Embed Size (px)
DESCRIPTION
Lower Middle Regeneration Experiment - Climate & Regeneration INGY 2014. Fred C. Martin WA Dept. Natural Resources Olympia, WA. Objectives. Evaluate planting versus natural regeneration with respect to survival, growth, and stocking. - PowerPoint PPT Presentation
Citation preview
Lower Middle Regeneration Experiment -
Climate & RegenerationINGY 2014
Fred C. MartinWA Dept. Natural Resources
Olympia, WA
Objectives
• Evaluate planting versus natural regeneration with respect to survival, growth, and stocking.
• Evaluate survival, growth, and stocking on forest health, species diversity, stand structure, and yield.
• Monitor survival and growth of residual over-story trees, and their impact on regeneration.
• Evaluate effect of covariates (habitat type, understory vegetation, duff, CWD, etc.) on both regeneration and residual overstory trees.
• Conduct annual measurements to provide validation for climate driven growth models.
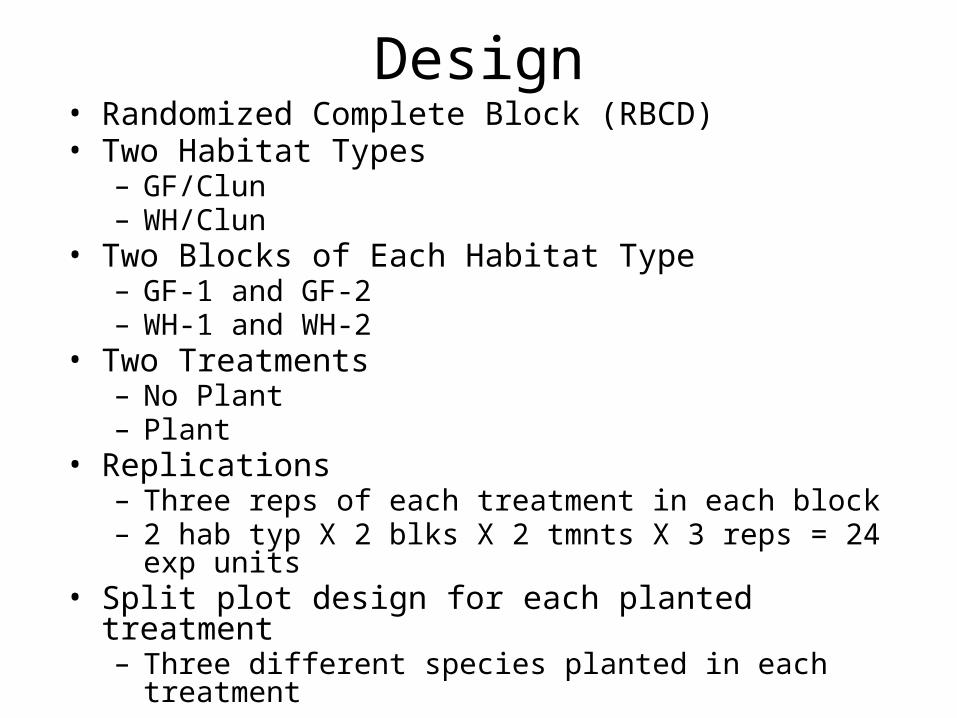
Design• Randomized Complete Block (RBCD)• Two Habitat Types
– GF/Clun– WH/Clun
• Two Blocks of Each Habitat Type– GF-1 and GF-2– WH-1 and WH-2
• Two Treatments– No Plant– Plant
• Replications– Three reps of each treatment in each block– 2 hab typ X 2 blks X 2 tmnts X 3 reps = 24 exp units
• Split plot design for each planted treatment– Three different species planted in each treatment
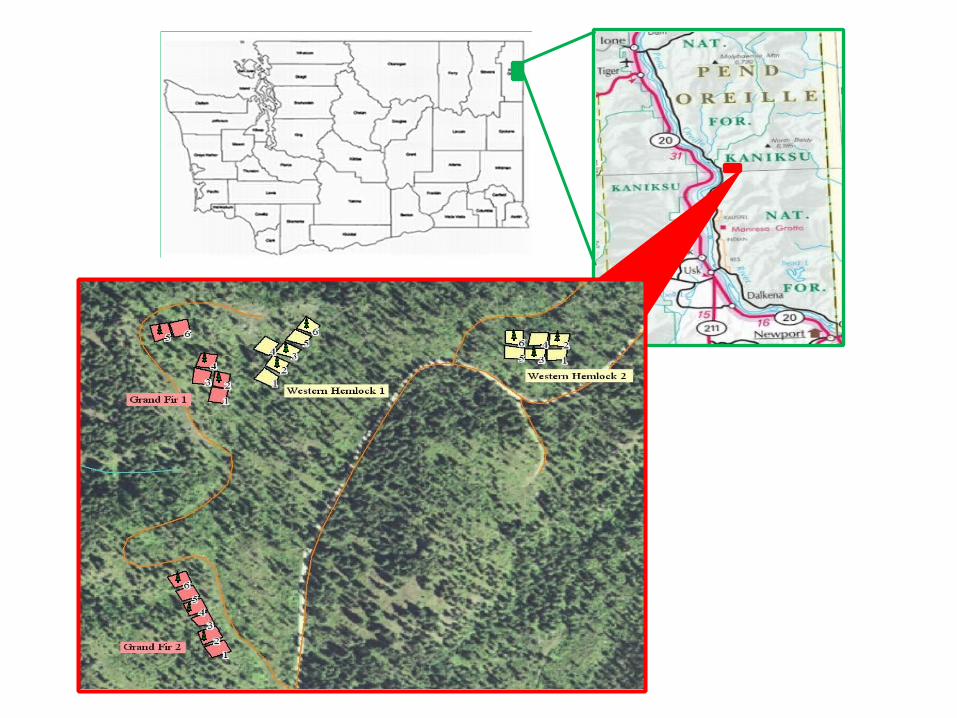
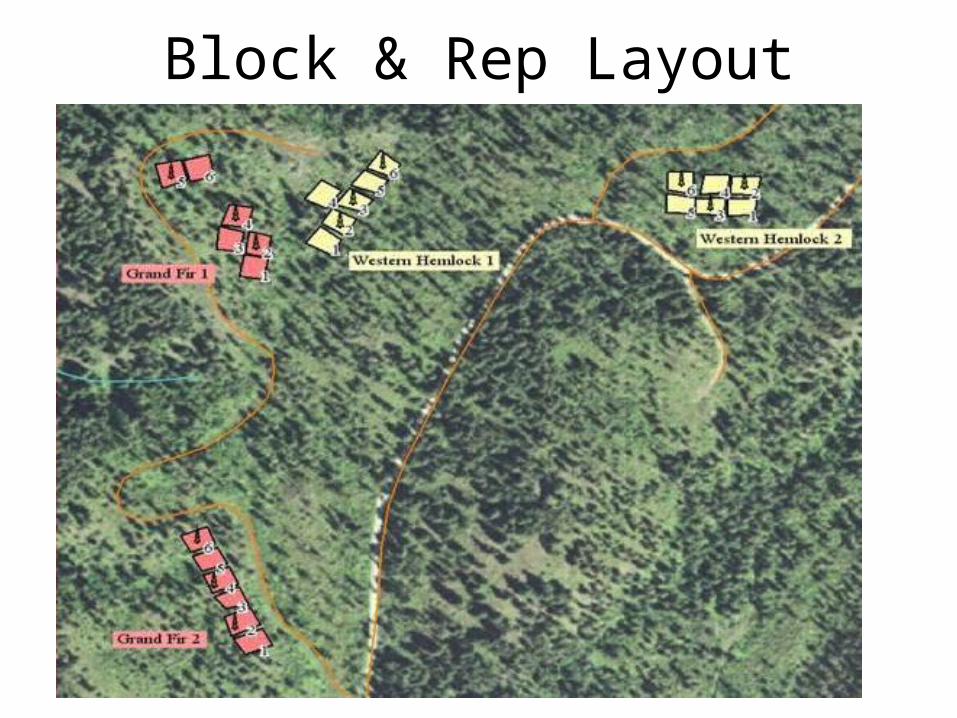
Block & Rep Layout
Replication Details
• Rectangular 1/10th acre• Replications paired for treatment assignment• Divided into 25 1/250th acre tabulation cells• Each planted treatment cell contains one planted– Ponderosa pine (1-1, camp-run stock)– Western larch (2-0, camp-run stock)– Western white pine (Plug-1, 2nd generation)
• Trees planted on equal area hexagonal grid
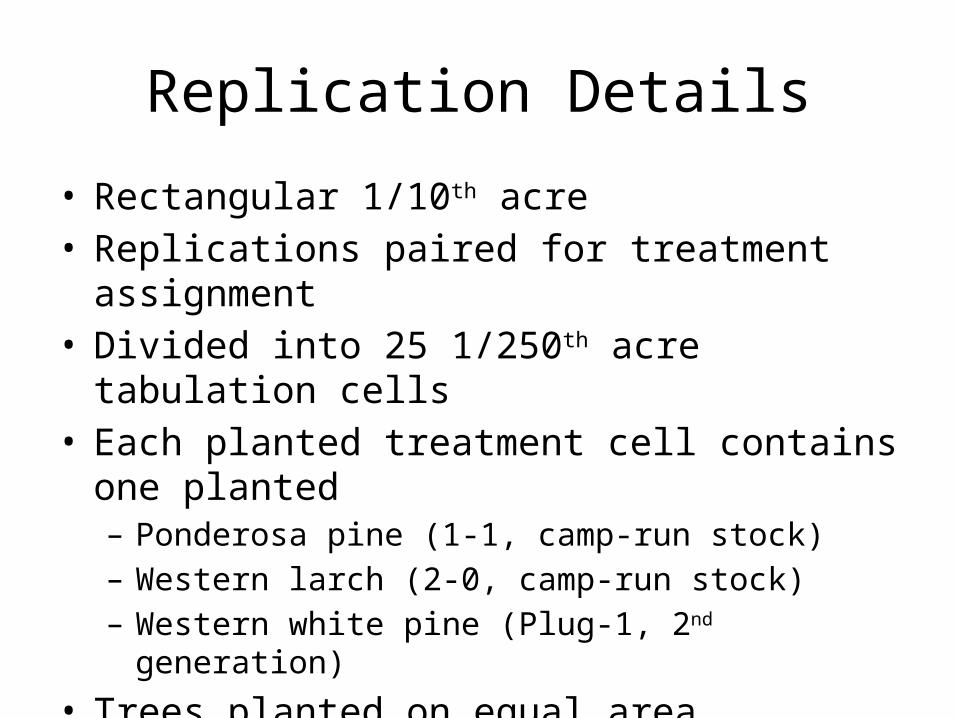
WH-2 Rep 2, 1995
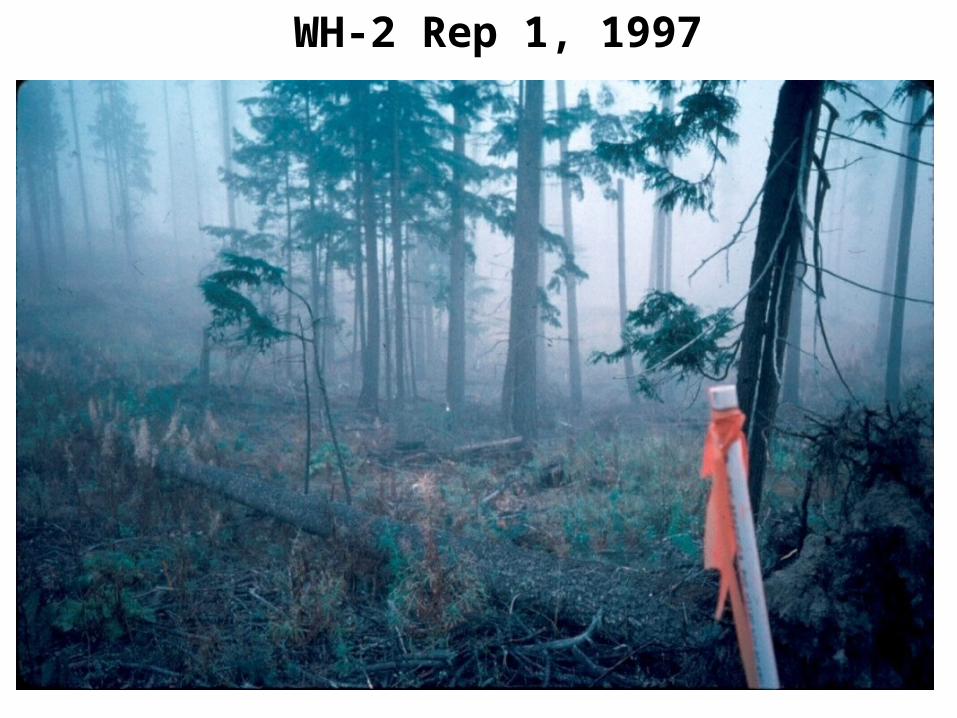
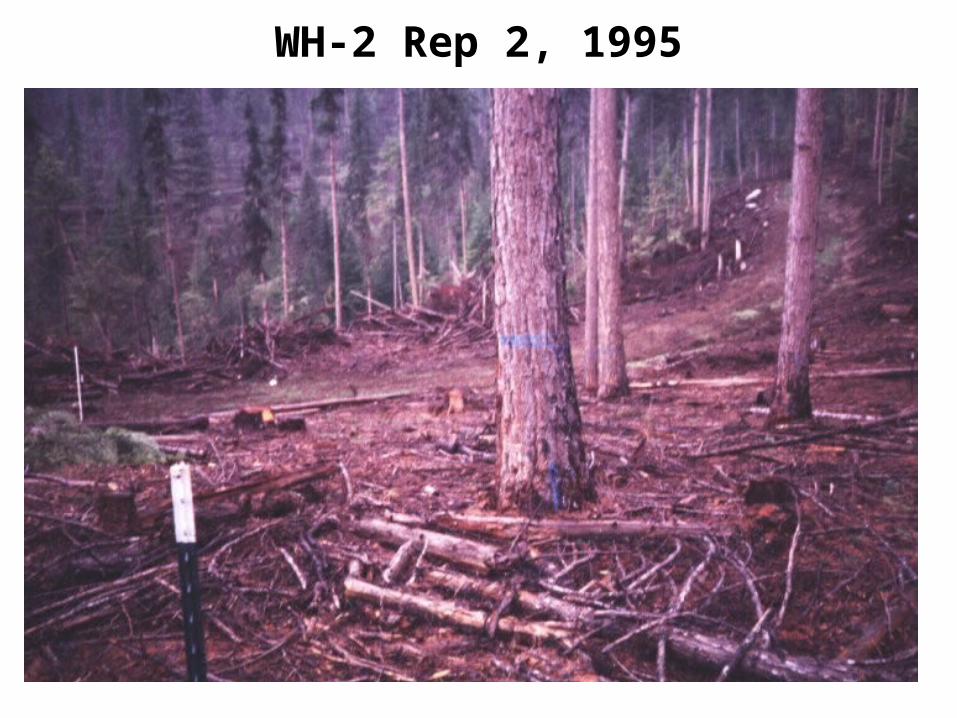
WH-2 Rep 1, 1997
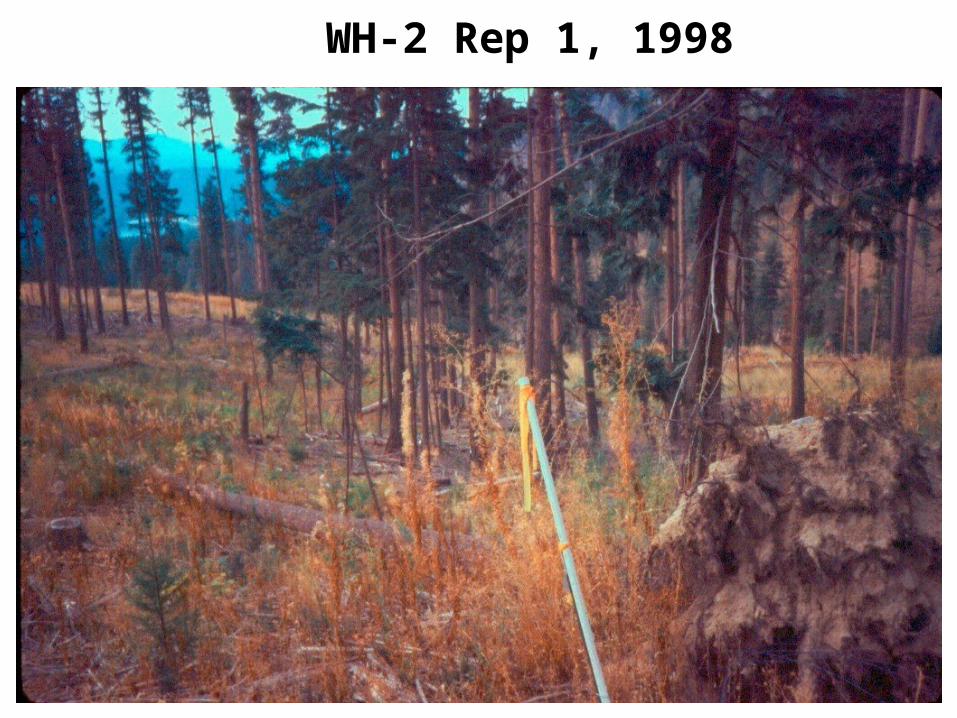
WH-2 Rep 1, 1998
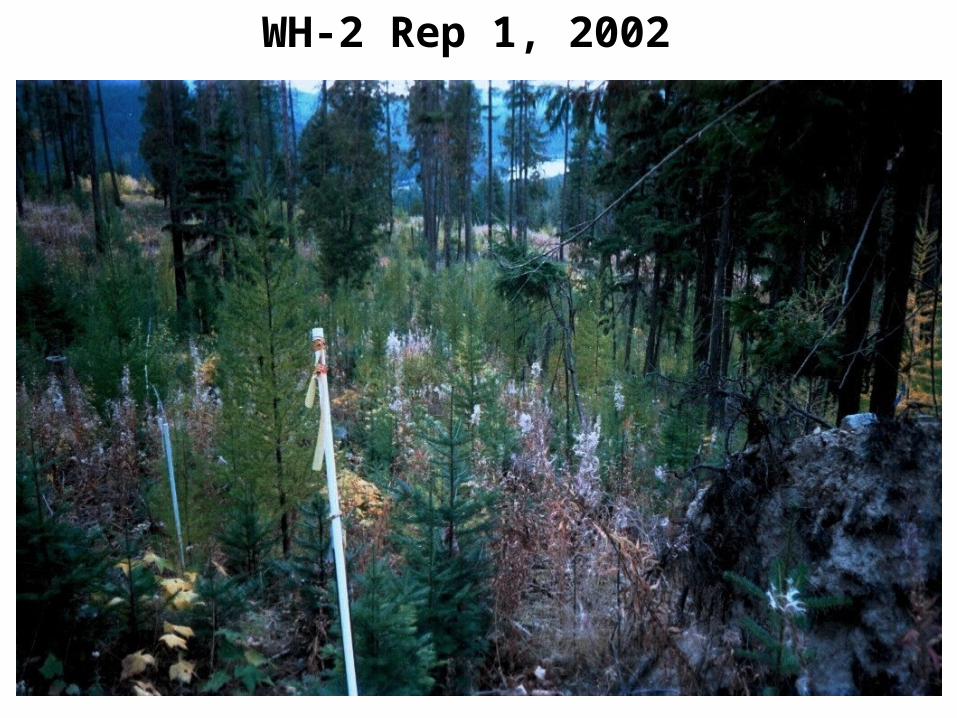
WH-2 Rep 1, 2002
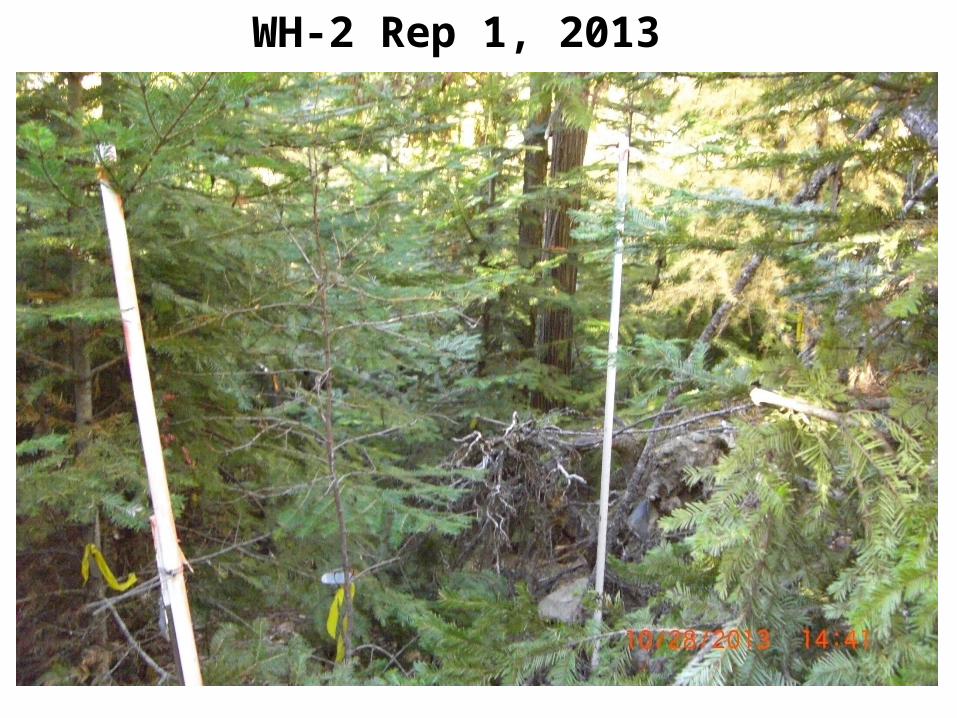
WH-2 Rep 1, 2013
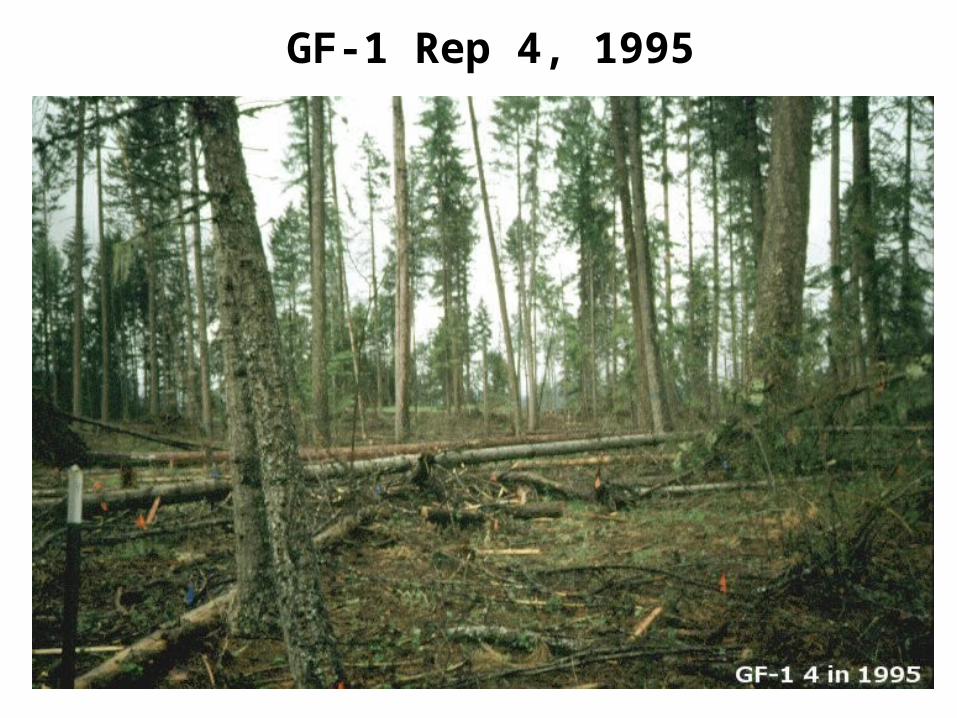
GF-1 Rep 4, 1995
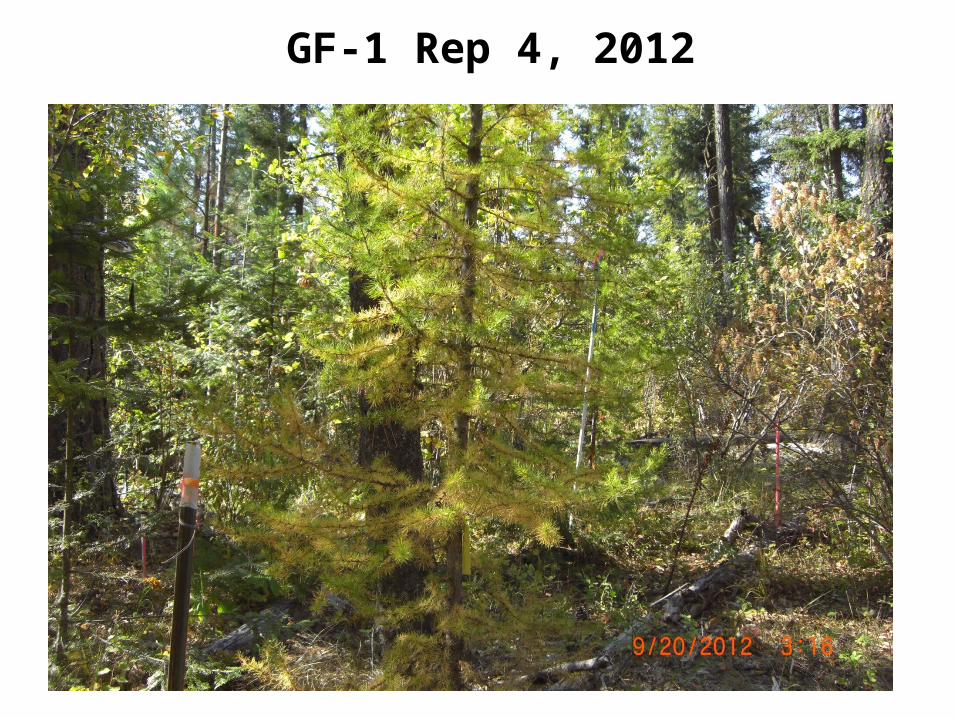
GF-1 Rep 4, 2012
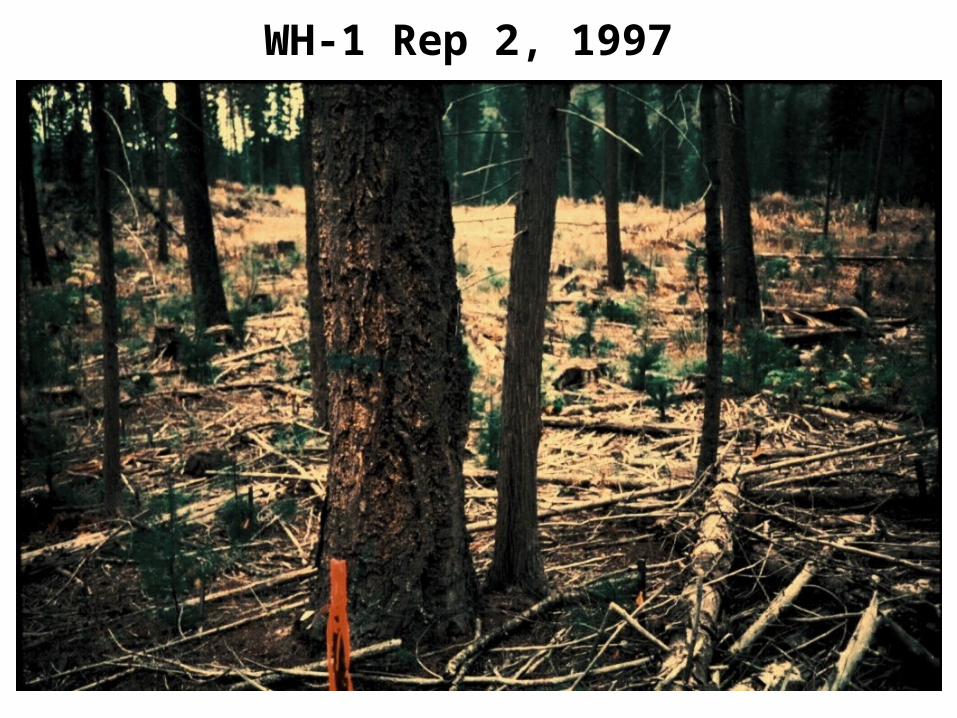
WH-1 Rep 2, 1997
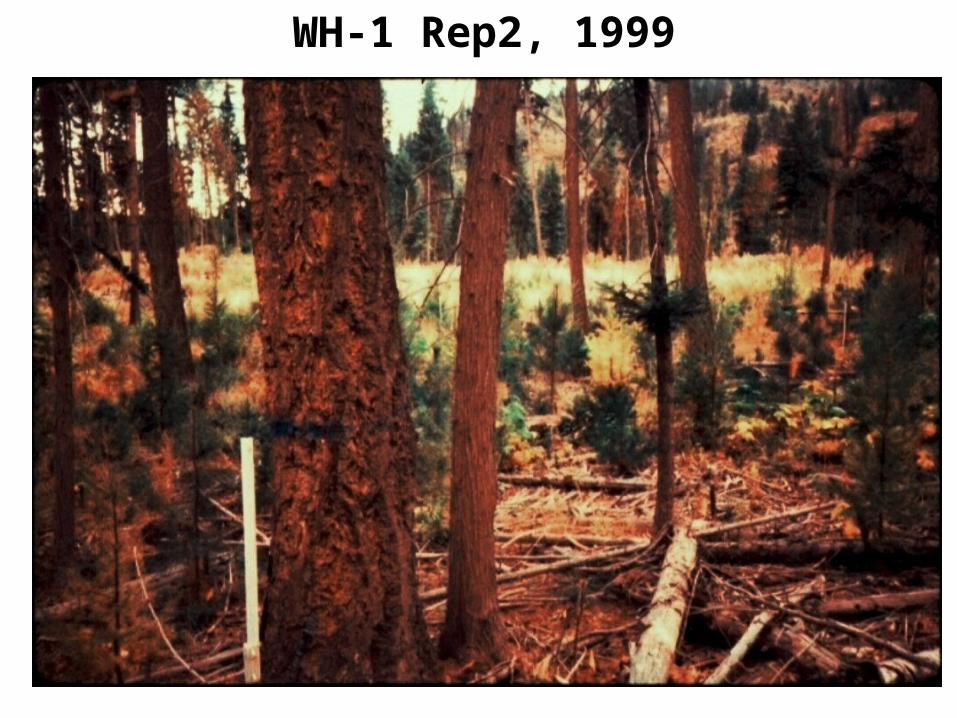
WH-1 Rep2, 1999
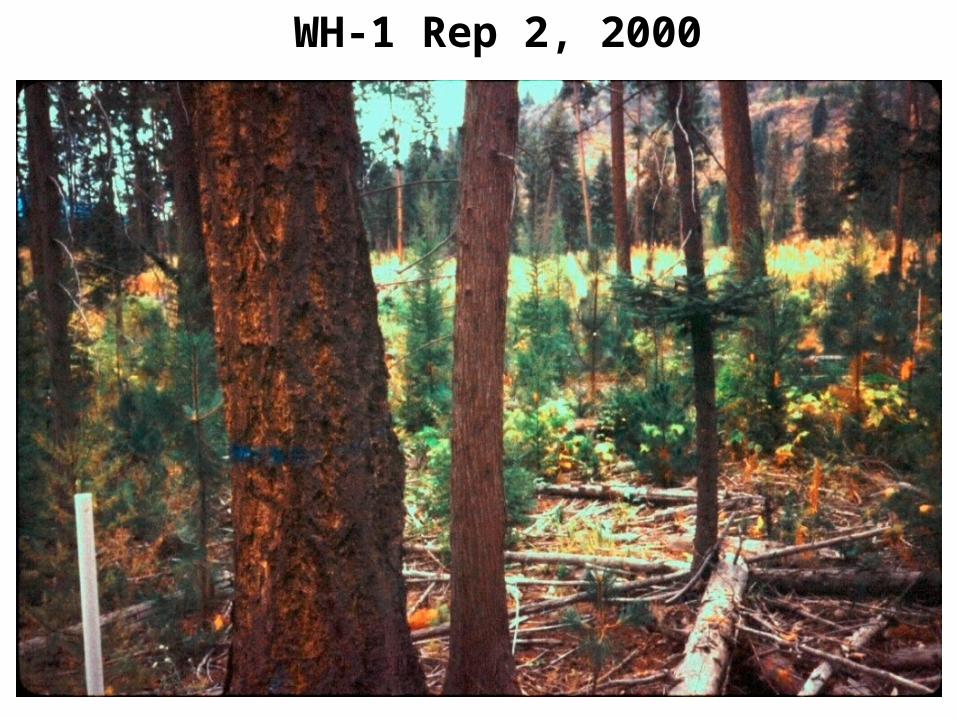
WH-1 Rep 2, 2000
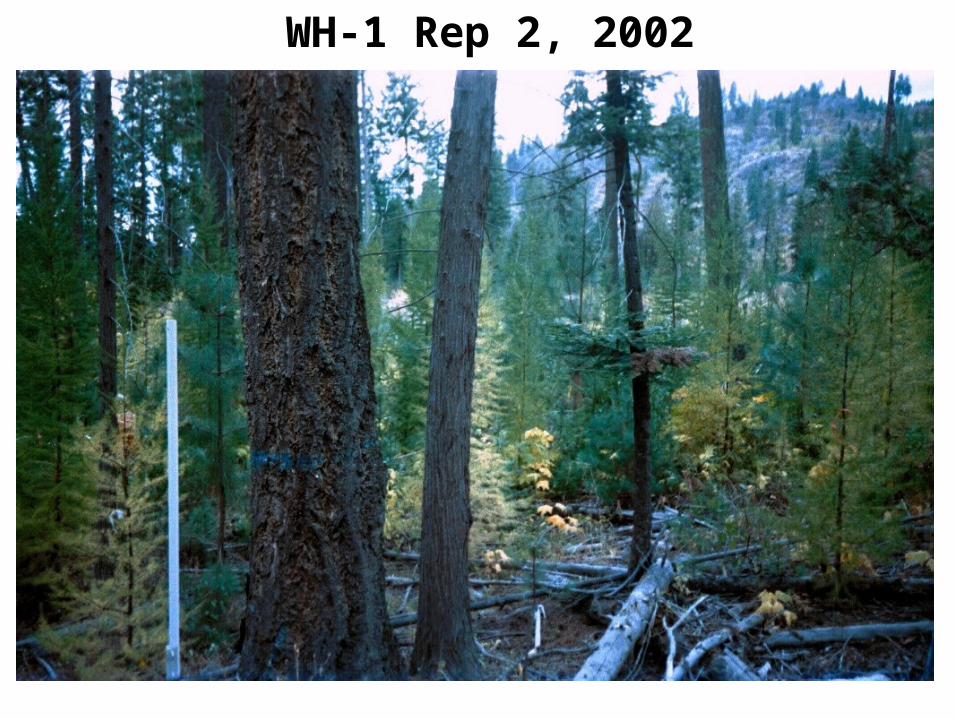
WH-1 Rep 2, 2002
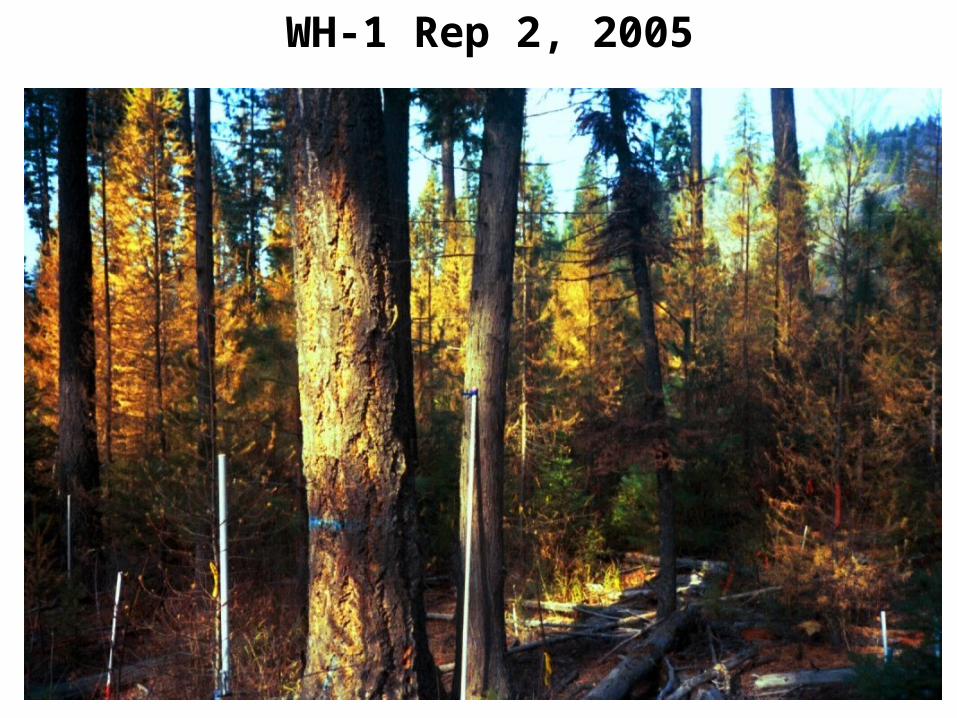
WH-1 Rep 2, 2005
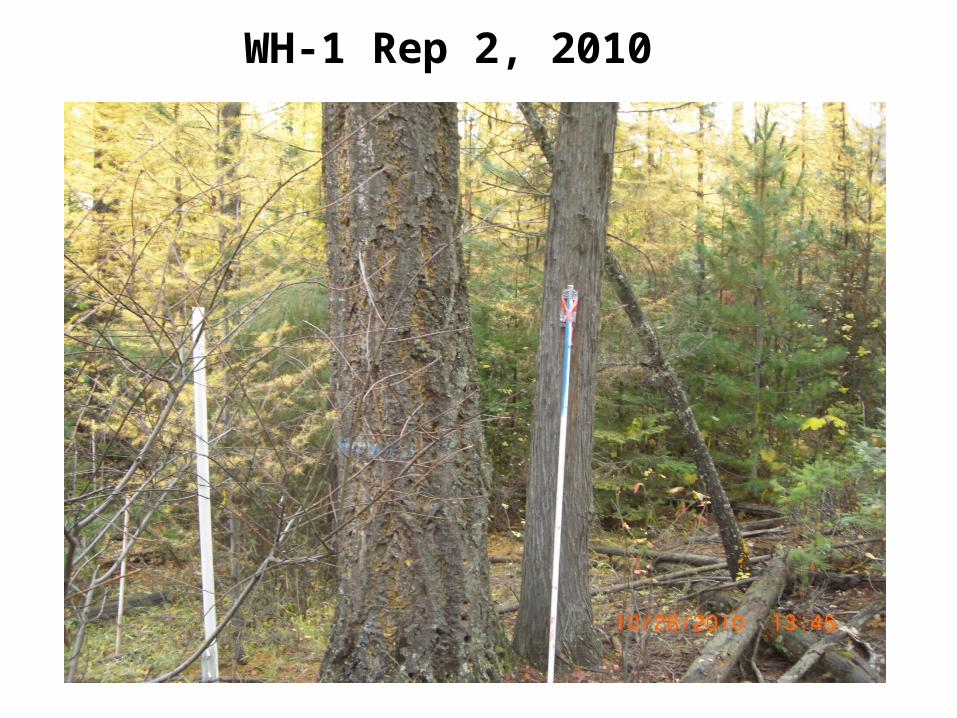
WH-1 Rep 2, 2010
Climate Questions
• Can temperature be measured with sufficient precision?
• Is temperature correlated with productivity?
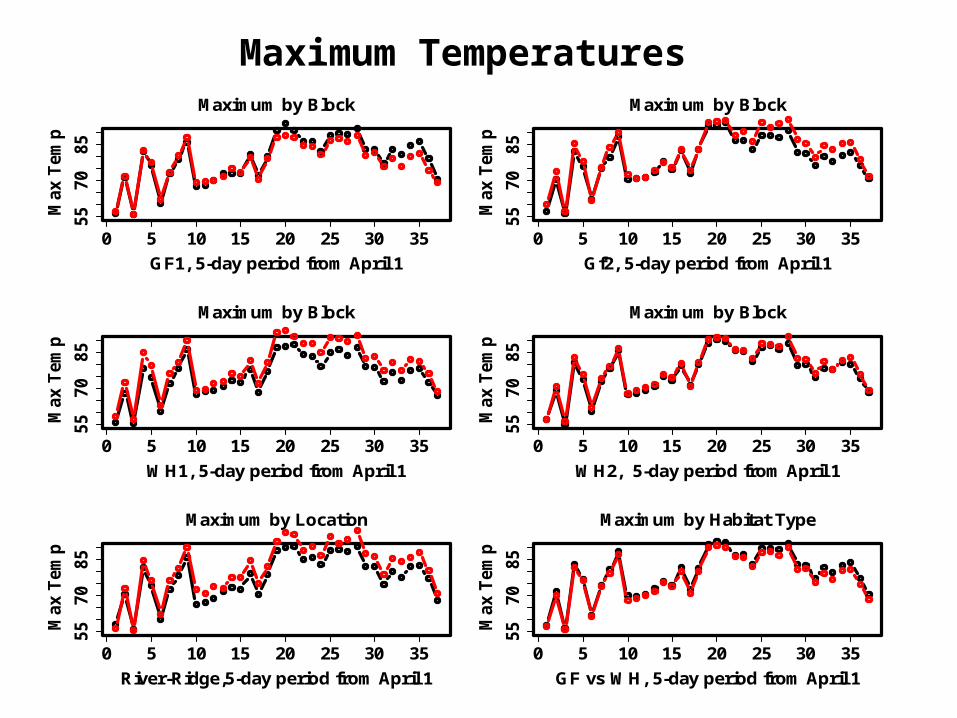
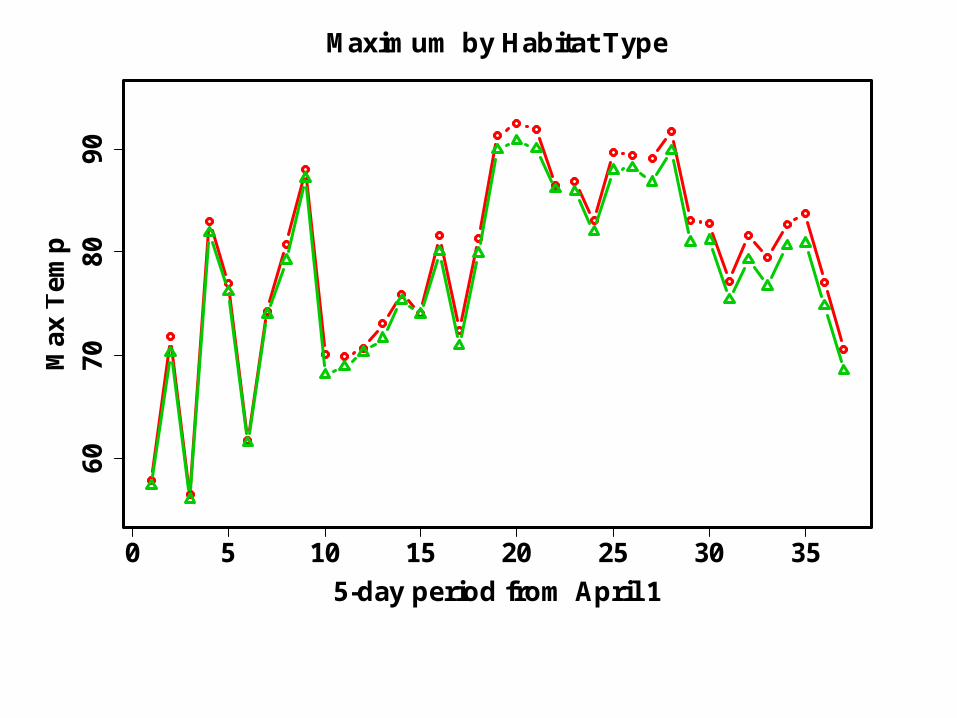
Maximum Temperatures
0 5 10 15 20 25 30 35
55
70
85
Maximum by Block
GF1, 5-day period from April 1
Max T
em
p
0 5 10 15 20 25 30 35
55
70
85
Maximum by Block
WH1, 5-day period from April 1
Max T
em
p
0 5 10 15 20 25 30 35
55
70
85
Maximum by Location
River-Ridge,5-day period from April 1
Max T
em
p
0 5 10 15 20 25 30 35
55
70
85
Maximum by Block
Gf2, 5-day period from April 1
Max T
em
p
0 5 10 15 20 25 30 35
55
70
85
Maximum by Block
WH2, 5-day period from April 1M
ax T
em
p
0 5 10 15 20 25 30 35
55
70
85
Maximum by Habitat Type
GF vs WH, 5-day period from April 1
Max T
em
p
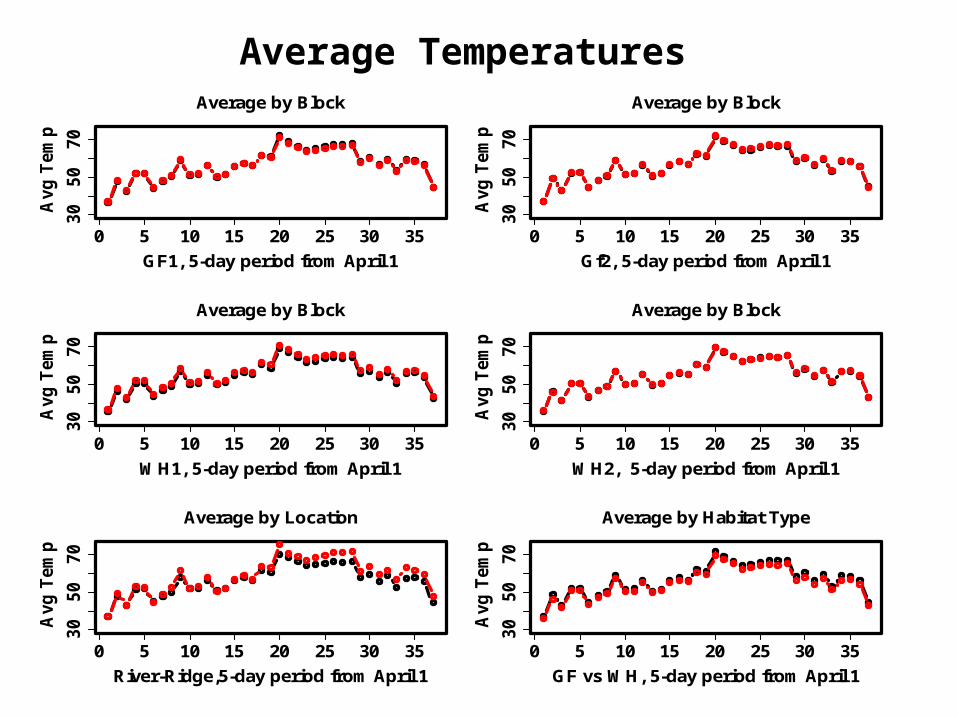
Average Temperatures
0 5 10 15 20 25 30 35
30
50
70
Average by Block
GF1, 5-day period from April 1
Avg
Tem
p
0 5 10 15 20 25 30 35
30
50
70
Average by Block
WH1, 5-day period from April 1
Avg
Tem
p
0 5 10 15 20 25 30 35
30
50
70
Average by Location
River-Ridge,5-day period from April 1
Avg
Tem
p
0 5 10 15 20 25 30 35
30
50
70
Average by Block
Gf2, 5-day period from April 1
Avg
Tem
p
0 5 10 15 20 25 30 35
30
50
70
Average by Block
WH2, 5-day period from April 1A
vg
Tem
p
0 5 10 15 20 25 30 35
30
50
70
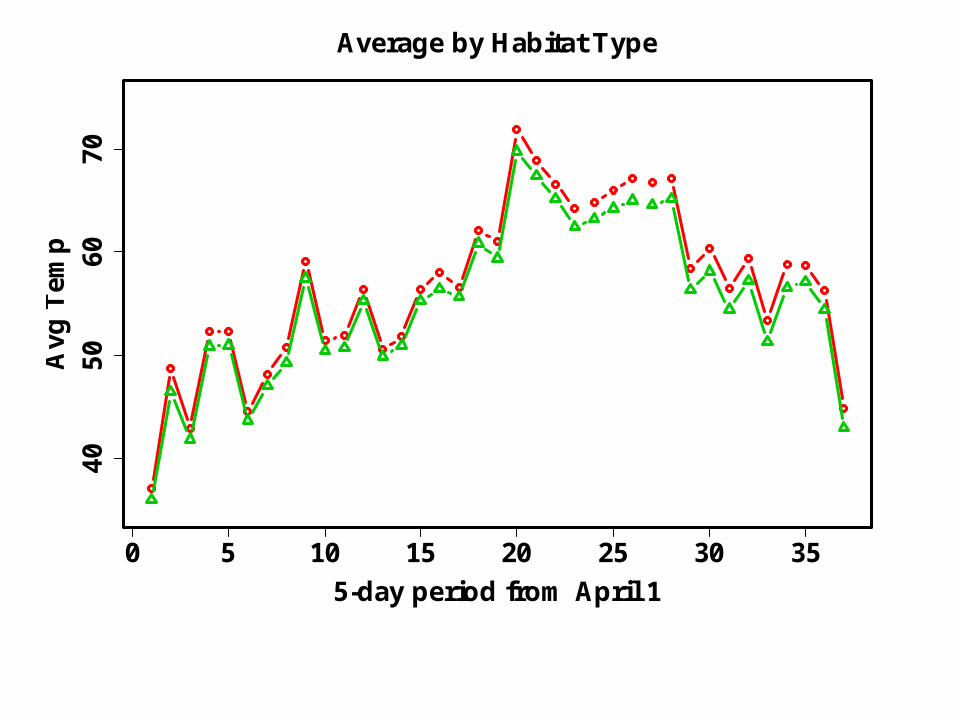
Average by Habitat Type
GF vs WH, 5-day period from April 1
Avg
Tem
p
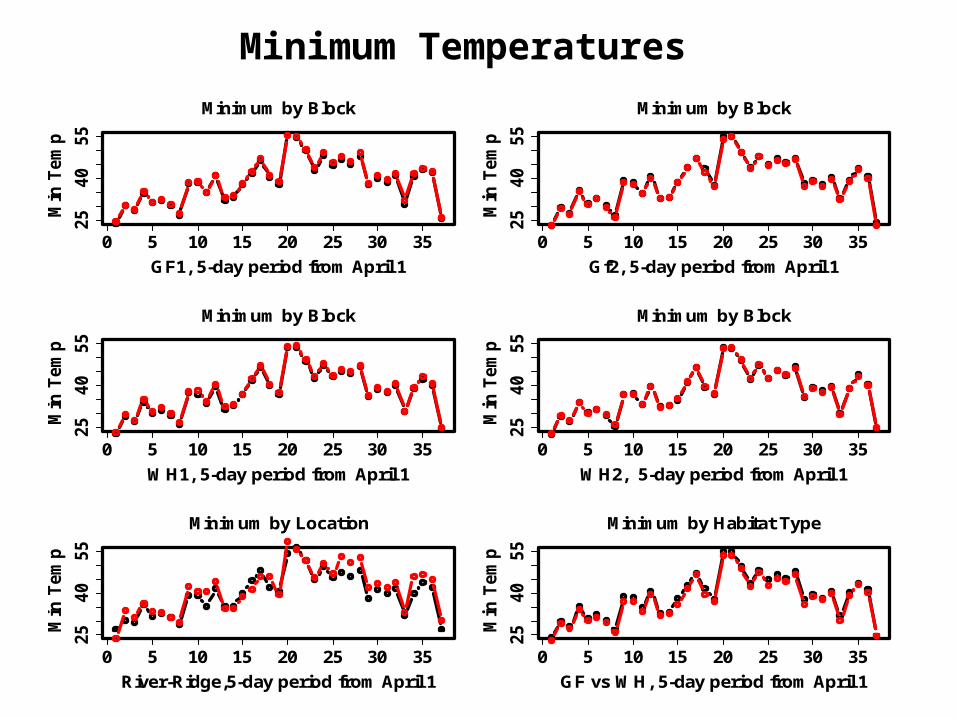
Minimum Temperatures
0 5 10 15 20 25 30 35
25
40
55
Minimum by Block
GF1, 5-day period from April 1
Min
Tem
p
0 5 10 15 20 25 30 35
25
40
55
Minimum by Block
WH1, 5-day period from April 1
Min
Tem
p
0 5 10 15 20 25 30 35
25
40
55
Minimum by Location
River-Ridge,5-day period from April 1
Min
Tem
p
0 5 10 15 20 25 30 35
25
40
55
Minimum by Block
Gf2, 5-day period from April 1
Min
Tem
p
0 5 10 15 20 25 30 35
25
40
55
Minimum by Block
WH2, 5-day period from April 1M
in T
em
p
0 5 10 15 20 25 30 35
25
40
55
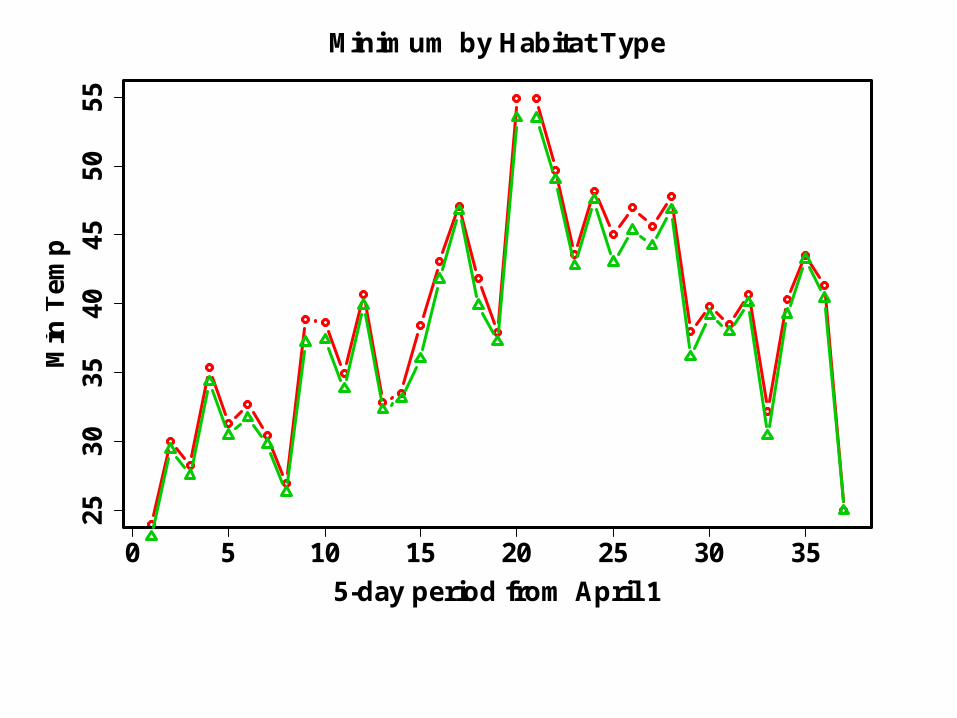
Minimum by Habitat Type
GF vs WH, 5-day period from April 1
Min
Tem
p
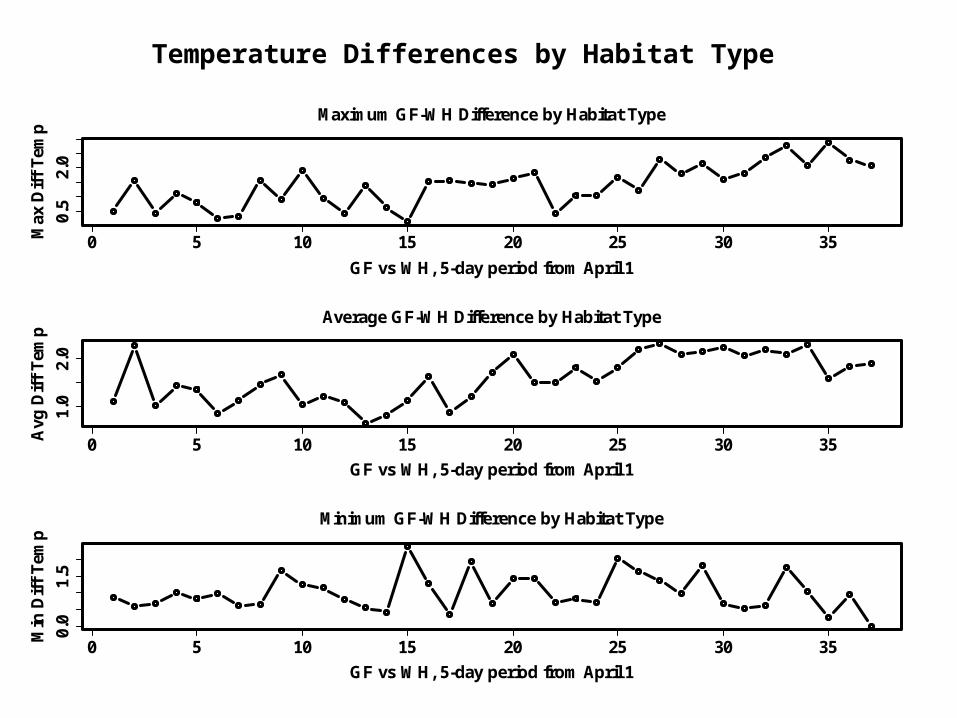
Temperature Differences by Habitat Type
0 5 10 15 20 25 30 35
0.5
2.0
Maximum GF-WH Difference by Habitat Type
GF vs WH, 5-day period from April 1
Max
Dif
f T
emp
0 5 10 15 20 25 30 35
1.0
2.0
Average GF-WH Difference by Habitat Type
GF vs WH, 5-day period from April 1
Avg
Dif
f T
emp
0 5 10 15 20 25 30 35
0.0
1.5
Minimum GF-WH Difference by Habitat Type
GF vs WH, 5-day period from April 1
Min
Dif
f T
emp
0 5 10 15 20 25 30 35
6070
8090
Maximum by Habitat Type
5-day period from April 1
Max
Tem
p
0 5 10 15 20 25 30 35
4050
6070
Average by Habitat Type
5-day period from April 1
Avg
Tem
p
0 5 10 15 20 25 30 35
2530
3540
4550
55
Minimum by Habitat Type
5-day period from April 1
Min
Tem
p
0 5 10 15 20 25 30 35
40
50
60
70
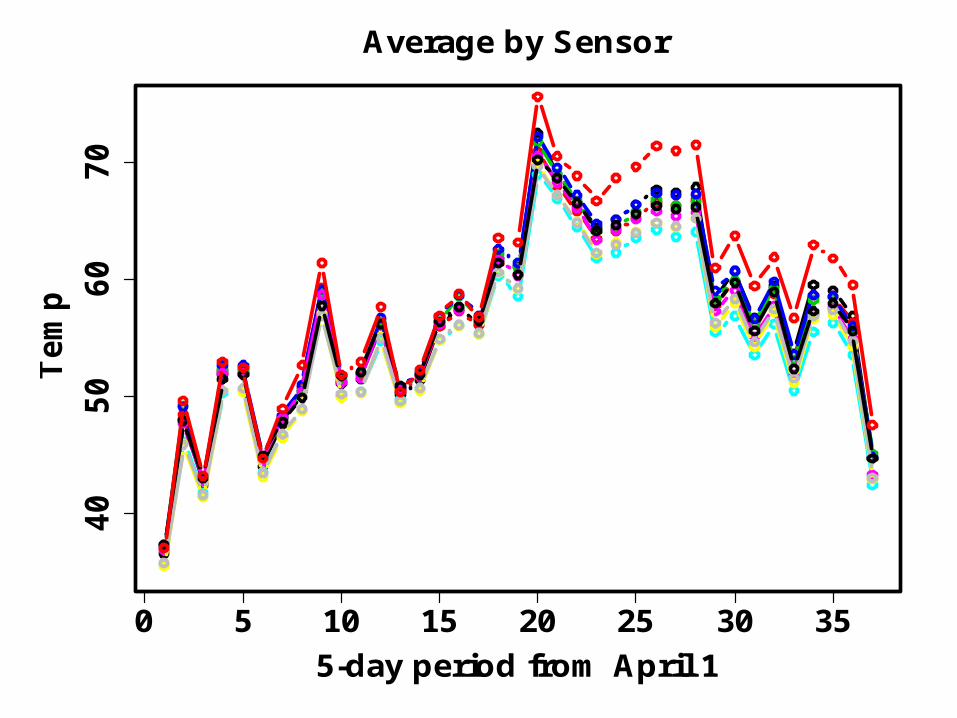
Average by Sensor
5-day period from April 1
Te
mp
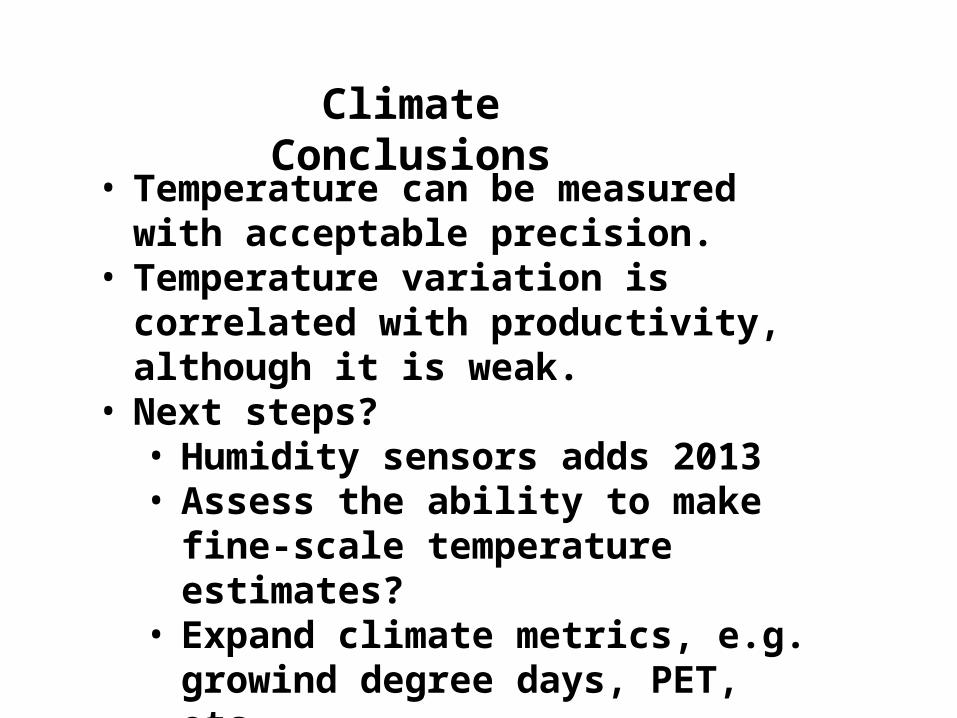
Climate Conclusions
• Temperature can be measured with acceptable precision.
• Temperature variation is correlated with productivity, although it is weak.
• Next steps?• Humidity sensors adds 2013• Assess the ability to make fine-scale
temperature estimates?• Expand climate metrics, e.g. growind
degree days, PET, etc.
Regeneration Questions
• Is it true that regeneration is greater on the control than on the planted replications?
• What is the trend of regeneration over time?
1995 2000 2005 2010
010
0020
0030
0040
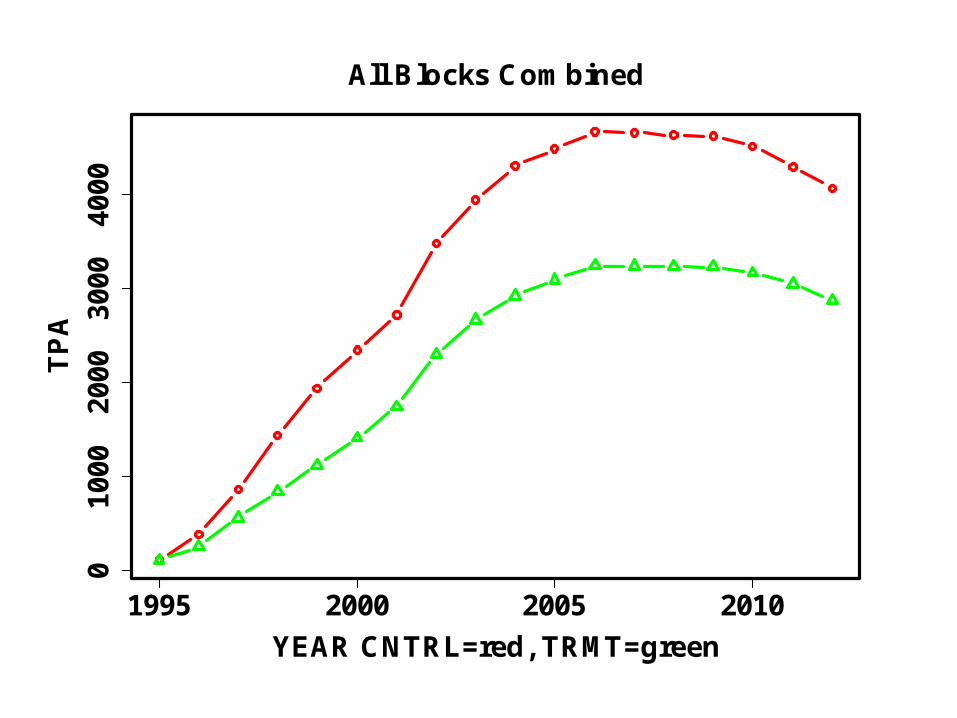
00All Blocks Combined
YEAR CNTRL=red, TRMT=green
TP
A
1995 2000 2005 2010
020
0040
0060
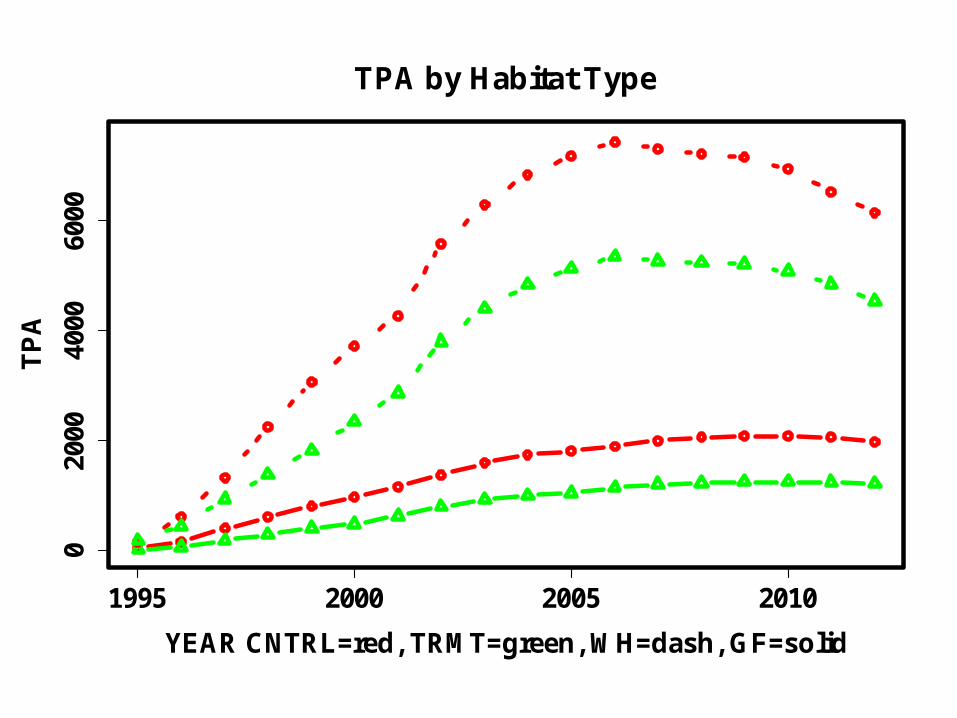
00TPA by Habitat Type
YEAR CNTRL=red, TRMT=green, WH=dash, GF=solid
TP
A
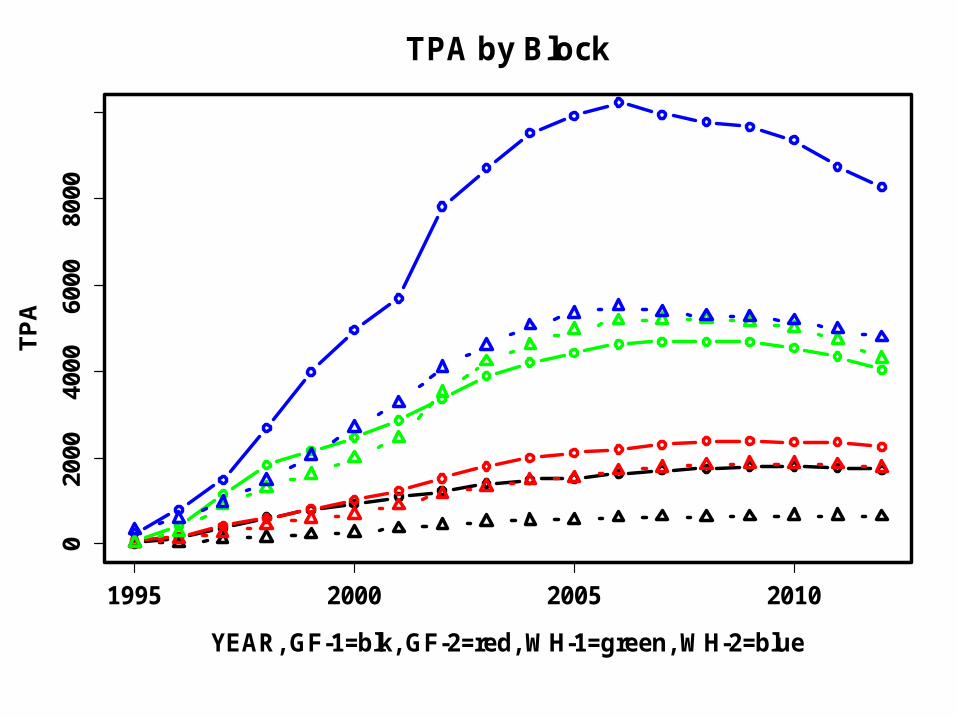
1995 2000 2005 2010
020
0040
0060
0080
00TPA by Block
YEAR, GF-1=blk, GF-2=red, WH-1=green, WH-2=blue
TP
A
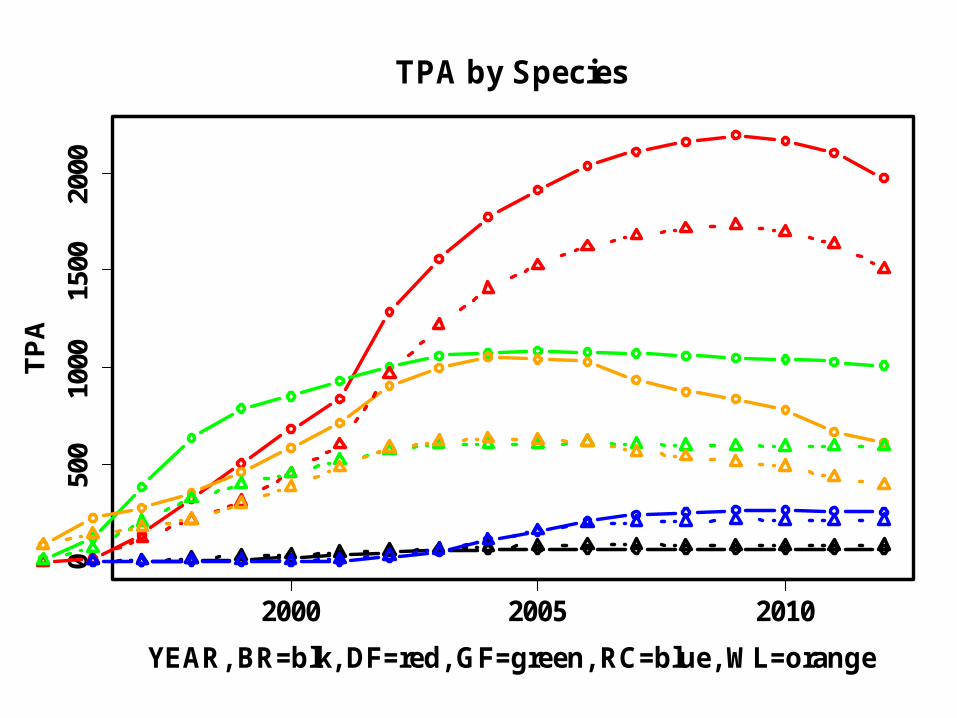
2000 2005 2010
050
010
0015
0020
00TPA by Species
YEAR, BR=blk, DF=red, GF=green, RC=blue, WL=orange
TP
A
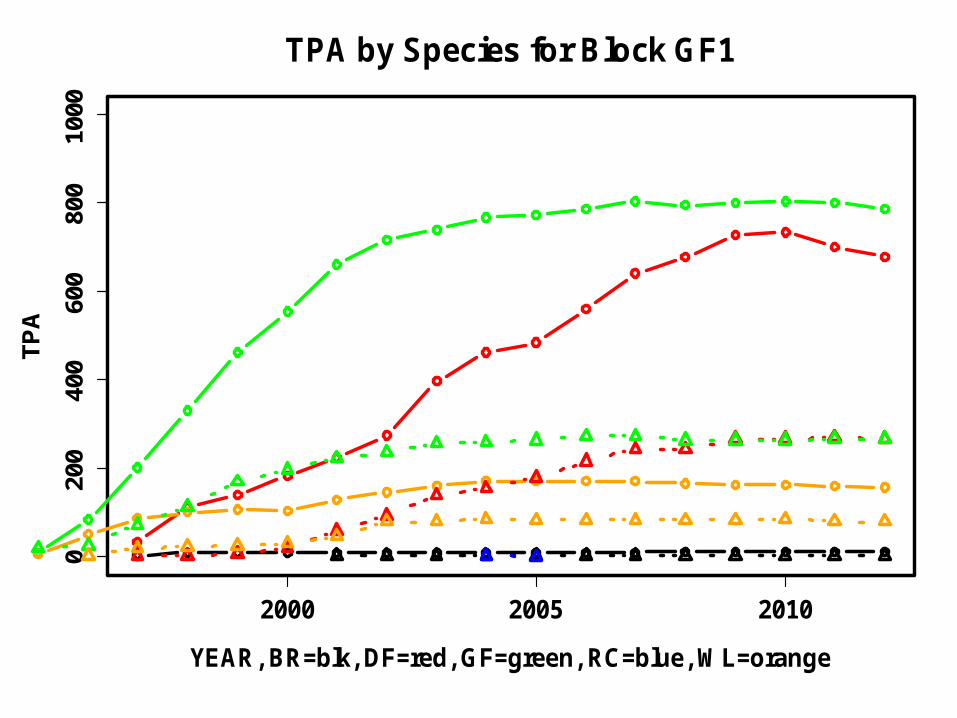
2000 2005 2010
020
040
060
080
010
00TPA by Species for Block GF1
YEAR, BR=blk, DF=red, GF=green, RC=blue, WL=orange
TP
A
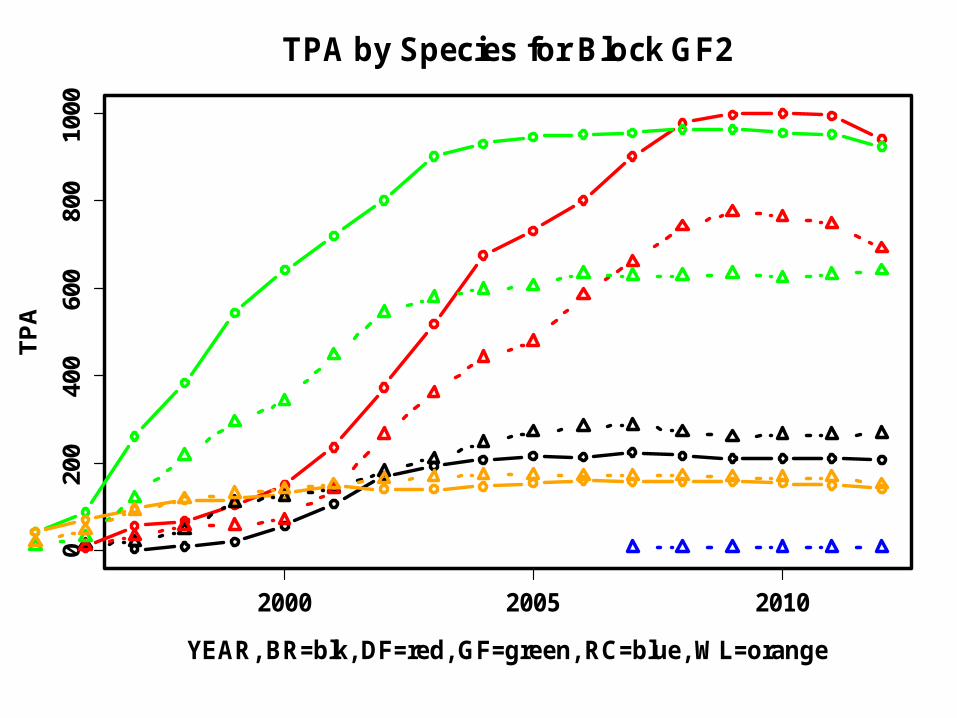
2000 2005 2010
020
040
060
080
010
00TPA by Species for Block GF2
YEAR, BR=blk, DF=red, GF=green, RC=blue, WL=orange
TP
A
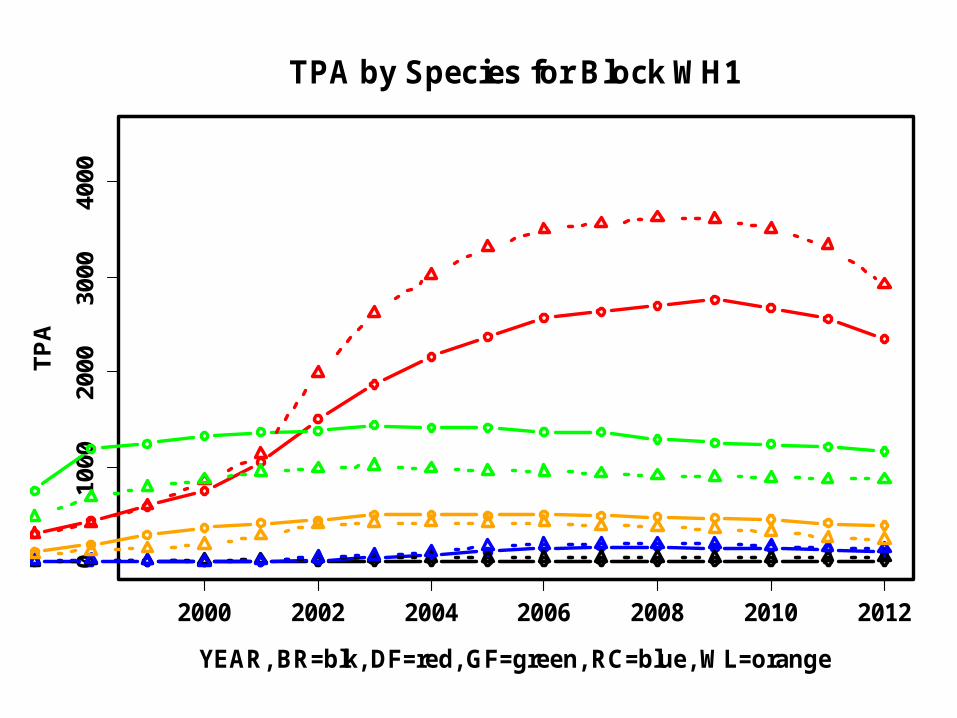
2000 2002 2004 2006 2008 2010 2012
010
0020
0030
0040
00TPA by Species for Block WH1
YEAR, BR=blk, DF=red, GF=green, RC=blue, WL=orange
TP
A
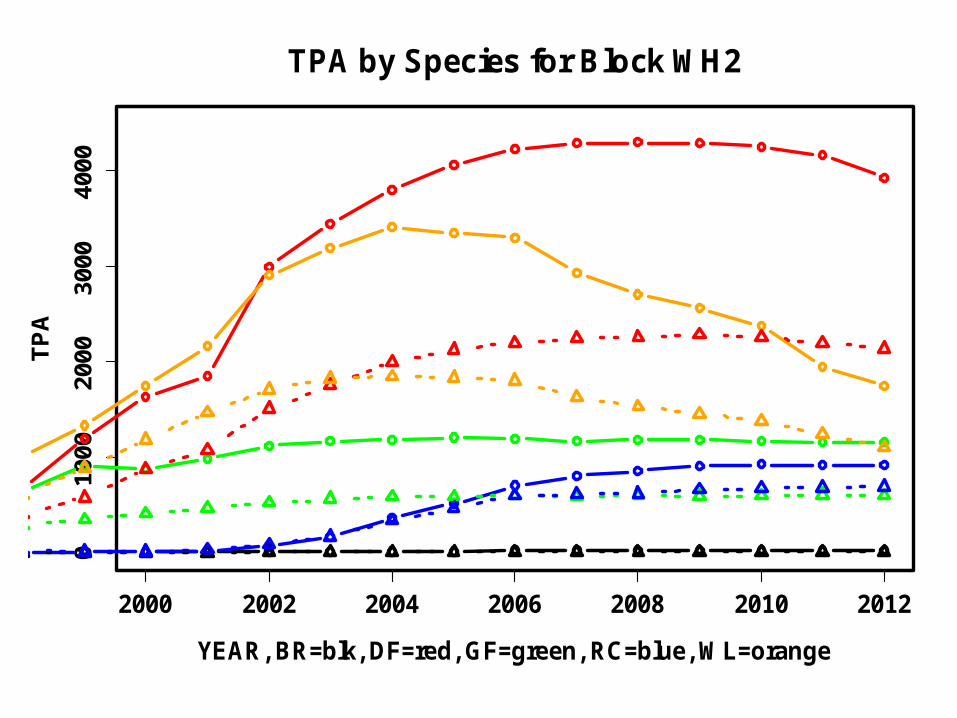
2000 2002 2004 2006 2008 2010 2012
010
0020
0030
0040
00TPA by Species for Block WH2
YEAR, BR=blk, DF=red, GF=green, RC=blue, WL=orange
TP
A
Regeneration Conclusions
• Regeneration tends to be greater on the control than on the planted replications.
• Regeneration is declining over time for seral species but increasing or constant for climax species.
• Rates of mortality are greater on high versus low productivity.
• Next steps.• Examine covariate effects on survival,
( overstory, competing vegetation, CWD, etc.).
• Assess rate of growth.