Embed Size (px)
Citation preview

Al-Abdi et al. BMC Pediatrics 2013, 13:137http://www.biomedcentral.com/1471-2431/13/137
RESEARCH ARTICLE Open Access
Lower reference limits of quantitative cordglucose-6-phosphate dehydrogenase estimatedfrom healthy term neonates according to theclinical and laboratory standards instituteguidelines: a cross sectional retrospective studySameer Yaseen Al-Abdi1,3*, Amina Suleman Alsaigh2,3, Fahima Lugman Aldawoud2,3 and Amal Ali Al Sadiq2,3
Abstract
Background: Previous studies have reported the lower reference limit (LRL) of quantitative cord glucose-6-phosphate dehydrogenase (G6PD), but they have not used approved international statistical methodology. Usingcommon standards is expecting to yield more true findings. Therefore, we aimed to estimate LRL of quantitativeG6PD detection in healthy term neonates by using statistical analyses endorsed by the International Federation ofClinical Chemistry (IFCC) and the Clinical and Laboratory Standards Institute (CLSI) for reference interval estimation.
Methods: This cross sectional retrospective study was performed at King Abdulaziz Hospital, Saudi Arabia, betweenMarch 2010 and June 2012. The study monitored consecutive neonates born to mothers from one Arab Muslimtribe that was assumed to have a low prevalence of G6PD-deficiency. Neonates that satisfied the following criteriawere included: full-term birth (37 weeks); no admission to the special care nursery; no phototherapy treatment;negative direct antiglobulin test; and fathers of female neonates were from the same mothers’ tribe. The G6PDactivity (Units/gram Hemoglobin) was measured spectrophotometrically by an automated kit. This study usedstatistical analyses endorsed by IFCC and CLSI for reference interval estimation. The 2.5th percentiles and thecorresponding 95% confidence intervals (CI) were estimated as LRLs, both in presence and absence of outliers.
Results: 207 males and 188 females term neonates who had cord blood quantitative G6PD testing met theinclusion criteria. Method of Horn detected 20 G6PD values as outliers (8 males and 12 females). Distributions ofquantitative cord G6PD values exhibited a normal distribution in absence of the outliers only. The Harris-Boydmethod and proportion criteria revealed that combined gender LRLs were reliable. The combined bootstrap LRL inpresence of the outliers was 10.0 (95% CI: 7.5-10.7) and the combined parametric LRL in absence of the outliers was11.0 (95% CI: 10.5-11.3).
Conclusion: These results contribute to the LRL of quantitative cord G6PD detection in full-term neonates. Theyare transferable to another laboratory when pre-analytical factors and testing methods are comparable and theIFCC-CLSI requirements of transference are satisfied. We are suggesting using estimated LRL in absence of theoutliers as mislabeling G6PD-deficient neonates as normal is intolerable whereas mislabeling G6PD-normal neonatesas deficient is tolerable.
Keywords: Glucose-6-phosphate dehydrogenase, Reference interval, Lower reference limit, Cord blood, Term neonate
* Correspondence: [email protected] of Pediatrics, King Abdulaziz Hospital, Al-Ahsa, Saudi Arabia3King Abdullah International Medical Research Center, Riyadh, Saudi ArabiaFull list of author information is available at the end of the article
© 2013 Al-Abdi et al.; licensee BioMed CentralCommons Attribution License (http://creativecreproduction in any medium, provided the orwaiver (http://creativecommons.org/publicdomstated.
Ltd. This is an Open Access article distributed under the terms of the Creativeommons.org/licenses/by/2.0), which permits unrestricted use, distribution, andiginal work is properly cited. The Creative Commons Public Domain Dedicationain/zero/1.0/) applies to the data made available in this article, unless otherwise
Al-Abdi et al. BMC Pediatrics 2013, 13:137 Page 2 of 15http://www.biomedcentral.com/1471-2431/13/137
BackgroundGlucose-6-phosphate dehydrogenase (G6PD) deficiencyis a common X-linked recessive enzymopathy [1]. Geno-typically, males are either hemizygous for the G6PDgene with normal gene expression or G6PD deficient,while females can be normal, heterozygous, or homozy-gous. While about 186 variants have been recognized,not all of them are clinically significant [2]. The WorldHealth Organization (WHO) has classified G6PD vari-ants into five classes: Class I (severe enzyme deficiencywith chronic non-spherocytic hemolytic anemia); ClassII (<10% of normal); Class III (10–60% of normal); ClassIV (60–100% of normal); and Class V (>200% of normal)[3]. The G6PD deficiency is well-known to cause hyper-bilirubinemia that may be severe enough to causekernicterus or neonatal death [1,4]. Early recognition ofG6PD deficiency can help prevent these serious compli-cations. Thus, the WHO has endorsed screening cordblood samples from all neonates in populations with aprevalence of G6PD deficiency of 3 to 5% or more inmales [5]. The WHO has endorsed 5 methods as screen-ing or diagnostic tests for G6PD deficiency includingquantitative measurement of G6PD activity in red bloodcells (RBCs) [5,6]. Reference limits are the cornerstonesof interpretation of any laboratory result, includingquantitative cord G6PD values. Previous studies havereported on the lower reference limit (LRL) or lower de-cision limit (LDL) of quantitative cord G6PD values, butthese have methodological and/or statistical flaws [7-18].These studies did not implement standard statistics usedto estimate LRLs that have long been endorsed by theInternational Federation of Clinical Chemistry (IFCC)and the Clinical and Laboratory Standards Institute(CLSI) [19-25]. None of these studies have addressed thedetection and handling of outliers. Only two of thesestudies addressed the type of distribution of G6PDvalues and were in accordance with known methods ofdefining reference intervals (RIs), including the 95% cen-tral RIs [7,8]. Instead of reporting non-parametric RIs thatdo not make any assumptions about the data distribution,[26] some researchers have based the LRL on the meanwithout addressing normal distribution testing [13]. Somereported LRLs/LDLs have been estimated from smallsample sizes, [7,11,12] from populations with high G6PDdeficiency prevalence, [8-10,13,15,16] and from mixturesof G6PD-normal and G6PD-deficient preterm and full-term neonates [8,15]. Therefore, we aimed to estimate theLRLs of quantitative cord G6PD activity from a largepopulation of healthy term neonates in accordance withthe standard method of IFCC-CLSI [19-25]. In our opin-ion, using of these common standards would overcomelimitations of the previous studies and yield true findings[27]. We elected not to estimate the upper reference limitas it has no clinical implication [28].
MethodsSettingWe conducted this cross sectional retrospective study atKing Abdulaziz Hospital (KAH) in the Al-Ahsa area of theEastern province of Saudi Arabia. Since 2009, KAH hasbeen accredited by the Joint Commission of InternationalAccreditation and its laboratory has been accredited bythe College of American Pathologists, which implementsthe CLSI standards in its accreditation checklists.
Analytic method for G6PDIn early 2008, KAH began universal cord blood screeningfor G6PD deficiency coupled with direct antiglobulin test-ing and blood grouping [29]. A semi-qualitative fluores-cence spot test (FST) with a cut-off point of 2.1 Units/gram Hemoglobin (U/g Hb) was used until 01 March2010, at which point it was replaced with an automatedcommercial kit. This kit is Udilipse Auto Analyzer fromUnited Diagnostics Industry, Dammam, Saudi Arabia thatoffers quantitative measurement of G6PD activity.Just after delivery of the placenta, whole cord blood
was collected in ethylenediaminetetraacetic acid (EDTA)Vacutainer tubes (Becton-Dickinson, Rutherford, NJ, USA).Blood specimens were transported to the laboratory bypneumatic tubes. Quantitative G6PD activity measure-ments were performed in batches every morning, 7 days aweek, with blood samples stored in the vertical position at2–8 degree Celsius (°C) until analysis. The principal me-thod of the Udilipse kit is in accordance with the standar-dized WHO method for G6PD assay of the hemolysate at25°C outlined as follows [6]:
Glucose‐6‐PhosphateþNADP→G6PD
6−PhosphogluconateþNADPHþHþ
The reagents of this kit are outlined as follows:Reagent 1 (G6PD Buffer): Ready to use 50 micromolar
(mM)/Liter triethanolamine buffer, 5 mM/Liter EDTA,pH 7.6 ± 0.05 (25°C).Reagent 2 (G6PD NADP): Reconstituted 30 mM nico-
tinamide adenine dinucleotide phosphate (NADP).Reagent 3 (G6PD Substrate): Reconstituted 17 mM
Glucose-6-Phosphate Sodium.Reagent 4 (G6PD Lysis): Ready to use 0.2% Saponin
aqueous solution.Hemolysate was prepared according to the manu-
facturer’s manual for the Udilipse kit by adding a well-mixed 100 microliters of whole blood to 400 microlitersof 0.2% Saponin. The G6PD activity was measuredwithin one hour of hemolysate preparation. The activityof the G6PD enzyme is measured by the rate of NADPHformation, which is measured spectrophotometrically bymeans of the increase in extinction at 340, 334 or 365nanometer. As the Udilipse kit only measures G6PD

Al-Abdi et al. BMC Pediatrics 2013, 13:137 Page 3 of 15http://www.biomedcentral.com/1471-2431/13/137
activity, hemoglobin was measured spectrophotometric-ally on the same sample by CELL-DYN Sapphire (Ab-bott Diagnostics, Santa Clara, CA, USA). Then, thevalues of G6PD activity and hemoglobin were enteredand stored in Cerner Lab Information System Software(Cerner Corporation, Kansas City, MO, USA), which isalready programmed to express the G6PD activity in U/g Hb by dividing the obtained G6PD activity by theobtained hemoglobin values.
Reference sample groupThe IFCC-CLSI recommends estimating RLs from ahealthy population [20,25]. In our case, the healthypopulation would be the population free from G6PDmutations. The Al-Ahsa area is composed of an oasispart inhabited by Arab Muslims of urban descent and adesert part inhabited by Arab Muslims of Bedouin des-cent. The overall prevalence of G6PD deficiency in theAl-Ahsa area is 23% in males and 13% in females [30].The G6PD-Mediterranean (WHO class II) constitutes84% of G6PD mutations in this population and theG6PD-A- (WHO class III) represents 5.8% [2,28,31].G6PD deficiency is confined to the oasis part of the area,as malaria was much more prevalent in the oasis than inthe desert [32-34]. A recent retrospective Ahsai studyfound no single severe G6PD deficient case among 236neonates from one Arabic Bedouin tribe subjected tocord blood screening by FST [29]. Therefore, this tribecan function as the reference population for estimatingthe LRLs of G6PD [35]. Henceforth, this tribe will bereferred to as the reference tribe.The reference sample group was identified from the
delivery room log book via the mothers’ names. Itconsisted of all consecutive neonates born to mothersfrom the reference tribe between March, 2010 and June,2012 that satisfied all the following posteriori inclusioncriteria: 1) full-term (37 weeks of gestation); 2) roomedin with mothers and were not admitted to the specialcare nursery; 3) no phototherapy treatment during theneonatal period; 4) negative direct antiglobulin test; and5) fathers of female neonates were from the referencetribe. For male neonates it does not matter whether thefather is from the reference tribe or not, but it doesmatter for female neonates as the G6PD is inherited asX-linked recessive. Thus, only copies of birth notices offemale neonates were reviewed to ascertain that bothparents were from the reference tribe. At KAH, birthnotices that include the full name of both parents areissued upon home discharges and copies of these birthnotices are stored in hard and electronic medical recordsof neonates. We selected only full-term neonates as wedid not expect to have an adequate number of pretermneonates of the reference sample group during the studyperiod and as G6PD values have been shown to be
higher in preterm neonates <34 weeks of gestation[15,36,37]. Gestational age was calculated according to thebest obstetric estimate at KAH based on the first or sec-ond trimester obstetric ultrasound and/or the last men-strual period, and on the Ballard score when the bestobstetric estimate was uncertain [38,39]. The photother-apy threshold used in this hospital has been published pre-viously and is more conservative than those used by theAmerican Academy of Pediatrics [29]. All the study datawere extracted from electronic health care records(QuadraMed CPR 5.0.9, Reston, VA, USA). This study wasexempted from review by the Institutional Review Board.
Statistical analysisWe performed statistical analyses as endorsed by theIFCC- CLSI [24,25]. The IFCC-CLSI has endorsed theuse of the 2.5th percentile of the values as the LRL.Further, this body endorses the use of a minimum of 146reference individuals in each gender partition to calculatethe 95% confidence interval (CI) of the 2.5th percentile[25]. We estimated the 2.5th percentiles for males, fema-les, and the combined group.The IFCC-CLSI suggests detecting outliers by Tukey’s
boxplot for unskewed data and by method of Horn forskewed data. The method of horn uses Tukey’s boxploton Box-Cox transformed data [40]. Although the me-thod of Horn is implanted in RefVal 4.11, [41] we alsoestimated the best lambda and performed the Box-Coxtransformation by using already available SPSS syntax[42]. The two Tukey’s inner fences are the 25th per-centile minus 1.5 interquartile range (IQR) and the 75thpercentile plus 1.5 IQR. The two Tukey’s outer fencesare the 25th percentile minus 3.0 IQR and the 75thpercentile plus 3.0 IQR. Values outside the inner fencesbut inside the outer fences are considered mild outliersand values outside the outer fences are considered ex-treme outliers.Data extraction and entry of the outliers were double-
checked. It was difficult to ascertain whether these outlierswere due to G6PD mutations or to pre-analytic errors asthese values were not cross-referenced with moleculartesting. Assuming that the reference tribe is in Hardy-Weinberg equilibrium, the Hardy-Weinberg equationwas used as a surrogate to determine whether theseoutliers represent G6PD mutations [43,44]. The asymp-totic Pearson’s chi-square goodness-of-fit test with 2degrees of freedom was calculated to test the departurefrom Hardy-Weinberg proportions [45]. Distributions ofG6PD values with and without outliers were presented ashistograms with superimposed best-fitting normal distri-bution curves. Non-integer G6PD values were roundeddown to the nearest integer at the boundaries of histo-gram bins. The type of distribution of the G6PD valueswas assessed by visual examination of the histograms,
Al-Abdi et al. BMC Pediatrics 2013, 13:137 Page 4 of 15http://www.biomedcentral.com/1471-2431/13/137
comparison between measures of central tendency (mean,median, and mode), skewness, kurtosis, the Anderson-Darling test, and the Shapiro-Wilk test [46,47]. A distri-bution was considered normal if it had a two-sidedP value > .05 for skewness coefficient, kurtosis coefficient,and the Anderson-Darling or Shapiro-Wilk tests [46,47].The IFCC recommends testing for normal distributionusing coefficients of skewness and kurtosis and theAnderson-Darling test [46]. The Shapiro-Wilk test, whichhas not been evaluated by the IFCC, was also used as ithas recently been found to be more powerful than theAnderson-Darling test [47]. For comprehensiveness,z-scores of both skewness and kurtosis ware calculated as[Skewness (or Kurtosis)/SD of Skewness (or Kurtosis)]and z-scores between ±1.96 were considered statisticallyinsignificant [48].The IFCC-CLSI recommends excluding values from
unhealthy individuals and estimating the LRLs fromhealthy individuals only [20,25]. Thus, LRLs were esti-mated both in presence and absence of the detected out-liers as these outliers might be due to G6PD mutations.As laboratory professionals diverge on the best methodto estimate LRL, LRLs and their 95% CIs were estimatedby three methods when appropriate: parametric, non-parametric bootstrap based on 500 bootstrap samplesand non-parametric rank- based [24,25,41,49]. Lowerreference limits were also estimated based on methodsof previous studies in order to compare between LRLsbased on those methods and those based on method ofthe IFCC-CLSI. The Harris-Boyd method was used toassess the reliability of gender combined LRLs [50,51].The combined gender LRLs were considered to be reli-able when the larger SD divided by the smaller SD <1.5and when the normal deviate z value was less than thecritical z value of 5. Additionally, the proportion criteriawere used for non-normal distributions as it is moreaccurate than the Harris-Boyd method for such distribu-tions. (Lahti A, 2004), [52] The combined gender LRLswere considered to be reliable when proportion of G6PDvalues less than the combined LRL did not exceed 4.1%in any gender subgroups [52].The binomial test was used to compare the observed
frequencies of male and female neonates. The two-samplet-test assuming equal variances or Mann–Whitney U testwas used to compare differences between male and femaleneonates’ continuous variables when appropriate. Thetwo-sample t-test assuming unequal variances was used tocompare means of this study with those of previous stud-ies. The one-sample Wilcoxon signed rank test was usedto compare medians of this study with hypothetical valuesequal to medians of previous studies. A two-sided P value< .05 was considered statistically significant. Data analysiswas performed using the RefVal 4.11, IBM SPSS Statistics20 (Chicago, IL, USA), and OpenEpi 2.2.1 programs.
ResultsFigure 1 depicts the process of study selection. A total of463 term neonates (241 males and 222 females) of thereference tribe were born during the study period. Ofthese, 62 neonates (13.4%) did not meet the posterioriinclusion criteria (32 males and 30 females). The 2.5thpercentile of the G6PD values of the excluded neonateswas 9.6 U/g Hb (range: 7.3-19.6). Of the 401 neonates(86.6%) that met the posteriori inclusion criteria (209males and 192 females), 2 males and 4 females had noquantitative G6PD testing on their cord blood as thereagents were not available at the time of birth. Thus, 395term neonates with a similar proportion of males (n = 207)and females (n =188) left for analysis (P = .37). Mean (SD)gestational age of male and female neonates were similar[39.6 (1.3) versus 39.6 (1.4) weeks, P = .68). Mean (SD)birth weight of male and female neonates were similar[3315 (460) versus 3243 (442) grams, P = .12).The combined gender reference sample group had a
mean (SD) birth weight of 3281 (452) grams and a meangestational age of 39.6 (1.3) weeks.
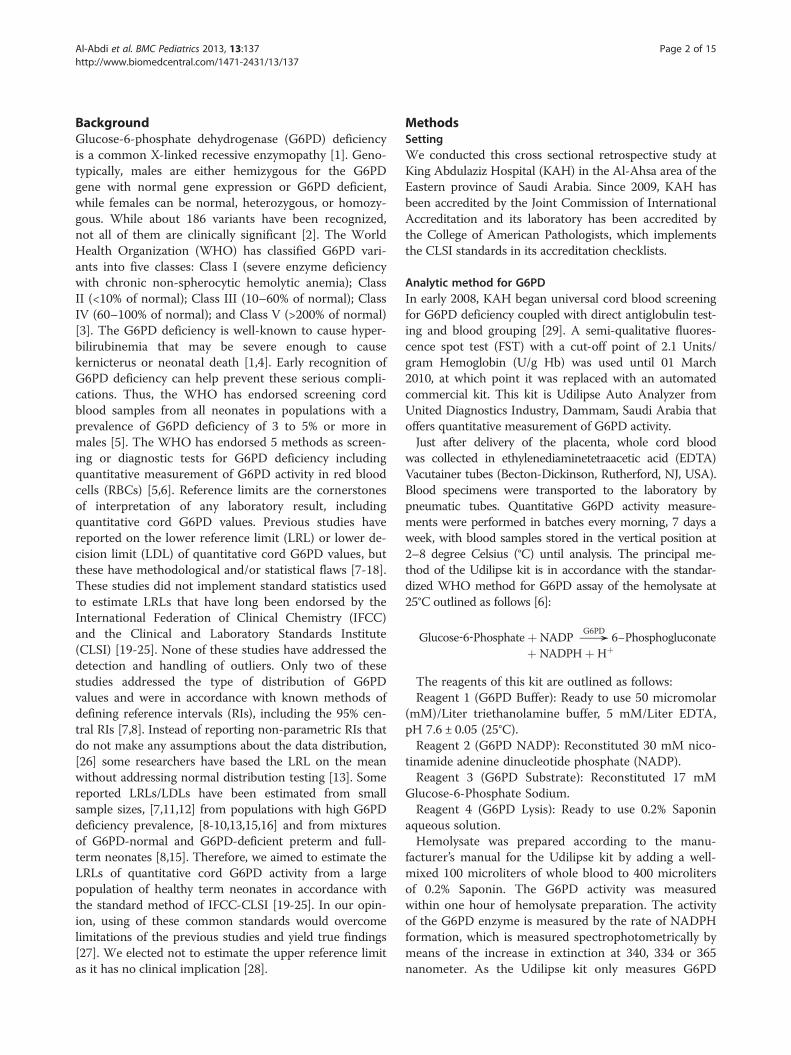
The outliersThe G6PD values among the males had no significantskewness (0.07). The SPSS syntax indicated that theoriginal data had the lowest skewness. Thus, Tukey’sboxplot was performed on their original values (Figure 2).Both the RefVal and SPSS programs detected exactly thesame eight (3.9%) G6PD values as outliers among males(Figure 2).The G6PD values among the females had significant
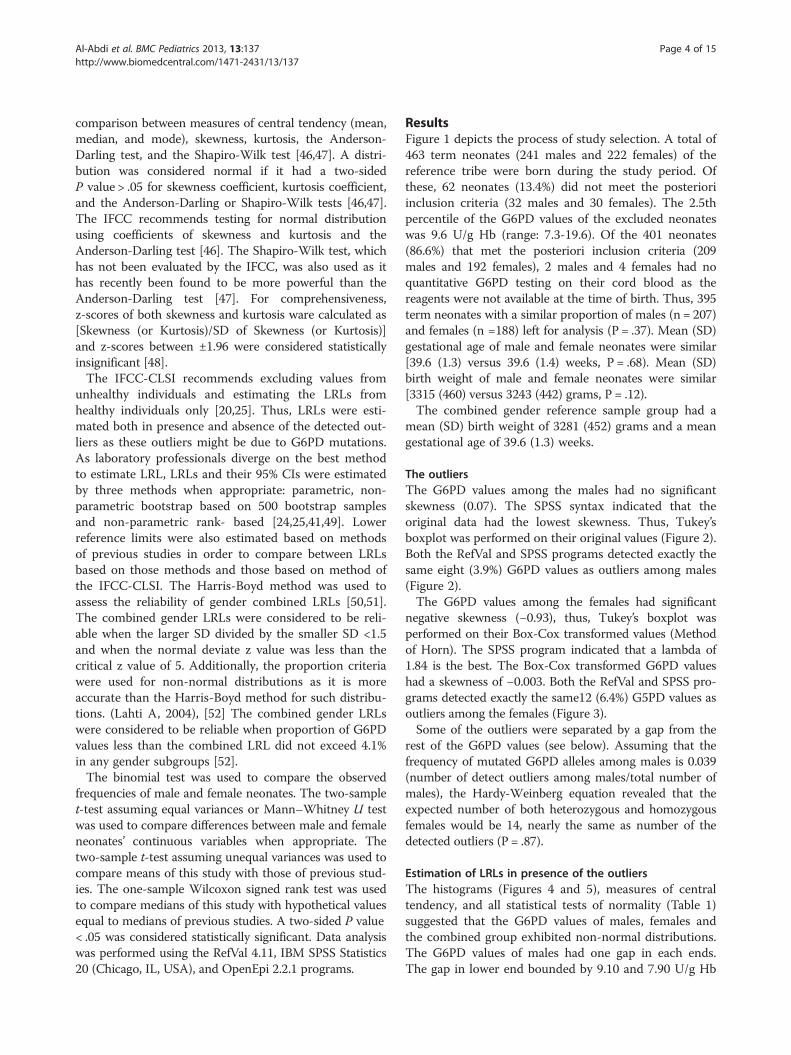
negative skewness (−0.93), thus, Tukey’s boxplot wasperformed on their Box-Cox transformed values (Methodof Horn). The SPSS program indicated that a lambda of1.84 is the best. The Box-Cox transformed G6PD valueshad a skewness of −0.003. Both the RefVal and SPSS pro-grams detected exactly the same12 (6.4%) G5PD values asoutliers among the females (Figure 3).Some of the outliers were separated by a gap from the
rest of the G6PD values (see below). Assuming that thefrequency of mutated G6PD alleles among males is 0.039(number of detect outliers among males/total number ofmales), the Hardy-Weinberg equation revealed that theexpected number of both heterozygous and homozygousfemales would be 14, nearly the same as number of thedetected outliers (P = .87).
Estimation of LRLs in presence of the outliersThe histograms (Figures 4 and 5), measures of centraltendency, and all statistical tests of normality (Table 1)suggested that the G6PD values of males, females andthe combined group exhibited non-normal distributions.The G6PD values of males had one gap in each ends.The gap in lower end bounded by 9.10 and 7.90 U/g Hb

Figure 1 Flow chart describing neonates’ selection.
Al-Abdi et al. BMC Pediatrics 2013, 13:137 Page 5 of 15http://www.biomedcentral.com/1471-2431/13/137
and the gap in upper end bounded by 22.80 and 20.80U/g Hb (Figure 4). The G6PD values of females had onegap in the lower end only which bounded by 9.60 and7.50 U/g Hb (Figure 4).Table 1 depicts that G6PD levels in male and
female neonates were similar (P = .50). It depicts theestimated LRLs in presence of the outliers. The RefValindicated that even the two-stage transformation ofthe combined group did not yield a normal distribu-tion. As a result, it recommended using the bootstrapmethod for the combined LRLs. The combined LRLswere reliable as the proportion of G6PD values lessthan the common LRL (10.0 U/g Hb) did not exceed4.1% among male or female neonates, the ratio ofSDs < 1.5 and the normal deviate z test < the critical z valueof 5 (Table 1).
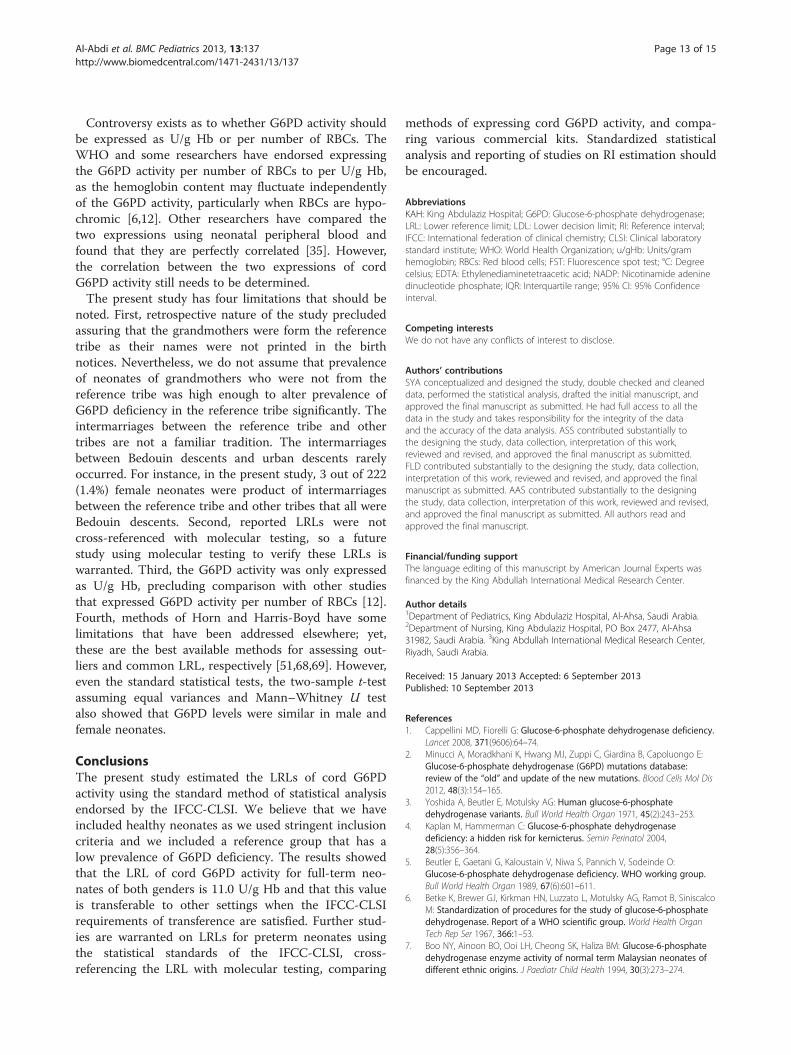
Estimation of LRLs in absence of the outliersAfter the outliers were excluded, LRLs were estimatedfrom cord blood samples of 375 neonates (199 malesand 176 females). The histograms (Figures 6 and 7) andmeasures of central tendency (Table 2) suggested thatthe G6PD values of males, females and the combinedgroup all exhibited normal distributions. This was con-firmed by the non-statistically significant coefficients ofskewness and kurtosis and by the Anderson-Darling andShapiro-Wilk tests (Table 2). As expected, the observedgaps in presence of the outliers disappeared.Table 2 depicts that G6PD levels in male and female
neonates were similar (P = .62). Estimated parametricLRLs had the tightest 95% CI, followed by bootstrap andnon-parametric LRLs (Table 2). The combined LRLswere reliable as the ratio of SDs < 1.5 and the normal
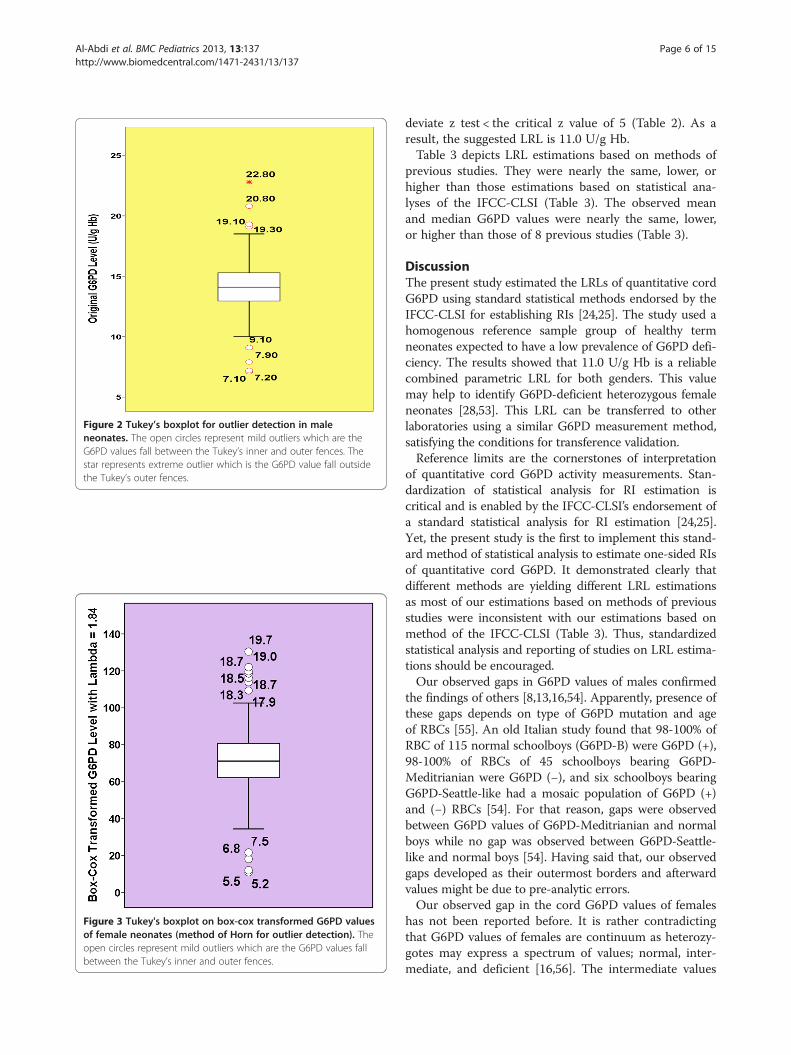
Figure 2 Tukey’s boxplot for outlier detection in maleneonates. The open circles represent mild outliers which are theG6PD values fall between the Tukey’s inner and outer fences. Thestar represents extreme outlier which is the G6PD value fall outsidethe Tukey’s outer fences.
Figure 3 Tukey's boxplot on box-cox transformed G6PD valuesof female neonates (method of Horn for outlier detection). Theopen circles represent mild outliers which are the G6PD values fallbetween the Tukey’s inner and outer fences.
Al-Abdi et al. BMC Pediatrics 2013, 13:137 Page 6 of 15http://www.biomedcentral.com/1471-2431/13/137
deviate z test < the critical z value of 5 (Table 2). As aresult, the suggested LRL is 11.0 U/g Hb.Table 3 depicts LRL estimations based on methods of
previous studies. They were nearly the same, lower, orhigher than those estimations based on statistical ana-lyses of the IFCC-CLSI (Table 3). The observed meanand median G6PD values were nearly the same, lower,or higher than those of 8 previous studies (Table 3).
DiscussionThe present study estimated the LRLs of quantitative cordG6PD using standard statistical methods endorsed by theIFCC-CLSI for establishing RIs [24,25]. The study used ahomogenous reference sample group of healthy termneonates expected to have a low prevalence of G6PD defi-ciency. The results showed that 11.0 U/g Hb is a reliablecombined parametric LRL for both genders. This valuemay help to identify G6PD-deficient heterozygous femaleneonates [28,53]. This LRL can be transferred to otherlaboratories using a similar G6PD measurement method,satisfying the conditions for transference validation.Reference limits are the cornerstones of interpretation
of quantitative cord G6PD activity measurements. Stan-dardization of statistical analysis for RI estimation iscritical and is enabled by the IFCC-CLSI’s endorsement ofa standard statistical analysis for RI estimation [24,25].Yet, the present study is the first to implement this stand-ard method of statistical analysis to estimate one-sided RIsof quantitative cord G6PD. It demonstrated clearly thatdifferent methods are yielding different LRL estimationsas most of our estimations based on methods of previousstudies were inconsistent with our estimations based onmethod of the IFCC-CLSI (Table 3). Thus, standardizedstatistical analysis and reporting of studies on LRL estima-tions should be encouraged.Our observed gaps in G6PD values of males confirmed
the findings of others [8,13,16,54]. Apparently, presence ofthese gaps depends on type of G6PD mutation and ageof RBCs [55]. An old Italian study found that 98-100% ofRBC of 115 normal schoolboys (G6PD-B) were G6PD (+),98-100% of RBCs of 45 schoolboys bearing G6PD-Meditrianian were G6PD (−), and six schoolboys bearingG6PD-Seattle-like had a mosaic population of G6PD (+)and (−) RBCs [54]. For that reason, gaps were observedbetween G6PD values of G6PD-Meditrianian and normalboys while no gap was observed between G6PD-Seattle-like and normal boys [54]. Having said that, our observedgaps developed as their outermost borders and afterwardvalues might be due to pre-analytic errors.Our observed gap in the cord G6PD values of females
has not been reported before. It is rather contradictingthat G6PD values of females are continuum as heterozy-gotes may express a spectrum of values; normal, inter-mediate, and deficient [16,56]. The intermediate values

Figure 4 Distributions of quantitative cord G6PD values in male and females in presence of the outliers with superimposed best-fittingnormal distribution curves.
Figure 5 Distributions of quantitative cord G6PD values in the combined gender group in presence of the outliers with superimposedbest-fitting normal distribution curve.
Al-Abdi et al. BMC Pediatrics 2013, 13:137 Page 7 of 15http://www.biomedcentral.com/1471-2431/13/137
Table 1 Characteristics of G6PD values and lower reference limits (2.5th percentiles) in presence of outliers
Males (n = 207) Females (n = 188) Combined (n = 395)
Mean (SD)a 14.1 (2.1) 14.1 (2.1) 14.1 (2.1)
Median (interquartile range)a 14.1 (12.9-15.3) 14.2 (13.2-15.2) 14.1 (13.0-15.3)
Modea 14.7 15.1 13.3
z-score of skewnessb 0.07/0.17 = 0.41 −0.93/0.18 = 5.2 −0.40/0.12 = −3.3
z-score of kurtosisb 2.3/0.34 = 6.8 3.9/0.35 = 11.1 3.0/0.25 = 12.0
Skewness coefficient (P-value) .66 <.001 .002
Kurtosis coefficient (P-value) <.001 <.001 <.001
Anderson-Darling test (P-value) <.001 <.001 <.001
Shapiro-Wilk test (P-value) <.001 <.001 <.001
Two-stage transformation parametric 9.8 (8.8-10.7) 9.4 (7.9-10.6) Unreliable as transformed distribution is not normal
LRL (95% CI)a
Bootstrap LRL (95% CI)a 10.0 (7.3-10.9) 9.0 (5.5-10.9) 10.0 (7.5-10.7)
Non-parametric LRL (95% CI)a 10.0 (7.1-10.8) 9.0 (5.2-10.9) 10.0 (7.1-10.7)
Combination tests
1. Proportion of observations 4/207 (1.9%) 5/188 (2.7%)
less than the combined LRL
(proportion criteria) 1.0
2. Harris-Boyd method Zero
Larger SD/Smaller SD 6.4
Normal deviate z test
Critical z value of 5aG6PD activity expressed as Units/gram Hemoglobin.bz-score = Skewness (or Kurtosis)/SD of Skewness (or Kurtosis).
Al-Abdi et al. BMC Pediatrics 2013, 13:137 Page 8 of 15http://www.biomedcentral.com/1471-2431/13/137
will bridge the gap between normal and deficient values.That is why it is difficult to diagnosis heterozygoteswithout a family history or molecular testing [56-59].Thus, this observed gap developed by chance or becausetheir outermost borders and afterward values might bedue to pre-analytic errors. However, excessive skewingof X-chromosome inactivation (allele ratios 3:1) in hete-rozygotes might account partly for our observed gap inG6PD values of females [60]. The excessive skewing hasbeen reported to be in favor of RBCs bearing normalG6PD gene [54]. As a result, G6PD values for heterozy-gotes would be within RI of non-G6PD deficient females.On other hand, the skewing could be in favor of abnor-mal RBCs, and then G6PD values for heterozygoteswould be within RI of homozygous G6PD-deficientfemales [60,61]. Reported incidence of excessive skewingof X-chromosome in cord blood of healthy, term, femaleneonates is 9- 24% [62,63]. Nevertheless, as the observedgap could be due to pre-analytic errors or chance andhas no plausible explanation, further confirmatory andexploratory studies are required before firm conclusionscan be drawn.Comprehensive normal distribution testing in the
present study showed that the distribution of quantitativecord G6PD exhibited a normal distribution only in
absence of the outliers. Previous studies that have runlimited normal distribution testing diverge on the normaldistribution of G6PD values. The G6PD values exhibited anormal distribution in the study by Boo et al. but a non-normal distribution in the study by Fok et al. [7,8]. Thefact that only full-term neonates were included in boththe present study and that by Boo et al. might explain thenormal distribution in those populations, while the inclu-sion of both preterm and term neonates in the study byFok et al. might account for the non-normal distribution,as G6PD activity has been shown to vary with gestationalage (Table 3) [15,36,37]. Some researchers based their LRLand LDL estimations on the mean without addressingnormal distribution testing [13]. Taken together, theseobservations emphasize the importance of conductingcomprehensive normal distribution testing or estimatingnon-parametric RIs that do not make any assumptionsabout the data distribution [26].Outliers are known to skew statistical tests based on
sample means and variances, making it strongly advisableto detect outliers before performing these tests. Thus, itwas not surprising that presence of these outliers widenedthe 95% CIs and distorted the homogeneity and the nor-mal distributions, particularly for the combined gendergroup where even the two-stage transformation did not
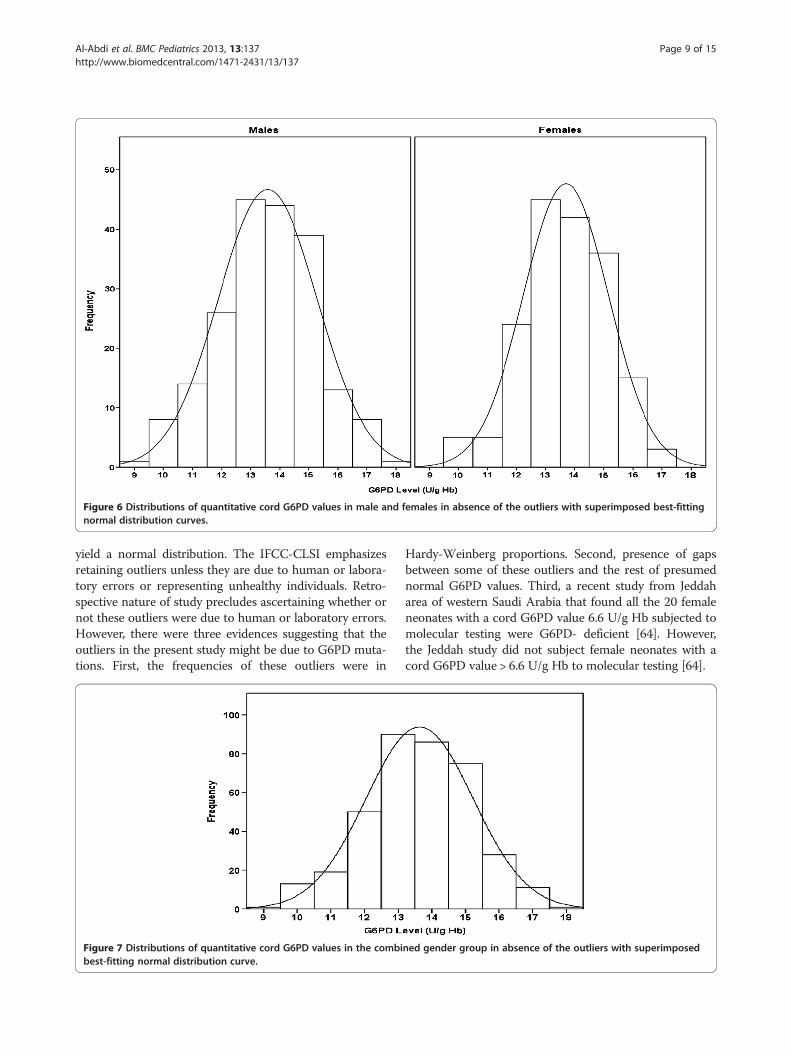
Figure 6 Distributions of quantitative cord G6PD values in male and females in absence of the outliers with superimposed best-fittingnormal distribution curves.
Al-Abdi et al. BMC Pediatrics 2013, 13:137 Page 9 of 15http://www.biomedcentral.com/1471-2431/13/137
yield a normal distribution. The IFCC-CLSI emphasizesretaining outliers unless they are due to human or labora-tory errors or representing unhealthy individuals. Retro-spective nature of study precludes ascertaining whether ornot these outliers were due to human or laboratory errors.However, there were three evidences suggesting that theoutliers in the present study might be due to G6PD muta-tions. First, the frequencies of these outliers were in
Figure 7 Distributions of quantitative cord G6PD values in the combibest-fitting normal distribution curve.
Hardy-Weinberg proportions. Second, presence of gapsbetween some of these outliers and the rest of presumednormal G6PD values. Third, a recent study from Jeddaharea of western Saudi Arabia that found all the 20 femaleneonates with a cord G6PD value 6.6 U/g Hb subjected tomolecular testing were G6PD- deficient [64]. However,the Jeddah study did not subject female neonates with acord G6PD value > 6.6 U/g Hb to molecular testing [64].
ned gender group in absence of the outliers with superimposed

Table 2 Characteristics of G6PD values and lower reference limits (2.5th percentiles) in absence of the outliers
Males (n = 199) Females (n =176) Combined (n = 375)
Mean (SD)a 14.1 (1.7) 14.1 (1.4) 14.1 (1.6)
Median (interquartile range)a 14.1 (13.0-15.2) 14.1 (13.2-15.1) 14.1 (13.1-15.2)
Modea 14.7 15.1 13.3
z-score of skewnessb −0.20/0.17 = −1.18 −0.30/0.18 = −1.67 −0.24/0.13 = −1.85
z-score of kurtosisb −0.13/0.34 = −0.38 −0.11/0.37 = −0.28 −0.06/0.25 = 0.24
Skewness coefficient (P-value) .24 .11 .06
Kurtosis coefficient (P-value) .87 .89 .92
Anderson-Darling test (P-value) >.999 >.999 .12
Shapiro-Wilk test (P-value) 0.64 0.18 0.14
Parametric LRL (95% CI)a 10.8 (10.3–11.3) 11.0 (10.5–11.6) 11.0 (10.5–11.3)c
Bootstrap LRL (95% CI)a 10.7 (10.1–11.2) 10.6 (10.2–11.6) 10.7 (10.3–11.1)
Non-parametric LRL (95% CI)a 10.7 (10.0–11.2) 10.6 (9.6–11.6) 10.7 (10.2–11.1)
Harris-Boyd method combination test
Larger SD/Smaller SD 1.2
Normal deviate z test Zero
Critical z value of 5 6.2aG6PD activity expressed as Units/gram Hemoglobin.bz-score = Skewness (or Kurtosis)/SD of Skewness (or Kurtosis).cThe suggested lower reference limit (LRL) and its 95% confidence interval (CI).
Al-Abdi et al. BMC Pediatrics 2013, 13:137 Page 10 of 15http://www.biomedcentral.com/1471-2431/13/137
We are suggesting using estimated LRLs in absence ofthe outliers for three reasons. First, the outliers of thepresent study might be due to pre-analytic errors. Sec-ond, they might be due to G6PD mutations. Third, allestimated LRLs were higher in absence than in presenceof the outliers. Increasing cut-off point of LRLs will in-crease their sensitivity at the expense of their specificity.This is quite acceptable as mislabeling G6PD-deficientneonates as normal is intolerable whereas mislabelingG6PD-normal neonates as deficient is tolerable [65].The parametric method is preferable to bootstrap andnon-parametric methods for normal distributions [49].This study showed that parametric LRLs had tight 95%CIs. The reference sample group in the present studysatisfied the assumptions of the Harris-Boyd method asthe G6PD values exhibited a normal distribution and theproportions of males and females were similar [50]. TheHarris-Boyd method showed that the LRL of the com-bined genders is reliable. The standard statistical tests, thetwo-sample t-test assuming equal variances and Mann–Whitney U test also showed that G6PD levels were similarin male and female neonates. This is logic and consistentwith the fact that the LRL was estimated from non-G6PDdeficient neonates, as normal males and females shouldhave the same G6PD values [58]. Consequently, we sug-gested the parametric LRL of the combined gender group(11.0 U/g Hg) as the LRL for cord G6PD of term neonates.Future studies on the LRLs for preterm neonates usingthe IFCC-CLSI are warranted as G6PD activity has beenshown to vary across gestational age categories [15,36,37].
Some laboratory professionals have advocated estima-ting the 5.0th percentile as the LRL when a one-sided RIis assumed [66]. We elected the 2.5th percentile as theLRL in compliance with the IFCC-CLSI guidelines. How-ever, the 5.0th percentiles of the G6PD values in this studywere similar to the 2.5th percentiles (data not shown).The IFCC-CLSI allow transferal of a reference limit
from one laboratory to another when pre-analyticalfactors and testing methods are comparable in bothlaboratories and when one of their 3 validation methodsis satisfied [25]. One of these validation methods is theN-20 reference sample group method, in which 20 sam-ples from carefully assessed reference individuals aretested. When no more than 2 of these 20 samples falloutside the transferred reference limit, it is statisticallyvalid to accept the transferred reference limit. Variouscommercial G6PD kits are available (Table 3), but as fewstudies have addressed their comparability, [65] futurestudies using the CLSI guidelines for methodologicalcomparison are warranted [67].Observed mean and median G6PD values were sta-
tistically significantly different from those reported inprevious studies. The discrepancy could be due to differ-ences in the timing of these studies, the ethnicities ofthe reference sample groups, gestational ages, G6PD kitsand their reagents, and statistical strategies for LRLestimation (Table 3). However, not all of these differ-ences are clinically significant, as trivial differences weresometimes statistically significant due to large samplesizes (Table 3).

Table 3 Summary of 8 previous studies on the lower reference limit (LRL)/lower decision limit (LDL) of cord G6PD ty and our LRL/LDL estimations basedon methods of those studies
Study Mean (SD)a
OR MedianaP-valueb LRL/LDLa Our LRL/LDL estimationsa based on
methods of previous studiesMethod for LRL/LDL est n G6PD measurement
method
I. Previous studies with means/medians similar statistically/clinically to those of the present study
Fok et al. (1985) [8] 10.6 10.8 Chinese neonates born at eeks ofgestation.
Cobas Bio,F.Hoffmann,La Roche & Co. (Switzerland)
Male (n = 660) 14.8 <.001c Observed normal G6PD a separated fromabnormal activity in male tes.
14.3 (3.9) .30
Female (n = 568) 14.6 <.001c The 3rd percentile of valu
14.6 (2.9) .002c after excluding deficient m eonates (< 3.0).
Ainoon et al.(2003)[10] (n = 976)
14.6 (mean) SD was not reportedC 8.7 8.5 Malay and Chinese neona stational age wasnot addressed. G6PD defi is < 60% of thenormal mean level.
Randox Laboratories, Ltd.
Riskin et al. (2012) [15] 14.7 (2.0) <.001c Jew (Sephardic, Ashkenaz pian), Arab(Muslim, Druze, Christian) aucasus pretermand term neonates.
Sentinel Diagnosticskit (Italy)
(n = 2269 term neonates)
Male >7.0 8.5 G6PD deficiency is < 60% normal mean level.[70] Gender distribution. H einberg equation.
Female >10.0 9.6
II. Previous studies with means lower than those of the present study
Boo et al. (1994) [7] >4.1 9.9 Normal Malay, Chinese, an ian neonates bornat 37 weeks of gestation
Manually according to thestandardized
Male (n = 135) 8.3 (2.2) <.001 G6PD level 4.1 U/g Hb or ive fluorescencespot test.
WHO method for G6PDassay of the hemolysate.
95% CI:7.9-8.6 <.001
Female (n = 127) 8.5 (2.1)
95% CI:8.2-8.9 Mean-2SD
Azma et al. (2010) [11](n = 94)
12.4 (2.3) <.001 10.2 12.0 Normal term Malay neon th negativefluorescence spot test. 68 rence interval(mean-1SD)
OSMMR-D (R&D DiagnosticsLtd., Greece)
Al-A
bdietal.BM
CPediatrics
2013,13:137Page
11of
15http://w
ww.biom
edcentral.com/1471-2431/13/137
activi
imatio
>30 w
ctivityneona
es
ale n
tes. Geciency
i, Ethio, and C
of theardy-W
d Indwith
negat
ates wi% refe

Table 3 Summary of 8 previous studies on the lower reference limit (LRL)/lower decision limit (LDL) of cord G6PD activity and our LRL/LDL estimations basedon methods of those studies (Continued)
III. Previous studies with mean/median higher than those of the present study
Reclos et al.(2003) [9] Uneventful pregnancies and normal full-termdeliveries.
OSMMR200 0 (R&D
Greek Male (n = 505) 20.8 (1.6) <.001 12.5 8.5 G6PD deficiency is < 60% of the normalmean level.[70]
Diagnostics Ltd., Greece)
Greek Female (n = 551) 19.5 (2.0) <.001 11.7 8.5
Albanian Male (n = 444) 21.6 (2.0) <.001 13.0
Albanian Female(n = 363)
21.0 (2.6) <.001 12.6
Kaplan et al. (2005) [13] Healthy term and near-term African Americanneonates.
Technicon RA 1000 analyzer(Bayer Diag.,NY)
Male (436) 21.8 (2.9) <.001 14.5 9.1 Observed normal G6PD activity separated fromabnormal activity in male neonates.
Algur et al. (2012) [16] Sephardic Jew born at 36 weeks of gestation. Sentinel Diagnostics kit(Italy)
Male (n = 1256) 18.8 <.001 9.0 9.1 Males: observed normal G6PD activity separatedfrom abnormal activity.
Female (n = 1153) 18.4 <.001 9.5 7.1d Probable normal females: > 50% of the normalmale median level.
aG6PD activity expressed as Units/gram Hemoglobin (U/g Hb). Some of the original values were rounded to one decimal.bP-value for the two-sample t-test that was used to compare our means with those of previous studies and the one-sample Wilcoxon signed rank test that was used to compare our medians with those ofprevious study.cNot clinically significant.dOur estimated LRL would be 9.6 U/g Hb based on the observed gap in G6PD values of females.
Al-A
bdietal.BM
CPediatrics
2013,13:137Page
12of
15http://w
ww.biom
edcentral.com/1471-2431/13/137
Al-Abdi et al. BMC Pediatrics 2013, 13:137 Page 13 of 15http://www.biomedcentral.com/1471-2431/13/137
Controversy exists as to whether G6PD activity shouldbe expressed as U/g Hb or per number of RBCs. TheWHO and some researchers have endorsed expressingthe G6PD activity per number of RBCs to per U/g Hb,as the hemoglobin content may fluctuate independentlyof the G6PD activity, particularly when RBCs are hypo-chromic [6,12]. Other researchers have compared thetwo expressions using neonatal peripheral blood andfound that they are perfectly correlated [35]. However,the correlation between the two expressions of cordG6PD activity still needs to be determined.The present study has four limitations that should be
noted. First, retrospective nature of the study precludedassuring that the grandmothers were form the referencetribe as their names were not printed in the birthnotices. Nevertheless, we do not assume that prevalenceof neonates of grandmothers who were not from thereference tribe was high enough to alter prevalence ofG6PD deficiency in the reference tribe significantly. Theintermarriages between the reference tribe and othertribes are not a familiar tradition. The intermarriagesbetween Bedouin descents and urban descents rarelyoccurred. For instance, in the present study, 3 out of 222(1.4%) female neonates were product of intermarriagesbetween the reference tribe and other tribes that all wereBedouin descents. Second, reported LRLs were notcross-referenced with molecular testing, so a futurestudy using molecular testing to verify these LRLs iswarranted. Third, the G6PD activity was only expressedas U/g Hb, precluding comparison with other studiesthat expressed G6PD activity per number of RBCs [12].Fourth, methods of Horn and Harris-Boyd have somelimitations that have been addressed elsewhere; yet,these are the best available methods for assessing out-liers and common LRL, respectively [51,68,69]. However,even the standard statistical tests, the two-sample t-testassuming equal variances and Mann–Whitney U testalso showed that G6PD levels were similar in male andfemale neonates.
ConclusionsThe present study estimated the LRLs of cord G6PDactivity using the standard method of statistical analysisendorsed by the IFCC-CLSI. We believe that we haveincluded healthy neonates as we used stringent inclusioncriteria and we included a reference group that has alow prevalence of G6PD deficiency. The results showedthat the LRL of cord G6PD activity for full-term neo-nates of both genders is 11.0 U/g Hb and that this valueis transferable to other settings when the IFCC-CLSIrequirements of transference are satisfied. Further stud-ies are warranted on LRLs for preterm neonates usingthe statistical standards of the IFCC-CLSI, cross-referencing the LRL with molecular testing, comparing
methods of expressing cord G6PD activity, and compa-ring various commercial kits. Standardized statisticalanalysis and reporting of studies on RI estimation shouldbe encouraged.
AbbreviationsKAH: King Abdulaziz Hospital; G6PD: Glucose-6-phosphate dehydrogenase;LRL: Lower reference limit; LDL: Lower decision limit; RI: Reference interval;IFCC: International federation of clinical chemistry; CLSI: Clinical laboratorystandard institute; WHO: World Health Organization; u/gHb: Units/gramhemoglobin; RBCs: Red blood cells; FST: Fluorescence spot test; °C: Degreecelsius; EDTA: Ethylenediaminetetraacetic acid; NADP: Nicotinamide adeninedinucleotide phosphate; IQR: Interquartile range; 95% CI: 95% Confidenceinterval.
Competing interestsWe do not have any conflicts of interest to disclose.
Authors’ contributionsSYA conceptualized and designed the study, double checked and cleaneddata, performed the statistical analysis, drafted the initial manuscript, andapproved the final manuscript as submitted. He had full access to all thedata in the study and takes responsibility for the integrity of the dataand the accuracy of the data analysis. ASS contributed substantially tothe designing the study, data collection, interpretation of this work,reviewed and revised, and approved the final manuscript as submitted.FLD contributed substantially to the designing the study, data collection,interpretation of this work, reviewed and revised, and approved the finalmanuscript as submitted. AAS contributed substantially to the designingthe study, data collection, interpretation of this work, reviewed and revised,and approved the final manuscript as submitted. All authors read andapproved the final manuscript.
Financial/funding supportThe language editing of this manuscript by American Journal Experts wasfinanced by the King Abdullah International Medical Research Center.
Author details1Department of Pediatrics, King Abdulaziz Hospital, Al-Ahsa, Saudi Arabia.2Department of Nursing, King Abdulaziz Hospital, PO Box 2477, Al-Ahsa31982, Saudi Arabia. 3King Abdullah International Medical Research Center,Riyadh, Saudi Arabia.
Received: 15 January 2013 Accepted: 6 September 2013Published: 10 September 2013
References1. Cappellini MD, Fiorelli G: Glucose-6-phosphate dehydrogenase deficiency.
Lancet 2008, 371(9606):64–74.2. Minucci A, Moradkhani K, Hwang MJ, Zuppi C, Giardina B, Capoluongo E:
Glucose-6-phosphate dehydrogenase (G6PD) mutations database:review of the “old” and update of the new mutations. Blood Cells Mol Dis2012, 48(3):154–165.
3. Yoshida A, Beutler E, Motulsky AG: Human glucose-6-phosphatedehydrogenase variants. Bull World Health Organ 1971, 45(2):243–253.
4. Kaplan M, Hammerman C: Glucose-6-phosphate dehydrogenasedeficiency: a hidden risk for kernicterus. Semin Perinatol 2004,28(5):356–364.
5. Beutler E, Gaetani G, Kaloustain V, Niwa S, Pannich V, Sodeinde O:Glucose-6-phosphate dehydrogenase deficiency. WHO working group.Bull World Health Organ 1989, 67(6):601–611.
6. Betke K, Brewer GJ, Kirkman HN, Luzzato L, Motulsky AG, Ramot B, SiniscalcoM: Standardization of procedures for the study of glucose-6-phosphatedehydrogenase. Report of a WHO scientific group. World Health OrganTech Rep Ser 1967, 366:1–53.
7. Boo NY, Ainoon BO, Ooi LH, Cheong SK, Haliza BM: Glucose-6-phosphatedehydrogenase enzyme activity of normal term Malaysian neonates ofdifferent ethnic origins. J Paediatr Child Health 1994, 30(3):273–274.
Al-Abdi et al. BMC Pediatrics 2013, 13:137 Page 14 of 15http://www.biomedcentral.com/1471-2431/13/137
8. Fok TF, Lau SP, Fung KP: Cord blood G-6-PD activity by quantitativeenzyme assay and fluorescent spot test in Chinese neonates.Aust Paediatr J 1985, 21(1):23–25.
9. Reclos GJ, Schulpis KH, Gavrili S, Vlachos G: Evaluation of glucose-6-phosphate dehydrogenase activity in two different ethnic groups usinga kit employing the haemoglobin normalization procedure. Clin Biochem2003, 36(5):393–395.
10. Ainoon O, Alawiyah A, Yu YH, Cheong SK, Hamidah NH, Boo NY, Zaleha M:Semiquantitative screening test for G6PD deficiency detects severedeficiency but misses a substantial proportion of partially-deficientfemales. Southeast Asian J Trop Med Public Health 2003, 34(2):405–414.
11. Azma RZ, Hidayati N, Farisah NR, Hamidah NH, Ainoon O: G6PD enzymeactivity in normal term Malaysian neonates and adults using aOSMMR2000-D kit with Hb normalization. Southeast Asian J Trop MedPublic Health 2010, 41(4):982–988.
12. Ardati KO, Bajakian KM, Mohammed AM, Coe EL: Glucose-6-phosphatedehydrogenase phenotypes in Bahrain: quantitative analysis andalectrophoresis characterization. Saudi Med J 1995, 16(2):102–104.
13. Kaplan M, Hoyer JD, Herschel M, Hammerman C, Stevenson DK: Glucose-6-phosphate dehydrogenase activity in term and near-term, male AfricanAmerican neonates. Clin Chim Acta 2005, 355(1–2):113–117.
14. Obasa TO, Adesiyun OO, Mokuolu OA, Ojuawo AI: Comparative analysis ofglucose-6-phosphate dehydrogenase levels in pre-term and term babiesdelivered at University of Ilorin Teaching Hospital. Pediatric reports 2012,4(1):e7.
15. Riskin A, Gery N, Kugelman A, Hemo M, Spevak I, Bader D: Glucose-6-phosphate dehydrogenase deficiency and borderline deficiency: associationwith neonatal hyperbilirubinemia. J Pediatr 2012, 161(2):191–196 e191.
16. Algur N, Avraham I, Hammerman C, Kaplan M: Quantitative neonatalglucose-6-phosphate dehydrogenase screening: distribution, referencevalues, and classification by phenotype. J Pediatr 2012, 161(2):197–200.
17. Kaplan M, Algur N, Hammerman C: Intermediate values of glucose-6-phosphate dehydrogenase. J Pediatr 2012, 161(3):571.
18. Riskin A, Kugelman A, Bader D: Reply. J Pediatr 2012, 161(3):571–572.19. Solberg HE: International federation of clinical chemistry (IFCC), scientific
committee, clinical section, expert panel on theory of reference values,and international committee for standardization in haematology (ICSH),standing committee on reference values. Approved recommendation(1986) on the theory of reference values. Part 1. The concept ofreference values. J Clin Chem Clin Biochem 1987, 25(5):337–342.
20. PetitClerc C, Wilding P: International Federation of Clinical Chemistry(IFCC), Scientific Committee, Clinical Section. The theory of referencevalues. Part 2. Selection of individuals for the production of referencevalues. J Clin Chem Clin Biochem 1984, 22(2):203–208.
21. Solberg HE, PetitClerc C: International Federation of Clinical Chemistry(IFCC), Scientific Committee, Clinical Section, Expert Panel on Theory ofReference Values. Approved recommendation (1988) on the theory ofreference values. Part 3. Preparation of individuals and collection ofspecimens for the production of reference values. J Clin Chem ClinBiochem 1988, 26(9):593–598.
22. Solberg HE, Stamm D: International Federation of Clinical Chemistry,Scientific Division: approved recommendation on the theory ofreference values. Part 4. Control of analytical variation in the production,transfer and application of reference values. Eur J Clin Chem Clin Biochem1991, 29(8):531–535.
23. Dybkaer R: International federation of clinical chemistry (IFCC)1),2) thetheory of reference values. Part 6. Presentation of observed valuesrelated to reference values. J Clin Chem Clin Biochem 1982, 20(11):841–845.
24. Solberg HE: International Federation of Clinical Chemistry (IFCC), ScientificCommittee, Clinical Section, Expert Panel on Theory of Reference Values(EPTRV), and International Committee for Standardization in Haematology(ICSH), Standing Committee on Reference Values. ApprovedRecommendation (1987) on the Theory of Reference Values. Part 5.Statistical treatment of collected reference values. Determination ofreference limits. J Clin Chem Clin Biochem 1987, 25(9):645–656.
25. Horowitz GL, Altaie S, Boyd JC, Ceriotti F, Garg U, Horn P, Pesce A, Sine HE,Zakowski J: Defining, establishing, and verifying reference intervals in theclinical laboratory; approved guideline vol. 28. Thirdth edition. Wayne, PA:Clinical and Laboratory Standards Institute (CLSI); 2008. (Corrected 2010): 72.
26. Horowitz GL: Estimating reference intervals. Am J Clin Pathol 2010,133(2):175–177.
27. Ioannidis JP: Why most published research findings are false.PLoS medicine 2005, 2(8):e124.
28. Minucci A, Giardina B, Zuppi C, Capoluongo E: Glucose-6-phosphatedehydrogenase laboratory assay: how, when, and why? IUBMB Life 2009,61(1):27–34.
29. Al-Abdi SY, Mousa TA, Al-Aamri MA, Ul-Rahman NG, Abou-Mehrem AI:Hyperbilirubinemia in glucose-6-phosphate dehydrogenase-deficientmale newborns in Al-Ahsa Saudi Arabia. Saudi Med J 2010, 31(2):175–179.
30. Warsy AS, El-Hazmi MA: G6PD deficiency, distribution and variants inSaudi Arabia: an overview. Ann Saudi Med 2001, 21(3–4):174–177.
31. Al-Ali AK, Al-Mustafa ZH, Al-Madan M, Qaw F, Al-Ateeq S: Molecularcharacterization of glucose-6-phosphate dehydrogenase deficiency inthe Eastern Province of Saudi Arabia. Clin Chem Lab Med 2002,40(8):814–816.
32. Gelpi AP: Glucose-6-phosphate dehydrogenase deficiency in SaudiArabia: a survey. Blood 1965, 25(4):486–493.
33. Gelpi AP: Glucose-6-phosphate dehydrogenase deficiency, the sicklingtrait, and malaria in Saudi Arab children. J Pediatr 1967, 71(1):138–146.
34. Gelpi AP: Glucose-6-phosphate dehydrogenase deficiency in SaudiArabia. Bull World Health Organ 1967, 37(4):539–546.
35. Kaplan M, Leiter C, Hammerman C, Rudensky B: Enzymatic activity inglucose-6-phosphate dehydrogenase-normal and -deficient neonatesmeasured with a commercial kit. Clin Chem 1995, 41(11):1665–1667.
36. Mesner O, Hammerman C, Goldschmidt D, Rudensky B, Bader D,Kaplan M: Glucose-6-phosphate dehydrogenase activity in malepremature and term neonates. Arch Dis Child Fetal Neonatal Ed 2004,89(6):F555–F557.
37. Ko CH, Wong RP, Ng PC, Li K, Chui KM, Yuen PM, Fok TF: Oxidativechallenge and glucose-6-phosphate dehydrogenase activity of pretermand term neonatal red blood cells. Neonatology 2009, 96(2):96–101.
38. Al-Abdi SY, Al-Aamri MA, Dabelah KI, Mousa TA, Al-Rahman NG, BukhamsienHI: Associations between spontaneous preterm birth and maternal-newborn ABO blood phenotype pairs. Saudi Med J 2012, 33(6):660–664.
39. Ballard JL, Khoury JC, Wedig K, Wang L, Eilers-Walsman BL, Lipp R: NewBallard Score, expanded to include extremely premature infants. J Pediatr1991, 119(3):417–423.
40. Horn PS, Feng L, Li Y, Pesce AJ: Effect of outliers and nonhealthyindividuals on reference interval estimation. Clin Chem 2001,47(12):2137–2145.
41. Solberg HE: The IFCC recommendation on estimation of referenceintervals. The RefVal program. Clin Chem Lab Med 2004, 42(7):710–714.
42. Osborne JW: Improving your data transformations: applying the Box-Coxtransformation. Practical Assessment, Research & Evaluation 2010, 15(12):1–9.
43. Dudek RW: BRS Genetics, 1st edn.. China: Wolters Kluwer Health: LippincottWilliams & Wilkins; 2010.
44. Edwards AWF: G. H. Hardy (1908) and Hardy–Weinberg Equilibrium.Genetics 2008, 179(3):1143–1150.
45. Wang J, Shete S: Testing departure from Hardy-Weinberg proportions. InStatistical Human Genetics-Methods in Molecular Biology. Volume 850. 1stedition. Edited by Elston RC, Satagopan JM, Sun S. New York, NY, USA:Humana Press; 2012:77–102.
46. Solberg HE: Statistical treatment of reference values in laboratorymedicine: testing the goodness-of-fit of an observed distribution to theGaussian distribution. Scand J Clin Lab Invest Suppl 1986, 184:125–132.
47. Razali NM, Wah YB: Power comparisons of Shapiro-Wilk, Kolmogorov-Smirnov, Lilliefors and Anderson-Darling tests. Journal of StatisticalModeling and Analytics 2011, 2(1):21–33.
48. Cramer D, Howitt DL: The SAGE Dictionary of Statistics: A Practical Resourcefor Students in the Social Sciences. 1st edition. London, UK: Sage PublicationsLtd; 2004.
49. Pavlov IY, Wilson AR, Delgado JC: Resampling approach for determinationof the method for reference interval calculation in clinical laboratorypractice. Clin Vaccine Immunol 2010, 17(8):1217–1222.
50. Harris EK, Boyd JC: On dividing reference data into subgroups to produceseparate reference ranges. Clin Chem 1990, 36(2):265–270.
51. Lahti A: Are the common reference intervals truly common? Case studieson stratifying biochemical reference data by countries using twopartitioning methods. Scand J Clin Lab Invest 2004, 64(4):407–430.
52. Lahti A, Petersen PH, Boyd JC, Rustad P, Laake P, Solberg HE: Partitioning ofnongaussian-distributed biochemical reference data into subgroups.Clin Chem 2004, 50(5):891–900.
Al-Abdi et al. BMC Pediatrics 2013, 13:137 Page 15 of 15http://www.biomedcentral.com/1471-2431/13/137
53. Watchko JF: Screening for glucose-6-phosphate dehydrogenasedeficiency in newborns-practical considerations. J Pediatr 2012,161(2):179–180.
54. Rinaldi A, Filippi G, Siniscalco M: Variability of red cell phenotypesbetween and within individuals in an unbiased sample of 77heterozygotes for G6PD deficiency in Sardinia. Am J Hum Genet 1976,28(5):496–505.
55. Luzzatto L, Poggi V: Glucose-6-phosphate dehydrogenase deficiency. InNathan and Oski’s hematology of infancy and childhood. 7th edition. Editedby Orkin SH, Nathan DG, Ginsburg D, Look AT, Fisher DE SEL IV. Canada:Saunders Elsevier; 2008:883–907.
56. Kaplan M, Hammerman C: Neonatal screening for glucose-6-phosphatedehydrogenase deficiency: biochemical versus genetic technologies.Semin Perinatol 2011, 35(3):155–161.
57. Luzzatto L: Glucose 6-phosphate dehydrogenase deficiency: fromgenotype to phenotype. Haematologica 2006, 91(10):1303–1306.
58. Beutler E: Glucose-6-phosphate dehydrogenase deficiency: a historicalperspective. Blood 2008, 111(1):16–24.
59. May J, Meyer CG, Großterlinden L, Ademowo OG, Mockenhaupt FP,Olumese PE, Falusi AG, Luzzatto L, Bienzle U: Red cell glucose-6-phosphatedehydrogenase status and pyruvate kinase activity in a Nigerianpopulation. Trop Med Int Health 2000, 5(2):119–123.
60. Burton C, Kaczmarski R: Glucose 6-phosphate dehydrogenase deficiencyand oxidative hemolysis. In Clinical Studies in Medical Biochemistry.Volume 1. Thirdth edition. Edited by Glew RH, Rosenthal MD. New York:Oxford University Press; 2007:123–133.
61. Hsia YE, Miyakawa F, Baltazar J, Ching NS, Yuen J, Westwood B, Beutler E:Frequency of glucose-6-phosphate dehydrogenase (G6PD) mutations inChinese, Filipinos, and Laotians from Hawaii. Hum Genet 1993,92(5):470–476.
62. Busque L, Mio R, Mattioli J, Brais E, Blais N, Lalonde Y, Maragh M, Gilliland D:Nonrandom X-inactivation patterns in normal females: lyonization ratiosvary with age. Blood 1996, 88(1):59–65.
63. El Kassar N, Hetet G, Brière J, Grandchamp B: X-Chromosome inactivationin healthy females: incidence of excessive lyonization with age andcomparison of assays involving DNA methylation and transcriptpolymorphisms. Clin Chem 1998, 44(1):61–67.
64. Jarullah J, AlJaouni S, Sharma MC, Busha MSJ, Kamal MA: Detection ofglucose-6-phosphate dehydrogenase deficiency in heterozygousSaudi female neonates. Enzyme Engineering 2012, 1(105):1–3.
65. Kaplan M, Leiter C, Hammerman C, Rudensky B: Comparison of commercialscreening tests for glucose-6-phosphate dehydrogenase deficiency inthe neonatal period. Clin Chem 1997, 43(7):1236–1227.
66. Boyd JC: Defining laboratory reference values and decision limits:populations, intervals, and interpretations. Asian journal of andrology 2010,12(1):83–90.
67. Krouwer JS, Tholen DW, Garber CC, Goldschmidt HMJ, Kroll MH, Linnet K,Meier K, Robinowitz M, Kennedy JW: Method Comparison and BiasEstimation Using Patient Samples; Approved Guideline. vol. 30. SecondEdition (Interim Revision)th edition. Wayne, PA: Clinical and LaboratoryStandards Institute (CLSI); 2010.
68. Solberg HE, Lahti A: Detection of outliers in reference distributions:performance of Horn’s algorithm. Clin Chem 2005, 51(12):2326–2332.
69. Henny J: The IFCC recommendations for determining reference intervals:strengths and limitations. LaboratoriumsMedizin 2009, 33(2):45–51.
70. Reclos GJ, Hatzidakis CJ, Schulpis KH: Glucose-6-phosphate dehydrogenasedeficiency neonatal screening: preliminary evidence that a highpercentage of partially deficient female neonates are missed duringroutine screening. J Med Screen 2000, 7(1):46–51.
doi:10.1186/1471-2431-13-137Cite this article as: Al-Abdi et al.: Lower reference limits of quantitativecord glucose-6-phosphate dehydrogenase estimated from healthy termneonates according to the clinical and laboratory standards instituteguidelines: a cross sectional retrospective study. BMC Pediatrics2013 13:137.
Submit your next manuscript to BioMed Centraland take full advantage of:
• Convenient online submission
• Thorough peer review
• No space constraints or color figure charges
• Immediate publication on acceptance
• Inclusion in PubMed, CAS, Scopus and Google Scholar
• Research which is freely available for redistribution
Submit your manuscript at www.biomedcentral.com/submit