Embed Size (px)
Citation preview

LOWER SNAKE RIVER COMPENSATION PLAN STEELHEAD FISH HATCHERY EVALUATIONS—IDAHO
Project Progress Report
October 1, 1998 to September 30, 1999
Chris Harrington Senior Fisheries Research Biologist
IDFG Report Number 03-40 July 2003

Lower Snake River Compensation Plan Steelhead Fish Hatchery Evaluations—Idaho
1999 Annual Report
By
Chris Harrington
Idaho Department of Fish and Game 600 South Walnut Street
P.O. Box 25 Boise, ID 83707
To
U.S. Fish and Wildlife Service Lower Snake River Compensation Plan Office
1387 S. Vinnell Way, Suite 343 Boise, ID 83709
Cooperative Agreement 14110-9-J001
IDFG Report Number 03-40 July 2003

i
TABLE OF CONTENTS Page
ABSTRACT.................................................................................................................................1 INTRODUCTION ........................................................................................................................2 METHODS..................................................................................................................................2
Hatchery Operations Documentation .......................................................................................2 Fish Marking............................................................................................................................3 Migration Conditions................................................................................................................3 Migration Timing and Juvenile Survival....................................................................................3 Adult Returns...........................................................................................................................4 Fisheries Contribution..............................................................................................................4 Hatchery Weirs........................................................................................................................5 Experimentation.......................................................................................................................5
Squaw Pond.........................................................................................................................5 RESULTS AND DISCUSSION....................................................................................................6
Hatchery Operations Documentation .......................................................................................6 Clearwater Fish Hatchery.....................................................................................................6
Brood Year 1998 ............................................................................................................. 6 Brood Year 1999 ............................................................................................................. 6
Hagerman National Fish Hatchery .......................................................................................7 Brood Year 1998 ............................................................................................................. 7 Brood Year 1999 ............................................................................................................. 7
Magic Valley Fish Hatchery..................................................................................................7 Brood Year 1998 ............................................................................................................. 7 Brood Year 1999 ............................................................................................................. 8
Migration Conditions................................................................................................................8 Migration Timing and Juvenile Survival....................................................................................8 Adult Returns...........................................................................................................................9
Fisheries Contribution ..........................................................................................................9 Weir Operation.....................................................................................................................9
Sawtooth Fish Hatchery Weir .......................................................................................... 9 East Fork Salmon River Weir .......................................................................................... 9 Crooked River Weir ........................................................................................................10 Red River Weir ...............................................................................................................10
Smolt-to-Adult Return Rates..................................................................................................10 Clearwater Fish Hatchery...................................................................................................10 Hagerman National Fish Hatchery .....................................................................................11 Magic Valley Fish Hatchery................................................................................................12
Experimentation.....................................................................................................................12 Squaw Pond.......................................................................................................................12
LITERATURE CITED................................................................................................................20 APPENDICES...........................................................................................................................22

ii
LIST OF TABLES Page
Table 1. Number of unique interrogations of PIT-tagged steelhead smolts, by release
site/PIT tag file(s) at Lower Granite Dam (GRJ), Little Goose Dam (GOJ), Lower Monumental Dam (LMJ), and McNary Dam (MCJ) for the 1999 migration period. A total of 11,886 PIT-tagged steelhead were released from Clearwater, Hagerman National, and Magic Valley fish hatcheries during April and May of 1999. Median travel time is to Lower Granite Dam.......................13
Table 2. Snake River mean daily outflow and spill (thousand cubic feet per second) for the Lower Granite Dam fore bay in Washington from 1977-1999 during the peak and extended chinook salmon smolt migration periods as defined by Petrosky (1991). ................................................................................................14
Table 3. Estimated number of LSRCP hatchery steelhead that returned to Idaho from 1998-1999. The adult returns in 1998 and 1999 included fish from three age classes. Steelhead were reared at Clearwater, Hagerman National, and Magic Valley fish hatcheries. These estimates were prepared by the Idaho Department of Fish and Game Harvest Monitoring Project and only include steelhead harvested in Idaho�s sport fisheries, steelhead that returned to hatchery racks, and in-river escapement. These are minimum estimates and do not include all tributary and mainstem strays or in-river prespawning mortalities. ..............................................................................................................14
Table 4. Steelhead smolts released from Magic Valley, Hagerman National, and Clearwater fish hatcheries that contributed to the 1998-1999 steelhead return. The number of steelhead smolts released and the estimated number of adults that returned were compared to the production targets and projected adult return goals for each facility............................................................15
Table 5. Summary of the 1999 A-stock steelhead return to the Sawtooth Fish Hatchery weir. The fish return included fish of hatchery and natural origin. Hatchery aging criteria based on length were used to determine agea. ND indicates that the data were not available. Data is from Schilling et al. (1999). .......16
Table 6. Summary of the 1999 B-stock steelhead return to the East Fork Salmon River weir. The fish return included fish of hatchery and natural origin. Hatchery aging criteria, based on length, were used to determine agea. ND indicates that the data were not available. Data is from Schilling et al. (1999). .......17
Table 7. Summary of the 1999 B-stock steelhead return to the Crooked River weir. Hatchery aging criteria, based on length, were used to determine agea. All data is from Patterson (1999). ................................................................................18

iii
LIST OF FIGURES Page
Figure 1. Percent of the adult steelhead return goal achieved by Clearwater,
Hagerman National, and Magic Valley fish hatcheries between 1995 and 1999. Annual adult return goals for Clearwater, Hagerman National, and Magic Valley fish hatcheries were 14,000, 13,600, and 11,660, respectively. Note that the adult return goal for Clearwater Fish Hatchery decreased from 14,000 to 4,000 in 1999. .........................................................................................19
LIST OF APPENDICES Appendix A. Table 1. Release data for all steelhead released from Clearwater Fish
Hatchery during 1999. Releases are arranged by coded-wire tag group and raceway. The coded-wire tag group includes one or more unique tag codes, along with all untagged fish represented by those tags. If PIT tags were put into fish in a raceway that had more than one coded-wire tag code, the PIT tags were assumed to have been put into the various tag codes proportionally. ....................23
Appendix A. Table 2. Release data for all steelhead released from Hagerman National Fish Hatchery during 1999. Releases are arranged by coded-wire tag group and raceway. The coded-wire tag group includes one or more unique tag codes, along with all untagged fish represented by those tags. If PIT tags were put into fish in a raceway that had more than one coded-wire tag code, the PIT tags were assumed to have been put into the various tag codes proportionally. ....................25
Appendix A. Table 3. Release data for all steelhead released from Magic Valley Fish Hatchery during 1999. Releases are arranged by coded-wire tag group and raceway. The coded-wire tag group includes one or more unique tag codes, along with all untagged fish represented by those tags. If PIT tags were put into fish in a raceway that had more than one coded-wire tag code, the PIT tags were assumed to have been put into the various tag codes proportionally. ....................30
Appendix B. Table 1. Release and recovery data for brood year 1996 steelhead released from Clearwater Fish Hatchery. Only 1-ocean recoveries are available at this time. Data is shown by groups with both hatchery and harvest recoveries for each tag code, along with any untagged fish, shown separately. Harvest estimates are based on angler phone surveys and creel census data. Hatchery estimates include rack returns along with estimates of in-stream escapement values. The total returns represent a minimum estimate of returns that do not include out-of-basin strays or prespawning mortalities. Recovery data is from Hansen and White (In Press, a). .........................35

iv
List of Appendices (Continued) Page
Appendix B. Table 2. Release and recovery data for brood year 1996 steelhead
released from Hagerman National Fish Hatchery. Only 1-ocean recoveries are available at this time. Data is shown by groups with both hatchery and harvest recoveries for each tag code, along with any untagged fish, shown separately. Harvest estimates are based on angler phone surveys and creel census data. Hatchery estimates include rack returns, along with estimates of in-stream escapement values. The total returns represent a minimum estimate of returns that do not include out-of-basin strays or prespawning mortalities. Recovery data is from Hansen and White (In Press, a)............................................................................................37
Appendix B. Table 3. Release and recovery data for brood year 1996 steelhead released from Magic Valley Fish Hatchery. Only 1-ocean recoveries are available at this time. Data is shown by groups with both hatchery and harvest recoveries for each tag code, along with any untagged fish, shown separately. Harvest estimates are based on angler phone surveys and creel census data. Hatchery estimates include rack returns along with estimates of in-stream escapement values. The total returns represent a minimum estimate of returns that do not include out-of-basin strays or prespawning mortalities. Recovery data is from Hansen and White (In Press, a)............................................................................................39
Appendix C. Table 1. Release and recovery data for brood year 1995 steelhead released from Clearwater Fish Hatchery. Only 1- and 2-ocean recoveries are available at this time. Data is shown by groups with both hatchery and harvest recoveries for each tag code, along with any untagged fish, shown separately. Harvest estimates are based on angler phone surveys and creel census data. Hatchery estimates include rack returns along with estimates of in-stream escapement values. The total returns represent a minimum estimate of returns that do not include out-of-basin strays or prespawning mortalities. Recovery data is from Hansen and White (In Press, a) and Hansen and White (In Press, b)...................................42
Appendix C. Table 2. Release and recovery data for brood year 1995 steelhead released from Hagerman National Fish Hatchery. Only 1- and 2-ocean recoveries are available at this time. Data is shown by groups with both hatchery and harvest recoveries for each tag code, along with any untagged fish, shown separately. Harvest estimates are based on angler phone surveys and creel census data. Hatchery estimates include rack returns along with estimates of in-stream escapement values. The total returns represent a minimum estimate of returns that do not include out-of-basin strays or prespawning mortalities. Recovery data is from Hansen and White (In Press, a) and Hansen and White (In Press, b)..................44

v
List of Appendices (Continued) Page
Appendix C. Table 3. Release and recovery data for brood year 1995 steelhead
released from Magic Valley Fish Hatchery. Only 1- and 2-ocean recoveries are available at this time. Data is shown by groups with both hatchery and harvest recoveries for each tag code, along with any untagged fish, shown separately. Harvest estimates are based on angler phone surveys and creel census data. Hatchery estimates include rack returns along with estimates of in-stream escapement values. The total returns represent a minimum estimate of returns that do not include out-of-basin strays or prespawning mortalities. Recovery data is from Hansen and White (In Press, a) and Hansen and White (In Press, b)...................................47
Appendix D. Table 1. Release and recovery data for brood year 1994 steelhead released from Clearwater Fish Hatchery. All returns are complete at this time. Data is shown by groups with both hatchery and harvest recoveries for each tag code, along with any untagged fish, shown separately. Harvest estimates are based on angler phone surveys and creel census data. Hatchery estimates include rack returns along with estimates of in-stream escapement values. The total returns represent a minimum estimate of returns that do not include out-of-basin strays or prespawning mortalities. Recovery data is from Ball and White (2001), Hansen and White (In Press a), and Hansen and White (In Press, b)...................................49
Appendix D. Table 2. Release and recovery data for brood year 1994 steelhead released from Hagerman National Fish Hatchery. All returns are complete at this time. Data is shown by groups with both hatchery and harvest recoveries for each tag code, along with any untagged fish, shown separately. Harvest estimates are based on angler phone surveys and creel census data. Hatchery estimates include rack returns along with estimates of in-stream escapement values. The total returns represent a minimum estimate of returns that do not include out-of-basin strays or prespawning mortalities. Recovery data is from Ball and White (2001), Hansen and White (In Press a), and Hansen and White (In Press, b)...................................51
Appendix D. Table 3. Release and recovery data for brood year 1994 steelhead released from Magic Valley Fish Hatchery. All returns are complete at this time. Data is shown by groups with hatchery and harvest recoveries for each tag code, along with any untagged fish, shown separately. Harvest estimates are based on angler phone surveys and creel census data. Hatchery estimates include rack returns, along with estimates of in-stream escapement values. The total returns represent a minimum estimate of returns that do not include out-of-basin strays or prespawning mortalities. Recovery data is from Ball and White (2001), Hansen and White (In Press, a), and Hansen and White (In Press, b)..................................53

1
ABSTRACT
This annual report summarizes activities associated with Idaho-Lower Snake River Compensation Plan (LSRCP) steelhead hatchery activities from October 1, 1998 through September 30, 1999. Included in this report are all fall 1998 and spring 1999 adult steelhead Oncorhynchus mykiss returns and all releases of juvenile steelhead made within the reporting period. Information presented in this report supersedes that included in previous reports.
An estimated minimum of 9,318 adult LSRCP steelhead returned to Idaho in the fall of
1998 and spring of 1999. This estimated minimum consisted of 4,045 steelhead from Hagerman National Fish Hatchery releases, 3,888 from Magic Valley Fish Hatchery releases, and 1,385 from Clearwater Fish Hatchery releases. This return was well below the LSRCP goal of 39,260 adult steelhead and a 68% decrease from the 1997-1998 return year.
In April and May 1999, the Idaho-LSRCP steelhead hatcheries released 3,671,228
steelhead smolts. Clearwater Fish Hatchery released 595,998 brood year 1998 Dworshak B-stock smolts. Hagerman National Fish Hatchery released 1,133,825 brood year 1998 A-stock smolts. Magic Valley Fish Hatchery released 1,941,405 brood year 1998 smolts, of which 1,061,673 were B-stock while the remaining 879,732 were A-stock.
The out-migration conditions in 1999 were very good. Total flow and spill at Lower
Granite Dam during the peak migration period were near the highest levels seen during the last 20 years. Out-migrant survival under these conditions is expected to be better than average.
Cumulative, unique passive integrated transponder tag detections at downstream dams
showed no unusual results from production releases. Clearwater Fish Hatchery releases were detected at an overall rate of 33.1%, but most of this low percentage can be attributed to the poor performance of a supplementation group released in the Red River. Hagerman National Fish Hatchery releases were detected at an overall rate of 58.4% and had relatively little variation. Magic Valley Fish Hatchery releases were detected at 63.6%.
Author: Chris Harrington Senior Fisheries Research Biologist

2
INTRODUCTION
The completion of the four hydroelectric dams on the lower section of the Snake River in Washington reduced the returns of anadromous salmonids to the Snake River drainage. The Water Resources Development Act of 1976 authorized the Lower Snake River Compensation Plan (LSRCP) to mitigate for the loss of fisheries and wild runs to the Upper Snake River basin in Idaho, Washington, and Oregon. Mitigation for anadromous fishery losses included improvements in smolt passage at the dams, as well as the construction and operation of fish hatcheries for stock augmentation in the affected region. The U.S. Fish and Wildlife Service (USFWS) was authorized to administer the operation and maintenance of 12 hatcheries and 11 satellite facilities in the region.
The LSRCP includes a Hatchery Evaluation Studies (HES) component to monitor and
determine the best practices for the operation of LSRCP hatcheries in each state. In Idaho, the Idaho Department of Fish and Game (IDFG) operates McCall Fish Hatchery and the Sawtooth Fish Hatchery for producing chinook salmon Oncorhynchus tshawytscha, the Magic Valley Fish Hatchery for producing steelhead trout O. mykiss, and the Clearwater Fish Hatchery for producing both chinook and steelhead. In addition, the USFWS operates the Hagerman National Fish Hatchery for producing steelhead trout as part of the LSRCP mitigation program.
Hatchery evaluation consists of two major components as laid out in the Cooperative
Work Agreement established annually between the USFWS and the IDFG. The first of these components is the documentation of the accomplishments of the IDFG-LSRCP program towards meeting specific smolt production and adult return goals. The second component is to identify factors limiting hatchery success at meeting return goals and to recommend possible improvements as they become apparent.
This report summarizes juvenile steelhead releases from each of the three Idaho LSRCP
steelhead hatcheries during the period October 1, 1998 through September 30, 1999. This report also summarizes total returns, weir operation, and contribution to the fisheries for adult steelhead returning to Idaho during the fall of 1998 and spring of 1999. The experimentation section of the report covers a summary of the findings from the ongoing Squaw Creek Pond study.
METHODS
Hatchery Operations Documentation
Hatchery operations between October 1, 1998 and September 30, 1999 are documented in this report. Any information relevant to the quality of the brood year 1998 smolts released in 1999 or relevant to the early rearing success of brood year 1999 is discussed. Information concerning size at release, health problems, and dietary considerations was obtained through the Hatchery Brood Year and Run reports from each hatchery. Further information on final numbers and mark information was obtained through the Release database maintained by the IDFG Coded-Wire Tag (CWT) Recovery Laboratory in Lewiston, Idaho.

3
Fish Marking
With the exception of 4,993 fish released from Clearwater Fish Hatchery as part of a supplementation study, all brood year 1998 steelhead released from the three LSRCP hatcheries had a fin removed prior to release to indicate their hatchery origin. Representative samples destined for most release sites received coded-wire tags to facilitate measurement of adult return success. All production B-stock steelhead that received a CWT had the left ventral fin removed to indicate the presence of a tag. Coded-wire-tagged A-stock steelhead did not receive an externally visible tag indicator mark.
Small numbers of steelhead also received a passive integrated transponder (PIT) tag to
monitor out-migration success and timing. Not all releases included a PIT tag group, but groups were distributed with the intention that at least one PIT tag group would be included in each basin. The PIT tags were added preferentially to coded-wire-tagged fish when possible.
Migration Conditions
One of the important factors found to influence survival to adult of Idaho anadromous salmonids is the condition of the river corridor during out-migration. Raymond (1979) discusses several of the issues pertinent to smolt survival during migration. Of primary importance for this consideration is the level of flow in the lower reaches of the Snake River, which directly affects the amount of spill at the four lower Snake River dams, and the length of time taken by smolts during the migration through the river corridor (Berggren and Filardo 1993). This reporting period covers the adults that return as three-, four-, or five-year-olds during the fall of 1998 and the spring of 1999. These adults were from the out-migrations in the springs of 1995, 1996, or 1997. Therefore, the flow conditions during the emigration period for these three years, as well as the flow conditions during the emigration period of 1999, are reported. Water flow data for these periods was obtained through the Columbia River Data Access in Real Time (DART) website.
Petrosky (1991) defined two time periods that accounted for most of the chinook
migration past Lower Granite Dam. The Peak period of emigration for chinook smolts is from April 15 to May 5 and is the time period when approximately 50% of the yearling chinook salmon reach Lower Granite Dam. The Extended period is from April 20 to May 30 and encompasses the time when most of the wild and natural yearling chinook salmon reach the dam. Hatchery raised steelhead in Idaho are generally released beginning in early to mid April, and all releases are finished by early May. Steelhead emigration generally lags behind wild chinook emigration (Raymond, 1979), but falls within the periods identified for chinook by Petrosky.
Migration Timing and Juvenile Survival
Juvenile out-migration timing and survival was estimated with PIT tags. Tagging of hatchery steelhead was performed by IDFG fish marking and HES personnel about one month prior to release to give the fish a chance to recover and to allow for any tagging-induced mortality to occur. Size and mark information was collected at the time of marking and was submitted to the PIT Tag Information System (PTAGIS), a computerized database managed by Pacific States Marine Fisheries Commission (PSMFC). Release information for tag groups was obtained from hatcheries and was submitted to PTAGIS by the HES tag coordinator.

4
The PIT tags were interrogated at four of the dams on the Snake and Columbia Rivers:
Lower Granite, Little Goose, Lower Monumental, and McNary. Arrival timing and tag number data were collected for each interrogation site and linked to the release information found in the PTAGIS database. From this information, smolt migration timing to Lower Granite Dam and a smolt survival index through the system was obtained. The survival index is a minimum value for several reasons: 1) a variable number of smolts pass over the spillway at the dams rather than going through the bypass system; 2) mortality occurs after leaving the hatchery, but prior to arrival at an interrogation site; 3) mechanical errors allow fish to pass through the interrogation system undetected; 4) a small number of PIT tags fail for mechanical reasons (approximately 2%, Russell Kiefer, IDFG, personal communication), 5) a small number of smolts may shed the tag, which often goes undetected, and 6) a small but unknown number of smolts may die prior to release and not be recovered, although all mortalities recovered by the hatchery are scanned for PIT tags.
Median travel time to Lower Granite dam was calculated for each of the PIT tag groups
released in 1999. Interrogation rates were calculated for each PIT tag group by dividing the number of unique interrogations at Lower Granite, Little Goose, Lower Monumental, and McNary dams by the number of PIT-tagged steelhead released, multiplied by 100.
Adult Returns
The Harvest Monitoring Project (HMP) estimated the number of LSRCP steelhead that returned to Idaho in the 1998-1999 return year (Hansen and White In Press, a). This estimate consists of steelhead caught during the sport fishery, at hatchery racks, and in-river escapement for off-site release groups. Hansen and White�s (In Press, a) estimate should be considered a minimum estimate, since it does not include prespawning mortality or tributary strays. The number of smolts released versus the number of estimated adult returns was used to determine an estimated smolt-to-adult return (SAR) rate for each group.
The success of the LSRCP mitigation goals was measured by comparing the estimated
adult steelhead returns to the LSRCP goal of 39,260 adults. In addition, the individual contributions of Magic Valley, Clearwater, and Hagerman National fish hatcheries toward the overall mitigation goal was estimated using CWT recovery data supplied by the HMP. It should be noted that the adult return goal for Hagerman National Fish Hatchery remains at 13,600, even though production targets have been reduced from 2.4 million smolts down to 1.3 million smolts. Therefore, the overall adult return goal, as well as the specific goal for Hagerman National Fish Hatchery, is unrealistically high.
Fisheries Contribution
Snouts from coded-wire-tagged steelhead recovered by creel clerks in the fishery were sent to the CWT lab for processing. The HMP derived a harvest estimate by river section for the fishery through a phone survey of angler success (Hansen and White In Press, a). A sample rate was then calculated by river section per month for creel recoveries by dividing the number of harvested fish checked by the estimated harvest in that section (Hansen and White In Press, a). Contribution to the fishery for each LSRCP group was calculated by dividing the number of tags of each code recovered by the sample rate for the river section and month where the tag was recovered.

5
Hatchery Weirs
Hatchery personnel documented the number of steelhead that returned to the East Fork Salmon River weir, Sawtooth Fish Hatchery weir, and two weirs operated by Clearwater Fish Hatchery. The Clearwater Fish Hatchery weirs are located on Crooked River and Red River, which are tributaries to the South Fork of the Clearwater River. All adult steelhead recovered at the traps were measured for length and sex and were scanned for the presence of coded-wire tags. No subsampling of recovered adults took place at any of these weirs during the spring of 1999, so no expansion needed to be done on the tag group contribution. Snouts from steelhead containing a CWT were removed and sent to the CWT Lab for processing. The HMP used these data to estimate the total number of LSRCP-reared steelhead that returned to hatchery racks or escaped above the weir to spawn naturally.
Weir management at all LSRCP weirs was designed to segregate naturally produced
steelhead from hatchery-produced steelhead. At the East Fork and Sawtooth weirs, hatchery steelhead were collected for egg production, while natural steelhead were released above the weir. The Crooked River and Red River weirs were operated in the same fashion with the exception that hatchery-origin steelhead were released back down river.
Experimentation
Squaw Pond
The second year of releases from Squaw Pond occurred in 1999. The Squaw Pond release is an ongoing study to determine whether volitional releases from a pond environment improves migration success and reduces residualism in juvenile steelhead. Steelhead smolts reared at Magic Valley Fish Hatchery were released into the Squaw Pond acclimation facility at the earliest practical opportunity in the spring. This allowed the smolts a minimum of two weeks to imprint on the pond and Squaw Creek. After the acclimation period, the dam boards were removed from the outlet according to a prearranged schedule. The goal of board removal was to steadily lower the water level in the pond to encourage the smolts to emigrate freely without forcing them to leave. Representative groups from the early migrants, late migrants, and nonmigrants were PIT tagged to measure out-migration survival and timing. The nonmigrant group was taken from the fish remaining in the pond after all boards had been removed.
A further group of steelhead smolts was sequestered at Sawtooth Fish Hatchery from
among the fish destined for Squaw Pond. This group was called the Captive Group and was held to compare precocial development in the hatchery environment to precocial development in the acclimation pond. Precocity was determined through dissecting the fish and noting gonadal development.
Prior to trucking from Magic Valley Fish Hatchery, the population of smolts destined for
Squaw Pond was sampled for size and population characteristics. At the termination of volitional migration from the pond, the same information was obtained from the Captive Group that had been held at Sawtooth Fish Hatchery. Size and population data was not collected from the pond due to the difficulty in obtaining a representative sample.
See Osborne and Rhine (2000) for additional information regarding the design and
operation of the Squaw Pond study in 1999.

6
RESULTS AND DISCUSSION
Hatchery Operations Documentation
Clearwater Fish Hatchery
Brood Year 1998—In 1997, smolt production at Clearwater Fish Hatchery was reduced from an eventual release goal of 2,000,000 down to 800,000 to comply with the National Marine Fisheries Service hatchery production cap for the Snake River basin. Brood year 1998 was the second year under the lower goal. At the time the stocking reduction was implemented, Clearwater Fish Hatchery had not yet attained the higher goal, though smolt production had been growing every year.
A total of 699,768 brood year 1998 Dworshak B-stock eyed steelhead eggs were
received from Dworshak National Fish Hatchery (McGehee and Patterson 1999). These eggs were all from the middle egg takes and did not represent the entire run. This is common practice for Clearwater Fish Hatchery steelhead, since the fish will be released off-site and will not be part of a broodstock program.
Survival from eyed-egg to smolt was reported to be 85.5% (McGehee and Patterson
1999), which is comparable to the previous year. No disease incidence was reported for the brood year 1998 steelhead.
The bulk of the brood year 1998 steelhead were marked as production fish during the
summer of 1998 (McGehee and Patterson 1999). Complete information on stocks, release sites, and exact numbers of each mark type can be found in Appendix A, Table 1.
Survival to the dams was about 63% for the groups released in the lower South Fork of
the Clearwater River, whereas survival to the dams for the Clear Creek release was over 70% (Table 1). However, survival for the group released in the upper South Fork of the Clearwater River was only about one third the survival of the lower groups. Furthermore, the travel time for the upper group was almost 37 days compared to 6-7 days for the lower release groups.
Releases in the upper South Fork of the Clearwater River showed greatly decreased
survival when compared with other releases in the Clearwater. This trend has held consistent for several years (Harrington 2002a, Harrington 2002b, Rhine et al. 1999). Most of the PIT-tagged releases in the South Fork of the Clearwater River above Harpster were part of experimental releases. It is unclear whether the decreased survival is due to river conditions or the nature of the experimental release.
Brood Year 1999—During the month of April, Clearwater Fish Hatchery received
889,200 eyed brood year 1999 Dworshak B-stock steelhead eggs from the middle takes at Dworshak National Fish Hatchery (George and McGehee 2001). Survival was reported to be greater than 82%, and no health problems were reported.
7
Hagerman National Fish Hatchery
Brood Year 1998—A total of 1,355,000 eyed steelhead eggs were received from Oxbow Fish Hatchery and Sawtooth Fish Hatchery (Hagerman National Fish Hatchery 1999). These eggs consisted of two stocks: 803,000 Sawtooth A-stock and 552,000 Oxbow A-stock (Hagerman National Fish Hatchery 1998). Survival from egg to release was 94.7% for the Sawtooth A-stock and 86.4% for the Oxbow A-stock. No explanation is given for the difference in survival, though it may be due to location within the three tiers of raceways at Hagerman National Fish Hatchery.
All coded-wire tagging and fin clipping was completed during the end of September and
early October 1998. PIT tagging was performed during late February of 1999. Complete information on marks, release timing, and release location can be found in Appendix A, Table 2.
Survival of the PIT-tagged fish to the dams was fairly uniform, with detection rates
ranging from a low of 51.7% to a high of 64.7% (Table 1). All of the PIT tag groups were released at the Sawtooth weir, which accounts for much of the uniformity in the performance of these groups. The early and late progeny releases seemed to do somewhat better than the other release groups, but there is no obvious reason for that performance difference.
Brood Year 1999—During late May and early June of 1999, 1,453,000 eyed brood year
1999 steelhead eggs were received from Sawtooth Fish Hatchery and Oxbow Fish Hatchery (Hagerman National Fish Hatchery 1999). These eggs consisted of 899,000 Sawtooth A-stock and 554,000 Oxbow A-stock. Hatching success for the two stocks was about 97% (Hagerman National Fish Hatchery 1999).
Magic Valley Fish Hatchery
Brood Year 1998—During the latter part of April, all of May, and the first part of June, Magic Valley Fish Hatchery received four stocks of eyed steelhead eggs consisting of: 1,295,412 Dworshak B-, 7,700 East Fork B-, 887,000 Pahsimeroi A-, and 123,540 Oxbow A-stock eggs (Moore et. al. 1999). Survival to release for the Pahsimeroi A and Oxbow A stocks was 92.4% and 86.6%, respectively. Considering the small number of East Fork B-stock steelhead produced, Magic Valley Fish Hatchery combined them with the Dworshak B-stock in raceway 1E, so no survival estimate can be determined for this group. Survival to release for the Dworshak B-stock fish was 87.7%. This last estimate is atypical, since survival of Dworshak B-stock fish at Magic Valley Fish Hatchery has been considerably worse than survival for any other stock during the last several years. Most of the survival problems in this stock have been attributed to disease and other factors during the fingerling stage. These problems apparently did not arise this year, though no definitive explanation has been given for the change.
All coded-wire tagging and fin clipping occurred during September and October of 1998.
All PIT tagging took place during February of 1999. Complete information on marks, release timing, and release location can be found in Appendix A, Table 3.
Detection rates of the PIT-tagged steelhead at the dams was good, with a total survival
of 61.6% for Dworshak B-stock fish and 69.6% for Pahsimeroi A-stock fish (Table 1). This reduced survival of Dworshak B-stock fish compared to the A-stock fish is not a consistent

8
trend, though early survival of Dworshak B-stock steelhead in the Hagerman Valley is generally lower than A-stock survival.
Migration timing between point of release and Lower Granite Dam of the production PIT-
tagged steelhead varied from 11.5 days to 23.3 days (Table 1). This variability is probably due to differences in stocking date more than anything else. It may be advantageous to release fish over a narrower range of dates, but the large number of fish to be released and the limited number of trucks largely determines the date. The various PIT-tagged groups associated with the Squaw Pond study had a much wider variability in migration time, which probably reflects the considerably different conditions they encountered during emigration.
Brood Year 1999—From April through June of 1999, Magic Valley Fish Hatchery
received a total of 2,583,519 eyed steelhead eggs comprised of five stocks: 1,446,208 Dworshak B, 57,954 East Fork B, 515,375 Pahsimeroi A, 174,000 Oxbow A, and 389,982 Sawtooth A (Lowell et al. 2001). The Dworshak B-stock steelhead had a survival rate of only about 77%, whereas the other four stocks had survival rates between 90 and 95%. Unfortunately, the improved performance seen in the brood year 1998 Dworshak B-eggs was not maintained.
Migration Conditions
Flows were very good throughout the migration window in 1999 (Table 2). During both the peak and extended periods, flow values were among the highest seen since 1977. Spill at Lower Granite Dam followed the same pattern as flow, which may have increased survival for migrants throughout the migration window.
The three migration years that contributed to the 1999 adult return were 1995, 1996, and
1997. Of these three years, only the first had flows near average, whereas the last two had flows that were well above average during the migration period.
Migration Timing and Juvenile Survival
A total of 10,690 steelhead smolts were released with PIT tags in 1998. With the exception of 4,993 PIT tags released in the upper South Fork of the Clearwater, all of these fish were production smolts. Overall, 45.5% (4,869) of the PIT tags were interrogated at the dams (Table 1). However, this percentage was considerably reduced by the inclusion of the experimental group released in the upper South Fork of the Clearwater, which contained nearly 50% of the PIT tags but had a detection rate of only 26.6% (Table 1). If this release from the upper South Fork of the Clearwater was removed, the detection rate jumps to 62.1%, which is probably a more accurate representation of overall performance for migration year 1998.
In addition, the juvenile detection points at the dams detected small numbers of fish from
previous years. Detections from the 1997 migration year are probably steelhead that did not migrate during their first year in the river. Detections from earlier migration years are probably adults that fell back through the detection system. In either case, these detections were exceedingly rare and were not tabulated here.

9
Adult Returns
The HMP (Hansen and White In Press, a) estimated that Hagerman National Fish Hatchery, Magic Valley Fish Hatchery, and Clearwater Fish Hatchery returned a minimum of 9,318 adult steelhead to Idaho waters in the fall of 1998 and spring of 1999 (Table 3). This estimate does not include in-stream prespawning mortalities or tributary strays from hatchery release groups. Hansen and White (In Press, a) estimated that anglers harvested 5,253 steelhead, while 4,065 either returned to hatchery racks or escaped to spawn naturally.
The number of steelhead smolts released and the estimated number of adults that
returned are compared to facility design production targets and projected adult return goals in Table 4. Figure 1 shows adult returns from steelhead released by each of the three LSRCP steelhead hatcheries as a percentage of their return goals for the last five years. The 1998-1999 return year showed large declines in adult numbers for both Hagerman National and Magic Valley fish hatcheries. The returns for Clearwater Fish Hatchery showed the only increase. It must be noted that the adult return goal for Clearwater Fish Hatchery was reduced in 1999, from 14,000 to 4,000, which is reflected in the percent goal achievement.
Fisheries Contribution
Hansen and White (In Press, a) estimated that 24,100 hatchery steelhead were harvested by anglers during the 1998-99 season. Of these, 5,253 were produced by the three Idaho LSRCP facilities, while Dworshak National Fish Hatchery, Niagara Springs Fish Hatchery, and hatcheries in Oregon and Washington produced the remainder.
Weir Operation
Sawtooth Fish Hatchery Weir—Nine hundred thirty-three adult A-stock steelhead were trapped at the Sawtooth Fish Hatchery weir between March 23 and May 6, 1999 (Schilling et al. 1999). This total consisted of 529 males (56.7%) and 404 females (43.3%). Of the 529 males, 526 were of hatchery origin; 477 (90.7%) of those were 1-ocean fish. Of the 404 females, 397 were of hatchery origin; 315 (79.3%) of those were 1-ocean fish.
All wild/natural fish along with four hatchery origin males were released directly above
the weir for natural spawning (Schilling et al. 1999). Another 15 hatchery males and 15 hatchery females were released into a weired-off section of Beaver Creek, and 10 hatchery males along with 10 hatchery females were released into a weired-off section of Frenchmen Creek. These last two releases were part of a supplementation study conducted by IDFG (Byrne, 2002).
Three hundred sixty-four pairs of hatchery origin steelhead were spawned at the
Sawtooth weir in 1999, yielding 1,526,046 green eggs (Schilling et al. 1999). Survival to eye-up for these eggs was 87.7%, which left 1,338,178 eyed-eggs for distribution to Magic Valley and Hagerman National fish hatcheries. Complete disposition for all fish trapped can be found in Table 5.
East Fork Salmon River Weir—Fifty-six B-stock steelhead were recovered at the East
Fork trap that operated between April 2 and May 3, 1999 (Schilling et al. 1999). These fish were primarily returns from East Fork progeny that had been raised at Magic Valley Fish Hatchery. Of the 56 total fish recovered, 33 (58.9%) were male and 23 (41.1%) were female. Three of the

10
males and seven of the females were of natural origin; the rest were hatchery origin. All of the natural origin steelhead along with eight hatchery origin males were released above the weir to spawn naturally (Schilling et al. 1999). Complete disposition for all fish trapped can be found in Table 6.
Crooked River Weir—Trapping at the Crooked River trap commenced on March 31,
1999 and concluded in June (Patterson 1999). During that time, ten steelhead were trapped. Seven of the steelhead were of hatchery-origin, while the remaining three were of wild/natural-origin. Of the seven hatchery-origin steelhead, five were marked with ventral clips, indicating their inclusion in an on-going supplementation study. The ventral clipped steelhead along with the three wild/natural-origin steelhead were released above the weir. The remaining two hatchery steelhead were released below the weir (Table 7). One of these fish is unique. Patterson (1999) reported that an 88 cm adult was trapped that had a right ventral clip. At that size, the fish is easily large enough to be a 2-ocean or even 3-ocean fish. However, the only RV clipped releases in the basin were in 1994 and again in 1997. This would mean that the fish was either a very rare 4-ocean fish or it was a mistaken clip.
Red River Weir—The Red River trap began operation on April 1 and continued through
chinook season (Patterson 1999). No adult steelhead were trapped during this time, though Patterson (1999) reported that high runoff and debris caused the trap to be inoperable and even partially destroyed after May 5.
Smolt-to-Adult Return Rates
Clearwater Fish Hatchery
Adult returns in 1999 from Clearwater Fish Hatchery steelhead releases could consist of three different brood years of fish from 1994 to 1996. All of the adipose-clipped fish that were available to the fishery were Dworshak B-stock. In 1996 and 1997, there were small releases (15,215 and 75,984 respectively) of Selway B-stock steelhead that were not adipose clipped. Furthermore, releases in 1995, 1996, and 1997 each included small numbers (49,790, 22,498, and 53,721, respectively) of non-adipose-clipped steelhead that were part of other projects (Appendix B, Table 1; Appendix C, Table 1; Appendix D, Table 1). Adult returns from these non-adipose-clipped releases cannot be adequately evaluated, since they were neither caught in a fishery nor returned to a rack.
In 1995, Clearwater Fish Hatchery released 637,752 brood year 1994 Dworshak B-stock
smolts (Appendix D Table 1). About 633 adults were estimated to have returned from this release. Since none of these fish were released at a trapping facility, none were expected to return to a hatchery rack. Therefore, the poor return may be more prone to sampling error.
The second factor influencing this poor return was that production was well below the
target of 2,000,000 (Table 4). Production at the Clearwater facility was curtailed to allow for enhanced production in the Salmon River (Rhine and Osborne 2000). As long as the production remains at or below a quarter of the design goal for the facility, returns cannot be expected to approach the original target of 14,000 adult steelhead returning. The formal objectives were scaled down in 1997, but the effect of the reduction was felt earlier.

11
The 2-ocean returns for brood year 1995 releases showed continued improvement over the performance of brood year 1994. However, the two major factors limiting adult recoveries for Clearwater Fish Hatchery steelhead still applied, with only 1,286 2-ocean adults recovered from a release of 838,583 (Appendix C, Table 1). It must be noted that nearly 12% of this total release (99,598) consisted of fish that did not receive an adipose clip and could not be evaluated adequately.
First year returns of brood year 1996 steelhead released in 1997 were higher than first
year returns for brood year 1995 releases (Appendix B Table 1). Since all of these releases consisted of B-stock releases, this may not indicate how subsequent returns will perform. B-stock steelhead tend to return as two- and 3-ocean adults. A stronger showing of 1-ocean returns does not necessarily indicate that the overall SAR for the year class will be strong as well. Brood year 1994 steelhead returned considerably more adults as 1-ocean than did brood year 1995, but brood year 1995 returned more total adults than did brood year 1994.
Hagerman National Fish Hatchery
The 1998-1999 adult steelhead return included fish from three release years. All of the brood year 1994, 1995, and 1996 steelhead released from Hagerman National Fish Hatchery in 1995-1997 were A-stock fish. Though A-stock fish seldom return as 3-ocean adults, 18 brood year 1994 steelhead were estimated to have been included in the 1999 adult returns (Appendix D, Table 2). These few steelhead returns do not appreciably affect the total SARs for those groups as reported in Harrington (2002b).
The HMP estimated that 1,635 adult 2-ocean steelhead were recovered in 1999 from a
total brood year 1995 release of 1,322,418 (Appendix C, Table 2). Of these, fishermen accounted for 1,042, while the rest either returned to the Idaho hatchery racks or escaped to spawn naturally. This completes the returns for this brood year, since so few A-stock adults return as 3-ocean fish that they are very unlikely to contribute to the overall SAR.
Smolt-to-adult return rates for upper Salmon River releases were generally below 0.5%.
The SARs for the Little Salmon River were slightly better, with SARs for some CWT groups making it over 0.5%. The SARs for the Little Salmon River release may be less accurate than other SARs reported for this hatchery, since there are no rack recoveries for the river. All data for the Little Salmon River are based on creel survey information along with exploitation rate estimates by Ball (1999) and Hansen and White (In Press, b). Furthermore, the relatively high SARs of 0.7% for the group released at the Pahsimeroi Fish Hatchery weir may be unnaturally elevated, since there were no CWT in this group.
The first year of returns for brood year 1996 fish was not promising. A total of 2,392 adult
steelhead were recovered from a release of 1,148,330 (Appendix B Table 2). Overall, SARs after the first year were 0.21%. This number is expected to rise as the second year returns come in; however, it is still below the first year SARs for brood year 1995 steelhead. Lower release numbers coupled with lower first year SARs make it likely that overall brood year 1996 performance will be worse compared to the last few years.

12
Magic Valley Fish Hatchery
Adult returns from Magic Valley Fish Hatchery releases potentially consisted of fish from three different brood years. Surprisingly, the 100 3-ocean adult steelhead recovered in 1999 were all from an A-stock release in the Lemhi River (Appendix D Table 3). This is unusual, since A-stock steelhead rarely return as 3-ocean adults. Few 3-ocean returns were expected from the B-stock releases, since the SARs for the 2-ocean returns from these groups were moderate (Harrington 2002b).
The HMP estimated 1,519 adult brood year 1995 steelhead returned in 1999 from a total
release of 1,731,353 (Appendix C, Table 2). Of this total, anglers harvested 1,042, while the remainder either returned to a hatchery rack or contributed to in-river escapement. Since a sizeable percentage of these steelhead were B-stock, it is possible that there will be significant 3-ocean returns in 2000, but past performance suggests that these returns will most likely not alter the overall SARs for these release groups.
The overall SARs for Magic Valley Fish Hatchery brood year 1995 steelhead was
0.29%.This estimate was influenced by the very poor return of B-stock fish to both the East Fork and Little Salmon rivers. The brood year 1995 SAR is 25% less than the SAR for brood year 1994 steelhead, which suggests that the migration conditions encountered during the 1996 out-migration were inferior to those of 1995. This suggests that the 1994 brood year encountered considerably above average conditions during out-migration and their first year in the ocean. This is contrary to expectations based on the relatively good flow and spill conditions encountered in 1996 when compared to 1995 (Table 2).
The first year of adult recoveries for brood year 1996 steelhead was considerably less
than the previous year. This is a concern as there was a reduction in the proportion of B-stock fish that would not be expected to return as 1-ocean adults. The number of smolts released was decreased to 1,643,202, but the number of 1-ocean adults declined to 2,269 (Appendix B, Table 3).
Experimentation
Squaw Pond
The results of the 1999 emigration from Squaw Pond were disappointing. Osborne and Rhine (2000) reported that there was no particular evidence that the Squaw Pond acclimation facility had separated residual steelhead smolts from the general population, though they did note an increase in precocity in the pond. These results resemble the results from the 1998 emigration (Osborne and Rhine 1999) and further suggest that use of an acclimation facility in the upper Salmon River basin may not serve to reduce the number of residualized steelhead smolts in the river. Complete information about the characteristics and behavior of the 1999 migrants, as well as information about the operation of the Squaw Pond facility during the 1999 emigration period, can be found in Osborne and Rhine (2000).

13
Table 1. Number of unique interrogations of PIT-tagged steelhead smolts, by release site/PIT tag file(s) at Lower Granite Dam (GRJ), Little Goose Dam (GOJ), Lower Monumental Dam (LMJ), and McNary Dam (MCJ) for the 1999 migration period. A total of 11,886 PIT-tagged steelhead were released from Clearwater, Hagerman National, and Magic Valley fish hatcheries during April and May of 1999. Median travel time is to Lower Granite Dam.
Number / Percent Interrogated GRJ GOJ LMJ MCJ Total
Coordinator Release Site Rel. Date
No. Rel. No. % No. % No. % No. % No. %
Median Travel Time
(Days) Clearwater Fish Hatchery Dworshak B-Stock: AAB Red River 4/20/99 4993 495 9.9 598 12.0 206 4.1 34 0.7 1,333 26.6 36.6 TDR Clear Creek 4/20/99 599 142 23.7 197 32.9 67 11.2 7 1.2 413 68.9 7.5 TDR South Fork Clearwater R. 4/28/99 300 69 23.0 115 38.3 18 6.0 3 1.0 205 68.3 6.5 Total 5,892 1,951 33.1 Clearwater Hatchery Grand Total 5,892 1,951 33.1 Hagerman National Fish Hatchery Sawtooth A-Stock: TDR Sawtooth Hatchery
Feed/Fast Diet TDR99062.50H 4/23/99 300 72 24.0 71 23.7 25 8.3 3 1.0 171 57.0 31.4 TDR99063.52H 4/23/99 300 75 25.0 55 18.3 24 8.0 1 0.3 155 51.7 20.8 TDR99063.54H 4/23/99 300 87 29.0 63 21.0 17 5.7 3 1.0 170 56.9 31.3
Feed/Fast Control TDR99062.49H 4/23/99 299 86 28.8 63 21.1 25 8.4 3 1.0 177 59.2 24.8 TDR99063.51H 4/23/99 300 79 26.3 70 23.3 28 9.3 0 0.0 177 59.0 20.1 TDR99063.53H 4/23/99 300 87 29.0 60 20.0 22 7.3 1 0.3 170 56.9 32.4 Early Egg Take Progeny TDR99063.43H 4/23/99 300 84 28.0 76 25.3 25 8.3 2 0.7 187 62.3 16.8 Late Egg Take Progeny TDR99063.77H 4/23/99 300 84 28.0 65 21.7 41 13.7 4 1.3 194 64.7 15.1 Hagerman National Grand Total 2,399 1,401 58.4 Magic Valley Hatchery Dworshak B-Stock TDR Lt Salmon @ Stinky Springs 4/14/99 299 114 38.1 77 25.8 4 1.3 0 0 195 65.2 17.1 TDR EF Salmon @ Dumpster 4/30/99 300 79 26.3 66 22.0 40 13.3 4 1.3 189 63.0 23.3 TDR Salmon R @ Tunnel Rock 4/28/99 300 76 25.3 67 22.3 29 9.7 7 2.3 179 59.7 20.3 TDR Squaw Creek 5/10/99 600 159 26.5 99 16.5 64 10.7 6 1.0 328 54.7 15.1
TDR Squaw Pond Early Migrants 5/10/99 300 66 22.0 54 18.0 32 10.7 2 0.67 154 51.3 14.3
TDR Squaw Pond Late Migrants 5/26/99 297 80 26.9 93 31.3 20 6.7 0 0 193 64.3 8.0 TDR Squaw Pond Non-Migrants 5/26/99 299 95 31.8 89 29.8 27 9.0 0 0 211 70.6 6.4 TDR Squaw Pond Captive 5/10/99 300 89 29.7 78 26.0 39 13.0 5 1.7 211 70.3 15.7 Total 2,695 1,660 61.6 Pahsimeroi A-Stock TDR Salmon R. @ Tunnel Rock 4/21/99 300 97 32.3 82 27.3 26 8.7 4 1.3 209 69.7 11.5 TDR Salmon R. @ Shoup Br 4/19/99 300 106 35.3 80 26.7 23 7.7 5 1.7 214 71.3 16.5 TDR Lemhi River 4/19/99 300 87 29.0 87 29.0 22 7.3 7 2.3 203 67.7 17.1 Total 900 626 69.6
Magic Valley Hatchery Grand Total 3,595 2,286 63.6

14
Table 2. Snake River mean daily outflow and spill (thousand cubic feet per second) for the Lower Granite Dam fore bay in Washington from 1977-1999 during the peak and extended chinook salmon smolt migration periods as defined by Petrosky (1991).
Year Peak
(4/15—5/5) Extended
(4/20—5/30) Peak Spill (4/15—5/5)
Extended Spill (4/20—5/30)
1977 39.1 40.2 0 0 1978 85.4 95.8 10.3 7.7 1979 64.9 90.0 0 3.4 1980 89.9 103.1 0 0 1981 76.2 86.7 9.4 7.1 1982 116.7 131.6 24.2 32.4 1983 85.6 111.3 22.1 19.3 1984 122.8 146.1 36.2 42.9 1985 86.9 87.2 0.7 1.5 1986 93.4 105.7 0.1 4.6 1987 57.7 62.3 0 0 1988 55.0 64.1 0 0 1989 94.1 87.2 0 0 1990 63.8 66.4 0 0 1991 44.0 70.8 0 0.3 1992 54.8 57.3 0 0 1993 69.8 114.0 0 19.7 1994 64.1 75.9 0 12.0 1995 72.1 97.2 2.6 14.0 1996 111.9 124.4 37.1 44.4 1997 149.1 169.9 43.6 57.0 1998 81.4 123.9 17.3 37.6 1999 105.8 111.8 36.8 41.1
Table 3. Estimated number of LSRCP hatchery steelhead that returned to Idaho from 1998-
1999. The adult returns in 1998 and 1999 included fish from three age classes. Steelhead were reared at Clearwater, Hagerman National, and Magic Valley fish hatcheries. These estimates were prepared by the Idaho Department of Fish and Game Harvest Monitoring Project and only include steelhead harvested in Idaho�s sport fisheries, steelhead that returned to hatchery racks, and in-river escapement. These are minimum estimates and do not include all tributary and mainstem strays or in-river prespawning mortalities.
Hatchery Brood Year 3-Ocean 2-Ocean 1-Ocean
Clearwater 1994 37 � � Clearwater 1995 � 1,286 � Clearwater 1996 � � 62
Estimated Fish Returned in 1998-1999 1,385 Hagerman 1994 18 � � Hagerman 1995 � 1,635 � Hagerman 1996 � � 2,392
Estimated Fish Returned in 1998-1999 4,045 Magic Valley 1994 100 � � Magic Valley 1995 � 1,519 � Magic Valley 1996 � � 2,269
Estimated Fish Returned in 1998-1999 3,888 Grand Total 9,318

15
Table 4. Steelhead smolts released from Magic Valley, Hagerman National, and Clearwater fish hatcheries that contributed to the 1998-1999 steelhead return. The number of steelhead smolts released and the estimated number of adults that returned were compared to the production targets and projected adult return goals for each facility.
Releases Contributing to the 1998-1999 Adult Returns
Brood Year Fish Hatchery
Number Released
Design Target
Percent of Target
1998-99 Adult Returns
1994 Clearwater 637,752 2,000,000 31.9% 37 1994 Hagerman National 1,151,544 1,300,000 88.6% 18 1994 Magic Valley 1,731,353 2,000,000 86.6% 100 Total 3,520,649 6,150,000 69.0% 155 1995 Clearwater 838,553 2,000,000 41.9% 1,286 1995 Hagerman National 1,322,849 1,300,000 101.8% 1,635 1995 Magic Valley 1,868,086 2,000,000 93.4% 1,519 Total 4,029,488 6,150,000 79.0% 4,440 1996 Clearwater 730,001 2,000,000 36.5% 62 1996 Hagerman National 1,147,144 1,300,000 88.2% 2,392 1996 Magic Valley 1,643,202 2,000,000 82.2% 2,269 Total 3,520,347 6,150,000 69.0% 4,723 Mean annual release as percent of target: 72.3% Total adult return:a 9,318 Adult return goal: 39,260 Percent of goal achieved: 23.7%
a These are minimum estimates that include only steelhead harvested in Idaho�s sport fisheries, steelhead that returned to hatchery racks, and off-site escapement. Tributary strays and in-river prespawning mortalities are not included.

16
Table 5. Summary of the 1999 A-stock steelhead return to the Sawtooth Fish Hatchery weir. The fish return included fish of hatchery and natural origin. Hatchery aging criteria based on length were used to determine agea. ND indicates that the data were not available. Data is from Schilling et al. (1999).
HATCHERY ORIGIN n = 923
Males n = 526 Females n = 397 Ageb Trapped Released Spawned Morts Other Trapped Released Spawned Morts Other 1-ocean 477 26 ND 0 ND 315 23 ND ND ND 2-ocean 49 3 ND 0 ND 82 2 ND ND ND Total 526 29c 364 0 133d 397 25c 364 1 7d
NATURAL ORIGIN n = 10
Males n = 3 Females n = 7 Ageb Trapped Released Spawned Morts Other Trapped Released Spawned Morts Other 1-ocean 1 1 0 0 0 3 3 0 0 0 2-ocean 2 2 0 0 0 4 4 0 0 0 Total 3 3e 0 0 0 7 7e 0 0 0
Total Number Trapped 933 Green Egg Number 1,526,046 Trapping Period 3/23 – 5/6/99 Eyed Egg Number 1,338,178f (87.7% eye up)
a Fish were aged using the following aging criteria: RUN SEX LENGTH AGE (Years in Ocean)
A Male ≤68 cm 1-Ocean A Male >68 cm 2-Ocean A Female ≤65 cm 1-Ocean A Female >65 cm 2-Ocean
b Hatchery fish classified as 1-ocean were brood year 1996, released in 1997. Hatchery fish classified as 2-ocean were brood year 1995, released in 1996.
c Of these fish, 50 (25 male, 25 female) were released in Beaver Creek and Frenchman Creek for natural spawning as part of a supplementation study. Fifteen pair went to Beaver Creek, while the remainder went to Frenchman Creek. Another four hatchery males were released above the weir.
d Fish were killed but not used for spawning. e Fish were released above the weir. f Eyed-eggs were shipped to other hatcheries for rearing.

17
Table 6. Summary of the 1999 B-stock steelhead return to the East Fork Salmon River weir. The fish return included fish of hatchery and natural origin. Hatchery aging criteria, based on length, were used to determine agea. ND indicates that the data were not available. Data is from Schilling et al. (1999).
HATCHERY ORIGIN n = 46
Males n = 30 Females n = 16 Ageb Trapped Released Spawned Morts Other Trapped Released Spawned Morts Other 1-ocean 28 7 ND 0 ND 10 0 10 0 0 2-ocean 2 1 ND 0 ND 6 0 6 0 0 Total 30 8c 18 0 4d 16 0 16 0 0
NATURAL ORIGIN n = 10
Males n = 3 Females n = 7 Ageb Trapped Released Spawned Morts Other Trapped Released Spawned Morts Other 1-ocean 2 2 0 0 0 1 1 0 0 0 2-ocean 1 1 0 0 0 6 6 0 0 0 Total 3 3c 0 0 0 7 7c 0 0 0
Total Number Trapped 56 Green Egg Number 62,442 Trapping Period 4/6-4/27/99 Eyed Egg Number 57,954e (92.8% eye up)
a Fish were aged using the following aging criteria: RUN SEX LENGTH AGE (Years in Ocean)
B Male ≤73 cm 1-Ocean B Male >73 cm 2- or 3-Ocean B Female ≤68 cm 1-Ocean B Female >68 cm 2- or 3-Ocean
b Hatchery fish classified as 1-ocean were brood year 1996, released in 1997. Hatchery fish classified as 2-ocean were brood year 1995, released in 1996.
c Fish were released above the weir. d Fish were killed but not used for spawning. e Eyed-eggs were shipped to other hatcheries for rearing.

18
Table 7. Summary of the 1999 B-stock steelhead return to the Crooked River weir. Hatchery aging criteria, based on length, were used to determine agea. All data is from Patterson (1999).
HATCHERY ORIGIN n = 7
Males n = 4 Females n = 3 Ageb Trapped Released Spawned Morts Other Trapped Released Spawned Morts Other 1-ocean 1 0 0 0 0 0 0 0 0 0 2-ocean 3 0 0 0 0 3 0 0 0 0 Total 4 4d 0 0 0 3 3d 0 0 0
NATURAL ORIGIN n = 3
Males n = 2 Females n = 1 Ageb Trapped Released Spawned Morts Other Trapped Released Spawned Morts Other 1-ocean 0 0 0 0 0 0 0 0 0 0 2-ocean 2 2 0 0 0 1 1 0 0 0 Total 2 2c 0 0 0 1 1c 0 0 0
Total Number Trapped 10 Green Egg Number 0 Trapping Period 3/31-6/99 Eyed Egg Number 0
a Fish were aged using the following aging criteria: RUN SEX LENGTH AGE (Years in Ocean)
B Male ≤73 cm 1-Ocean B Male >73 cm 2- or 3-Ocean B Female ≤68 cm 1-Ocean B Female >68 cm 2- or 3-Ocean
b Hatchery fish classified as 1-ocean were brood year 1995, released in 1996. Hatchery fish classified as 2-ocean were brood year 1994, released in 1995.
c Fish were released above the weir with a radio tag. d All fish released below the weir. Those fish with ventral clips (2 males, 3 females) received radio tags prior to
release.

19
0
10
20
30
40
50
60
70
1994-1995 1995-1996 1996-1997 1997-1998 1998-1999
Return Year
Perc
ent o
f Goa
l Ach
ieve
d
Clearwater Hagerman Magic Valley
Figure 1. Percent of the adult steelhead return goal achieved by Clearwater, Hagerman
National, and Magic Valley fish hatcheries between 1995 and 1999. Annual adult return goals for Clearwater, Hagerman National, and Magic Valley fish hatcheries were 14,000, 13,600, and 11,660, respectively. Note that the adult return goal for Clearwater Fish Hatchery decreased from 14,000 to 4,000 in 1999.

20
LITERATURE CITED
Ball, K., and M. White. 2001. Evaluation of Hatchery-Wild Composition of Idaho Salmon and Steelhead Harvest. United States Fish and Wildlife Service-Lower Snake River Fish and Wildlife Compensation Plan (October 1, 1996 to December 31, 1997). Idaho Department of Fish and Game. Boise, Idaho.
Berggren, T. J., and M. J. Filardo. 1993. An analysis of variables influencing the migration of
juvenile salmonids in the Columbia River basin. North American Journal of Fisheries Management 13:48-63.
Byrne, A. 2002. Steelhead Supplementation in Idaho Rivers Annual Progress Report. January
1, 2001�December 31, 2001. Idaho Department of Fish and Game, Boise, Idaho. George, B., and J. McGehee. 2001. Clearwater Fish Hatchery Brood Year Report. Brood Year
1998 Chinook and Brood Year 1999 Steelhead. Idaho Department of Fish and Game. Boise, Idaho.
Hagerman National Fish Hatchery Annual Report 1998. 1998. United States Fish and Wildlife
Service. Hagerman, Idaho. Hagerman National Fish Hatchery Annual Report 1999. 1999. United States Fish and Wildlife
Service. Hagerman, Idaho. Hansen, J., and M. White. In press a. Evaluation of Idaho Steelhead Harvest for Lower Snake
River Compensation Plan Hatchery Programs. September 1, 1998 to April 30, 1999. Idaho Department of Fish and Game, Boise, Idaho.
Hansen, J., and M. White. In press b. Evaluation of Idaho Steelhead Harvest for Lower Snake
River Compensation Plan Hatchery Programs. September 1, 1997 to April 30, 1998. Idaho Department of Fish and Game, Boise, Idaho.
Harrington, C. 2002a. Steelhead Fish Hatchery Evaluations-Idaho. Project Progress Report.
October 1, 1996 to September 30, 1997. Idaho Department of Fish and Game, Boise Idaho.
Harrington, C. 2002b. Steelhead Fish Hatchery Evaluations-Idaho. Project Progress Report.
October 1, 1997 to September 30, 1998. Idaho Department of Fish and Game, Boise Idaho.
Lowell, R., D. May, D. Keen, M. Olson, and W. Symmons. 2001. Magic Valley Hatchery 1999
Brood Year Report. Idaho Department of Fish and Game. Boise, Idaho. McGehee, J., and S. Patterson. 1999. Clearwater Fish Hatchery Brood Year 1997 Chinook and
Brood Year 1998 Steelhead Report. Idaho Department of Fish and Game. Boise, Idaho. Moore, B., D. May, D. Keen, and M. Olson. 2000. Magic Valley Fish Hatchery 1998 Brood Year
Report. Idaho Department of Fish and Game. Boise, Idaho.

21
Patterson, S. 1999. Clearwater Fish Hatchery Steelhead 1999 Run Report. Idaho Department of Fish and Game. Boise, Idaho.
Petrosky, C. E. 1991. Influence of smolt migration flows on recruitment and return rates of Idaho
spring chinook. Staff Report. Idaho Department of Fish and Game. Boise, Idaho. Submitted to the Endangered Species Act record of the National Marine Fisheries Service, March 1992.
Raymond, H. L. 1979. Effect of dams and impoundments on migrations of juvenile chinook
salmon and steelhead from the Snake River, 1966 to 1975. Transactions of the American Fisheries Society 108:505-529.
Rhine, T. D., R. S. Osborne, and K. A. Stevens. 1999. Steelhead Fish Hatchery Evaluations-
Idaho. Idaho Department of Fish and Game. Boise, Idaho. Schilling, K., R. Elmore, and B. R. Snider. 1999. 1999 Steelhead Run Report. Idaho Department
of Fish and Game. Boise, Idaho.

22
APPENDICES

23
Appendix A. Table 1. Release data for all steelhead released from Clearwater Fish Hatchery during 1999. Releases are arranged by coded-wire tag group and raceway. The coded-wire tag group includes one or more unique tag codes, along with all untagged fish represented by those tags. If PIT tags were put into fish in a raceway that had more than one coded-wire tag code, the PIT tags were assumed to have been put into the various tag codes proportionally.
Release Brood Stock Raceway Raceway Mark CWT Release Size Marking Site/Date Year Name Number Total Type Code Number (FPP) Purpose Clear Ck 1998 DWOR B R09W 58,970 CWT,AD,LV 105234 20,025 5.07 Bio-Diet Feed Clwtr R CWT,AD,LV,PIT 105234 297 (Feed Exp.) 4/22/99-4/23/99 AD 38,020 AD,LV 628 Total CWT Release: 20,322 Total non-CWT Release: 38,648 Total Group Release: 58,970 Clear Ck 1998 DWOR B R10W 59,377 CWT,AD,LV 105233 20,370 5.07 Moore/Clark Diet Clwtr R CWT,AD,LV,PIT 105233 298 (Feed Exp.) 4/22/99-4/23/99 AD 38,070 AD,LV 639 Clear Ck 1998 DWOR B R11E 72,192 AD 72,192 5.07 Moore/Clark Diet Clwtr R (Feed Exp.) 4/22/99-4/23/99 Total CWT Release: 20,668 Total non-CWT Release: 110,901 Total Group Release: 131,569 Red River@ 1998 DWOR B R11W 4,993 PIT 4,993 5.9 Supplementation Soda Ck Brdg (PIT tag Only 4/20/1999 Total CWT Release: 0 Total non-CWT Release: 4,993 Total Group Release: 4,993 S Fk Clwtr@ 1998 DWOR B R07E 69,061 AD 69,061 5.3 Contribution Red House Hole 4/27/99-4/29/99 S Fk Clwtr@ 1998 DWOR B R07W 69,061 AD 69,061 5.3 Contribution Red House Hole 4/27/99-4/29/99 S Fk Clwtr@ 1998 DWOR B R08E 71,035 AD 71,035 5.3 Contribution Red House Hole 4/27/99-4/29/99 S Fk Clwtr@ 1998 DWOR B R08W 73,480 CWT,AD,LV 105237 20,763 5.3 Contribution Red House Hole CWT,AD,LV 105236 20,904 4/27/99-4/29/99 CWT,AD,LV,PIT 105236 296 CWT,AD,LV 105235 20,645 AD 8,936 AD,LV 1,936 S Fk Clwtr@ 1998 DWOR B R09E 59,511 AD 59,511 5.3 Contribution Red House Hole 4/27/99-4/29/99 S Fk Clwtr@ 1998 DWOR B R10E 58,318 AD 58,318 5.3 Contribution Red House Hole 4/27/99-4/29/99 Total CWT Release: 62,608 Total non-CWT Release: 337,858 Total Group Release: 400,466

24
Appendix A. Table 1. Continued. Release Brood Stock Raceway Raceway Mark CWT Release Size Marking Site/Date Year Name Number Total Type Code Number (FPP) Purpose Total DWOR B-Stock CWT Release 103,598 Total DWOR B-Stock non-CWT Release 492,400 Total DWOR B-Stock Release 595,998 Total CWT Release for Clearwater 103,598 Total non-CWT Release for Clearwater 492,400 Total PIT Tag Release for Clearwater Hatchery 5,884 Total Clearwater Hatchery Release 595,998

25
Appendix A. Table 2. Release data for all steelhead released from Hagerman National Fish Hatchery during 1999. Releases are arranged by coded-wire tag group and raceway. The coded-wire tag group includes one or more unique tag codes, along with all untagged fish represented by those tags. If PIT tags were put into fish in a raceway that had more than one coded-wire tag code, the PIT tags were assumed to have been put into the various tag codes proportionally.
Release Brood Stock Raceway Raceway Mark CWT Release Size Marking Site/Date Year Name Number Total Type Code Number (FPP) Purpose Sawtooth Hatchery 1998 Sawtooth A R50 20,069 CWT,AD 105259 18,871 4.88 Acclimated 4/23/1999 CWT,AD,PIT 105259 300 Feed/Fast AD 898 Sawtooth Hatchery 1998 Sawtooth A R52 19,822 CWT,AD 105260 19,126 4.94 Acclimated 4/23/1999 CWT,AD,PIT 105260 300 Feed/Fast AD 396 Sawtooth Hatchery 1998 Sawtooth A R54 20,397 CWT,AD 105263 19,378 4.99 Acclimated 4/23/1999 CWT,AD,PIT 105263 300 Feed/Fast AD 719 Total CWT Release: 58,275 Total non-CWT Release: 2,013 Total Group Release: 60,288 Sawtooth Hatchery 1998 Sawtooth A R40 15,999 AD 15,999 4.6 Acclimated 4/23/1999 % Body Wt. Diet Sawtooth Hatchery 1998 Sawtooth A R41 16,905 AD 16,905 4.9 Acclimated 4/23/1999 % Body Wt. Diet Sawtooth Hatchery 1998 Sawtooth A R42 15,248 AD 15,248 4.81 Acclimated 4/23/1999 % Body Wt. Diet Sawtooth Hatchery 1998 Sawtooth A R46 21,438 AD 21,438 5.08 Acclimated 4/23/1999 % Body Wt. Diet Sawtooth Hatchery 1998 Sawtooth A R47 19,009 AD 19,009 5.14 Acclimated 4/23/1999 % Body Wt. Diet Sawtooth Hatchery 1998 Sawtooth A R48 20,803 AD 20,803 5.26 Acclimated 4/23/1999 % Body Wt. Diet Sawtooth Hatchery 1998 Sawtooth A R49 19,431 CWT,AD 105257 18,674 4.77 Acclimated 4/23/1999 CWT,AD,PIT 105257 299 % Body Wt. Diet AD 458 Sawtooth Hatchery 1998 Sawtooth A R51 19,310 CWT,AD 105258 18,486 5.13 Acclimated 4/23/1999 CWT,AD,PIT 105258 300 % Body Wt. Diet AD 524 Sawtooth Hatchery 1998 Sawtooth A R53 18,393 CWT,AD 105261 17,507 4.9 Acclimated 4/23/1999 CWT,AD,PIT 105261 300 % Body Wt. Diet AD 586 Sawtooth Hatchery 1998 Sawtooth A R55 20,475 AD 20,475 5.36 Acclimated 4/23/1999 % Body Wt. Diet Sawtooth Hatchery 1998 Sawtooth A R56 17,496 AD 17,496 4.93 Acclimated 4/23/1999 % Body Wt. Diet Sawtooth Hatchery 1998 Sawtooth A R57 20,036 AD 20,036 5.55 Acclimated 4/23/1999 % Body Wt. Diet Sawtooth Hatchery 1998 Sawtooth A R58 17,867 AD 17,867 5.3 Acclimated 4/23/1999 % Body Wt. Diet

26
Appendix A. Table 2. Continued. Release Brood Stock Raceway Raceway Mark CWT Release Size Marking Site/Date Year Name Number Total Type Code Number (FPP) Purpose Sawtooth Hatchery 1998 Sawtooth A R62 18,027 AD 18,027 5.31 Acclimated 4/23/1999 % Body Wt. Diet Sawtooth Hatchery 1998 Sawtooth A R63 17,960 AD 17,960 5.27 Acclimated 4/23/1999 % Body Wt. Diet Sawtooth Hatchery 1998 Sawtooth A R64 19,215 AD 19,215 5.39 Acclimated 4/23/1999 % Body Wt. Diet Sawtooth Hatchery 1998 Sawtooth A R65 19,394 AD 19,394 5.27 Acclimated 4/23/1999 % Body Wt. Diet Sawtooth Hatchery 1998 Sawtooth A R66 18,398 AD 18,398 4.88 Acclimated 4/23/1999 % Body Wt. Diet Sawtooth Hatchery 1998 Sawtooth A R67 18,641 AD 18,641 5.1 Acclimated 4/23/1999 % Body Wt. Diet Sawtooth Hatchery 1998 Sawtooth A R68 18,427 AD 18,427 5.22 Acclimated 4/23/1999 % Body Wt. Diet Sawtooth Hatchery 1998 Sawtooth A R69 17,893 AD 17,893 4.97 Acclimated 4/23/1999 % Body Wt. Diet Sawtooth Hatchery 1998 Sawtooth A R70 19,437 AD 19,437 5.19 Acclimated 4/23/1999 % Body Wt. Diet Sawtooth Hatchery 1998 Sawtooth A R71 18,264 AD 18,264 4.8 Acclimated 4/23/1999 % Body Wt. Diet Total CWT Release: 55,566 Total non-CWT Release: 372,500 Total Group Release: 428,066 Sawtooth Hatchery 1998 Sawtooth A R72 16,960 AD 16,960 4.8 Direct Release 4/21�4/26/1999 Sawtooth Hatchery 1998 Sawtooth A R73 16,461 AD 16,461 4.82 Direct Release 4/21�4/26/1999 Sawtooth Hatchery 1998 Sawtooth A R74 18,043 AD 18,043 4.89 Direct Release 4/21�4/26/1999 Sawtooth Hatchery 1998 Sawtooth A R75 17,687 AD 17,687 4.97 Direct Release 4/21�4/26/1999 Sawtooth Hatchery 1998 Sawtooth A R76 16,091 AD 16,091 5.06 Direct Release 4/21�4/26/1999 Sawtooth Hatchery 1998 Sawtooth A R80 18,071 AD 18,071 4.96 Direct Release 4/21�4/26/1999 Sawtooth Hatchery 1998 Sawtooth A R77 1,208 AD 1,208 5.08 Direct Release 4/21�4/26/1999 Total CWT Release: 0 Total non-CWT Release: 104,521 Total Group Release: 104,521 Lt Salmon R @ 1998 Hells Canyon A R59 22,017 AD 22,017 5.32 Contribution Stinky Springs 4/14�5/10/1999 Lt Salmon R @ 1998 Hells Canyon A R60 21,921 AD 21,921 5.17 Contribution Stinky Springs 4/14�5/10/1999

27
Appendix A. Table 2. Continued. Release Brood Stock Raceway Raceway Mark CWT Release Size Marking Site/Date Year Name Number Total Type Code Number (FPP) Purpose Lt Salmon R @ 1998 Hells Canyon A R61 22,847 AD 22,847 5.18 Contribution Stinky Springs 4/14�5/10/1999 Lt Salmon R @ 1998 Hells Canyon A R81 16,432 AD 16,432 4.33 Contribution Stinky Springs 4/14�5/10/1999 Lt Salmon R @ 1998 Hells Canyon A R82 16,519 AD 16,519 4.37 Contribution Stinky Springs 4/14�5/10/1999 Lt Salmon R @ 1998 Hells Canyon A R95 19,029 AD 19,029 4.63 Contribution Stinky Springs 4/14�5/10/1999 Lt Salmon R @ 1998 Hells Canyon A R83 17,539 AD 17,539 4.35 Contribution Stinky Springs 4/14�5/10/1999 Lt Salmon R @ 1998 Hells Canyon A R84 15,931 AD 15,931 4.14 Contribution Stinky Springs 4/14�5/10/1999
Lt Salmon R @ 1998 Hells Canyon A R96 16,629 AD 16,629 3.86 Contribution Stinky Springs 4/14�5/10/1999 Lt Salmon R @ 1998 Hells Canyon A R97 14,966 AD 14,966 3.98 Contribution Stinky Springs 4/14�5/10/1999 Lt Salmon R @ 1998 Hells Canyon A R85 15,910 AD 15,910 3.82 Contribution Stinky Springs 4/14�5/10/1999 Lt Salmon R @ 1998 Hells Canyon A R86 16,942 AD 16,942 4.3 Contribution Stinky Springs 4/14�5/10/1999 Lt Salmon R @ 1998 Hells Canyon A R98 15,817 AD 15,817 4.04 Contribution Stinky Springs 4/14�5/10/1999 Lt Salmon R @ 1998 Hells Canyon A R87 16,581 AD 16,581 4.04 Contribution Stinky Springs 4/14�5/10/1999 Lt Salmon R @ 1998 Hells Canyon A R88 15,445 AD 15,445 3.95 Contribution Stinky Springs 4/14�5/10/1999 Lt Salmon R @ 1998 Hells Canyon A R99 14,999 AD 14,999 3.86 Contribution Stinky Springs 4/14�5/10/1999
Lt Salmon R @ 1998 Hells Canyon A R100 15,906 AD 15,906 4.11 Contribution Stinky Springs 4/14�5/10/1999 Lt Salmon R @ 1998 Hells Canyon A R89 16,575 AD 16,575 3.97 Contribution Stinky Springs 4/14�5/10/1999 Lt Salmon R @ 1998 Hells Canyon A R90 16,078 AD 16,078 4.16 Contribution Stinky Springs 4/14�5/10/1999

28
Appendix A. Table 2. Continued. Release Brood Stock Raceway Raceway Mark CWT Release Size Marking Site/Date Year Name Number Total Type Code Number (FPP) Purpose Lt Salmon R @ 1998 Hells Canyon A R101 16,010 AD 16,010 4.1 Contribution Stinky Springs 4/14�5/10/1999 Lt Salmon R @ 1998 Hells Canyon A R91 18,514 AD 18,514 4.06 Contribution Stinky Springs 4/14�5/10/1999 Lt Salmon R @ 1998 Hells Canyon A R92 13,175 CWT,AD 104638 6,715 4.21 Contribution Stinky Springs CWT,AD 104637 6,300 4/14�5/10/1999 AD 160 Lt Salmon R @ 1998 Hells Canyon A R93 15,171 CWT,AD 104638 3,601 4.42 Contribution Stinky Springs CWT,AD 104637 3,703 4/14�5/10/1999 CWT,AD 104636 4,202 CWT,AD 104635 3,343 AD 322 Lt Salmon R @ 1998 Hells Canyon A R94 13,170 CWT,AD 104636 5,935 4.59 Contribution Stinky Springs CWT,AD 104635 6,983 4/14�5/10/1999 AD 252 Lt Salmon R @ 1998 Hells Canyon A R102 14,913 AD 14,913 3.75 Contribution Stinky Springs 4/14�5/10/1999 Total CWT Release: 40,782 Total non-CWT Release: 378,254 Total Group Release: 419,036 Sawtooth Hatchery 1998 Sawtooth A R43 20,614 CWT,AD 105301 19,833 5.31 Early Egg Progeny4/23/1999 CWT,AD,PIT 105301 300 AD 481 Sawtooth Hatchery 1998 Sawtooth A R45 19,018 CWT,AD 105110 9,309 4.94 Early Egg Progeny4/22�4/23/1999 CWT,AD 105109 9,495 AD 214 Sawtooth Hatchery 1998 Sawtooth A R44 18,520 AD,CWT 105302 18,088 5.22 Early Egg Progeny4/22/1999 AD 432 Total CWT Release: 57,025 Total non-CWT Release: 1,127 Total Group Release: 58,152 Sawtooth Hatchery 1998 Sawtooth A R77 21,637 CWT,AD 105107 9,008 5.08 Late Egg Progeny 4/22�4/26/1999 CWT,AD 104634 9,701 CWT,AD,PIT Both (300 total PIT) AD 2,928 Sawtooth Hatchery 1998 Sawtooth A R78 21,489 CWT,AD 104646 9,875 5.28 Late Egg Progeny 4/22�4/26/1999 CWT,AD 104645 9,509 AD 2,105 Sawtooth Hatchery 1998 Sawtooth A R79 20,636 CWT,AD 104644 9,343 4.89 Late Egg Progeny 4/22�4/26/1999 CWT,AD 104643 9,257 AD 2,036 Total CWT Release: 56,693 Total non-CWT Release: 7,069 Total Group Release: 63,762 Total Sawtooth A-Stock Cwt Release 227,559 Total SAWTOOTH A-Stock Non-CWT Release 487,230 Total Sawtooth A-Stock Release 714,789

29
Appendix A. Table 2. Continued. Release Brood Stock Raceway Raceway Mark CWT Release Size Marking Site/Date Year Name Number Total Type Code Number (FPP) Purpose Total Hells Canyon A-Stock Cwt Release 40,782 Total HELLS CANYON A-Stock Non-CWT Release 378,254 Total Hells Canyon A-Stock Release 419,036 Total CWT Release For Hagerman NFH 268,341 Total Non-CWT Release For Hagerman NFH 865,484 Total PIT Tag Release For Hagerman NFH Hatchery 2,399 Total Hagerman NFH Hatchery Release 1,133,825

30
Appendix A. Table 3. Release data for all steelhead released from Magic Valley Fish Hatchery during 1999. Releases are arranged by coded-wire tag group and raceway. The coded-wire tag group includes one or more unique tag codes, along with all untagged fish represented by those tags. If PIT tags were put into fish in a raceway that had more than one coded-wire tag code, the PIT tags were assumed to have been put into the various tag codes proportionally.
Release Brood Stock Raceway Raceway Mark CWT Release Size Marking Site/Date Year Name Number Total Type Code Number (FPP) Purpose Salmon R @ 1998 PAH A R15W 17,569 CWT,AD 105406 17,407 3.8 Contribution Red Rock AD 162 4/19/1999 Salmon R @ 1998 PAH A R10W 38,805 AD 38,805 3.6 Contribution Red Rock 4/16/99-4/26/99 Salmon R @ 1998 PAH A R12W 41,760 AD 41,760 3.6 Contribution Red Rock 4/16/99-4/26/99 Salmon R @ 1998 PAH A R13W 12,250 AD 12,250 3.6 Contribution Red Rock 4/16/99-4/26/99 Salmon R @ 1998 PAH A R16W 61,380 CWT,AD 105406 42,936 3.6 Contribution Red Rock AD 18,444 4/16/1999 Total CWT Release: 60,343 Total non-CWT Release: 111,421 Total Group Release: 171,764 Salmon R @ 1998 PAH A R04W 20,600 AD 20,600 3.6 Contribution Shoup Brdg 4/19/99-4/20/99 Salmon R @ 1998 PAH A R13W 50,400 AD 50,400 3.6 Contribution Shoup Brdg 4/19/99-4/20/99 Salmon R @ 1998 PAH A R14W 61,420 CWT,AD 105405 60,174 3.6 Contribution Shoup Brdg CWT,AD,PIT 105405 279 4/19/99-4/20/99 AD 967 Total CWT Release: 60,453 Total non-CWT Release: 71,967 Total Group Release: 132,420 Salmon R @ 1998 PAH A R10W 15,210 AD 15,210 3.96 Contribution Tunnel Rock 4/21/99-5/3/99 Salmon R @ 1998 PAH A R11W 62,832 CWT,AD 105404 60,661 3.96 Contribution Tunnel Rock AD 2,171 4/21/1999 Salmon R @ 1998 PAH A R12W 20,160 AD 20,160 3.96 Contribution Tunnel Rock 4/21/99-5/3/99 Salmon R @ 1998 PAH A R02W 29,480 AD 29,480 4.3 Contribution Tunnel Rock 4/21/99-5/3/99 Salmon R @ 1998 PAH A R03W 1,531 AD 1,531 4.3 Contribution Tunnel Rock 4/21/99-5/3/99

31
Appendix A. Table 3. Continued. Release Brood Stock Raceway Raceway Mark CWT Release Size Marking Site/Date Year Name Number Total Type Code Number (FPP) Purpose Total CWT Release: 60,661 Total non-CWT Release: 68,552 Total Group Release: 129,213 E Fk Salmon R @ 1998 DWOR B R03E 60,865 AD 60,865 4.2 Contribution Dumpster 4/29/99-5/5/99 E Fk Salmon R @ 1998 DWOR B R07E 1,440 AD 1,440 4.2 Contribution Dumpster 4/29/99-5/5/99 E Fk Salmon R @ 1998 DWOR B R08E 1,440 AD 1,440 4.2 Contribution Dumpster 4/29/99-5/5/99 E Fk Salmon R @ 1998 DWOR B R09E 41,800 AD 41,800 4.2 Contribution Dumpster 4/29/99-5/5/99 E Fk Salmon R @ 1998 DWOR B R10E 40,740 AD 40,740 4.2 Contribution Dumpster 4/29/99-5/5/99 E Fk Salmon R @ 1998 DWOR B R11E 60,270 AD 60,270 4.2 Contribution Dumpster 4/29/99-5/5/99 E Fk Salmon R @ 1998 DWOR B R13E 62,370 CWT,AD,LV 105403 58,829 4.2 Contribution Dumpster CWT,AD,LV,PIT 105403 300 4/29/99-5/5/99 AD 1,412 AD,LV 1,829 Total CWT Release: 59,129 Total non-CWT Release: 209,796 Total Group Release: 268,925 Salmon R @ 1998 DWOR B R03W 55,844 CWT,AD,LV 105401 53,405 4.3 Contribution Tunnel Rock CWT,AD,LV,PIT 105401 275 4/28/99-5/3/99 AD,LV 2,164 Salmon R @ 1998 DWOR B R14E 21,060 AD 21,060 4.3 Contribution Tunnel Rock 4/28/99-5/3/99 Salmon R @ 1998 DWOR B R15E 1,230 AD 1,230 4.3 Contribution Tunnel Rock 4/28/99-5/3/99 Total CWT Release: 53,680 Total non-CWT Release: 24,454 Total Group Release: 78,134 Squaw Ck 1998 DWOR B R02E 7,600 AD 7,600 4.1 Contribution 4/30/99-5/11/99 Squaw Ck 1998 DWOR B R04E 57,600 AD 57,600 4.1 Contribution 4/30/99-5/11/99 Squaw Ck 1998 DWOR B R09E 19,000 AD 19,000 4.1 Contribution 4/30/99-5/11/99 Squaw Ck 1998 DWOR B R10E 21,000 AD 21,000 4.1 Contribution 4/30/99-5/11/99 Squaw Ck 1998 DWOR B R12E 477 AD 477 4.1 Contribution 4/30/99-5/11/99

32
Appendix A. Table 3. Continued. Release Brood Stock Raceway Raceway Mark CWT Release Size Marking Site/Date Year Name Number Total Type Code Number (FPP) Purpose Squaw Ck 1998 DWOR B R12E 60,324 CWT,AD,LV 105402 58,230 4.1 Contribution 4/30/99-5/11/99 CWT,AD,LV,PIT 105402 284 AD,LV 1,810 Squaw Ck 1998 DWOR B R14E 38,805 AD 38,805 4.1 Contribution 4/30/99-5/11/99 Total CWT Release: 58,514 Total non-CWT Release: 146,292 Total Group Release: 204,806 Squaw Creek Pond 1998 DWOR B/ R01E 59,009 CWT,AD,LV 105255 14,407 4.1 Contribution Below Outlet E Fk B CWT,AD,LV 105254 17,397 5/5/99-5/12/99 CWT,AD,LV,PIT 105254 286 CWT,AD,LV 105253 16,755 AD,LV 10,164 Squaw Creek Pond 1998 DWOR B R02E 48,000 AD 48,000 4.1 Contribution Below Outlet 5/5/99-5/12/99 Total CWT Release: 48,845 Total non-CWT Release: 58,164 Total Group Release: 107,009 Lt Salmon R @ 1998 PAH A R02W 28,820 AD 28,820 4.71 Contribution Stinky Springs 4/12/99-4/16/99 Total CWT Release: 0 Total non-CWT Release: 28,820 Total Group Release: 28,820 Sawtooth 1998 PAH A R09W 26,400 AD 26,400 3.96 Contribution Hatchery 4/23/1999 Sawtooth 1998 PAH A R10W 13,260 AD 13,260 3.96 Contribution Hatchery 4/23/1999 Total CWT Release: 0 Total non-CWT Release: 39,660 Total Group Release: 39,660 Salmon R @ 1998 PAH A R04W 12,600 AD 12,600 4 Contribution McNabb Point 4/23/99-4/28/99 Salmon R @ 1998 PAH A R05W 48,400 AD 48,400 4 Contribution McNabb Point 4/23/99-4/28/99 Salmon R @ 1998 PAH A R08W 25,010 AD 25,010 4 Contribution McNabb Point 4/23/99-4/28/99 Salmon R @ 1998 PAH A R09W 35,200 AD 35,200 4 Contribution McNabb Point 4/23/99-4/28/99 Total CWT Release: 0 Total non-CWT Release: 121,210 Total Group Release: 121,210 Squaw Ck Ponds 1998 DWOR B R15E 31,890 AD 31,890 4 Volitional Release 4/7/99-4/12/99 Study

33
Appendix A. Table 3. Continued. Release Brood Stock Raceway Raceway Mark CWT Release Size Marking Site/Date Year Name Number Total Type Code Number (FPP) Purpose Squaw Ck Ponds 1998 DWOR B R16E 46,354 AD 46,354 4 Volitional Release 4/7/99-4/12/99 Study Total CWT Release: 0 Total non-CWT Release: 78,244 Total Group Release: 78,244 Lt Salmon R @ 1998 DWOR B R01W 61,160 AD 61,160 4.71 Contribution Stinky Springs 4/12/99-4/16/99 Lt Salmon R @ 1998 DWOR B R05E 61,495 CWT,AD,LV 105256 16,416 4.71 Contribution Stinky Springs AD 41,809 4/12/99-4/16/99 AD,LV 2,985 AD,PIT 285 Lt Salmon R @ 1998 DWOR B R06E 62,220 AD 62,220 4.71 Contribution Stinky Springs 4/12/99-4/16/99 Lt Salmon R @ 1998 DWOR B R07E 60,960 AD 60,960 4.71 Contribution Stinky Springs 4/12/99-4/16/99 Lt Salmon R @ 1998 DWOR B R08E 59,040 AD 59,040 4.71 Contribution Stinky Springs 4/12/99-4/16/99 Lt Salmon R @ 1998 DWOR B R15E 19,680 AD 19,680 4.71 Contribution Stinky Springs 4/12/99-4/16/99 Total CWT Release: 16,416 Total non-CWT Release: 308,139 Total Group Release: 324,555 Lt Salmon R @ 1998 PAH A R04W 12,800 AD 12,800 4 Contribution Stinky Springs 5/6/1999 Total CWT Release: 0 Total non-CWT Release: 12,800 Total Group Release: 12,800 Lemhi R: 1998 PAH A R04W 20,000 AD 20,000 3.8 Contribution Salmon R 4/19/99-4/26/99 Lemhi R: 1998 PAH A R07W 55,670 AD 55,670 3.8 Contribution Salmon R 4/19/99-4/26/99 Lemhi R: 1998 PAH A R08W 38,745 AD 38,745 3.8 Contribution Salmon R 4/19/99-4/26/99 Lemhi R: 1998 PAH A R15W 43,450 AD 43,173 3.8 Contribution Salmon R AD,PIT 277 4/19/1999 Total CWT Release: 0 Total non-CWT Release: 157,865 Total Group Release: 157,865 Salmon R @ 1998 PAH A R05W 16,600 AD 16,600 4.2 Contribution Cottonwood Cg 4/29/99-5/5/99
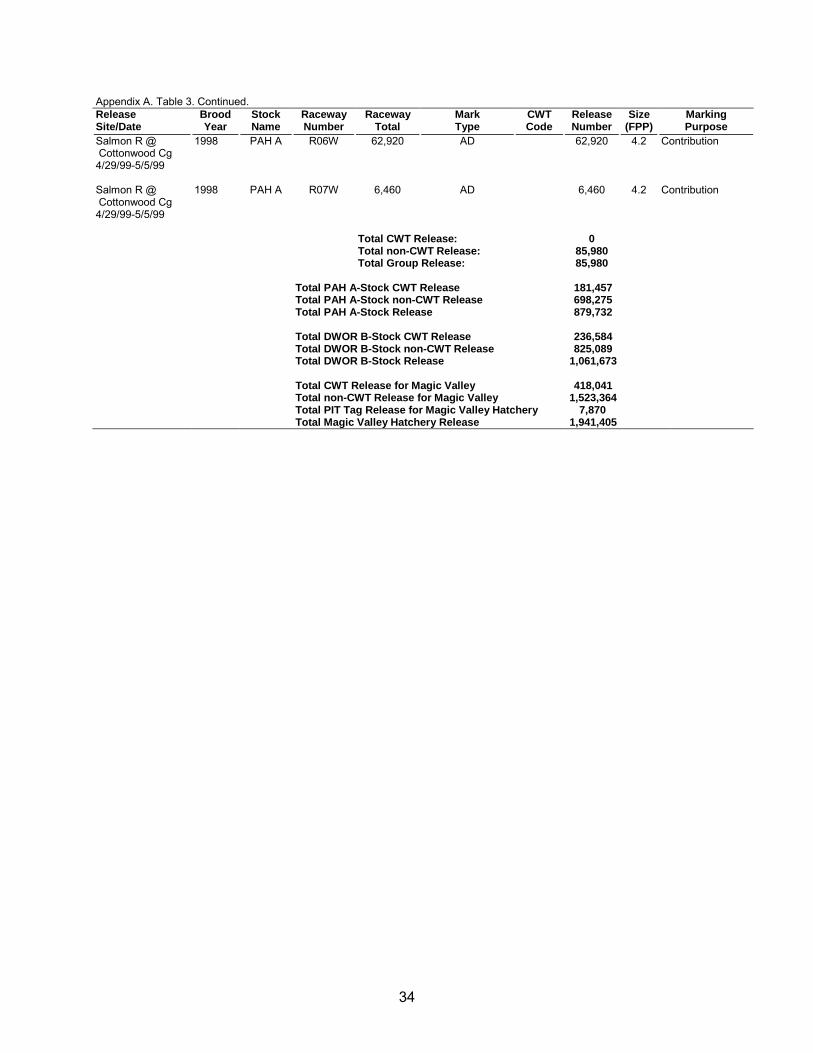
34
Appendix A. Table 3. Continued. Release Brood Stock Raceway Raceway Mark CWT Release Size Marking Site/Date Year Name Number Total Type Code Number (FPP) Purpose Salmon R @ 1998 PAH A R06W 62,920 AD 62,920 4.2 Contribution Cottonwood Cg 4/29/99-5/5/99 Salmon R @ 1998 PAH A R07W 6,460 AD 6,460 4.2 Contribution Cottonwood Cg 4/29/99-5/5/99 Total CWT Release: 0 Total non-CWT Release: 85,980 Total Group Release: 85,980 Total PAH A-Stock CWT Release 181,457 Total PAH A-Stock non-CWT Release 698,275 Total PAH A-Stock Release 879,732 Total DWOR B-Stock CWT Release 236,584 Total DWOR B-Stock non-CWT Release 825,089 Total DWOR B-Stock Release 1,061,673 Total CWT Release for Magic Valley 418,041 Total non-CWT Release for Magic Valley 1,523,364 Total PIT Tag Release for Magic Valley Hatchery 7,870 Total Magic Valley Hatchery Release 1,941,405

35
Appendix B. Table 1. Release and recovery data for brood year 1996 steelhead released from Clearwater Fish Hatchery. Only 1-ocean recoveries are available at this time. Data is shown by groups with both hatchery and harvest recoveries for each tag code, along with any untagged fish, shown separately. Harvest estimates are based on angler phone surveys and creel census data. Hatchery estimates include rack returns along with estimates of in-stream escapement values. The total returns represent a minimum estimate of returns that do not include out-of-basin strays or prespawning mortalities. Recovery data is from Hansen and White (In Press, a).
Release Brood Stock CWT Tagged Other Marking Ocean Harvest Hatchery Total SARSite/Date Year Name Code Release Marks Purpose Age Returns Returns Returns (%)Clear Ck 1996 DWOR B 105145 31,672 AD,LV Coded wire tag 1 0 3 3 0.01Clwtr R length 2 ND ND ND 4/28/1997 experiment. 3 ND ND ND Clear Ck 1996 DWOR B 104663 32,575 AD,LV Coded wire tag 1 0 4 4 0.01Clwtr R length 2 ND ND ND 4/28/1997 experiment. 3 ND ND ND Clear Ck 1996 DWOR B Untagged 114,966 AD Coded wire tag 1 0 13 13 0.01Clwtr R length 2 ND ND ND 4/28/1997 experiment. 3 ND ND ND Totals: 179,213 0 20 20 0.01 Crooked R: 1995 SELWAY Untagged 75,894 RV Selway Program, 1 0 0 0 0 S Fk Clwtr RV only. 2 ND ND ND 4/23/1997 3 ND ND ND Totals: 75,894 0 0 0 0 S Fk Clwtr@ 1996 DWOR B 104610 21,451 AD,LV Contribution 1 0 2 2 0.01Red House Hole 2 ND ND ND 4/28�4/30/1997 3 ND ND ND S Fk Clwtr@ 1996 DWOR B 102129 21,291 AD,LV Contribution 1 0 2 2 0.01Red House Hole 2 ND ND ND 4/28�4/30/1997 3 ND ND ND S Fk Clwtr@ 1996 DWOR B 102130 21,163 AD,LV Contribution 1 0 2 2 0.01Red House Hole 2 ND ND ND 4/28�4/30/1997 3 ND ND ND S Fk Clwtr@ 1996 DWOR B Untagged 357,268 AD Contribution 1 0 36 36 0.01Red House Hole 2 ND ND ND 4/28�4/30/1997 3 ND ND ND Totals: 421,173 0 42 42 0.01 S Fk Red River 1996 DWOR B 105120 42,426 NONE Supplementation 1 0 0 0 0 9/5/1996 2 ND ND ND 3 ND ND ND S Fk Red River 1996 DWOR B Untagged 6,304 NONE Supplementation 1 0 0 0 0 9/5/1996 (4,992 PIT tags) 2 ND ND ND 3 ND ND ND Totals: 48,730 0 0 0 0 Red River@ 1996 DWOR B Untagged 4,991 All PIT Supplementation 1 0 0 0 0 Soda Ck Brdg 2 ND ND ND 4/28/1997 3 ND ND ND Totals: 4,991 0 0 0 0
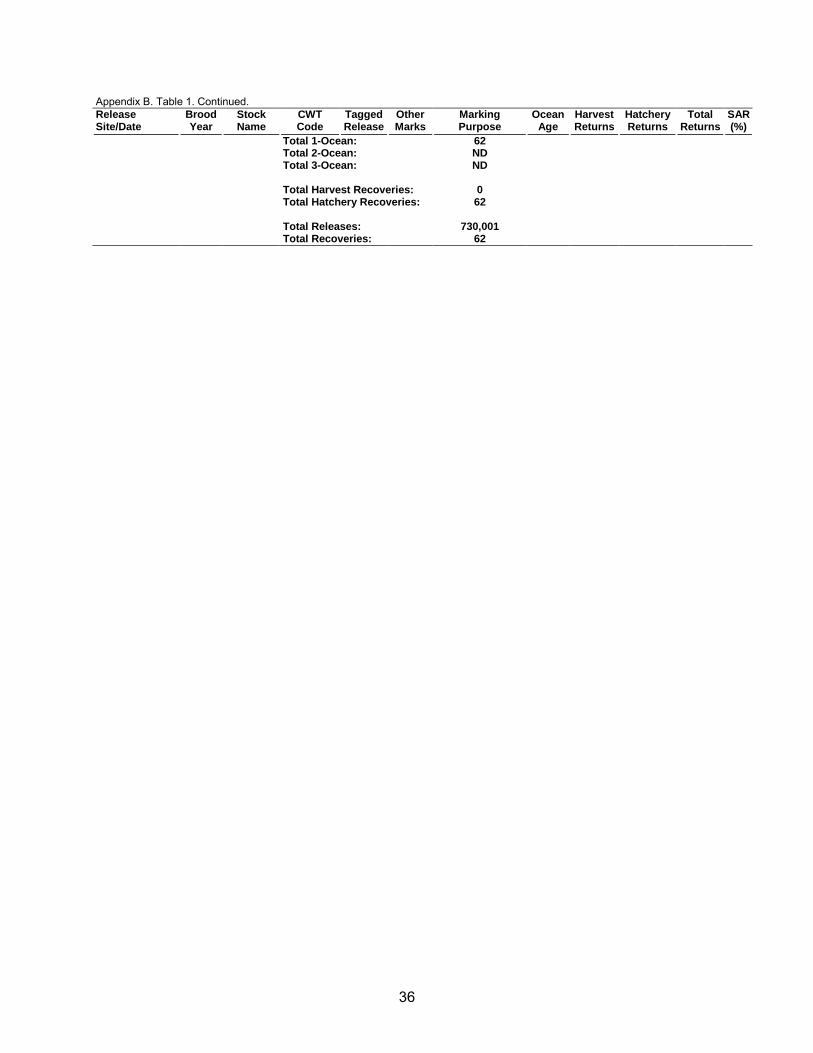
36
Appendix B. Table 1. Continued. Release Brood Stock CWT Tagged Other Marking Ocean Harvest Hatchery Total SARSite/Date Year Name Code Release Marks Purpose Age Returns Returns Returns (%) Total 1-Ocean: 62 Total 2-Ocean: ND Total 3-Ocean: ND Total Harvest Recoveries: 0 Total Hatchery Recoveries: 62 Total Releases: 730,001 Total Recoveries: 62

37
Appendix B. Table 2. Release and recovery data for brood year 1996 steelhead released from Hagerman National Fish Hatchery. Only 1-ocean recoveries are available at this time. Data is shown by groups with both hatchery and harvest recoveries for each tag code, along with any untagged fish, shown separately. Harvest estimates are based on angler phone surveys and creel census data. Hatchery estimates include rack returns, along with estimates of in-stream escapement values. The total returns represent a minimum estimate of returns that do not include out-of-basin strays or prespawning mortalities. Recovery data is from Hansen and White (In Press, a).
Release Brood Stock CWT Tagged Other Marking Ocean Harvest Hatchery Total SARSite/Date Year Name Code Release Marks Purpose Age Returns Returns Returns (%)Salmon R @ 1996 Sawtooth A 105146 57,115 AD Acclimated 1 108 49 157 0.27 Torrey's Hole Torrey's Hole 2 ND ND ND 4/25/1997 Contribution 3 ND ND ND Salmon R @ 1996 Sawtooth A Untagged 8,305 AD Acclimated 1 13 6 19 0.23 Torrey's Hole Torrey's Hole 2 ND ND ND 4/25/1997 Contribution 3 ND ND ND Totals: 65,420 121 55 176 0.27 Lt Salmon R @ 1996 PAH A 105105 10,977 AD Contribution 1 15 15 30 0.27 Stinky Springs 2 ND ND ND 4/14�5/2/1997 3 ND ND ND Lt Salmon R @ 1996 PAH A 105205 20,939 AD Contribution 1 0 0 0 0 Stinky Springs 2 ND ND ND 4/14�5/2/1997 3 ND ND ND Lt Salmon R @ 1996 PAH A Untagged 279,225 AD Contribution 1 131 131 262 0.09 Stinky Springs 2 ND ND ND 4/14�5/2/1997 3 ND ND ND Totals: 311,141 146 146 292 0.09 Lt Salmon R @ 1996 Sawtooth A Untagged 31,140 AD Contribution 1 15 15 30 0.1 Stinky Springs 2 ND ND ND 4/16/1997 3 ND ND ND Totals: 31,140 15 15 30 0.1 Sawtooth Hatchery 1996 Sawtooth A 105159 19,619 AD Contribution 1 27 11 38 0.194/25/1997 2 ND ND ND 3 ND ND ND Sawtooth Hatchery 1996 Sawtooth A 105157 20,507 AD Contribution 1 18 11 29 0.144/25/1997 2 ND ND ND 3 ND ND ND Sawtooth Hatchery 1996 Sawtooth A 105158 19,794 AD Contribution 1 13 14 27 0.144/25/1997 2 ND ND ND 3 ND ND ND Sawtooth Hatchery 1996 Sawtooth A Untagged 418,204 AD Contribution 1 596 570 1,166 0.284/25/1997 2 ND ND ND 3 ND ND ND Totals: 478,124 654 606 1,260 0.26 Sawtooth Hatchery 1996 Sawtooth A 105156 20,464 AD Direct Release 1 51 12 63 0.314/25/1997 2 ND ND ND 3 ND ND ND

38
Appendix B. Table 2. Continued. Release Brood Stock CWT Tagged Other Marking Ocean Harvest Hatchery Total SARSite/Date Year Name Code Release Marks Purpose Age Returns Returns Returns (%)Sawtooth Hatchery 1996 Sawtooth A 105154 19,301 AD Direct Release 1 39 33 72 0.374/25/1997 2 ND ND ND 3 ND ND ND Sawtooth Hatchery 1996 Sawtooth A 105155 19,480 AD Direct Release 1 35 17 52 0.274/25/1997 2 ND ND ND 3 ND ND ND Sawtooth Hatchery 1996 Sawtooth A Untagged 2,903 AD Direct Release 1 4 4 8 0.284/25/1997 2 ND ND ND 3 ND ND ND Totals: 62,148 129 66 195 0.31 Sawtooth Hatchery 1996 Sawtooth A 105153 20,038 AD Acclimated 1 36 17 53 0.264/25/1997 Group 2 ND ND ND 3 ND ND ND Sawtooth Hatchery 1996 Sawtooth A 105151 20,498 AD Acclimated 1 35 19 54 0.264/25/1997 Group 2 ND ND ND 3 ND ND ND Sawtooth Hatchery 1996 Sawtooth A 105152 20,268 AD Acclimated 1 20 11 31 0.154/25/1997 Group 2 ND ND ND 3 ND ND ND Sawtooth Hatchery 1996 Sawtooth A Untagged 727 AD Acclimated 1 1 1 2 0.284/25/1997 Group 2 ND ND ND 3 ND ND ND Totals: 61,531 92 48 140 0.23 Sawtooth Hatchery 1996 Sawtooth A 105148 27,801 AD Double Length 1 32 24 56 0.2 4/25/1997 Wire 2 ND ND ND 3 ND ND ND Sawtooth Hatchery 1996 Sawtooth A 105147 31,771 AD Double Length 1 40 31 71 0.224/25/1997 Wire 2 ND ND ND 3 ND ND ND Sawtooth Hatchery 1996 Sawtooth A Untagged 2,122 AD Double Length 1 3 3 6 0.284/25/1997 Wire 2 ND ND ND 3 ND ND ND Totals: 61,694 75 58 133 0.22 Salmon R @ 1996 Sawtooth A Untagged 75,946 AD Contribution 1 81 85 166 0.22 McNabb Point 2 ND ND ND 4/9/1997-4/24/1997 3 ND ND ND Totals: 75,946 81 85 166 0.22 Total 1-Ocean: 2,392 Total 2-Ocean: ND Total 3-Ocean: ND Total Harvest Recoveries: 1,313 Total Hatchery Recoveries: 1,079 Total Releases: 1,147,144 Total Recoveries: 2,392

39
Appendix B. Table 3. Release and recovery data for brood year 1996 steelhead released from Magic Valley Fish Hatchery. Only 1-ocean recoveries are available at this time. Data is shown by groups with both hatchery and harvest recoveries for each tag code, along with any untagged fish, shown separately. Harvest estimates are based on angler phone surveys and creel census data. Hatchery estimates include rack returns along with estimates of in-stream escapement values. The total returns represent a minimum estimate of returns that do not include out-of-basin strays or prespawning mortalities. Recovery data is from Hansen and White (In Press, a).
Release Brood Stock CWT Tagged Other Marking Ocean Harvest Hatchery Total SARSite/Date Year Name Code Release Marks Purpose Age Returns Returns Returns (%)Sawtooth Hatchery 1996 PAH A Untagged 84,715 AD Late eggs. 1 122 72 194 0.234/11/1997 Acclimated group 2 ND ND ND 3 ND ND ND Totals: 84,715 122 72 194 E Fk Salmon R @ 1996 DWOR B 105224 13,032 AD,LV Contribution 1 0 0 0 0 Dumpster 2 ND ND ND 4/23/97-4/30/97 3 ND ND ND E Fk Salmon R @ 1996 DWOR B 105222 19,347 AD,LV Contribution 1 0 0 0 0 Dumpster 2 ND ND ND 4/23/97-4/30/97 3 ND ND ND E Fk Salmon R @ 1996 DWOR B 105223 19,798 AD,LV Contribution 1 0 0 0 0 Dumpster 2 ND ND ND 4/23/97-4/30/97 3 ND ND ND E Fk Salmon R @ 1996 DWOR B Untagged 240,777 AD Contribution 1 0 0 0 0 Dumpster 2 ND ND ND 4/23/97-4/30/97 3 ND ND ND Totals: 292,954 0 0 0 0 N Fk Salmon 1996 PAH A 105216 20,026 AD Contribution 1 79 22 101 0.5 Release 2 ND ND ND 4/21/1997 3 ND ND ND N Fk Salmon 1996 PAH A 105217 19,979 AD Contribution 1 38 22 60 0.3 Release 2 ND ND ND 4/21/1997 3 ND ND ND N Fk Salmon 1996 PAH A 105218 17,633 AD Contribution 1 22 20 42 0.24Release 2 ND ND ND 4/21/1997 3 ND ND ND N Fk Salmon 1996 PAH A Untagged 76,673 AD Contribution 1 185 86 271 0.35Release 2 ND ND ND 4/21/1997 3 ND ND ND Totals: 134,311 324 150 474 0.35 Lt Salmon R @ 1996 DWOR B 105206 19,407 AD,LV Contribution 1 0 0 0 0 Stinky Springs 2 ND ND ND 4/9/97-4/10/97 3 ND ND ND Lt Salmon R @ 1996 DWOR B 105106 9,505 AD,LV Contribution 1 0 0 0 0 Stinky Springs 2 ND ND ND 4/9/97-4/10/97 3 ND ND ND Lt Salmon R @ 1996 DWOR B Untagged 211,618 AD Contribution 1 0 0 0 0 Stinky Springs 2 ND ND ND 4/9/97-4/10/97 3 ND ND ND Totals: 240,530 0 0 0 0

40
Appendix B. Table 3. Continued. Release Brood Stock CWT Tagged Other Marking Ocean Harvest Hatchery Total SARSite/Date Year Name Code Release Marks Purpose Age Returns Returns Returns (%)Salmon R @ 1996 PAH A 105212 14,694 AD Contribution 1 19 16 35 0.24 McNabb Point 2 ND ND ND 4/14/97-4/15/97 3 ND ND ND Salmon R @ 1996 PAH A 105210 17,401 AD Contribution 1 12 19 31 0.18 McNabb Point 2 ND ND ND 4/14/97-4/15/97 3 ND ND ND Salmon R @ 1996 PAH A 105211 17,574 AD Contribution 1 22 20 42 0.24 McNabb Point 2 ND ND ND 4/14/97-4/15/97 3 ND ND ND Salmon R @ 1996 PAH A Untagged 104,802 AD Contribution 1 112 118 230 0.22 McNabb Point 2 ND ND ND 4/14/97-4/15/97 3 ND ND ND Totals: 154,471 165 173 338 0.22 Slate Ck 1996 DWOR B 105162 15,480 AD,LV Contribution 1 0 0 0 0 U Salmon R 2 ND ND ND 4/25/97-5/1/97 3 ND ND ND Slate Ck 1996 DWOR B 105160 20,273 AD,LV Contribution 1 0 0 0 0 U Salmon R 2 ND ND ND 4/25/97-5/1/97 3 ND ND ND Slate Ck 1996 DWOR B 105161 21,448 AD,LV Contribution 1 0 0 0 0 U Salmon R 2 ND ND ND 4/25/97-5/1/97 3 ND ND ND Slate Ck 1996 DWOR B Untagged 156,010 AD Contribution 1 0 0 0 0 U Salmon R 2 ND ND ND 4/25/97-5/1/97 3 ND ND ND Totals: 213,211 0 0 0 0 E Fk Salmon R 1996 East Fk B 105221 15,007 AD,LV Contribution 1 18 5 23 0.15Trap 2 ND ND ND 4/22/97-4/23/97 3 ND ND ND E Fk Salmon R 1996 East Fk B 105219 19,375 AD,LV Contribution 1 10 4 14 0.07Trap 2 ND ND ND 4/22/97-4/23/97 3 ND ND ND E Fk Salmon R 1996 East Fk B 105220 20,667 AD,LV Contribution 1 17 2 19 0.09Trap 2 ND ND ND 4/22/97-4/23/97 3 ND ND ND E Fk Salmon R 1996 East Fk B Untagged 76,171 AD Contribution 1 62 27 89 0.12Trap 2 ND ND ND 4/22/97-4/23/97 3 ND ND ND Totals: 131,220 107 38 145 0.11 Lemhi R: 1996 PAH A 105213 20,560 AD Contribution 1 58 23 81 0.39 Salmon R 2 ND ND ND 4/16/97-4/18/97 3 ND ND ND Lemhi R: 1996 PAH A 105214 20,628 AD Contribution 1 36 23 59 0.29 Salmon R 2 ND ND ND 4/16/97-4/18/97 3 ND ND ND Lemhi R: 1996 PAH A 105215 15,226 AD Contribution 1 27 17 44 0.29 Salmon R 2 ND ND ND 4/16/97-4/18/97 3 ND ND ND

41
Appendix B. Table 3. Continued. Release Brood Stock CWT Tagged Other Marking Ocean Harvest Hatchery Total SARSite/Date Year Name Code Release Marks Purpose Age Returns Returns Returns (%)Lemhi R: 1996 PAH A Untagged 185,096 AD Contribution 1 397 208 605 0.33 Salmon R 2 ND ND ND 4/16/97-4/18/97 3 ND ND ND Totals: 241,510 518 271 789 0.33 Salmon R @ 1996 PAH A Untagged 150,280 AD Contribution 1 160 169 329 0.22 Bruno Bridge 2 ND ND ND 4/15/97-4/16/97 3 ND ND ND Totals: 150,280 160 169 329 0.22 Total 1-Ocean: 2,269 Total 2-Ocean: ND Total 3-Ocean: ND Total Harvest Recoveries: 1,396 Total Hatchery Recoveries: 873 Total Releases: 1,643,202 Total Recoveries: 2,269

42
Appendix C. Table 1. Release and recovery data for brood year 1995 steelhead released from Clearwater Fish Hatchery. Only 1- and 2-ocean recoveries are available at this time. Data is shown by groups with both hatchery and harvest recoveries for each tag code, along with any untagged fish, shown separately. Harvest estimates are based on angler phone surveys and creel census data. Hatchery estimates include rack returns along with estimates of in-stream escapement values. The total returns represent a minimum estimate of returns that do not include out-of-basin strays or prespawning mortalities. Recovery data is from Hansen and White (In Press, a) and Hansen and White (In Press, b).
Release Brood Stock CWT Tagged Other Marking Ocean Harvest Hatchery Total SARSite/Date Year Name Code Release Marks Purpose Age Returns Returns Returns (%)Red River: 1995 DWOR B 104630 6,163 LV Supplementation 1 0 0 0 0 S Fk Clwtr NBS 2 0 0 0 4/16/1996 3 ND ND ND Red River: 1995 DWOR B Untagged 191 NONE Supplementation 1 0 0 0 0 S Fk Clwtr NBS 2 0 0 0 4/16/1996 3 ND ND ND Totals: 6,354 0 0 0 0 S Fk Red River 1995 DWOR B 102022 40,970 NONE Supplementation 1 ND ND ND 9/6/1995 2 ND ND ND 3 ND ND ND S Fk Red River 1995 DWOR B Untagged 6,256 NONE Supplementation 1 ND ND ND 9/6/1995 2 ND ND ND 3 ND ND ND Totals: 47,226 ND ND ND S Fk Clwtr@ 1995 DWOR B 102029 63,743 AD,LV Contribution 1 0 0 0 0.21Red House Hole 2 61 72 133 4/17/1996 3 ND ND ND S Fk Clwtr@ 1995 DWOR B Untagged 121,471 AD Contribution 1 0 0 0 0.20Red House Hole 2 112 133 245 4/17/1996 3 ND ND ND Totals: 185,214 173 205 378 0.20 S Fk Clwtr; 2nd 1995 DWOR B 103515 64,254 AD,LV Contribution 1 0 0 0 0.26Br Up 2 97 73 170 4/18/1996 3 ND ND ND S Fk Clwtr; 2nd 1995 DWOR B Untagged 61,755 AD Contribution 1 0 0 0 0.26Br Up 2 93 70 163 4/18/1996 3 ND ND ND Totals: 126,009 190 143 333 0.26 Clear Ck 1995 DWOR B 103053 63,556 AD,LV Contribution 1 0 2 2 0.11Clwtr R 2 26 44 70 4/19/96-4/24/96 3 ND ND ND Clear Ck 1995 DWOR B Untagged 99,049 AD Contribution 1 0 3 3 0.11Clwtr R 2 40 69 109 4/19/96-4/24/96 3 ND ND ND Totals: 162,605 66 118 184 0.11 Cottonwood Ck 1995 DWOR B 103514 63,551 AD,LV Contribution 1 0 0 0 0.2 S Fk Clwtr R 2 56 72 128 4/18/1996 3 ND ND ND

43
Appendix C. Table 1. Continued. Release Brood Stock CWT Tagged Other Marking Ocean Harvest Hatchery Total SARSite/Date Year Name Code Release Marks Purpose Age Returns Returns Returns (%)Cottonwood Ck 1995 DWOR B Untagged 57,739 AD Contribution 1 0 0 0 0.20S Fk Clwtr R 2 51 65 116 4/18/1996 3 ND ND ND Totals: 121,290 107 137 244 0.20 Red River: 1995 DWOR B Untagged 8,000 AD Supplementation 1 0 0 0 0.03 S Fk Clwtr Project 2 0 2 2 4/17/1996 3 ND ND ND Totals: 8,000 0 2 2 0.03 Clear Ck 1994 DWOR B Untagged 135,837 AD 2 Yr Rearing 1 0 4 4 0.11Clwtr R 2 56a 94a 150a 4/17/1996 3 ND ND ND Totals: 135,837 56 98 154 0.11 Crooked R 1995 SELWAY Untagged 15,215 LV Wild Selway 1 0 0 0 0 Ponds Stock 2 0 0 0 4/15/1996 3 ND ND ND Totals: 15,215 0 0 0 0 Crooked R 1995 DWOR B Untagged 16,144 LV Selway Study, 1 0 0 0 0 Ponds Hatchery Stock 2 0 0 0 4/15/1996 3 ND ND ND Totals: 16,144 0 0 0 0 Crooked R 1995 DWOR B Untagged 14,659 LV Hatch/Wild 1 0 0 0 0 Ponds Selway study 2 0 0 0 4/15/1996 3 ND ND ND Totals: 14,659 0 0 0 0 Total 1-Ocean: 9 Total 2-Ocean: 1,286 Total 3-Ocean: ND Total Harvest Recoveries: 592 Total Hatchery Recoveries: 703 Total Releases: 838,553 Total Recoveries: 1,295
a Based on harvest and rack return rates for 1-year reared fish from marked Clear Creek release group.

44
Appendix C. Table 2. Release and recovery data for brood year 1995 steelhead released from Hagerman National Fish Hatchery. Only 1- and 2-ocean recoveries are available at this time. Data is shown by groups with both hatchery and harvest recoveries for each tag code, along with any untagged fish, shown separately. Harvest estimates are based on angler phone surveys and creel census data. Hatchery estimates include rack returns along with estimates of in-stream escapement values. The total returns represent a minimum estimate of returns that do not include out-of-basin strays or prespawning mortalities. Recovery data is from Hansen and White (In Press, a) and Hansen and White (In Press, b).
Release Brood Stock CWT Tagged Other Marking Ocean Harvest Hatchery Total SARSite/Date Year Name Code Release Marks Purpose Age Returns Returns Returns (%) Lt Salmon R @ 1995 Hells Canyon A 104538 20,068 AD Contribution 1 37 37 74 0.42 Warm Springs Br 2 5 5 10 4/8�4/22/1996 3 ND ND ND Lt Salmon R @ 1995 Hells Canyon A 104539 21,012 AD Contribution 1 82 82 164 1.16 Warm Springs Br 2 40 40 80 4/8�4/22/1996 3 ND ND ND Lt Salmon R @ 1995 Hells Canyon A 104540 20,389 AD Contribution 1 54 54 108 0.64 Warm Springs Br 2 11 11 22 4/8�4/22/1996 3 ND ND ND Lt Salmon R @ 1995 Hells Canyon A Untagged 271,829 AD Contribution 1 402 402 804 0.46 Warm Springs Br 2 229 229 458 4/8�4/22/1996 3 ND ND ND Totals: 333,298 860 860 1,720 0.52 Salmon R @ 1995 Sawtooth A 104526 21,388 AD Acc. 1 48 13 61 0.42 Torrey's Hole Torrey's 2 26 2 28 4/19/1996 Hole 3 ND ND ND Salmon R @ 1995 Sawtooth A 104527 21,765 AD Acc. 1 88 23 111 0.56 Torrey's Hole Torrey's 2 9 1 10 4/19/1996 Hole 3 ND ND ND Salmon R @ 1995 Sawtooth A 104528 21,503 AD Acc. 1 20 5 25 0.14 Torrey's Hole Torrey's 2 4 2 6 4/19/1996 Hole 3 ND ND ND Salmon R @ 1995 Sawtooth A Untagged 2,000 AD Acc. 1 5 1 6 0.35 Torrey's Hole Torrey's 2 1 0 1 4/19/1996 Hole 3 ND ND ND Totals: 66,656 201 47 248 0.37 Sawtooth Hatchery 1995 Pah A 104532 21,720 AD Acc. & Vol. 1 73 10 83 0.5 4/19�5/16/1996 Pah-A 2 22 3 25 Release 3 ND ND ND Sawtooth Hatchery 1995 Pah A 104533 22,336 AD Acc. & Vol. 1 34 10 44 0.314/19�5/16/1996 Pah-A 2 24 1 25 Release 3 ND ND ND Sawtooth Hatchery 1995 Pah A 104534 20,414 AD Acc. & Vol. 1 16 4 20 0.174/19�5/16/1996 Pah-A 2 15 0 15 Release 3 ND ND ND Sawtooth Hatchery 1995 Pah A Untagged 179,964 AD Acc. & Vol. 1 437 153 590 0.434/19�5/16/1996 Pah-A 2 137 41 178 Release 3 ND ND ND Totals: 244,434 758 222 980 0.4

45
Appendix C. Table 2. Continued. Release Brood Stock CWT Tagged Other Marking Ocean Harvest Hatchery Total SARSite/Date Year Name Code Release Marks Purpose Age Returns Returns Returns (%) Lt Salmon R @ 1995 Pah A 104535 20,699 AD Contribution 1 0 0 0 0.1 Warm Springs Br 2 10 10 20 4/8�4/22/1996 3 ND ND ND Lt Salmon R @ 1995 Pah A 104536 20,825 AD Contribution 1 0 0 0 0.05 Warm Springs Br 2 5 5 10 4/8�4/22/1996 3 ND ND ND Lt Salmon R @ 1995 Pah A 104537 19,762 AD Contribution 1 8 8 16 0.4 Warm Springs Br 2 32 32 64 4/8�4/22/1996 3 ND ND ND Lt Salmon R @ 1995 Pah A Untagged 3,771 AD Contribution 1 5 5 10 0.42 Warm Springs Br 2 3 3 6 4/8�4/22/1996 3 ND ND ND Totals: 65,057 63 63 126 0.19 Pahsimeroi 1995 Pah A Untagged 21,196 AD Pahsimeroi 1 80 38 118 Hatchery FH 2 22 9 31 3/26/1996 Contribution 3 ND ND ND Totals: 21,196 102 47 149 0.7 Hazard Ck 1995 Hells Canyon A Untagged 130,911 AD Contribution 1 192 192 384 Lt Salmon R 2 109 109 218 4/24�4/29/1996 3 ND ND ND Totals: 130,911 301 301 602 0.46 Sawtooth Hatchery 1995 Sawtooth A 104531 21,305 AD Sawtooth 1 57 16 73 0.414/15�4/19/1996 Acclimated 2 13 2 15 3 ND ND ND Sawtooth Hatchery 1995 Sawtooth A 104529 22,036 AD Sawtooth 1 70 17 87 0.444/15�4/19/1996 Acclimated 2 8 3 11 3 ND ND ND Sawtooth Hatchery 1995 Sawtooth A 104530 21,716 AD Sawtooth 1 32 12 44 0.344/15�4/19/1996 Acclimated 2 29 1 30 3 ND ND ND Sawtooth Hatchery 1995 Sawtooth A Untagged 327,655 AD Sawtooth 1 791 278 1,069 0.424/15�4/19/1996 Acclimated 2 247 75 322 3 ND ND ND Totals: 392,712 1,247 404 1,651 0.42 Sawtooth Hatchery 1995 Sawtooth A 104525 21,581 AD Sawtooth 1 13 18 31 0.184/15�4/19/1996 Direct 2 7 1 8 Release 3 ND ND ND Sawtooth Hatchery 1995 Sawtooth A 104523 22,106 AD Sawtooth 1 26 21 47 0.344/15�4/19/1996 Direct 2 24 4 28 Release 3 ND ND ND Sawtooth Hatchery 1995 Sawtooth A 104524 21,652 AD Sawtooth 1 40 17 57 0.3 4/15�4/19/1996 Direct 2 5 3 8 Release 3 ND ND ND Sawtooth Hatchery 1995 Sawtooth A Untagged 3,246 AD Sawtooth 1 16 6 22 0.864/15�4/19/1996 Direct 2 5 1 6 Release 3 ND ND ND Totals: 68,585 136 71 207 0.3

46
Appendix C. Table 2. Continued. Release Brood Stock CWT Tagged Other Marking Ocean Harvest Hatchery Total SARSite/Date Year Name Code Release Marks Purpose Age Returns Returns Returns (%) Total 1-Ocean: 4,048 Total 2-Ocean: 1,635 Total 3-Ocean: ND Total Harvest Recoveries: 3,668
Total Hatchery Recoveries: 2,015
Total Releases: 1,322,849 Total Recoveries: 5,683

47
Appendix C. Table 3. Release and recovery data for brood year 1995 steelhead released from Magic Valley Fish Hatchery. Only 1- and 2-ocean recoveries are available at this time. Data is shown by groups with both hatchery and harvest recoveries for each tag code, along with any untagged fish, shown separately. Harvest estimates are based on angler phone surveys and creel census data. Hatchery estimates include rack returns along with estimates of in-stream escapement values. The total returns represent a minimum estimate of returns that do not include out-of-basin strays or prespawning mortalities. Recovery data is from Hansen and White (In Press, a) and Hansen and White (In Press, b).
Release Brood Stock CWT Tagged Other Marking Ocean Harvest Hatchery Total SARSite/Date Year Name Code Release Marks Purpose Age Returns Returns Returns (%) Salmon R @ 1995 PAH A 103513 62,686 AD Contribution 1 127 47 174 0.36 Bruno Bridge 2 24 27 51 4/17/96-4/19/96 3 ND ND ND Salmon R @ 1995 PAH A Untagged 144,559 AD Contribution 1 293 108 401 0.36 Bruno Bridge 2 55 62 117 4/17/96-4/19/96 3 ND ND ND Totals: 207,245 499 244 743 0.36 Lemhi R: 1995 PAH A 103512 61,673 AD Contribution 1 262 97 359 0.65 Salmon R 2 17 26 43 4/15/96-4/26/96 3 ND ND ND Lemhi R: 1995 PAH A Untagged 139,539 AD Contribution 1 593 219 812 0.65 Salmon R 2 39 59 98 4/15/96-4/26/96 3 ND ND ND Totals: 201,212 911 401 1,312 0.65 Salmon R @ 1995 PAH A 103511 61,552 AD Contribution 1 214 79 293 0.57 McNabb Point 2 30 26 56 4/15/96-4/17/96 3 ND ND ND Salmon R @ 1995 PAH A Untagged 140,417 AD Contribution 1 488 180 668 0.57 McNabb Point 2 68 60 128 4/15/96-4/17/96 3 ND ND ND Totals: 201,969 800 345 1,145 0.57 N Fk Salmon 1995 PAH A 103510 61,852 AD Contribution 1 408 151 559 1.07 Release 2 75 26 101 4/15/96-4/16/96 3 ND ND ND N Fk Salmon 1995 PAH A Untagged 65,856 AD Contribution 1 434 160 594 1.07 Release 2 80 28 108 4/15/96-4/16/96 3 ND ND ND Totals: 127,708 997 365 1,362 1.07 Hazard Ck 1995 DWOR B 103509 62,228 AD,LV Contribution 1 4 4 8 0.16 Lt Salmon R 2 47 47 94 4/9/96-4/12/96 3 ND ND ND Hazard Ck 1995 DWOR B Untagged 341,053 AD Contribution 1 22 22 44 0.16 Lt Salmon R 2 258 258 516 4/9/96-4/12/96 3 ND ND ND Totals: 403,281 331 331 662 0.16 E Fk Salmon R 1995 DWOR B 103508 63,440 AD,LV Contribution 1 0 0 0 0.03 Trap 2 17 4 21 4/24/96-5/4/96 3 ND ND ND

48
Appendix C. Table 3. Continued. Release Brood Stock CWT Tagged Other Marking Ocean Harvest Hatchery Total SARSite/Date Year Name Code Release Marks Purpose Age Returns Returns Returns (%) E Fk Salmon R 1995 DWOR B Untagged 115,235 AD Contribution 1 11 2 13 0.05 Trap 2 31 8 39 4/24/96-5/4/96 3 ND ND ND Totals: 178,675 59 14 73 0.04 Slate Ck 1995 DWOR B 103507 61,962 AD,LV Contribution 1 0 0 0 0.01 U Salmon R 2 7 2 9 4/26/96-5/2/96 3 ND ND ND Slate Ck 1995 DWOR B Untagged 174,335 AD Contribution 1 0 5 5 0.02 U Salmon R 2 20 5 25 4/26/96-5/2/96 3 ND ND ND Totals: 236,297 27 12 39 0.02 E Fk Salmon R 1995 East Fk B 104613 10,891 AD,LV Contribution 1 7 1 8 0.11 Trap 2 3 1 4 4/24/96-4/30/96 3 ND ND ND E Fk Salmon R 1995 East Fk B 104709 22,225 AD,LV Contribution 1 0 1 1 0.04 Trap 2 7 2 9 4/24/96-4/30/96 3 ND ND ND E Fk Salmon R 1995 East Fk B Untagged 29,804 AD Contribution 1 3 0 3 0.05 Trap 2 9 2 11 4/24/96-4/30/96 3 ND ND ND Totals: 62,920 29 7 36 0.06 E Fk Salmon R 1995 DWOR B Untagged 210,459 AD Contribution 1 20 3 23 0.05 @ Dumpster 2 57 17 74 4/27/96-5/4/96 3 ND ND ND Totals: 210,459 77 20 97 0.05 E Fk Salmon R 1995 DWOR B Untagged 38,320 AD Contribution 1 5 1 6 0.05 Below Herd Ck 2 12 3 15 4/12/1996 3 ND ND ND Totals: 38,320 17 4 21 0.05 Total 1-Ocean: 3,971 Total 2-Ocean: 1,519 Total 3-Ocean: ND Total Harvest Recoveries: 3,747 Total Hatchery Recoveries: 1,743 Total Releases: 1,868,086 Total Recoveries: 5,490

49
Appendix D. Table 1. Release and recovery data for brood year 1994 steelhead released from Clearwater Fish Hatchery. All returns are complete at this time. Data is shown by groups with both hatchery and harvest recoveries for each tag code, along with any untagged fish, shown separately. Harvest estimates are based on angler phone surveys and creel census data. Hatchery estimates include rack returns along with estimates of in-stream escapement values. The total returns represent a minimum estimate of returns that do not include out-of-basin strays or prespawning mortalities. Recovery data is from Ball and White (2001), Hansen and White (In Press a), and Hansen and White (In Press, b).
Release Brood Stock CWT Tagged Other Marking Ocean Harvest Hatchery Total SARSite/Date Year Name Code Release Marks Purpose Age Returns Returns Returns (%)S Fk Clwtr@ 1994 DWOR B 104621 42,581 AD,LV Contribution 1 0 0 0 0.05Red House Hole 2 19 0 19 4/19/95-4/20/95 3 0 3 3 S Fk Clwtr@ 1994 DWOR B Untagged 136,975 AD Contribution 1 16 16 32 0.1 Red House Hole 2 61 29 90 4/19/95-4/20/95 3 0 10 10 Totals: 179,556 96 58 154 0.09 Cottonwood Ck 1994 DWOR B 104727 21,252 AD,LV Contribution 1 0 0 0 0.01S Fk Clrwtr R 2 0 1 1 4/20/1995 3 0 2 2 Cottonwood Ck 1994 DWOR B Untagged 84,150 AD Contribution 1 10 10 20 0.09S Fk Clrwtr R 2 32 15 47 4/20/1995 3 0 6 6 Totals: 105,402 42 34 76 0.07 S Fk Red River 1994 DWOR B 104506 21,590 NONE Supplementation 1 ND ND ND 10/27/1994 2 ND ND ND 3 ND ND ND S Fk Red River 1994 DWOR B 104505 22,060 NONE Supplementation 1 ND ND ND 10/27/1994 2 ND ND ND 3 ND ND ND S Fk Red River 1994 DWOR B Untagged 6,140 NONE Supplementation 1 ND ND ND 10/27/1994 2 ND ND ND 3 ND ND ND Totals: 49,790 ND ND ND ND Clear Ck 1994 DWOR B 102025 56,533 AD,LV Fin Erosion 1 143 2 145 0.3 Clwtr R Study 2 0 17 17 4/18/1995 3 5 1 6 Clear Ck 1994 DWOR B 102026 62,834 AD,LV Fin Erosion 1 0 1 1 0.1 Clwtr R Study 2 28 34 62 4/18/1995 3 0 0 0 Clear Ck 1994 DWOR B 102027 58,301 AD,LV Fin Erosion 1 0 2 2 0.14Clwtr R Study 2 51 28 79 4/18/1995 3 0 1 1 Clear Ck 1994 DWOR B Untagged 6,044 NONE Fin Erosion 1 5 0 5 0.18Clwtr R Study 2 3 3 6 4/18/1995 3 0 0 0 Totals: 183,712 235 89 324 0.18

50
Appendix D. Table 1. Continued. Release Brood Stock CWT Tagged Other Marking Ocean Harvest Hatchery Total SARSite/Date Year Name Code Release Marks Purpose Age Returns Returns Returns (%)S Fk Clwtr R@ 1994 DWOR B 104728 20,710 AD,LV Contribution 1 10 0 10 0.06 MP18 2 0 0 0 4/19/1995 3 0 2 2 S Fk Clwtr R@ 1994 DWOR B Untagged 98,582 AD Contribution 1 11 11 22 0.07 MP18 2 26 12 38 4/19/1995 3 0 7 7 Totals: 119,292 47 32 79 0.07 Total 1-Ocean: 237 Total 2-Ocean: 359 Total 3-Ocean: 37 Total Harvest Recoveries: 420 Total Hatchery Recoveries: 213 Total Releases: 637,752 Total Recoveries: 633

51
Appendix D. Table 2. Release and recovery data for brood year 1994 steelhead released from Hagerman National Fish Hatchery. All returns are complete at this time. Data is shown by groups with both hatchery and harvest recoveries for each tag code, along with any untagged fish, shown separately. Harvest estimates are based on angler phone surveys and creel census data. Hatchery estimates include rack returns along with estimates of in-stream escapement values. The total returns represent a minimum estimate of returns that do not include out-of-basin strays or prespawning mortalities. Recovery data is from Ball and White (2001), Hansen and White (In Press a), and Hansen and White (In Press, b).
Release Brood Stock CWT Tagged Other Marking Ocean Harvest Hatchery Total SARSite/Date Year Name Code Release Marks Purpose Age Returns Returns Returns (%) Salmon R @ 1994 Sawtooth A 104513 20,287 AD Torrey's Hole 1 71 30 101 0.6 Torrey's Hole (Indian Riffles) 2 8 4 12 4/19/1995 Acclimated 3 0 0 0 Salmon R @ 1994 Sawtooth A 104514 21,887 AD Torrey's Hole 1 54 23 77 0.4 Torrey's Hole (Indian Riffles) 2 10 2 12 4/19/1995 Acclimated 3 0 0 0 Salmon R @ 1994 Sawtooth A 104515 19,085 AD Torrey's Hole 1 91 39 130 0.8 Torrey's Hole (Indian Riffles) 2 16 2 18 4/19/1995 Acclimated 3 0 0 0 Salmon R @ 1994 Sawtooth A Untagged 2,908 AD Torrey's Hole 1 10 4 14 0.6 Torrey's Hole (Indian Riffles) 2 2 0 2 4/19/1995 Acclimated 3 0 0 0 Totals: 64,167 262 104 366 0.6 Sawtooth 1994 Sawtooth A 104510 20,321 AD Acclimated 1 46 16 62 0.5 Hatchery 2 31 7 38 4/17/1995 3 0 0 0 Sawtooth 1994 Sawtooth A 104511 19,335 AD Acclimated 1 53 24 77 0.4 Hatchery 2 7 2 9 4/17/1995 3 0 0 0 Sawtooth 1994 Sawtooth A 104512 20,591 AD Acclimated 1 20 35 55 0.3 Hatchery 2 7 3 10 4/17/1995 3 0 0 0 Sawtooth 1994 Sawtooth A Untagged 288,522 AD Acclimated 1 1,100 518 1,618 0.9 Hatchery 2 731 90 821 4/17/1995 3 0 0 0 Totals: 348,769 1,995 695 2,690 0.8 Lt Salmon R @ 1994 Pah A 104516 21,481 AD Contribution 1 30 30 60 0.3 Warm Springs Br 2 0 0 0 4/10/1995-4/28/1995 3 0 0 0 Lt Salmon R @ 1994 Pah A 104517 20,853 AD Contribution 1 0 0 0 0 Warm Springs Br 2 4 4 8 4/10/1995-4/28/1995 3 0 0 0 Lt Salmon R @ 1994 Pah A Untagged 42,831 AD Contribution 1 177 177 354 0.9 Warm Springs Br 2 12 12 24 4/10/1995-4/28/1995 3 0 0 0 Totals: 85,165 223 223 446 0.5 Lt Salmon R @ 1994 Hells 104521 22,923 AD Contribution 1 17 17 34 0.2 Warm Springs Br Canyon A 2 5 5 10 4/10/1995-4/28/1995 3 0 0 0

52
Appendix D. Table 2. Continued. Release Brood Stock CWT Tagged Other Marking Ocean Harvest Hatchery Total SARSite/Date Year Name Code Release Marks Purpose Age Returns Returns Returns (%) Lt Salmon R @ 1994 Hells 104522 19,236 AD Contribution 1 28 28 56 0.4 Warm Springs Br Canyon A 2 14 14 28 4/10/1995-4/28/1995 3 0 0 0 Lt Salmon R @ 1994 Hells Untagged 273,180 AD Contribution 1 291 290 581 0.3 Warm Springs Br Canyon A 2 74 74 148 4/10/1995-4/28/1995 3 0 0 0 Totals: 315,339 429 428 857 0.3 Sawtooth 1994 Pah A 104518 23,576 AD Pah-A 1 40 16 56 0.6 Hatchery Acclimated 2 81 1 82 4/21/1995 3 0 0 0 Sawtooth 1994 Pah A 104519 21,995 AD Pah-A 1 38 10 48 0.4 Hatchery Acclimated 2 35 1 36 4/21/1995 3 0 0 0 Sawtooth 1994 Pah A 104520 18,109 AD Pah-A 1 53 8 61 0.4 Hatchery Acclimated 2 4 1 5 4/21/1995 3 3 0 3 Sawtooth 1994 Pah A Untagged 195,922 AD Pah-A 1 747 352 1,099 0.9 Hatchery Acclimated 2 496 61 557 4/21/1995 3 13 2 15 Totals: 259,602 1,510 452 1,962 0.8 Sawtooth 1994 Sawtooth A 104509 19,900 AD Direct Release 1 63 29 92 0.7 Hatchery 2 43 9 52 4/17/1995 3 0 0 0 Sawtooth 1994 Sawtooth A 104507 19,923 AD Direct Release 1 20 23 43 0.3 Hatchery 2 21 3 24 4/17/1995 3 0 0 0 Sawtooth 1994 Sawtooth A 104508 19,689 AD Direct Release 1 75 22 97 0.7 Hatchery 2 34 4 38 4/17/1995 3 0 0 0 Sawtooth 1994 Sawtooth A Untagged 17,123 AD Direct Release 1 66 30 96 0.9 Hatchery 2 43 6 49 4/17/1995 3 0 0 0 Totals: 76,635 365 126 491 0.6 Total 1-Ocean: 4,811 Total 2-Ocean: 1,983 Total 3-Ocean: 18 Total Harvest Recoveries: 4,784 Total Hatchery Recoveries: 2,028 Total Releases: 1,149,677 Total Recoveries: 6,812

53
Appendix D. Table 3. Release and recovery data for brood year 1994 steelhead released from Magic Valley Fish Hatchery. All returns are complete at this time. Data is shown by groups with hatchery and harvest recoveries for each tag code, along with any untagged fish, shown separately. Harvest estimates are based on angler phone surveys and creel census data. Hatchery estimates include rack returns, along with estimates of in-stream escapement values. The total returns represent a minimum estimate of returns that do not include out-of-basin strays or prespawning mortalities. Recovery data is from Ball and White (2001), Hansen and White (In Press, a), and Hansen and White (In Press, b).
Release Brood Stock CWT Tagged Other Marking Ocean Harvest Hatchery Total SARSite/Date Year Name Code Release Marks Purpose Age Returns Returns Returns (%) E Fk Salmon R 1994 East Fk B 102024 62,484 AD Contribution 1 8 11 19 0.22 Trap 2 113 3 116 4/19/95-4/25/95 3 0 0 0 E Fk Salmon R 1994 East Fk B Untagged 2,516 AD Contribution 1 1 0 1 0.28 Trap 2 6 0 6 4/19/95-4/25/95 3 0 0 0 Totals: 65,000 128 14 142 0.22 E Fk Salmon R 1994 DWOR B 102012 21,143 AD Contribution 1 0 0 0 0.07 Trap 2 15 0 15 4/19/95-4/25/95 3 0 0 0 E Fk Salmon R 1994 DWOR B 102003 21,698 AD Contribution 1 1 0 1 0.22 Trap 2 45 1 46 4/19/95-4/25/95 3 0 0 0 E Fk Salmon R 1994 DWOR B 102004 20,949 AD Contribution 1 0 0 0 0 Trap 2 0 0 0 4/19/95-4/25/95 3 0 0 0 E Fk Salmon R 1994 DWOR B Untagged 359,915 AD Contribution 1 9 13 22 0.11 Trap 2 356 11 367 4/19/95-4/25/95 3 0 0 0 Totals: 423,705 426 25 451 0.11 N Fk Salmon 1994 PAH A 104661 31,090 AD Contribution 1 117 81 198 1.15 Release 2 114 47 161 4/13/95-4/14/95 3 0 0 0 N Fk Salmon 1994 PAH A 104660 31,639 AD Contribution 1 38 26 64 1.25 Release 2 234 96 330 4/13/95-4/14/95 3 0 0 0 N Fk Salmon 1994 PAH A Untagged 52,321 AD Contribution 1 133 92 225 1.23 Release 2 298 122 420 4/13/95-4/14/95 3 0 0 0 Totals: 115,050 934 464 1,398 1.22 Salmon R @ 1994 PAH A 102018 21,328 AD Contribution 1 67 21 88 0.66 McNabb Point 2 34 18 52 4/10/95-4/12/95 3 0 0 0 Salmon R @ 1994 PAH A 102016 20,862 AD Contribution 1 63 20 83 0.62 McNabb Point 2 31 16 47 4/10/95-4/12/95 3 0 0 0 Salmon R @ 1994 PAH A 102017 21,078 AD Contribution 1 105 33 138 0.89 McNabb Point 2 33 17 50 4/10/95-4/12/95 3 0 0 0

54
Appendix D. Table 3. Continued. Release Brood Stock CWT Tagged Other Marking Ocean Harvest Hatchery Total SARSite/Date Year Name Code Release Marks Purpose Age Returns Returns Returns (%) Salmon R @ 1994 PAH A Untagged 144,577 AD Contribution 1 546 172 718 0.73 McNabb Point 2 227 117 344 4/10/95-4/12/95 3 0 0 0 Totals: 207,845 1,106 414 1,520 0.73 Lemhi R: 1994 PAH A 102015 20,783 AD Contribution 1 53 37 90 0.57 Salmon R 2 19 10 29 4/14/95-4/17/95 3 0 0 0 Lemhi R: 1994 PAH A 102007 20,810 AD Contribution 1 31 22 53 0.71 Salmon R 2 63 32 95 4/14/95-4/17/95 3 0 0 0 Lemhi R: 1994 PAH A 102008 20,672 AD Contribution 1 109 76 185 1.14 Salmon R 2 25 13 38 4/14/95-4/17/95 3 4 8 12 Lemhi R: 1994 PAH A Untagged 136,005 AD Contribution 1 441 306 747 0.89 Salmon R 2 244 126 370 4/14/95-4/17/95 3 29 59 88 Totals: 198,270 1,018 689 1,707 0.86 Hazard Ck 1994 DWOR B 102014 21,036 AD Contribution 1 10 10 20 0.17 Lt Salmon R 2 8 8 16 4/26/95-5/1/95 3 0 0 0 Hazard Ck 1994 DWOR B 102006 20,471 AD Contribution 1 0 0 0 0.03 Lt Salmon R 2 3 3 6 4/26/95-5/1/95 3 0 0 0 Hazard Ck 1994 DWOR B 102013 21,137 AD Contribution 1 0 0 0 0.05 Lt Salmon R 2 5 5 10 4/26/95-5/1/95 3 0 0 0 Hazard Ck 1994 DWOR B Untagged 280,035 AD Contribution 1 49 49 98 0.09 Lt Salmon R 2 77 77 154 4/26/95-5/1/95 3 0 0 0 Totals: 342,679 152 152 304 0.09 Salmon R @ 1994 PAH A 102011 21,135 AD Contribution 1 85 27 112 1.04 Bruno Bridge 2 71 37 108 4/17/95-4/19/95 3 0 0 0 Salmon R @ 1994 PAH A 102009 20,456 AD Contribution 1 47 15 62 0.59 Bruno Bridge 2 38 20 58 4/17/95-4/19/95 3 0 0 0 Salmon R @ 1994 PAH A 102010 20,460 AD Contribution 1 85 28 113 0.86 Bruno Bridge 2 41 21 62 4/17/95-4/19/95 3 0 0 0 Salmon R @ 1994 PAH A Untagged 100,819 AD Contribution 1 430 136 566 1.01 Bruno Bridge 2 298 156 454 4/17/95-4/19/95 3 0 0 0 Totals: 162,870 1,095 440 1,535 0.94 Slate Ck 1994 DWOR B 102005 21,224 AD Contribution 1 0 0 0 0 U Salmon R 2 0 0 0 4/12/95-4/22/95 3 0 0 0 Slate Ck 1994 DWOR B 102001 21,065 AD Contribution 1 0 0 0 0 U Salmon R 2 0 0 0 4/12/95-4/22/95 3 0 0 0

55
Appendix D. Table 3. Continued. Release Brood Stock CWT Tagged Other Marking Ocean Harvest Hatchery Total SARSite/Date Year Name Code Release Marks Purpose Age Returns Returns Returns (%) Slate Ck 1994 DWOR B 102002 21,355 AD Contribution 1 5 0 5 0.09 U Salmon R 2 13 1 14 4/12/95-4/22/95 3 0 0 0 Slate Ck 1994 DWOR B Untagged 152,290 AD Contribution 1 13 0 13 0.02 U Salmon R 2 19 1 20 4/12/95-4/22/95 3 0 0 0 Totals: 215,934 50 2 52 0.02 Total 1-Ocean: 3,621 Total 2-Ocean: 3,388 Total 3-Ocean: 100 Total Harvest Recoveries: 4,909 Total Hatchery Recoveries: 2,200 Total Releases: 1,731,353 Total Recoveries: 7,109

56
Prepared by: Approved by: IDAHO DEPARTMENT OF FISH AND GAME Chris Harrington Virgil K. Moore, Chief Sr. Fisheries Research Biologist Bureau of Fisheries Steve Yundt Fisheries Research Manager