Embed Size (px)
Citation preview

Lower Wages and Continued Occupational and Industrial Segmentation of Latinos in the Chicago Economy
BY
JOSÉ ACOSTA CÓRDOVAB.A., University of Illinois at Chicago, Chicago 2016
M.U.P.P, University of Illinois at Chicago, Chicago, 2019
THESIS
Submitted as partial fulfillment of the requirementsfor the degree of Master’s in Urban Planning and Policy
in the Graduate College of theUniversity of Illinois at Chicago, 2019
Chicago, Illinois
Committee: John J. Betancur, Chair and Advisor, Urban Planning and Public Policy
Nik Theodore, Urban Planning and Public PolicyXochitl Bada, Latin American and Latino Studies
Timothy Imeokparia, Great Cities Institute, University of Illinois at Chicago

ii
Chapter
I. Introduction ...............................................................................................................II. Methodology .............................................................................................................III. Historical Context of Latin America and Latino Incorporation into Chicago
Economy ...................................................................................................................IV. Global Economic Restructuring and the Chicago Economy ....................................V. General Population Statistics ....................................................................................VI. The Impact of Economic Restructuring on Latinos in Chicago as Reflected in
Census Figures and other Evidence ..........................................................................VII. Latino Settlements in Chicago area – Continued Growth and Disbursement ..........VIII. Conclusions, Recommendations and Questions for Further Research .....................
CITED LITERATURE .........................................................................................................
BIBLIOGRAPHY ON LATINOS IN CHICAGO ................................................................
VITA .....................................................................................................................................
Page
14
51416
187087
89
92
97
TABLE OF CONTENTS

iii
Table
1. Table 5.1 - Industrial Distribution of All Earners in the Chicago Metropolitan Areaby Race and Latino Group, 1980 and 2012-2016 (in percent) .......................................
2. Table 5.2 - Occupational Distribution for All Earners in the Chicago MetropolitanArea by Racial or Latino Group. 1980 and 2012-2016 (in percent) ..............................
3. Table 5.3a - Average Wages for Male and Female Earners by Industry and Racialor Latino Group in the Chicago Metropolitan Area, 1980 to 2012-2016 .......................
4. Table 5.3b - Average Wages for Male and Female Earners by Occupation andRacial or Latino Group in the Chicago Metropolitan Area, 1980 to 2012-2016 ............
5. Table 5.4 Mean Income Compared to Level of Education for All Wage Earners,1980 to 2012-2016 ..........................................................................................................
6. Table 5.6a - Occupational Distribution by Latino Subgroup – 1980 to 2012-2016 .......7. Table 5.6b - Occupational Distribution by Latino Subgroup – 2012-2016 ....................8. Table 5.7a – Industry of Latinos by National Group – 1980 to 2012-2016 ...................
Page
27
30
33
41
48515661
LIST OF TABLES

iv
LIST OF FIGURES
Figure
1. Figure 1 - Average Wages for Latino Earners by Industry, 2012-2016 ..........................2. Figure 2 - Average Wages for Latina Earners by Industry, 2012-2016 ...........................3. Figure 3 - Average Wages for Latino Earners by Occupation, 2012-2016 .....................4. Figure 4 - Average Wages for Latina Earners by Occupation, 2012-2016 .....................5. Map 1 - Latinos Neighborhoods and Industrial Corridors in Chicago, 1980 .................6. Map 2 - Latinos Neighborhoods and Industrial Corridors in Chicago, 1990 .................7. Map 3 - Latinos Neighborhoods and Industrial Corridors in Chicago, 2000 .................8. Map 4 - Latinos Neighborhoods and Industrial Corridors in Chicago, 2010 .................9. Map 5 - Latinos Neighborhoods and Industrial Corridors in Chicago, 2012-2016 ........10. Map 6 - Latino Population Growth in the Chicago Metropolitan Area, 1980 ................11. Map 7 - Latino Population Growth in the Chicago Metropolitan Area, 1990 ................12. Map 8 - Latino Population Growth in the Chicago Metropolitan Area, 2000 ................13. Map 9 - Latino Population Growth in the Chicago Metropolitan Area, 2010 ................14. Map 10 - Latino Population Growth in the Chicago Metropolitan Area, 2012-2016 .....
Page
3434424277787980818283848586

v
LIST OF ABBREVIATIONS
American Community SurveyWorld War IWorld War IINorth American Free Trade Agreement
ACSWWIWWIINAFTA

vi
SUMMARY
In 1993, John Betancur, Teresa Córdova, and Maria de los Angeles Torres published
“Economic Restructuring and the Process of Incorporation of Latinos into the Chicago Econo-
my,” in Latinos in the Changing U.S. Econom,y edited by Rebecca Morales and Frank Bonilla.
They concluded, “The history of the incorporation of Latino workers into the economy best
explained the Latino experience in the Chicago area and provides a backdrop for understanding
the impact of restructuring (110).” The authors argue that “the condition of ascriptive low-wage
labor” restricted the mobility options for the Latino work force in the region. Examining PUM
census data for the Chicago metro area from 1950 – 1980 on labor force participation, the study
demonstrated that Latino labor, composed primarily of Mexicans and Puerto Ricans, facilitated
the growth of the service sector in the Chicago economy while continuing to further entrench the
segmentation of Latino labor in low-wage service sector employment.
The Latino population in the city has grown significantly since the Betancur et al. study
(Cervantes, 1996; Suro, 2002; Paral et. al., 2004; Acosta-Córdova, 2017). However, no recent
study has examined the industrial and occupational mobility of Latinos to the same extent as
Betancur, et. al. Given the demographic growth of Latinos in Chicago and the continued changes
in the Chicago economy, this study provides an update of the Betancur et. al. study to examine
the changes taking place between 1980 and 2016 and to determine the extent of economic mo-
bility for Latinos in Chicago. Using updated PUM census data, this thesis seeks to determine
whether, since 1980, we continue to see what they described as the “continuation of occupational
and industrial segmentation and lower wages” among Latinos in Chicago and how their labor
force status affects policies and perspectives towards Latinos in the Chicago area.
This thesis finds that despite progress for Latinos in several industries and occupations,
they continue to be segmented into jobs and industries with the lowest-wages. While Afri-
can-Americans and Latinos both displayed similar conditions in most of the categories, Latinos
had lower wages in more industries and occupations than any other group in Chicago. Even
when accounting for a college degree, Latinos and African-Americans still earned far less than

vii
Non-Latino Whites and Asians, with Latinos earning lower wages than all other groups. This is
crucial to understanding the reality of the economic conditions of Latino households throughout
the region. On an individual basis, Latinos earn the lowest wages within the Chicago economy.
Regardless of any economic progress for Latinos since 1980, the amount of the labor
force concentrated in low-wage industries and occupations shows that there is still ample room
for growth. Latinos did not progress to the same extent as other racial/ethnic groups. Since 1980,
the Latino population has exploded in the region, and if it were not for this influx, both the city
and the metropolitan area would have lost a significant amount of total population during this
period. What is crucial to understand about the restructuring of the Chicago economy, were it
not for the influx of Latino immigrants, many industries that have grown or remained in the area
since would not have found the labor to do it. It is because of the large source of low-wage labor
that these industries have prospered. Latino labor has helped transform Chicago from an indus-
trial metropolis into a modern-day, service-based metropolis. One could argue, Latinos saved
Chicago’s economy.
SUMMARY (Continued)

1
I. Introduction
The dynamics of global economic restructuring have been underway since the mid 1970s,
leading to both economic “growth” and increased inequality (Castells 1989; Morales and Bonilla
1993). The parallel industrial and occupational restructuring has had widespread impacts affect-
ing whether and where people work and the amount of pay they receive, with the migration of
labor as a key element in the functioning of the globalized economy (Sassen 1988).
Morales and Bonilla (1993), leading a team of researchers, examined these trends of eco-
nomic restructuring at both the national level and in five major U.S. cities to determine how they
were impacting Latinos in a Changing U.S. Economy. One of those cities was Chicago. Betan-
cur, Córdova and Torres (1993) provided an analysis of “Economic Restructuring and the Process
of Incorporation of Latinos into the Chicago Economy.” In their chapter, the authors demonstrate
that “the history of the incorporation of Latino workers into the economy best explains the Latino
experience in the Chicago area and provides a backdrop for understanding the impact of restruc-
turing (110).” The authors argue that “the condition of ascriptive low-wage labor” restricted the
options for Latinos for labor force mobility. In the 1993 study, Betancur et. al..examined PUMS
census data on labor force participation for the seven county Chicago area from 1950 – 1980 and
concluded that Latino labor, primarily that of Mexicans and Puerto Ricans, facilitated the growth
of the service sector in the Chicago economy while continuing to further entrench the segmenta-
tion of Latinos labor in low-wage service sector employment.
Chicago presents an interesting area for examining this process of economic restructur-
ing due to its history of manufacturing and industrial development; its historical role as a hub of
migration including early ethnic-European, African-American, Latin American (both from within
and outside the U.S.) and Asians. It, in fact, allows for the examination of the ways in which
economic restructuring shaped the current socio-economic conditions of the communities dein-
dustrialization left behind. Manufacturing played a major role in the growth and development of
Chicago, as well as the many neighborhoods where workers resided (Año-Nuevo Kerr, 1976).
In 1960, at the height of Chicago’s manufacturing sector employment, 56% of the Latino labor

2
force was employed in manufacturing, compared to 37% of non-Hispanic Whites and 33% of the
African-American labor force (Acosta-Córdova, 2017).
The deindustrialization of the Chicago economy accelerated in the 1970’s and 1980’s and
coincided with the growth in the region of the service economy (Ranney, 2002). The total Latino
population exploded during this time period, going from 250,000 in 1970, to 600,000 in 1990
(Acosta-Córdova, 2017). The continued influx of Latinos into Chicago set the stage for Latinos
to play a key role in the Chicago area economy and for employers to benefit from a large source
of cheap labor (Betancur et. al., 1993).
Since the study of Betancur et Al, the Latino population in the city, as well as in the larger
metropolitan area, has continued to grow at high rates with some studies and reports noting
population growth that accelerated in the 1980’s. During the 1990’s, the total number of Latinos
in the metropolitan area increased by 570,000 people, while between 2000 and 2010, the Latino
population grew by 30% while the metropolitan region’s overall population grew by only 4%
(Acosta-Córdova, 2017).
While the demographic growth has been documented and analyzed, no other recent study
has examined in detail the industrial and occupational mobility of Latinos. Given the demograph-
ic growth of Latinos in Chicago and the continued changes in the Chicago economy, the purpose
of this study is to examine the changes from 1980 to 2016 and interpret the extent of economic
mobility for Latinos in Chicago. Similar to Betancur et.Al., this study, utilizes primarily PUMS
census data and seeks to determine whether, since 1980, we continue to see what they described
as the “continuation of occupational and industrial segmentation and lower wages” among Lati-
nos in Chicago.
Three significant factors have fundamentally changed the economic positioning of Lati-
nos in the U.S. generally and Chicago since the publication of that study, specifically: (1) Further
economic restructuring of the Chicago and U.S. economies and continued deindustrialization
along with a significant growth of the service sector, which was highlighted in the study by
Betancur, et. Al., but has further developed in the past 25 years. (2) Global trade liberalization

3
and the North American Free-Trade Agreement (NAFTA), which liberalized trade between Cana-
da, Mexico, and the U.S, and led to a significant rural to urban migration of Mexicans not only to
Mexican cities but also to US cities such as Chicago; and (3) The continued growth and disper-
sion of the Latino population in the Chicago area.

4
II. Methodology
1980 Decennial Census public use data and 2012-2016 American Community Survey
5-year estimates public use data for Industry, occupation, average income by industry and occu-
pation, and average income by educational attainment data were web downloaded from IPUMS
USA at IPUMS.org. This data was tabulated using SPSS statistical software version 22. IPUMS
provides standardized industry and occupation classifications to allow for consistent compara-
bility over-time. For the 1980 and 2012-2016 data, industry and occupation classifications were
standardized to be consistent with 1990 Decennial Census industry and occupation classifica-
tions. Because the 1980 Decennial Census and 2012-2016 American Community Survey were
based off a sample of the total U.S. population, this analysis used replicate frequency person
weights provided in the data to be representative of the total population. 1980 average income
dollar amounts were inflation adjusted to 2016 dollars using a consumer price index value of
2.91 as determined by the Bureau of Labor Statistics.
This thesis uses the same 6-County region that the 1993 study by Betancur et. al. used,
which are Cook, DuPage, Will, Lake, Kane, and Kendall.

5
III. Historical Context of Latin America and Latino Incorporation into Chicago Economy
The migration of Latinos into the Chicago area began in 1916, with the first recruit-
ment of Mexican workers by railroad companies (Año-Nuevo Kerr, 1976). World War I created
an economic boom in the United States, particularly in Northern U.S. industrial cities such as
Chicago, among many others (Betancur et. al). This combined with a significant reduction in the
influx of immigrants from Europe, leading to a labor shortage in several low-wage industries
and occupations (ibid). African-Americans migrating from the Southern U.S. partially filled this
void. Mexican workers were recruited to work agricultural fields throughout the Southwestern
U.S. prior to WWI and were satisfactory to their employers due to their willingness to work for
low-wages, in harsh conditions, and without much resistance over these wages and conditions
(ibid). Therefore, Mexican workers were recruited to the Midwest in order to fulfill the labor
shortages in the lowest-paying industries and occupations, thus establishing initial patterns of
migration, as well as patterns of segmentation (ibid).
Initially, Mexican workers were recruited to work the railroads and agricultural fields of
the Chicago metropolitan area, throughout the state of Illinois, as well as most other Midwestern
states (Año-Nuevo Kerr, 1976; Mize & Swords, 2010). By 1928 in Chicago, Mexicans account-
ed for 43% of track and maintenance workers on 16 major railroads in the Chicago-Gary region
(Betancur et. al.). The success of recruiting railroad workers led to recruitment by the Steel
(1919) and Meatpacking (1921) industries, primarily from the Southwest, and from towns on
both sides of the border (ibid). The Steel industry in particular, recruited Mexican labor as strike-
breakers during a strike by Ethnic-European and African-American workers, leading to severe
resentment towards Mexican workers (Innis-Jimenez, 2013). Recruitment continued, however,
and by 1926 Mexicans accounted for 14% of the total Steel work force in Chicago (Betancur et.
al.). Recruitment also continued by beef and hog producers, and by 1928 Mexican workers made
up 11% of the labor force in 15 meat-packing industries (ibid). As a result of this recruitment,
and the initial patterns of migration, the total Mexican population increased from 1,224 in 1920,
to 19,362 in 1930 (ibid). This time period created the conditions for steady immigration to the

6
area, for occupational segmentation, and for the reproduction of the same conditions for future
immigrants.
Betancur et. al..identified three major characteristics of the initial process of Mexican
incorporation into the Chicago economy, 1) The process was closely conditioned and shaped
by relations between US and Mexico, 2) the extremely vulnerable immigrant status of Mexican
workers, and 3) their status as low-wage, disposable labor with minimal mobility and job tenure
and extremely limited rights. The complicated relationship between the U.S. and Mexico began
before the U.S.-Mexico War of 1846-1848 as many Anglos from the east began settling illegally
in the area now known as Texas (Martinez, 1996). U.S. dominance of Mexico expanded follow-
ing their victory in the war (ibid). Mexico became one the largest recipients of U.S. foreign in-
vestment under the model of dependent development, especially after the dictatorship of Porfirio
Diaz (Betancur et. al). By 1900, U.S. investors played a crucial role in railroad construction, oil
extraction, mining, and agricultural exploitation (ibid). According to Betancur et. al., “Extensive
programs of land expropriation and agricultural capitalization since the turn of the century, fi-
nanced by foreign capital, produced massive displacement of Mexican peasants in search of jobs.
Further displaced by the chaos of the revolution of 1910 and the ensuing counterrevolutions,
many of them joined the stream of workers willing to work in the U.S. Southwest.” Mexican
immigration into the U.S. was met with disdain by restrictionists seeking to limit the influx of
non-European immigrants into the country, as well as by organized labor who viewed Mexicans
as a threat (ibid). Following the Restrictionist debates of the 1920’s, and the Great Depression
of 1929, Mexican workers were vilified and blamed for the economic downturn of the country
(Betancur et. al.; Año-Nuevo Kerr, 1976). This led to Mexican Repatriation, a period between
1929-1936 during which an estimated 400,000 – 2 million people were deported to Mexico from
throughout the U.S., with approximately 60% of them being birthright citizens who were legally
permitted to be in the country (Balderrama & Rodriguez, 2006). This led to a major decrease in
immigration throughout the country and decreased the overall population of Mexicans in Chica-
go from just under 20,000 to about 14,000 by the end of the 1930’s (Año-Nuevo Kerr, 1976).
7
This all changed drastically, following the official entrance of U.S. into World War II
after the Japanese attacked Pearl Harbor, Hawaii, on December 7th, 1941. Similar to WWI, WWII
played a crucial role in attracting Mexican labor to the U.S. as a whole, as well as into the Chi-
cago region. This role was in the form of the Bracero program, which was an agreement between
the U.S. and Mexico negotiated between 1941-1942, that provided the U.S. with contracted labor
primarily for agricultural employment, and later extended into manufacturing employment (Mize
& Swords, 2010). In Chicago alone, 15,000 railroad workers, or 11% of total railroad imports in
US, were recruited between 1943-1945 (Betancur et. al). The program was only supposed to be
temporary, however, Mexican low-wage labor became crucial to several industries, who lobbied
to extend the program, especially during times of war (Betancur et. al.; Mize & Swords, 2010).
The program ultimately lasted until 1964. The Mexican population increased from 14,000 in
1940, to 35,000 in 1950 (Betancur et. al). Operation Wetback in 1954, which was a U.S. govern-
ment policy that deported millions of Mexican immigrants across the country, including several
thousand from Chicago, temporarily slowed down migration into the area (Año-Nuevo Kerr,
1976; Mize & Swords, 2010). However, due to the direct railroad connection between Chicago
and the Mexican border, as well as the availability of employment, Mexican migration expanded
during the 1950’s and 1960’s. This coincided with a major influx of African-Americans from the
South, the migration of other Latino groups such as Puerto Ricans and Cubans, the growth of the
suburbs, and the phenomenon known as “White-flight,” during which ethnic Whites were aban-
doning cities across the country and moving into suburban areas (Betancur et. al). This led to the
creation of African-American and Latino enclaves in Chicago, and it countless cities across the
country. By 1970, the Latino population in the Chicago area increased to 250,000, an increase of
more than 200,000 people in a 20-year period (ibid).
Puerto Ricans and Cubans began migrating into Chicago during the 1940’s but did not
accelerate until the 1950’s (ibid). Puerto Ricans were initially recruited to the Midwest to work
the agricultural fields of the region (ibid). Similar to Mexican workers before them, Puerto Ri-
cans migrated into urban areas in search of employment in manufacturing. Migration out of the

8
island of Puerto Rico accelerated due to social unrest and unemployment, which led to a signif-
icant influx of Puerto Ricans into New York City, New York, and Chicago, among other cities
(ibid). The Puerto Rican population in Chicago increased from 240 in 1940, to 32,371 in 1960,
78,963 in 1970, 109,736 in 1980, and 119,866 in 1990 (ibid). Puerto Rican migrants shared
similar socio-economic conditions as Mexicans, and often occupied similar low-wage indus-
tries and occupations (ibid). They also faced discrimination like Mexicans did, however, due to
their citizenship status were never targeted for deportation (ibid). The Puerto Rican population
did not expand to nearly the same extent as the Mexican population did, and in fact decreased
to 113,055 in 2000, 102,703 in 2010, before increasing to 103,560 in 2012-2016 (U.S. Census
Data; American Community Survey 2012-2016 5-Year estimates). The total Puerto Rican popu-
lation in the 6-County region of Northeastern Illinois was 181,905 in 2012-2016, with more than
200,000 when including the additional counties in Wisconsin and Indiana that makeup the rest of
the greater Chicago metropolitan area, which is the 5th highest population for metropolitan areas
in the U.S. (ACS 2012-2016. Puerto Ricans continue to be a significant population in the city,
culturally, politically, )and economically.
Cubans on the other hand, experienced a sharp contrast in comparison with Mexicans and
Puerto Ricans, both in terms of the immigration process, as well as the socio-economic status of
the immigrants themselves (Betancur et. al). Due to the Cuban Revolution in 1959, and the role
of the U.S., as well as the close relationship of U.S. and Cuban leadership prior to the revolution,
Cubans received “Special Immigrant Status,” (ibid). Therefore, the incorporation of Cubans was
drastically different from Mexicans and Puerto Ricans. Most Cuban immigrants were upper and
middle class, with many being professionals or merchants (ibid). Although there was a small
population in the Chicago area prior to the 1960’s, there was never a significant influx. By 1970,
there were 15,000 in the city, however the population decreased to 11,400 in 1980, and 10,000
in 1990 (ibid). Since the 1993 study, the Cuban population has further declined to 8,084 in 2000,
then increased to 8,331 in 2010, and to 9,561 in 2012-2016 (U.S. Census Data; ACS 2012-2016).
The population in the metropolitan area, however, has increased from 16,624 in 1990, to 16,554

9
in 2000, to 19,474 in 2010, to 22,087 in 2012-2016 (ibid). There are more Cubans in the suburbs
than in the city, and they never established an enclave in the city.
The northern migration of Mexicans, people from the Caribbean, Central and South
Americans was ultimately a result of U.S. hegemony in the region (Betancur et. al). U.S. domi-
nance in Latin America, which began with the Monroe Doctrine of 1823, expanded following the
Spanish-American War of 1898, which lasted less than a year, and resulted in Spain relinquishing
the remainder of its empire, which were the islands of Cuba, Puerto Rico, Philippines, Guam, as
well as several other islands (Rockoff, 2012). By this time, most countries in the region fought
for, and successfully gained independence from their European colonizers (Galeano, 1971). The
U.S. saw an opportunity to dominate the region, with President Theodore Roosevelt declaring the
right to institute “international police power,” over Latin America in 1904 (ibid). Thus, the polit-
ical, social, and economic relationship between the U.S. and Latin America was established and
solidified. Several industries were interested in benefitting from the countless crops that the lands
of Latin America produced, and that people in Europe and the U.S. were accustomed to consum-
ing (ibid). This was of course, due to 400 years of colonization, genocide, slavery, and the raping
and pillaging of the lands themselves (ibid). The sugar industry for example, had major interest
in protecting their investments in Cuba, while the U.S. was interested in expanding its own em-
pire 50 years after the theft of more than half of Mexico’s territory during the U.S.-Mexico War
(ibid). Following the defeat of the Spanish, U.S. business interests set their sights on the fruitful
lands of Latin America. Political leaders from most countries in Central and South America were
themselves descendants of Europeans, with many welcoming U.S. foreign investment (ibid).
Thus, the dependent development relationship between the U.S. and Latin America became em-
bedded in the economies of nearly every country in the region.
WWII had a profound impact on economies throughout the world, and nobody capi-
talized more than the United States (Rockoff, 2012). Many of the world’s largest economies
were devastated due to the war, especially in Europe (ibid). The war never made it to U.S. soil,
therefore there was not devastation compared to what countries in Europe and Asia experienced.

10
The Marshall Plan of 1948, which was a U.S. plan to redevelop Western Europe, resulted in the
transferring of roughly $13 billion dollars to these countries between 1948 and 1951 (De Long,
Eichengreen, 1991). The plan, which has been referred to as “the most successful structural
adjustment program in history,” not only successfully redeveloped the economies of Europe,
it established the U.S. as a world economic powerhouse at a time when all other world powers
were recuperating economically (ibid). For the U.S. to maintain this world dominance, they
needed to have a source of high-value agricultural crops, and of cheap labor, Latin America pro-
vided both. The U.S. therefore, needed to protect its empire by any means necessary, including
through military warfare, as well as economic warfare (Lehoucq, Pérez-Liñán, 2014). This has
been proven, as the U.S. has intervened many times in countries that were fighting for economic
independence, or where there was social and political conflict (ibid). In fact, between 1846 and
1996, the U.S. intervened 95 times in the political and economic affairs of nearly every country
in Latin America (ibid). This continues until present day, the U.S. has proven they will not allow
for the economic independence of Latin America, these countries are too important economically
for the U.S. empire.
U.S. Intervention in Central America has led to more civil unrest, as well as more dis-
placement of impoverished people than in any other region (Lehoucq, Pérez-Liñán, 2014). The
countries of Guatemala, El Salvador, Honduras and Nicaragua continue to suffer from the im-
pacts of U.S. interventions in the form of civil war, and economic distress (ibid). This led to mass
migration north, first into Mexico, and then into the United States. The metropolitan area of Los
Angeles, California, experienced the most significant influx of Central Americans during the
1980’s, as too did many other metropolises where Latinos already lived in large numbers, includ-
ing Chicago. Although smaller numbers of Central Americans were already in the Chicago area,
migration increased during the 1980’s, and by 1990 there were more than 29,000 total, includ-
ing nearly 16,000 Guatemalans, more than 6,000 Salvadorans, more than 3,000 Hondurans, and
nearly 1,500 Panamanians, and more than 1,200 Nicaraguans (U.S. Census). The total population
in the metropolitan area increased to 37,211 in 2000, 63,590 in 2010, and 72,557 in 2012-2016

11
(U.S. Census, ACS 2012-2016). Out of these 72,557, more than 36,000 were Guatemalans, near-
ly 15,000 were Hondurans, nearly 13,500 were Salvadorans, with roughly 2,000 each of Nicara-
guans, Panamanians, and Costa Ricans (ibid). The total Central American population in the city
of Chicago also increased, from 23,339 in 2000, to 31,263 in 2010, and to 33,869 in 2012-2016,
out of which more than 18,500 were Guatemalans, more than 6,000 were Hondurans, and nearly
6,000 were Salvadorans (ibid). Like Cubans, there are more Central Americans in the suburbs
than in the city. While most Central Americans have migrated from impoverished areas, the
social unrest and violence also led to the exodus of many upper and middle class people, creating
what Betancur et. al..referred to as a “bipolar occupational structure,” with many educated and
upper or middle class workers on one end of the spectrum, while the majority were low-wage
workers (Betancur et. al.)
South American migration into the U.S. also increased after the 1980’s, which was also
tied to social unrest, civil war, and economic instability (Lehoucq, Pérez-Liñán, 2014). Eco-
nomics especially played a crucial role, as several countries experienced the impacts of global
economic restructuring. The first Neoliberal economic experiment was in Chile in 1973, during
which the U.S. first supported a military coup of the democratically-elected Socialist and Marxist
President Salvador Allende (Taylor, 2003, 2006; Winn, 2004). Following the successful coup, the
U.S. placed the military dictator Augusto Pinochet into the presidency, and subsequently imple-
mented the first form of one of the most socially detrimental economic policies the world has
ever known (ibid). The rest of Latin America, except for Cuba, would become a testing grounds
for economic policies that have impacted the vast majority of the world’s economy, therefore the
people of Latin America have suffered more from economic restructuring than in any other conti-
nent (ibid). South American migration to the U.S. therefore, is intrinsically tied to the failures of
economic restructuring and its impacts to the socio-economic stability of these countries (ibid).
Ecuador, for example, experienced an economic crisis following the restructuring of its
economy in the 1990’s, leading to a mass exodus of Ecuadorians, most of which migrated to
New York City, however many of which migrated to Chicago (Jokisch, Pribilsky, 2002). Al-

12
though Ecuadorians migrated to Chicago in numbers in the 1960’s, many of which were upper
and middle class, there was not a significant influx until the 1990’s. The migration of Colombians
was like that of Central Americans, in that it was tied to U.S. political and economic interven-
tion, the violence from civil wars, and the socio-economic unrest that accompanied these civil
wars (Lehoucq, Pérez-Liñán, 2014). Colombian migration also expanded during the 1960’s, and
further increased during the 1980’s (ibid). Most migrants headed for South Florida, or New York
City, with a smaller number migrating to Chicago. The South American population in the Chica-
go metropolitan area increased from 28,598 in 1990, to 36,080 in 2000, to 62,205 in 2010, and to
74,161 in 2012-2016, slightly more than Central Americans (U.S. Census; ACS 2012-2016). The
total South American population in the city of Chicago increased from 20,828 in 2000, to 32,129
in 2010, to 38,284 in 2012-2016, also more than Central Americans (ibid). There are more South
Americans in the city than in the suburbs. The Ecuadorian and Colombian populations have also
expanded during this time. Ecuadorians in the metropolitan area increased from 8,472 in 1990, to
11,811 in 2000, to 22,037 in 2010, and to 26,567 in 2012-2016 (ibid). Within the city of Chicago,
the population increased from 8,941 in 2000, to 15,466 in 2010, to 19,057 in 2012-2016 (ibid).
The Colombian population in the metropolitan area increased from 9,514 in 1990, to 10,941
in 2000, to 17,384 in 2010, and 20,891 in 2012-2016 (ibid). Within city limits, the population
increased from 5,625 in 2000, to 7,547 in 2010, to 8,342 in 2012-2016 (ibid). There are more
Ecuadorians in the city than in the suburbs, but more Colombians in the suburbs than in the city.
Like Central Americans, South Americans also had a bipolar occupational structure, with many
educated upper and middle class residents, and a larger percentage of low-wage workers (Betan-
cur et. al.).
The Mexican population, which was already the largest group in 1990, has also expanded
the most since. This was primarily due to the North American Free Trade Agreement (NAFTA)
in 1994, which was a trade agreement between the U.S., Canada, and Mexico (Mize & Swords,
2010). Proponents of the trade deal claimed it would be good for the economies of all three
countries, and that people would benefit on all sides of the border (ibid). NAFTA had mixed re-

13
sults for the U.S. and Canada, particularly on the workers who became unemployed as industries
moved south into Mexico to exploit cheap labor, thereby increasing their overall profits (ibid). In
terms of Gross Domestic Product (GDP), NAFTA can be viewed as a trade deal that had positive
outcomes for the economies of all three counties. In fact, Mexico’s GDP has increased nearly
every year since 1994, and has grown by nearly $800 billion since (World Bank Data, 2016).
However, for the people of Mexico it had a devastating impact. Until this point, Mexico’s rural
population was self-sustaining, and primarily survived off agricultural production. This changed
drastically with the implementation of NAFTA, which flooded the Mexican market with cheap
U.S. corn, and devastated the corn economy of Mexico (Mize & Swords, 2010). This led to
mass land displacement as people were no longer able to sustain themselves, and thus migrat-
ed into urban areas both in Mexico and in the United States. In addition to the impacts from
NAFTA, drug cartel violence has also contributed significantly to the migration of Mexicans
(García, González, 2009). Cartels fighting for access to the billion-dollar U.S. consumer market
have done so ruthlessly, leaving many people to flee to the U.S. in search of safety (ibid). Cartel
violence escalated significantly during the 1990’s and 2000’s, with NAFTA playing a role in the
transportation of drugs as many semi-trucks carrying goods could cross the border with minimal
risk (ibid). The Mexican population in the U.S. grew by more than 7 million people from 1990
to 2000, by more than 11 million people from 2000 to 2010, and by nearly another 4 million
people from 2010 to 2012-2016 (U.S. Census; ACS 2012-2016). The Chicago metropolitan area
was one of the key destinations Mexicans, and grew from 565,737 in 1990, to 1,052,878 in 2000,
to 1,428,114 in 2010, and to 1,500,270 in 2012-2016 (ibid). The Mexican population in the city
grew from 530,462 in 2000, to 578,100 in 2010, and to 591,897 in 2012-2016 (ibid). There are
more Mexicans in the suburbs, nearly l million, than in the city.

14
IV. Global Economic Restructuring and the Chicago Economy
Scholars have described aspects of the process of global economic restructuring in many
ways: e.g. deindustrialization, reindustrialization, post Fordism, internationalization, global city
formation, urban entrepreneurialism, informalization, gentrification, and sociospatial polariza-
tion (Brenner and Theodore, 2005). The term neoliberalism has been conceptually used by many
authors to describe economic restructuring, especially as it relates to the adoption and implemen-
tation of free-market and deregulation policies by governments and institutions (Brenner and
Theodore, 2005; Córdova, 2014).
While the term neoliberal and the aspects of neoliberalization continue to be debated by
scholars globally, its impacts have been detrimental to many countries and local governments
who believed that deregulating markets, cutting social spending, and cutting taxes on the wealthy
would ultimately benefit the overall economy. Neoliberal economics have spread globally; how-
ever, no other region has been as impacted as Latin America, where the first neoliberal exper-
iment occurred in Chile in 1973 paving the way for the rise of a military dictatorship (Taylor,
2003, 2006; Winn, 2004).
The concepts of neoliberalism were developed based on the successes and failures of Lat-
in American experiments that would not only become the basis for economic policies in the U.S.
and beyond but would also have an impact on migration patterns from Latin American countries
to the U.S. Aside from its impacts on local economies, neoliberalism has also changed the na-
ture of employment (Betancur et. al). The underlying industrial and occupational restructuring
has widespread impacts affecting whether and where people work, and the amount of pay they
receive (ibid). Morales and Bonilla and their team of researchers understood early on that glob-
al economic restructuring that accelerated in the mid-1970s was having – and would continue
to have – an impact on Latinos in cities across the U.S. particularly visible in the industries and
occupations where Latinos worked and the amount of pay that they received.
In Chicago, the continued loss of manufacturing jobs was matched with an increase in
service economy jobs, particularly in the 1970s and 1980s (ibid). Betancur et. al..(1993) demon-

15
strate that it was the continued influx of Latinos into Chicago that employers could tap on as a
source of cheap labor enabling economic restructuring to be successful in Chicago (ibid). This
paper examines industrial and occupational characteristics of Chicago’s economy since that
time especially as they apply to Latinos in that economy. In 1980, comparing Whites and Non-
Hispanic Blacks, Latinos were segmented in low paying industries and/or occupations (e.g.
operatives) and had the lowest average wages – e.g. even in manufacturing, where they had the
highest rates of employment controlling for education, confirming their role as low wage labor.
How does this compare to today?
This thesis updates the data presented by Betancur et. al..to examine Latino participation
in the Chicago labor force by gender by industry and occupation; their level of wages; and their
educational attainment and to determine whether or not there has been progress in these areas
over time. In doing so, the data on the conditions of the Latino labor force in Chicago reflects the
impacts of globalization and the restructuring economy, on the limited occupational mobility of
labor force participation of Latinos on the Chicago area.
16
V. General Population Statistics
This thesis uses the Six-County region within Illinois boundaries that is the majority of
the Chicago metropolitan area. These include, Cook, DuPage, Lake, Will, Kane, and McHen-
ry. Kendall and Kankakee counties in Illinois, Lake County in Indiana, and Kenosha County in
Wisconsin, are also considered part of the Chicago metropolitan area, however the original study
by Betancur et. at. was limited to the initial six counties, therefore all other counties were not
included in this study.
Within the six-counties, there were 1,893,436 total Latinos in 2012-2016, which accounts
for 22.6% of the total 8,380,055 people (ACS 2012-2016). Cook County had the highest total
Latino population at 1,300,843 (24.9% of pop.), followed by Kane County at 165,111 (31.4% of
pop.), Lake County at 146,608 (20.9% of pop.), DuPage County at 129,964 (14.0% of pop.), Will
County at 113,180 (16.5% of pop.), and McHenry County at 37,727 (12.3% of pop.) (ibid).
The city of Chicago is by far the largest city in the region with 2,714,017 people, fol-
lowed by Aurora with 200,907, Joliet with 147,515, Naperville with 145,789, Elgin with
111,919, Waukegan with 88,159, and Cicero with 83,972 (ibid). Except for Naperville, these are
the largest Latino settlements in the metropolitan area. Chicago had a total Latino population of
790,548 (% of pop.), followed by Aurora which had a total of 85,817 (42.7% of pop.), Cicero
which had a total of 74,555 (88.8% of pop.), Elgin which had 50,457 (45.1% of pop.), Waukegan
which had 48,966 (55.5% of pop.), Joliet which had 41,883 (28.4% of pop.), and Naperville had
only 8,750 (6% of pop.) (ibid).
Latinos outnumber Latinas in all the aforementioned cities. In Chicago, there were
402,654 Latinos compared to 387,894 Latinas (ibid). In Aurora, there were 43,843 Latinos com-
pared to 41,974 Latinas (ibid). In Cicero, there were 38,278 Latinos and 36,277 Latinas (ibid).
In Elgin, there were 26,719 Latinos and 23,738 Latinas (ibid). In Waukegan, there were 25,145
Latinos, and 23,821 Latinas (ibid). In Joliet, there were 21,404 Latinos and 20,479 Latinas (ibid).
In Naperville, there were 4,435 Latinos, and 4,315 Latinas (ibid). Latinos also outnumber Latinas
when breaking down the Sex by Occupation for the Civilian Employed Population 16 Years and

17
Over. In Chicago, there were 349,618 total Latinos in this category, with 204,406 Latinos, and
145,212 Latinas (ibid). In Aurora, there were 38,122 total, with 22,567 Latinos, and 15,555 Lati-
nas (ibid). In Cicero, there were 31,920 total, with 19,101 Latinos, and 12,819 Latinas (ibid). In
Elgin, there were 22,632 total, with 13,860 Latinos, and 8,772 Latinas (ibid). In Waukegan, there
were 23,354 total, with 13,566 Latinos, and 9,788 Latinas (ibid). In Joliet, there were 18,481
total, with 10,751 Latinos and 7,730 Latinas. In Naperville, there were 3,970 total, with 2,459
Latinos and 1,511 Latinas (ibid).
Educational attainment by sex, however, details how Latinas have larger numbers of peo-
ple with a college degree. The census category, Sex by Educational Attainment for the Population
25 Years and Over, also shows that Latinos have larger number of people without a high school
diploma. In Chicago, there were 457,701 total Latinos in this category, with 234,065 Latinos, and
223,636 Latinas (ibid). Out of the 234,065 Latinos, 87,601 had less than a high school diploma,
72,202 had only a high school diploma, 44,276 had some college or an Associate’s degree, and
29,986 had a Bachelor’s degree or higher (ibid). Out of the 223,636 Latinas, 78,932 had less than
a high school diploma, 61,030 had only a high school diploma, 47,779 had some college or an
Associate’s degree, and 35,895 had a Bachelor’s degree or higher (ibid).

18
VI. TheImpactofEconomicRestructuringonLatinosinChicagoasReflectedinCen-sus Figures and other Evidence
In the 1993 study, Betancur et. al.. examined PUMS census data on labor force participa-
tion for the Chicago area from 1950 to 1980 and concluded that Latino labor, composed primar-
ily of Mexicans and Puerto Ricans, facilitated the growth of the service sector in the Chicago
economy while continuing to entrench further the segmentation of Latino labor in low-wage ser-
vice sector employment. Betancur et. al.. described Latinos not only as being the least prepared
for the impacts of restructuring, but also as the group who had suffered the most economically as
a result of that restructuring. This details the reasoning for this:
Tied to unskilled or low-skilled occupations, particularly in the traditional manufactur-
ing sector, deprived of the stability and wages needed to invest in education, lacking the
resources to carry them through difficult times, and having no or weak political or institu-
tional ties and jobs, Latino workers were the least prepared for economic structuring, and
indeed, have the suffered the most from it (Betancur et al., 124).
According to the study by Betancur et. al., In 1980, Latinos were concentrated in the industries
with the lowest wages and received lower wages in every industrial category with the exception
of FIRE (ahead of African-Americans), services (slightly ahead of African-Americans), public
utilities (tied for last with Asians), transportation (tied with Asians and African-Americans, way
behind Non-Latino Whites), and retail (tied for lowest with African-Americans). Latinos also
had the lowest wages in several occupational categories, including operative, service (tied with
Asians), craft, officials and managers (tied with African-Americans), and sales. Latinos also had
the second lowest wages in clerical work (after Asians). Latinos had the lowest wages in both
manufacturing (industry) and operatives (occupation), both of which accounted for the largest
percentages of Latino workers, and thus solidifying their position as low-wage workers. How
have these changed since 1980? This excerpt from Betancur et. al.. best describes how Latinos
have fared as a result of restructuring:
The high-value manufacturing decline and restructuring had a devastating impact on Lati-
19
no workers. While other groups increased their proportions in high-paying industries and
occupations, Latino earners stagnated in low-paying occupations and industries. Latinos
often followed manufacturing jobs to the suburbs. They remained in manufacturing at
higher rates than other groups, despite long and expensive commuting (124).
This brings up the question, how have these aspects changed since 1980? Have there been signif-
icant increases in wages for Latino workers? How have Latinos compared to other groups with
respect to increases in wages? The core of this thesis compares findings from Betancur et. al.
(1980) to 2012-2016 data. The data presented in this section is divided into three parts: 1) Data
Summary, 2) Detailed Findings, and 3) Data Highlights.
Data Summary
Industrial Distribution:
In 1980, the largest concentration of employed Latino workers was in manufacturing at
47%, a 15% decrease from a peak of 62% in 1970. By 2012-2016, the total concentration further
decreased to 18.2% (See Table 5.1).
The largest increase for Latinos was in Retail Trade, going from 10.4% in 1970, to 14.1%
in 1980, and 23% in 2012-2016, making it the largest current total industry of employment for
Latinos.
There has also been an increase for all groups in the Finance, Insurance, and Real Estate
Industries (FIRE), which is generally the highest paying sector. For Latinos, however, the in-
crease has been smaller than for the other groups,
Occupational Distribution:
Similar to 1980, the largest share of the Latino labor force was occupied as Operators,
Fabricators, and Laborers at 24.4%. As Table 5.1, shows, corresponding with a decrease in the
manufacturing industry from 1980 to 2012-2016, the largest occupational decrease was in the
category Operators, Fabricators, and Laborers (See Table 5.2).
For Latinos, the most significant increase was in Service Occupations, going from 14.7%

20
in 1980 to 23.5% in 2012-2016, a shift that made this the second largest occupation for Latinos
in the metropolitan area. This increase of nearly 9% is significant for many reasons, most notably
the fact that it has nearly become the largest occupation for Latinos, and also because it has the
second-lowest wages of all the categories.
The category Executive, Administrative, and Managerial Occupations, with the highest
compensation, also increased its share of Latinos going from 2.7% in 1980 to 4.7% in 2012-
2016. However, this share is still lower than for all other groups.
Average Wages for Male and Female Earners by Industry and Racial and Latino Groups in Metro
Area
Similar to 1980, Latinos and African-Americans are overrepresented in the lowest paying
sectors and while they increased their presence in some of the higher paying sectors, they did so
at lower rates—and often in the lowest rungs (See Table 5.3).
The industry with the largest percentage of Latino workers, Retail Trade, also has the
second-lowest wages for male workers, and the lowest-wages for female workers.
Manufacturing is the next largest industry for Latino employment, and additionally has
the sixth-lowest wages for male workers, and fifth-lowest wages for female workers.
While Latinos have higher shares of their labor force in Manufacturing, wages are vastly
lower compared to their non-Latino White and Asian counterparts in this same industry. Latinos
as a whole earn lower wages than other groups as a whole.
The industries with the highest wages, Finance, Insurance, and Real Estate (FIRE), are
coincidentally industries with underrepresentation of Latino and African-American workers.
Ironically, these are also among the highest paying industries for both groups.
In one of the fastest growing industries for Latino workers, Business and Repair Services,
Latinos receive lower wages in comparison with other groups (p. 28). Furthermore, wages have
decreased for Latinos from 1980 to 2012-2016, dropping from $33,302 to $30,957, although they
have slightly increased for Latinas by $3,268, which is concerning considering that this industry

21
has grown by roughly 6% during this time-period (See Table 5.3a).
The occupation with the largest percentage of Latino workers, Operators, Fabricators, and
Laborers, is also one of the lowest-paying occupations.
The occupational category with the highest overall wages for all groups is Executive, Ad-
ministrative, and Managerial. In this category, Latinos and Latinas had the highest wages while
increasing the share of Latino employment by 2% since 1980—although accounting for just
under 5% of the total Latino labor force. Once again, Latinos as a whole earned lower average
wages than all other groups.
Table 5.3b shows how Latinos are disproportionately concentrated in low-wage occupa-
tions and lack representation in high-wage occupations. Only 7% of the Latino labor force were
in the two highest paying occupational categories, compared to 19.4% of the non-Latino White
labor force, 17.2% of the Asian labor force, and 10.5% of the African-American labor force.
The next highest paying category had an additional 8.1% of the Latino labor force, compared to
29.65% of the Asian, 22.8% of the non-Latino White, and 14.6% of the African-American labor
forces. The five largest occupational categories for Latinos, which amounts to 80% of the labor
force, have average annual wages below $40,000. This clearly indicates that the vast majority of
the Latino labor force was not in a high-wage occupation.
Occupational Distribution by Latino Subgroup
The occupational category with the largest total percentages, Operators, Fabricators, and
Laborers also have one of the lowest wages for its workers. Mexican workers had the highest overall
percentage at 26.8%, followed by Other Latino workers at 17.2%, Puerto Rican workers at 14.9%,
Cuban workers at 12.1%, and non-Latino workers at 9%. While still a significant portion, this catego-
ry has experienced the largest decrease in the total percentage of the workforce since 1980. The total
percentage of the Mexican workforce decreased from 47.9% in 1980, to 26.8% in 2012-2016; for
Puerto Ricans the percentage decreased from 43.5% in 1980 to 14.9% in 2012-2016.
The occupational category with the next largest percentages of Latino workers, also ex-
perienced the largest increase in the percentage of the total Latino workforce between 1980 and

22
2012-2016 and, additionally, is one of the lowest-paying occupational categories for Latinos.
While the highest wages for Latinos are in Executive, Administrative and Managerial
occupations, they continue to earn wages below those of other groups. Additionally, Latinos and
African-Americans as a whole continue to earn substantially less than their non-Latino White
and Asian counterparts (See Table 5.3b). Furthermore, both Latinos and African-Americans have
much lower rates of participation in these occupations, meaning fewer people are earning high
wages in comparison to non-Latino Whites and Asians. Still, wages have increased significantly
for Latinos and females from 1980 to 2012-2016.
Table 5.3b displays how Latinos are disproportionately concentrated in low-wage occu-
pations and lack representation in high-wage occupations. Only 7% of the Latino labor force was
in the two highest paying occupational categories, compared to 19.4% of the non-Latino White
labor force, 17.2% of the Asian labor force, and 10.5% of the African-American labor force.
The next highest paying category had an additional 8.1% of the Latino labor force, compared to
29.65% of the Asian, 22.8% of the non-Latino White, and 14.6% of the African-American labor
forces. The five largest occupational categories for Latinos amounting to 80% of the labor force
have average annual wages below $40,000. This clearly indicates that the vast majority of the
Latino labor force was not in a high-wage occupation.
Mean Income Compared to Level of Education for All Wage Earners, 1980 to 2012-2016
Table 5.4 displays average income by race/ethnicity when accounting for educational
attainment, comparing the years of 1980 and 2012-2016. There are clear discrepancies not only
between the racial/ethnic groups, but also within these groups. It is evident that on average,
access to higher education leads to higher-paying employment opportunities. This is the case for
every group in 2012-2016, with average incomes much higher for those with 4 or more years of
college, and lower incomes for those who have not completed a college degree.
However, while each racial/ethnic group average higher incomes based on educational at-
tainment, non-Latino Whites and Asians continue to average higher incomes than African-Amer-

23
icans and Latinos overall. For Non-Latino Whites in particular, average incomes are higher than
for every other racial/ethnic group, regardless of educational level. Asians on the other hand, on
the average have similar incomes to those of Latinos and African-Americans in every education-
al category, with the exception of the “4 or more years” category, where incomes for Asians are
much higher.
Incomes for Latinos and African-Americans continue to be the lowest overall. Incomes
are similar in all five educational categories, with Latinos averaging lower incomes in both the
1-3 Years of College and 4 or More Years of College, and African-Americans averaging lower
incomes in all three other categories.
In the 1-3 Years of College category, Latinos were the only racial/ethnic group that did
not experience an increase in average incomes between 1980 and 2012-2016.
According to Table 5.4, the 4 or More Years of College category showed the most signif-
icant increases for all four racial/ethnic groups; however, these increases have varied not only in
total amount, but also in the average incomes of each group. This is significant, for it is an indi-
cation that a college degree does not equate to equal pay for each racial/ethnic group. Non-Latino
Whites experienced the most significant increases, with average incomes increasing by $27,651
in total, going from $59,997 in 1980, to $87,648 in 2012-2016.
According to Table 5.6a, the occupational category with the largest percentages in total,
Operators, Fabricators, and Laborers, also has one of the lowest wages for the workers within it.
Mexican workers had the highest overall percentage, at 26.8%, followed by Other Latino work-
ers at 17.2%, Puerto Rican workers at 14.9%, Cuban workers at 12.1%, and non-Latino workers
at 9%. While still a significant portion, this category has experienced the largest decrease in the
total percentage of the workforce since 1980. The total percentage of the Mexican workforce
decreased from 47.9% in 1980, to 26.8% in 2012-2016; for Puerto Ricans the percentage de-
creased from 43.5% in 1980 to 14.9% in 2012-2016. The percentage for Other Latinos decreased
from 33.5% in 1980, to 17.2% in 2012-2016; Cubans decreased from 27.4% in 1980, to 12.1% in
2012-2016; and non-Latinos decreased from 17.7% in 1980, to 9% in 2012-2016.

24
The highest-paying occupational category, Executive, Administrative, and Manageri-
al Occupations, also had Cubans with the highest percentage of total workers amongst Latino
groups; however, Puerto Rican workers experienced the most significant growth rate between
1980 and 2012-2016. Mexican workers on the other hand, continued to experience low growth
rates during this same time period, and once again had the lowest percentage of the Latino
groups.
According to Table 5.6a, most Latino groups are concentrated in low-paying occupations;
however, Cuban and Other Latino labor forces occupied higher percentages in higher-paying
occupations than the Mexican and Puerto Rican labor forces occupied. The Mexican workforce
in particular, had the highest percentages in the lowest-paying occupations.
Table 5.6b displays the concentration of Mexicans, and Puerto Ricans in occupational
categories with the lowest-paying wages. However, Ecuadorians, Guatemalans, and Other Cen-
tral Americans are in the same position. The vast majority of these groups labor forces are in
low-wage occupations; however higher percentages of Cubans, Colombians, Dominicans, and
Other Central Americans are in higher-paying occupations than the rest of the groups.
Similarly, Table 5.6a, 5.6b shows that Latinos overall were more concentrated in low-
wage occupations in 2012-2016. However, percentages vary significantly for each group. Once
again, Mexicans had the highest percentage of its labor force in low-wage occupations at 86.4%
followed by Guatemalans at 80.1%, Ecuadorians at 77.9%, Other Central Americans at 77.6%,
Puerto Ricans at 75.7%, Dominicans at 61.5%, Cubans at 59.8%, Colombians at 58.9%, and
Other South Americans at 56.2%.
Industry of Latinos by National Group – 1980 to 2012-2016
Table 5.7a displays the Industry of Latinos by National Group, detailing the increases and
decreases in employment of Mexicans, Puerto Ricans, Cubans, and Other Latinos compared to
Non-Latinos from 1980 to 2012-2016. As mentioned in Table 5.3a, Latinos were concentrated in
low-wage industries. However, the industries of Latino concentration changed drastically during
25
this period, with decreases in several industries and increases in several others. The most notable
decrease for Mexicans, Puerto Ricans, Other Latinos, and Non-Latinos was in Manufacturing,
with the percentage of Mexican labor going from 49.3% in 1980 to 19.6% in 2012-2016, Puerto
Rican labor decreasing from 47.5% in 1980 to 8.4% in 2012-2016, Other Latino labor decreasing
from 37.8% in 1980 to 14.6% in 2012-2016, and Non-Latino labor decreasing from 24.5% in
1980 to 9.7% in 2012-2016. For Cubans, however, the largest decrease was from 36.4% in 1980
to 3.2% in 2012-2016. The most notable increases vary depending on the group. For Mexican
workers, the most significant increase was in Retail Trade, going from 14% in 1980, to 23.9% in
2012-2016. For Puerto Rican workers, it was in Entertainment and Recreational Services, in-
creasing from .6% in 1980 to 28.6% in 2012-2016. For Cubans, Other Latinos, and Non-Latinos,
it was in Professional and Related Services, with Cubans increasing from 1.7% in 1980 to 31.4%
in 2012-2016, Other Latinos increasing from 19.3% in 1980 to 26% in 2012-2016, and non-Lati-
nos increasing from 20.2% in 1980 to 33.7% in 2012-206.
Retail Trade is one of the industrial categories with the most significant increases for
several groups. Cuban workers in particular, increased significantly from 7.1% in 1980 to 20.6%
in 2012-2016. Mexican labor increased from 14% in 1980 to 23.9% in 2012-2016, and Other
Latinos increased from 14% in 1980 to 18.6% in 2012-2016. Puerto Ricans and Non-Latinos per-
centages decreased in this industry, however, with Puerto Ricans decreasing from 14.1% in 1980
to 6.7% in 2012-2016, and Non-Latinos decreasing from 17.4% in 1980 to 15.6% in 2012-2016.
The largest percentage of the Mexican labor force is in this industry, and the second-largest per-
centages of the Cuban, Other Latino, and Non-Latino labor forces. The Retail Trade industry is
crucial to Latinos in the region; however, it has the second-lowest wages for Latinos on average.
The industry with the highest wages on average, Finance, Insurance, and Real Estate,
experienced increases for every group. The most significant increase was for Cuban workers that
went from 2.3% in 1980 to 7.5% in 2012-2016.
The thirteen industries are split into the six-lowest, and six-highest paying industries,
with the Mining industry right in the middle. Table 5.7a displays how Latinos are concentrated in

26
the bottom six, with Mexicans, Other Latinos and Puerto Ricans having the highest percentages
in these industries.
Similar to previous tables, in comparison with other groups, Mexicans have the highest
labor force concentrations in the lowest-paying industries. Inversely, Non-Latinos had the highest
percentage in the six-highest paying industries at 61.3%, followed by Cubans at 56.4%, Other
Latinos at 49.1%, Puerto Ricans at 47% (Mining – 3.1%), and Mexicans at 38.4%. These figures
have increased for every group with the exception of Cuban workers.
Detailed Findings
The following tables provide an update of the 1980 data and compare 1980 with 2012-
2016 data, thereby examining the changes to the industrial and occupational conditions for
Latino workers since the publication of Betancur et. Al’s report (The Tables are labeled to be
consistent with the table labels in Betancur et. al.). Tables 5.1 - 5.7b examine changes to the total
percentage of the industrial and occupational share of Latino workers compared to other racial/
ethnic groups, changes in wages compared to other groups, industrial and occupational break-
down by sex, educational attainment, and breakdown by Latino subgroup. Tables 5.6b and 5.7b
were not a part of the original study due to a lack of available data. In 5.6a and 5.7a, the Latino
subgroups are broken into the same categories of Non-Latino, Mexican, Puerto Rican, Cuban
and Other; however, 5.6b and 5.7b were both created to examine the industrial and occupational
positioning of other Latino groups that were not part of the original study, including Ecuadorians,
Guatemalans, Colombians, Dominicans, Other Central Americans, and Other South Americans.
Industrial Distribution of All Earners in the Chicago Metropolitan Area by Race and Latino Group, 1980 and 2012-2016 (in percent)
In 1980, the largest concentration of employed Latino workers was in manufacturing at
47%, a 15% decrease from a peak of 62% in 1970. By the 2012-2016 period, the total concentra-
tion decreased further to 18.2%. Whereas in 1980 manufacturing accounted for the highest total
portion of employed Latino workers, in 2012-2015 it dropped to third behind Retail Trade (23%),

27
Table 5.1 Industrial Distribution of All Earners in the Chicago Metropolitan Area by Race and Latino Group, 1980 and 2012-2016 (in percent)
White (non-His-panic or Latino)
Black (non-His-panic or Latino)
Asian (non-His-panic or Latino)
Hispanic or Latino
1980 2012-2016 1980 2012-
2016 1980 2012-2016 1980 2012-
2016
AGRICULTURE, FORESTRY, AND FISHERIES 0.6% 0.9% 0.2% 0.4% 0.2% 0.3% 1.0% 2.8%
MINING 0.1% 0.0% 0.1% 0.0% 0.1% 0.0% 0.1% 0.0%
CONSTRUCTION 5.1% 5.6% 2.6% 2.1% 1.2% 1.2% 3.5% 6.7%
MANUFACTURING 24.6% 10.1% 24.0% 7.2% 25.8% 11.4% 47.0% 18.2%
TRANSPORTATION, COMMUNICATIONS, AND OTHER PUBLIC UTILITIES
7.6% 7.1% 11.3% 12.1% 3.8% 6.5% 5.8% 6.6%
WHOLESALE TRADE 5.5% 3.3% 2.8% 1.9% 4.5% 3.1% 4.3% 3.4%
RETAIL TRADE 18.2% 15.2% 14.4% 16.3% 15.2% 16.4% 14.1% 23.0%
FINANCE, INSURANCE, AND REAL ESTATE 8.0% 9.1% 5.9% 6.5% 5.9% 8.3% 3.8% 4.3%
BUSINESS AND REPAIR SERVICES 4.2% 7.2% 4.0% 7.6% 2.9% 8.5% 3.2% 9.1%
PERSONAL SERVICES 2.2% 3.2% 4.3% 3.4% 2.4% 4.7% 3.3% 4.3%
ENTERTAINMENT AND RECREATION SERVICES 1.2% 2.0% 0.6% 1.1% 0.6% 0.8% 0.7% 1.3%
PROFESSIONAL AND RELATED SERVICES 19.1% 32.9% 22.8% 35.2% 35.9% 37.2% 11.0% 18.3%
PUBLIC ADMINISTRATION 3.6% 3.2% 7.0% 6.1% 1.5% 1.6% 2.2% 2.1%
Source: PUMS 1980, 2012-2016

28
and Professional and Related Services (18.3%).
Latinos were not the only group that experienced a major decrease in manufacturing since
1970 and 1980; in fact, the manufacturing industry’s portion of the labor force also decreased
for non-Latino Whites, African-Americans, and Asians. For all four groups, the highest total
decrease was in the manufacturing industry. Latinos had the highest total decrease, going from
62% in 1970 to 47% in 1980, to 18.2% in 2012-2016. African-Americans had the next highest
total decrease, dropping from 31.3% in 1970 to 24% in 1980, to 7.2% in 2012-2016. Non-Latino
Whites followed suit, decreasing from 31.1% in 1970 to 24.6% in 1980, to 10.1% in 2012-2016.
Asians, however, were the only population that experienced an increase before a decrease, going
from 22.3% in 1970, to 25.4% in 1980, to 11.4% in 2012-2016. The one constant from 1970 is
that Latinos still have the highest total share of their labor force in manufacturing. African-Amer-
icans, on the contrary, went from having the second-highest concentration in 1970, to having the
lowest in 2012-2016.
The largest increase for Latinos was in Retail Trade, going from 10.4% in 1970 to 14.1%
in 1980, to 23% in 2012-2016, and becoming the largest current total industry for Latinos. Other
groups did not experience the same level of growth; however retail trade also accounted for a
significant portion of each group’s labor force. For Asians (16.4%), African-Americans (16.3%)
and non-Latino Whites (15.2%) it was the second largest industry.
The second largest increase for Latinos has been in Professional and Related Services,
going from 11% in 1980 to 18.3% in 2012-2016. However, all three other groups have a higher
percentage of their labor force in this industry. The overall increase for Asians was not as sub-
stantial as for the other groups, going from 35.9% in 1980 to 37.2% to 2012-2016. For non-Lati-
no Whites and African-Americans, however, the increase was substantial, going from 19.1%
in 1980 to 32.9% in 2012-2016, and from 22.8% in 1980 to 35.2% in 2012-2016 respectively.
Professional and Related Services is the largest industry for non-Latino Whites, African-Ameri-
cans, and Asians.
There has also been an increase for all groups in the Finance, Insurance, and Real Estate

29
Industries (FIRE), which is generally the highest paying industrial sector. For Latinos, however,
the increase has been smaller than for the other groups, increasing from 3.8% in 1980 to 4.3%
in 2012-2016. In comparison, non-Latino Whites increased from 8.0% in 1980 to 9.1% in 2012-
2016; Asians increased the most from 5.9% in 1980 to 8.3% in 2012-2016; and African-Ameri-
cans increased slightly more than Latinos going from 5.9% in 1980 to 6.5% in 2012-2016.
The next largest increase for Latinos was in the Business and Repair Services industry,
going from 3.2% in 1980 to 9.1% in 2012-2016, the largest increase among all of the groups.
There was also a significant increase for Asians, going from 2.9% in 1980 to 8.5% in 2012-2016.
African-Americans also increased from 4.0% in 1980 to 7.6% in 2012-2016. Non-Latino Whites
increased from 4.2% in 1980 to 7.2%.
The Construction industry’s share of Latino labor also increased from 3.5% in 1980, to
6.7% in 2012-2016, also the largest among all groups. Non-Latino Whites were the only other
group that increased, going from 5.1% in 1980 to 5.6% in 2012-2016. African-American’s share
in the industry decreased from 2.6% in 1980 to 2.1% in 2012-2016. Asian’s remained the same at
1.2% in both instances.
The industrial share of Transportation, Communication, and Other Public Utilities also
increased for Latinos, Asians, and African-Americans, but decreased for non-Latino Whites. For
Latinos, the increase was from 5.8% in 1980 to 6.6% in 2012-2016. Asians had the highest in-
crease going from 3.8% in 1980 to 6.5% in 2012-2016. African-Americans increased from 11.3%
in 1980 to 12.1% in 2012-2016, and had the highest total share of the labor force in this industry.
Non-Latino Whites were the only group that decreased, going from 7.6% in 1980 to 7.1% in
2012-2016, but remained higher overall than Latinos and Asians.
The Agriculture, Forestry, and Fishing industries, which is the lowest paying industry,
also increased for Latinos, going from 1.0% in 1980 to 2.8% in 2012-2016. In comparison,
non-Latino Whites increased from 0.6% in 1980 to 0.9% in 2012-2016, African-Americans
increased from 0.2% in 1980 to 0.4% in 2012-2016, and Asians increased from 0.2% in 1980 to
0.3% in 2012-2016. It is important to note that Latinos are the only group with more than 1% if

30
Table 5.2 Occupational Distribution for All Earners in the Chicago Metropolitan Area by Racial or Latino Group. 1980 and 2012-2016 (in percent)
White (non-His-panic or Latino)
Black (non-His-panic or Latino)
Asian (non-His-panic or Latino)
Hispanic or Latino
Occupation 1980 2012-2016 1980 2012-
2016 1980 2012-2016 1980 2012-
2016
Executive, Administrative, and Managerial Occupations: 9.2% 13.1% 3.4% 6.6% 5.8% 10.2% 2.7% 4.7%
Management Related Occupations: 3.2% 6.3% 1.7% 3.9% 4.0% 7.0% 1.0% 2.3%
Professional Specialty Occupations 12.4% 22.8% 8.2% 14.6% 26.0% 29.6% 4.4% 8.1%
Technicians and Related Support Occupations 2.8% 3.4% 2.6% 2.8% 7.2% 8.3% 1.3% 1.7%
Sales Occupations: 12.1% 12.4% 6.7% 10.3% 6.5% 9.6% 5.5% 9.2%
Administrative Support Occupations, Including Clerical
21.3% 14.3% 22.6% 17.7% 16.7% 10.3% 14.6% 13.0%
Service Occupations 11.2% 12.2% 20.2% 24.5% 11.6% 13.5% 14.7% 23.5%
Farming, Forestry and Fishing Occupations 0.6% 0.9% 0.4% 0.6% 0.3% 0.2% 1.0% 3.0%
Precision Production, Craft, and Repair Occupations 11.5% 6.9% 7.2% 4.2% 5.9% 3.6% 10.6% 10.1%
Operators, Fabricators, and Laborers 15.7% 7.6% 27.0% 14.5% 16.1% 7.7% 44.4% 24.4%
Source: PUMS 1980, 2012-2016

31
its labor force in this industry.
Occupational Distribution for All Earners in the Chicago Metropolitan Area by Racial or Latino Group. 1980 and 2012-2016 (in percent)
Similar to 1980, the largest share of the Latino labor force worked as Operators, Fabrica-
tors, and Laborers at 24.4%. The largest occupational decrease (Table 5.2) in the manufacturing
industry from 1980 to 2012-2016 was in the category Operators, Fabricators, and Laborers. In
1980, 44.4% of the Latino labor force was in these occupations, in comparison to 27% of Afri-
can-Americans, 16.1% of Asians, and 15.7% of non-Latino Whites. In 2012-2016, these percent-
ages decreased to 24.4%, 14.5%, 7.7% and 7.6% respectively.
For Latinos, the most significant increase was in Service Occupations, going from 14.7%
in 1980, to 23.5% in 2012-2016, making it the second largest occupation for Latinos in the
metropolitan area. This increase of nearly 9% is significant for many reasons, most notably the
fact that it has nearly become the largest occupation for Latinos and also because it has the sec-
ond-lowest wages of all the categories. In comparison, African-Americans increased from 20.2%
in 1980 to 24.5% in 2012-2016; Asians increased from 13.5% in 1980 to 14.7% in 2012-2016;
and non-Latino Whites increased from 11.2% in 1980, to 12.2% in 2012-2016.
The next largest occupation for Latinos was Administrative Support Occupations, which
also includes Clerical employment. However, there was a decrease from 14.6% in 1980 to 13.0%
in 2012-2016. In comparison, non-Latino Whites decreased from 21.3% in 1980 to 14.3% in
2012-2016; African-Americans decreased from 22.6% in 1980 to 17.7% in 2012-2016; and
Asians decreased from 16.7% in 1980 to 10.3% in 2012-2016.
Precision Production, Craft, and Repair are the next largest occupations for Latinos.
There was also a decrease, however, going from 10.6% in 1980 to 10.1% in 2012-2016. All three
other groups also decreased, with non-Latino Whites going from 11.5% in 1980 to 6.9% in 2012-
2016; African-Americans going from 7.2% in 1980 to 4.2% in 2012-2016; and Asians going
from 5.9% in 1980 to 3.6% in 2012-2016.
Latinos experienced increases in several other occupations including Sales, Professional

32
Specialty, and Executive, Administrative, and Managerial Occupations. Sales occupations ac-
count for the highest percentage with 9.2% in 2012-2016, an increase from 5.5% in 1980. All
other groups increased as well, with non-Latino Whites going from 12.1% in 1980 to 12.4% in
2012-2016, African-Americans going from 6.7% in 1980 to 10.3% in 2012-2016, and Asians
going from 6.5% in 1980 to 9.6& in 2012-2016. Latinos occupied in Professional Specialty in-
creased from 4.4% in 1980 to 8.1% in 2012-2016. All other groups also increased, with non-Lati-
no Whites going from 12.4% in 1980 to 22.8% in 2012-2016, African-Americans increasing
from 8.2% in 1980 to 14.6% in 2012-2016, and Asians going from 26% in 1980 to 29.6% in
2012-2016.
The share of Latinos in Executive, Administrative, and Managerial Occupations, which
are the highest paying, also increased its share of Latinos going from 2.7% in 1980 to 4.7% in
2012-2016. However, this is still lower than for all other groups. Non-Latinos Whites increased
from 9.2% in 1980 to 13.1% in 2012-2016; Asians increased from 5.8% in 1980 to 10.2% in
2012-2016; and African-Americans increased from 3.4% in 1980 to 6.6% in 2012-2016.
The second highest paying occupation category, Management Related Occupations, also
increased its share of Latinos slightly going from 1% in 1980 to 2.3% in 2012-2016. Non-Latino
Whites increased from 3.2% in 1980 to 6.3% in 2012-2016; Asians increased from 4% in 1980 to
7% in 2012-2016; and African-Americans increased from 1.7% in 1980 to 3.9% in 2012-2016.
Latinos also increased in the lowest-paying occupational category of Farming, Forestry
and Fishing, going from 1% in 1980 to 3% in 2012-2016. Similar to Table 5.1, no other group
has more than 1 percent of its labor force in this category. Non-Latino Whites are close to 1 per-
cent, going from 0.6% in 1980 to 0.9% in 2012-2016. African-Americans increased from 0.4% in
1980 to 0.6% in 2012-2016. Asians were the only group to decrease, going from 0.3% in 1980, to
0.2% in 2012-2016.
Similar to 1980, Latinos and African-Americans are overrepresented in the lowest paying
sectors and, although increasing their presence in some of the higher paying sectors, they re-
ceived lower rates also in these sectors.
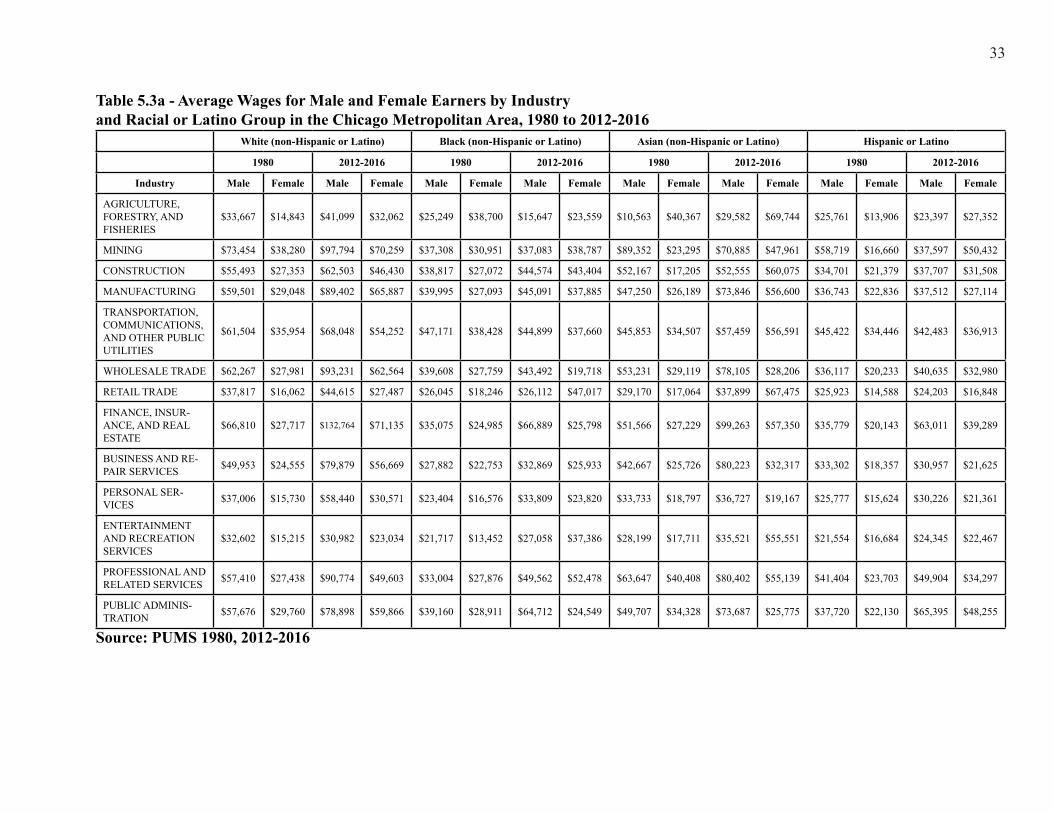
33
Table 5.3a - Average Wages for Male and Female Earners by Industry and Racial or Latino Group in the Chicago Metropolitan Area, 1980 to 2012-2016
White (non-Hispanic or Latino) Black (non-Hispanic or Latino) Asian (non-Hispanic or Latino) Hispanic or Latino
1980 2012-2016 1980 2012-2016 1980 2012-2016 1980 2012-2016
Industry Male Female Male Female Male Female Male Female Male Female Male Female Male Female Male Female
AGRICULTURE, FORESTRY, AND FISHERIES
$33,667 $14,843 $41,099 $32,062 $25,249 $38,700 $15,647 $23,559 $10,563 $40,367 $29,582 $69,744 $25,761 $13,906 $23,397 $27,352
MINING $73,454 $38,280 $97,794 $70,259 $37,308 $30,951 $37,083 $38,787 $89,352 $23,295 $70,885 $47,961 $58,719 $16,660 $37,597 $50,432
CONSTRUCTION $55,493 $27,353 $62,503 $46,430 $38,817 $27,072 $44,574 $43,404 $52,167 $17,205 $52,555 $60,075 $34,701 $21,379 $37,707 $31,508
MANUFACTURING $59,501 $29,048 $89,402 $65,887 $39,995 $27,093 $45,091 $37,885 $47,250 $26,189 $73,846 $56,600 $36,743 $22,836 $37,512 $27,114
TRANSPORTATION, COMMUNICATIONS, AND OTHER PUBLIC UTILITIES
$61,504 $35,954 $68,048 $54,252 $47,171 $38,428 $44,899 $37,660 $45,853 $34,507 $57,459 $56,591 $45,422 $34,446 $42,483 $36,913
WHOLESALE TRADE $62,267 $27,981 $93,231 $62,564 $39,608 $27,759 $43,492 $19,718 $53,231 $29,119 $78,105 $28,206 $36,117 $20,233 $40,635 $32,980
RETAIL TRADE $37,817 $16,062 $44,615 $27,487 $26,045 $18,246 $26,112 $47,017 $29,170 $17,064 $37,899 $67,475 $25,923 $14,588 $24,203 $16,848
FINANCE, INSUR-ANCE, AND REAL ESTATE
$66,810 $27,717 $132,764 $71,135 $35,075 $24,985 $66,889 $25,798 $51,566 $27,229 $99,263 $57,350 $35,779 $20,143 $63,011 $39,289
BUSINESS AND RE-PAIR SERVICES $49,953 $24,555 $79,879 $56,669 $27,882 $22,753 $32,869 $25,933 $42,667 $25,726 $80,223 $32,317 $33,302 $18,357 $30,957 $21,625
PERSONAL SER-VICES $37,006 $15,730 $58,440 $30,571 $23,404 $16,576 $33,809 $23,820 $33,733 $18,797 $36,727 $19,167 $25,777 $15,624 $30,226 $21,361
ENTERTAINMENT AND RECREATION SERVICES
$32,602 $15,215 $30,982 $23,034 $21,717 $13,452 $27,058 $37,386 $28,199 $17,711 $35,521 $55,551 $21,554 $16,684 $24,345 $22,467
PROFESSIONAL AND RELATED SERVICES $57,410 $27,438 $90,774 $49,603 $33,004 $27,876 $49,562 $52,478 $63,647 $40,408 $80,402 $55,139 $41,404 $23,703 $49,904 $34,297
PUBLIC ADMINIS-TRATION $57,676 $29,760 $78,898 $59,866 $39,160 $28,911 $64,712 $24,549 $49,707 $34,328 $73,687 $25,775 $37,720 $22,130 $65,395 $48,255
Source: PUMS 1980, 2012-2016

34
Figure 1 – Average Wages for Latino Earners by Industry, 2012-2016
Figure 2 – Average Wages for Latina Earners by Industry, 2012-2016

35
Average Wages for Male and Female Earners by Industry and Racial or Latino Group in the Chi-cago Metropolitan Area, 1980 to 2012-2016
The industry with the largest percentage of Latino workers, Retail Trade, also has the
second-lowest wages for male workers, and the lowest-wages for female workers. In 2012-2016,
Latinos earned $24,203 and Latinas $16,848, compared to $44,615 for non-Latino White males
and $27,487 for non-Latino White females, $26,112 for African-American males, $47,017 for
African-American females, $37,899 for Asian males, and $67,475 for Asian females. While Lati-
nos have a larger share of their labor force in the Retail Trade industry, their wages are lower for
both men and women in comparison to other racial/ethnic groups. Additionally, while there has
been substantial growth for Latinos in this industry, wages have decreased from $25,923 in 1980,
to $24,203 in 2012-2016 for Latinos while increasing slightly from $14,588 in 1980 to $16,848
in 2012-2016 for Latinas. It is important to note that the cost of living has increased during this
time making these figures much more alarming.
Professional and Related Services is the second largest industry of employment for Lati-
nos and has the third-highest wages on average for male workers and the fifth-highest for female
workers. In 2012-2016, Latinos earned $49,904 and Latinas $34,297, compared to $90,774 for
non-Latino White males, $49,603 for non-Latina White females, $49,562 for African-American
males, $52,478 for African-American females, $80,402 for Asian males, and $55,139 for Asian
females. While the second largest industry for Latinos (18.3%), Asian (37.2%), African-Amer-
ican (35.2%) and non-Latino Whites (32.9%) have nearly double the percentage of their labor
force in this industry. Additionally, wages for Latinos and African-American males are roughly
the same, but well below their non-Latino White and Asian male counterparts. Similarly, Latinas
earn far lower wages than their non-Latina White, Asian, and African-American female counter-
parts. However, there has been an increase in the wages of Latinos as a whole, with males going
from $41,404 in 1980 to $49,904 in 2012-2016 and females from $23,703 in 1980 to $34,297 in
2012-2016—although these increases are lower than those of other racial/ethnic groups during
the same period.
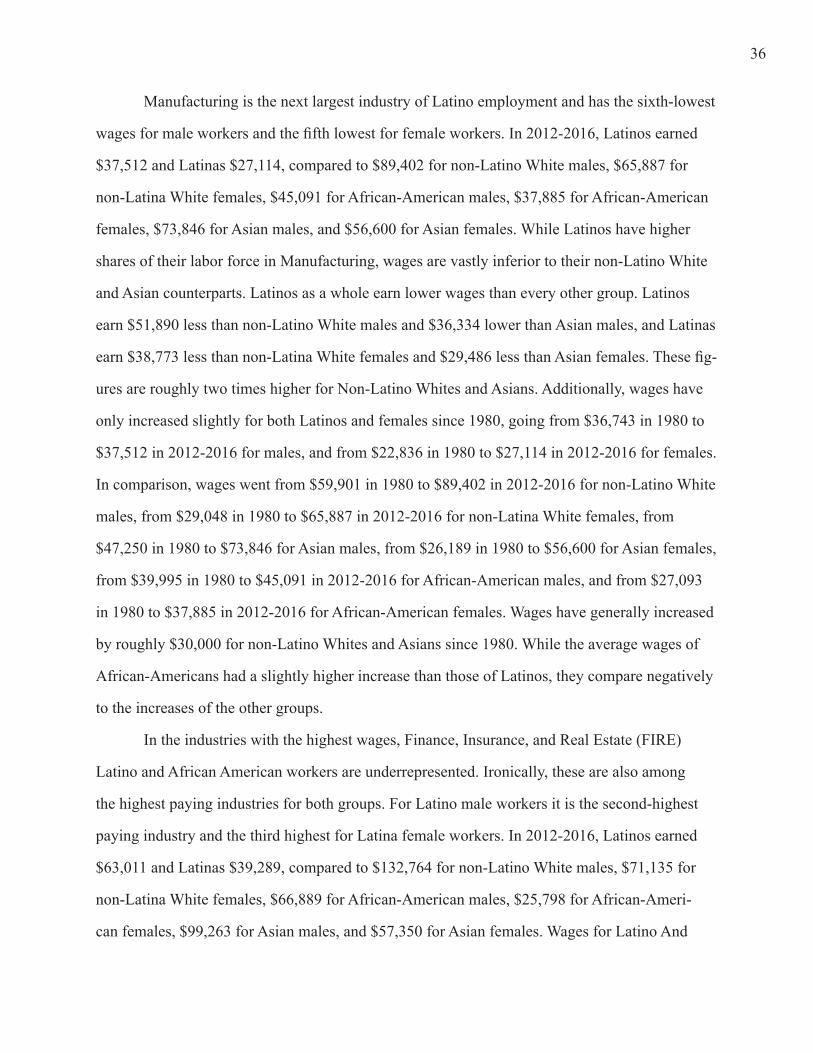
36
Manufacturing is the next largest industry of Latino employment and has the sixth-lowest
wages for male workers and the fifth lowest for female workers. In 2012-2016, Latinos earned
$37,512 and Latinas $27,114, compared to $89,402 for non-Latino White males, $65,887 for
non-Latina White females, $45,091 for African-American males, $37,885 for African-American
females, $73,846 for Asian males, and $56,600 for Asian females. While Latinos have higher
shares of their labor force in Manufacturing, wages are vastly inferior to their non-Latino White
and Asian counterparts. Latinos as a whole earn lower wages than every other group. Latinos
earn $51,890 less than non-Latino White males and $36,334 lower than Asian males, and Latinas
earn $38,773 less than non-Latina White females and $29,486 less than Asian females. These fig-
ures are roughly two times higher for Non-Latino Whites and Asians. Additionally, wages have
only increased slightly for both Latinos and females since 1980, going from $36,743 in 1980 to
$37,512 in 2012-2016 for males, and from $22,836 in 1980 to $27,114 in 2012-2016 for females.
In comparison, wages went from $59,901 in 1980 to $89,402 in 2012-2016 for non-Latino White
males, from $29,048 in 1980 to $65,887 in 2012-2016 for non-Latina White females, from
$47,250 in 1980 to $73,846 for Asian males, from $26,189 in 1980 to $56,600 for Asian females,
from $39,995 in 1980 to $45,091 in 2012-2016 for African-American males, and from $27,093
in 1980 to $37,885 in 2012-2016 for African-American females. Wages have generally increased
by roughly $30,000 for non-Latino Whites and Asians since 1980. While the average wages of
African-Americans had a slightly higher increase than those of Latinos, they compare negatively
to the increases of the other groups.
In the industries with the highest wages, Finance, Insurance, and Real Estate (FIRE)
Latino and African American workers are underrepresented. Ironically, these are also among
the highest paying industries for both groups. For Latino male workers it is the second-highest
paying industry and the third highest for Latina female workers. In 2012-2016, Latinos earned
$63,011 and Latinas $39,289, compared to $132,764 for non-Latino White males, $71,135 for
non-Latina White females, $66,889 for African-American males, $25,798 for African-Ameri-
can females, $99,263 for Asian males, and $57,350 for Asian females. Wages for Latino And

37
African-American male and female workers are vastly inferior to the wages of their non-Latino
White and Asian counterparts. Latinos earned $69,753 less than non-Latino White males, and
$36,252 less than Asian males, while Latinas earned $31,846 less than non-Latina Whites and
$18,061 less than Asian females. Wages have increased significantly for Latinos as a group,
however, with wages for Latinos going from $35,779 in 1980 to $63,011 in 2012-2016 and for
females from $20,143 in 1980 to $39,289 in 2012-2016. Still, their wages are far lower than
those of non-Latino Whites and Asians.
One of the fastest growing industries for Latino workers, Business and Repair Services,
also show differences vis-à-vis other groups. For Latino male workers it is the fifth-lowest
paying industry, and for Latina female workers the third lowest. In 2012-2016, Latinos earned
$30,957 and Latinas $21,625, compared to $79,879 for non-Latino White males, $56,669 for
non-Latina White females, $80,223 for Asian males, $32,317 for Asian females, $32,869 for Af-
rican-American males, and $25,933 for African-American females. As in other industries, there
are major discrepancies between the wages of non-Latino Whites and Asians and the wages of
African-Americans and Latinos. Latinos earned $48,922 less than non-Latino White males, and
$49,266 less than Asian men, while Latinas earned $35,044 less than non-Latina White females
and $10,692 less than Asian females. Furthermore, wages in t his industry have decreased for
Latinos from $33,302 in 1980 to $30,957 in 2012-2016—although slightly increasing for Latinas
by $3,268, which is concerning considering that this industry grew by roughly 6% during this
same period.
In the construction industry, Latinos also have a larger share of their labor force com-
pared to other groups. For Latino male workers this it is the sixth-highest paying industry and for
Latina female workers the seventh-highest. In 2012-2016, Latinos earned $37,707 and Latinas
earned $31,508, compared to $62,503 for non-Latino White males, $46,430 for non-Latina White
females, $44,574 for African-American males, $43,404 for African-American females, $52,555
for Asian males, and $60,075 for Asian females. As in other industries, non-Latino White males
and females have and continue earning significantly more than Latinos and females. Despite be-

38
ing the majority in this industry, Latinos earn $24,796 less than non-Latino White males, $14,848
less than Asian men and $6,867 less than African-American men, while Latinas earn $14,922
less than non-Latina White females, $28,567 less than Asian females and $11,896 less than
African-American females. Additionally, Latino male wages have only increased by $3,006 from
1980 to 2012-2016, while Latina female wages have increased by $10,129 during this same pe-
riod. Although wages did not increase significantly for any male group, however, they increased
substantially for female workers. Asian female wages increased by $42,970, non-Latina White
female wages by $19,077 and African-American female wages by $16,332.
The industries of Transportation, Communication, and Other Public Utilities also account
for a fair share of Latino employment while representing the fourth-highest wages for Latino
male workers and the fourth highest for Latina female workers. In 2012-2016, Latino male wag-
es were at $42,483 and Latinas at $36,913, compared to $68,048 for non-Latino White males,
$54,252 for non-Latina White females, $44,899 for African-American males, $37,660 for Afri-
can-American females, $57,459 for Asian males, and $56,591 for Asian females. Although Lati-
nos do not have the largest share of their labor force in this industry, as a group they continue to
earn lower wages than other groups but principally than non-Latino Whites and Asians. Latinos
earn $25,565 less than non-Latino White males and $14,976 less than Asian men, while Latinas
earn $20,038 less than Asian females and $17,339 less than non-Latina White females.
Agriculture, Forestry, and Fisheries are other industries in which Latinos have a larger
share of labor force participation. Yet, compared to other groups, Latinos received the lowest
wages and Latinas the sixth lowest. Along with mining, in this industry Latina female work-
ers earn more than Latino male workers do. In 2012-2016, Latinos earned $23,397 and Lati-
nas $27,352, compared to $41,099 for non-Latino White males, $32,062 for non-Latina White
females, $15,647 for African-American males, $23,559 for African-American females, $29,582
for Asian males, and $69,744 for Asian females. While wages are not high for any group, Latinos
and females continue to earn less than non-Latino White and Asian males and females. Latinos
earn $17,702 less than non-Latino White males and $6,185 less than Asian males, while Latinas

39
earn $42,392 less than Asian females and $4,710 less than non-Latina White females.
The other industry that has experienced an increase in wages for Latino male and Latina
female workers is Public Administration with the highest-paying wages for Latino male workers
and the second-highest paying wages for Latina workers. In 2012-2016, Latinos earned $65,395
and Latinas $48,255, compared to $78,898 for non-Latino White males, $59,866 for non-Latina
White females, $64,712 for African-American males, $24,549 for African-American females,
$73,687 for Asian females, and $25,775 for Asian females. Again, similar to other industries,
wages for Latino and African-American males were lower than for non-Latino White and Asian
males. In three industries, the wages of African-American females are higher than the wages of
non-Latina White females and one industry in which they are higher than Asian females.
Latinas have higher wages than Asian females in four industries; however, no single in-
dustry has higher wages for Latinas than for non-Latina White females. Additionally, Public Ad-
ministration is one of only three industries that pay higher wages to Latino male workers than to
non-Latina White female workers and one of four that pays higher wages to Latino male workers
than to Asian female workers. In this industry, Latinos earn $13,503 less than non-Latino White
males and $8,292 less than Asian males, while Latinas earn $11,611 less than non-Latina White
females, but earn more than Asian females. Still, as the highest paying industry for Latinos, the
fact that only 2.1% of the total labor force is participating in this industry means that very few
people are actually earning such wages.
Taking into consideration that Latino participation in the other highest pay industry,
FIRE, is 4.3%, only 6.4% of Latinos are averaging annual wages over $60,000. In three addi-
tional industries accounting for 28.3% of Latino participation, Latinos earn more than $40,000
annually. Then, 38% of Latinos in the workforce make between $30,000 and $40,000 annually.
The remaining 27.1 percent are concentrated in three industries where they earn under $25,000
annually. Average annual wages for Latinas, are lower overall and in none of the industries did
they make more than $60,000. Only in one industry in which 0.1% of them work, did they make
more than $50,000. A second industry with 2.1% of employed Latinas averaged over $40,000. In

40
five industries employing 39.3% of them, Latinas earn an average annual wage between $30,000
and $40,000. Twenty-one percent of them made average wages between $25,000 and $30,000 in
two industries. Three industries employing 14.7% of Latinas, paid them averages wages between
$20,000 and $25,000, and one industry employing 23% of all working Latinas, paid them and
average below $20,000. Despite the terrible condition of Latino male workers, the compensation
of Latinas is an even worse concern.
Average Wages for Male and Female Earners by Occupation and Racial or Latino Group in the Chicago Metropolitan Area, 1980 to 2012-2016
The occupation with the largest percentage of Latino workers, Operators, Fabricators, and
Laborers, is also one of the lowest-paying occupations overall. It had the fourth-lowest wages
for Latino male workers and the third lowest for Latina female workers. In 2012-2016, Latinos
earned $31,086 and Latinas earned $19,849, compared to $40,161 for non-Latino White males,
$27,002 for non-Latina White females, $34,561 for African-American males, $25,466 for Af-
rican-American females, $32,042 for Asian males, and $24,415 for Asian females. As was the
case of Table 5.3a, Table 5.3b shows that Latinos as a group earned lower wages than the other
groups. This is extremely concerning considering Latinos have a higher share of their labor force
participation in this occupation. Additionally, during the same period in which the total percent-
age of Latinos in the occupation decreased, wages also decreased going from $34,020 in 1980 to
$31,086 in 2012-2016 for Latinos, and from $21,432 in 1980 to $19,849 in 2012-2016 for Lati-
nas. Again, the cost of living and inflation increased significantly during this same time period,
making the fact that nearly a quarter of the total Latino labor force is decreasing its earnings all
the more concerning.
The occupation with the next highest percentage of the Latino labor force, Services, has
lower wages than Operators, Fabricators, and Laborers. It had the second-lowest wages for Lati-
no male workers and the lowest-paying wages for Latina female workers. In 2012-2016, Latinos
earned $25,979 and Latinas earned $18,386, compared to $38,175 for non-Latino White males,
$20,719 for non-Latina White females, $30,892 for African-American males, $22,151 for Afri-

41
Table 5.3b - Average Wages for Male and Female Earners by Occupation and Racial or Latino Group in the Chicago Metropolitan Area, 1980 to 2012-2016
White (non-Hispanic or Latino) Black (non-Hispanic or Latino) Asian (non-Hispanic or Latino) Hispanic or Latino
1980 2012-2016 1980 2012-2016 1980 2012-2016 1980 2012-2016
Occupation Male Female Male Female Male Female Male Female Male Female Male Female Male Female Male Female
Executive, Administrative, and Managerial Occupations:
$87,823 $41,719 $130,351 $87,100 $56,318 $40,013 $77,601 $64,126 $71,470 $32,832 $107,055 $72,873 $55,616 $32,431 $73,608 $57,262
Management Related Occupations:
$68,684 $36,600 $114,607 $72,574 $45,675 $35,448 $69,856 $58,434 $50,884 $34,099 $95,660 $64,593 $54,477 $31,583 $64,616 $50,716
Professional Specialty Occupations
$67,117 $33,708 $96,084 $55,649 $45,870 $37,472 $66,351 $51,963 $73,037 $50,090 $90,370 $69,111 $57,739 $31,308 $64,561 $45,734
Technicians and Related Support Occupations
$51,243 $30,094 $80,672 $49,676 $40,907 $29,924 $53,701 $45,189 $45,724 $34,767 $79,035 $63,498 $46,338 $30,900 $56,460 $41,870
Sales Occupations: $60,212 $17,628 $88,745 $44,145 $34,101 $17,404 $36,105 $23,102 $39,111 $18,147 $56,729 $35,318 $30,805 $12,637 $35,291 $19,487
Administrative Support Occupations, Including Clerical
$43,279 $24,886 $48,186 $35,975 $35,322 $26,856 $32,915 $32,400 $31,902 $25,288 $34,505 $32,361 $31,782 $22,343 $30,527 $28,910
Service Occupations $31,936 $14,589 $38,175 $20,719 $26,388 $18,951 $30,892 $22,151 $23,074 $20,434 $25,218 $26,035 $25,162 $16,991 $25,979 $18,386
Farming, Forestry and Fishing Occupations
$26,328 $13,023 $28,519 $18,844 $22,508 $31,023 $21,208 $12,148 $24,677 $48,830 $28,026 $16,018 $22,580 $15,237 $22,370 $21,148
Precision Production, Craft, and Repair Occupations
$55,672 $30,686 $56,359 $33,231 $44,734 $29,256 $48,096 $35,595 $47,135 $25,837 $49,462 $29,858 $42,662 $25,329 $39,284 $26,134
Operators, Fabricators, and Laborers
$42,059 $23,129 $40,161 $27,002 $36,953 $24,854 $34,561 $25,466 $33,555 $21,629 $32,042 $24,415 $34,020 $21,432 $31,086 $19,849
Source: PUMS 1980, 2012-2016

42
Figure 3 – Average Wages for Latino Earners by Occupation, 2012-2016
Figure 4 – Average Wages for Latina Earners by Occupation, 2012-2016

43
can-American females, $25, 218 for Asian males, and $26,035 for Asian females. While wages
are low for all four groups, they are slightly lower overall for Latinos and African-Americans,
both with much larger shares of their labor forces in this category. Additionally, while participa-
tion rates for Latinos have increased substantially since 1980, wages have only increased slightly
during this same period. Wages increased from $25,162 in 1980 to $25,979 in 2012-2016 for
Latinos, and from $16,991 in 1980 to $18,386 in 2012-2016 for Latinas. This will continue to be
an issue if the growth of the service sector continues growing as it has in recent decades.
The next largest occupation for Latinos, Administrative Support Occupations, Including
Clerical, also displays low wages for both males and females. It was the third-lowest paying
occupation for Latino male workers and, although average wages were under $30,000, it was
the fifth-highest paying occupation for Latina workers. In 2012-2016, Latinos earned $30,527
and Latinas $28,910, compared to $48,186 for non-Latino White males, $35,975 for non-Latina
White females, $32,915 for African-American males, $32,400 for African-American females,
$34,505 for Asian males, and $32,361 for Asian females. While wages are not high for any
group, non-Latino Whites as a group make more than all three other groups. Wages, however,
have decreased for Latinos from $31,782 in 1980 to $30,527 in 2012-2016. They have increased
for Latinas during the same time period, going from $22,343 in 1980 to $28,910 in 2012-2016.
While not a significant increase, there has been progress for Latinas. For Latinos, however, a
decrease in wages has coincided with an overall decrease in the rates of Latino participation in
this industry.
Precision Production, Craft, and Repair Occupations also constitute a large share of the
Latino labor force: this was the fifth-highest paying occupation for Latino male workers but the
fifth-lowest for Latina female workers. In 2012-2016, Latino male average wages were $39,284,
and Latina female $26,134, compared to $56,359 for non-Latino White males, $33,231 for
non-Latina White females, $48,096 for African-American males, $35,595 for African-American
females, $49,462 for Asian males, and $29,858 for Asian females. Similar to other occupations,
Latinos as a group earn lower wages and Latinas are the lowest of all the groups. Also similar

44
to Administrative Support occupations and to Operators, Fabricators, and Laborers, participa-
tion rates as a whole have decreased in correlation with a decrease in wages for Latinos and an
increase in wages for Latinas between 1980 and 2012-2016. Wages decreased from $42,662 in
1980 to $39,284 for Latinos, and increased from $25,329 in 1980 to $26,134 in 2012-2015 for
Latinas.
Sales Occupations also account for a large portion of the Latino labor force, which has in-
creased its share by roughly 4% since 1980. However, wages were low for both male and female
Latino workers. This was the fifth-lowest paying sector for Latino male workers and the second
lowest for Latina female workers. In 2012-2016, Latinos averaged $35,291 in wages and Latinas
averaged $19,487, compared to $88,745 for non-Latino White males, $44,145 for non-Latina
White females, $36,105 for African-American males, $23,102 for African-American females,
$56,729 for Asian males, and $35,318 for Asian females. As in other occupations, average wages
for Latinos as a group are below the wages of their counterparts. Wages have increased, however,
for Latinos as a group from 1980 to 2012-2016. Latinos went from $30,805 in 1980 to $35,291
in 2012-2016, and Latinas from $12,637 in 1980 to $19,487 in 2012-2016.
Professional Specialty was the next largest occupational category of Latino employment
increasingly roughly by 4% since 1980. This is among the highest paying occupations, however,
averaging the third-highest wages for both Latinos and Latinas. In 2012-2016, Latinos aver-
aged $64,561 and Latinas averaged $45,734, compared to $96,084 for non-Latino White males,
$55,649 for non-Latina White females, $66,351 for African-American males, $51,963 for Afri-
can-American females, $90,370 for Asian males, and $69,111 for Asian females. While Latinos
as a whole have wages below everyone else and Latinas occupy the lowest position, both Latinos
and African-Americans as a whole average wages well below those of their non-Latino White
and Asian counterparts. Wages have increased, however, for Latinos and Latinas between 1980
and 2012-2016—Latinos wages increased from $57,739 in 1980 to $64,561 in 2012-2016 and
Latinas wages increased from $31,308 in 1980 to $45,734 in 2012-2016.
The occupational category with the highest overall wages for all groups is Executive,

45
Administrative, and Managerial. This category had the highest wages for Latinos and Latinas and
an increase of 2% in the share of Latino employment since 1980 accounting for just under 5%
of the total Latino labor force. In 2012-2016, Latinos averaged $73,608 annual wages and Lati-
nas $57,262, compared to $130,351 for non-Latino White males, $87,100 for non-Latina White
females, $77,601 for African-American males, $64,126 for African-American females, $107,055
for Asian males, and $72,873 for Asian females.
While the highest wages for Latinos are in Executive, Administrative and Managerial
occupations, they continue to earn wages below those of other groups. Additionally, Latino and
African-Americans as a whole continue to earn substantially less than their non-Latino White
and Asian counterparts. Furthermore, both Latinos and African-Americans have much lower
rates of participation in these occupations; this implies that fewer people in these two groups are
earning high wages in comparison to non-Latino Whites and Asians. Still, wages have increased
for Latinos and females from 1980 to 2012-2016: Latinos wages went from $55,616 in 1980 to
$73,608 and Latina female wages from $32,431 in 1980 to $57,262 in 2012-2016. While prog-
ress has been made, both Latinos and African-Americans need to increase their shares in employ-
ment in these occupations. Additionally, wages need to be increased to be on par with non-Latino
Whites and Asians.
Management Related is the occupational category with the second-highest wages for all
groups. This category had the second-highest wages for Latinos and Latinas, whose shares in-
creased its share by roughly 1.2% since 1980. In 2012-2016, Latino male workers averaged wag-
es of $64,616 and Latina female workers averaged $50,716, compared to $114,607 for non-Lati-
no White males, $72,574 for non-Latina White females, $69,856 for African-American males,
$58,434 for African-American females, $95,660 for Asian males, and $64,593 for Asian females.
Once again, Latinos as a whole earned lower average wages than all other groups. Latinos and
African-Americans continue to average lower overall wages than their non-Latino White and
Asian counterparts also in this category. This is the same case in every occupational category.
Latinas also continue to average lower wages than every other group. Wages have increased for

46
Latinos since 1980, going from $54,477 in 1980 to $64,616 in 2012-2016 for Latinos, and from
$32,431 in 1980 to $50,716 in 2012-2016 for Latinas. While these increases are positive, it is
important to note that only 2.3% of the total Latino labor force works in this category. Therefore,
the amount of people earning high wages in this occupational category is minimal and dispropor-
tionate when compared to other groups.
The occupations that are among the lowest paying are Farming, Forestry, and Fishing.
Latinos had the lowest wages of any category and Latinas the fourth lowest. The share of Lati-
nos in this category grew by 2% as a share of the Latino labor force becoming 3% of the total.
In 2012-2016, Latinos averaged wages of $22,370 and Latinas averaged $21,148, compared to
$28,519 for non-Latino White males, $18,844 for non-Latina White females, $21,208 for Af-
rican-American males, $12,148 for African-American females, $28,026 for Asian males, and
$16,018 for Asian females. Although wages are low for all groups, this is the only category in
which non-Latina White and Asian females earn lower average wages than Latinas. Regardless
of this, wages are still low for Latinos as a whole while decreasing slightly for Latinos and in-
creasing but Latinas. In 1980, Latinos averaged $22,580 in wages and in 2012-2016 $22,370. For
Latinas, wages increased from $15,237 in 1980 to $21,148 in 2012-2016.
Table 5.3b shows Latinos’ disproportionate concentration in low-wage occupations and
their lack representation in high-wage occupations. Only 7% of the Latino labor force worked
in the two highest paying occupational categories, compared to 19.4% of the non-Latino White
labor force, 17.2% of the Asian labor force, and 10.5% of the African-American labor force. The
next highest paying category had an 8.1% share of the Latino labor force, compared to 29.65%
of the Asian, 22.8% of the non-Latino White, and 14.6% of the African-American labor forces.
The five largest occupational categories for Latinos with 80% of their labor force have average
annual wages below $40,000 testifying to the bottom position of Latino workers in the employ-
ment scale.
Out of 10 occupational categories, three categories had average wages over $60,000 for
Latinos compared to zero categories for Latinas. One category had wages between $50,000 and

47
$60,000 for Latinos compared to two categories for Latinas. Latinos did not have any occupa-
tions with averages wages between $40,000 and $50,000 but Latinas had two. Four categories
had wages between $30,000 and $40,000 for Latinos and none for Latinas. Two categories had
averages between $20,000 and $30,000 for Latinos and three for Latinas. Three categories had
averages wages below $20,000 for Latinas but none for Latinos.
Educational Levels and Income of Employed Latinos and Latinas Compared to Other Racial/Eth-nic Groups
Table 5.4 displays average income by race/ethnicity by educational attainment for 1980
and 2012-2016. The table shows clear discrepancies not only between the racial/ethnic groups,
but also within these groups. It is evident that on average, access to higher education leads to
higher-paying employment opportunities. This is the case for every group in 2012-2016 with
average incomes much higher for those with 4 or more years of college and lower incomes for
those that had not completed a college degree.
Although each racial/ethnic group averages higher or lower incomes according to edu-
cational attainment, overall, non-Latino Whites and Asians continue to average higher incomes
than African-Americans and Latinos. Non-Latino Whites in particular, average incomes higher
than every other racial/ethnic group, regardless of educational level. Asians, though, average
incomes similar to those of Latinos and African-Americans in every educational category but the
“4 or more years,” category, in which the where incomes of Asians are much higher.
Incomes for Latinos and African-Americans continue to be the lowest. Incomes are simi-
lar in all five educational categories, with Latinos averaging lower incomes in both the 1-3 Years
of College and 4 or More Years of College, and African-Americans averaging lower incomes in
all three other categories.
When comparing the changes in income between 1980 and 2012-2016, increases and
decreases vary for all four racial/ethnic groups. In the N/A or No Schooling category, non-Lati-
no Whites experienced the most significant increases going from $27,042 in 1980 to $42,759 in
2012-2016. Asians also increased from $28,660 in 1980 to $33,904 in 2012-2016. Latinos de-

48
Table 5.4 Mean Income Compared to Level of Education for All Wage Earners, 1980 to 2012-2016
White (non-His-panic or Latino)
Black (non-His-panic or Latino)
Asian (non-His-panic or Latino) Hispanic or Latino
Education 1980 2012-2016 1980 2012-
2016 1980 2012-2016 1980 2012-
2016N/A or No Schooling $27,042 $42,759 $29,365 $23,534 $28,660 $33,904 $27,547 $27,413
Less than 9th Grade $35,434 $28,868 $30,735 $24,016 $22,211 $22,893 $28,504 $25,627
9th Grade to 12th Grade
$34,607 $36,654 $28,693 $26,231 $26,582 $25,544 $28,310 $26,779
1-3 Years of College $42,354 $45,099 $32,868 $34,094 $30,643 $35,712 $33,066 $31,076
4 or More Years of College
$59,997 $87,648 $46,611 $62,609 $53,128 $76,503 $49,583 $59,988
Source: PUMS 1980, 2012-2016

49
creased slightly going from $27,547 in 1980 to $27,413 in 2012-2016. African-Americans expe-
rienced the most significant decreases, dropping from $29,365 in 1980 to $23,534 in 2012-2016.
In the Less than 9th Grade category, every racial/ethnic group saw decreases with the
exception of Asians. Non-Latino Whites and African-Americans experienced the most sig-
nificant decreases from 1980 to 2012-2016, with average incomes decreasing by $6,719 for
African-Americans and by $6,566 for non-Latino Whites. Latinos decreased by $2,877, going
from $28,504 in 1980 to $25,627 in 2012-2016. Asians were the only group that experienced an
increase, going from $22,211 in 1980, to $22,893 in 2012-2016.
The 9th to 12th Grade category displays minor changes for all four racial/ethnic groups;
however, these changes were only positive for non-Latino Whites. All three other groups expe-
rienced decreases from 1980 to 2012-2016. For non-Latino Whites, average incomes increased
from $34,607 in 1980 to $36,654 in 2012-2016. Average incomes for African-Americans de-
creased from $28,693 in 1980 to $26,231 in 2012-2016. For Asians, incomes decreased from
$26,582 in 1980, to $25,544 in 2012-2016. Average incomes decreased for Latinos as well, going
from $28,310 in 1980 to $26,779 in 2012-2016.
In the 1-3 Years of College category, Latinos were the only racial/ethnic group that
did not experience an increase in average incomes between 1980 and 2012-2016. Non-Latino
Whites, with the highest overall incomes in both datasets, increased from $42,354 in 1980 to
$45,099 in 2012-2016. Asians increased from $30,643 in 1980 to $35,712 in 2012-2016, the
highest among all groups. African-Americans increased from $32,868 in 1980 to $34,094 in
2012-2016. For Latinos, incomes decreased from $33,066 in 1980 to $31,076 in 2012-2016.
According to Table 5.4, the 4 or More Years of College category showed the most sig-
nificant increases for all four racial/ethnic groups; however, these increases have varied not only
in total amount, but also in the average incomes of each group. This is very significant because
it shows that a college degree does not translate into equal pay for each racial/ethnic group.
Non-Latino Whites experienced the most significant increases, with average incomes growing
by $27,651, going from $59,997 in 1980 to $87,648 in 2012-2016. Asians experienced the next

50
highest increases of $23,375, going from $53,128 in 1980 to $76,503 in 2012-2016. The increase
for African-Americans was also significant at $15,998, going from $46,611 in 1980 to $62,609
in 2012-2016. Latinos experienced the lowest gains at $10,405, going from $49,583 in 1980 to
$59,988 in 2012-2016, an increase that pales in comparison to non-Latino Whites and Asians.
How does the relationship income-educational attainment breaks by Latino subgroup?Occupational Distribution by Latino Subgroup – 1980 to 2012-2016
Table 5.6a displays the differences between Mexicans, Puerto Ricans, and Cubans, com-
paring them to each other, as well as to Other Latino groups and Non-Latinos overall (non-Latino
Whites, non-Latino African-American, and Asian). It also displays the changes between 1980
and 2012-2016. Similar to 1980, in 2012-2015 there were clear differences in occupational dis-
tribution between Mexicans and Puerto Ricans in comparison with Cubans. Mexican and Puerto
Rican workers are concentrated in the lowest-paying occupations and have low percentages of
workers in the highest-paying occupations. Cubans on the other hand, have a larger concentration
in the highest-paying occupations and lower percentages of workers in the lowest-paying occu-
pations. The Other Latinos category also displays higher concentrations in low-paying occupa-
tions, but had a good representation in the highest-paying occupations.
Reflecting prior analyses, the occupational category with the largest share of Latinos,
Operators, Fabricators, and Laborers, also has the lowest wages. Mexican workers had the
highest overall percentage at 26.8%, followed by Other Latino workers at 17.2%, Puerto Rican
workers at 14.9%, Cuban workers at 12.1%, and non-Latino workers at 9%. While still a sig-
nificant portion, this category has experienced the largest decrease in the total percentage of the
workforce since 1980. The percentage of the Mexican workforce decreased from 47.9% in 1980,
to 26.8% in 2012-2016; for Puerto Ricans the percentage went from 43.5% in 1980 to 14.9% in
2012-2016; the share for Other Latinos decreased from 33.5% in 1980 to 17.2% in 2012-2016
and Cubans went from 27.4% in 1980, to 12.1% in 2012-2016. The corresponding figures for
non-Latinos were 17.7% in 1980 and to 9% in 2012-2016.
The occupational category with the next largest percent of Latino workers, also ex-

51
Table 5.6a - Occupational Distribution by Latino Subgroup – 1980 to 2012-2016 Non-Hispanic or Latino Mexican Puerto Rican Cuban Other
Occupation 1980 2012-2016 1980 2012-2016 1980 2012-2016 1980 2012-2016 1980 2012-2016
Executive, Administrative, and Managerial Occupations: 8.1% 11.5% 2.2% 3.9% 2.4% 7.3% 6.6% 9.7% 4.4% 7.7%
Management Related Occupations: 3.0% 5.9% 0.8% 1.9% 0.8% 2.9% 0.9% 4.6% 1.9% 4.0%
Professional Specialty Occupations 12.0% 21.9% 2.9% 6.3% 4.1% 11.9% 11.1% 22.2% 9.9% 15.9%
Technicians and Related Support Occupations 2.9% 3.8% 1.0% 1.4% 1.3% 2.2% 2.8% 3.8% 2.2% 2.7%
Sales Occupations: 11.0% 11.8% 4.6% 8.9% 6.6% 11.6% 7.0% 12.1% 7.5% 9.2%
Administrative Support Occupations, Including Clerical 21.4% 14.6% 13.3% 12.4% 16.7% 19.7% 19.7% 12.6% 15.9% 11.7%
Service Occupations 12.8% 14.7% 15.1% 23.9% 13.6% 21.3% 14.1% 16.5% 14.5% 23.1%
Farming, Forestry and Fishing Occupations 0.6% 0.8% 1.4% 3.4% 0.4% 1.1% 0.0% 1.1% 0.5% 1.4%
Precision Production, Craft, and Repair Occupations 10.6% 6.1% 10.8% 11.0% 10.5% 7.1% 10.5% 5.4% 9.8% 7.2%
Operators, Fabricators, and Laborers 17.7% 9.0% 47.9% 26.8% 43.5% 14.9% 27.4% 12.1% 33.5% 17.2%
Source: PUMS 1980, 2012-2016

52
perienced the largest increase in the percent of the total Latino workforce between 1980 and
2012-2016; additionally, it is one of the lowest-paying occupational categories for Latinos. The
percent of the workforce in Service Occupations increased for every group; however, the larg-
est increases were for Mexican, Puerto Rican, and Other Latino workers. Mexican workers had
the highest percentage at 23.9%, followed by Other Latinos at 23.1%, Puerto Ricans at 21.3%,
Cubans at 16.5%, and non-Latinos at 14.7%. As previously mentioned, this category experienced
the most significant increases for Latino workers. The percentage of Mexican workers increased
from 15.1% in 1980 to 23.9% in 2012-2016; for Other Latino workers it increased from 14.5%
in 1980 to 23.1% in 2012-2016, and for Puerto Rican workers it increased from 13.6% in 1980 to
21.3% in 2012-2016. For Mexicans and Other Latinos, this was the largest percentage increase;
for Puerto Ricans it was the 2nd largest. However, percentages did not increase as substantially for
Cuban and Non-Latino workers. Cubans increased from 14.1% in 1980 to 16.5% in 2012-2016,
and Non-Latinos increased from 12.8% in 1980 to 14.7% in 2012-2016.
The next largest occupational category for Latino workers was Administrative Support,
Including Clerical. This category also displayed low-paying wages for Latinos, and decreased for
every group with the exception of Puerto Rican workers between 1980 and 2012-2016. Puerto
Ricans had the highest total percentage at 19.7%, followed by Non-Latinos at 14.6%, Cuban
workers at 12.6%, Mexican workers at 12.4%, and Other Latino workers at 11.7%. The largest
decrease in percentage was for Cuban workers, going from 19.7% in 1980 to 12.6% in 2012-
2016. The next highest was for Non-Latino workers, decreasing from 21.4% in 1980 to 14.6% in
2012-2016. Other Latinos decreased from 15.9% in 1980 to 11.7% in 2012-2016, and Mexican
workers from 13.3% in 1980 to 12.4% in 2012-2016. The percentage of Puerto Rican workers
increased from 16.7% in 1980 to 19.7% in 2012-2016.
Precision Production, Craft, and Repair Occupations is the category with the next highest
percentages for Latino groups. With the exception of Mexican workers, every other group de-
creased in percentage from 1980 to 2012-2016. The Mexican workforce had the highest percent-
age at 11%, followed by Other Latinos at 7.2%, Puerto Ricans at 7.1%, Non-Latinos at 6.1%, and

53
Cubans at 5.4%. The percentage increased for Mexican workers from 10.8% in 1980 to 11% in
2012-2016. For Other Latino workers, it decreased from 9.8% in 1980 to 7.2% in 2012-2016, for
Puerto Rican workers it decreased from 10.5% in 1980 to 7.1% in 2012-2016, Non-Latino work-
ers decreased from 10.6% in 1980 to 6.1% in 2012-2016, and Cuban workers decreased from
10.5% in 1980 to 5.4% in 2012-2016.
Sales Occupations increased for every group between 1980 and 2012-2016. However,
Latinos employed in this category received very low wages. The Latino group with the largest
percentage in this category was Cuban workers at 12.1%, followed by 11.6% of Puerto Rican
workers at 9.2% of Other Latino workers, and 8.9% of Mexican workers. The percentage of
Non-Latino workers was the 2nd highest overall at 11.8%. The percentage increased for Cuban
workers from 7% in 1980 to 12.1% in 2012-2016; for Non-Latinos it went from 11% in 1980
to 11.8% in 2012-2016; for Puerto Rican workers from 6.6% in 1980 to 11.6% in 2012-2016;
for Other Latino workers from 7.5% in 1980 to 9.2% in 2012-2016; and for Mexican workers
from 4.6% in 1980 to 8.9% in 2012-2016. The Cuban workforce experienced the largest overall
increase in this category.
The occupational category with the lowest-paying wages on average, Farming, Forestry
and Fishing Occupations, had among the lowest percentages for all groups. Yet, the Mexican
share grew by 2% between 1980 and 2012-2016 to a total of 3.4% in 2012-2016, compared to
Other Latinos at 1.4%, Puerto Ricans at 1.1%, Cubans at 1.1%, and Non-Latinos at 0.8%. The
percentage of Mexican workers increased from 1.4% in 1980 to 3.4%; Other Latinos grew from
0.5 in 1980 to 1.4% in 2012-2016; Puerto Ricans from 0.4% in 1980 to 1.1% in 2012-2016;
Cubans from 0% in 1980 to 1.1% in 2012-2016; and Non-Latinos from 0.6% in 1980 to 0.8% in
2012-2016.
The four highest-paying occupational categories displayed significant differences among
Latino groups. The fourth-highest, Technicians and Related Support Occupations, displayed mi-
nor differences, with Cubans having the largest percentage and the highest growth between 1980
and 2012-2016; in contrast, Mexicans had the lowest percentage and the least amount of growth.

54
The total percentage for Cubans was 3.8%, for Other Latinos 2.7%, for Puerto Ricans 2.2%, for
Mexicans 1.4%, and for Non-Latinos 3.8%. For Cuban workers, the percentage increased from
2.8% in 1980 to 3.8% in 2012-2016; for Other Latino workers it grew from 2.2% in 1980 to
2.7% in 2012-2016; for Puerto Ricans from 1.3% in 1980 to 2.2% in 2012-2016; for Mexicans
from 1% in 1980 to 1.4% in 2012-2016: and Non-Latinos from 2.9% in 1980 to 3.8% in 2012-
2016.
The third highest-paying occupational category, Professional Specialty Occupations, also
had the most significant growth for Latino groups. Cuban workers again displayed both higher
percentages and higher growth rates between 1980 and 2012-2016 than the other Latino groups,
While Mexican workers continued to have the lowest percentage as well as the lowest growth
rates of the groups. The percentage for Cuban workers was 22.2%, compared to 15.9% of Oth-
er Latino workers, 11.9% of Puerto Rican workers, 6.3% of Mexican workers, and 21.9% of
Non-Latino workers. The percentage of Cuban workers increased from 11.1% in 1980 to 22.2%
in 2012-2016. For Other Latinos it went from 9.9% in 1980 to 15.9% in 2012-2016; for Puerto
Ricans from 4.1% in 1980 to 11.9% in 2012-2016; for Mexicans from 2.9% in 1980 to 6.3% in
2012-2016; and for Non-Latinos from 12% in 1980 to 21.9% in 2012-2016.
The occupational category with the second highest-paying wages, Management Related
Occupations, once again had Cuban workers with the highest overall percentage and the highest
growth rate between 1980 and 2012-2016 and Mexican workers with the lowest percentage and
the lowest growth rate during this period. The percentage of the Cuban workforce was 4.6%,
compared to 4% of the Other Latino workforce, 2.9% of the Puerto Rican workforce, 1.9% of
the Mexican workforce, and 5.9% of the Non-Latino workforce. The percentage of the Cuban
workforce increased from 0.9% in 1980, to 4.6% in 2012-2016; for the Other Latino workforce
it increased from 1.9% in 1980 to 4% in 2012-2016; for the Puerto Rican workforce it grew from
0.8% in 1980 to 2.9% in 2012-2016; for the Mexican workforce from 0.8% in 1980 to 1.9% in
2012-2016; and for Non-Latino workforce from 3.0% in 1980, to 5.9% in 2012-2016.
The highest-paying occupational category, Executive, Administrative, and Managerial

55
Occupations, also displayed placed Cubans first with the highest percentage amongst Latino
groups. However, Puerto Rican workers experienced the most significant growth rate between
1980 and 2012-2016. Mexican workers, meanwhile, continued to experience low growth rates
during this same period, and once again had the lowest percentage among all Latino groups. The
percentage of Cuban workers in 2012-2016 was 9.7%, of Other Latino workers it was 7.7%, of
Puerto Rican workers 7.3%, of Mexican workers 3.9%, and of Non-Latinos 11.5%. For Cubans,
the total workforce percentage increased from 6.6% in 1980 to 9.9% in 2012-2016; for Other
Latinos the corresponding increase went from 4.4% in 1980 to 7.7% in 2012-2016; Puerto Ri-
cans increased from 2.4% in 1980 to 7.3% in 2012-2016, Mexicans from 2.2% in 1980 to 3.9%
in 2012-2016, and Non-Latinos from 8.1% in 1980, to 11.5% in 2012-2016.
These percentages indicate that most Latino groups are concentrated in low-paying occu-
pations; however, Cuban and Other Latinos had higher percentages in higher-paying occupations
than Mexicans and Puerto Ricans. The Mexican workforce in particular, had the highest percent-
ages in the lowest-paying occupations. In fact, 86.4% of the Mexican workforce was concen-
trated in low-wage occupational categories, compared to 75.7% of the Puerto Rican workforce,
69.8% of the Other Latino workforce, 59.8% of the Cuban workforce, and 57% of the Non-Lati-
no workforce. However, since 1980 the total percentages decreased from 93.1% of the Mexican
workforce, 91.3% of the Puerto Rican workforce, 81.7% of the Other Latino workforce, 78.7%
of the Cuban workforce, and 74% of the Non-Latino workforce. The decrease for the Mexican
workforce, however, was much lower than for the other Latino groups.
Inversely, the shares of the Latino workforce increased in the four highest-paying occupa-
tional categories. Cubans had the highest percentage of all Latino groups at 40.3%, followed by
the Other Latinos at 30.3%, by Puerto Ricans at 24.3%, and by Mexicans at 13.4%. Meanwhile,
43.1% of the Non-Latino workforce worked in this category. Since 1980, percentages increased
for every group—from 21,4% for Cuban workers, 18,4% for Other Latino workers, 8.6% for
Puerto Rican workers, 6.9% for Mexican workers and 26% for Non-Latinos. Once again, Mexi-
can workers experienced the lowest growth rates.

56
Table 5.6b - Occupational Distribution by Latino Subgroup – 2012-2016 2012-2016
Occupation Mexican Puerto Rican Ecuadorian Guatema-
lan Cuban Colombian DominicanOther
Central American
Other South
American
Executive, Administrative, and Managerial Occupations: 3.9% 7.3% 6.1% 5.8% 9.7% 12.9% 5.6% 8.2% 8.0%
Management Related Occupations: 1.9% 2.9% 3.1% 1.7% 4.6% 5.5% 4.7% 2.9% 6.6%
Professional Specialty Occupations 6.3% 11.9% 11.1% 10.0% 22.2% 19.4% 27.8% 9.4% 24.8%
Technicians and Related Support Occupations 1.4% 2.2% 1.9% 2.4% 3.8% 3.2% 0.4% 1.9% 4.5%
Sales Occupations: 8.9% 11.6% 9.1% 7.5% 12.1% 11.9% 7.9% 6.9% 11.7%
Administrative Support Occupations, Including
Clerical12.4% 19.7% 8.6% 12.9% 12.6% 13.4% 10.5% 11.7% 11.7%
Service Occupations 23.9% 21.3% 35.6% 27.9% 16.5% 16.0% 11.5% 27.0% 15.7%
Farming, Forestry and Fishing Occupations 3.4% 1.1% 0.5% 1.8% 1.1% 0.9% 1.8% 1.9% 1.3%
Precision Production, Craft, and Repair Occupations 11.0% 7.1% 9.4% 9.7% 5.4% 3.8% 5.5% 9.5% 5.0%
Operators, Fabricators, and Laborers 26.8% 14.9% 14.7% 20.3% 12.1% 12.9% 24.3% 20.6% 10.8%
Source: PUMS 2012-2016
57
Table 5.6b, the Occupational Distribution by Latino Subgroup, shows the differences be-
tween Mexicans, Puerto Ricans, Ecuadorians, Guatemalans, Cubans, Colombians, Dominicans,
Other Central Americans, and Other South Americans in 2012-2016. Aside from Mexicans, Puer-
to Ricans, and Cubans, this level of detail was not available for all other Latino groups in 1980
and, therefore, does not allow for analysis of changes over time. Still, it provides a baseline for
understanding the differences in occupational structure based on countries of origin. Similar to
Table 5.6a, Table 5.6b displays the concentration of Mexicans, and Puerto Ricans in occupational
categories with the lowest-paying wages joined by Ecuadorians, Guatemalans, and Other Central
Americans. The vast majority of these groups’ labor forces are in low-wage occupations; howev-
er the percentage shares of Cubans, Colombians, Dominicans, and Other Central Americans in
higher-paying occupations are higher.
In the Operators, Fabricators, and Laborers category, the largest for Latinos as a whole
(table 5.2), Mexicans had the highest share at 26.8%, followed by Dominicans at 24.3%, Other
Central Americans at 20.6%, Guatemalans at 20.3%, Puerto Ricans at 14.9%, Ecuadorians at
14.7%, Colombians at 12.9%, Cubans at 12.1%, and Other South Americans at 10.8%. While we
know that percentages have decreased from 1980 to 2012-2016 for Mexicans, Puerto Ricans, and
Cubans, growth over time for the other groups cannot be determined. However, considering the
decrease for Latinos as a whole, it is likely that percentages for the other groups also decreased
during this time. Mexicans are the only group in which this category has the highest percentage,
while for Ecuadorians, Guatemalans, Dominicans, and Other Central Americans this was the
second highest percentage, and for Puerto Ricans it was the third highest.
The category with the largest increase for Latinos, Service Occupations, was the largest
occupational category for Puerto Ricans, Ecuadorians, Guatemalans, and Other Central Amer-
icans. Ecuadorians had the highest percentage of their labor force in this category at 35.6%,
followed by Guatemalans at 27.9%, Other Central Americans at 27%, Mexicans at 23.9%, Puerto
Ricans at 21.3%, Cubans at 16.5%, Colombians at 16%, Other South Americans at 15.7%, and
Dominicans at 11.5%. Because this category had the highest growth for all Latino workers be-

58
tween 1980 and 2012-2016, these percentages have likely have increased for most groups since
during this time. For Mexicans, Cubans, Colombians, and Other South Americans it was the
second largest occupational category, and for Dominicans it was third largest.
Administrative Support Occupations, Including Clerical, is one of the categories that
varied in growth for Latino groups between 1980 and 2012-2016—although declining for Lati-
nos as a whole. Puerto Ricans have the highest percentage of their labor force in this category at
19.7%, followed by Colombians at 13.4%, by Guatemalans at 12.9%, Cubans at 12.6%, Mexi-
cans at 12.4%, Other South Americans at 11.7%, Other Central Americans at 11.7%, Dominicans
at 10.5%, and Ecuadorians at 8.6%. For Puerto Ricans, this is the second largest occupational
category, and for Mexicans, Guatemalans, Cubans, Colombians, Other Central Americans, and
Other South Americans the third largest.
The Precision Production, Craft, and Repair Occupations category showed an increase of
Mexican workers but a decline for other Latino workers between 1980 and 2012-2016. The same
as Table 5.6a, Table 5.6b show that Mexicans have the largest percentage of their labor force
in this category at 11%, followed by Guatemalans at 9.7%, Other Central Americans at 9.5%,
Ecuadorians at 9.4%, Puerto Ricans at 7.1%, Dominicans at 5.5%, Cubans at 5.4%, Other South
Americans at 5%, and Colombians at 3.8%. This is not among the top three largest categories for
any of the groups; for Mexicans, Guatemalans, Other Central Americans, and Ecuadorians it was
the fourth largest.
While showing growth across the board between 1980 and 2012-2016 (table 5.6a), the
Sales Occupations category had consistent proportions among Latino sub groups (see Table
5.6b). Cubans had the highest percentage in this category at 12.1%, followed by Colombians
at 11.9%, by Other South Americans at 11.7%, Puerto Ricans at 11.6%, Ecuadorians at 9.1%,
Mexicans at 8.9%, Dominicans at 7.9%, Guatemalans at 7.5%, and Other Central Americans
at 6.9%. This category was third -highest for the Other South Americans in the labor force, and
fourth-highest for Cubans.
The occupational category with the lowest overall wages, Farming, Forestry and Fishing

59
Occupations, had some of the lowest percentages for every group. However, as in Table 5.6a, Ta-
ble 5.6b shows that Mexicans had the largest percentage shares in the category at 3.4%, followed
by Other Central Americans at 1.9%, Guatemalans at 1.8%, Dominicans at 1.8%, Other South
Americans at 1.3%, Puerto Ricans at 1.1%, Cubans at 1.1%, Colombians at .9%, and Ecuador-
ians at .5%. This category experienced minimal growth for every subgroup between 1980 and
2012-2016 (see Table 5.6a).
The four-highest paying categories displayed significant differences among Latino sub-
groups (see Table 5.6b). The fourth highest paying category, Technicians and Related Support
Occupations, had also among the lowest percentages for each group—although there was an in-
crease for Latinos as a whole between 1980 and 2012-2016 (see Table 5.6a). In 2012-2016, Other
South Americans had the highest percentage in this category at 4.5%, followed by Cubans at
3.8%, Colombians at 3.2%, Guatemalans at 2.4%, Puerto Ricans at 2.2%, Ecuadorians at 1.9%,
Other Central Americans at 1.9%, Mexicans at 1.4%, and Dominicans at 0.4%.
The third highest-paying category, Professional Specialty Occupations, had among the
highest percentage shares for several groups. The group with the largest percentage of its labor
force in this category was Dominicans at 27.8%, followed by Other South Americans at 24.8%,
Cubans at 22.2%, Colombians at 19.4%, Puerto Ricans at 11.9%, Ecuadorians at 11.1%, Guate-
malans at 10%, Other Central Americans at 9.4%, and Mexicans at 6.3%. For Dominicans, Other
South Americans, Cubans, and Colombians, it was the category with the largest share. For Ecua-
dorians it was third largest, and for Puerto Ricans and Guatemalans the fourth largest.
The second highest-paying occupational category, Management Related Occupations,
had low percentages for every group—despite there was an overall increase for Latinos between
1980 and 2012-2016 (see Table 5.6a). The group with the largest percentage, Other South Amer-
icans had a share of 6.6%, followed by Colombians at 5.5%, Dominicans at 4.7%, Cubans at
4.6%, Ecuadorians at 3.1%, Puerto Ricans at 2.9%, Other Central Americans at 2.9%, Mexicans
at 1.9%, and Guatemalans at 1.7%.
Executive, Administrative, and Managerial Occupations, the highest-paying category,

60
saw an increase in the percentage share of Latinos between 1980 and 2012-2016 (see Table 5.6a).
However, the share differed among Latino subgroups. Colombians had the highest percentage at
12.9%, followed by Cubans at 9.7%, Other Central Americans at 8.2%, Other South Americans
at 8%, Puerto Ricans at 7.3%, Ecuadorians at 6.1%, Guatemalans at 5.8%, Dominicans at 5.6%,
and Mexicans at 3.9%. Although this was the third-largest occupation for Colombians, it was not
among the top 4 for any other subgroup.
As was the case for Table 5.6a, Table 5.6b shows that Latinos as a whole were more
concentrated in low-wage occupations in 2012-2016. However, percentages vary significantly
by subgroup. Once again, Mexicans had the highest percentage of its labor force in low-wage
occupations at 86.4% followed by Guatemalans at 80.1%, Ecuadorians at 77.9%, Other Central
Americans at 77.6%, Puerto Ricans at 75.7%, Dominicans at 61.5%, Cubans at 59.8%, Colombi-
ans at 58.9%, and Other South Americans at 56.2%.
While the percentage of the labor force in the four highest-paying occupations increased
for Latinos as a whole, Table 5.6b shows that Mexican labor is less prevalent in these occupa-
tions. Other South Americans had the highest percentage in the top four at 43.9%, followed by
Colombians at 41%, Cubans at 40.3%, Dominicans at 38.5%, Puerto Ricans at 24.3%, Other
Central Americans at 22.4%, Ecuadorians at 22.2%, Guatemalans at 19.9, and Mexicans at
13.5%.
Industry of Occupation of Latinos by National Group – 1980 to 2012-2016
Table 5.7a shows the Industry of occupation of Latinos by National Group and increases
and decreases in employment of Mexicans, Puerto Ricans, Cubans, and Other Latinos compared
to Non-Latinos from 1980 to 2012-2016. As mentioned in Table 5.3a, Latinos were concentrat-
ed in low-wage industries. However, their distribution changed drastically during this period,
with decreases in several industries and increases in several others. The most notable decrease
for Mexicans, Puerto Ricans, Other Latinos, and Non-Latinos was in Manufacturing, with the
percentage of Mexican labor decreasing from 49.3% in 1980 to 19.6% in 2012-2016, Puerto

61
Table 5.7a – Industry of Latinos by National Group – 1980 to 2012-2016 Industry Non-Hispanic or Latino Mexican Puerto Rican Cuban Other
1980 2012-2016 1980 2012-2016 1980 2012-2016 1980 2012-2016 1980 2012-2016
AGRICULTURE, FORESTRY, AND FISHERIES
0.6% 0.8% 1.4% 3.2% 0.4% 1.0% 0.0% 0.7% 0.5% 1.3%
MINING 0.1% 0.0% 0.1% 0.0% - 3.1% 2.4% - 0.1% 0.0%
CONSTRUCTION 4.6% 4.5% 3.9% 7.4% 2.4% 11.5% 36.4% 3.2% 3.5% 4.9%
MANUFACTURING 24.5% 9.7% 49.3% 19.6% 47.5% 8.4% 5.7% 12.9% 37.8% 14.6%
TRANSPORTATION, COMMUNICATIONS, AND OTHER PUBLIC UTILITIES
8.1% 8.0% 5.7% 6.3% 6.6% 3.2% 3.5% 7.1% 4.9% 6.9%
WHOLESALE TRADE 5.0% 3.0% 4.5% 3.5% 3.5% 20.8% 17.2% 2.9% 4.4% 3.0%
RETAIL TRADE 17.4% 15.6% 14.0% 23.9% 14.1% 6.7% 7.1% 20.6% 14.0% 18.6%
FINANCE, INSURANCE, AND REAL ESTATE 7.6% 8.5% 3.6% 3.7% 3.5% 6.9% 2.3% 7.5% 4.4% 5.8%
BUSINESS AND REPAIR SERVICES 4.2% 7.4% 3.3% 9.4% 2.8% 3.9% 3.0% 5.6% 3.9% 8.8%
PERSONAL SERVICES 2.6% 3.4% 3.4% 4.2% 2.5% 1.6% 0.7% 2.5% 4.3% 5.9%
ENTERTAINMENT AND RECREATION SERVICES 1.1% 1.7% 0.8% 1.2% 0.6% 28.6% 19.9% 1.5% 0.6% 1.6%
PROFESSIONAL AND RELATED SERVICES 20.2% 33.7% 8.4% 15.8% 12.4% 4.3% 1.7% 31.4% 19.3% 26.0%
PUBLIC ADMINISTRATION 4.2% 3.6% 1.8% 1.7% 3.5% 0.3% 0.0% 4.3% 2.5% 2.5%Source: PUMS 1980, 2012-2016
62
Rican labor going from 47.5% in 1980 to 8.4% in 2012-2016, Other Latino labor from 37.8% in
1980 to 14.6% in 2012-2016, and Non-Latino labor decreasing from 24.5% in 1980 to 9.7% in
2012-2016. Cubans, meanwhile, had the largest decrease going from 36.4% in 1980 to 3.2% in
2012-2016. Increases vary depending on the group. For Mexican workers, the most significant
increase was in Retail Trade, going from 14% in 1980 to 23.9% in 2012-2016. For Puerto Rican
workers, it took place in Entertainment and Recreational Services, from .6% in 1980 to 28.6% in
2012-2016. For Cubans, Other Latinos, and Non-Latinos, the main increase was in Professional
and Related Services, with the first subgroup going from 1.7% in 1980 to 31.4% in 2012-2016,
Other Latinos from 19.3% in 1980 to 26% in 2012-2016, and non-Latinos from 20.2% in 1980 to
33.7% in 2012-206.
Decreases in manufacturing coincide with economic restructuring and the associated
deindustrialization of the Chicago economy. With the exception of Cuban workers, all other
groups decreased in this industry. However, manufacturing remains a major employer of Latino
labor in the region. For Mexican workers, it is the second largest industry of employment, for
Puerto Ricans the fourth, for Cubans the third, for Other Latinos the third, and for Non-Latinos
also the third.
Retail Trade is one of the industrial categories with the most significant increases for var-
ious groups. Cuban workers in particular increased from 7.1% in 1980 to 20.6% in 2012-2016.
Mexican labor increased from 14% in 1980 to 23.9% in 2012-2016 and Other Latinos increased
from 14% in 1980 to 18.6% in 2012-2016. The presence of Puerto Ricans and Non-Latinos
decreased in this industry, with the former going from 14.1% in 1980 to 6.7% in 2012-2016 and
the latter from 17.4% in 1980, to 15.6% in 2012-2016. The largest percentage of the Mexican
labor force is in this industry, as is the second-largest percentages of Cubans, Other Latinos, and
Non-Latinos. Although the Retail Trade industry is a major employer of Latinos in the region, it
has the second-lowest wages on average for them.
The Professional and Related Services category was also one of the industries with a
significant growth for most subgroups. As previously mentioned, the most significant increase in

63
percentage was for Cuban workers, from 1.7% in 1980 to 31.4% in 2012-2016. Other significant
increases include Non-Latinos that went from 20.2% in 1980 to 33.7% in 2012-2016, for Mexi-
can workers going from 8.4% in 1980 to 15.8% in 2012-2016, and for Other Latinos increasing
from 19.3% in 1980 to 26% in 2012-2016. Puerto Ricans meanwhile decreased from 12.4% in
1980 to 4.3% in 2012-2016. This was the largest industry for Non-Latinos, Cubans, and Other
Latinos. For Mexican workers it was the third-largest. The fact that the percentage of Puerto Ri-
can labor decreased is concerning given that this is the industry with the second-highest average
wages.
The industry with the highest wages on average, Finance, Insurance, and Real Estate, expe-
rienced increases for all Latino subgroups. The most significant increase was for Cuban workers,
from 2.3% in 1980 to 7.5% in 2012-2016. Other significant increases included Puerto Rican work-
ers, going from 3.5% in 1980 to 6.9% in 2012-2016, Other Latinos from 4.4% in 1980 to 5.8% in
2012-2016, and Non-Latinos from 7.6% in 1980 to 8.5% in 2012-2016. For Mexican workers, the
increase was minimal going 3.6% in 1980 to 3.7% in 2012-2016. For the Non-Latino and Cu-
ban labor forces it was the fourth-largest industry, and for the Puerto Rican labor force it was the
fifth-largest industry. For the Mexican labor force, minimal growth in the industry with the highest
wages correlates with high concentrations of workers in low-wage industrial employment.
The Business and Repair Services industry is also one of the categories with growth for
every group. The most significant increases affected Mexican and Other Latino labor forces, with
the percentage of the former increasing from 3.3% in 1980 to 9.4% in 2012-2016, and that of the
latter increasing from 3.9% in 1980 to 8.8% in 2012-2016. The percentage of Non-Latino work-
ers increased from 4.2% in 1980 to 7.4% in 2012-2016; Cuban workers increased from 3% in
1980 to 5.6% in 2012-2016 and Puerto Rican workers from 2.8% in 1980 to 3.9% in 2012-2016.
For the Mexican, Other Latino, and Cuban labor forces it was the fourth-largest industry. Notice
that this industry had the fifth-lowest wages for Latinos as a whole.
The Construction industry experienced growth for most groups, with the only exceptions
being the Cuban and Non-Latino labor forces. The most significant increase was for Puerto Rican
64
workers whose total percentage increased from 2.4% in 1980 to 11.5% in 2012-2016, followed
by Mexican workers whose total increased from 3.9% in 1980 to 7.4% in 2012-2016, and Other
Latinos whose total increased from 3.5% in 1980 to 4.9% in 2012-2016. Cuban workers had the
most significant decrease in total percentage, dropping from 36.4% in 1980 to 3.2% in 2012-
2016, while Non-Latinos decreased slightly from 4.6% in 1980 to 4.5% in 2012-2016. For Puerto
Ricans, this was the third-largest industry and for the Mexicans the fifth largest. The Construc-
tion industry had the sixth-highest wages for Latinos overall.
The industrial category of Transportation, Communications, and Other Public Utilities
also experienced growth for most subgroups. The Cuban labor force experienced the most sig-
nificant growth, going from 3.5% in 1980 to 7.1% in 2012-2016, followed by Other Latinos,
which increased from 4.9% in 1980 to 6.9% in 2012-2016, and the Mexican labor force, which
increased from 5.7% in 1980 to 6.3% in 2012-2016. The percentages of the Puerto Rican and
Non-Latino labor forces decreased, however, with Puerto Ricans decreasing the most from 6.6%
in 1980 to 3.2% in 2012-2016, and Non-Latinos decreasing from 8.1% in 1980 to 8% in 2012-
2016. For the Non-Latino, Cuban, and Other Latino labor forces, this was the fifth-largest indus-
try. This industry had the fourth-highest wages on average for Latinos as a whole.
One of the industries that experienced growth for nearly every group with the exception
of Cuban workers was the category with the most significant growth for the Puerto Rican labor
force. The percentage of Puerto Ricans increased from 0.6% in 1980 to 28.6% in 2012-2016,
while Other Latinos increased from .6% in 1980 to 1.6% in 2012-2016, Non-Latinos from 1.1%
in 1980 to 1.7% in 2012-2016, and Mexicans from .8% in 1980 to 1.2% in 2012-2016. The per-
centage of Cuban workers decreased from 19.9% in 1980, to 1.5% in 2012-2016. Although this
was the largest industry for the Puerto Rican labor force, it was not in the top five largest indus-
tries for any other group. Additionally, it had the third-lowest wages for Latinos.
The Wholesale Trade industry also experienced significant growth in the total percentage
of the Puerto Rican labor force, increasing from 3.5% in 1980 to 20.8% in 2012-2016, which was
the second-largest increase for Puerto Rican workers. The percentages for every other group de-

65
creased, however, with the Cuban labor force going from 17.2% in 1980 to 2.9% in 2012-2016,
the Non-Latino labor force from 5% in 1980 to 3% in 2012-2016, the Mexican labor force from
4.5% in 1980 to 3.5% in 2012-2016, and the Other Latino labor force from 4.4% in 1980 to 3%
in 2012-2016. The Wholesale Industry was the second-largest industry for Puerto Rican workers
but was not in the top-five largest for any other subgroup. However, it averaged the fifth-highest
wages for Latinos overall.
The industry with the lowest overall wages for Latinos, Agriculture, Forestry, and Fisher-
ies, also experienced percentage growth for every group. The largest increase was for Mexicans
(from 1.4% in 1980 to 3.2% in 2012-2016), followed by the Other Latinos (from .5% in 1980 to
1.3% in 2012-2016), by Puerto Ricans (from .4% in 1980 to 1% in 2012-2016), Cubans (from
0% in 1980 to .7% in 2012-2016), and Non-Latinos (from .6% in 1980 to .8% in 2012-2016).
This was not in the top-five largest industries for any of the groups.
The percentage of the labor force in Public Administration increased for Cubans, re-
mained the same for Other Latinos, but decreased for every other subgroup. The percentage of
Cuban workers increased from 0% in 1980 to 4.3% in 2012-2016, and the percentage of Other
Latinos remained constant at 2.5% in 1980 and 2012-2016. The most significant decrease was for
Puerto Rican workers dropping from 3.5% in 1980 to .3% in 2012-2016, followed by Non-Lati-
nos decreasing from 4.3% in 1980 to 3.6% in 2012-2016, and by Mexican workers, from 1.8%
in 1980, to 1.7% in 2012-2016. While this was not one of the largest industries for any of the
groups, it averaged the third-highest wages for Latino workers.
The Personal Services industry also varied in growth amongst the groups, with the only
decreases occurring in the Puerto Rican subgroup. The percentage of Other Latino workers in-
creased from 4.3% in 1980 to 5.9% in 2012-2016, followed by Non-Latinos that increased from
2.6% in 1980 to 3.4% in 2012-2016, by Mexican workers that increased from 3.4% in 1980 to
4.2% in 2012-2016, and Cuban workers going from 0.7% in 1980, to 2.5% in 2012-2016. The
percentage of Puerto Rican workers decreased from 2.5% in 1980 to 1.6% in 2012-2016. This
industry was also not in the top-five largest positions for any of the groups while averaging the
66
fourth-lowest wages for Latinos as a whole.
The thirteen industries split into the six-lowest and six-highest paying industries, with the
Mining industry right in the middle. Table 5.7a shows how Latinos are concentrated in the bot-
tom six, with Mexicans, Other Latinos and Puerto Ricans having the highest percentages in these
industries. The Mexican labor force had the highest total percentage at 61.5%, followed by the
Other Latino labor force at 50.8%, the Puerto Rican labor force at 50.2%, the Cuban labor force
at 43.8%, and Non-Latinos at 38.6%. There were significant decreases since 1980, however, with
the percentage of Mexicans decreasing from 72.2% and Puerto Ricans decreasing from 67.9%,
Other Latinos decreased from 61.1% and Non-Latinos from 50.4%. The Cuban labor force was
the only group that increased during this period, from 36.4%.
As other Tables showed, when compared to other groups, Mexicans have the highest
concentrations in the lowest-paying industries. Inversely, Non-Latinos had the highest percent-
age of their labor force in the six-highest paying industries at 61.3%, followed by Cubans at
56.4%, Other Latinos at 49.1%, Puerto Ricans at 47% (Mining – 3.1%), and Mexicans at 38.4%.
The shares have increased for every group with the exception of Cubans, with Non-Latino labor
increasing from 49.7%, the Other Latino labor category from 39%, the Puerto Rican labor force
from 31.9%, and the Mexican labor force from 27.9%. Cubans were the only group to de-
crease—from 61.1%.
Data Highlights
While overall there has been economic progress for Latinos as a whole, Latino workers
continue to be segmented in the lowest-paying industries and occupations. Additionally, Latinos
have not progressed to the same extent as other racial/ethnic groups, most notably Non-Latino
Whites and Asians, have. Both Latino men and women earned the lowest wages in Construction;
Manufacturing; Transportation, Communications and Public Utilities; Retail Trade; Business
and Repair Services; and Entertainment and Recreational Services. African-American men and
women both earned the lowest wages in Agriculture, Forestry and Fisheries; Mining; and Public

67
Administration. In Wholesale Trade and FIRE, Latino men and African-American women had
the lowest wages. In Personal Services, Latino men and Asian women had the lowest wages. In
Professional and Related Services, African-American men and Latina women had the lowest
wages.
Wages by occupation show a similar picture for Latino workers. Both Latino men and
women had the lowest wages in the occupations of Executive, Administrative, and Manageri-
al; Management Related; Professional Specialty; Sales; Administrative Support Occupations,
Including Clerical; Precision Production, Craft, and Repair Occupations; and Operators, Fab-
ricators, and Laborers. In Technicians and Related Support, African-American men and Latina
women had the lowest wages. In Service occupations, Asian men had slightly lower wages than
Latino and African-American, while Latina women had the lowest wages. In Farming, Forestry
and Fishing, African-American men and Asian women had the lowest wages.
There were also several industries where wages have decreased for Latinos between 1980
and 2012-2016. For Latino men, Agriculture, Forestry and Fisheries decreased from an average
compensation of $25,761 in 1980 to $23,397 in 2012-2016. Mining went from $58,719 in 1980
to $37,597 in 2012-2016. Transportation, Communications and Public Utilities decreased from
$45,422 in 1980 to $42,483 in 2012-2016. Retail Trade decreased from $25,923 in 1980 to $24,203
in 2012-2016, and Business and Repair Services decreased from $33,303 in 1980 to $30,957 in
2012-2016. For Latina women, however, there were increases in every industrial category.
Decreases were not as significant by occupation for Latino men. In Administrative Support
Occupations, Including Clerical, average wages decreased from $31,782 in 1980 to $30,527 in
2012-2016. In Farming, Forestry and Fishing Occupations, wages decreased from $22,580 in 1980
to $22,370 in 2012-2016. In Precision Production, Craft, and Repair Occupations, wages decreased
from $42,662 in 1980 to $39,284 in 2012-2016. In Operators, Fabricators, and Laborers, the largest
occupational category for Latinos, wages decreased from $34,020 in 1980 to $31,086 in 2012-
2016. For Latina women, only one category experienced a decrease in wages, Operators, Fabrica-
tors, and Laborers, which went from $21,432 in 1980 to $19,849 in 2012-2016.

68
The data also shows that there has been more significant economic growth for other
Latino groups except for Mexicans and Puerto Ricans. While Puerto Rican migration since 1980
has not continued to the same extent that it did during the 1993 Betancur et. al..study, Mexican
migration has increased significantly since 1980. The total Mexican population within the city
limits was 255,802 in 1980, 352,560 in 1990, 530,462 in 2000, 578,100 in 2010, and 591,897 in
2012-2016. Growth, however, has not occurred for Puerto Ricans during the same time period.
The total Puerto Rican population in the city was 112,074 in 1980, 119,866 in 1990, and 113,055
in 2000, 102,703 in 2010, increasing slightly to 103,560 in 2012-2016. No other Latino subgroup
currently has more than 20,000 total persons within the city. The next two largest, Ecuadorians
and Guatemalans, have 19,057 and 18,574 respectively. Therefore, both the Mexican and Puerto
Rican labor forces have been dominant within Latino labor. Furthermore, the growth of the Mex-
ican population combined with its consistent replenishment via Mexican immigrants in search of
employment have supplied several industries with the low-wage labor that they need to function.
The economic progress for the Mexican population since 1980 has not happened to the
same extent that it has happened for other Latino subgroups, especially Cubans and Other Latinos
(see Table 5.7a). As was previously mentioned, in 2012-2016, 61.5% of the Mexican labor force
worked in the lowest paying industries, compared to 50.8% of the Other Latino groups in the labor
force, 50.2% of the Puerto Rican labor force, 43.8% of the Cuban labor force, and 38.6% of the
Non-Latino labor force. These numbers have decreased since 1980, going from 72.2% for Mexi-
cans, 67.9% for Puerto Ricans, 61.1% for Other Latinos, and 50.4% for Non-Latinos. Cubans, how-
ever, increased the share of their labor force in the lowest-paying industries from 36.4%. Between
1980 and 2012-2016, there was only a 10.7% decrease for Mexicans, 17.7% for Puerto Ricans,
10.3% decrease for Other Latinos, and 11.8% for Non-Latinos, while Cubans increased by 7.4%.
Although the percentage of Cubans increased and Other Latinos had a slightly lower decrease, the
fact that the Mexican labor force is so much larger than the other groups also explains the larger
presence of Mexican workers in the lowest-paying industries.
Occupational breakdown shows an even higher concentration of Mexican workers in the

69
lowest-paying occupations. In 1980, 93.1% of the Mexican labor force were in the lowest-paying
occupations, followed by 91.3% of the Puerto Rican labor force, 81.7% of the Other Latino labor
force, 78.7% of the Cuban labor force, and 74% of the Non-Latino labor force. In 2012-2016,
86.4% of the Mexican labor force was in the lowest-paying occupations, compared to 75.7% of
the Puerto Rican labor force, 69.8% of the Other Latino labor force, 59.8% of the Cuban labor
force, and 57% of the Non-Latino labor force. There was only a decrease of 6.7% for the Mex-
ican labor force, compared to 15.6% for Puerto Ricans, 11.9% for Other Latinos, 18.9% for
Cubans, and 17% for Non-Latinos. Once again, the Mexican labor force had the highest percent-
ages of workers in the lowest paying occupations and also had the slowest occupational mobility
growth compared to other groups.
Educational attainment by race/ethnicity also shows that Latinos and African-Americans
have average lower wages compared to other groups, even when accounting for a college degree.
The Asian population, however, displayed similar wages as Latinos and African-Americans in
the categories of No Schooling, Less than 9th Grade, 9th Grade to 12th Grade, and 1-3 Years of
College. In the 4 or More Years of College category, however, Asians had significantly higher
wages than both Latinos and African-Americans. It is important to note the differences in edu-
cational attainment by racial/ethnic group. Fifty-nine percent of Non-Latino White adults aged
25 or over had a college degree, compared to 58% of Asians, 19% of African-Americans, and
14% of Latinos. Inversely, 38% of Latino adults over the age of 25 had less than a high school
degree, compared to 17% of African-Americans, 13% of Asians, and 6% of Non-Latino Whites.
Therefore, there are far fewer Latinos and African-Americans earning the wages that a college
degree provides; still, both groups are paid far less than Non-Latino Whites and Asians in these
categories. The fact that nearly 38% of Latino adults did not have a high school diploma explains
the largest percent of this group earning the lowest wages compared to other groups. Yet, again,
there appears to be a racial effect across the board as Whites consistently make higher wages that
all other subgroups in all occupational and industrial categories.

70
VII. Latino Settlements in Chicago area – Continued Growth and Disbursement
Latino settlement in Chicago was initially shaped by the geography of industry, and the
neighborhoods of the Near West Side, South Chicago, and Back of the Yards all received a large
influx of Mexican laborers beginning in 1916 due to their proximity to industrial employment
(Año Nuevo Kerr, 1976; Betancur et. al., 1993; Fernandez, 2012; Innis-Jiménez, 2013; Acos-
ta-Córdova, 2017). With the exception of the Near West Side, both neighborhoods continue to
be large Mexican settlements. Urban Renewal, the construction of the Dan Ryan, Kennedy, and
Eisenhower expressways, and the construction of the University of Illinois at Chicago Circle
Campus (later UIC) all combined to destroy any remnants of the Mexican (Harrison and Halsted)
and Puerto Rican (La Madison) settlements in the Near West Side (Fernandez, 2012). The Mex-
ican population primarily migrated south into Pilsen and Little Village, while the Puerto Rican
population moved north to Lincoln Park only to be uprooted and displaced by Urban Renewal
once again, and then forced westward into West Town and Humboldt Park (ibid). These areas,
along with Back of the Yards and South Chicago would serve as the primary points of entry for
new arrivals as the city’s Latino population rapidly expanded (Acosta-Córdova, 2017).
In addition to cultural similarities, all of these neighborhoods shared the common trait of
being located adjacent to one of Chicago’s 26 officially designated industrial corridors (see Maps
1-5). Pilsen and Little Village are both located just north of the Chicago Sanitary and Ship Canal,
which is a man-made waterway built for the purposes of moving ships and cargo between the St.
Lawrence River in Canada and the Mississippi River, thus providing a route from the Atlantic
Ocean, on the eastern coast of the country, to the Gulf of Mexico on the southern coast. Due to
this history, both banks of the canal are used for industrial purposes, all of them within industrial
corridors. The Little Village industrial corridor is 1,252.2 acres, and the Pilsen industrial corridor
is 1,070.1 acres, the 3rd and 5th largest in the city respectively (City of Chicago, 2019). Back of
the Yards is located directly south of the Stockyards industrial corridor that, at 1,497.8 acres, is
the 2nd largest in the city (ibid.). South Chicago is located directly north of the Calumet Industrial
Corridor, which is the largest in the city at 4,197 acres (ibid.). West Town and Humboldt Park

71
are also both in close to proximity to three industrial corridors, Kinzie (854.4 acres), Northwest
(799.5 acres), and the North Branch (760 acres) (ibid.). While all of these neighborhoods are in
fact located near industrial areas, this does not necessarily mean that local community members
were necessarily employed in these areas. Yet, no other racial or ethnic group lives closer to
industry overall than Latinos do (see Maps 1-5).
As Latinos continued to migrate exponentially into the city of Chicago between the 1980’s
and the 2000’s, given the limited housing supply in the traditional Latino enclaves, new arrivals
had to seek housing in other neighborhoods, as well as in several suburban communities (See
Maps 6-10). Traditional ethnic-European enclaves throughout the Southwest and Northwest parts
of the city, started emptying out with white flight began seeing an influx of new Latino arriv-
als during the 1980’s (Betancur et. al.; Acosta-Córdova, 2017). The Southwest side of the city
experienced some of the most significant and rapid processes of ethnic succession during this
time period with the neighborhoods of Brighton Park, Gage Park, West Elsdon, and West Lawn
all going from over 90% non-Latino White, to more than 80% and 90% Latino between 1980
and 2017, while Archer Heights (76.9%) and McKinley Park (62.8%) also increased their Latino
populations very significantly (Acosta-Córdova, 2017).
Other Southwest side neighborhoods where Latinos are the largest racial/ethnic group
in 2012-2016 include Clearing (49.7%), Garfield Ridge (48.6%), and Latinos are the sec-
ond largest group in Ashburn (37.8%) (ACS-2012-2016). In addition to these areas, Back of
the Yards also transitioned from a majority Ethnic-European to a Latino enclave during this
time. Located within the community area of New City, which also includes Canaryville, the
total population between the two neighborhoods went from 99.6% White (Latinos included)
in 1960, to 41.8% African-American, 39.3% Latino, and 31.8% Non-Latino White in 1990;
50.2% Latino, 35.7% African-American, and 34.6% Non-Latino White in 2000; 57.7% Latino,
29.4% African-American, and 10.4% Non-Latino White in 2010; and 61.5% Latino, 23.1%
African-American, and 12.1% Non-Latino White in 2012-2016 (U.S. Census Bureau; ACS
2012-2016)

72
Little Village (84%) and Pilsen (77.9%) both continue to be primarily Mexican enclaves.
Pilsen has experienced gentrification and displacement since 2000, however, large-scale devel-
opment and mass displacement has not yet occurred to the same extent as West Town, Logan
Square, and Humboldt Park (Betancur, 2005 & 2011; Anderson, Sternberg, 2013). There are
many reasons for this, including community activism and resistance, the 2008 housing crisis
which stalled new development, as well as the geography of the aforementioned neighborhoods,
which are located to the directly west of the wealthy, predominantly non-Latino White neighbor-
hoods of the Near North Side, Lincoln Park, and Lakeview (ibid). The demand for real estate in
West Town, Logan Square, and Humboldt Park was significant, therefore these neighborhoods
have redeveloped and gentrified much quicker than Pilsen. Nevertheless, gentrification in Pilsen
has noticeably increased since 2010 as evidenced by increased housing costs, land values, and a
slight increase in the percentage of non-Latino White from 12.4% to 15% in 2012-2016 (Betan-
cur, 2011; ACS 2012-2016).
Little Village has not experienced a significant influx of development or of non-Latino
Whites, and continues to be the second largest Latino neighborhood in the city by total popula-
tion, and has the largest concentration of Mexicans not only in the city, but in the entire Midwest
(Acosta-Córdova, 2017). It is important to note that within the boundaries of Little Village is
Cook County Jail, the largest single site jail in the country (ibid). The population within the jail
are also included in the total population, which increases the percentage of African-Americans
in the area due to historical systemic racism, and nationwide mass incarceration (ibid). When the
census tract that contains the jail is removed from the total population, the percentage of Latinos
increases from 84% to 92.1%, and the percentage of African-Americans decreases from 11.9% to
4.5% (ACS 2012-2016). Although real estate investment in the neighborhood has not yet accel-
erated, many community activists are anticipating an increase in the near future due to the prox-
imity of Pilsen, and the City of Chicago’s Department of Planning and Development initiative
to repurpose a 4-mile stretch of an abandoned railway into a multi-purpose walking and biking
trail. Known as “El Paseo,” the trail would connect Pilsen and Little Village, and will have a

73
major impact on the adjacent land and home values (City of Chicago Department of Planning
and Development, 2019). A similar trail was constructed along the border of West Town, Logan
Square, and Humboldt Park, the “606” Bloomingdale Trail, and it has exacerbated the process
of displacement due to increases in land values and housing costs upon the announcement of the
project (DePaul Institute of Housing Studies). Due to the experience along the 606, community
activists have been fighting to ensure that considerations for long term displacement happen be-
fore the project is completed. The future of Pilsen and Little Village is uncertain, and real estate
developers are eager to move in before the project breaks ground.
The Northwest side of the city also experienced significant demographic shifts during
this same time period; however, the ethnic succession was not as significant in terms of the eth-
nic-white flight that has occurred on the Southwest side (Acosta-Córdova, 2017). The Northwest
side neighborhoods of Logan Square (1960-70’s reaching a peak of 65% in 2000 and declining to
46% in 2012-2016), Humboldt Park (54.8%), Hermosa (87%), Belmont Cragin (80.6%--largest
total Latino population in the city), Avondale (61.2%), Montclare (58.3%), Albany Park (48.3%),
and Irving Park (44.6%), all became large Latino enclaves during this time period (ibid). Other
areas such as Portage Park (42.7%), Dunning (29%) and Jefferson Park (22.9%) have also ex-
perienced recent demographic shifts, and may become majority Latino in the near future (Acos-
ta-Córdova, 2017; ACS 2012-2016). In addition to these areas, the area known as West Town
transitioned from an ethnic-European enclave, to a majority Latino enclave, but became majority
white again with gentrification since 1990 (Fernandez, 2012; Acosta-Córdova, 2017). The per-
centage of Latinos in West Town has decreased from 62% in 1990, to 46.9% in 2000, to 23.7% in
2010, to 26.4% in 2012-2016 (U.S. Census; ACS 2012-2016).
The Northwest side neighborhood with the most significant ethnic succession from 1980
to 2012-2016 is Belmont Cragin, which recently surpassed Little Village as the neighborhood
with the largest total Latino population in the city (Acosta-Córdova, 2017). It differs, however,
in terms of diversity of Latinos, whereas Little Village is 86% Mexican, Belmont Cragin is a mix
of Mexican (54.9%), Puerto Rican (15.8%), Guatemalan (2.7%), Ecuadorian (2.1%), as well as
74
smaller populations of many other Latino groups (ACS 2012-2016). In 1980, Latinos represented
only 6% of the total population in the area (U.S. Census 1980). This increased to 30% in 1990,
65% in 2000, 77% in 2010, and 80.6% in 2012-2016 (U.S. Census; ACS 2012-2016). This influx
of Latinos also significantly increased the total population in the neighborhood, going from
53,371 in 1980, to 78,155 in 2012-2016 (ibid). This is also a major difference between Little
Village and Belmont Cragin, Little Village has lost nearly 20,000 residents since 2000, decreas-
ing from 91,071 to 73,983 in 2012-2016 (ibid). Based on current trends of population loss in
Little Village, and growth in Belmont Cragin, the neighborhood will likely continue as the largest
current Latino settlement in the city.
On the Southeast side of the city, South Chicago (21%) and South Deering (28.3%)
continue to be smaller Latino enclaves as African-Americans became the majority in both neigh-
borhoods (ACS 2012-2016). The Latino settlements in South Chicago and South Deering are
among the oldest in city, with the first groups arriving after World War when they were recruited
as strikebreakers to work in the nearby steel factories (Innis-Jiménez, 2013). Latinos remained
in the area, even as most of the Ethnic-European groups abandoned the neighborhood follow-
ing the collapse of the steel industry. South Chicago went from being 94.8% White (Latinos
included), and 4.9% African-American in 1960, to 61.5% African-American, 33.6% Latino, and
16.8% Non-Latino White in 1990 (U.S. Census). The Latino population decreased, however,
to 27.4% in 2000, 18.1% in 2010, and 21% in 2012-2016 (U.S. Census; ACS 2012-2016). The
demographic shifts were similar in South Deering, with the population going from 99.2% White
(Latinos included) and 0.7% African-American in 1960, to 59% African-American, 28.4% Lati-
no, and 23.3% Non-Latino White in 1990 (U.S. Census). The Latino population then increased
to 30.5% in 2000, 45.3% in 2010, but has decreased to 28.3% according to 2012-2016 estimates
(U.S. Census; ACS 2012-2016). Latinos have migrated also in the south into the Eastside and
Hegewisch to become the largest group in both neighborhoods. The total percentage of Latinos
in Eastside increased from 13% in 1980, to 40% in 1990, to 68.1% in 2000, 78.7% in 2010, and
80% in 2012-2016 (ibid). In Hegewisch, the changes were not as significant, going from 12.7%

75
in 1990 to 28.8% in 2000, to 30.4% in 2010, to 50% in 2012-2016 (ibid).
As was the case for the original enclaves, the vast majority of these neighborhoods are in
close proximity to industrial corridors, especially the Southwest and Southeast neighborhoods. In
addition to the Little Village, Pilsen, Stockyards, and Calumet Industrial Corridors, are the Ste-
venson (1,245.3 acres, 4th largest overall), Greater Southwest (1,022.9 acres, 6th largest), and the
Brighton Park (400 acres) Industrial Corridors (City of Chicago, 2019). The boundaries of every
majority Latino neighborhood in the Southwest and Southeast sides of the city intersect with
an industrial corridor (see Maps 1-5). Within the city limits of Chicago, there is an inescapable
spatial relationship between Latinos and industry. This relationship is not as pronounced in the
northwest neighborhoods as it is further south, mainly due to the fact that the 6 largest industrial
corridors are all located south of Madison Ave., as are the majority of historically industrial land
uses in the city.
In addition to Latino settlement within the city limits, suburban communities have seen
a significant influx of Latinos since 1980 (See Maps 6-10). This is especially true for the largest
suburban municipalities of Chicago. Latinos are a significant population in 5 out of the top 6
largest suburban communities within the state boundaries, and are in fact the largest racial/eth-
nic group in Cicero (6th largest, 74,555 Latinos, 88.8% of pop.), Waukegan (5th largest, 48,966
Latinos, 55.5% of pop.), Elgin (4th largest, 50,457 Latinos, 45.1% of pop.), and Aurora (largest,
85,817 Latinos, 42.7% of pop.) (ACS 2012-2016). Latinos are the second largest group in Joliet
(2nd largest, 41,883 Latinos, 28.4% of pop.), but have not migrated into the wealthy suburb of
Naperville (3rd largest, 8,750 Latinos, 6% of total pop.) to the same extent (ibid). Within the
six-county region, there are 1,893,436 Latinos in total, which increases to more than 2 million
when including the populations of Lake County, Indiana, and Kenosha County, Wisconsin, both
of which are part of greater Chicagoland (ACS 2012-2016). This means that more Latinos live
in suburban communities than in the city, which has a population of 790,548 (ibid). All of this
growth has occurred since 1980 (see maps 6-10), however Mexican workers migrated to Au-
rora and Elgin as early as the 1920’s due to the availability of employment in manufacturing

76
(Chicago Encyclopedia). Growth to the rest of the suburban area, however, drastically increased
during the 1990’s and 2000’s (Paral, Ready, Chun, Sun, 2004). While migration to the suburbs
for non-Latino Whites was traditionally viewed as upward economic mobility, Latino settlement
in the suburbs has been significantly different. Although Latino households in the suburbs earn
roughly $11,000 more in annual household income, they also work an average of 8 more hours
per week than Latinos in Chicago (Koval, 2011). Additionally, suburban Latino households
earn roughly $4,000 more than suburban African-Americans, but $23,000 less than suburban
non-Latino Whites, $38,000 less than suburban Chinese and Indians, $36,000 less than Filipinos,
and $20,000 less than Koreans and Polish (Ibid). Therefore, while suburban Latino and Afri-
can-American households earn more than their urban counterparts, both groups earn significantly
less income than all other major populations in the region.

77
Map 1 – Latinos and Industry: Latino Settlement near Industrial Corridors, 1980

78
Map 2 – Latinos and Industry, Latino Settlement near Industrial Corridors, 1990

79
Map 3 – Latinos and Industry: Latino Settlement near Industrial Corridors, 2000

80
Map 4 – Latinos and Industry: Latino Settlement near Industrial Corridors, 2010
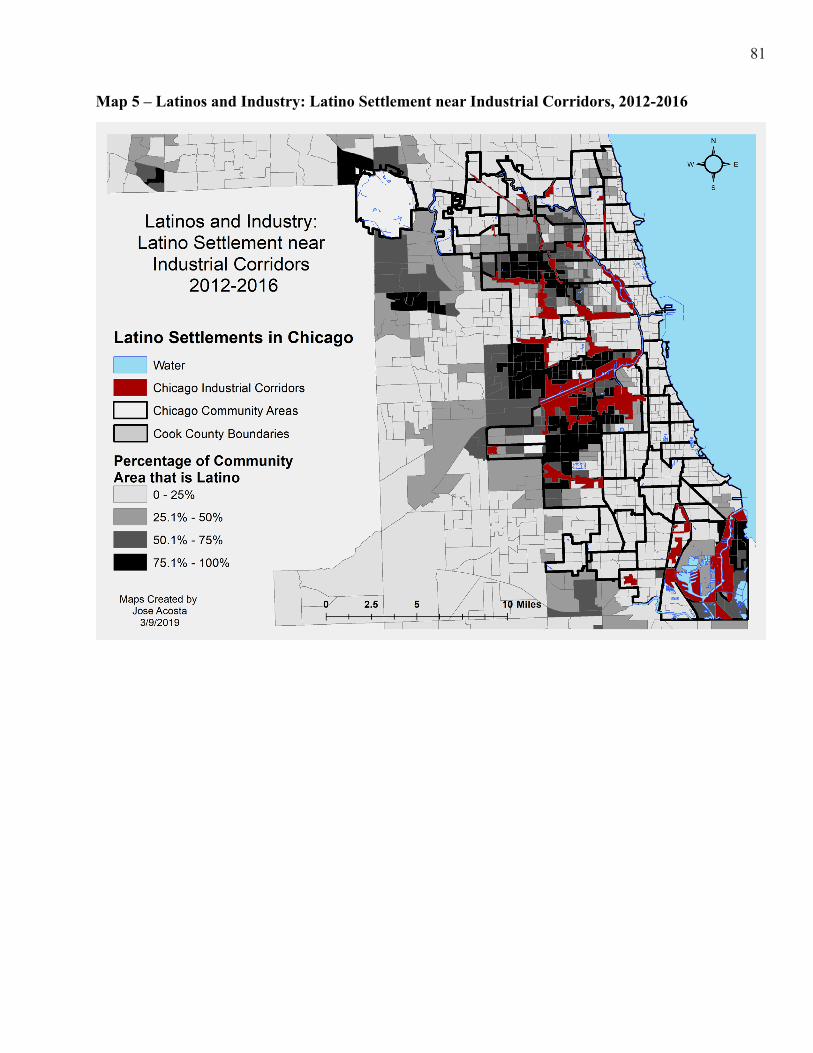
81
Map 5 – Latinos and Industry: Latino Settlement near Industrial Corridors, 2012-2016
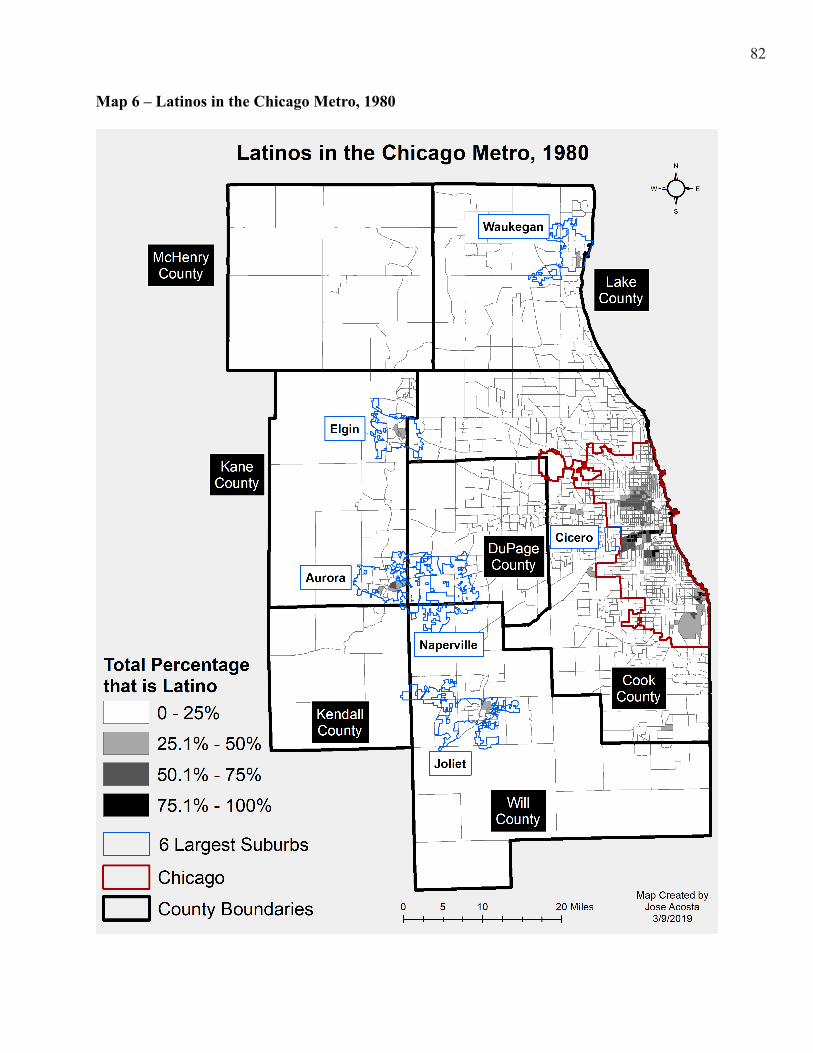
82
Map 6 – Latinos in the Chicago Metro, 1980
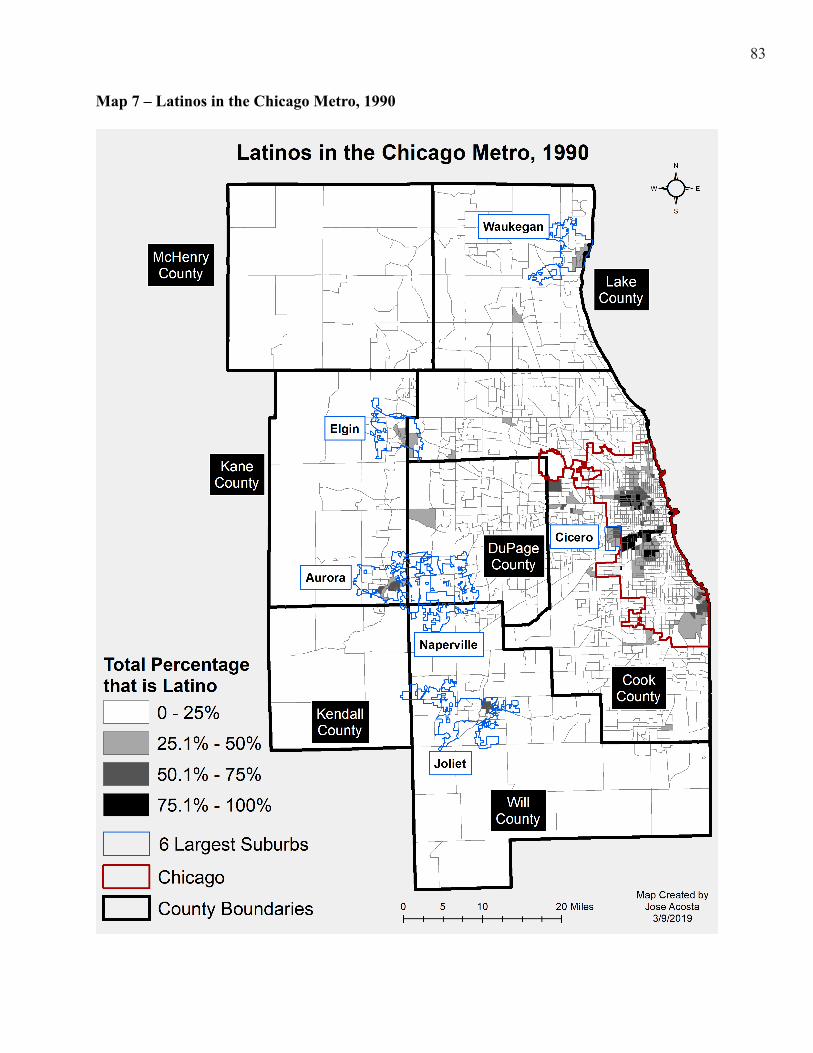
83
Map 7 – Latinos in the Chicago Metro, 1990

84
Map 8 – Latinos in the Chicago Metro, 2000
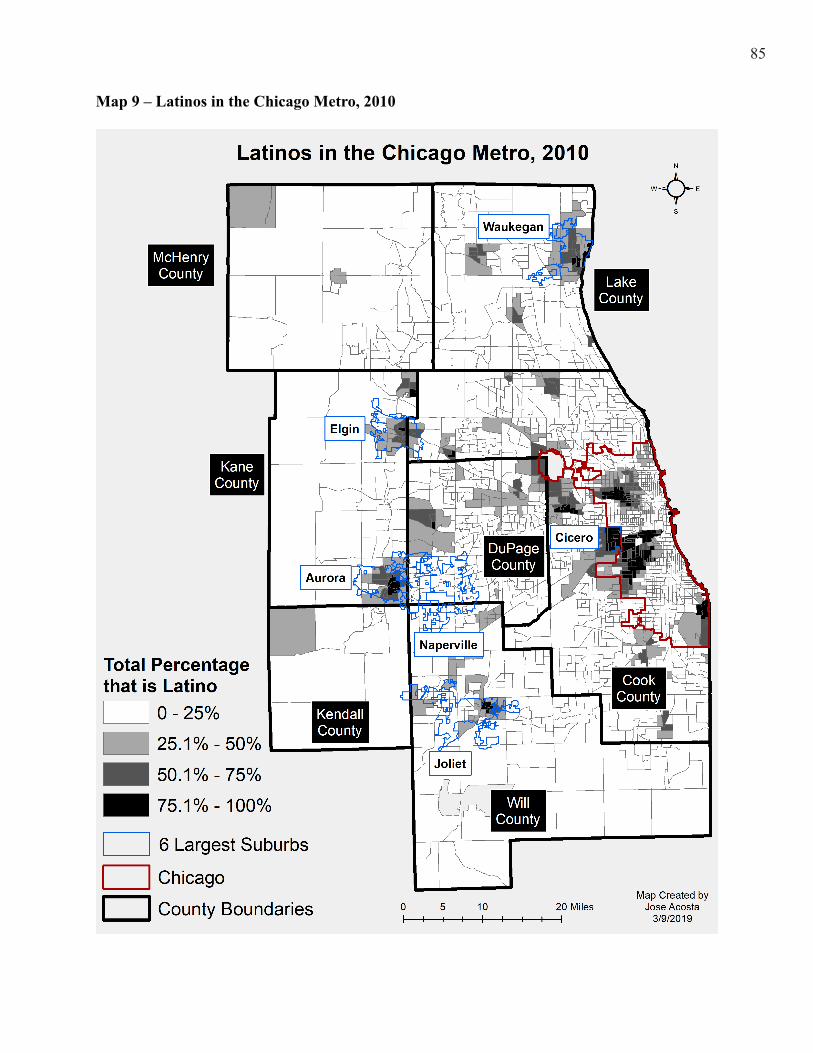
85
Map 9 – Latinos in the Chicago Metro, 2010
86
Map 10 – Latinos in the Chicago Metro, 2012-2016

87
VIII. Conclusions, Recommendations and Questions for Further Research
The 1993 study by Betancur et. al. concluded that Latino labor, primarily that of Mex-
icans and Puerto Ricans, facilitated the growth of the service sector in the Chicago economy
while continuing to further entrench the segmentation of Latinos labor in low-wage service
sector employment. They also described the conditions of “ascriptive low-wage labor,” which
restricted the options for labor force mobility for this group. Again, despite progress for Latinos
in several industries and occupations, overall they tend to be segmented into jobs and industries
with the lowest-wages. While African-Americans and Latinos both displayed similar conditions
in most of the categories, Latinos had lower wages in more industries and occupations than any
other group. This is crucial to understanding the reality of the economic conditions of Latino
households throughout the region. On an individual basis, Latinos earn the lowest wages within
the Chicago economy.
This also has several implications for policy makers. The educational attainment of Lati-
nos is a major concern, especially considering there was such a high percentage of adult Latinos
without a high school degree. However, even when accounting for a college degree, Latinos and
African-Americans still earned far less than Non-Latino Whites and Asians. While a college
degree alone won’t solve the wage differences, increasing the college completion rates of Latinos
and African-Americans may help increase the percentage of each group earning higher wages,
while decreasing the percentage of Latinos without a high school diploma may help decrease the
amount of Latinos earning the lowest wages.
Chicago’s economy has changed drastically since 1980. However, manufacturing remains
a key industry for Latino workers at 18.2% of the labor force, the third highest employer in
2012-2016. Retail Trade and Professional and Related Services are the two largest industries of
employment for Latinos overall. Occupationally, Operators, Fabricators, and Laborers continues
to be the largest category for Latinos; however, the most significant increase has taken place in
Service occupations, which is now the second largest category for Latinos. Each of these occupa-
tional categories accounts for roughly a quarter of the labor force and, together, for almost half.
88
The growth of Latinos correlates with the overall growth of Service occupations, and no other
racial/ethnic group experienced a larger increase in percentage of their labor force within this
category than Latinos did.
The differences between Latinos in the city and Latinos in the suburbs need to be ex-
plored further. Out of the more than 2 million Latinos in the Chicago metropolitan area, roughly
1.2 million currently reside in Suburban communities. This growth has primarily been a result
of the movement of manufacturing jobs to the suburbs. Suburban communities such as Aurora,
Elgin, Waukegan, Joliet and Cicero have all attracted significant Latino populations due to the
availability of employment in manufacturing related industries. Breaking down the details of
employment in these communities was beyond the scope of this thesis. However, understanding
any differences in economics between Latinos in the city and Latinos in the suburbs is crucial for
policy makers across the region.
Regardless of any economic progress by Latinos since 1980, the amount of the labor
force concentrated in low-wage industries and occupations shows that there is still ample room
for growth. The fact that Latinos did not progress to the same extent as other racial/ethnic groups
is also a major concern going forward. Since 1980, the Latino population has exploded in the
region, and if it were not for this influx, both the city and the metropolitan area would have lost a
significant amount of total population during this period. What is crucial to understand about the
restructuring of the Chicago economy, were it not for the influx of Latino immigrants, many in-
dustries that have grown or remained in the area since would not have found the labor to do it. It
is because of the large source of low-wage labor that these industries have prospered. Latino la-
bor has helped transform Chicago from an industrial metropolis into a modern-day, service-based
metropolis. One could argue, Latinos saved Chicago’s economy.

89
CITED LITERATURE
Acosta-Córdova, José Miguel. 2017. The Latino Neighborhoods Report: Issues and Prospects for Chicago, University of Illinois at Chicago: Institute for Research on Race and Public Policy and The Great Cities Institute, October.
Anderson, M. B., & Sternberg, C. (2013). “Non-White” gentrification in Chicago’s Bronzeville and Pilsen: Racial economy and the intraurban contingency of urban redevelopment. Urban Affairs Review, 49(3), 435-467.
Año-Nuevo Kerr, Louise. 1976. The Chicano Experience in Chicago: 1920-1970. Unpublished Dissertation, University of Illinois, Chicago.
Año-Nuevo Kerr, Louise. (n.d.). The Mexicans in Chicago. Retrieved September, 2016, from http://www.lib.niu.edu/1999/iht629962.html, n.d.
Asante-Muhammad, Dedrick and Jessika Lopez. 2017, February 08. Chicago, the Racial Wealth Divide and Mexican Americans. Retrieved July 09, 2017, from http://www.huffington-post.com/dedrick-muhammad/chicago-the-racial-wealth_b_14641412.html
Betancur, J. (2005). Gentrification before gentrification? The plight of Pilsen in Chicago. Natha-lie P. Voorhees Center for Neighborhood and Community Improvement White paper.
Betancur, J. (2011). Gentrification and community fabric in Chicago. Urban Stud-ies, 48(2), 383-406.
Betancur, John J. 2002. The politics of gentrification: the case of West Town in Chicago. Urban Affairs Review, 37(6), 780-814.
Betancur, John J. 1996. The settlement experience of Latinos in Chicago: Segregation, specula-tion, and the ecology model. Social Forces, 74(4), pp.1299-1324.
Betancur, John J., Cordova, T., & De los Angeles Torres, M. 1993. Economic restructuring and the process of incorporation of Latinos into the Chicago economy. Latinos in a changing US economy: Comparative perspectives on growing inequality, Chapter 7, pp. 109-32.
Brenner, Neil and Nik Theodore. 2005. Neoliberalism and the urban condition. City, 9(1), pp.101-107,
Cervantes, Arturo. 1996. “Latinos in the US and Chicago: The History, Demographics, and Pros-pects of a Growing Population.” Chicago Project News 2, no. 3, pp.1-4.
Cohn, D’Vera. 2010, March 03. “Census History: Counting Hispanics.” Pew Research Center: Social and Demographic Trends. Retrieved September, 2016, from http://www.pewsocial-trends.org/2010/03/03/census-history-counting-hispanics-2/

90
Córdova, Teresa. 2014. “Neoliberal Policy Regimes: Implications for Latino Studies Scholar-ship,” in Aztlán: A Journal of Chicano Studies, 41:1, Spring, 2016.
De Long, J. B., & Eichengreen, B. (1991). The Marshall Plan: History’s most successful structur-al adjustment program (No. w3899). National Bureau of Economic Research.
Fernandez, Lilia. 2012. Brown in the windy city: Mexicans and Puerto Ricans in postwar Chica-go. University of Chicago Press.
Galeano, E. (1971). Open veins of Latin America: Five centuries of the pillage of a continent. NYU Press.
García, V., & González, L. (2009). Labor migration, drug trafficking organizations, and drug use: major challenges for transnational communities in Mexico. Urban anthropology and studies of cultural systems and world economic development, 38(2-4), 303.
Gonzalez-Barrera, Ana and Lopez, Mark H. 2013, May 01. A Demographic Portrait of Mexi-can-Origin Hispanics in the United States. Retrieved September, 2016, from http://www.pewhispanic.org/2013/05/01/a-demographic-portrait-of-mexican-origin-hispanics-in-the-united-states/
Haub, Carl. 2012, November. Changing the Way U.S. Hispanics Are Counted. Retrieved Septem-ber, 2016, from http://www.prb.org/Publications/Articles/2012/us-census-and-hispanics.aspx
Innis-Jiménez, Michael. 2013. Steel barrio: The great Mexican migration to south Chicago, 1915-1940. New York University Press.
Jokisch, B., & Pribilsky, J. (2002). The panic to leave: Economic crisis and the “new emigration” from Ecuador. International Migration, 40(4), 75-102.
Koval, J. P. (2011). Suburban Chicago: The Latino Capital of the Midwest. Di· logo, 14(1), 6.
Lehoucq, F., & Pérez-Liñán, A. (2014). Breaking out of the coup trap: political competition and military coups in Latin America. Comparative Political Studies, 47(8), 1105-1129.
Martínez, O. J. (Ed.). (1996). US-Mexico borderlands: Historical and contemporary perspectives. Rowman & Littlefield Publishers.
Mihalopoulos, Dan and Evan Osnos. 2001, May 10. “Chicago a hub for Mexicans” in Chicago Tribune. Retrieved Spring, 2017, from http://articles.chicagotribune.com/2001-05-10/news/0105100211_1_mexican-hispanic-census
Mize, R. L., & Swords, A. C. (2010). Consuming Mexican labor: From the Bracero program to NAFTA. University of Toronto Press.
91
Paral, Rob, Timothy Ready, Sung Chun and Wei Sun. 2004.Latino Demographic Growth in Metropolitan Chicago. Institute for Latino Studies, Notre Dame University, Vo. 2004.2, December.
Ranney, David. 2002. Global Decisions, Local Collisions: Urban life in the new world order. Temple University Press.
Ready, Timothy, and Albert Brown-Gort. 2005. The state of Latino Chicago: This is home now. University of Notre Dame, Institute for Latino Studies.
Rockoff, H. (2012). America’s economic way of war: war and the US economy from the Span-ish-American War to the Persian Gulf War. Cambridge University Press.
Sassen, Saskia. 1988. The Mobility of Labor and Capital. Cambridge: Cambridge University Press.
Steven Ruggles, Sarah Flood, Ronald Goeken, Josiah Grover, Erin Meyer, Jose Pacas, and Matthew Sobek. IPUMS USA: Version 9.0 [dataset]. Minneapolis, MN: IPUMS, 2019. https://doi.org/10.18128/D010.V9.0
Suro, Roberto, and Audrey Singer. 2002. Latino growth in metropolitan America: Changing pat-
terns, new locations. Brookings Institution, Center on Urban and Metropolitan Policy in collaboration with the Pew Hispanic Center.
Taylor, Marcus. From Pinochet to the ‘Third Way’: Neoliberalism and social transformation in Chile. London: Pluto Press, 2006
Taylor, Marcus. “The Reformulation of Social Policy in Chile, 1973—2001: Questioning a Neo-liberal Model.” Global Social Policy 3.1 (2003): 21-44.
Usowski, K. G. (n.d.). Chicago Census Data. Retrieved September, 2016, from https://socds.huduser.gov/Census/race.odb?newmsacitylist=1600.0%2A1700014000%2A1.0&msa-var=1&metro=msa
Winn, Peter, ed. 2004.Victims of the Chilean Miracle: Workers and Neoliberalism in the Pinochet Era: 1973-2002. Duke University Press.

92
BIBLIOGRAPHY ON LATINOS IN CHICAGO
Demographic Overview:
Orfield, Gary,Ricardo M. Tostado, and Sheila A. Black. Latinos in Metropolitan Chicago: A Study of Housing and Employment. Vol. 6. Latino Institute, Research Division, 1983.
Acosta-Córdova, José Miguel. 2017. The Latino Neighborhoods Report: Issues and Prospects for Chicago, University of Illinois at Chicago: Institute for Research on Race and Public Policy and The Great Cities Institute, October 2017.
Cervantes, Arturo. “Latinos in the US and Chicago: The History, Demographics, and Prospects
of a Growing Population.” Chicago Project News 2, no. 3 (1996): 1-4.
Paral, Rob, Timothy Ready, Sung Chun and Wei Sun. Latino Demographic Growth in Metropol-itan Chicago. Institute for Latino Studies, Notre Dame University, Vo. 2004.2, December 2004.
Suro, Roberto, and Audrey Singer. Latino growth in metropolitan America: Changing patterns, new locations. Brookings Institution, Center on Urban and Metropolitan Policy in collab-oration with the Pew Hispanic Center, 2002.
Economics:
Betancur, John J., Cordova, T., & De los Angeles Torres, M. (1993). Economic restructuring and the process of incorporation of Latinos into the Chicago economy. Latinos in a changing US economy: Comparative perspectives on growing inequality, 7, 109-32.
Córdova, Teresa. (2014). “Neoliberal Policy Regimes: Implications for Latino Studies Scholar-ship,” in Aztlán: A Journal of Chicano Studies, 41:1, Spring, 2016.
Ranney, David C., and William Cecil. Transnational investment and job loss in Chicago: Impacts on women, African-Americans and Latinos. University of Illinois at Chicago, Center of Urban Economic Development, 1993.
Peck, Jamie, and Nik Theodore. “Contingent Chicago: Restructuring the spaces of temporary labor.” International Journal of Urban and Regional Research 25, no. 3 (2001): 471-496.
Tienda, Marta. “Latinos and the American Pie: Can Latinos Achieve Economic Parity?.” Hispan-ic Journal of Behavioral Sciences 17, no. 4 (1995): 403-429.
93
Historical studies
Año-Nuevo Kerr, Louise A. “Chicano settlements in Chicago: A brief history.” The Journal of Ethnic Studies 2, no. 4 (1975): 22.
Año-Nuevo Kerr, Louise. (1976).The Chicano Experience in Chicago: 1920-1970.Unpublished Dissertation, University of Illinois, Chicago.
Arredondo, Gabriela F. Mexican Chicago: Race, Identity, and Nation, 1916-39. Vol. 43. Univer-sity of Illinois Press, 2008.
Fernandez, Lilia. Brown in the windy city: Mexicans and Puerto Ricans in postwar Chicago. University of Chicago Press, 2012.
Innis-Jiménez, Michael. Steel barrio: The great Mexican migration to south Chicago, 1915-1940. NYU Press, 2013.
Krysan, M., Couper, M. P., Farley, R., & Forman, T. A. (2009). Does race matter in neighbor-hood preferences? Results from a video experiment. AJS; American journal of sociolo-gy, 115(2), 527-59. https://www.ncbi.nlm.nih.gov/pmc/articles/PMC3704191/
Neighborhoods, Settlements, Social Cohesion + Ethnographies
Almeida, Joanna, Ichiro Kawachi, Beth E. Molnar, and S. V. Subramanian. “A multilevel analy-sis of social ties and social cohesion among Latinos and their neighborhoods: results from Chicago.” Journal of Urban Health 86, no. 5 (2009): 745-759. https://www.ncbi.nlm.nih.gov/pmc/articles/PMC2729863/
Betancur, John J. (1996). The settlement experience of Latinos in Chicago: Segregation, specula-tion, and the ecology model. Social Forces, 74(4), 1299-1324.
Betancur, John. (2011). Gentrification and community fabric in Chicago. Urban Studies, 48(2), 383-406.
Krysan, Maria, Mick P. Couper, Reynolds Farley, and Tyrone A. Forman. “Does race matter in neighborhood preferences? Results from a video experiment.” American journal of so-ciology 115, no. 2 (2009): 527-559.
https://www.ncbi.nlm.nih.gov/pmc/articles/PMC3704191/
Flores-Gonzalez, Nilda. “Paseo Boricua: Claiming a Puerto Rican space in Chicago.” Centro Journal 13, no. 2 (2001).
Fox, Jonathan A., and Xóchitl Bada. “Migrant civic engagement.” (2009).

94
de Lourdes Villar, Maria. “Rethinking settlement processes: The experience of Mexican undocu-mented migrants in Chicago.” Urban Anthropology and Studies of Cultural Systems and World Economic Development (1990): 63-79.
Michelson, M. R. (2000). Political efficacy and electoral participation of Chicago Latinos. Social science quarterly, 136-150.
Policing
De Genova, Nicholas, and Ana Y. Ramos-Zayas. “Latino rehearsals: Racialization and the pol-itics of citizenship between Mexicans and Puerto Ricans in Chicago.” The Journal of Latin American and Caribbean Anthropology 8, no. 2 (2003): 18-57.
Lurigio, Arthur J., Richard G. Greenleaf, and Jamie L. Flexon. “The effects of race on relation-ships with the police: A survey of African American and Latino youths in Chicago.” W. Criminology Rev. 10 (2009): 29.
Skogan, Wesley G. “Community Policing and the New.” Justice and safety in America’s immi-grant communities (2006): 43.
Skogan, W. G. (2012). Police and Community in Chicago: A Tale of Three Cities. Oxford Uni-versity Press. https://doi.org/10.1093/acprof:oso/9780195154580.001.0001
Health Studies
Cagney, Kathleen A., Christopher R. Browning, and Danielle M. Wallace. “The Latino paradox in neighborhood context: the case of asthma and other respiratory conditions.” American Journal of Public Health 97, no. 5 (2007): 919-925. http://ajph.aphapublications.org/doi/full/10.2105/AJPH.2005.071472
McDermott, Michael, Julio Silva, Robert Rydman, Aida L. Giachello, Everildes Yarzagaray, Don Robinson, Nilda Peragallo, Hilda Barquero, and Jose O. Arrom. “Practice variations in treating urban minority asthmatics in Chicago.” Journal of medical systems 20, no. 5 (1996): 255-266.
Jurkowski, Janine M., and Timothy P. Johnson. “Acculturation and cardiovascular disease screening practices among Mexican Americans living in Chicago.” Ethnicity and Disease 15, no. 3 (2005): 411.
Linguistic Studies
Cintron, Ralph. Angels’ town: Chero ways, gang life, and rhetorics of the everyday. Boston: Bea-con Press, 1997.
95
Farr, Marcia, ed. Latino language and literacy in ethnolinguistic Chicago. Routledge Press, 2005.
Farr, Marcia, and E. Dominguez Barajas. “Latinos and diversity in a global city: Language and identity at home, school, church, and work.” Latino language and literacy in ethnolin-guistic Chicago (2005): 3-28.
Guerra, Juan C. Close to home: Oral and literate practices in a transnational Mexicano commu-nity. Teachers College Press, 1998.
Potowski, Kim. “Spanish language shift in Chicago.” Southwest Journal of Linguistics 23, no. 1 (2004): 87-117.
Education
Soltero, Jose, Sonia Soltero, and Elizabeth Robbins. “Latinos and education in the Chicago metropolitan area.” Latinos in Chicago: Reflections of an American landscape (2010): 67-124.
Olmedo, Irma M. “Accommodation and resistance: Latinas struggle for their children’s educa-tion.” Anthropology & Education Quarterly 34, no. 4 (2003): 373-395.
Lipman, Pauline. “Chicago school policy: Regulating Black and Latino youth in the global city.” Race Ethnicity and Education 6, no. 4 (2003): 331-355.
Housing
Troche-Rodriguez, Madeline. “Latinos and their housing experiences in metropolitan Chicago: Challenges and recommendations.” Harvard Journal of Hispanic Policy 21 (2009): 17-34.
Immigrant Rights
Pallares, Amalia, and Nilda Flores-González, eds. ¡ Marcha!: Latino Chicago and the immigrant rights movement. Vol. 34. University of Illinois Press, 2010.
Chun, Sung. “Remittance Behavior, Assimilation, and Socio-Cultural-Economic Factors: A Case Study of Latinos in the Chicago Metropolitan Area.” In Annual Meeting of the Population Association of America, Philadelphia, PA, March. 2005.
96
Citizenship
Bada, Xóchitl. Mexican hometown associations in Chicagoacán: From local to transnational civic engagement. Rutgers University Press, 2014.
Oboler, Suzanne, ed. Latinos and citizenship. Palgrave Macmillan, 2006.
Rivera-Salgado, Gaspar, Xóchitl Bada, and Luis Escala-Rabadán. “Mexican migrant civic and political participation in the US: The case of hometown associations in Los Angeles and Chicago.” In seminar Mexican Migrant Social and Civic Participation in the United States, Washington, DC. 2005.
Politics
Betancur, John J., and Douglas C. Gills. “The African American and Latino Coalition Experience in Chicago Under Mayor Harold Washington,” in Betancur, J. and D. Gills. The collaborative city: Opportunities and struggles for Blacks and Latinos in US cities (2000): 59-87.
Córdova, Teresa. “Harold Washington and the Rise of Latino Electoral Politics in Chicago: 1982-1987” in Chicano Politics and Society, Austin: University of Texas Press,1999: 31-57.
Domínguez, Jaime. “Latinos in Chicago: A Strategy Towards Political Empowerment (1975-2003).” PhD diss., University of Illinois at Chicago, 2007.
Masuoka, Natalie. “Defining the group: Latino identity and political participation.” American
Politics Research 36, no. 1 (2008): 33-61.
Torres, Maria de los Angeles. “The Commission on Latino Affairs: A case study of community empowerment.” Harold Washington and the Neighborhoods: Progressive City Govern-ment in Chicago, 1983-1987 (1991).
Miscellaneous
Allen, Richard L., and David E. Clarke. “Ethnicity and mass media behavior: A study of Blacks and Latinos.” Journal of Broadcasting & Electronic Media 24, no. 1 (1980): 23-34.
Betancur, John Jairo, and Doug Gills, eds. The collaborative city: Opportunities and struggles for Blacks and Latinos in US cities. Vol. 8. Taylor & Francis, 2000.
Davis, Mike. Magical urbanism: Latinos reinvent the US city. Verso, 2001.
Villanueva, Margaret, Brian Erdman, and Larry Howlett. World City/Regional City: Latinos and African-Americans in Chicago and St. Louis. No. 46. Julian Samora Research Institute, Michigan State University, 2000.

97
José Miguel Acosta-Córdova
B.A., Urban and Public Affairs, University of Illinois at Chicago, Chicago, Illinois, 2015
Master in Urban Planning and Policy, University of Illinois at Chicago,Chicago, Illinois, Expected 2019
Little Village Environmental Justice Organization, Environmental Planning and Research Organizer, July 2018 – Present
Office of Social Science Research, University of Illinois at ChicagoResearch Assistant, June 2017 – December 2017
Institute for Research on Race and Public Policy, University of Illinois at ChicagoResearch Assistant, February 2017 – December 2017
Resource Center for Raza Planning, University of New Mexico, 2013 Apprentice, American Community Survey, U.S. Census Bureau
James J. Stukel Student Fellow, Great Cities Institute, University of Illinois at Chicago, 2016-2017; 2017-2018
American Planning Association, Student Member
Acosta-Córdova, José Miguel. The Latino Neighborhoods Report: Issue and Prospect for Chicago, produced for Metropolitan Family Services, produced by University of Illinois at Chicago’s Institute for Research on Race and Public Policy (IRRPP) and the Great Cities Institute, October 11, 2017.
Henricks, Kasey, José Miguel Acosta-Córdova and Amanda Lewis, “How prisons inflate white voting power in downstate Illinois, Chicago Reporter, October 9, 2017.
A Tale of Three Cities: The 2017 State of the Racial Justice in Chicago Report, Institute for Research on Race and Public Policy, May 9, 2017.
Todd-Breland, E. (2018). A political education: Black politics and education reform in Chicago since the 1960s. UNC Press Books.
VITA
NAME:
EDUCATION:
EMPLOYMENT:
ACADEMIC AWARDS:
PROFESSIONAL MEMBERSHIP:
PUBLICATIONS:
GIS MAPS PRODUCED FOR PUBLICATIONS: