Embed Size (px)
DESCRIPTION
study material...easy to understand
Citation preview
FOLIN – LOWRY’S METHOD FOR PROTEIN
DETERMINATION
By:Simran Kaur
Priyanka GautamS.Swetha
INTRODUCTION•Lowry protein assay is a biochemical assay for determining the total level of proteins in a solutions.
•This method is named on the name of biochemist OLIVER .H.LOWRY .
HISTORY
Wu first proposed the use of folin phenol reagent in 1922.
In 1940, O.H.LOWRY devised and modified the folin reagent.
In 1951, his work was cited in’the journal of biological chemistry ‘.
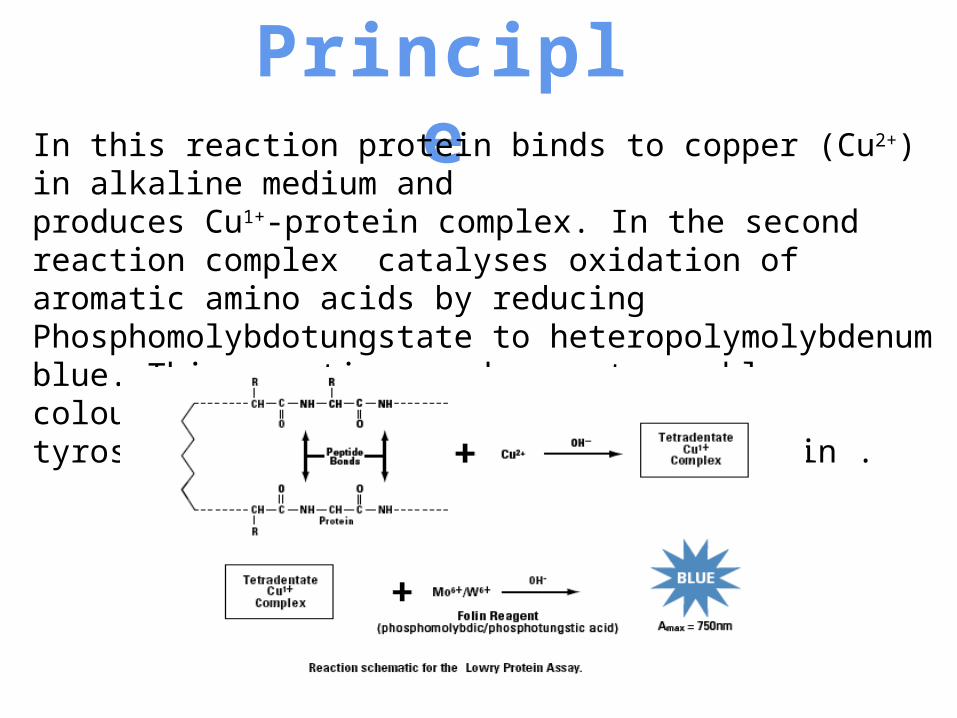
PrincipleIn this reaction protein binds to copper (Cu2+) in alkaline medium and produces Cu1+-protein complex. In the second reaction complex catalyses oxidation of aromatic amino acids by reducing Phosphomolybdotungstate to heteropolymolybdenum blue. This reaction produces strong blue colour,which predominantly depends upon tyrosine and tryptophan content of protein .
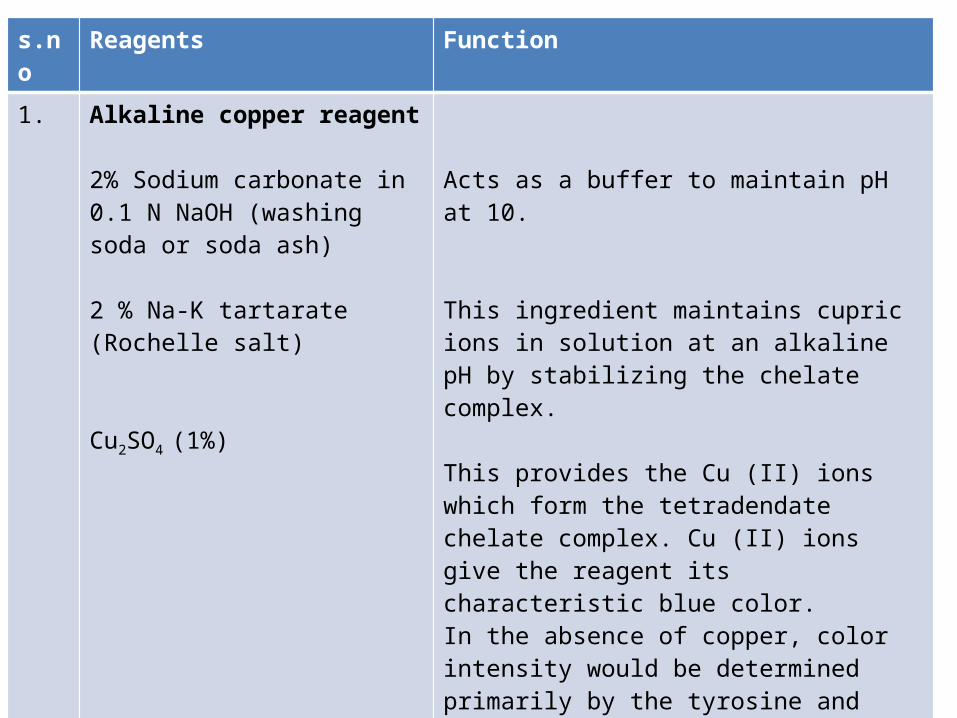
s.no Reagents Function
1. Alkaline copper reagent 2% Sodium carbonate in 0.1 N NaOH (washing soda or soda ash) 2 % Na-K tartarate(Rochelle salt) Cu2SO4 (1%)
Acts as a buffer to maintain pH at 10. This ingredient maintains cupric ions in solution at an alkaline pH by stabilizing the chelate complex.
This provides the Cu (II) ions which form the tetradendate chelate complex. Cu (II) ions give the reagent its characteristic blue color. In the absence of copper, color intensity would be determined primarily by the tyrosine and tryptophan content of the protein, and to a lesser extent by cysteine and histidine. Copper(II) enhances color formation by chelation with the peptide backbone, thus facilitating the transfer of electrons to the chromogens.
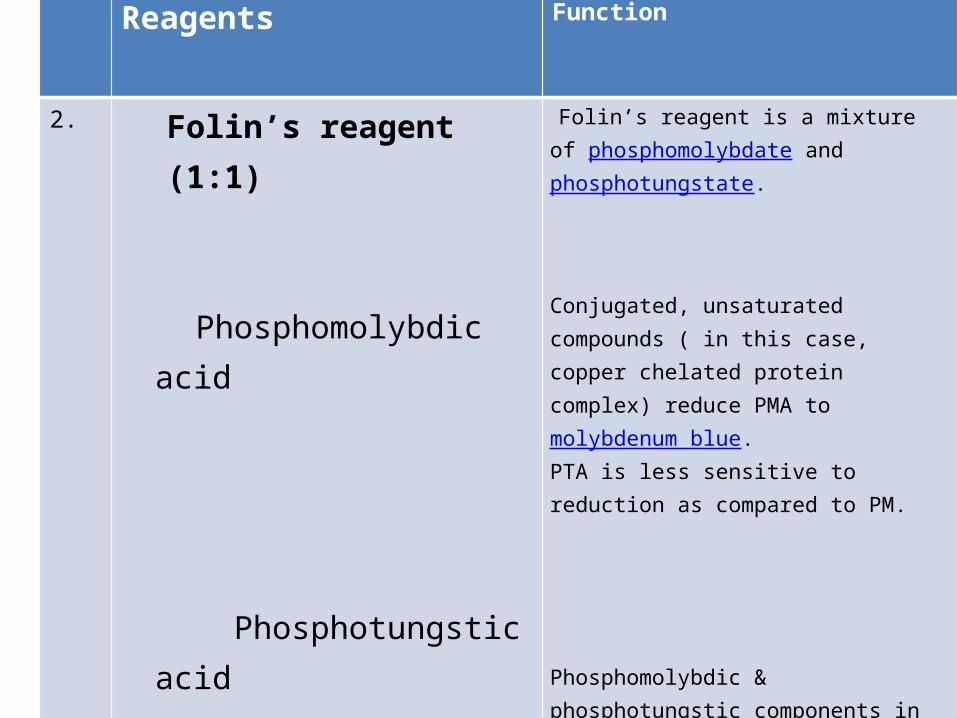
Reagents Function
2. Folin’s reagent (1:1)
Phosphomolybdic acid
Phosphotungstic acid
Folin’s reagent is a mixture of phosphomolybdate and phosphotungstate.
Conjugated, unsaturated compounds ( in this case, copper chelated protein complex) reduce PMA to molybdenum blue. PTA is less sensitive to reduction as compared to PM.
Phosphomolybdic & phosphotungstic components in FC reagents gets reduced by certain amino acids present in the protein like tyrosine , tryptophan thereby to their respective oxides. Estimation of this compound in turn provides the amount of protein present in the sample.
PROCEDURE FOR PROTEINESTIMATION BY LOWRY’S METHOD
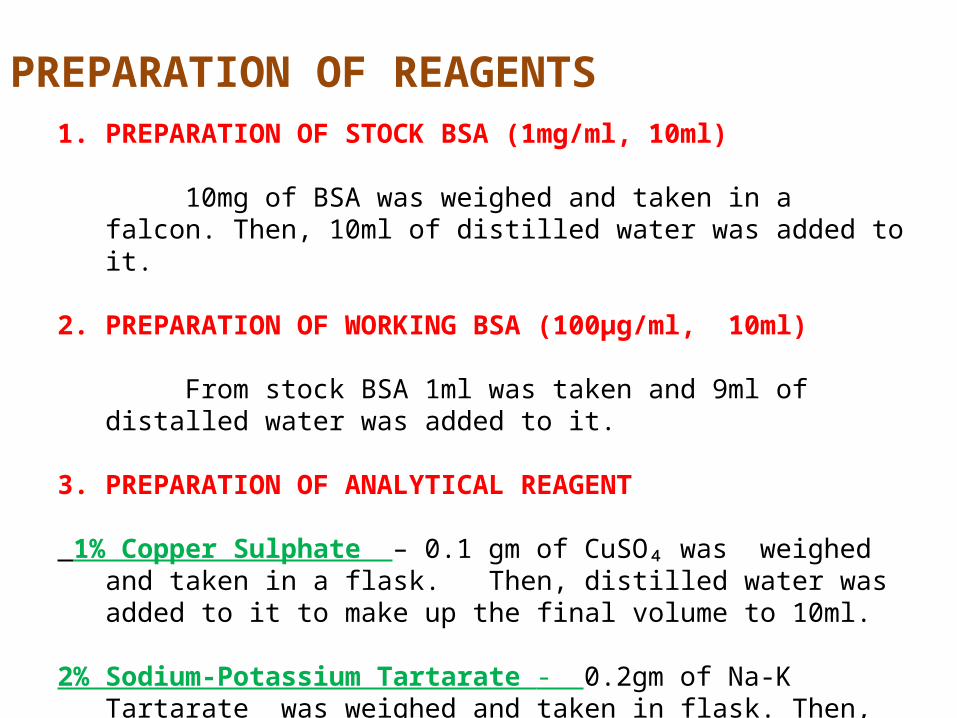
PREPARATION OF REAGENTS1. PREPARATION OF STOCK BSA (1mg/ml, 10ml)
10mg of BSA was weighed and taken in a falcon. Then, 10ml of distilled water was added to it.
2. PREPARATION OF WORKING BSA (100µg/ml, 10ml)
From stock BSA 1ml was taken and 9ml of distalled water was added to it.
3. PREPARATION OF ANALYTICAL REAGENT
1% Copper Sulphate – 0.1 gm of CuSO₄ was weighed and taken in a flask. Then, distilled water was added to it to make up the final volume to 10ml.
2% Sodium-Potassium Tartarate - 0.2gm of Na-K Tartarate was weighed and taken in flask. Then, distilled water was added to it to make up the final volume to 10ml.
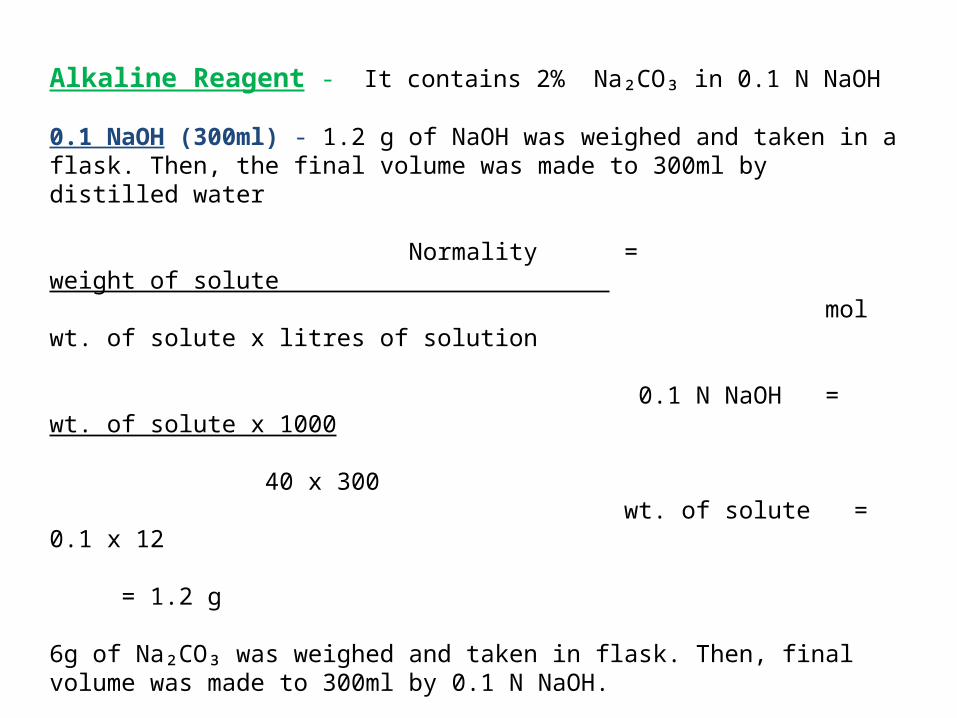
Alkaline Reagent - It contains 2% Na₂CO₃ in 0.1 N NaOH
0.1 NaOH (300ml) - 1.2 g of NaOH was weighed and taken in a flask. Then, the final volume was made to 300ml by distilled water
Normality = weight of solute mol wt. of solute x litres of solution
0.1 N NaOH = wt. of solute x 1000 40 x 300 wt. of solute = 0.1 x 12 = 1.2 g
6g of Na₂CO₃ was weighed and taken in flask. Then, final volume was made to 300ml by 0.1 N NaOH.
Then, analytical reagent was prepared by adding Na-K Tartarate : CuSO₄ : Alkaline Reagent in the ratio of 0.5 : 0.5 : 49For 300ml of Analytical reagent 1.5ml Na-K Tartarate, 1.5ml CuSO₄ and 297ml of alkaline reagent was added. These are to be added in a specific order only. Na-K Tartarate is the first to be added followed by CuSO₄, then alkaline reagent.
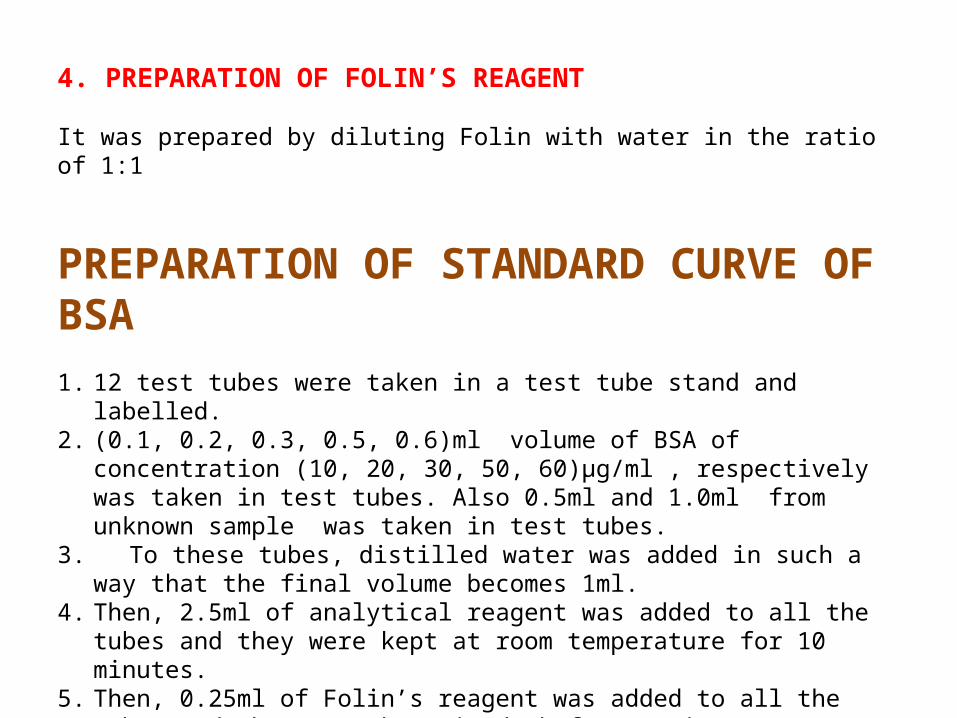
4. PREPARATION OF FOLIN’S REAGENT
It was prepared by diluting Folin with water in the ratio of 1:1
PREPARATION OF STANDARD CURVE OF BSA1. 12 test tubes were taken in a test tube stand and labelled.2. (0.1, 0.2, 0.3, 0.5, 0.6)ml volume of BSA of concentration (10, 20, 30, 50, 60)µg/ml ,
respectively was taken in test tubes. Also 0.5ml and 1.0ml from unknown sample was taken in test tubes.
3. To these tubes, distilled water was added in such a way that the final volume becomes 1ml.
4. Then, 2.5ml of analytical reagent was added to all the tubes and they were kept at room temperature for 10 minutes.
5. Then, 0.25ml of Folin’s reagent was added to all the tubes and they were kept in dark for 30 minutes.
6. Absorbance was taken at 660nm. Then , a standard curve was plotted and the concentration of unknown sample was found.
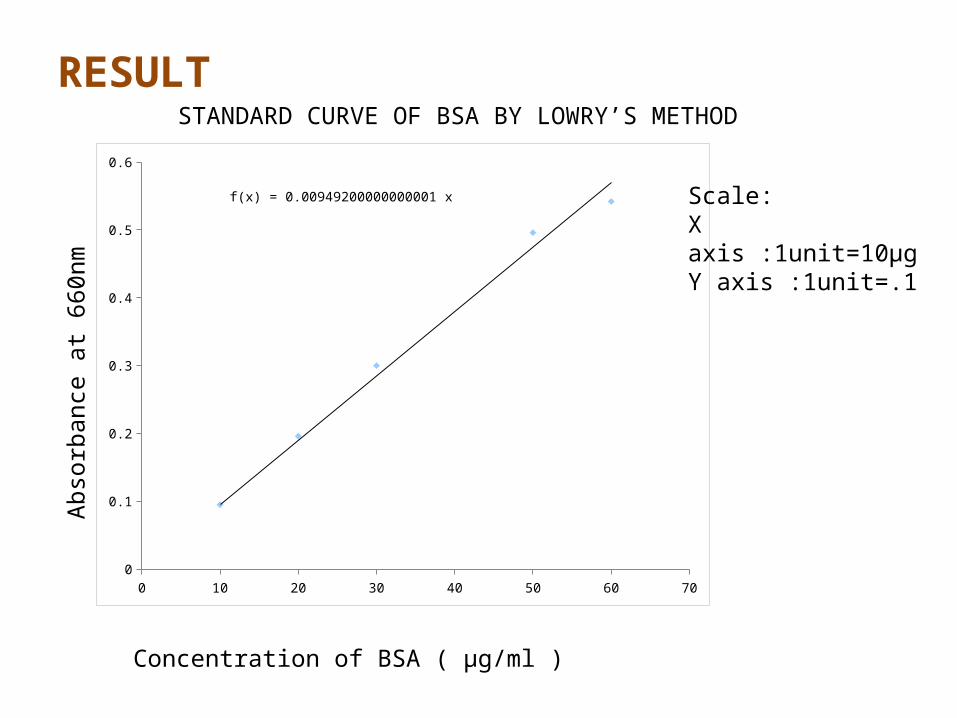
RESULT
0 10 20 30 40 50 60 700
0.1
0.2
0.3
0.4
0.5
0.6
f(x) = 0.00949200000000001 x
Concentration of BSA ( µg/ml )
Abso
rban
ce a
t 660
nm
STANDARD CURVE OF BSA BY LOWRY’S METHOD
Scale:X axis :1unit=10µgY axis :1unit=.1
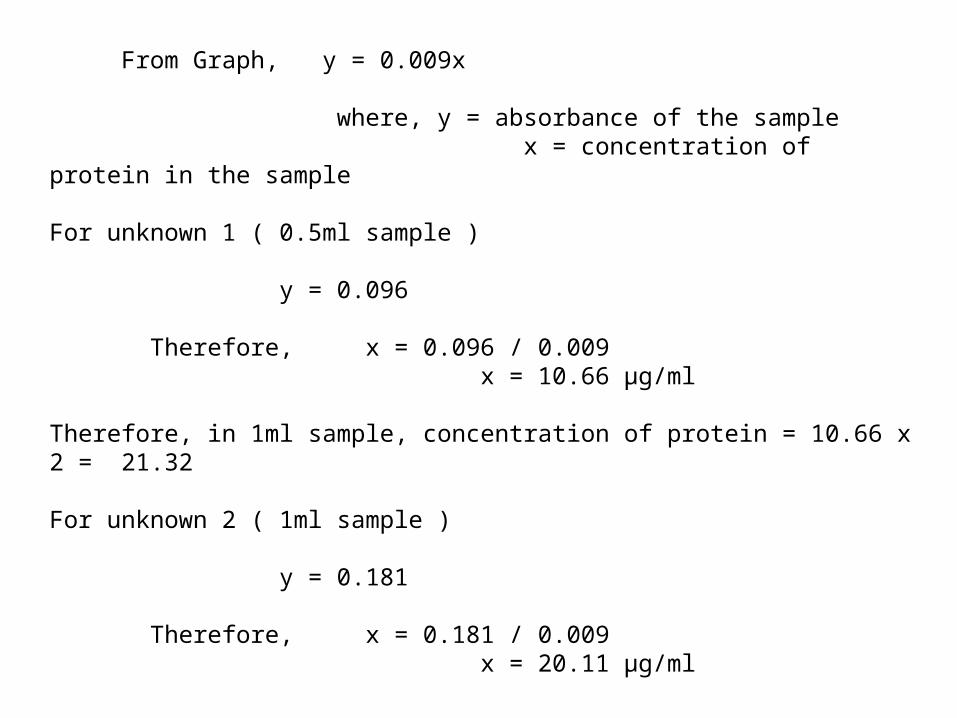
From Graph, y = 0.009x
where, y = absorbance of the sample x = concentration of protein in the sample
For unknown 1 ( 0.5ml sample )
y = 0.096 Therefore, x = 0.096 / 0.009 x = 10.66 µg/ml Therefore, in 1ml sample, concentration of protein = 10.66 x 2 = 21.32
For unknown 2 ( 1ml sample )
y = 0.181
Therefore, x = 0.181 / 0.009 x = 20.11 µg/ml
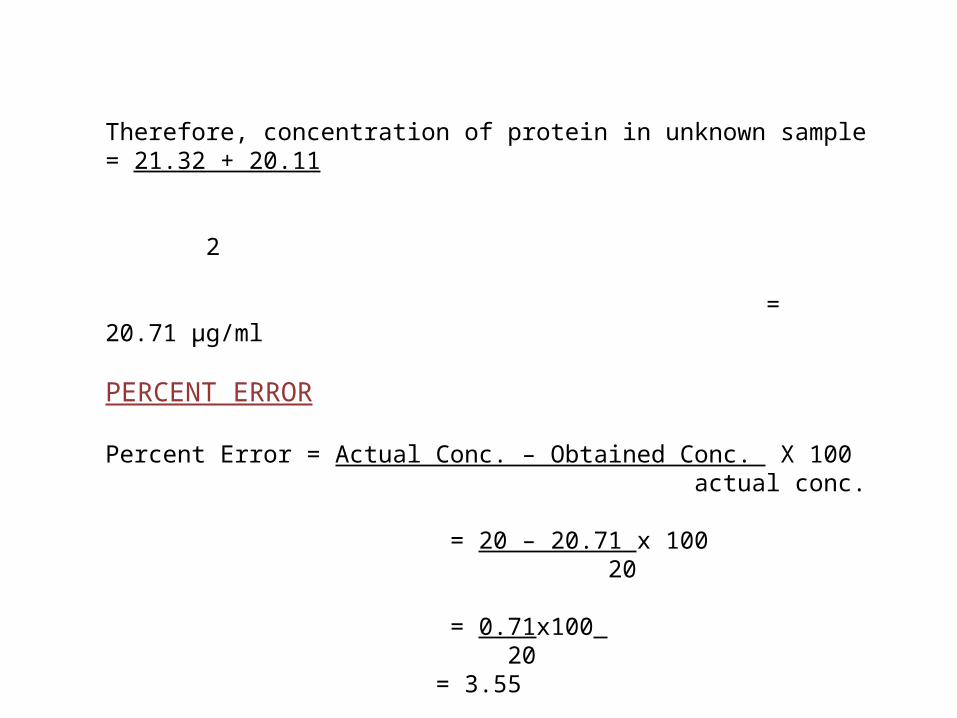
Therefore, concentration of protein in unknown sample = 21.32 + 20.11 2 = 20.71 µg/ml
PERCENT ERROR
Percent Error = Actual Conc. – Obtained Conc. X 100 actual conc.
= 20 – 20.71 x 100 20
= 0.71x100 20 = 3.55

LOWRY’s PROTEIN ASSAY
ADVANTAGES AND DISADVANTAGES
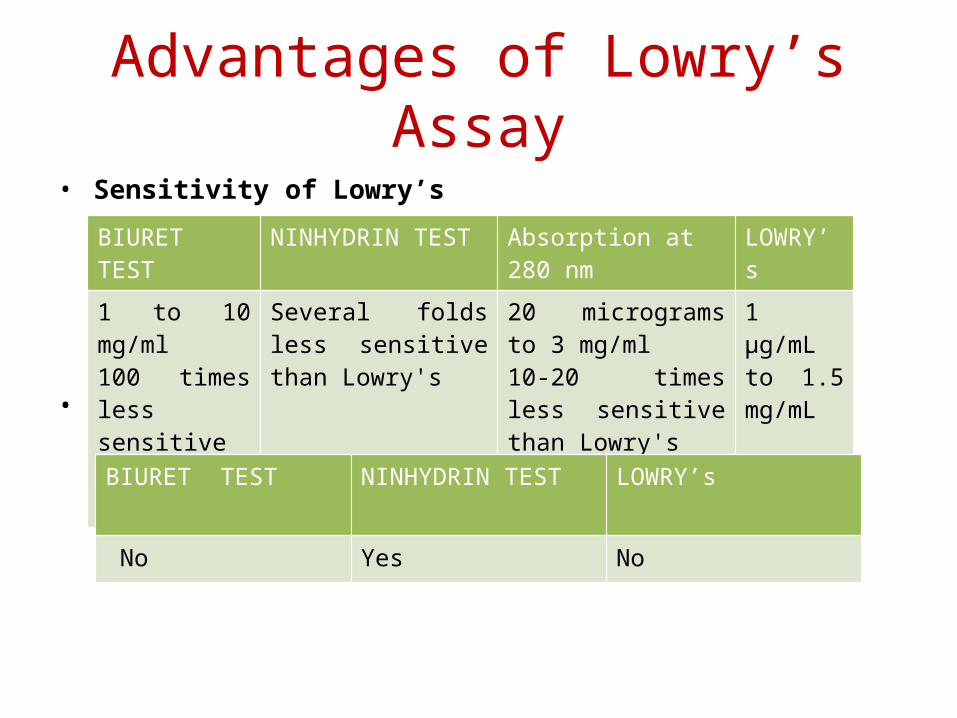
Advantages of Lowry’s Assay• Sensitivity of Lowry’s
• Protein Digestion
BIURET TEST NINHYDRIN TEST Absorption at 280 nm LOWRY’s
1 to 10 mg/ml100 times less sensitive than Lowry's
Several folds less sensitive than Lowry's
20 micrograms to 3 mg/ml10-20 times less sensitive than Lowry's
1 µg/mL to 1.5 mg/mL
BIURET TEST NINHYDRIN TEST LOWRY’s
No Yes No
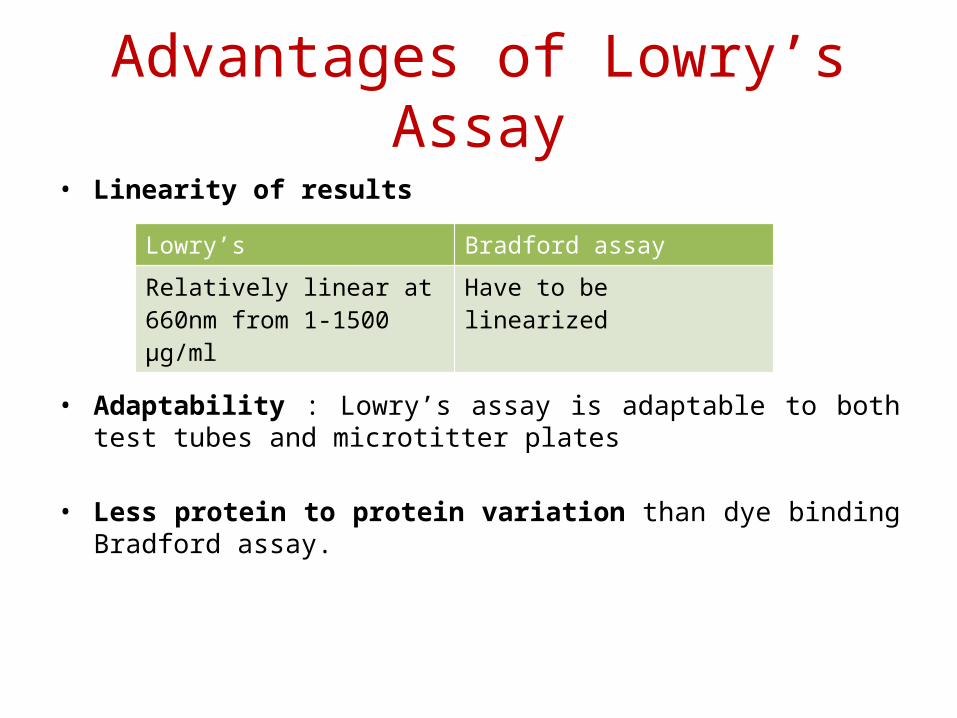
• Linearity of results
• Adaptability : Lowry’s assay is adaptable to both test tubes and microtitter plates
• Less protein to protein variation than dye binding Bradford assay.
Advantages of Lowry’s Assay
Lowry’s Bradford assay
Relatively linear at 660nm from 1-1500 µg/ml
Have to be linearized
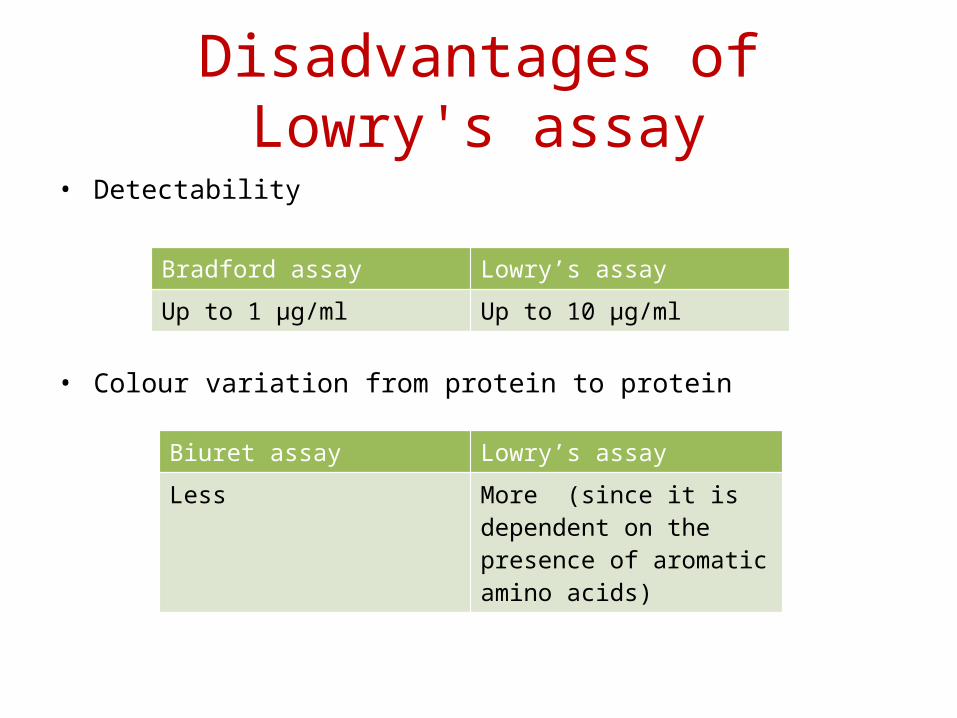
Disadvantages of Lowry's assay• Detectability
• Colour variation from protein to protein
Bradford assay Lowry’s assay
Up to 1 µg/ml Up to 10 µg/ml
Biuret assay Lowry’s assayLess More (since it is dependent
on the presence of aromatic amino acids)
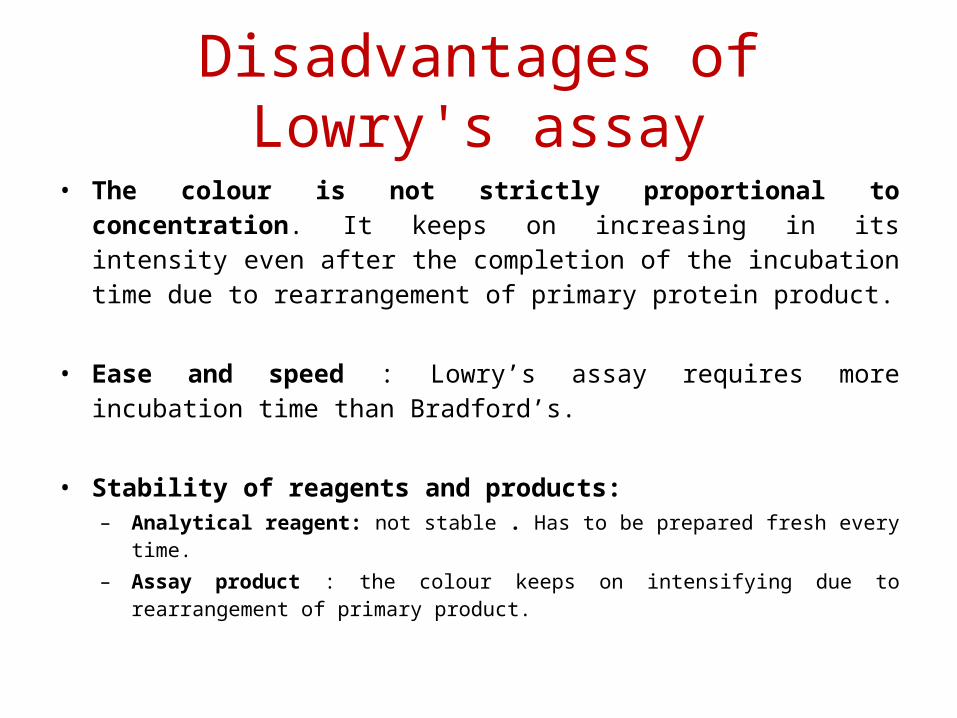
• The colour is not strictly proportional to concentration. It keeps on increasing in its intensity even after the completion of the incubation time due to rearrangement of primary protein product.
• Ease and speed : Lowry’s assay requires more incubation time than Bradford’s.
• Stability of reagents and products:– Analytical reagent: not stable . Has to be prepared fresh every time.– Assay product : the colour keeps on intensifying due to rearrangement of primary
product.
Disadvantages of Lowry's assay
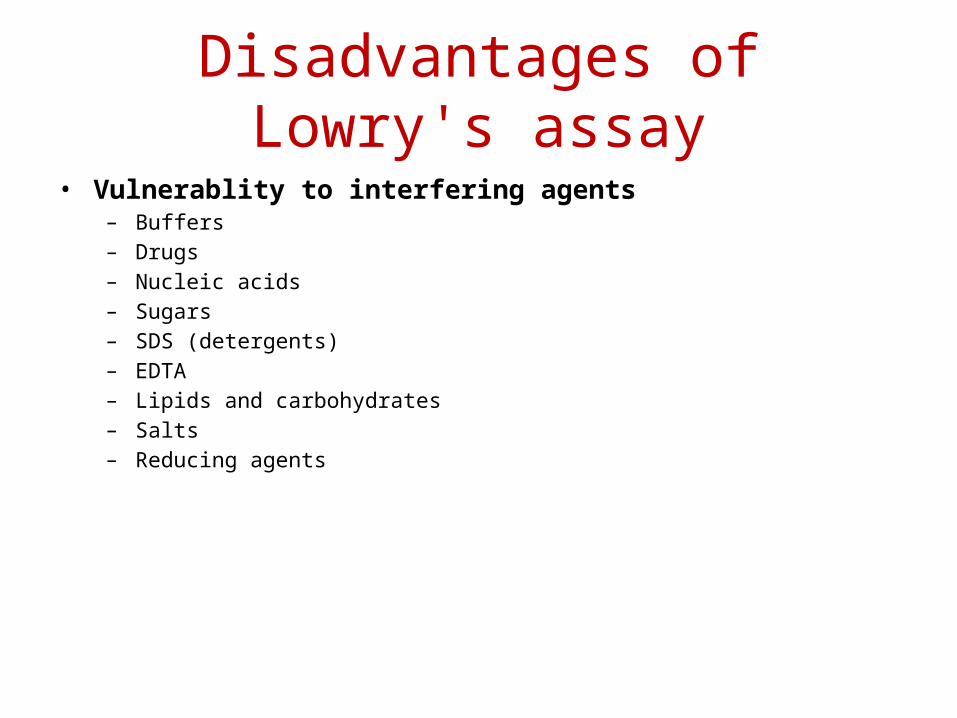
• Vulnerablity to interfering agents– Buffers– Drugs– Nucleic acids– Sugars– SDS (detergents)– EDTA– Lipids and carbohydrates– Salts– Reducing agents
Disadvantages of Lowry's assay
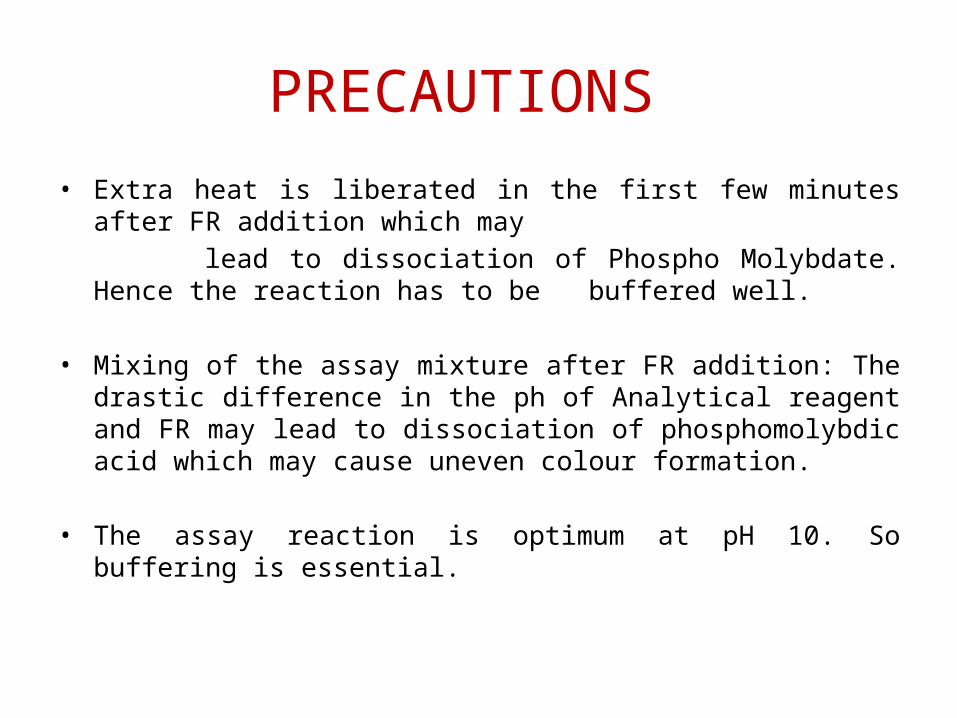
PRECAUTIONS • Extra heat is liberated in the first few minutes after FR addition which may lead to dissociation of Phospho Molybdate. Hence the reaction has to be
buffered well.
• Mixing of the assay mixture after FR addition: The drastic difference in the ph of Analytical reagent and FR may lead to dissociation of phosphomolybdic acid which may cause uneven colour formation.
• The assay reaction is optimum at pH 10. So buffering is essential.
Application’s of Lowry’s Assay
• Estimation of proteins during cell fractionation.
• Estimation of highly diluted proteins.
• To distinguish proteins from other nitrogen or amine containing molecules.