Embed Size (px)
Citation preview

1 | P a g e
LRS WEBA Chutes Commissioning
1) Executive Summary
In 2014, Laramie River Station (Basin Electric Power Cooperative) contracted out Power Techniques to design and Plant Techniques to install WEBA style engineered chutes (controlled flow chutes) at 10 different transfer locations throughout the PRB coal handling system. The purpose of the project was to:
1) Replace older coal chutes 2) Minimize coal dust creation 3) Facilitate the transfer of coal (minimize plugging) 4) Decrease dust collection volumes 5) Minimize wear on conveyors (and components) through central coal loading 6) Reduce coal spillage
Part of the contract with Power Techniques required that the new chutes produce less than
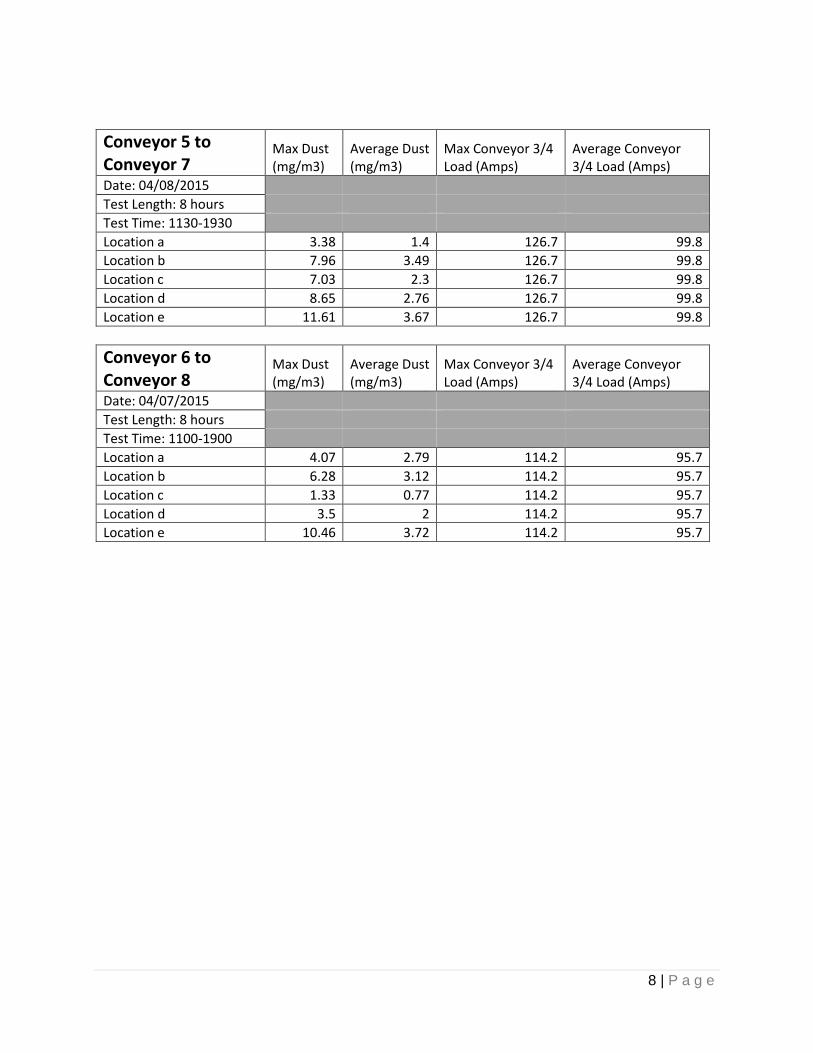
2.4 mg/m3 of dust under certain operation conditions (see Procedures section). All respirable dust volumes were measured with PdRs (Personal Data Rams) under strict guidelines. In general, when operated as designed (running the conveyors at full capacity - 700 TPH), the chutes passed all the tests (see General Summary table below). When conveyor operations became unstable (change in tonnage below design specification), they produced more dust (as can be seen by the Conveyor 5 to 7 and Conveyor 6 to 8 results).
General Summary Chute Location Date Max (mg/m3) Average (mg/m3) Detailed Results
Conveyor 3 to Conveyor 5 4/10/2015 6.0 1.8 6-7
Conveyor 3 to Conveyor 6 4/13/2015 4.8 1.6 6-7
Conveyor 4 to Conveyor 5 4/9/2015 7.0 2.1 6-7
Conveyor 4 to Conveyor 6 4/9/2015 5.1 1.6 6-7
Conveyor 5 to Conveyor 7* 4/8/2015 11.6 2.7 8-9
Conveyor 6 to Conveyor 8* 4/7/2015 10.5 2.5 8-9
Crusher 1 to Conveyor 9 6/11/2015 2.6 0.4 10-11
Crusher 1 to Conveyor 18a 6/15/2015 5.9 0.4 10-11
Crusher 2 to Conveyor 10 6/12/2015 6.8 0.4 12-13
Crusher 2 to Conveyor 19 6/16/2015 18.7 0.6 12-13
Reclaim Feeders 3 and 4** N/A N/A N/A N/A
*Passed due to inconsistent conveyor operations during the tests **Cancelled due to operations feasibility
Prior to the installation of the WEBA chutes, LRS staff collected “Before” data with the
PdRs in the first 6 installation areas (no viable data was collected in the Crusher House prior to installation). The Dust Reduction table below shows substantial dust reduction results. All
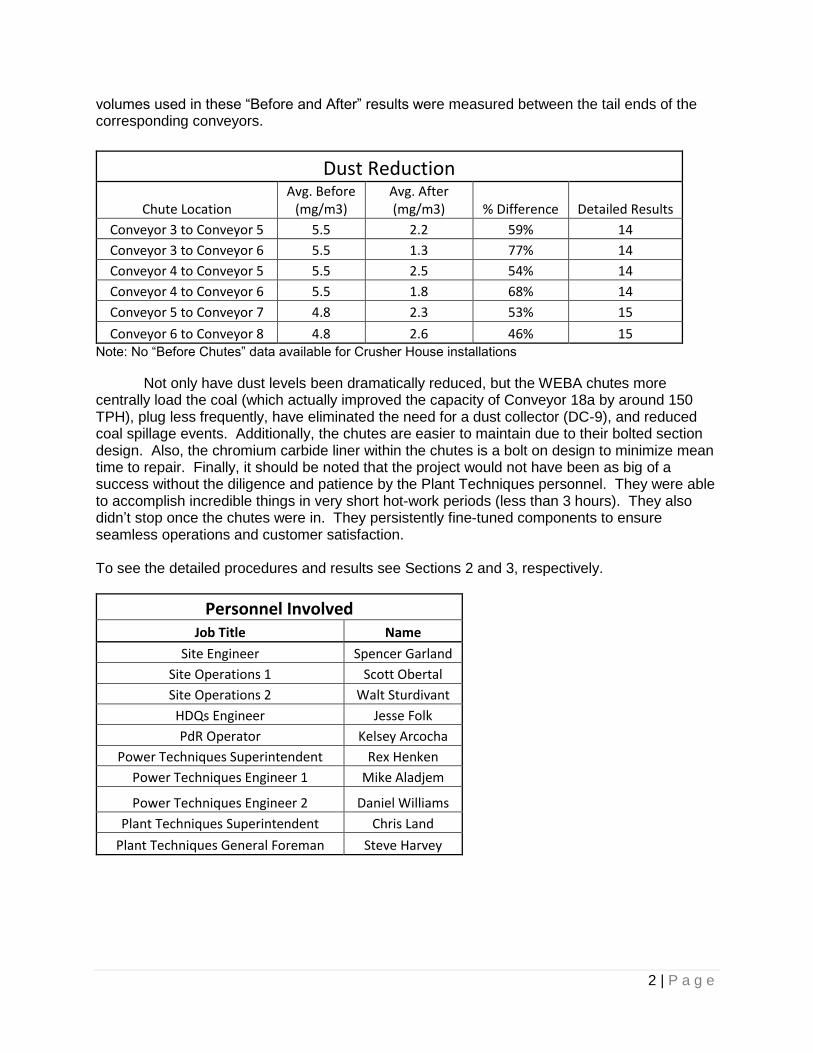
2 | P a g e
volumes used in these “Before and After” results were measured between the tail ends of the corresponding conveyors.
Dust Reduction
Chute Location Avg. Before
(mg/m3) Avg. After (mg/m3) % Difference Detailed Results
Conveyor 3 to Conveyor 5 5.5 2.2 59% 14
Conveyor 3 to Conveyor 6 5.5 1.3 77% 14
Conveyor 4 to Conveyor 5 5.5 2.5 54% 14
Conveyor 4 to Conveyor 6 5.5 1.8 68% 14
Conveyor 5 to Conveyor 7 4.8 2.3 53% 15
Conveyor 6 to Conveyor 8 4.8 2.6 46% 15 Note: No “Before Chutes” data available for Crusher House installations
Not only have dust levels been dramatically reduced, but the WEBA chutes more centrally load the coal (which actually improved the capacity of Conveyor 18a by around 150 TPH), plug less frequently, have eliminated the need for a dust collector (DC-9), and reduced coal spillage events. Additionally, the chutes are easier to maintain due to their bolted section design. Also, the chromium carbide liner within the chutes is a bolt on design to minimize mean time to repair. Finally, it should be noted that the project would not have been as big of a success without the diligence and patience by the Plant Techniques personnel. They were able to accomplish incredible things in very short hot-work periods (less than 3 hours). They also didn’t stop once the chutes were in. They persistently fine-tuned components to ensure seamless operations and customer satisfaction. To see the detailed procedures and results see Sections 2 and 3, respectively.
Personnel Involved Job Title Name
Site Engineer Spencer Garland
Site Operations 1 Scott Obertal
Site Operations 2 Walt Sturdivant
HDQs Engineer Jesse Folk
PdR Operator Kelsey Arcocha
Power Techniques Superintendent Rex Henken
Power Techniques Engineer 1 Mike Aladjem
Power Techniques Engineer 2 Daniel Williams
Plant Techniques Superintendent Chris Land
Plant Techniques General Foreman Steve Harvey

3 | P a g e
2) Procedures To pass, the chutes must produce meet the a measurable respirable dust level of 2.4 mg/m3 or less over an eight hour time weighted average. Respirable dust will be measured with 5 different PdRs (Personal Data Rams) placed at different areas around the chute including by the inlets and outlets (see list below). All tests will abide by the following criteria:
1) Tests will be eight hours in length 2) Coal flow will be between 550 and 800 TPH (between roughly 80% and 115% of
designed coal flow rate) during the entire 8 hour test. Note the following Conveyor amps will be used to estimate coal flow during for each test (since no accurate belt scales are currently functioning): - Conveyor 5 and 6 amps for tests #1 and #2 - Conveyor 5 amps for test #5 - Conveyor 6 amps for test #6 - Conveyor 9 amps for test #7 - Conveyor 10 amps for test #8 - Conveyor 18 amps for test #9 - Conveyor 19 amps for test #10
3) No neighboring conveyors and/or transfer points not in the specific test will be operating during at any point in the test. An exception to this rule must apply for tests #7, #8, #9 and #10 because it is impossible to get coal to the units otherwise. A rubber matting will be placed on the grating level that separates Conveyors 9/10 and Conveyors 18a and 19 to prevent dust migration from skewing the results. During tests #7 and #10 Conveyors 9 and 19 will run simultaneously and during tests #8 and #9 Conveyors 10 and 18a/18 will run simultaneously.
4) For tests # 1 and #2 isolation curtains will be placed at the exit of the silo tunnel South of the head ends of conveyors 3 and 4 to prevent dust migration from the silo feeders from skewing the results.
5) Data will not be included in the average until the conveyors/transfers being tested have started up and run with 550-800 TPH of coal for 5 minutes
6) The dust collector associated with the transfer points being tested shall be shut off during the entire span of the test
7) The area of testing will be thoroughly washed down prior to the test and foot trafficking in the area will only be permitted for emergencies.
PdR Placement:
1) Conveyor 3 to Conveyors 5 and 6 a. East of Conveyor 3 chute inlet b. Between Conveyor 3 and Conveyor 4 chute inlet c. Between Conveyor 5 and Conveyor 6 doghouse outlets d. Between Conveyor 5 and Conveyor 6 and between Conveyor 3 and Conveyor 4
load zones e. Between Conveyor 5 and Conveyor 6 tail pulleys
2) Conveyor 4 to Conveyors 5 and 6
a. West of Conveyor 4 chute inlet b. Between Conveyor 3 and Conveyor 4 chute inlet

4 | P a g e
c. Between Conveyor 5 and Conveyor 6 doghouse outlets d. Between Conveyor 5 and Conveyor 6 and between Conveyor 3 and Conveyor 4
load zones e. Between Conveyor 5 and Conveyor 6 tail pulleys
3) Reclaim Feeder 3 to Conveyors 5 and 6
a. On top of stairs platform b. At middle landing on stairs platform c. Between Conveyor 5 and Conveyor 6 doghouse outlets d. Between Conveyor 5 and Conveyor 6 and between Conveyor 3 and Conveyor 4
load zones e. Between Conveyor 5 and Conveyor 6 tail pulleys
4) Reclaim Feeder 4 to Conveyors 5 and 6
a. On top of stairs platform b. At middle landing on stairs platform c. Between Conveyor 5 and Conveyor 6 doghouse outlets d. Between Conveyor 5 and Conveyor 6 and between Conveyor 3 and Conveyor 4
load zones e. Between Conveyor 5 and Conveyor 6 tail pulleys
5) Conveyor 5 to Conveyor 7
a. South of Conveyor 5 chute inlet b. Between Conveyor 5 and Conveyor 6 chute inlet c. Between all chute work on middle landing (below Conveyor 5 and Conveyor 6
head pulleys and above Conveyor 7 and Conveyor 8 tail pulleys) d. Between Conveyor 7 and Conveyor 8 doghouse outlets e. Between Conveyor 7 and Conveyor 8 tail pulleys
6) Conveyor 6 to Conveyor 8
a. North of Conveyor 6 chute inlet b. Between Conveyor 5 and Conveyor 6 chute inlet c. Between all chute work on middle landing (below Conveyor 5 and Conveyor 6
head pulleys and above Conveyor 7 and Conveyor 8 tail pulleys) d. Between Conveyor 7 and Conveyor 8 doghouse outlets e. Between Conveyor 7 and Conveyor 8 tail pulleys f.
7) Crusher 1 to Conveyor 9 a. On tail end guard of Conveyor 9 b. North of tail end of Conveyor 9 c. South of tail end of Conveyor 9 d. Between Conveyor 9 and Conveyor 10 chute discharge before door e. Between Conveyor 9 and Conveyor 10 chute discharge after door
8) Crusher 2 to Conveyor 10
a. On tail end guard of Conveyor 10 b. North of tail end of Conveyor 10 c. South of tail end of Conveyor 10 d. Between Conveyor 9 and Conveyor 10 chute discharge before door e. Between Conveyor 9 and Conveyor 10 chute discharge after door

5 | P a g e
9) Crusher 1 to Conveyor 18a a. Behind tail end of Conveyor 18a b. East of tail end of Conveyor 18a c. West of tail end of Conveyor 18a d. East of Conveyor 18a discharge (end of dog house) e. West of Conveyor 18a discharge (end of dog house)
10) Crusher 2 to Conveyor 19
a. On tail end guard of Conveyor 19 b. North of tail end of Conveyor 19 c. South of tail end of Conveyor 19 d. Between Conveyor 18 and Conveyor 19 chute discharge before door e. Between Conveyor 18 and Conveyor 19 chute discharge after door

6 | P a g e
3) Results
Conveyor 3 to Conveyor 5
Max Dust (mg/m3)
Average Dust (mg/m3)
Max Conveyor 3/4 Load (Amps)
Average Conveyor 3/4 Load (Amps)
Date: 4/10/2015
Test Length: 4 hours
Test Time: 1300-1700
Location a 5.97 2.01 167.6 147.7
Location b 4.84 2.91 167.6 147.7
Location c 4.68 1.54 167.6 147.7
Location d 2.98 1.28 167.6 147.7
Location e 4.02 1.45 167.6 147.7
Conveyor 3 to Conveyor 6
Max Dust (mg/m3)
Average Dust (mg/m3)
Max Conveyor 3/4 Load (Amps)
Average Conveyor 3/4 Load (Amps)
Date: 4/13/2015
Test Length: 4 hours
Test Time: 1400-1800
Location a 4.81 2.01 175.6 163.9
Location b 4.03 1.7 175.6 163.9
Location c 2.35 1.23 175.6 163.9
Location d 4.35 2.25 175.6 163.9
Location e 2.12 0.91 175.6 163.9
Conveyor 4 to Conveyor 5
Max Dust (mg/m3)
Average Dust (mg/m3)
Max Conveyor 3/4 Load (Amps)
Average Conveyor 3/4 Load (Amps)
Date: 4/09/2015
Test Length: 4 hours
Test Time: 1300-1700
Location a 0.9 0.62 168.1 155.8
Location b 1.46 1.06 168.1 155.8
Location c 5.35 3.48 168.1 155.8
Location d 7.02 3.09 168.1 155.8
Location e 6.18 2.46 168.1 155.8
Conveyor 4 to Conveyor 6
Max Dust (mg/m3)
Average Dust (mg/m3)
Max Conveyor 3/4 Load (Amps)
Average Conveyor 3/4 Load (Amps)
Date: 4/09/2015
Test Length: 4 hours
Test Time: 1700-2100
Location a 1.7 0.58 166.2 155.5
Location b 2.85 1.12 166.2 155.5
Location c 4.76 2.66 166.2 155.5
Location d 5.11 1.84 166.2 155.5
Location e 4.5 1.76 166.2 155.5

7 | P a g e
8 | P a g e
Conveyor 5 to Conveyor 7
Max Dust (mg/m3)
Average Dust (mg/m3)
Max Conveyor 3/4 Load (Amps)
Average Conveyor 3/4 Load (Amps)
Date: 04/08/2015
Test Length: 8 hours
Test Time: 1130-1930
Location a 3.38 1.4 126.7 99.8
Location b 7.96 3.49 126.7 99.8
Location c 7.03 2.3 126.7 99.8
Location d 8.65 2.76 126.7 99.8
Location e 11.61 3.67 126.7 99.8
Conveyor 6 to Conveyor 8
Max Dust (mg/m3)
Average Dust (mg/m3)
Max Conveyor 3/4 Load (Amps)
Average Conveyor 3/4 Load (Amps)
Date: 04/07/2015
Test Length: 8 hours
Test Time: 1100-1900
Location a 4.07 2.79 114.2 95.7
Location b 6.28 3.12 114.2 95.7
Location c 1.33 0.77 114.2 95.7
Location d 3.5 2 114.2 95.7
Location e 10.46 3.72 114.2 95.7

9 | P a g e

10 | P a g e
Crusher 1 to Conveyor 9
Max Dust (mg/m3)
Average Dust (mg/m3)
Max Conveyor 3/4 Load (Amps)
Average Conveyor 3/4 Load (Amps)
Date: 06/11/2015
Test Length: 8 hours
Test Time: 1300-2100
Location a 2.58 0.7 172.4 153.7
Location b 0.63 0.18 172.4 153.7
Location c 1.23 0.3 172.4 153.7
Location d 0.97 0.34 172.4 153.7
Location e 1.52 0.61 172.4 153.7
Crusher 1 to Conveyor 18A
Max Dust (mg/m3)
Average Dust (mg/m3)
Max Conveyor 3/4 Load (Amps)
Average Conveyor 3/4 Load (Amps)
Date: 06/15/2015
Test Length: 8 hours
Test Time: 1300-2100
Location a 4.01 0.18 180 159.7
Location b 2.53 0.51 180 159.7
Location c 0.65 0.09 180 159.7
Location d 2.34 0.65 180 159.7
Location e 5.94 0.36 180 159.7

11 | P a g e

12 | P a g e
Crusher 2 to Conveyor 10
Max Dust (mg/m3)
Average Dust (mg/m3)
Max Conveyor 3/4 Load (Amps)
Average Conveyor 3/4 Load (Amps)
Date: 06/12/2015
Test Length: 8 hours
Test Time: 1200-2000
Location a 6.75 0.47 174.9 148.2
Location b 5.39 0.77 174.9 148.2
Location c 6.52 0.26 174.9 148.2
Location d 5.39 0.26 174.9 148.2
Location e 6.58 0.42 174.9 148.2
Crusher 2 to Conveyor 19
Max Dust (mg/m3)
Average Dust (mg/m3)
Max Conveyor 3/4 Load (Amps)
Average Conveyor 3/4 Load (Amps)
Date: 6/16/2015
Test Length: 8 hours
Test Time: 1230-2030
Location a 4.19 0.12 164.2 146.1
Location b 18.74 1.2 164.2 146.1
Location c 1.17 0.38 164.2 146.1
Location d N/A N/A 164.2 146.1
Location e 4.94 0.57 164.2 146.1

13 | P a g e

14 | P a g e

15 | P a g e


![15. Tehnologije Weba i aplikacijski poslužitelj [865,88 KiB]](https://img.pdfslide.net/doc/110x75/5890537d1a28abbc288c432b/15-tehnologije-weba-i-aplikacijski-posluzitelj-86588-kib.jpg)