Embed Size (px)
Citation preview
May. 2007
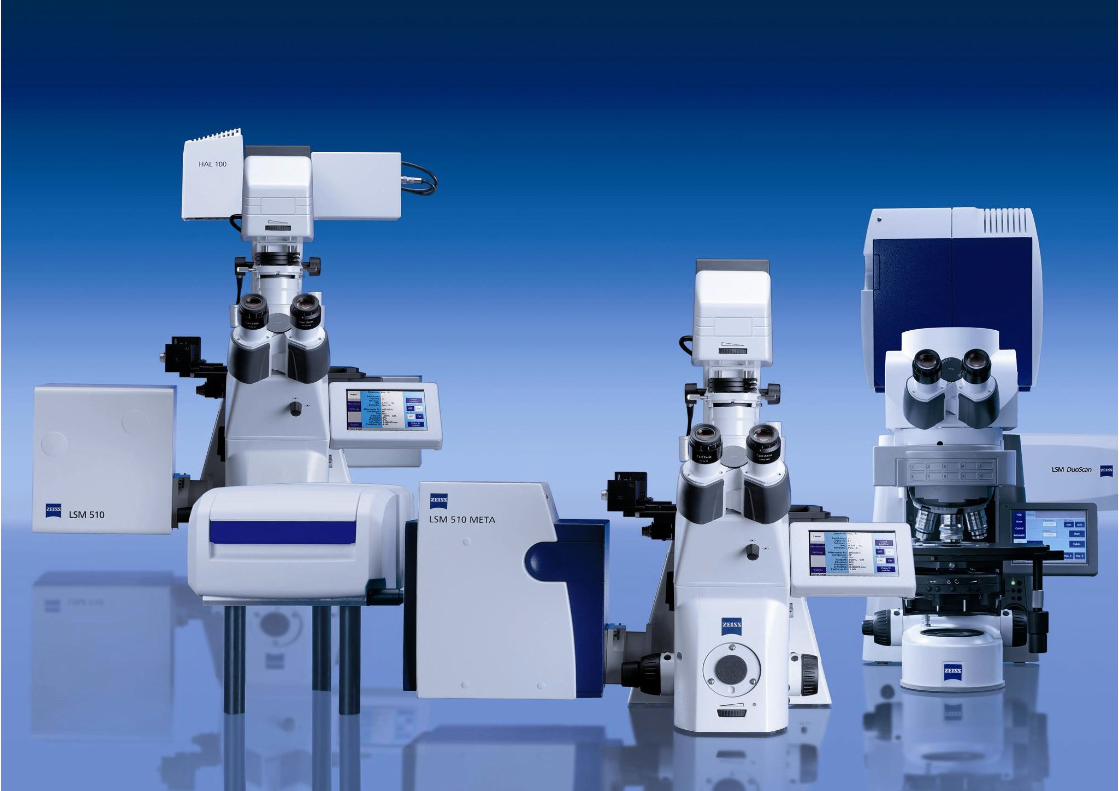
共焦点レーザスキャン蛍光相関分光顕微鏡システム
LSM 510 META ConfoCor 3
共焦点レーザスキャン蛍光相関分光顕微鏡システム
カールツァイスマイクロイメージング
May. 2007
May. 2007
共焦点レーザスキャン顕微鏡 (LSM 510)
- Contents -
スペクトルイメージング (META)
蛍光相関分光法 (ConfoCor3 ; FCS)
May. 2007
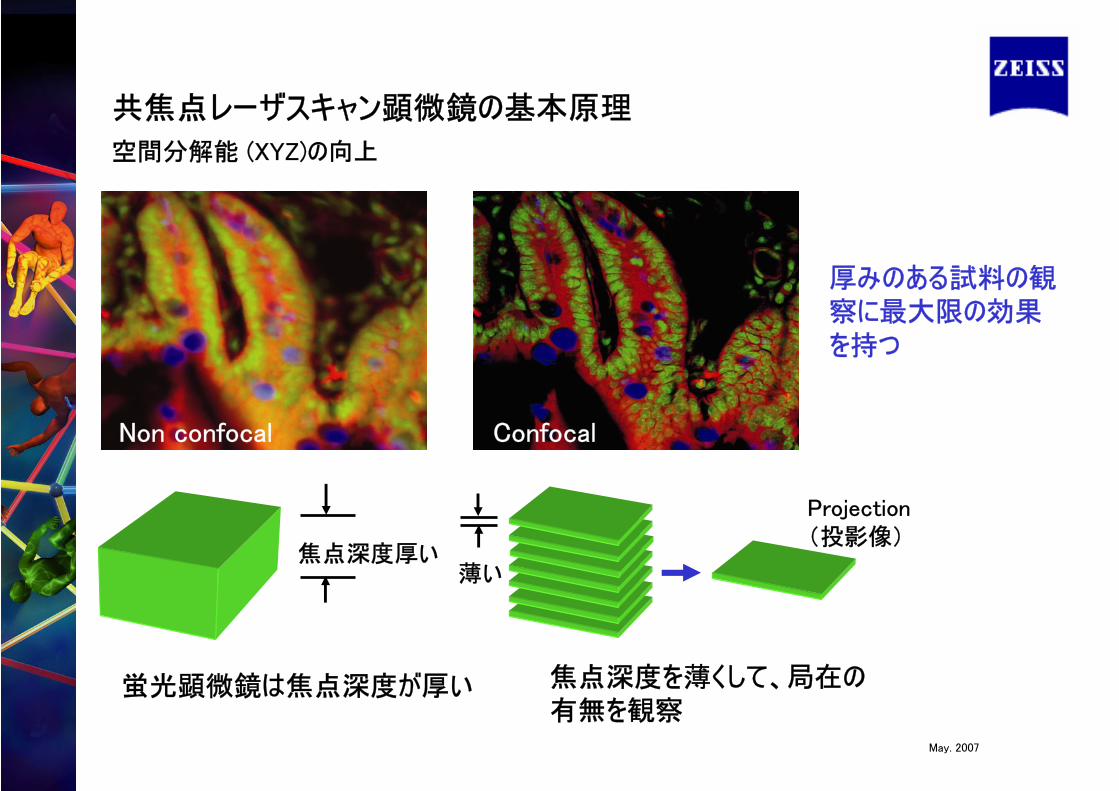
Non confocal Confocal
空間分解能 (XYZ)の向上
焦点深度を薄くして、局在の有無を観察
焦点深度厚い
蛍光顕微鏡は焦点深度が厚い
薄い
Projection(投影像)
厚みのある試料の観察に最大限の効果を持つ
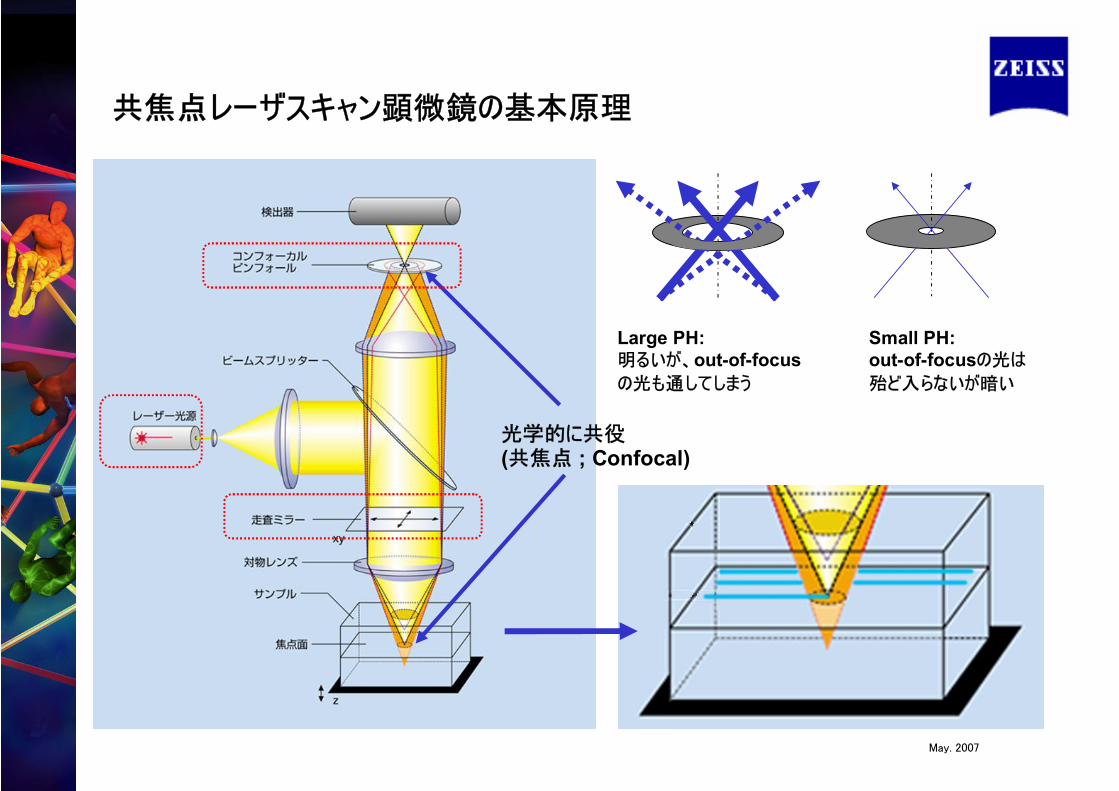
共焦点レーザスキャン顕微鏡の基本原理
May. 2007
光学的に共役(共焦点 ; Confocal)
共焦点レーザスキャン顕微鏡の基本原理
Small PH:out-of-focusの光は
殆ど入らないが暗い
Large PH:明るいが、out-of-focusの光も通してしまう
May. 2007
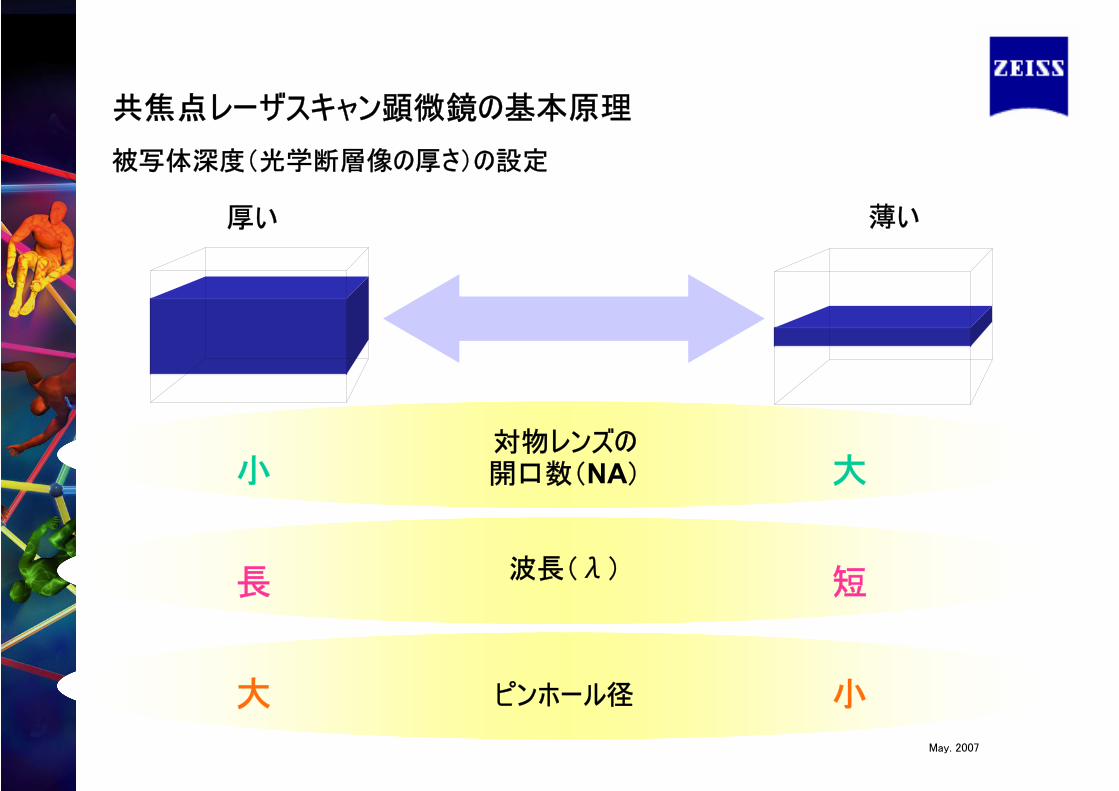
厚い 薄い
波長(λ)
ピンホール径
小
長
大
大
短
小
対物レンズの開口数(NA)
被写体深度(光学断層像の厚さ)の設定
共焦点レーザスキャン顕微鏡の基本原理
May. 2007
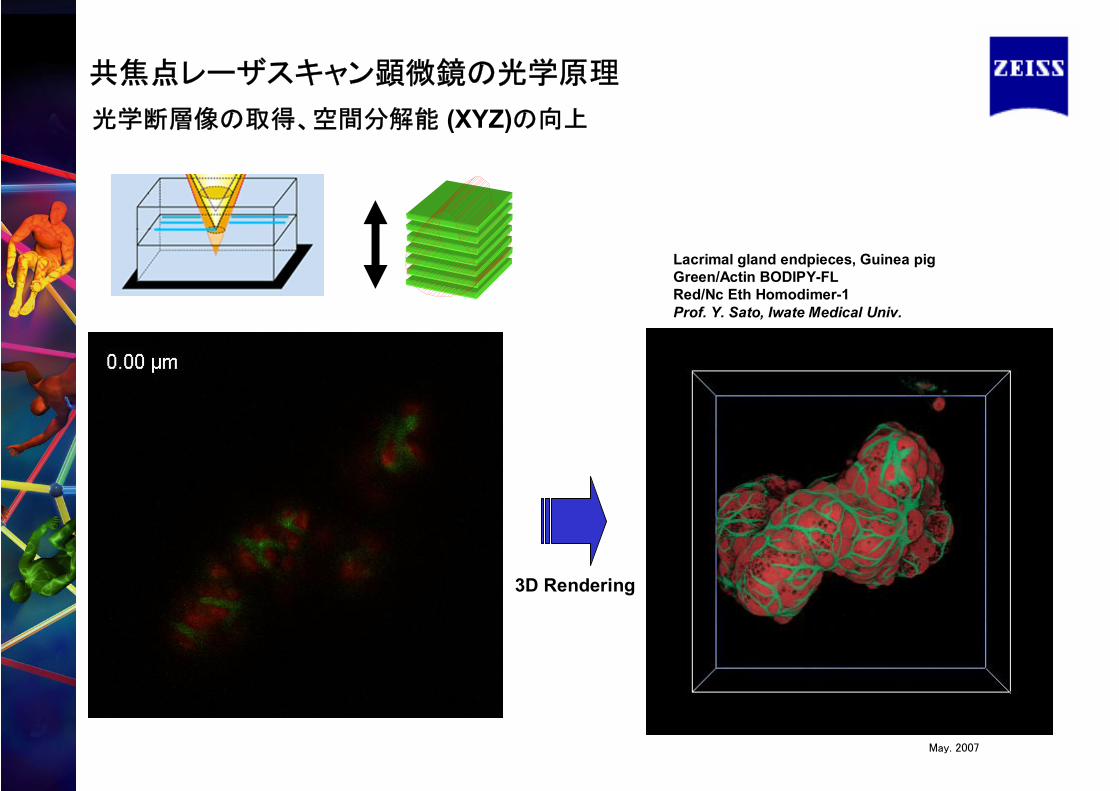
Lacrimal gland endpieces, Guinea pigGreen/Actin BODIPY-FLRed/Nc Eth Homodimer-1Prof. Y. Sato, Iwate Medical Univ.
3D Rendering
光学断層像の取得、空間分解能 (XYZ)の向上
共焦点レーザスキャン顕微鏡の光学原理
May. 2007
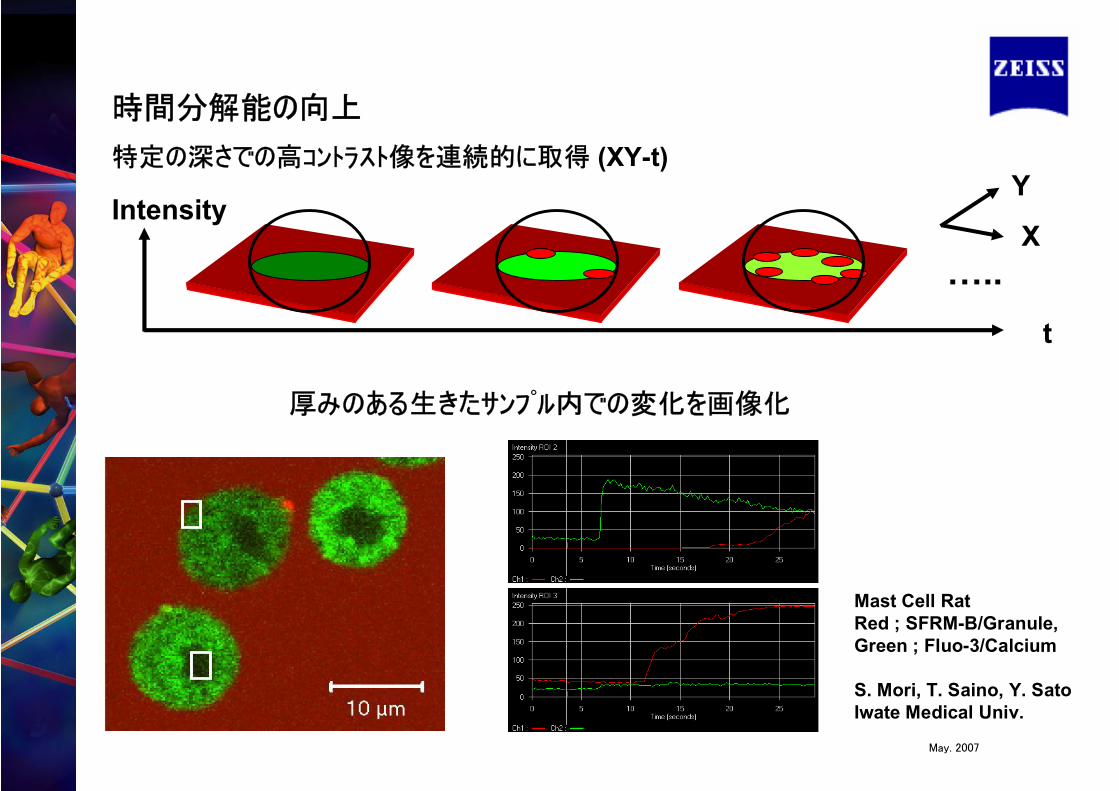
厚みのある生きたサンプル内での変化を画像化
t
X
YIntensity
…..
特定の深さでの高コントラスト像を連続的に取得 (XY-t)
Mast Cell RatRed ; SFRM-B/Granule,Green ; Fluo-3/Calcium
S. Mori, T. Saino, Y. SatoIwate Medical Univ.
時間分解能の向上
May. 2007
XY
Z
t
…..
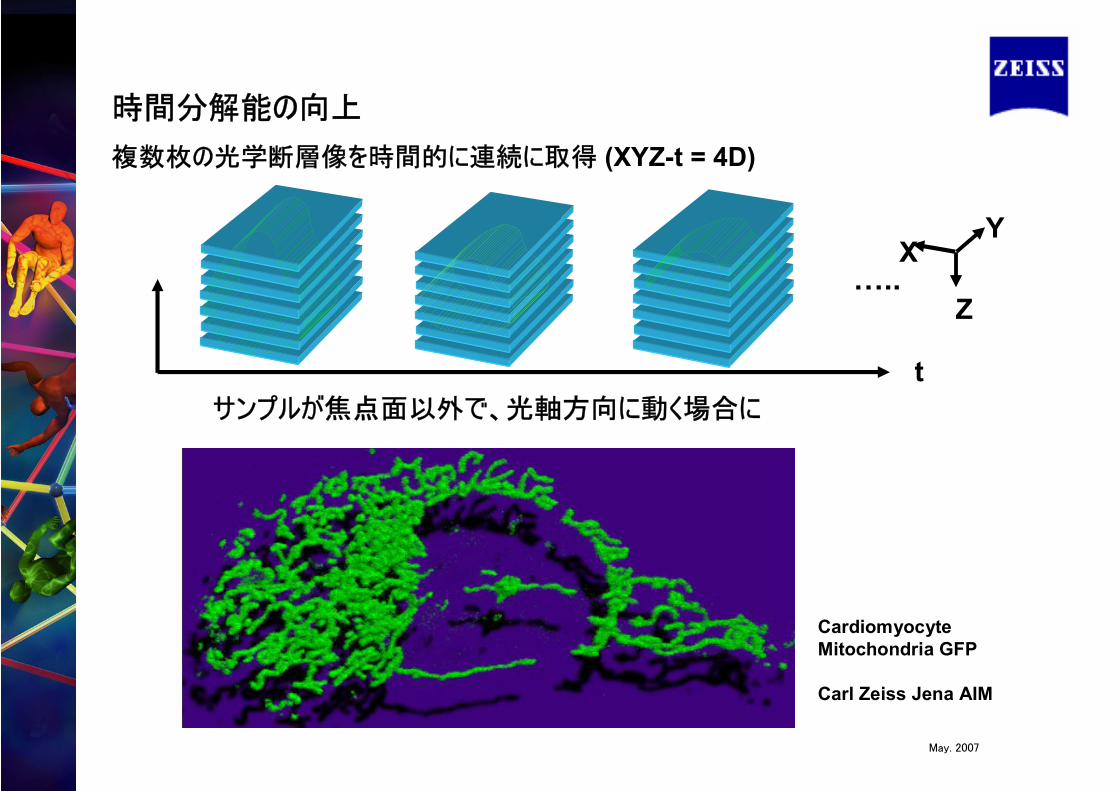
サンプルが焦点面以外で、光軸方向に動く場合に
CardiomyocyteMitochondria GFP
Carl Zeiss Jena AIM
複数枚の光学断層像を時間的に連続に取得 (XYZ-t = 4D)
時間分解能の向上
May. 2007
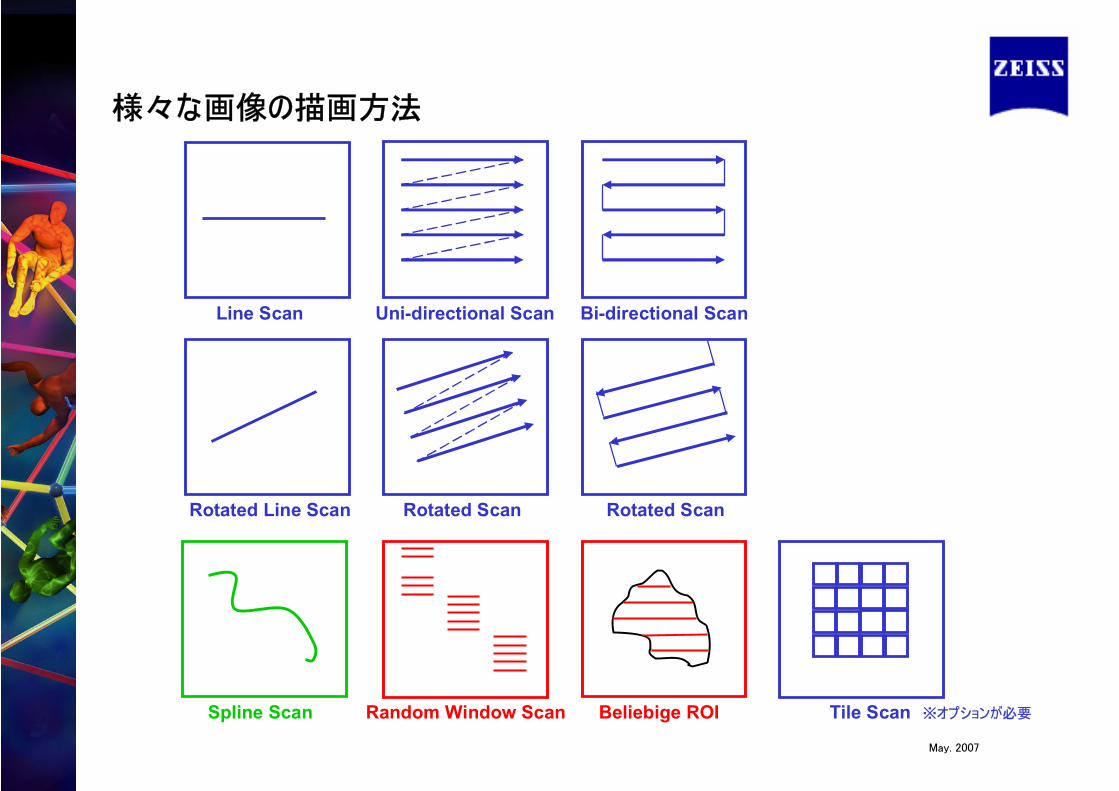
Line Scan
Rotated Line Scan
Spline Scan Tile Scan
Uni-directional Scan Bi-directional Scan
Rotated Scan Rotated Scan
Beliebige ROIRandom Window Scan
様々な画像の描画方法
※オプションが必要
May. 2007
Rotated Scan
Line Scan
Rotated Line Scan
Spline Scan Tile Scan
Uni-directional Scan Bi-directional Scan
Rotated Scan
Beliebige ROIRandom Window Scan
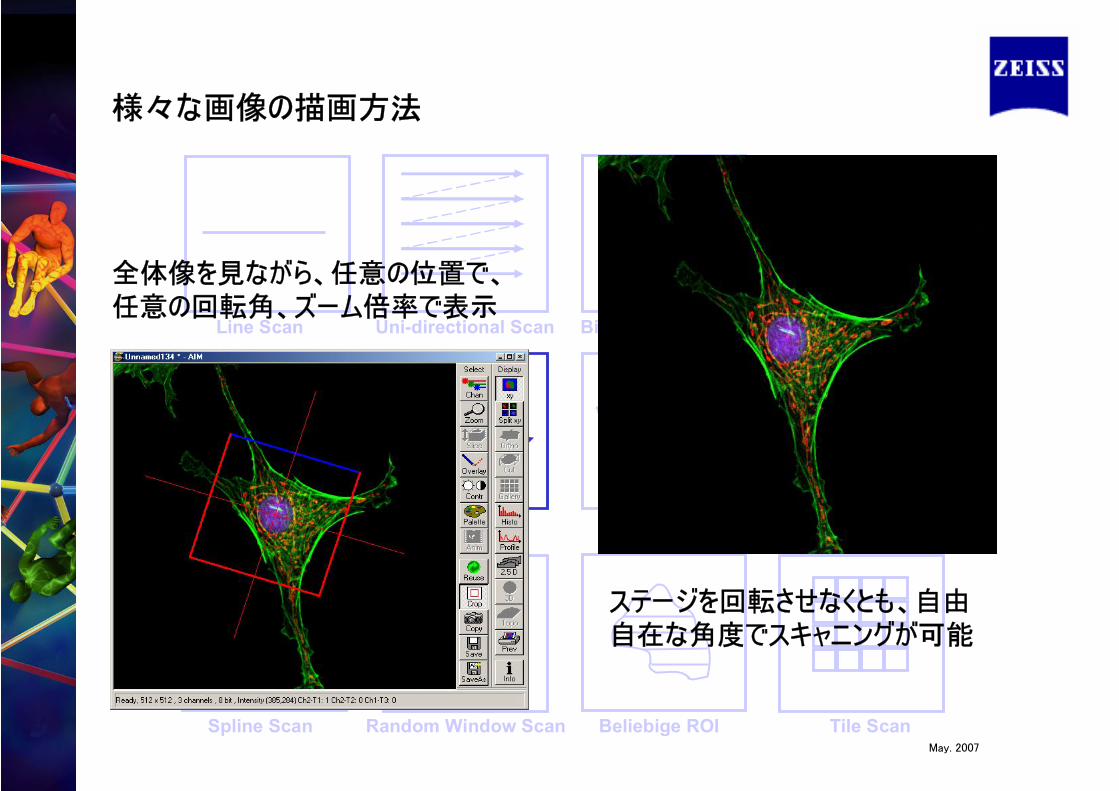
ステージを回転させなくとも、自由自在な角度でスキャニングが可能
全体像を見ながら、任意の位置で、任意の回転角、ズーム倍率で表示
様々な画像の描画方法
May. 2007
Line Scan
Rotated Line Scan
Spline Scan Tile Scan
Uni-directional Scan Bi-directional Scan
Rotated Scan Rotated Scan
Beliebige ROIRandom Window Scan
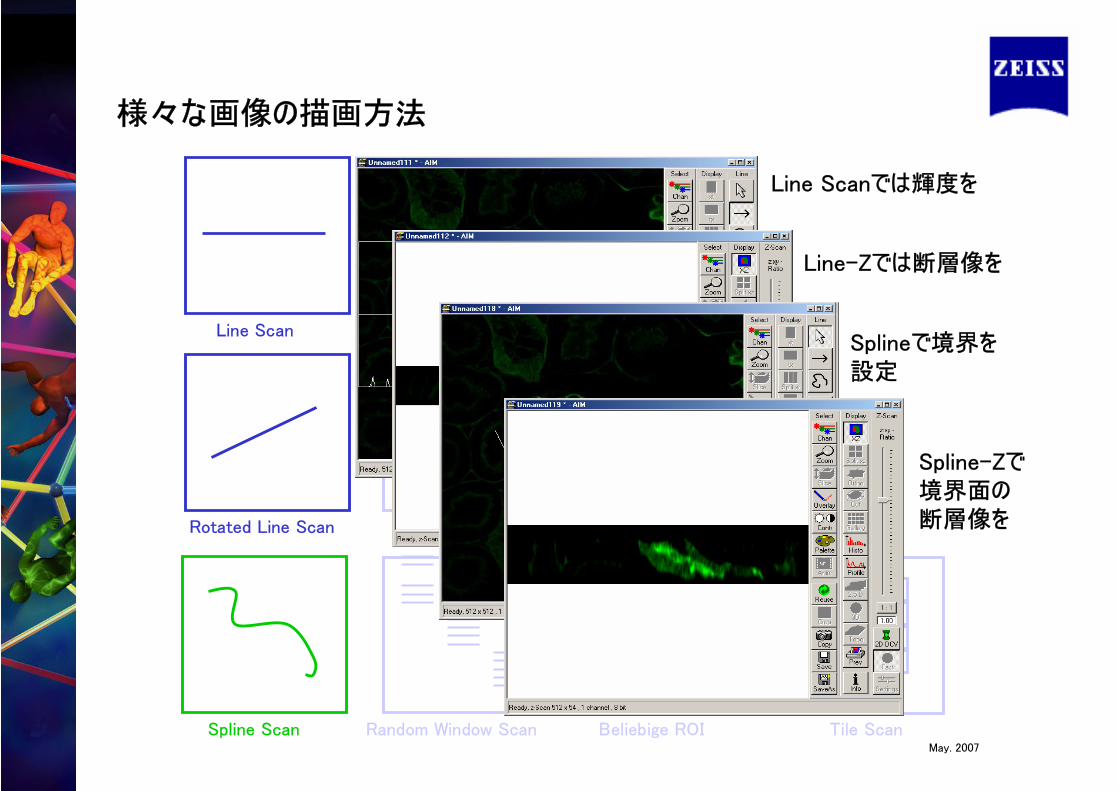
Line Scanでは輝度を
Line-Zでは断層像を
Splineで境界を設定
Spline-Zで境界面の断層像を
様々な画像の描画方法
May. 2007
Line Scan
Rotated Line Scan
Spline Scan Tile Scan
Uni-directional Scan Bi-directional Scan
Rotated Scan Rotated Scan
Beliebige ROIRandom Window Scan
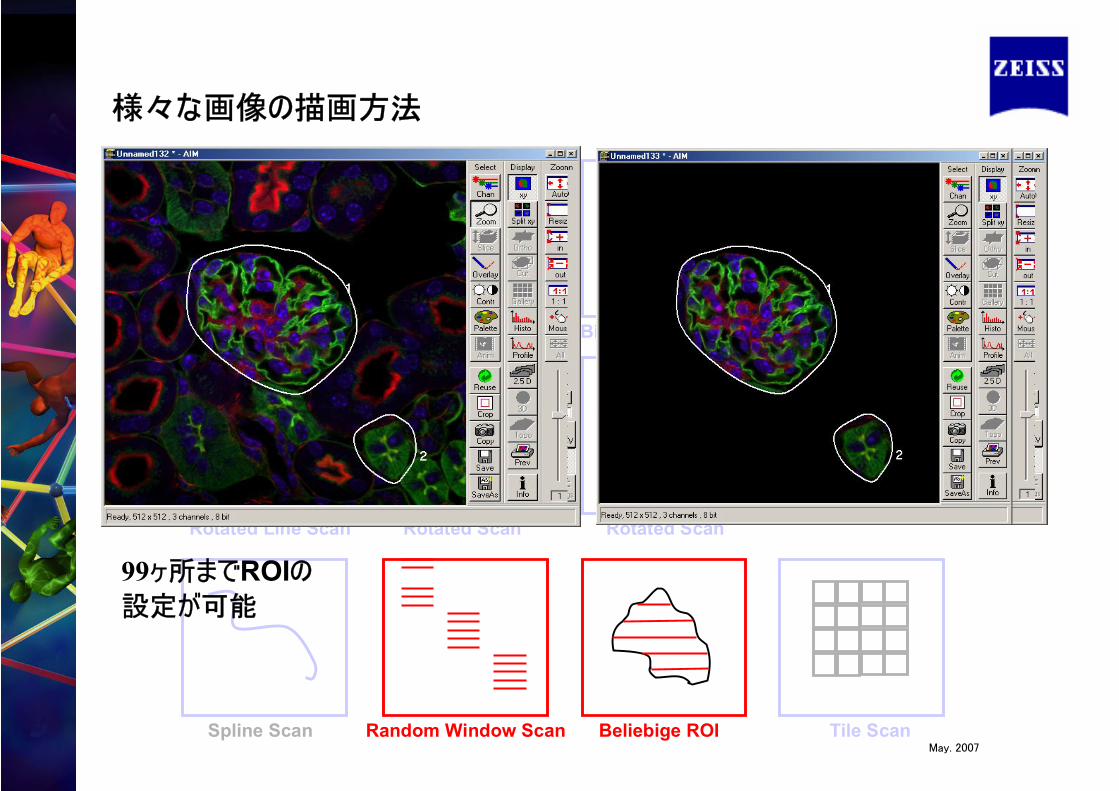
99ヶ所までROIの設定が可能
様々な画像の描画方法
May. 2007
Bi-directional ScanLine Scan
Rotated Line Scan
Spline Scan Tile Scan
Uni-directional Scan
Rotated Scan Rotated Scan
Beliebige ROIRandom Window Scan
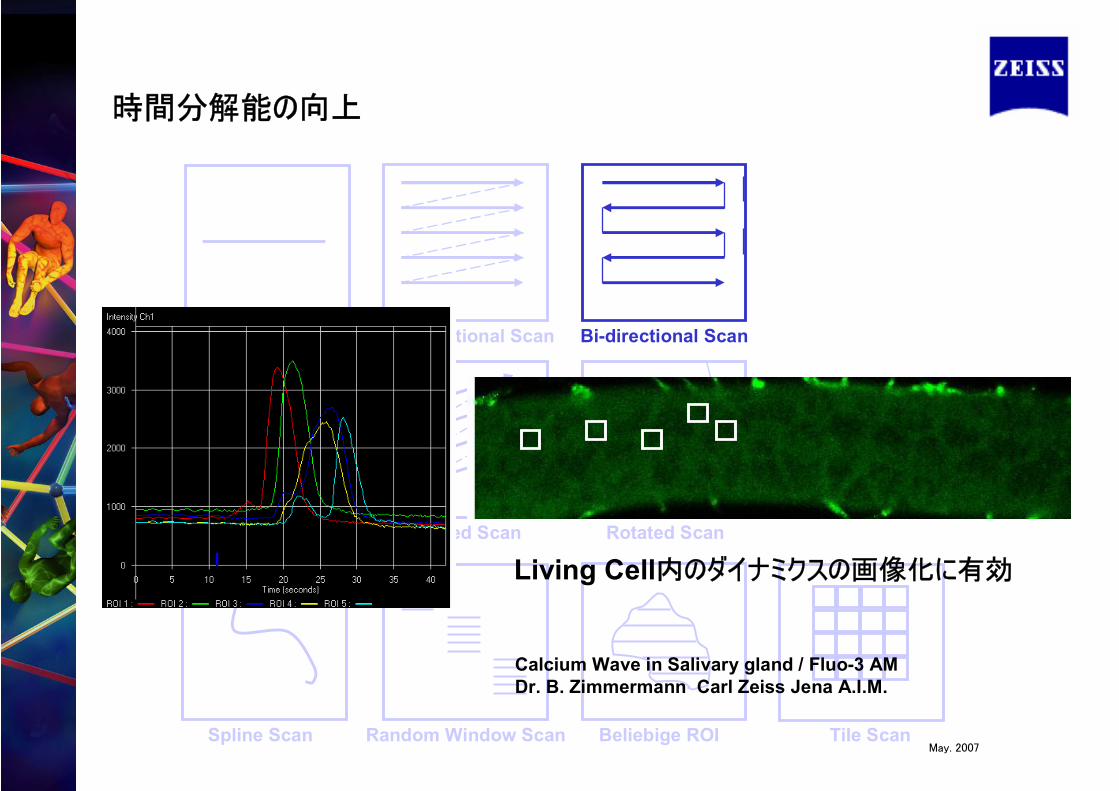
Calcium Wave in Salivary gland / Fluo-3 AMDr. B. Zimmermann Carl Zeiss Jena A.I.M.
Living Cell内のダイナミクスの画像化に有効
時間分解能の向上
May. 2007
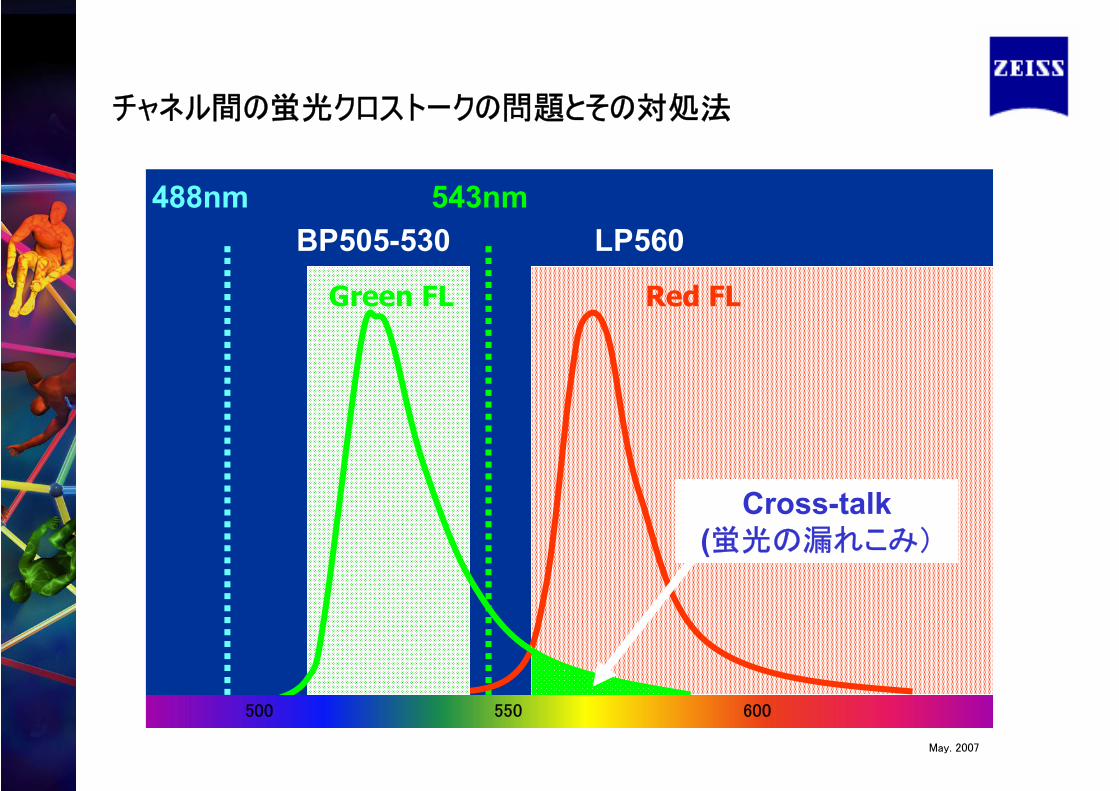
LP560BP505-530
500 600550
Red FL
Cross-talk(蛍光の漏れこみ)
Green FL
488nm 543nm
チャネル間の蛍光クロストークの問題とその対処法
May. 2007
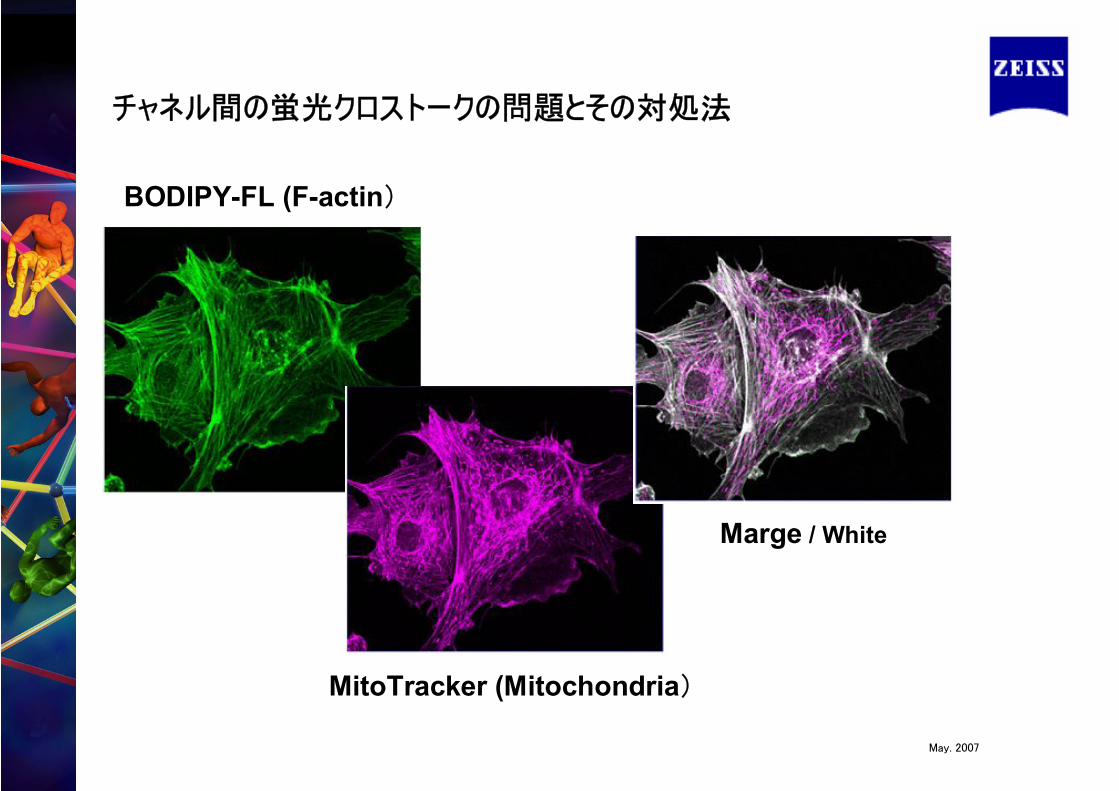
BODIPY-FL (F-actin)
MitoTracker (Mitochondria)
Marge / White
チャネル間の蛍光クロストークの問題とその対処法
May. 2007
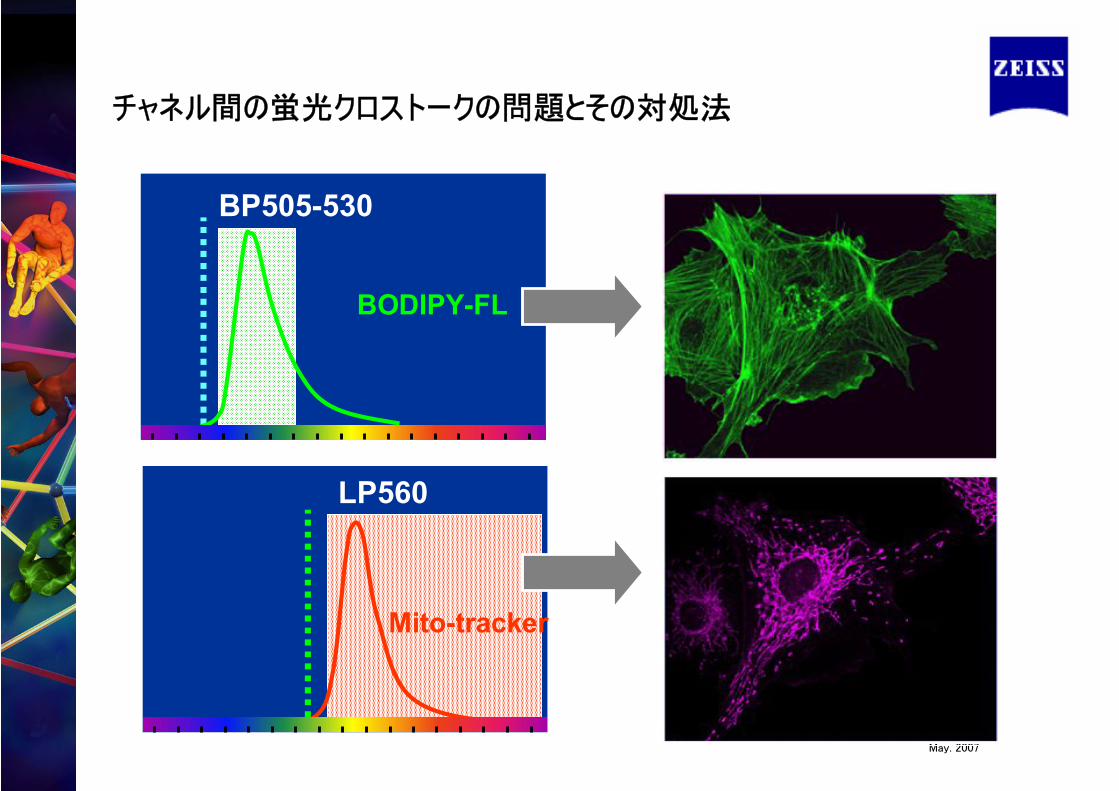
BP505-530
BODIPY-FL
LP560
Mito-tracker
チャネル間の蛍光クロストークの問題とその対処法
May. 2007
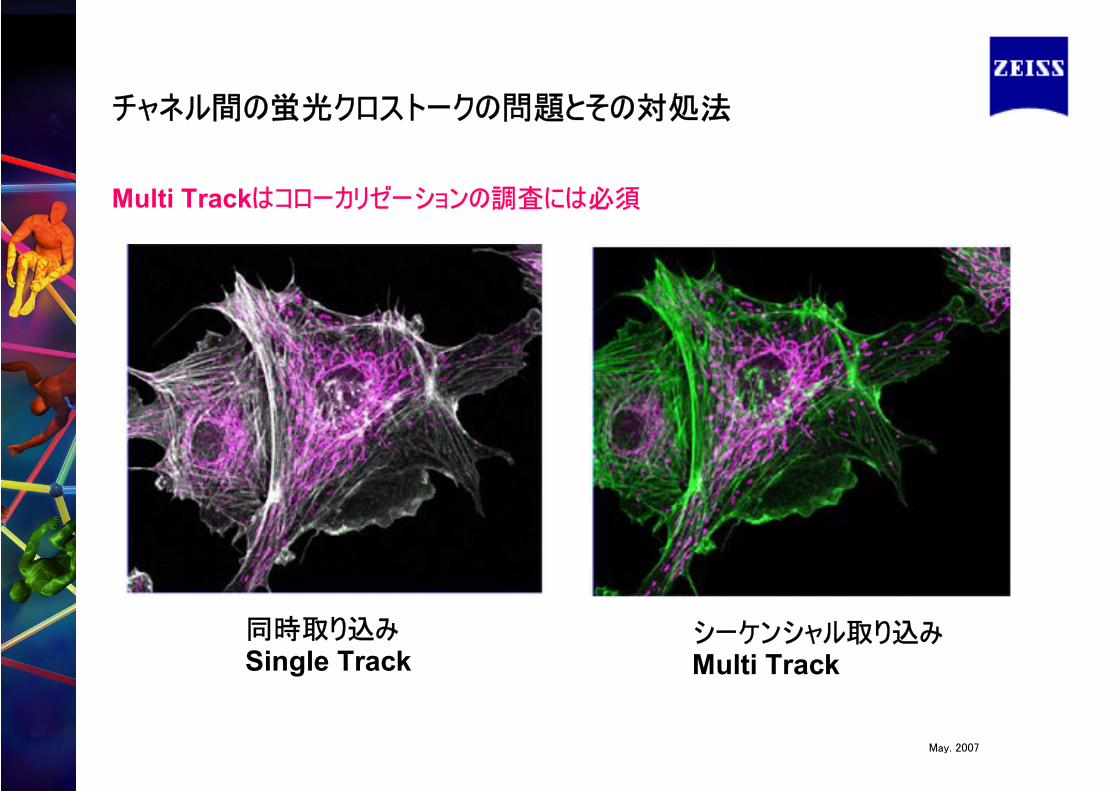
同時取り込みSingle Track
シーケンシャル取り込みMulti Track
Multi Trackはコローカリゼーションの調査には必須
チャネル間の蛍光クロストークの問題とその対処法

May. 2007
Mitochondria in Cultured Hepatocyte
Mito-tracker Red / Ex.543nmRhodamine 123 / Ex.488nm
Prof. T. Kawanishi, N.I.H.S.
May. 2007
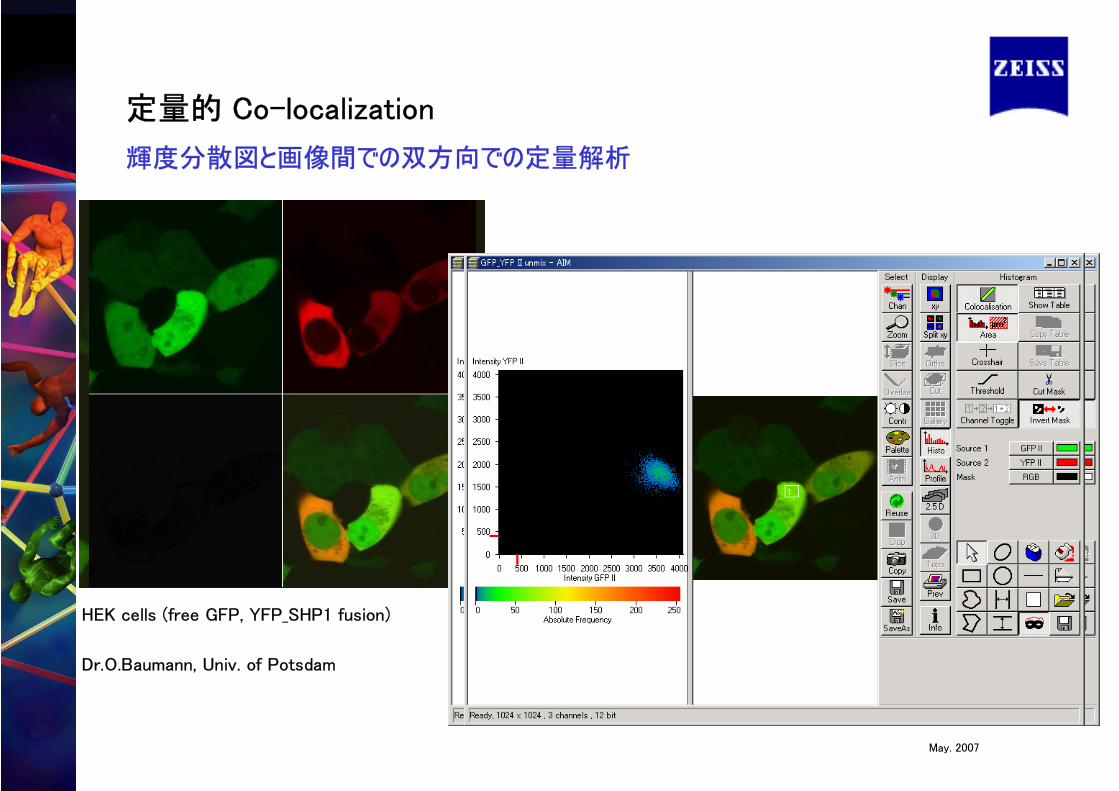
HEK cells (free GFP, YFP_SHP1 fusion)
Dr.O.Baumann, Univ. of Potsdam
定量的 Co-localization
輝度分散図と画像間での双方向での定量解析
May. 2007
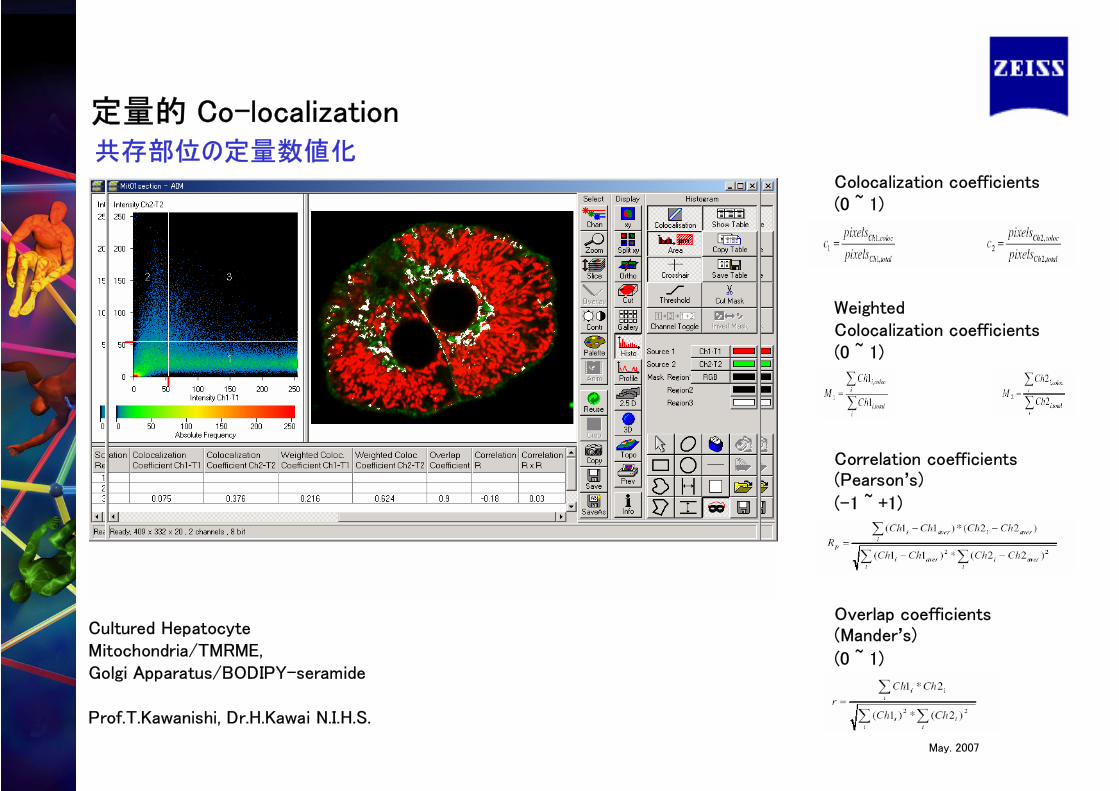
Cultured HepatocyteMitochondria/TMRME, Golgi Apparatus/BODIPY-seramide
Prof.T.Kawanishi, Dr.H.Kawai N.I.H.S.
Colocalization coefficients(0 ~ 1)
Weighted Colocalization coefficients(0 ~ 1)
Correlation coefficients(Pearson’s)
(-1 ~ +1)
Overlap coefficients(Mander’s)
(0 ~ 1)
定量的 Co-localization共存部位の定量数値化
May. 2007
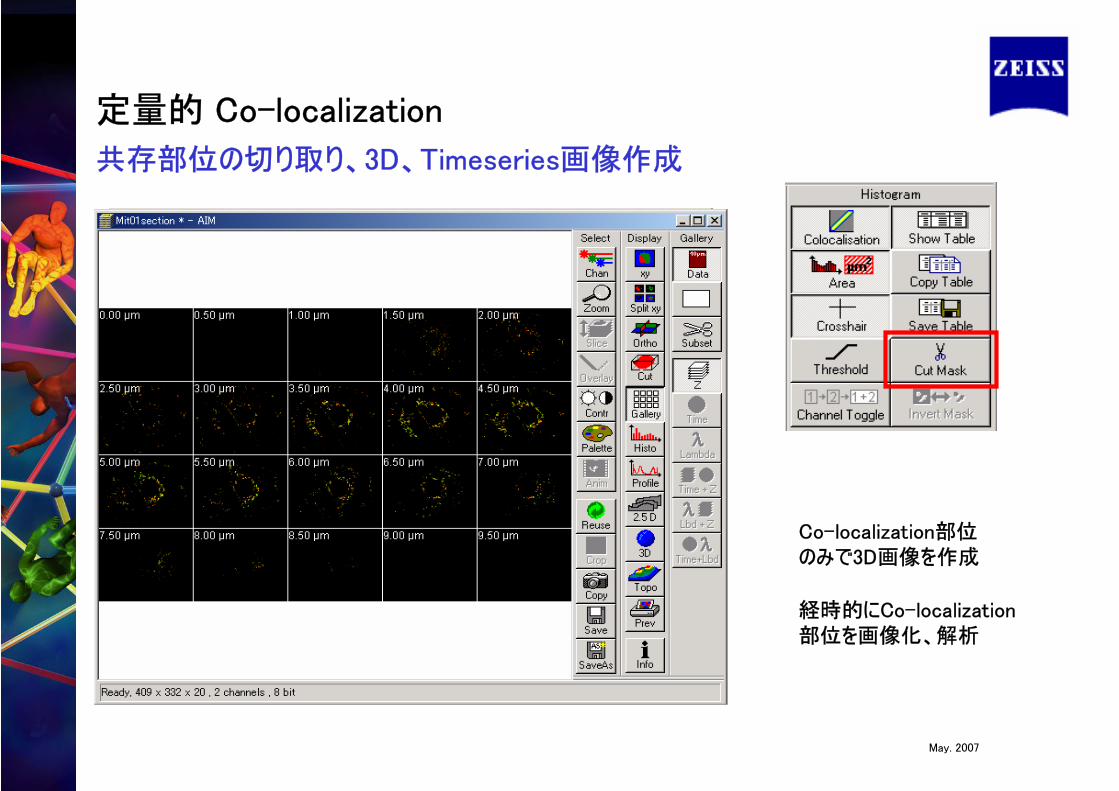
Co-localization部位のみで3D画像を作成
経時的にCo-localization部位を画像化、解析
定量的 Co-localization
共存部位の切り取り、3D、Timeseries画像作成
May. 2007
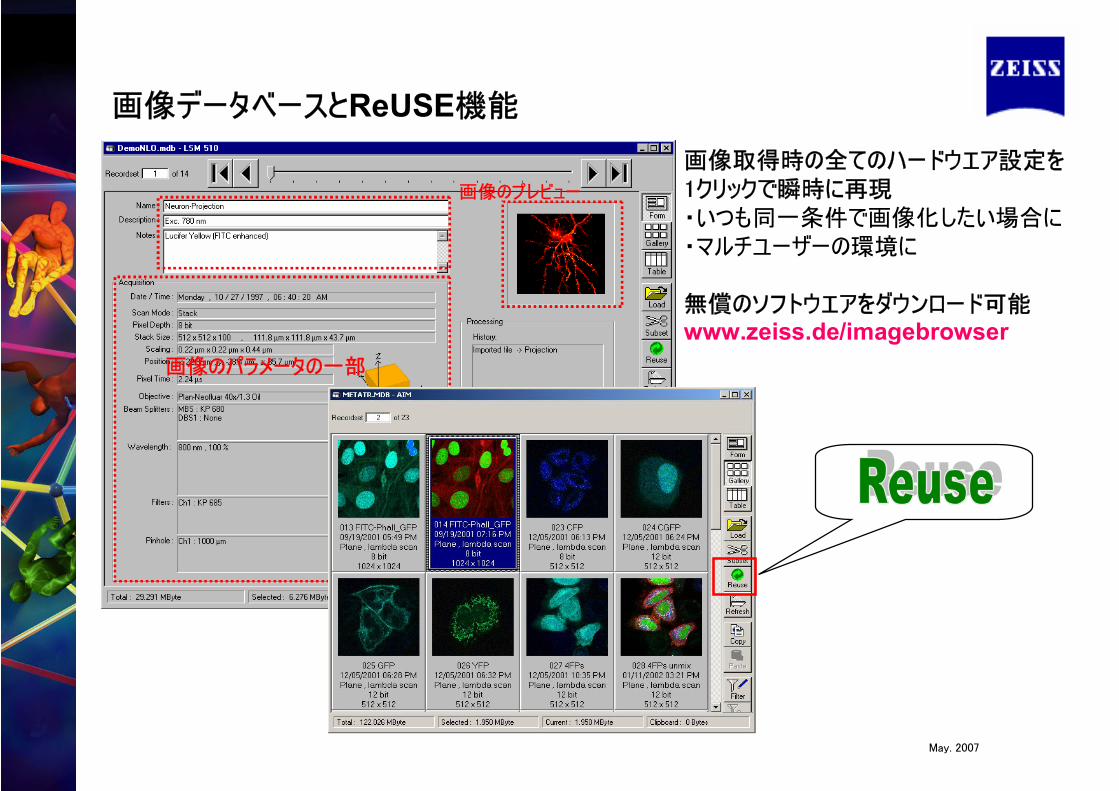
画像のプレビュー
画像のパラメータの一部
画像取得時の全てのハードウエア設定を1クリックで瞬時に再現・いつも同一条件で画像化したい場合に・マルチユーザーの環境に
無償のソフトウエアをダウンロード可能www.zeiss.de/imagebrowser
画像データベースとReUSE機能
May. 2007
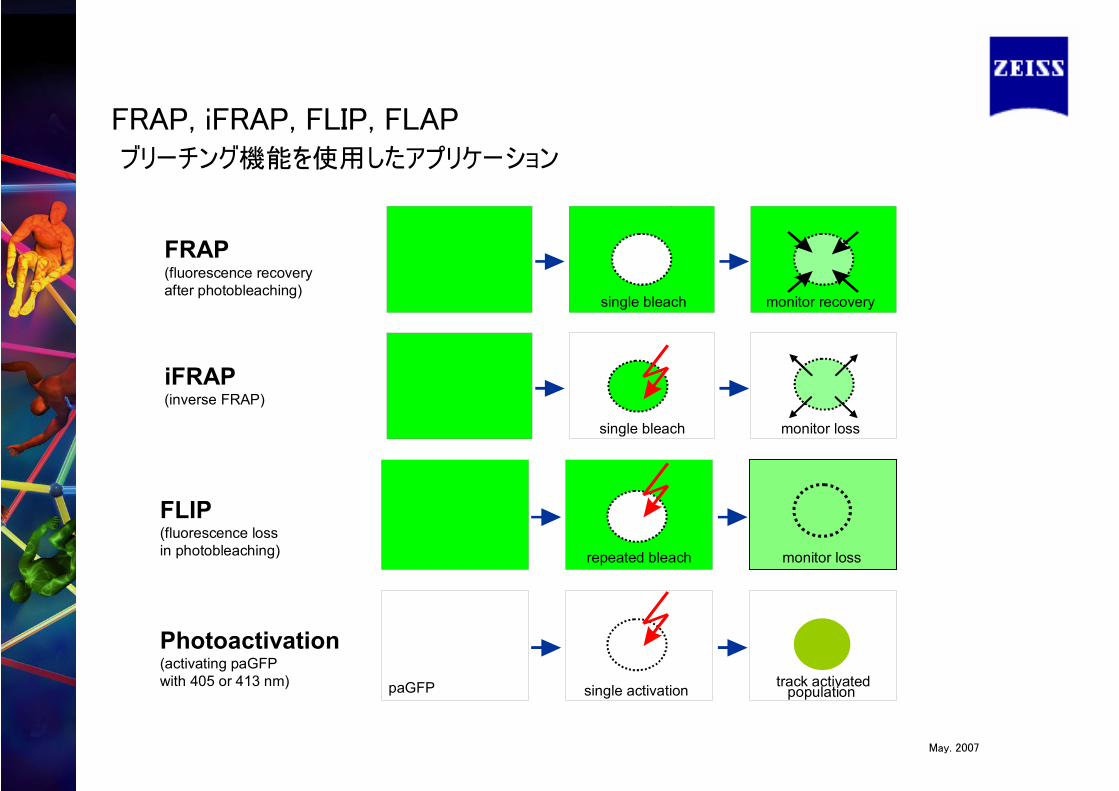
FRAP, iFRAP, FLIP, FLAP
repeated bleach monitor loss
FLIP(fluorescence loss in photobleaching)
single bleach monitor loss
iFRAP(inverse FRAP)
single activation track activated population
Photoactivation(activating paGFPwith 405 or 413 nm) paGFP
single bleach monitor recovery
FRAP(fluorescence recovery after photobleaching)
ブリーチング機能を使用したアプリケーション
May. 2007
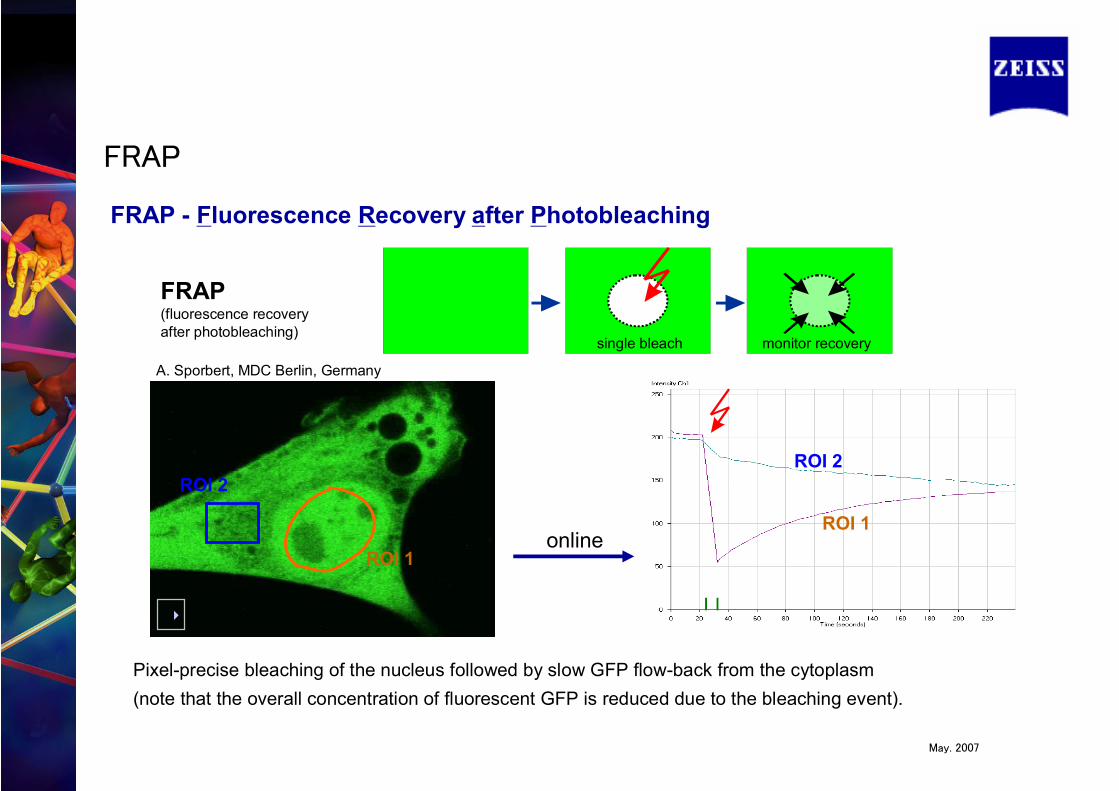
FRAP - Fluorescence Recovery after Photobleaching
ROI 1
ROI 2
ROI 1
ROI 2
Pixel-precise bleaching of the nucleus followed by slow GFP flow-back from the cytoplasm(note that the overall concentration of fluorescent GFP is reduced due to the bleaching event).
A. Sporbert, MDC Berlin, Germany
online
single bleach monitor recovery
FRAP(fluorescence recovery after photobleaching)
FRAP
May. 2007
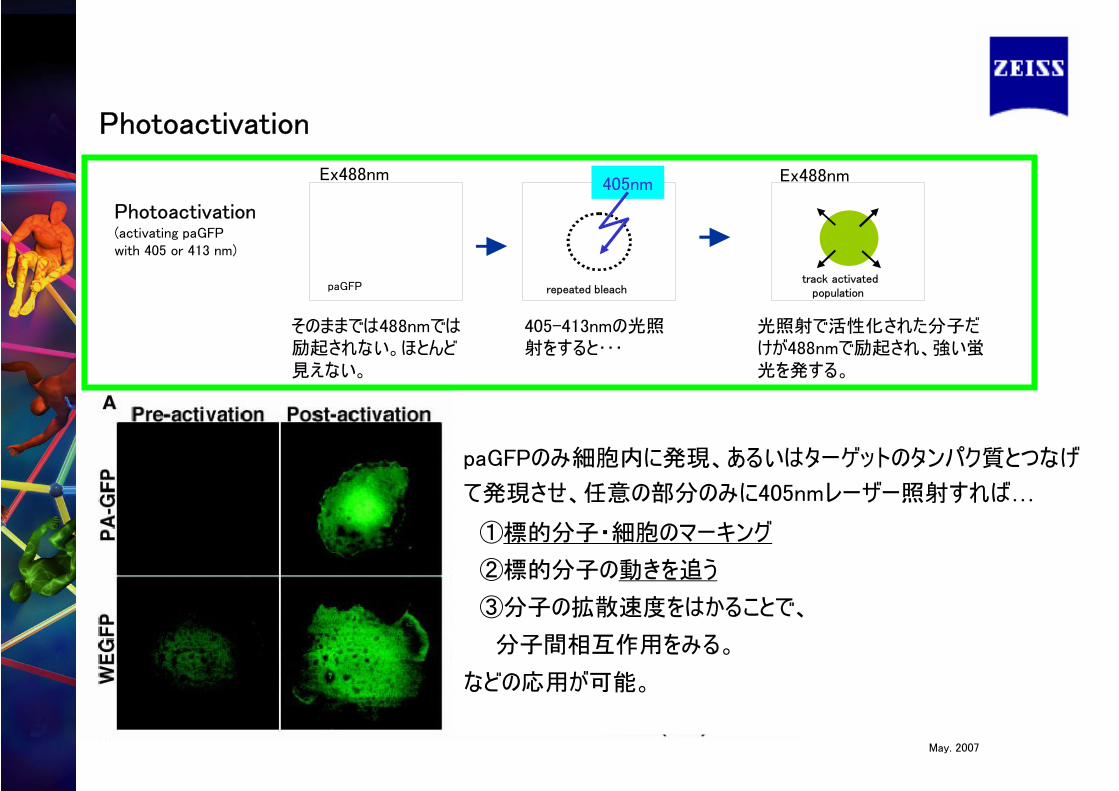
Photoactivation
Photoactivation(activating paGFPwith 405 or 413 nm)
repeated bleach
405nm
paGFP
Ex488nm
track activated population
Ex488nm
そのままでは488nmでは励起されない。ほとんど見えない。
405-413nmの光照射をすると・・・
光照射で活性化された分子だけが488nmで励起され、強い蛍光を発する。
paGFPのみ細胞内に発現、あるいはターゲットのタンパク質とつなげ
て発現させ、任意の部分のみに405nmレーザー照射すれば…
①標的分子・細胞のマーキング
②標的分子の動きを追う
③分子の拡散速度をはかることで、
分子間相互作用をみる。
などの応用が可能。
May. 2007
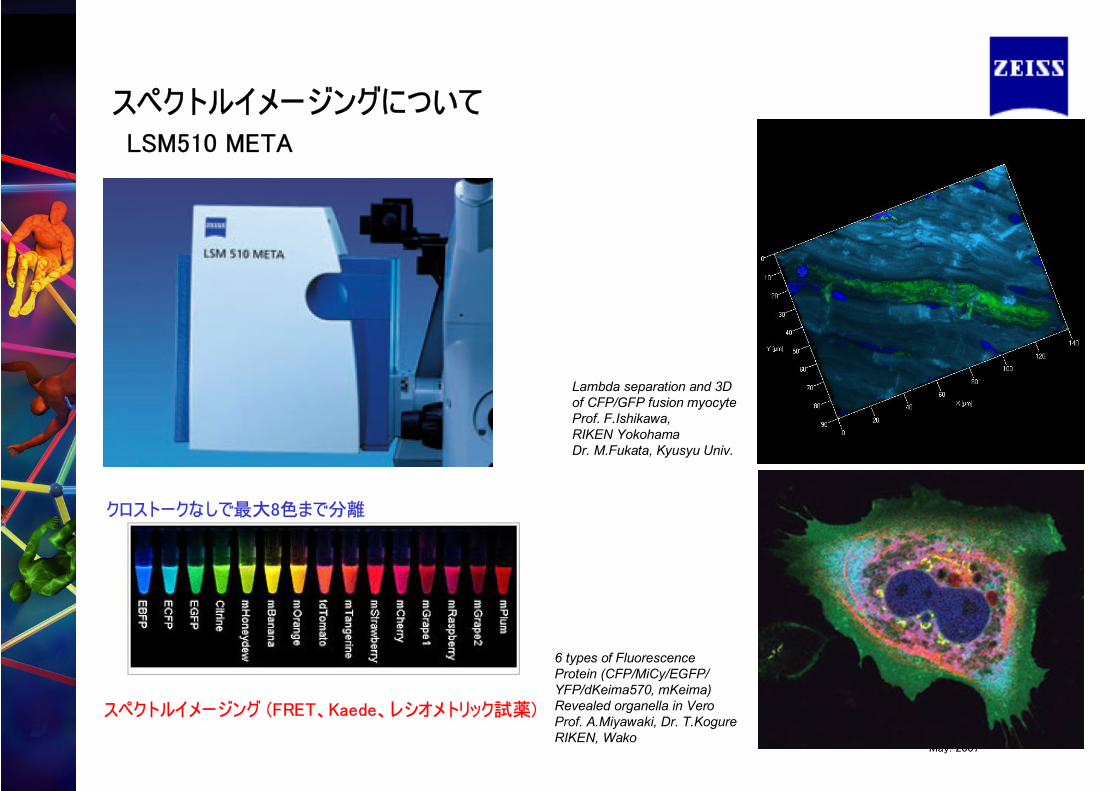
LSM510 META
Lambda separation and 3Dof CFP/GFP fusion myocyteProf. F.Ishikawa, RIKEN YokohamaDr. M.Fukata, Kyusyu Univ.
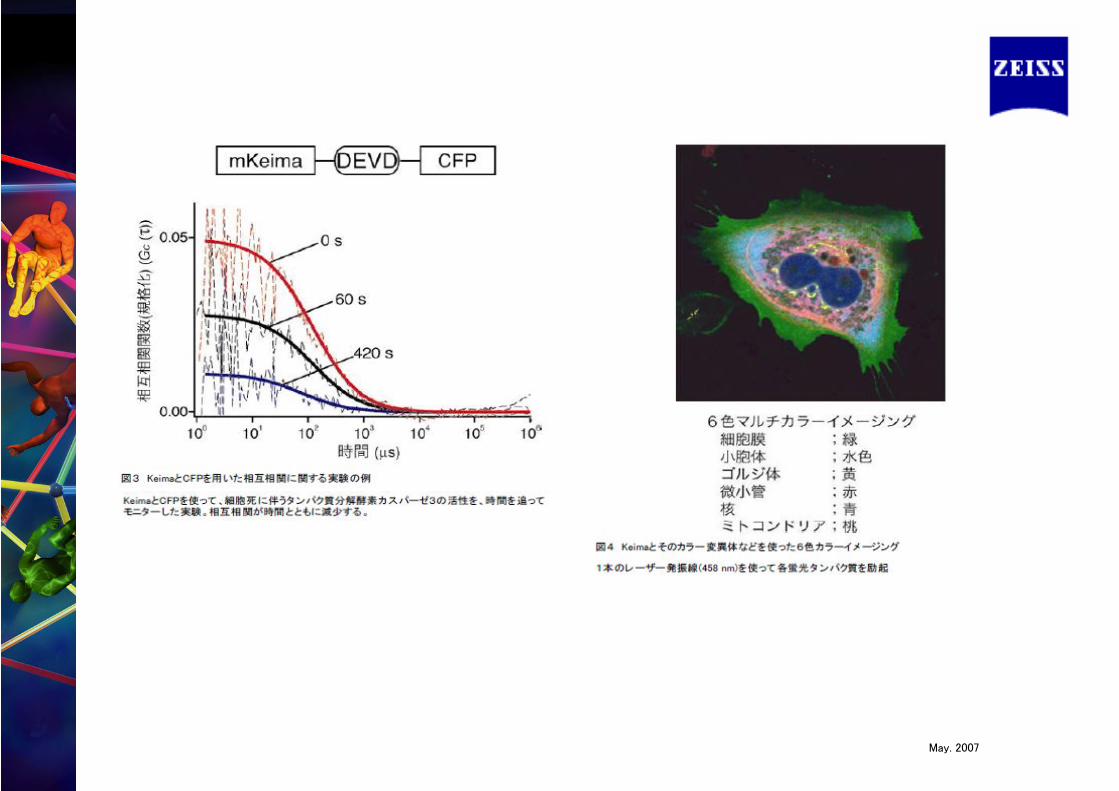
6 types of FluorescenceProtein (CFP/MiCy/EGFP/YFP/dKeima570, mKeima)Revealed organella in VeroProf. A.Miyawaki, Dr. T.KogureRIKEN, Wako
クロストークなしで最大8色まで分離
スペクトルイメージング (FRET、Kaede、レシオメトリック試薬)
スペクトルイメージングについて
May. 2007
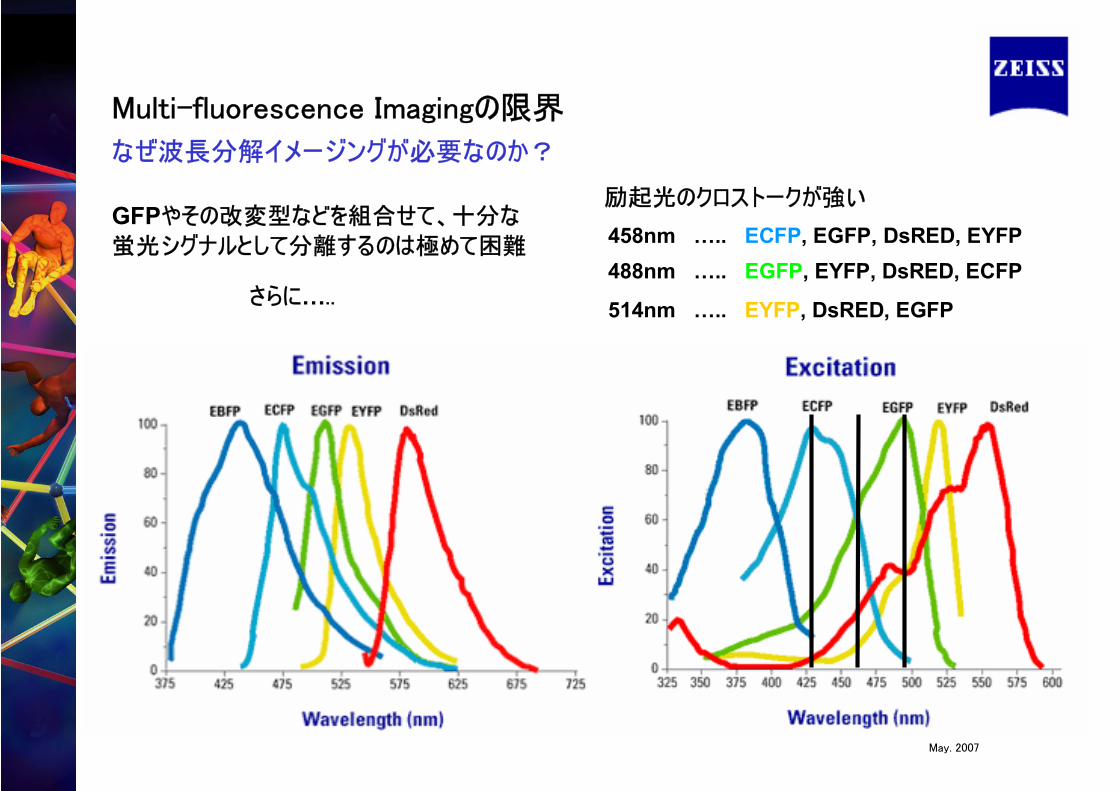
さらに…..
励起光のクロストークが強いGFPやその改変型などを組合せて、十分な
蛍光シグナルとして分離するのは極めて困難488nm ….. EGFP, EYFP, DsRED, ECFP458nm ….. ECFP, EGFP, DsRED, EYFP
514nm ….. EYFP, DsRED, EGFP
Multi-fluorescence Imagingの限界
なぜ波長分解イメージングが必要なのか?
May. 2007
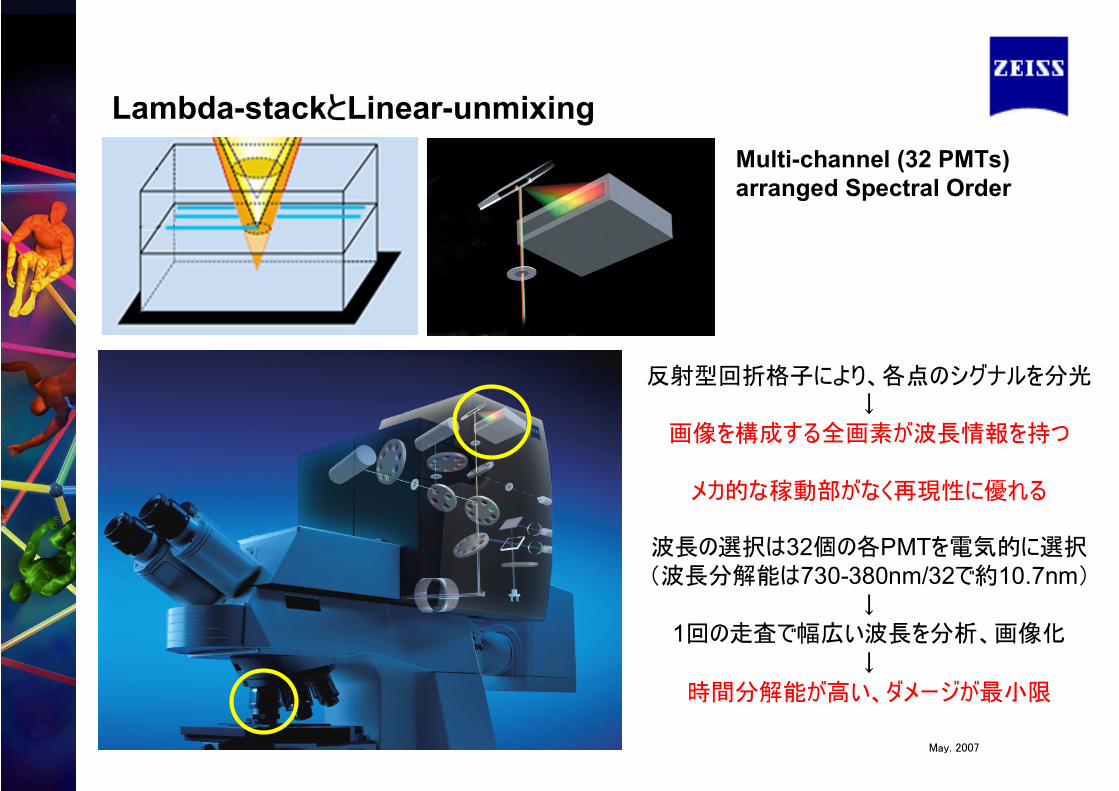
反射型回折格子により、各点のシグナルを分光↓
画像を構成する全画素が波長情報を持つ
メカ的な稼動部がなく再現性に優れる
波長の選択は32個の各PMTを電気的に選択(波長分解能は730-380nm/32で約10.7nm)
↓1回の走査で幅広い波長を分析、画像化
↓時間分解能が高い、ダメージが最小限
Multi-channel (32 PMTs)arranged Spectral Order
Lambda-stackとLinear-unmixing
May. 2007
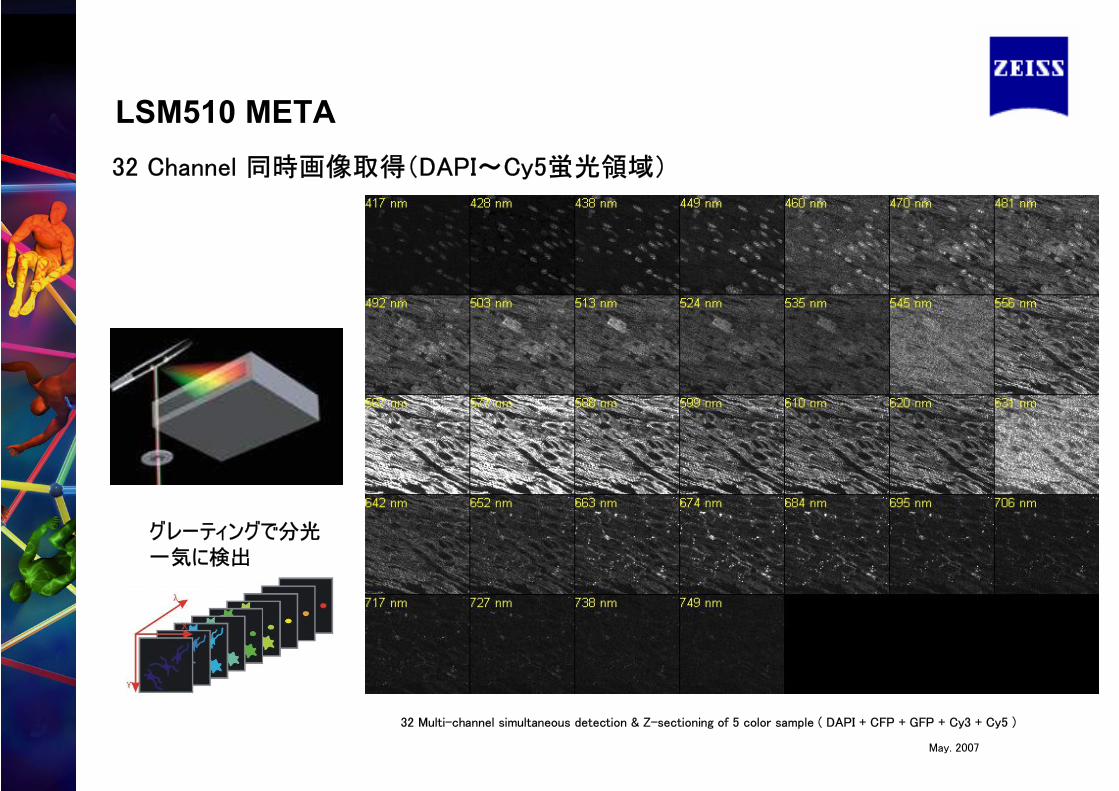
LSM510 META32 Channel 同時画像取得(DAPI~Cy5蛍光領域)
32 Multi-channel simultaneous detection & Z-sectioning of 5 color sample ( DAPI + CFP + GFP + Cy3 + Cy5 )
グレーティングで分光一気に検出
May. 2007
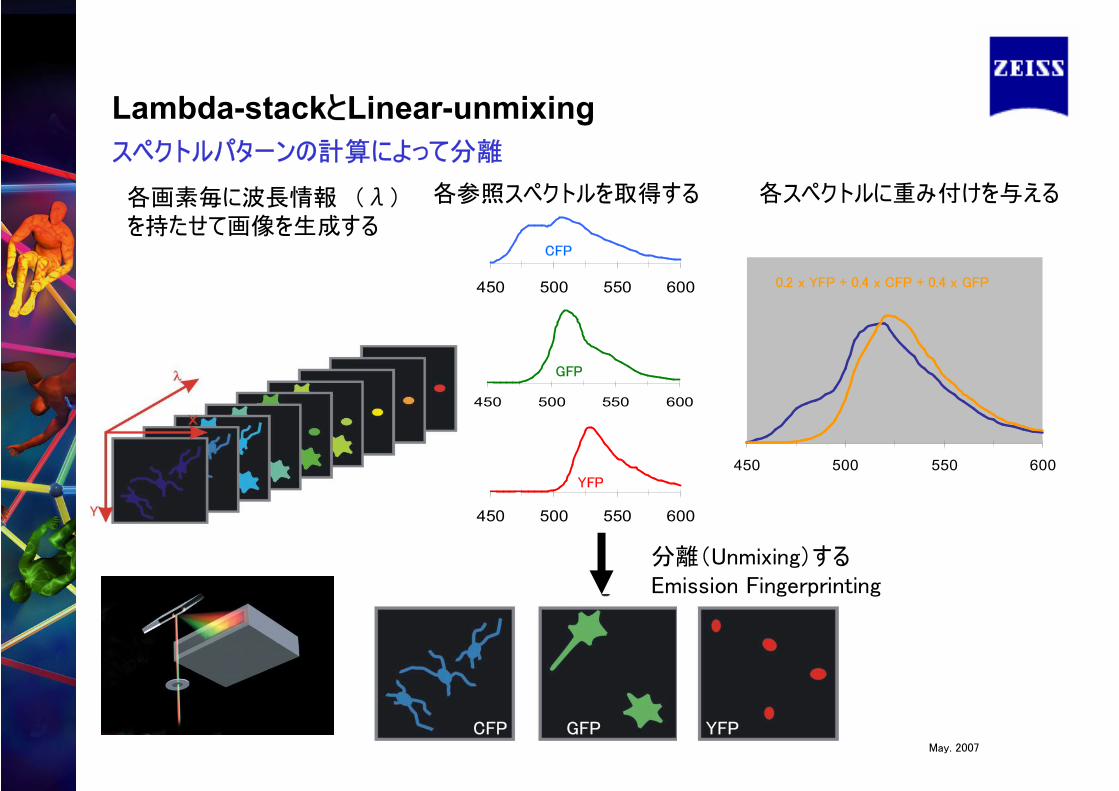
各画素毎に波長情報 (λ)を持たせて画像を生成する
450 500 550 600
CFP
450 500 550 600
GFP
450 500 550 600
YFP
各参照スペクトルを取得する 各スペクトルに重み付けを与える
450 500 550 600
0.2 x YFP + 0.4 x CFP + 0.4 x GFP
CFP GFP YFP
分離(Unmixing)するEmission Fingerprinting
スペクトルパターンの計算によって分離
Lambda-stackとLinear-unmixing
May. 2007
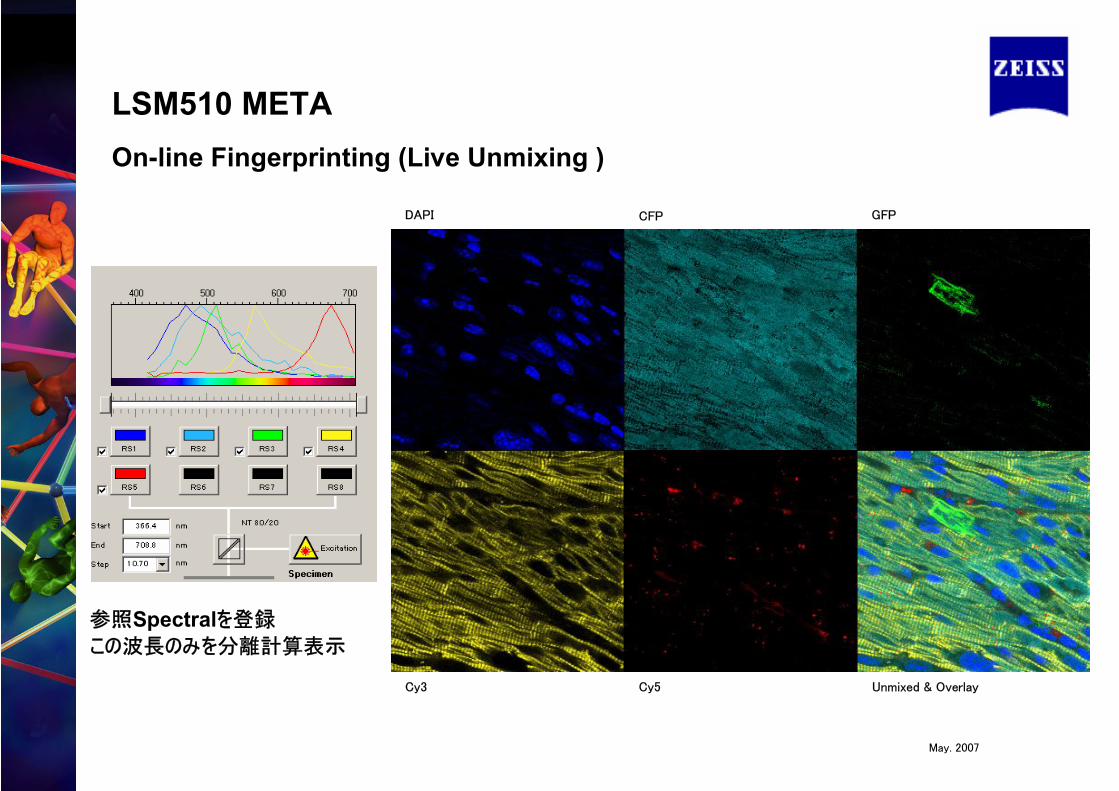
LSM510 METAOn-line Fingerprinting (Live Unmixing )
DAPI CFP GFP
Cy3 Cy5 Unmixed & Overlay
参照Spectralを登録
この波長のみを分離計算表示
May. 2007
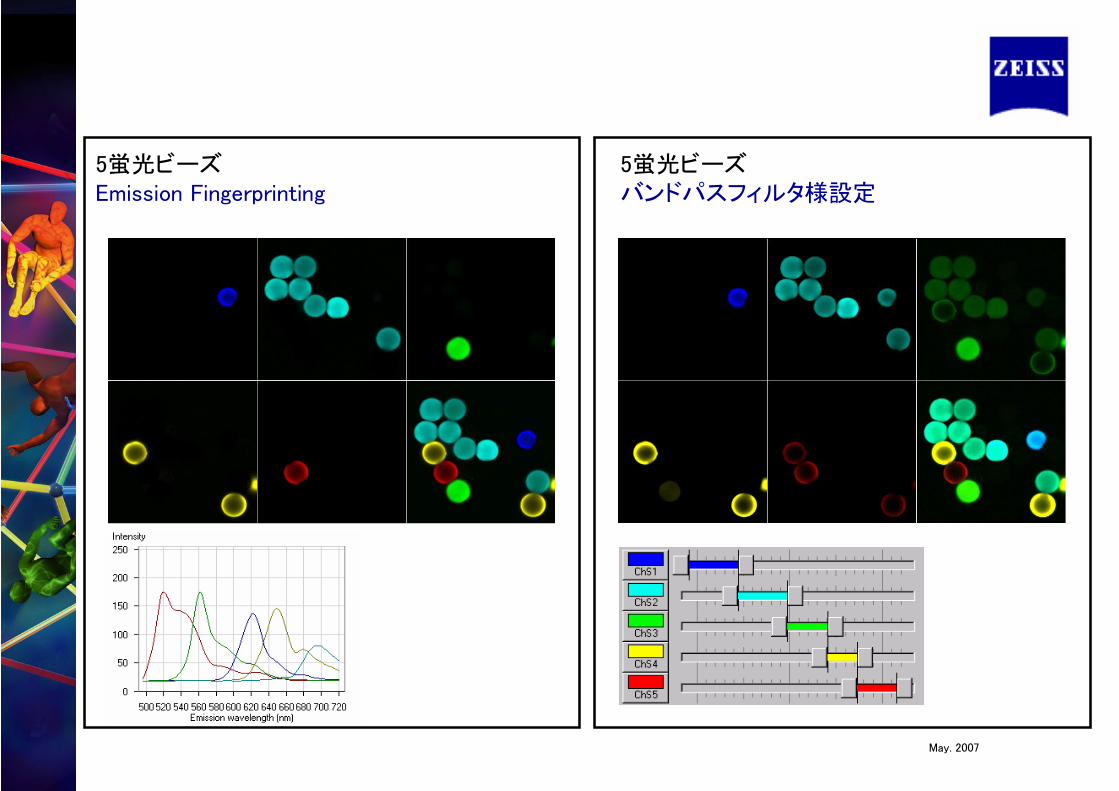
5蛍光ビーズバンドパスフィルタ様設定
5蛍光ビーズEmission Fingerprinting
May. 2007
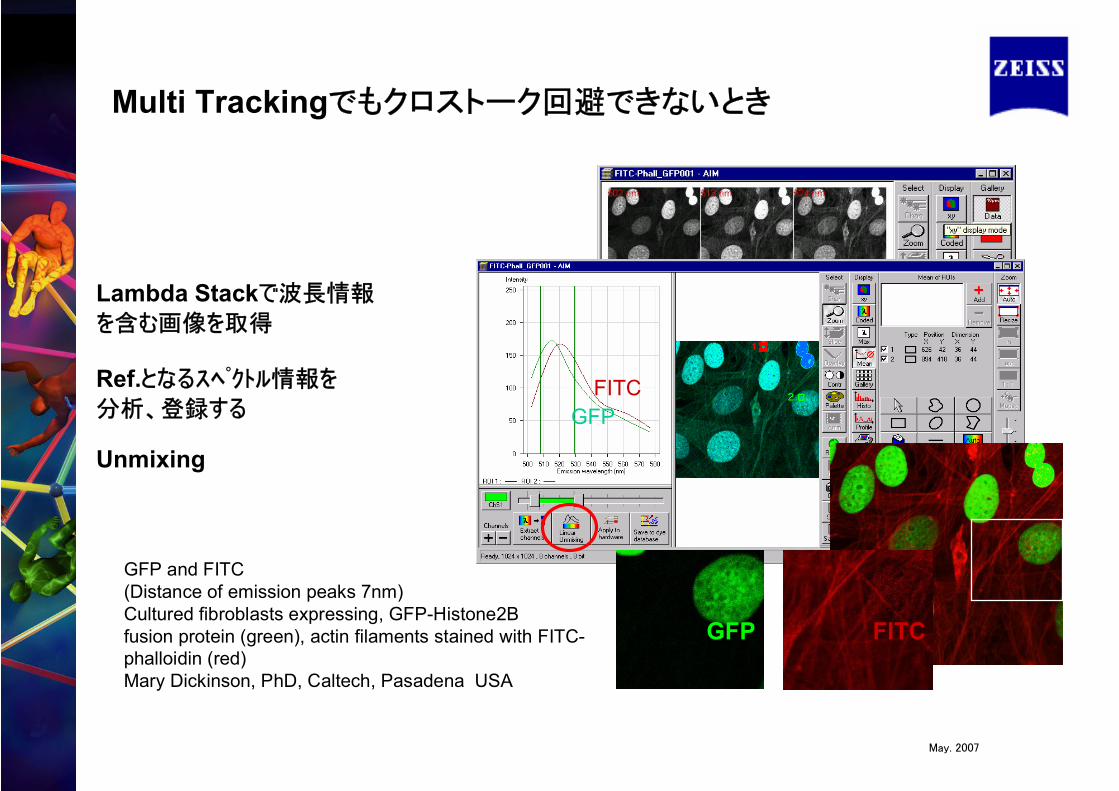
Multi Trackingでもクロストーク回避できないとき
Lambda Stackで波長情報
を含む画像を取得
FITCGFP
Ref.となるスペクトル情報を
分析、登録する
GFP FITC
GFP and FITC (Distance of emission peaks 7nm)Cultured fibroblasts expressing, GFP-Histone2Bfusion protein (green), actin filaments stained with FITC-phalloidin (red)Mary Dickinson, PhD, Caltech, Pasadena USA
Unmixing
May. 2007
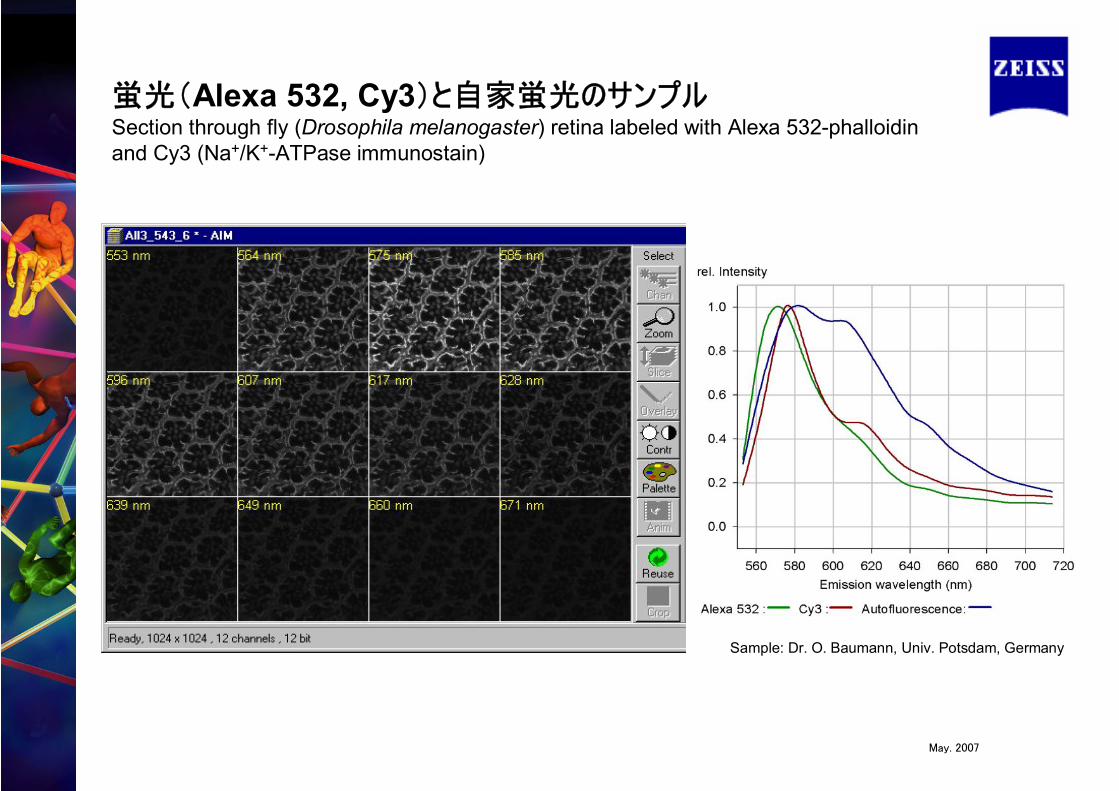
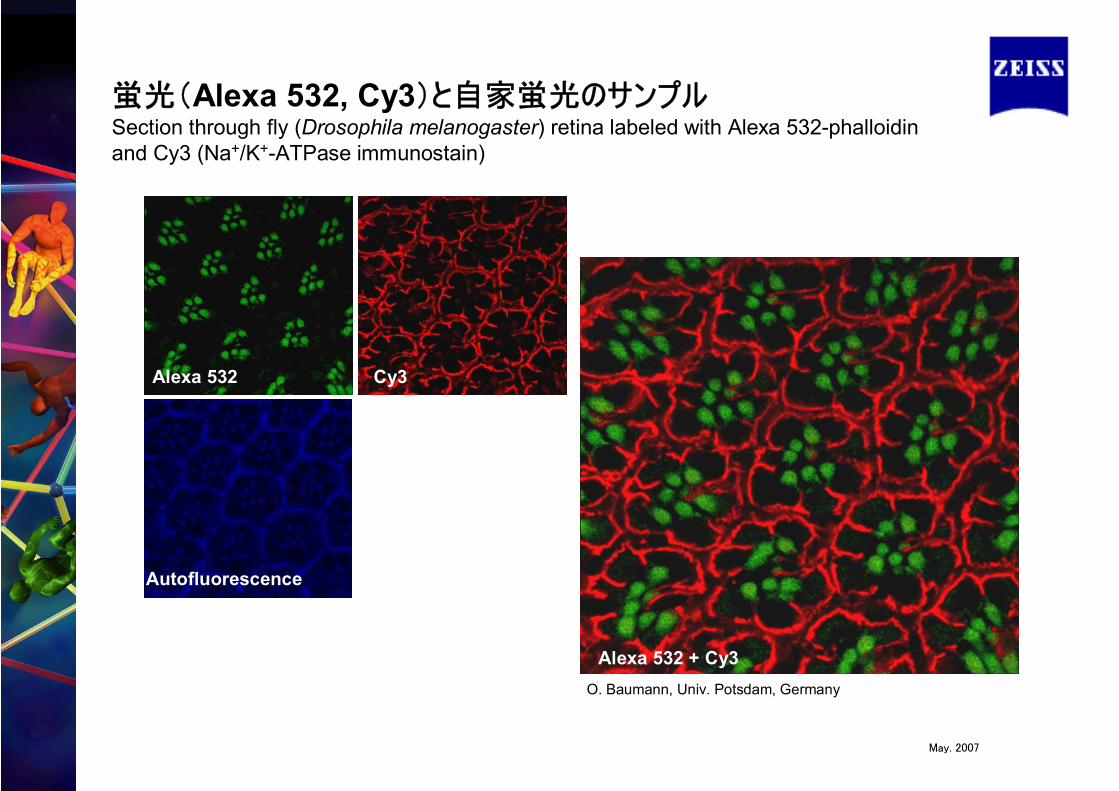
蛍光(Alexa 532, Cy3)と自家蛍光のサンプルSection through fly (Drosophila melanogaster) retina labeled with Alexa 532-phalloidin and Cy3 (Na+/K+-ATPase immunostain)
Sample: Dr. O. Baumann, Univ. Potsdam, Germany
May. 2007
Cy3Alexa 532
Alexa 532 + Cy3
Autofluorescence
O. Baumann, Univ. Potsdam, Germany
蛍光(Alexa 532, Cy3)と自家蛍光のサンプルSection through fly (Drosophila melanogaster) retina labeled with Alexa 532-phalloidin and Cy3 (Na+/K+-ATPase immunostain)
May. 2007
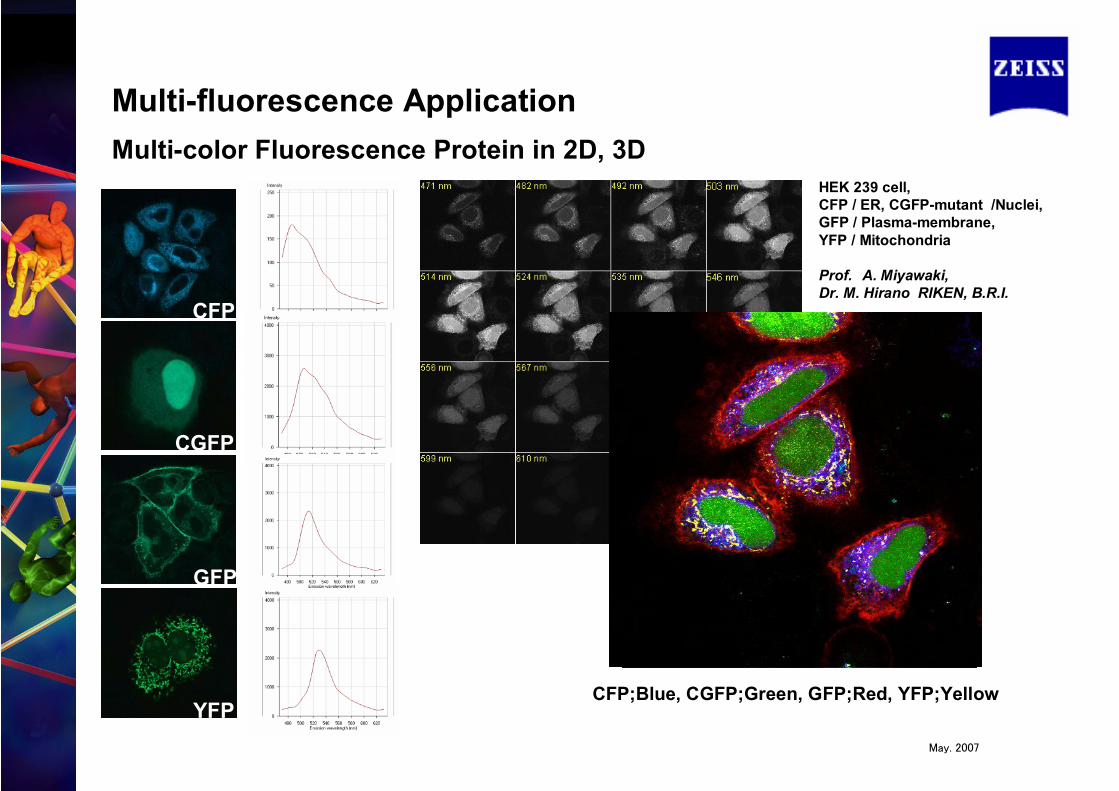
CFP
CGFP
GFP
YFP
HEK 239 cell, CFP / ER, CGFP-mutant /Nuclei, GFP / Plasma-membrane, YFP / Mitochondria
Prof. A. Miyawaki, Dr. M. Hirano RIKEN, B.R.I.
CFP;Blue, CGFP;Green, GFP;Red, YFP;Yellow
Multi-fluorescence ApplicationMulti-color Fluorescence Protein in 2D, 3D
May. 2007
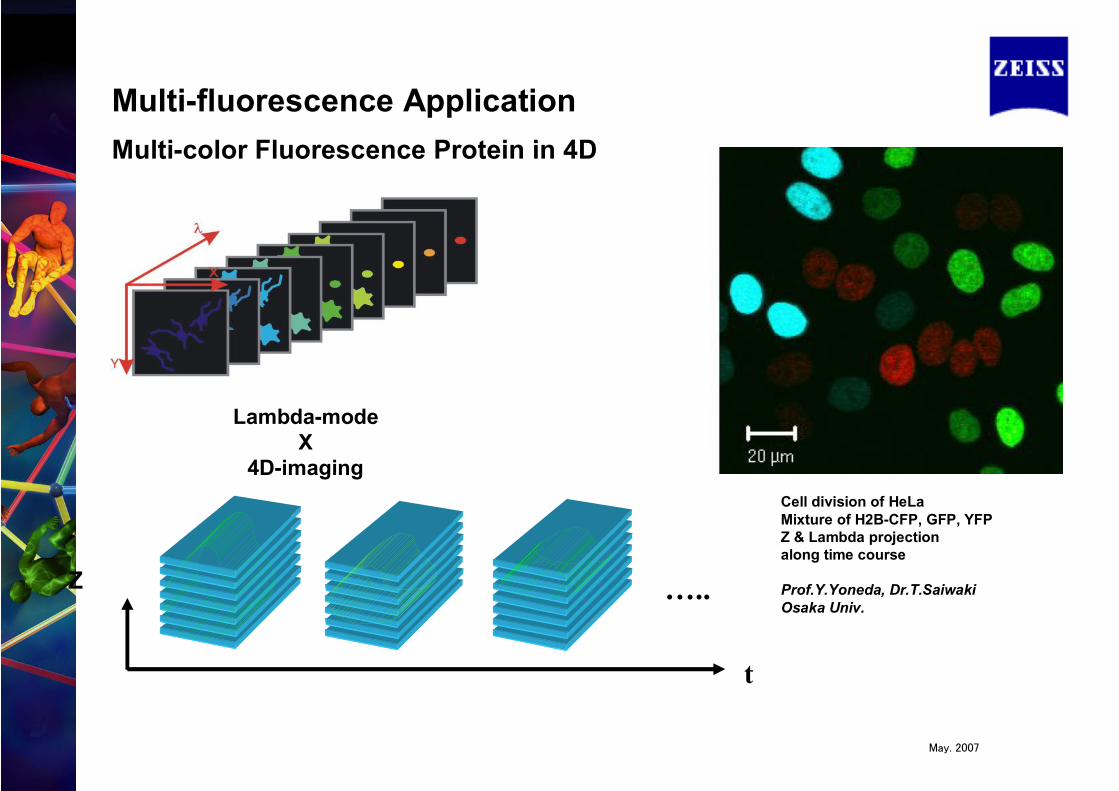
t
…..
Lambda-modeX
4D-imagingCell division of HeLaMixture of H2B-CFP, GFP, YFPZ & Lambda projection along time course
Prof.Y.Yoneda, Dr.T.SaiwakiOsaka Univ.
Z
Multi-fluorescence ApplicationMulti-color Fluorescence Protein in 4D
May. 2007
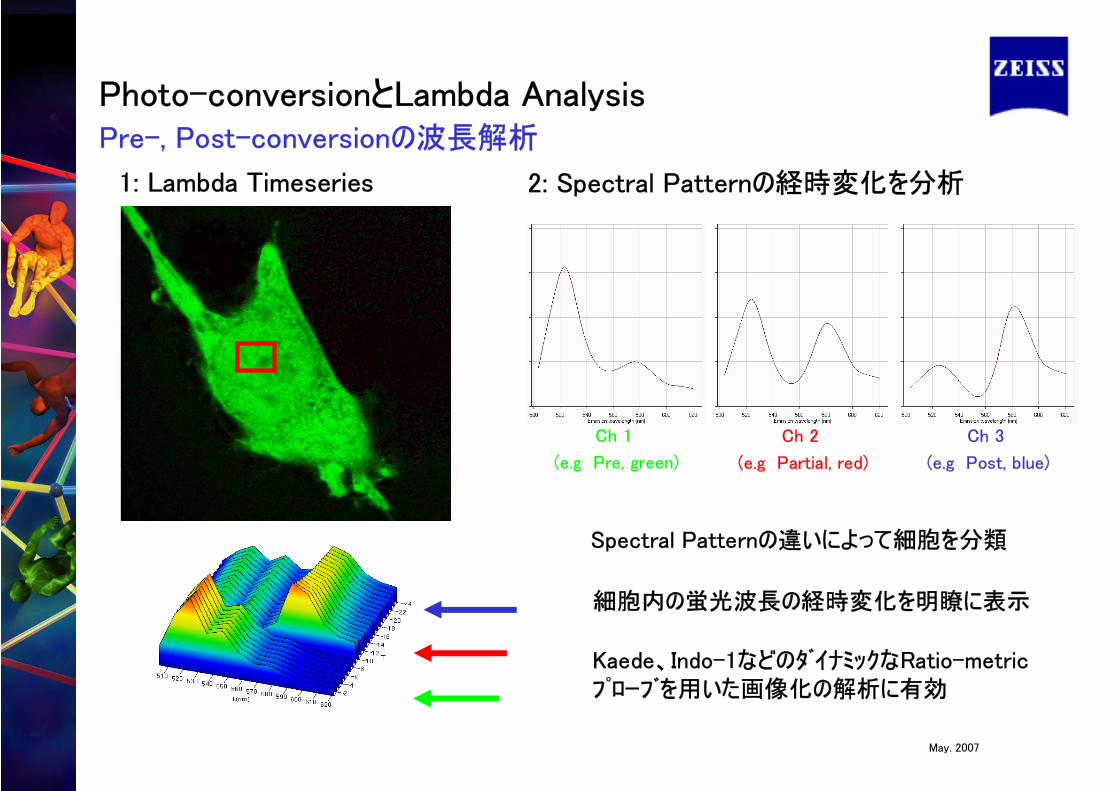
1: Lambda Timeseries 2: Spectral Patternの経時変化を分析
Ch 1
(e.g Pre, green)
Ch 2
(e.g Partial, red)
Ch 3
(e.g Post, blue)
Spectral Patternの違いによって細胞を分類
Kaede、Indo-1などのダイナミックなRatio-metricプローブを用いた画像化の解析に有効
細胞内の蛍光波長の経時変化を明瞭に表示
Photo-conversionとLambda AnalysisPre-, Post-conversionの波長解析
May. 2007
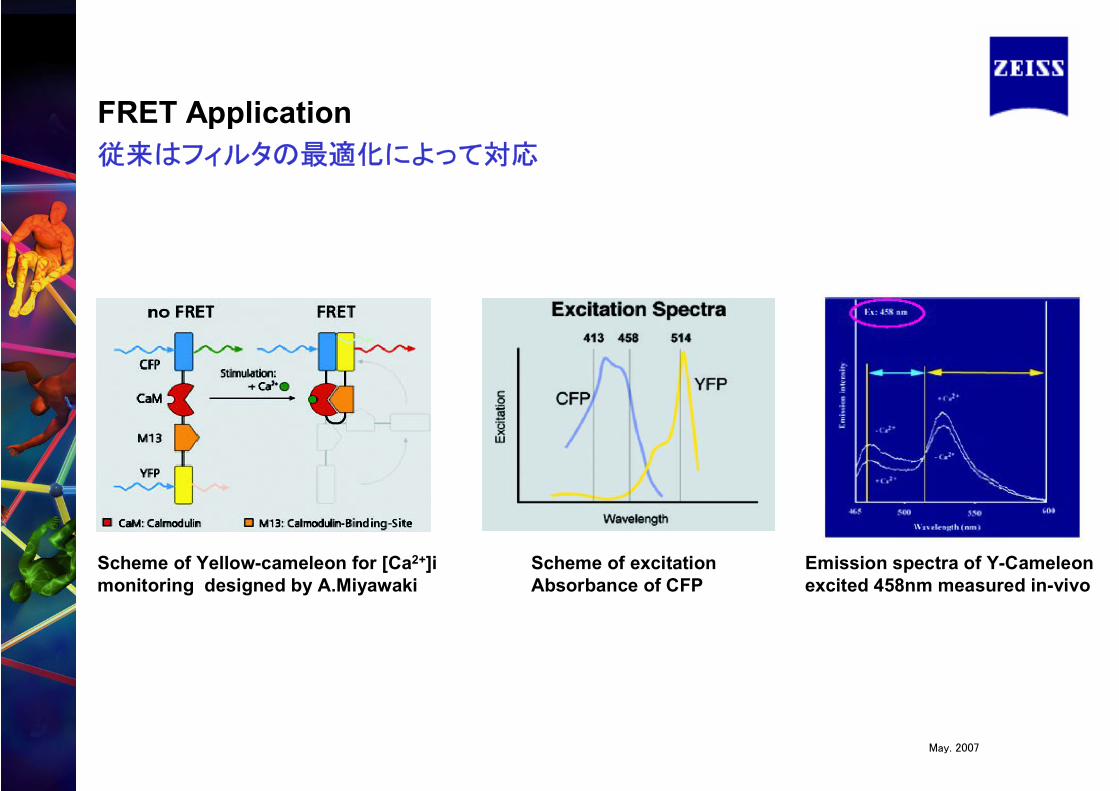
FRET Application従来はフィルタの最適化によって対応
Scheme of Yellow-cameleon for [Ca2+]imonitoring designed by A.Miyawaki
Scheme of excitationAbsorbance of CFP
Emission spectra of Y-Cameleonexcited 458nm measured in-vivo
May. 2007
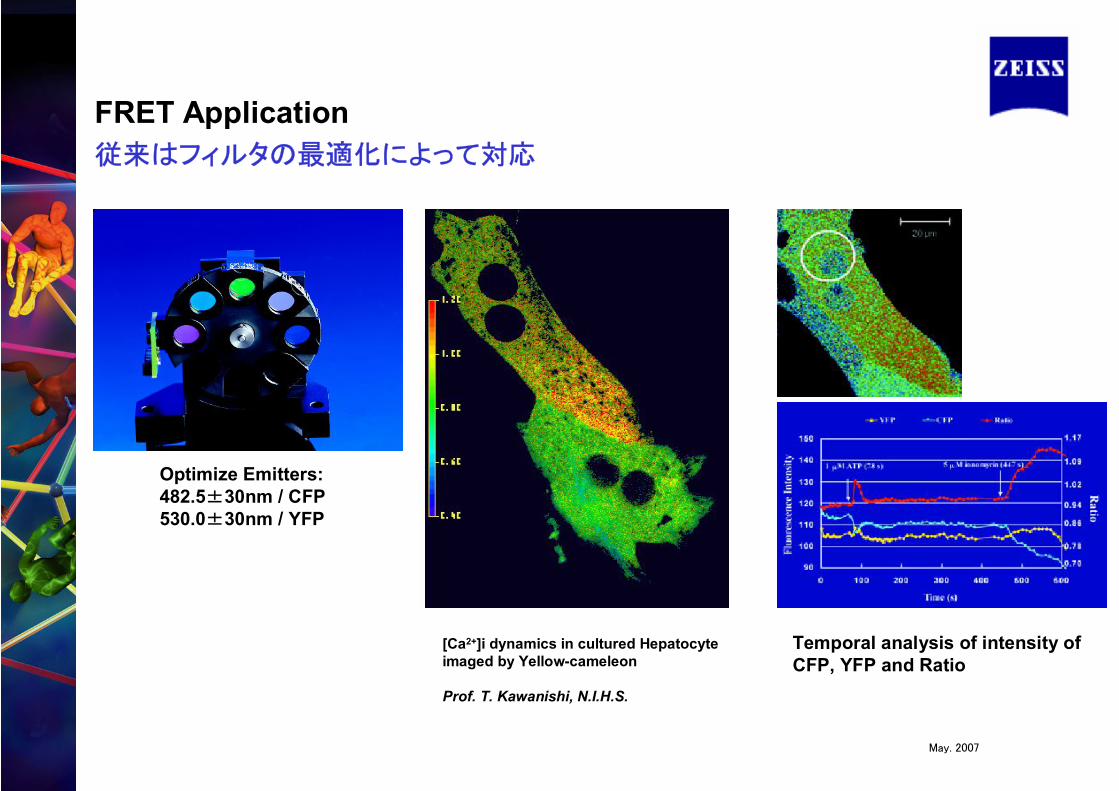
Optimize Emitters:482.5±30nm / CFP530.0±30nm / YFP
[Ca2+]i dynamics in cultured Hepatocyteimaged by Yellow-cameleon
Prof. T. Kawanishi, N.I.H.S.
Temporal analysis of intensity of CFP, YFP and Ratio
FRET Application従来はフィルタの最適化によって対応
May. 2007
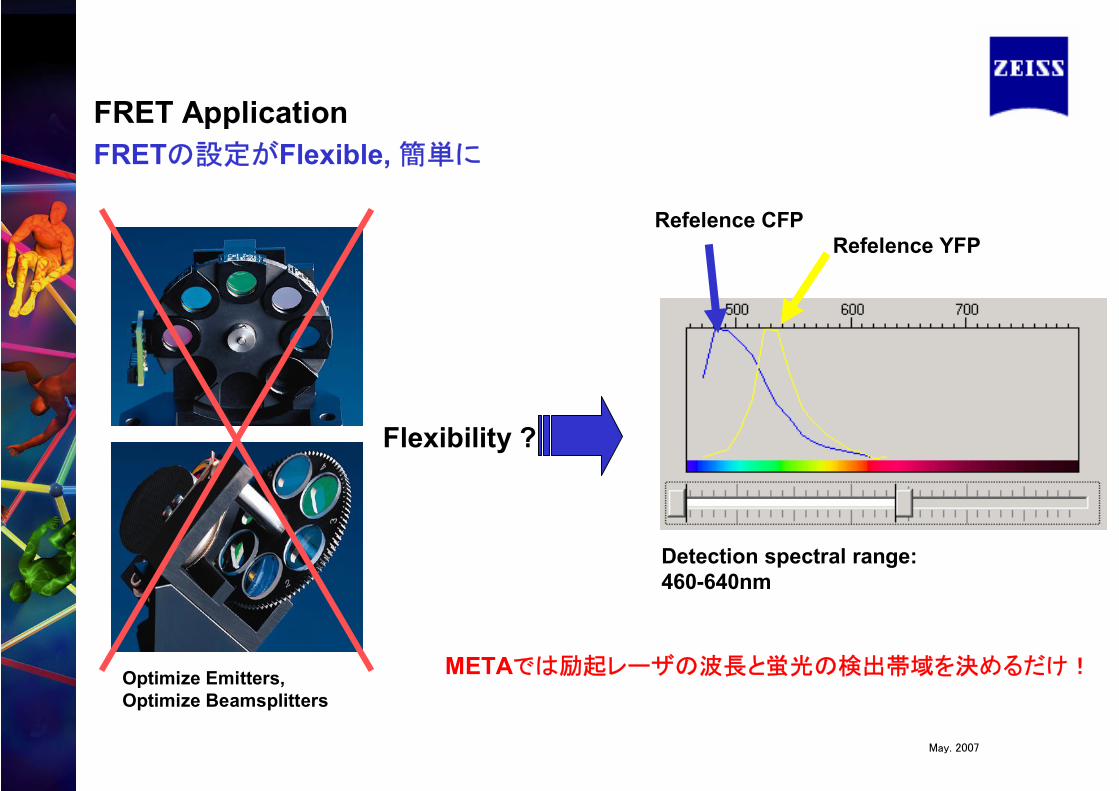
Optimize Emitters,Optimize Beamsplitters
Flexibility ?
Refelence CFPRefelence YFP
Detection spectral range:460-640nm
FRET ApplicationFRETの設定がFlexible, 簡単に
METAでは励起レーザの波長と蛍光の検出帯域を決めるだけ!
May. 2007
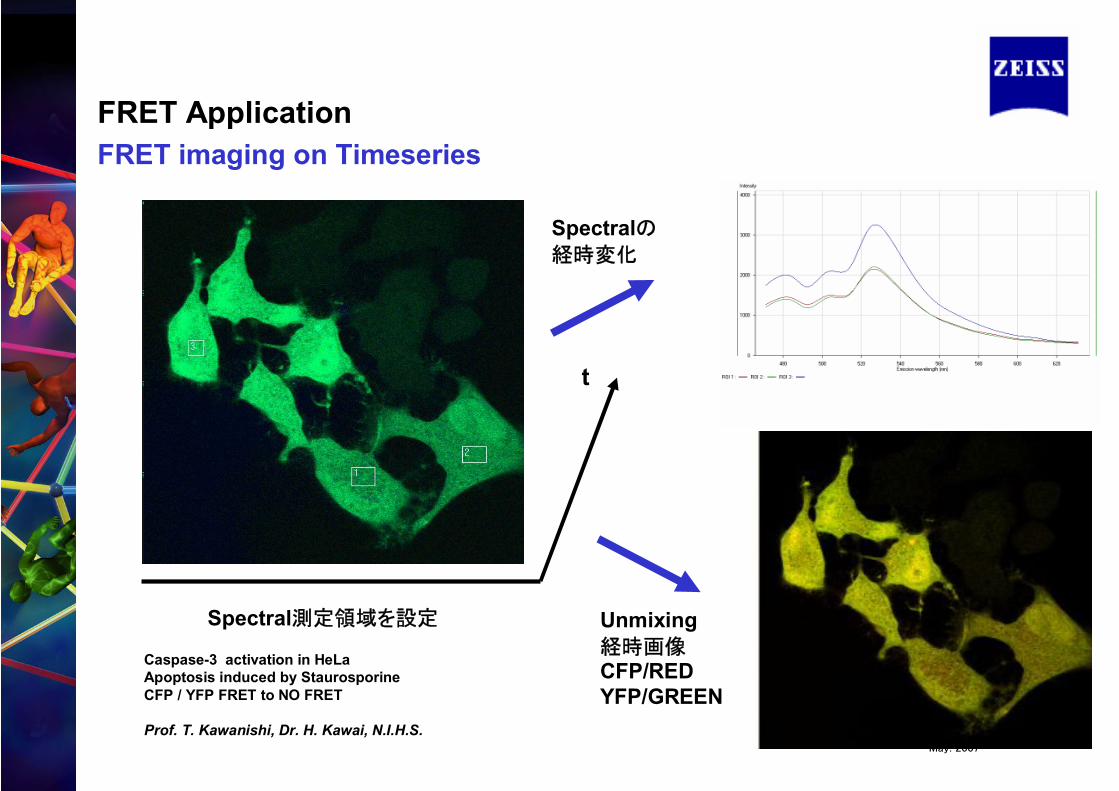
Caspase-3 activation in HeLaApoptosis induced by StaurosporineCFP / YFP FRET to NO FRET
Prof. T. Kawanishi, Dr. H. Kawai, N.I.H.S.
t
Spectralの経時変化
Unmixing経時画像CFP/REDYFP/GREEN
Spectral測定領域を設定
FRET ApplicationFRET imaging on Timeseries
May. 2007
0
500
1000
1500
400 450 500 550
0
1
2
3
4
5
6
7
0
5 0 0
1 0 0 0
1 5 0 0
2 0 0 0
2 5 0 0
4 0 0 4 5 0 5 0 0 5 5 0
0
1
Intensity Ratio
(sec.)
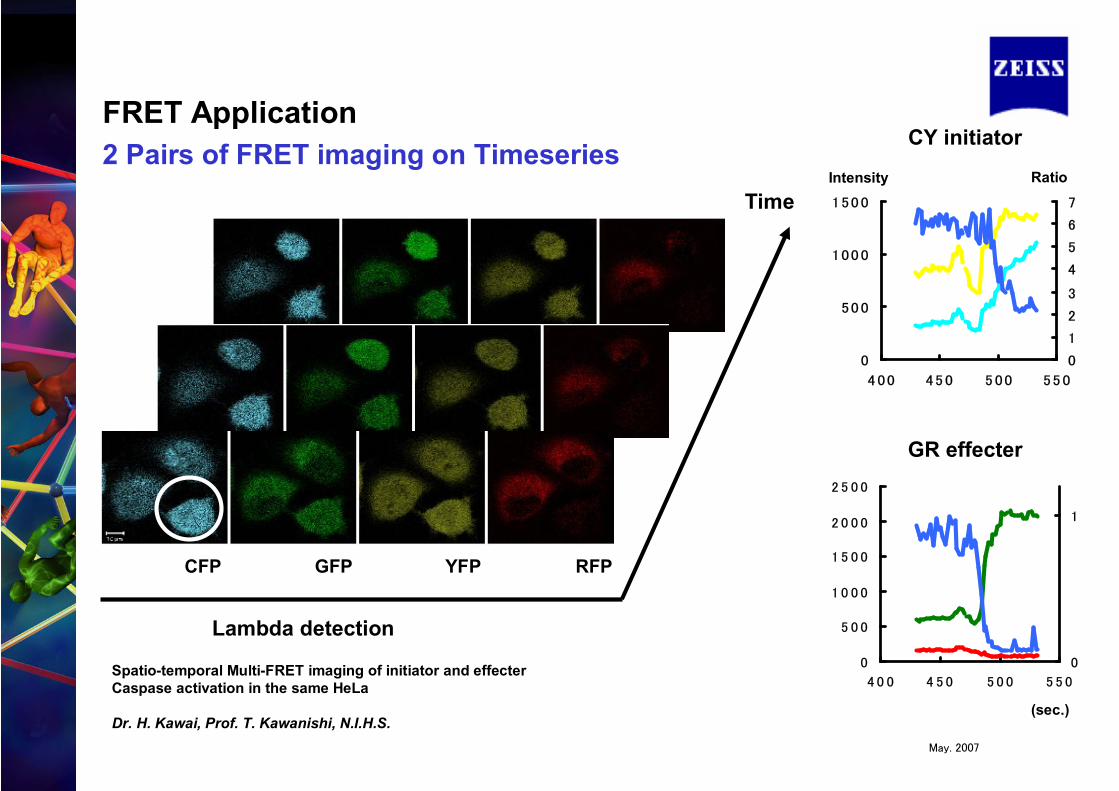
CY initiator
GR effecter
CFP GFP YFP RFP
Lambda detection
Time
Spatio-temporal Multi-FRET imaging of initiator and effecter Caspase activation in the same HeLa
Dr. H. Kawai, Prof. T. Kawanishi, N.I.H.S.
FRET Application2 Pairs of FRET imaging on Timeseries
May. 2007
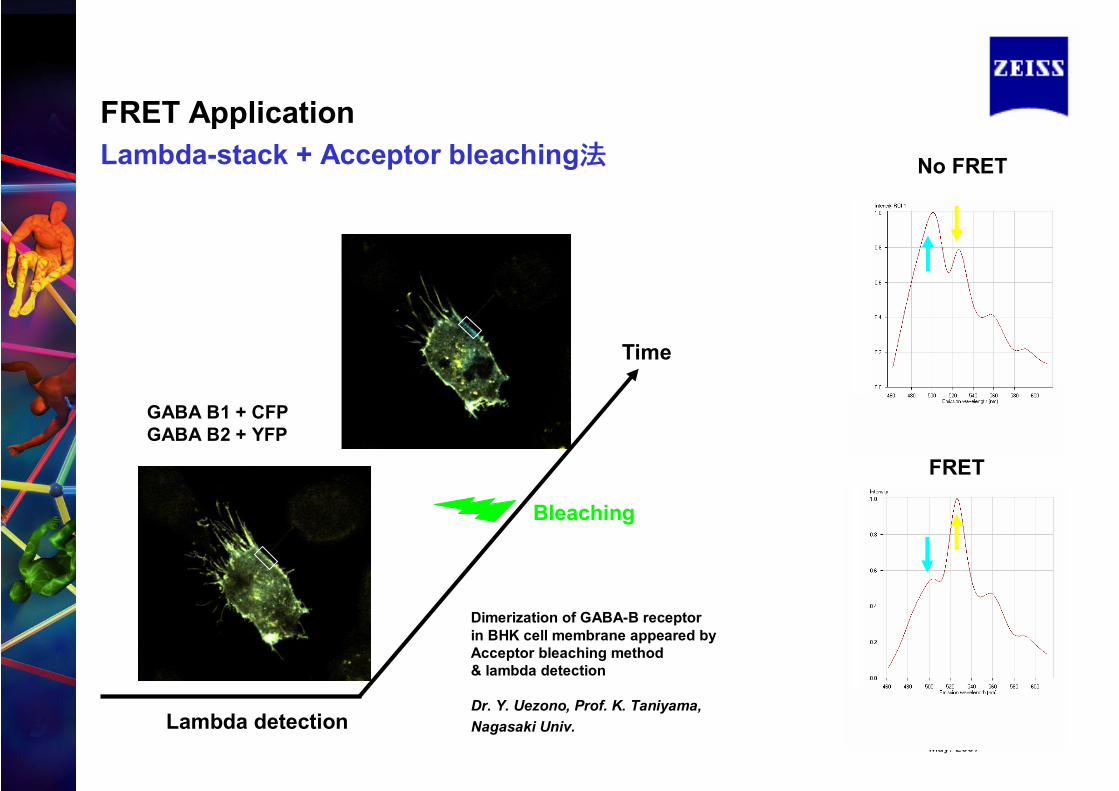
Lambda detection
Time
Bleaching
No FRET
FRET
Dimerization of GABA-B receptorin BHK cell membrane appeared byAcceptor bleaching method& lambda detection
Dr. Y. Uezono, Prof. K. Taniyama, Nagasaki Univ.
GABA B1 + CFPGABA B2 + YFP
FRET ApplicationLambda-stack + Acceptor bleaching法
May. 2007
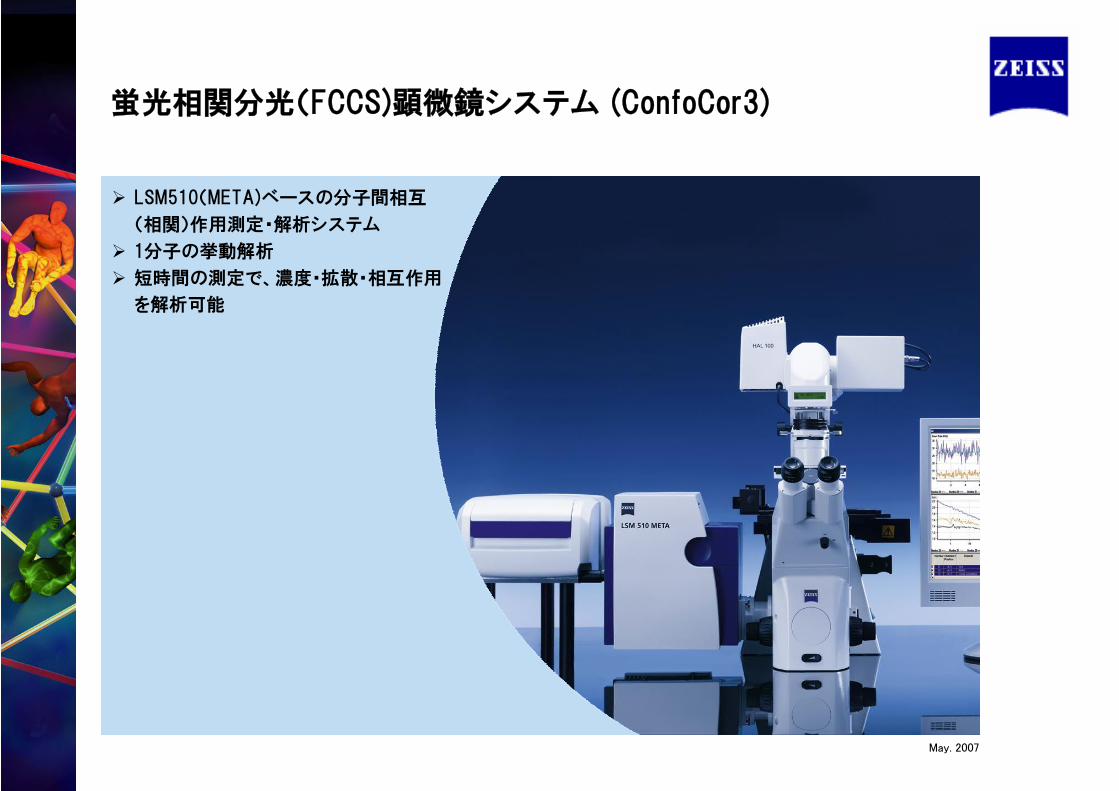
蛍光相関分光(FCCS)顕微鏡システム (ConfoCor3)
LSM510(META)ベースの分子間相互
(相関)作用測定・解析システム
1分子の挙動解析
短時間の測定で、濃度・拡散・相互作用
を解析可能
May. 2007
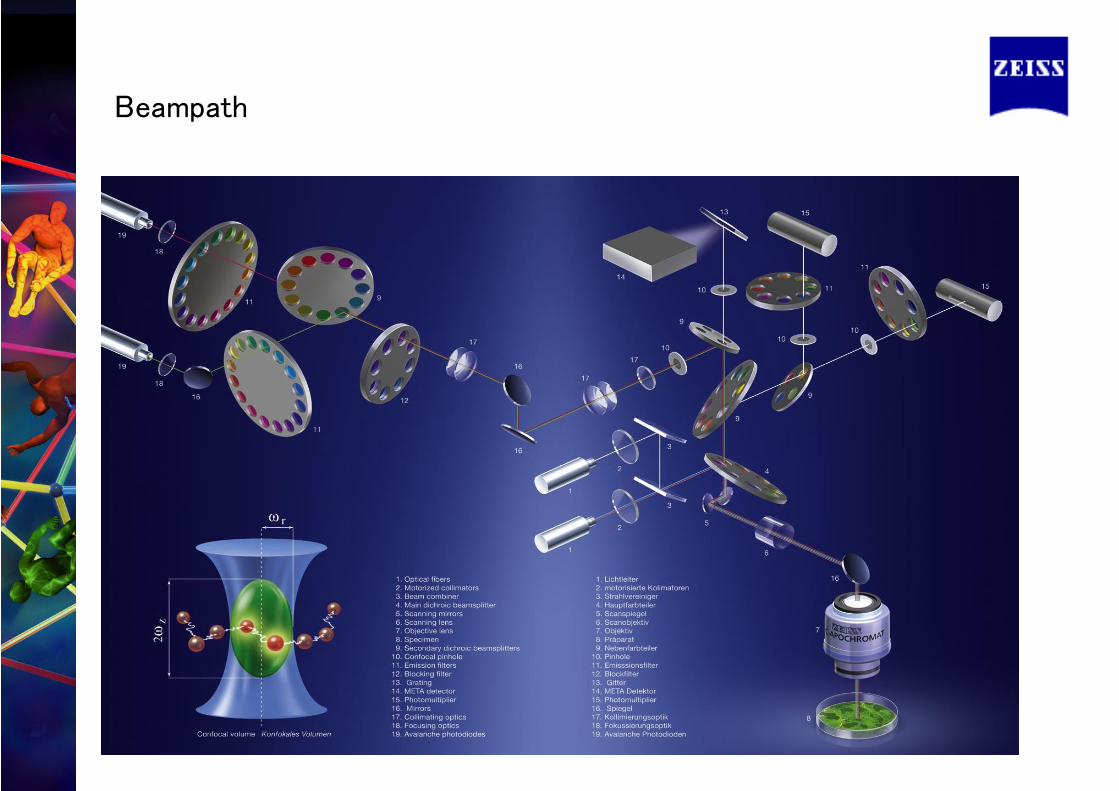
Beampath
May. 2007
• FCS : Fluorescence Correlation Spectroscopy
蛍光相関分光法
• FCCS : Fluorescence Cross-Correlation Spectroscopy
蛍光相互相関分光法
• AC : Auto-correlation
自己相関関数
• CC : Cross-correlation
相互相関関数
用語
May. 2007
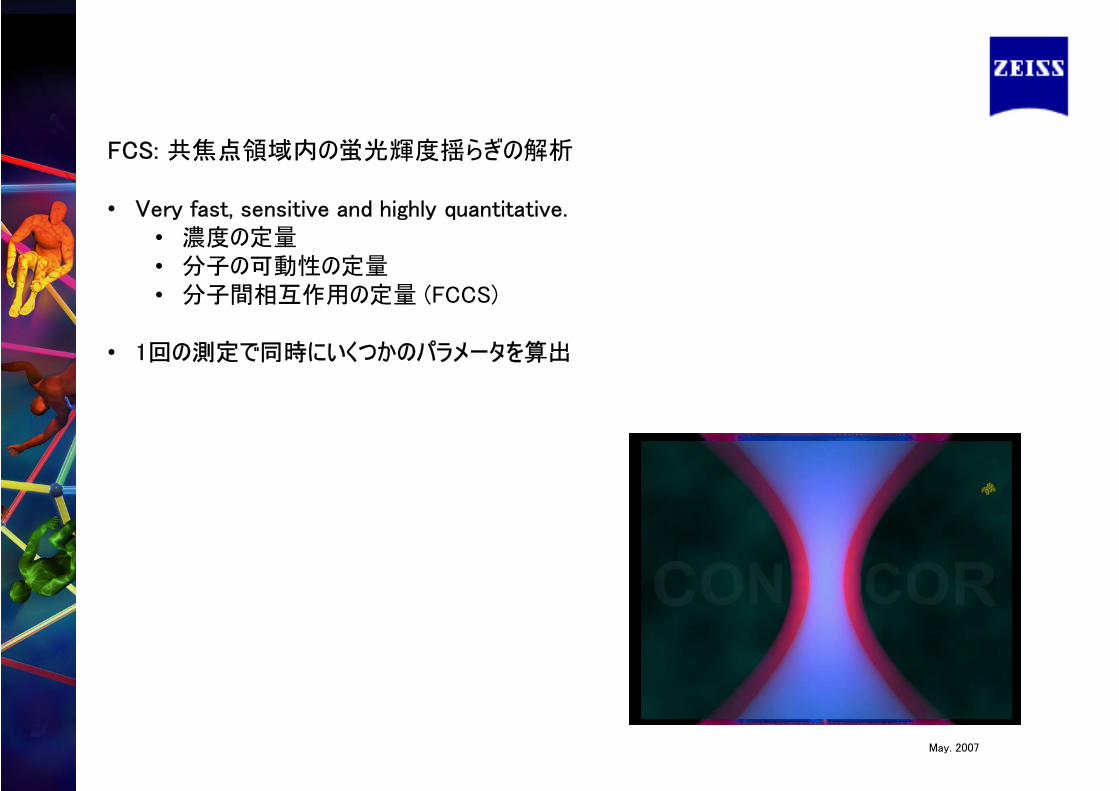
FCS: 共焦点領域内の蛍光輝度揺らぎの解析
• Very fast, sensitive and highly quantitative.• 濃度の定量• 分子の可動性の定量• 分子間相互作用の定量 (FCCS)
• 1回の測定で同時にいくつかのパラメータを算出
May. 2007
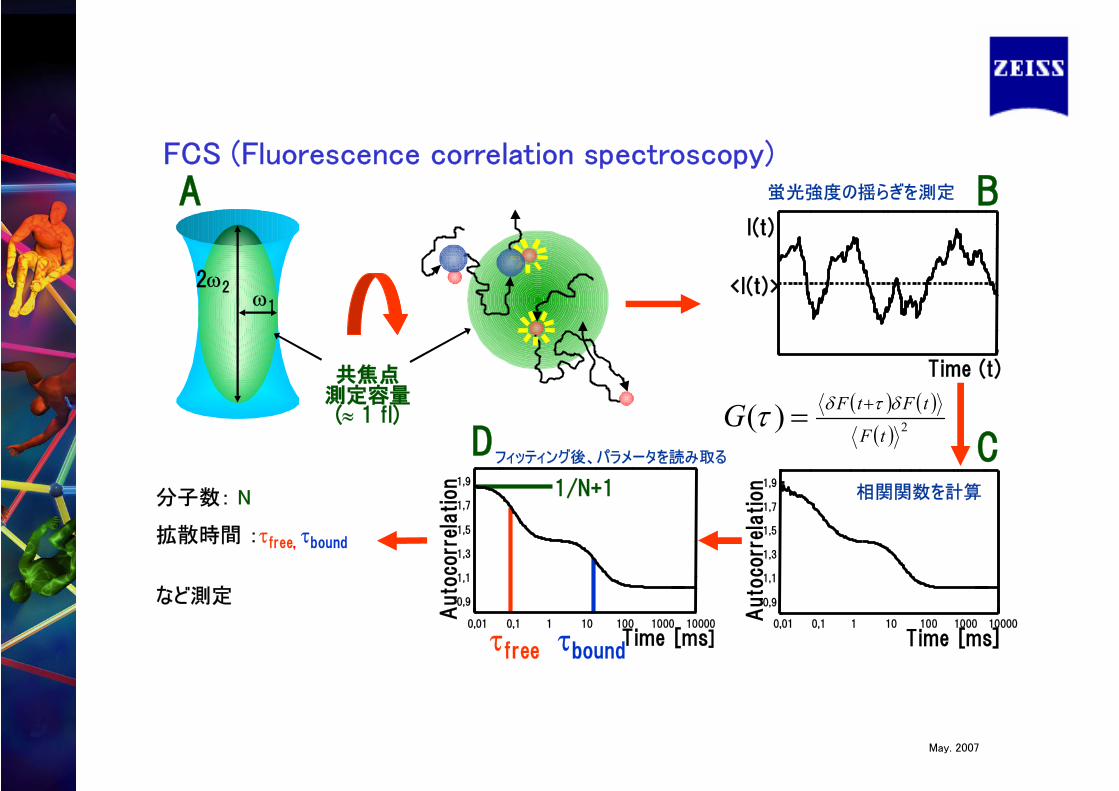
A
共焦点測定容量(» 1 fl)
2w2w1
分子数: N
拡散時間 :tfree, tbound
など測定
FCS (Fluorescence correlation spectroscopy)
B
Time (t)
I(t)
<I(t)>
蛍光強度の揺らぎを測定
C
Time [ms]
Auto
corr
elation
( ) ( )( ) 2(tF
tFtFG dtdt +=)
0,01 0,1 1 10 100 1000 10000
0,9
1,1
1,3
1,5
1,7
1,9相関関数を計算
Auto
corr
elation
Time [ms]tfree tbound
D1/N+1
0,01 0,1 1 10 100 1000 10000
0,9
1,1
1,3
1,5
1,7
1,9
フィッティング後、パラメータを読み取る
May. 2007
May. 2007
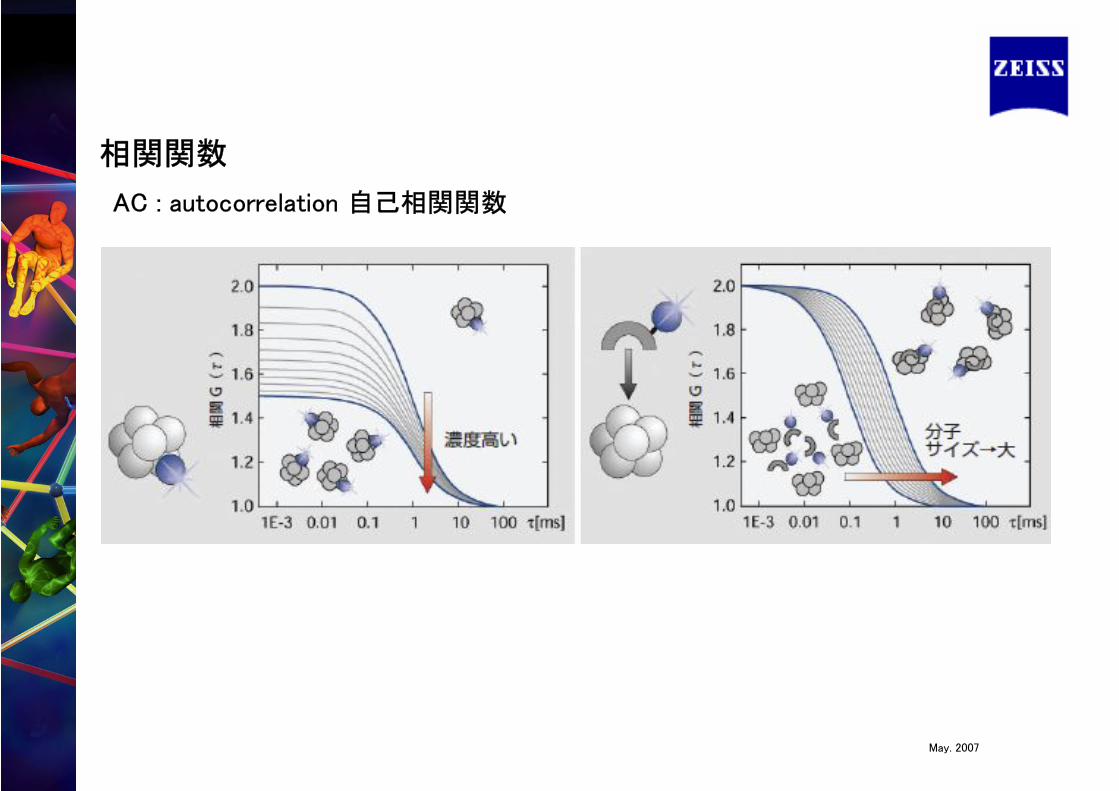
AC : autocorrelation 自己相関関数
相関関数
May. 2007
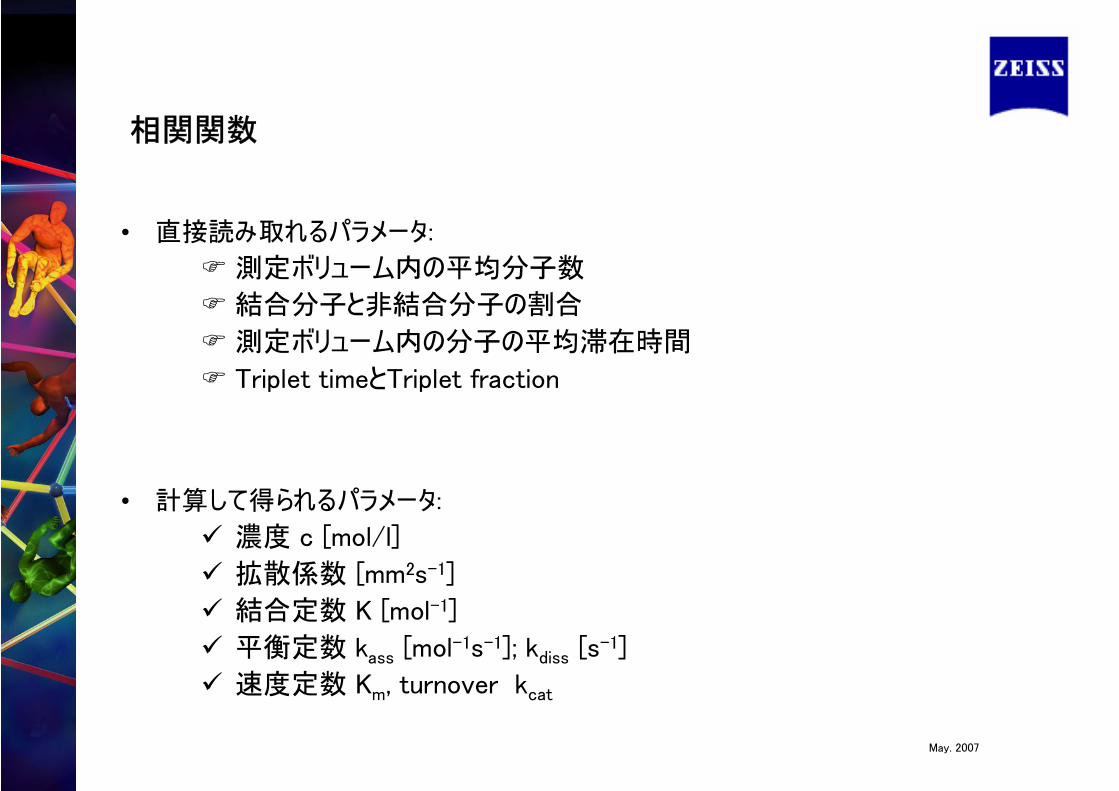
• 直接読み取れるパラメータ:
測定ボリューム内の平均分子数
結合分子と非結合分子の割合
測定ボリューム内の分子の平均滞在時間
Triplet timeとTriplet fraction
• 計算して得られるパラメータ:
濃度 c [mol/l]
拡散係数 [mm2s-1]
結合定数 K [mol-1]
平衡定数 kass [mol-1s-1]; kdiss [s-1]
速度定数 Km, turnover kcat
相関関数
May. 2007
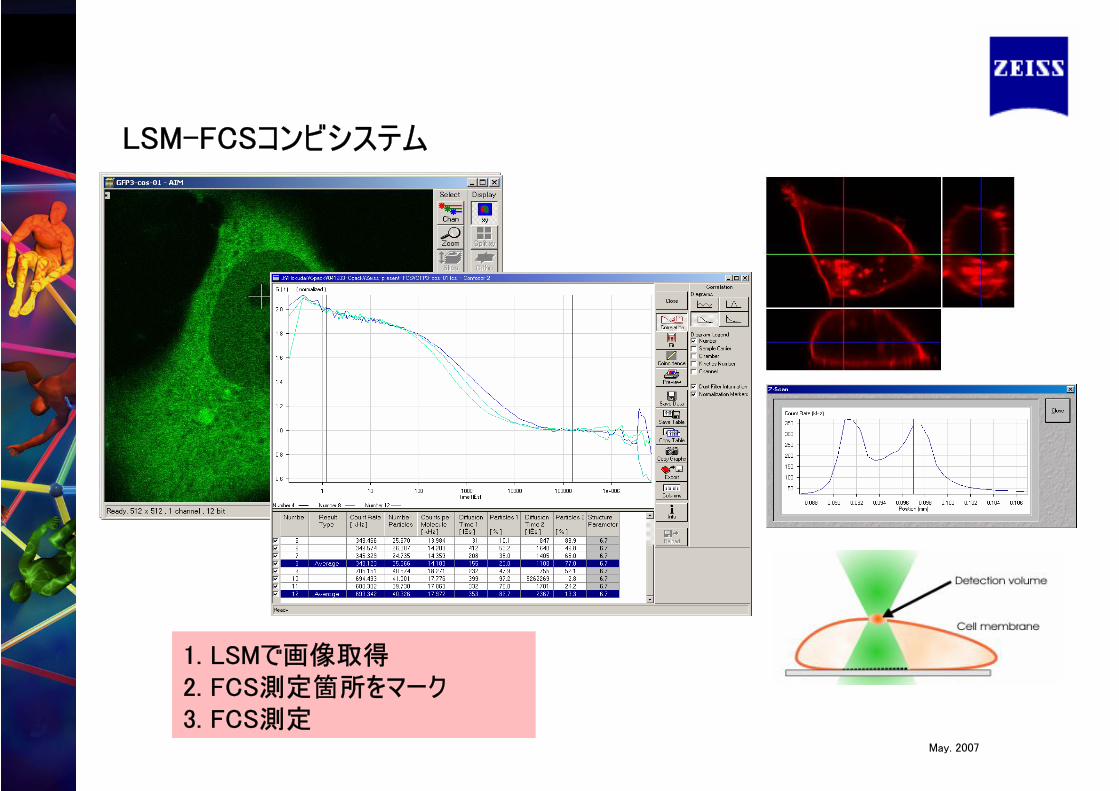
LSM-FCSコンビシステム
1. LSMで画像取得2. FCS測定箇所をマーク3. FCS測定
May. 2007
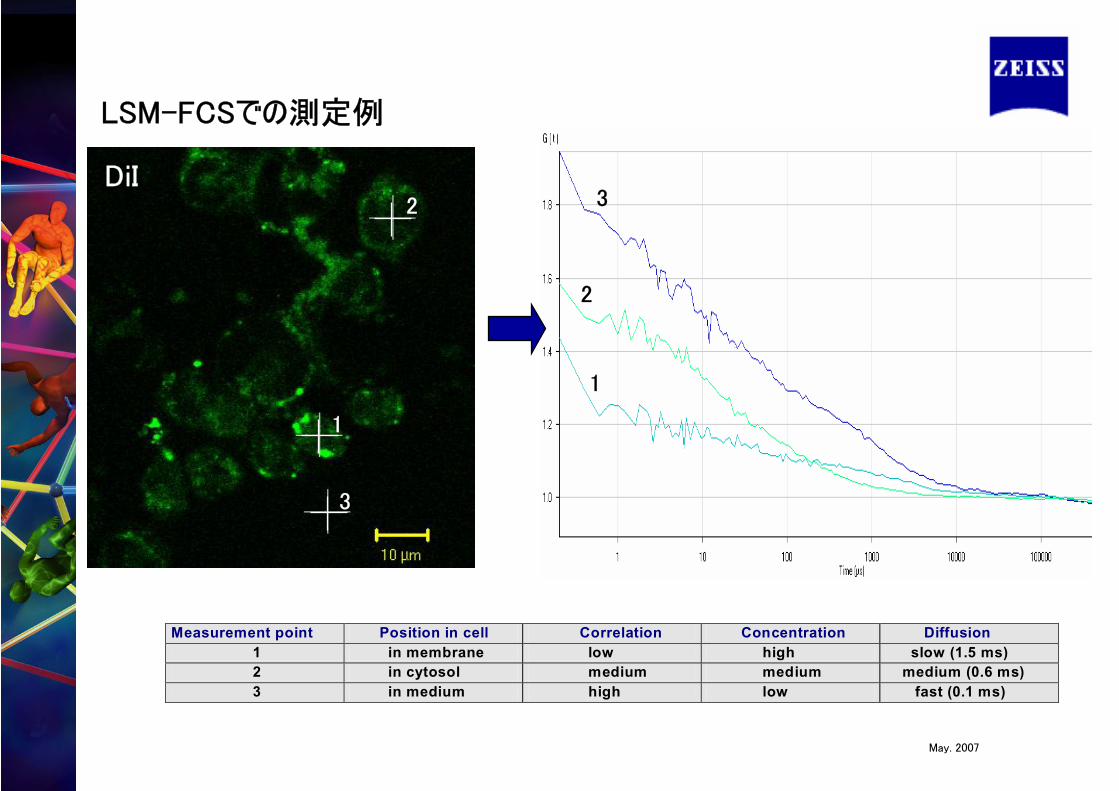
Measurement point Position in cell Correlation Concentration Diffusion 1 in membrane low high slow (1.5 ms) 2 in cytosol medium medium medium (0.6 ms) 3 in medium high low fast (0.1 ms)
1
2
3
DiI
LSM-FCSでの測定例
1
2
3

May. 2007
1-3
4
5
5 mm
measurementpoint
position within the cell correlation protein concentration
1, 2, 3 in the nucleoplasm low high
4 in the nucleolus high low
5 in the cytoplasm none no protein
1
4
5
2
3
Rahn, Sporbert, Cardoso & LeonhardtFranz-Vollhard KlinikBerlin, Germany
GFP-tagged nuclear protein
Exploring distribution and dynamic changes in mobility
May. 2007
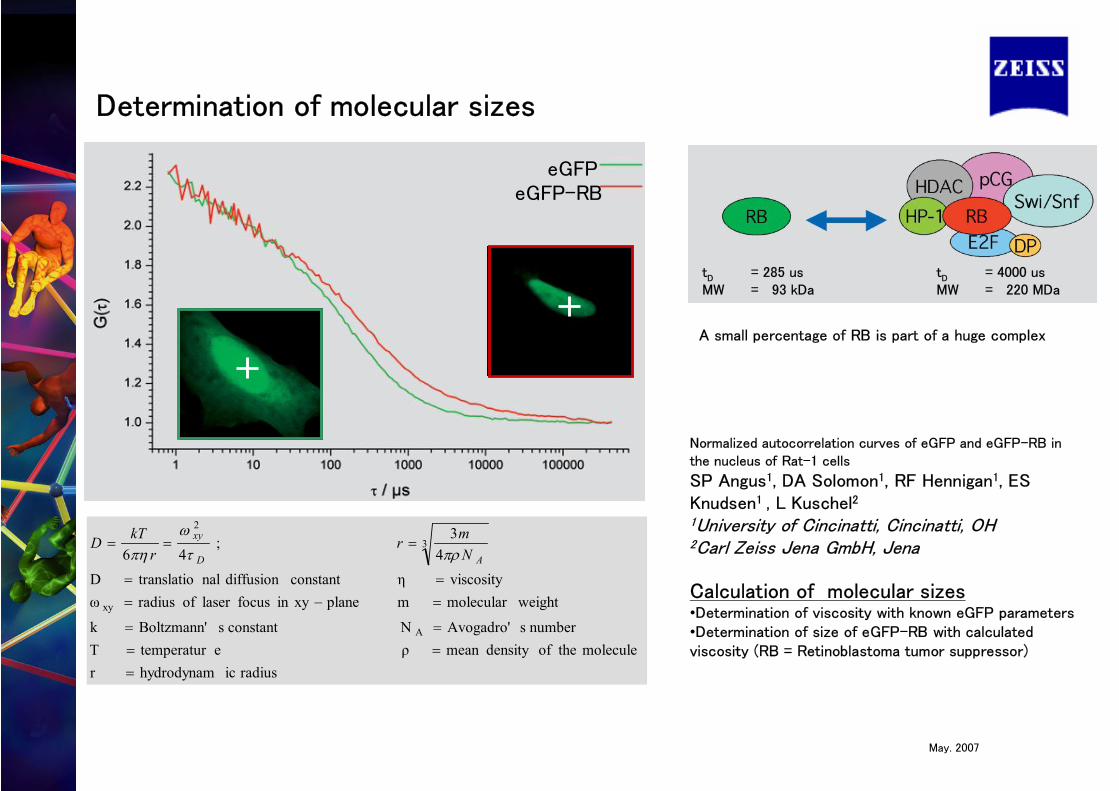
Determination of molecular sizes
eGFP-RBeGFP
Calculation of molecular sizes•Determination of viscosity with known eGFP parameters•Determination of size of eGFP-RB with calculated viscosity (RB = Retinoblastoma tumor suppressor)
radiusichydrodynamrmoleculetheofdensitymeanρetemperaturT
numbersAvogadro'NconstantsBoltzmann'k
weightmolecularmplanexyinfocuslaser ofradiusωviscosityηconstantdiffusionnaltranslatioD
43;
46
A
xy
3
2
=====
=-===
===AD
xy
Nmr
rkTD
prt
w
ph
Normalized autocorrelation curves of eGFP and eGFP-RB in the nucleus of Rat-1 cells
SP Angus1, DA Solomon1, RF Hennigan1, ES Knudsen1 , L Kuschel21University of Cincinatti, Cincinatti, OH2Carl Zeiss Jena GmbH, Jena
A small percentage of RB is part of a huge complex
tD = 285 usMW = 93 kDa
tD = 4000 usMW = 220 MDa
May. 2007
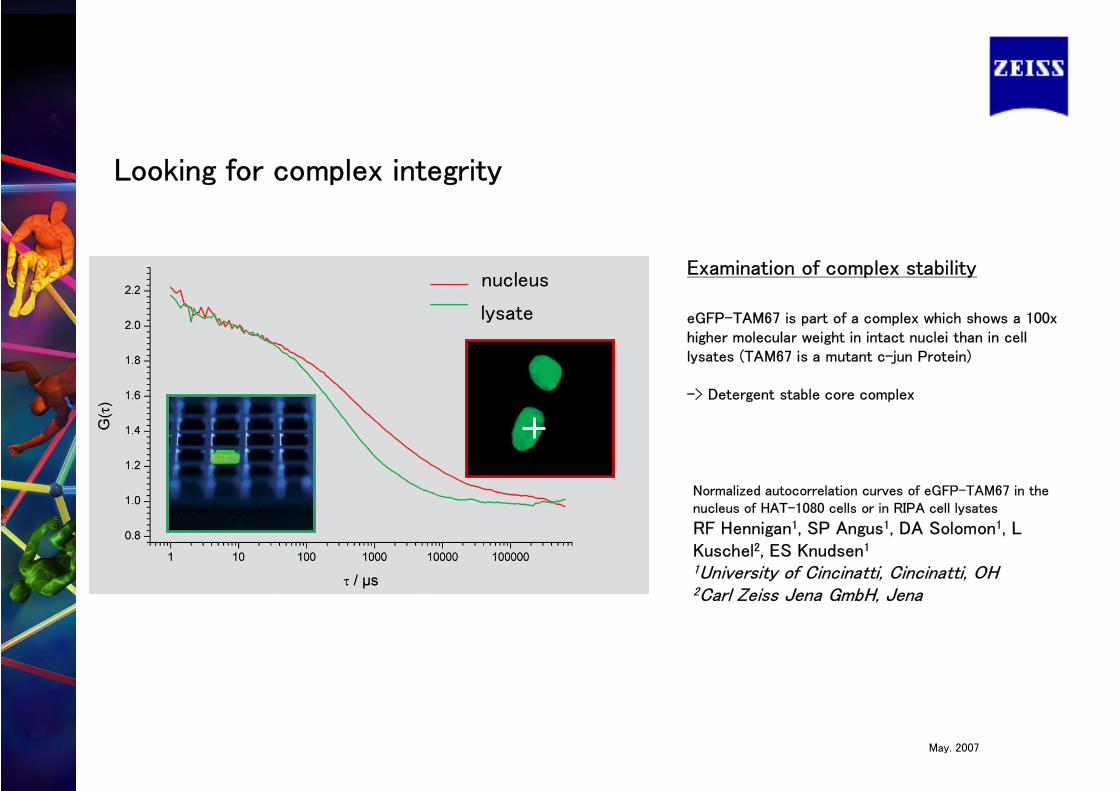
Looking for complex integrity
Normalized autocorrelation curves of eGFP-TAM67 in the nucleus of HAT-1080 cells or in RIPA cell lysates
RF Hennigan1, SP Angus1, DA Solomon1, L Kuschel2, ES Knudsen1
1University of Cincinatti, Cincinatti, OH2Carl Zeiss Jena GmbH, Jena
nucleus
lysate
Examination of complex stability
eGFP-TAM67 is part of a complex which shows a 100x higher molecular weight in intact nuclei than in cell lysates (TAM67 is a mutant c-jun Protein)
-> Detergent stable core complex
May. 2007
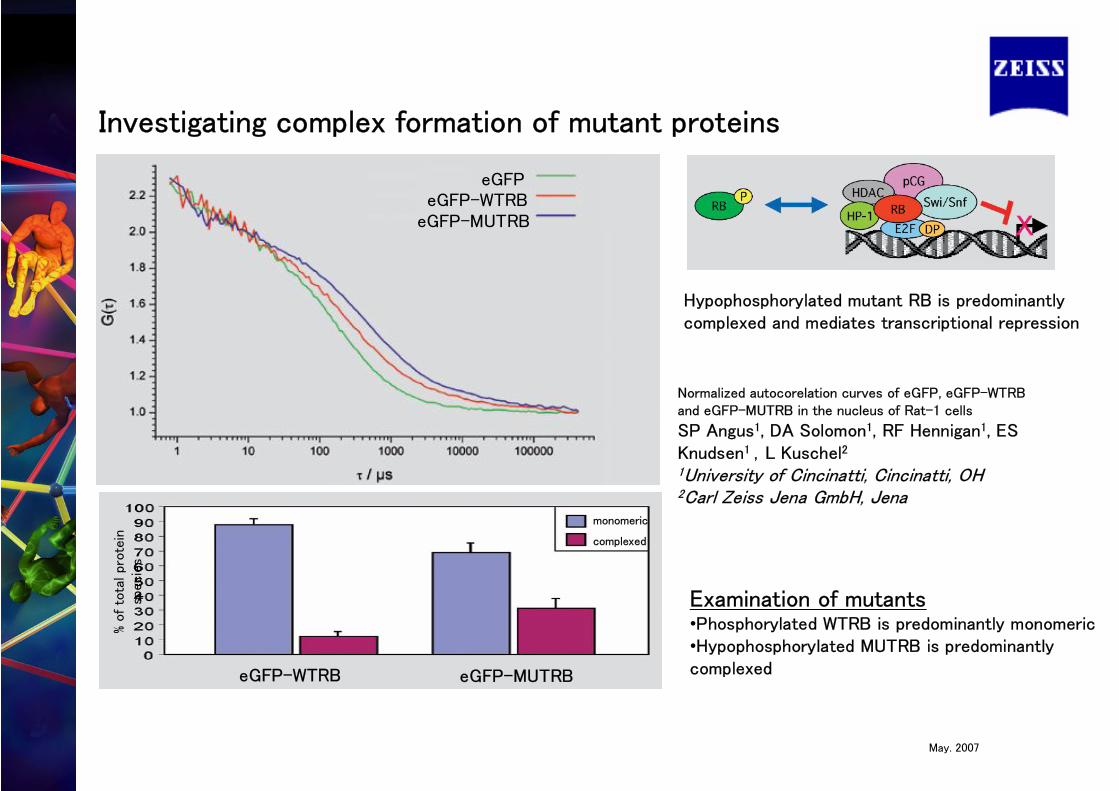
Investigating complex formation of mutant proteins
Normalized autocorelation curves of eGFP, eGFP-WTRB and eGFP-MUTRB in the nucleus of Rat-1 cells
SP Angus1, DA Solomon1, RF Hennigan1, ES Knudsen1 , L Kuschel21University of Cincinatti, Cincinatti, OH2Carl Zeiss Jena GmbH, Jena
eGFPeGFP-WTRB
eGFP-MUTRB
eGFP-WTRB eGFP-MUTRB
monomeric
complexed
Hypophosphorylated mutant RB is predominantly complexed and mediates transcriptional repression
Examination of mutants•Phosphorylated WTRB is predominantly monomeric•Hypophosphorylated MUTRB is predominantly complexed
% o
f to
tal pro
tein
sp
ecie
s
May. 2007
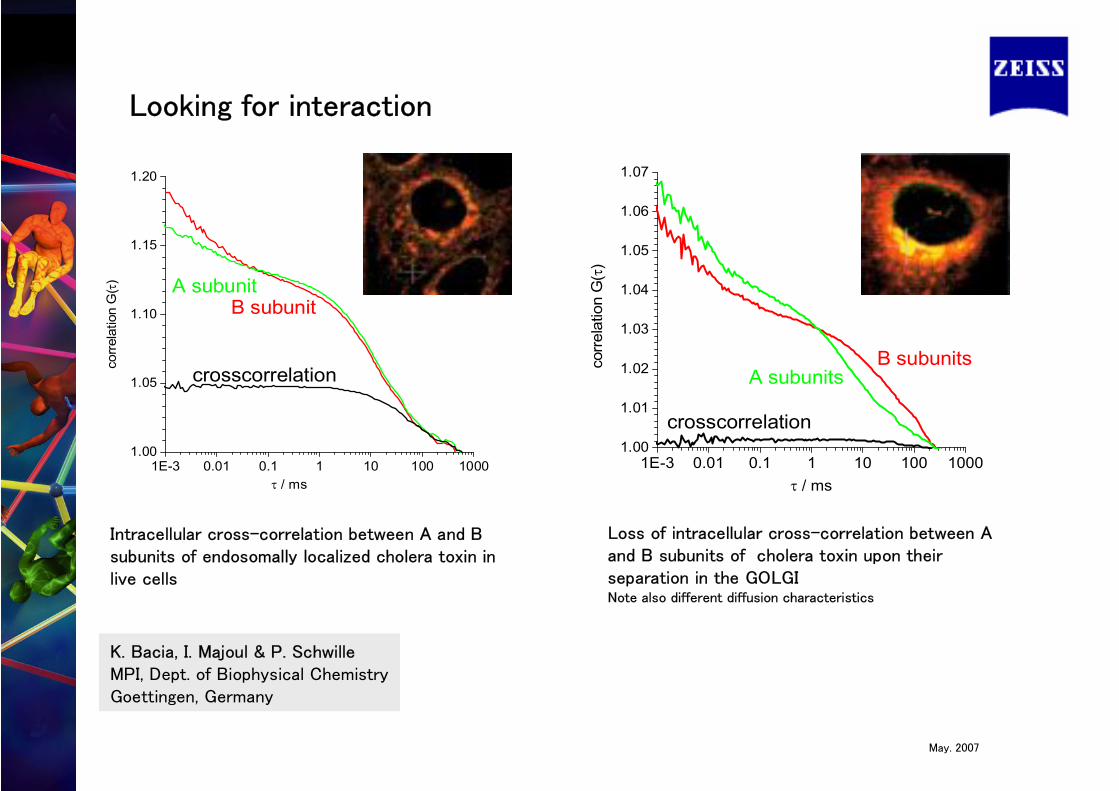
Looking for interaction
1E-3 0.01 0.1 1 10 100 10001.00
1.05
1.10
1.15
1.20
A subunit
crosscorrelation
B subunit
corre
latio
n G
(t)
t / ms
Intracellular cross-correlation between A and B subunits of endosomally localized cholera toxin in live cells
1E-3 0.01 0.1 1 10 100 10001.00
1.01
1.02
1.03
1.04
1.05
1.06
1.07
crosscorrelation
A subunitsB subunitsco
rrel
atio
n G
(t)
t / ms
Loss of intracellular cross-correlation between A and B subunits of cholera toxin upon their separation in the GOLGINote also different diffusion characteristics
K. Bacia, I. Majoul & P. SchwilleMPI, Dept. of Biophysical ChemistryGoettingen, Germany
May. 2007
May. 2007
May. 2007
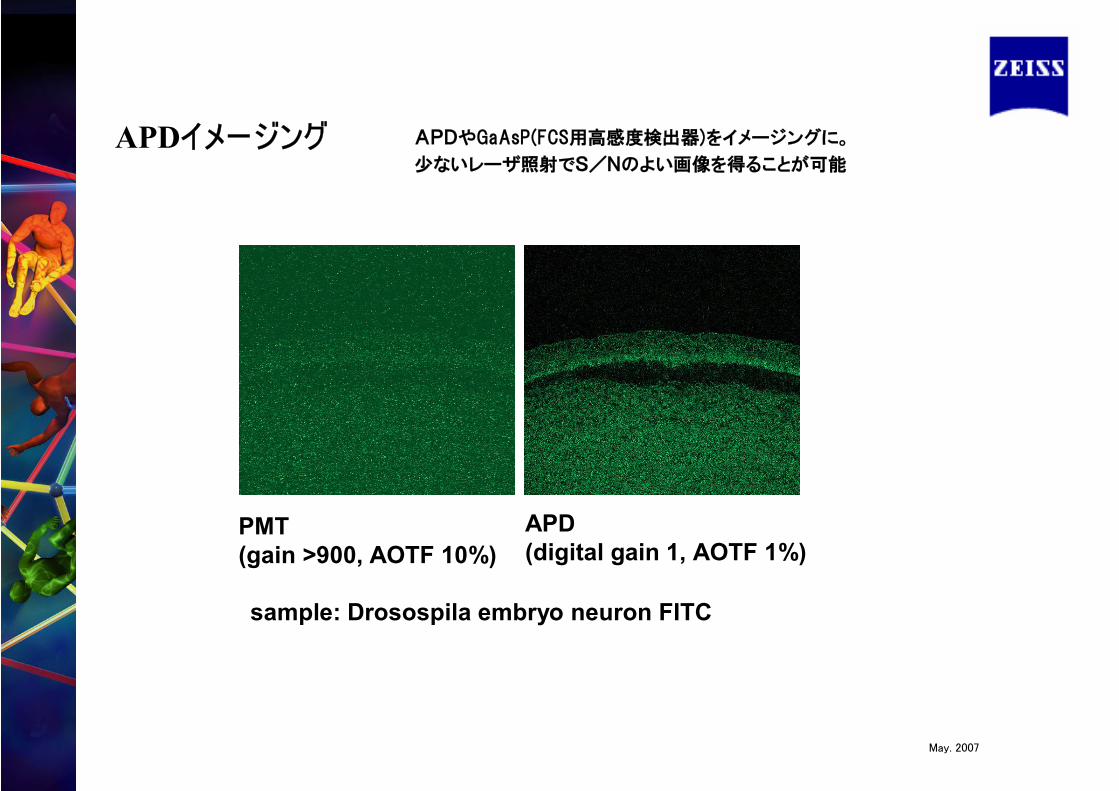
APDやGaAsP(FCS用高感度検出器)をイメージングに。
少ないレーザ照射でS/Nのよい画像を得ることが可能
FCCSの他にも・・・
PMT(gain >900, AOTF 10%)
APD(digital gain 1, AOTF 0.1%)
sample: yeast cells expressing GFP fusion, Wiegraebe, Stowers Institute Kansas City
APDイメージング
PMT(gain >900, AOTF 10%)
APD(digital gain 1, AOTF 1%)
sample: Drosospila embryo neuron FITC
May. 2007