Embed Size (px)
Citation preview

LSU AgCenter
Audubon Sugar Institute
Factory Operations Seminar
Syngenta Pavilion
Highway 75
St. Gabriel, LA
April 11, 2013
1
TABLE OF CONTENTS
Page
Large Scale Ripener Evaluation
A.Orgeron, B. Legendre, J. Griffin, K. Gravois, M. Hebert, J. Flanagan, B. Hebert……..2
Removal of Suspended Solids from Filtrate
S. Grimaldo, V. Kochergin………………………………………………….......................6
Preliminary Investigation of Filter Station Operations
H. Birkett, J. Stein………………………………………………………………………..14
Starch Analysis of Cane Juice and Raw Sugar
G. Aita……………………………………………………………………………………20
Improvements of Raw Sugar Quality with Double Purge of C-Massecuite
S. Polanco, V. Kochergin, S. Savoie, G. Carline……………….……….……………….25
The 2012 Molasses Survey
C. Verret, D. Dorman, S. Lu …………………………………………………………….31
Biofuel Update
D. Day…………………………………………...………………………….……………38

2
LARGE SCALE RIPENER EVALUATION
A. Orgeron1, B. Legendre
2, J. Griffin
3, K. Gravois
4, M. Hebert
4, J. Flanagan
4, and B. Hebert
4
1St. James Parish LCES,
2Audubon Sugar Institute,
3School of Plant, Environmental and Soil Sciences,
4LCES
INTRODUCTION
At the onset of the sugarcane harvest season in mid-September in Louisiana, sugarcane maturity
in terms of sucrose accumulation is at its lowest and increases as the season progresses through
natural ripening. Application of ripening agents target biochemical processes within the
sugarcane plant, resulting in a redistribution of fixed carbon and a shifting of resources into
sucrose storage. Use of chemical ripening agents to improve early season sucrose concentration
is of critical importance to Louisiana sugarcane processors through improve efficiency and
increased daily mill capacity.
Glyphosate has been used as a ripener in Louisiana since 1980 and has become a valuable
component of sugarcane production systems. In recent years, however, sugarcane producers have
become increasingly concerned with the possible deleterious effects of glyphosate ripener on
subsequent ratoon crops; mainly, retardation of regrowth, leaf chlorosis, and reduced shoot
population. Furthermore, there is interest in evaluating alternatives to glyphosate for use in
sugarcane production programs.
In 2012, the United States Environmental Protection Agency (EPA) granted registration of
trinexapac-ethyl (Palisade 2EC®) as a sugarcane ripener. The label states that sugarcane should
be harvested 28 to 60 days after trinexapac-ethyl application. For glyphosate sugarcane should be
harvested 21 to 49 days after application. Trinexapac-ethyl has been an effective ripener in
Brazil and Australia. Unlike glyphosate, trinexapac-ethyl is classified as a plant growth regulator
targeting gibberellin biosynthesis.
STUDY
A large scale field experiment was treated with glyphosate at 0.187 lb/A (210 g ae/ha) and
Palisade at 0.312 lb/A (350 g ai/ha) and compared to the untreated control and harvest at 28 and
56 days after treatment, respectively, in 2012 (Table 1). Treatments were applied aerially to
second stubble HoCP 96-540. Ripener treatments were applied at 3 gallons of spray mixture per
acre. At each location, ripener treatments were applied once, and are considered a single
replicate. The three locations were Blackberry Farms, Vacherie, LA, Hebert Brothers Farm,
Thibodaux, LA, and Ronald Hebert Farms, Jeanerette, LA. Palisade treatment was applied at
approximately 56 days before harvest while glyphosate treatment was applied at approximately
3
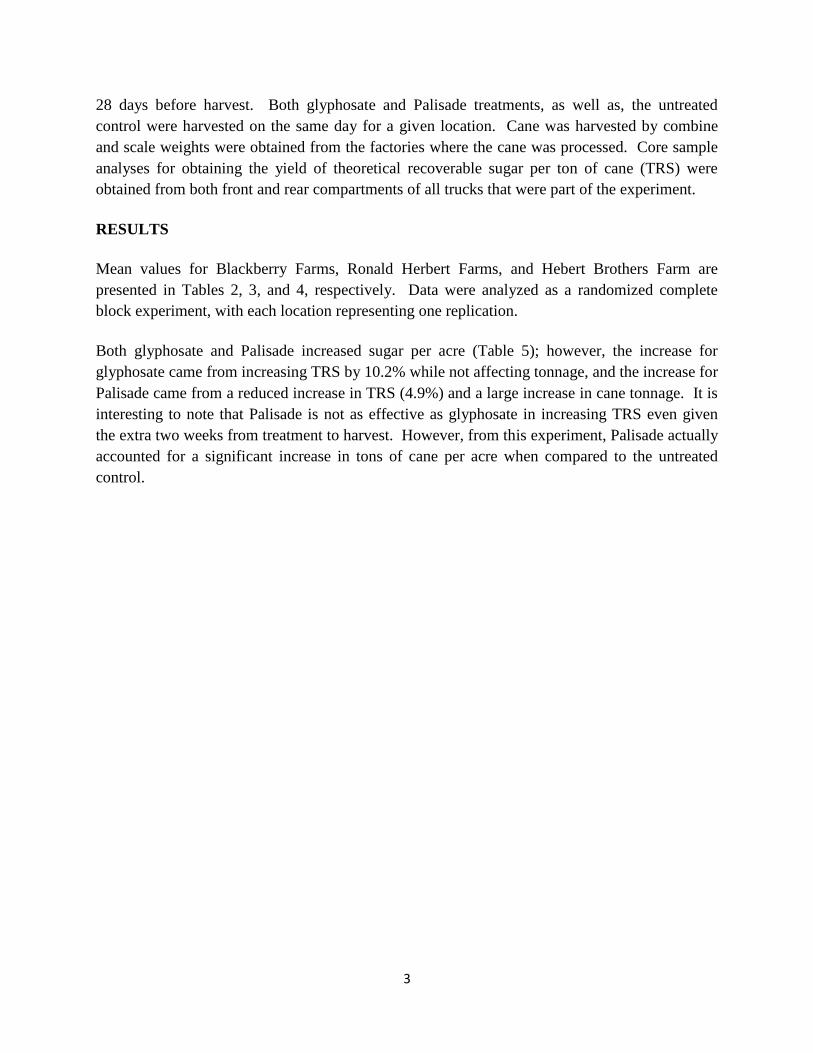
28 days before harvest. Both glyphosate and Palisade treatments, as well as, the untreated
control were harvested on the same day for a given location. Cane was harvested by combine
and scale weights were obtained from the factories where the cane was processed. Core sample
analyses for obtaining the yield of theoretical recoverable sugar per ton of cane (TRS) were
obtained from both front and rear compartments of all trucks that were part of the experiment.
RESULTS
Mean values for Blackberry Farms, Ronald Herbert Farms, and Hebert Brothers Farm are
presented in Tables 2, 3, and 4, respectively. Data were analyzed as a randomized complete
block experiment, with each location representing one replication.
Both glyphosate and Palisade increased sugar per acre (Table 5); however, the increase for
glyphosate came from increasing TRS by 10.2% while not affecting tonnage, and the increase for
Palisade came from a reduced increase in TRS (4.9%) and a large increase in cane tonnage. It is
interesting to note that Palisade is not as effective as glyphosate in increasing TRS even given
the extra two weeks from treatment to harvest. However, from this experiment, Palisade actually
accounted for a significant increase in tons of cane per acre when compared to the untreated
control.

4
Table 1. Large scale field experiment comparing efficacy of glyphosate and Palisade to
untreated control at Blackberry Farms (Vacherie), Ronald Hebert Farms (Jeanerette) and Hebert
Brothers Farm (Thibodaux).
Farm Treatment App. Date Harvest Date Harvest Int.
Blackberry Glyphosate 9/11/2012 10/8/2012 27
Blackberry Palisade 8/13/2012 10/8/2012 56
Blackberry Control 10/8/2012
Ronald Hebert Glyphosate 9/13/2012 10/11/2012 28
Ronald Hebert Palisade 8/11/2012 10/11/2012 61
Ronald Hebert Control
10/11/2012
Hebert Brothers Glyphosate 9/14/2012 10/15/2012 31
Hebert Brothers Palisade 8/17/2012 10/15/2012 59
Hebert Brothers Control 10/15/2012
Table 2. Results from Blackberry Farms at Vacherie.
Treatment Acres Harvested Mean TRS (lbs) Mean Tons/A (tons) Sugar/A (lbs)
Glyphosate 1.68 200 46.6 9311
Palisade 1.47 186 52.1 9703
Control 1.60 180 49.5 8934

5
Table 3. Results from Ronald Hebert Farms at Jeanerette.
Treatment Acres Harvested Mean TRS (lbs) Mean Tons/A (tons) Sugar/A (lbs)
Glyphosate 2.77 210 35.2 7404
Palisade 2.52 203 39.1 7922
Control 2.91 190 32.8 6229
Table 4. Results from Hebert Brothers Farm at Thibodaux.
Treatment Acres Harvested Mean TRS (lbs) Mean Tons/A (tons) Sugar/A (lbs)
Glyphosate 2.23 193 45.4 8777
Palisade 1.96 184 52.4 9628
Control 2.20 177 44.7 7917
Table 5. Combined analyses for three locations
Treatment TRS (lbs) Increase (%) Tons/A (tons) Sugar/A (lbs)
Glyphosate 201 a 10.4 42.4 b 8497 a
Palisade 190 b 4.4 47.9 a 9084 a
Control 182 c -- 42.4 b 7693 b
F-Value 0.0014 0.0251 0.0107

6
REMOVAL OF SUSPENDED SOLIDS FROM FILTRATE
S. Grimaldo and V. Kochergin
INTRODUCTION
In the sugar cane process the filtrate juice is continuously recirculated back to the clarification
process. This stream accounts for almost 15-20% of the mixed juice. The recirculation of this
stream brings several disadvantages to the process including recirculation of sugar as well as
non-sugars, inversion of sucrose, microbial activity, and color generation. If this stream is treated
independently through clarification and the quality of the juice is sufficient to be mixed with the
clarified juice that is forwarded to the evaporators, the performance of the process can be
improved by eliminating this recirculation and increasing the clarification capacity by almost
20% (Bento & Cuddihy, 2006; Prasad & Kafukp, 2005). However, this operation has been
attempted several times with low success due to the high residence times of the clarifiers and
complex processes. Therefore, the aim of this research is to overcome these limitations through
the development of a simple clarification process that involves the design of a Very Short
Residence Time Clarifier (VSRT) utilizing Turbulence Reduction Devices (TRD’S).
PROJECT GOALS
Design a scalable pilot plant for filtrate clarification using turbulence reduction devices.
Construct and tune-up the filtrate clarification pilot plant in a sugar mill.
Operate and test the filtrate clarification pilot plant during the grinding season.
Evaluate the performance of the pilot plant using standard analytical procedures.
MATERIALS AND METHODS
Process Design
A filtrate clarification pilot plant was designed to handle a maximum flow rate of 100 gallons per
minute. The designed process is shown in Figure 1 and was constructed at Alma Plantation Mill.
The process consists of heating the filtrate in a heat exchanger (E-101) up to 104°C (220°F).
After this operation, lime saccharate (V-101) is added to the juice (hot liming) in order to start
the flocculation process. Then the filtrate juice, which is slightly above its boiling point, is
degassed in a flash tank (FH-101) to remove all the air entrained in this stream in order to
enhance the clarification operation. When all the air has been removed, a flocculant in a dose
between 4 ppm- 6 ppm is added to the juice to form the flocs. The flocculant is stored in a 30
gallon vessel (V-102) and is dosed using a metering pump (P-102). Finally, the juice is directed
to the VSRT (C-101) where two phases will be obtained: The clarified filtrate as the overflow
and the mud phase as the underflow. Finally, the two streams, clarified filtrate and the muds, is
mixed again and returned back to the process.

7
Figure 1. Filtrate Clarification Pilot Plant
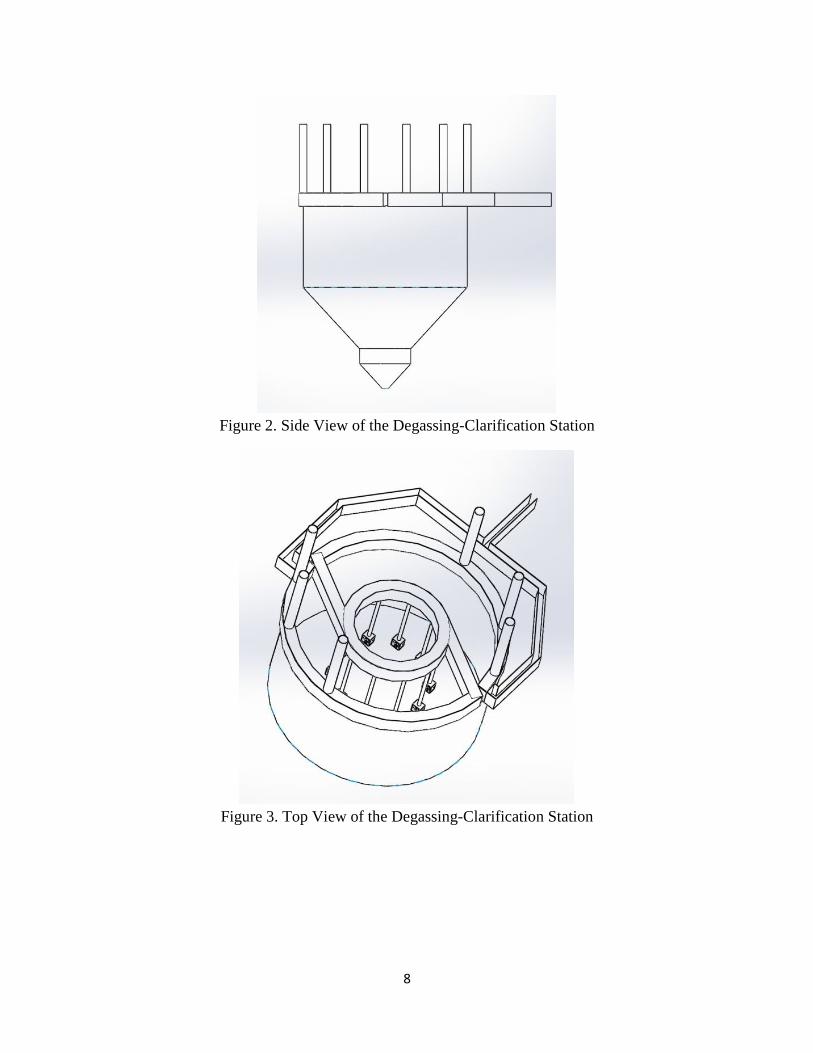
New Flash-Clarifier Design
Flashing is a very important step to achieve a good clarification. However, this operation is often
overlooked and can bring consequences including re-entrainment of air and excessive presence
of bagacillo in the clear juice not properly flashed. In order to minimize these effects a new
invention has been devised that incorporates the flash and clarification operations into an
integrated unit. The invention consists of a degassing trough around the clarifier and it will be
positioned at the same level of a feed launder in the center of the clarifier. This condition will
keep a level inside similar to a “Type B” flash tank (Rein, 2007). However, the main advantage
of this degassing system is that the trough surrounding the clarifier will provide more area with
less foot print guaranteeing a proper degasification of the liquid without re-entraining the air.
The elimination of the incondensable gases will be done through vents surrounding the degassing
trough. After the juice has been flashed it will be clarified using a Louisiana Low Turbulence
Clarifier (LLT). A top and side view of the invention is shown in Figures 2 and 3. The whole
unit has been filed for a Provisional Patent Application and the device was successfully tested at
Andhra Sugars Ltd. in India.
8
Figure 2. Side View of the Degassing-Clarification Station
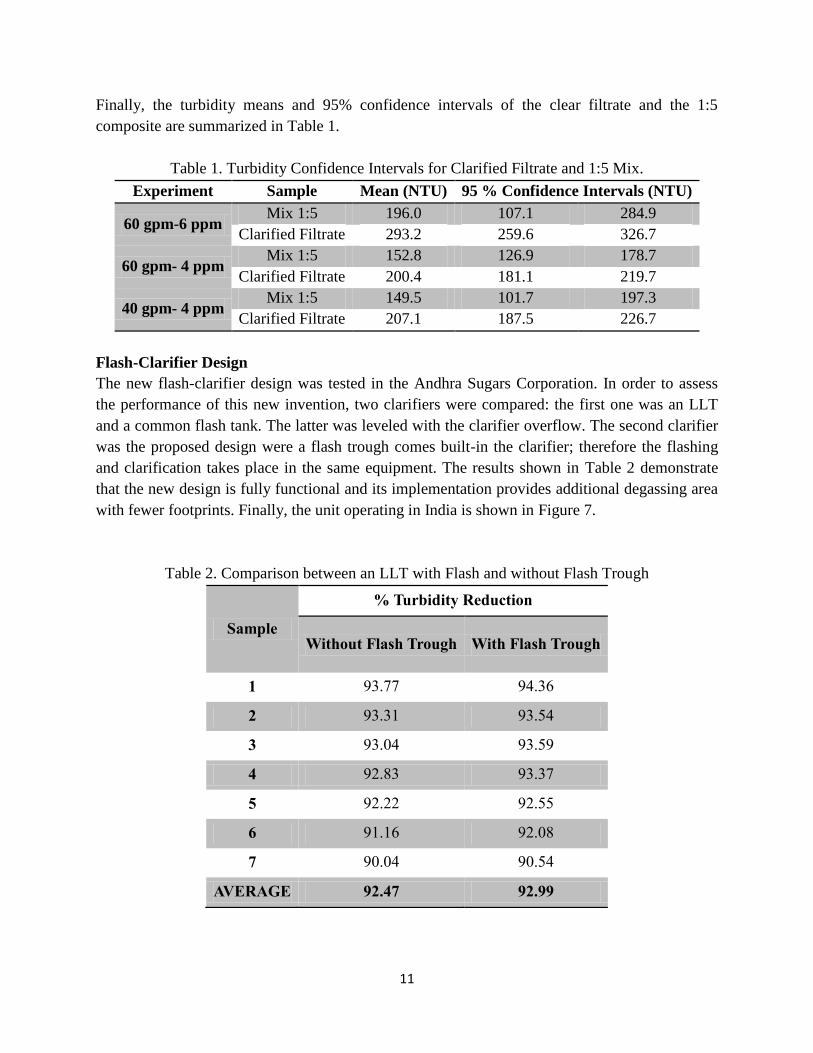
Figure 3. Top View of the Degassing-Clarification Station

9
Sampling and Data Analysis
The filtrate clarification pilot plant was tested during the 2012 harvesting season at Alma
Plantation mill. Even though the pilot’s designed capacity was 100 gpm, flow supply restrictions
limited the flow to 60 gpm; which is equivalent to 8 minutes residence time of clear juice. In
order to assess the performance of the filtrate clarifier, three different conditions were tested:
Filtrate flow of 60 gpm with a 6 ppm dose of flocculant
Filtrate flow of 60 gpm with a 4 ppm dose of flocculant
Filtrate flow of 40 gpm with a 4 ppm dose of flocculant
RESULTS AND DISCUSSION
Suspended Solids
The suspended solids were analyzed in Audubon Sugar Institute from samples of raw and
clarified filtrate collected during the trials. In Figure 4 it can be observed that the concentration
of suspended solids for the filtrate varied between 6349 to 8510 ppm and after clarification the
suspended solids concentration decreased significantly to values that ranged from 469 to 1038
ppm. It is worth to mention that the concentration of suspended solids of the clarified filtrate still
slightly high but within the range compared to values (133 ppm to 1064 ppm) of suspended solid
in clear juice reported in the South African sugar industry (Jullienne, Matic, & Teokarovic,
1970). Finally, the percent removal of suspended solid is shown in Figure 5 where it ranged
between 84 to 95%.
Figure 4. Concentration of Suspended Solids in Filtrate and Clarified Filtrate.
8,510
6,985 6,349
469 1,038 948
0
2000
4000
6000
8000
10000
60 gpm-6ppm 60 gpm-4ppm 40 gpm-4 ppm
SS C
on
cen
trat
ion
(p
pm
)
Raw Filtrate (ppm) Clarified Filtrate (ppm)

10
Figure 5. Percent Removal of Suspended Solid in the Clarifier.
Turbidity
In order to assess the performance of the clarifier, turbidity was measured and recorded for
different samples: clarified filtrate, the clear juice, a composite obtained from mixing the clear
juice and the clarified filtrate in a proportion of 1:5 (Proportion of clarified filtrate to mixed
juice) and the turbidity from jar tests that were done at the same time as the pilot plant was being
operated. These turbidities are shown in Figure 6 for each experiment. It can be inferred from the
figure and also from the application of statistical analysis that there are still significant
differences (P-value <0.05) between the clear juice from the main clarifiers and the clarified
filtrate. However, the differences between the turbidity of the mix and the clear juice are not
significant (P-value >0.05) suggesting that these two stream can be mixed.
Figure 6. Turbidity Profile of Different Samples.
95.3
85.7 84.0
7880828486889092949698
60 gpm-6ppm 60 gpm-4ppm 40 gpm-4 ppm
SS
Re
mo
val (
%)
% Removal
50
100
150
200
250
300
350
400
Tu
rbid
ity
(N
TU
)
60 gpm-
6ppm
Clear Filtrate
Jar Test
Mix 1:5
Clear Juice
60 gpm-
4ppm 40gpm-
4 ppm
11
Finally, the turbidity means and 95% confidence intervals of the clear filtrate and the 1:5
composite are summarized in Table 1.
Table 1. Turbidity Confidence Intervals for Clarified Filtrate and 1:5 Mix.
Experiment Sample Mean (NTU) 95 % Confidence Intervals (NTU)
60 gpm-6 ppm Mix 1:5 196.0 107.1 284.9
Clarified Filtrate 293.2 259.6 326.7
60 gpm- 4 ppm Mix 1:5 152.8 126.9 178.7
Clarified Filtrate 200.4 181.1 219.7
40 gpm- 4 ppm Mix 1:5 149.5 101.7 197.3
Clarified Filtrate 207.1 187.5 226.7
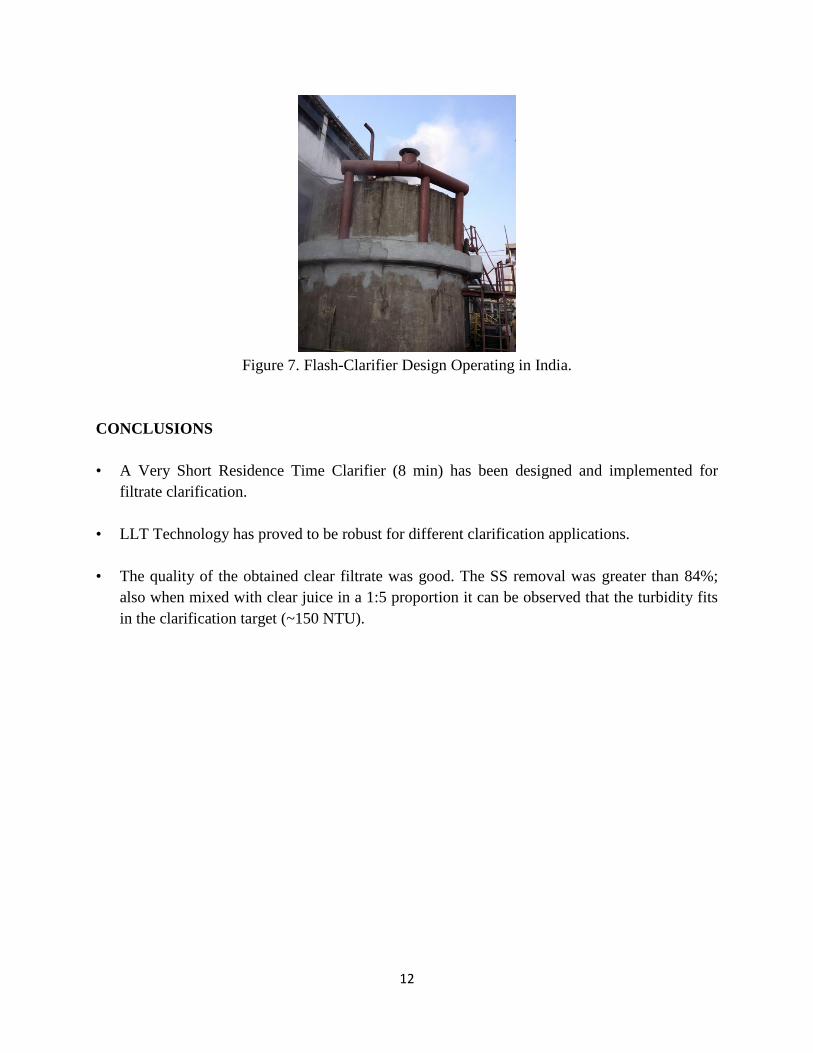
Flash-Clarifier Design
The new flash-clarifier design was tested in the Andhra Sugars Corporation. In order to assess
the performance of this new invention, two clarifiers were compared: the first one was an LLT
and a common flash tank. The latter was leveled with the clarifier overflow. The second clarifier
was the proposed design were a flash trough comes built-in the clarifier; therefore the flashing
and clarification takes place in the same equipment. The results shown in Table 2 demonstrate
that the new design is fully functional and its implementation provides additional degassing area
with fewer footprints. Finally, the unit operating in India is shown in Figure 7.
Table 2. Comparison between an LLT with Flash and without Flash Trough
Sample
% Turbidity Reduction
Without Flash Trough With Flash Trough
1 93.77 94.36
2 93.31 93.54
3 93.04 93.59
4 92.83 93.37
5 92.22 92.55
6 91.16 92.08
7 90.04 90.54
AVERAGE 92.47 92.99
12
Figure 7. Flash-Clarifier Design Operating in India.
CONCLUSIONS
• A Very Short Residence Time Clarifier (8 min) has been designed and implemented for
filtrate clarification.
• LLT Technology has proved to be robust for different clarification applications.
• The quality of the obtained clear filtrate was good. The SS removal was greater than 84%;
also when mixed with clear juice in a 1:5 proportion it can be observed that the turbidity fits
in the clarification target (~150 NTU).

13
ACKNOLEDGEMENTS
• American Sugar Cane League for providing partial funding for the project.
• David Stewart, Mario Acevedo, Josemanuel Henriquez, Nelson Dieguez, Alvaro Oquendo,
Rogelio Piñeiro, Belisario Montes, Rosenelly Corrales, Rubén Vasquez the personnel from
Alma Plantation Ltd for all their support.
• George M. Schaffer and CROMPION International for all their support and partial funding
for the project.
• Lamar Aillet, Ana Lucia Amaya, Iryna Tishechkina, Chardcie Verret, Julie King, Stuart
Goudeau and Audubon Sugar Institute personnel.
• Chip Nadler and D.B Doran for their help and assistance in constructing the flash tank and
the clarifier.
• Mullapudi Narendranath and his staff at the Andhra Sugars Corporation.
• Jim Cuddihy, Ricardo Rengifo and Carlos Benhar for their assistance in troubleshooting and
help testing different flocculants.
BIBLIOGRAPHY
Bento, L., & Cuddihy, J. (2006). Filtrate Clarification. American Society of Sugar Cane
Technologists.
Jullienne, L. M. S. A., Matic, M., & Teokarovic, M. (1970). The Mutual Clarification Project
Progress Report No. 2. Proc S Afr Sug Technol Ass, (June), 71–80.
Prasad, V., & Kafukp, D. (2005). Performance of Trayless Filtrate Clarifier at Kakira Sugar
Works (1985) LTD, Uganda. Proc. ISSCT, 25, 161–163.
Rein, P. (2007). Cane Sugar Engineering. (1st ed.). Berlin: Bartens.

14
PRELIMINARY INVESTIGATION OF FILTER STATION OPERATIONS
H. Birkett and J. Stein
INTRODUCTION
The two important issues regarding filter cake in the production of raw sugar are that of pol
losses and capacity (handling large quantities of filter cake or mud). The recent introduction of
belt filters to the sugar industry is of interest to all Louisiana raw sugar mills. The objectives of
the project are to review filter operations in general and compare belt filters with that of the
traditional rotary drum filters.
METHOD
In an effort to compare belt filters with rotary drum filters several areas of interest were
investigated. These included pol losses, bagacillo ratio (bagacillo % feed/mud solids % feed),
filter retention (mud in filter cake/mud in feed), filter capacity (filter cake production and
removal of mud), belt wash water loss and flocculant usage.
Samples of the following were collected at several Louisiana factories: clarifier underflow, feed
to filters, filtrate, filter cake and belt wash water. The underflow and filter feed were analyzed for
Brix, pol, moisture and bagacillo content. Mud filtrate samples were analyzed for Brix, pol and
sediment. Filter cake was analyzed for pol, moisture and bagacillo.
Brix and pol determinations were based on standard sugar laboratory methods (Chen & Chou
1993). Moisture was measured by drying a known amount of sample at 105°C for 24 hours or
until constant weight. Sediment was determined using the standard core lab method for juice
(Birkett 1998). Bagacillo content was determined by washing a known quantity of sample with
water through a 200-mesh screen until washings appeared clear. Large quantities of water were
used, however, dirt was still retained by the bagacillo. This led to necessary ash determinations
(Birkett & Stein 2004). Actual bagacillo % sample was determined after taking into account the
remaining ash in the washed sample.

15
RESULTS AND DISCUSSION
Figure 1. Pol % filter cake for drum and belt filters.
Figure 1 shows the pol % filter cake average of 3.75. Pol % filter cake from drum filters ranged
from 2.14 to 7.36 and averaged 4.07% pol. Belt filters had an average pol % filter cake of 3.06
with a range of 1.60 to 5.86%.
Figure 2. Filter retention for drum and belt filters.
The retention of all filters tested averaged 87.88% as shown in Figure 2. Retention varied from
38.89 to 98.38%. Retention rates above 90% are desirable.
0
1
2
3
4
5
6
7
8
1 2 3 4 5 6 7 8 9 10 11 12 13 14 15 16
PO
L %
FIL
TE
R C
AK
E
SAMPLE
DRUMS BELTS
4.07
3.06
0
10
20
30
40
50
60
70
80
90
100
1 2 3 4 5 6 7 8 9 10 11 12 13 14 15
FIL
TE
R R
ET
EN
TIO
N,
%
SAMPLE
DRUMS BELTS
83.36 90.13
16
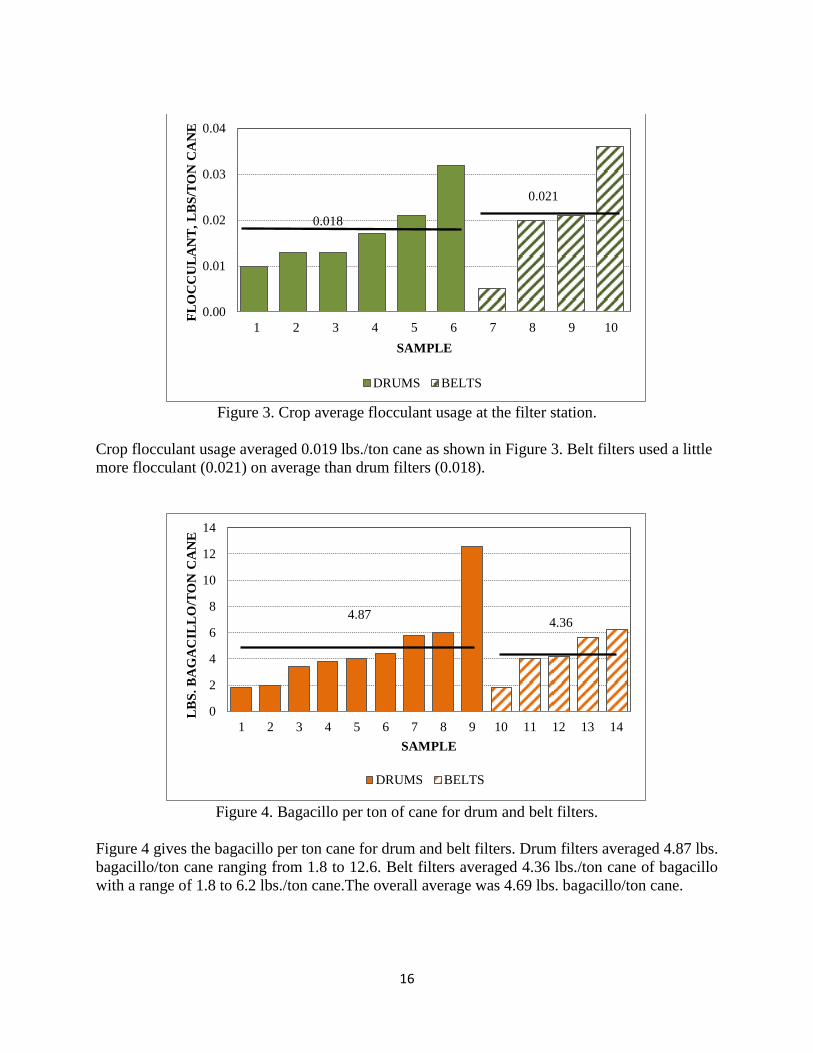
Figure 3. Crop average flocculant usage at the filter station.
Crop flocculant usage averaged 0.019 lbs./ton cane as shown in Figure 3. Belt filters used a little
more flocculant (0.021) on average than drum filters (0.018).
Figure 4. Bagacillo per ton of cane for drum and belt filters.
Figure 4 gives the bagacillo per ton cane for drum and belt filters. Drum filters averaged 4.87 lbs.
bagacillo/ton cane ranging from 1.8 to 12.6. Belt filters averaged 4.36 lbs./ton cane of bagacillo
with a range of 1.8 to 6.2 lbs./ton cane.The overall average was 4.69 lbs. bagacillo/ton cane.
0.00
0.01
0.02
0.03
0.04
1 2 3 4 5 6 7 8 9 10
FL
OC
CU
LA
NT
, L
BS
/TO
N C
AN
E
SAMPLE
DRUMS BELTS
0.018
0.021
0
2
4
6
8
10
12
14
1 2 3 4 5 6 7 8 9 10 11 12 13 14
LB
S.
BA
GA
CIL
LO
/TO
N C
AN
E
SAMPLE
DRUMS BELTS
4.36 4.87
17
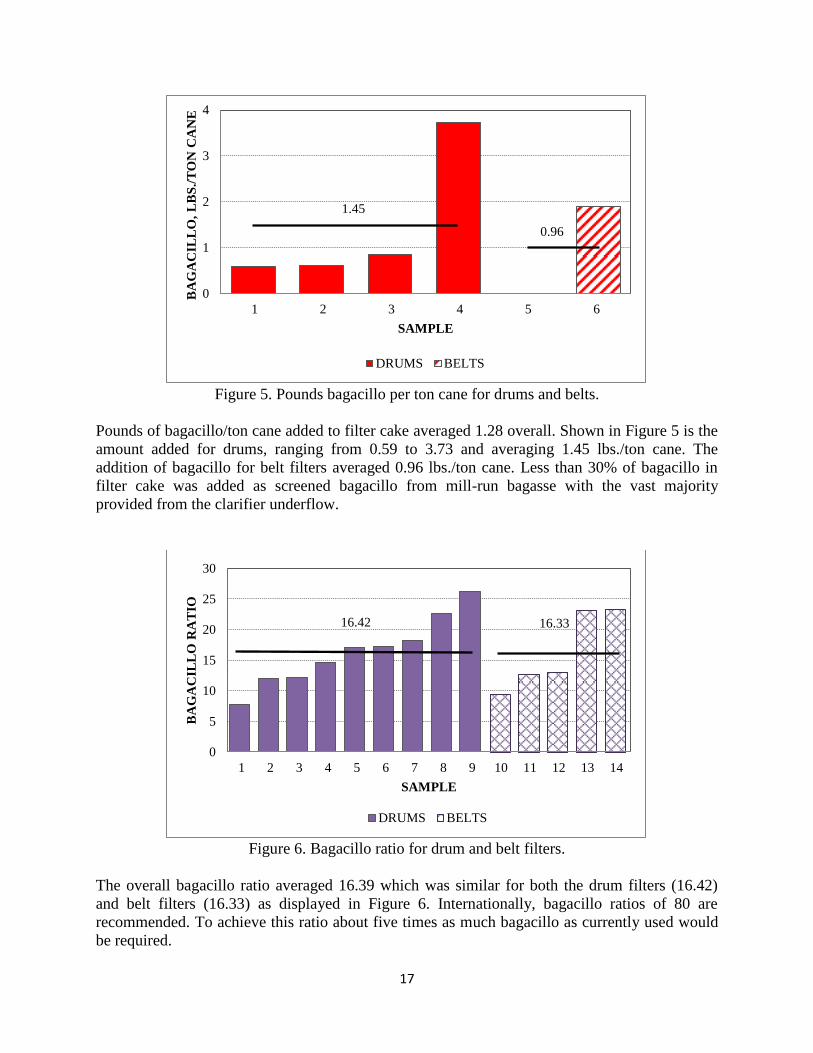
Figure 5. Pounds bagacillo per ton cane for drums and belts.
Pounds of bagacillo/ton cane added to filter cake averaged 1.28 overall. Shown in Figure 5 is the
amount added for drums, ranging from 0.59 to 3.73 and averaging 1.45 lbs./ton cane. The
addition of bagacillo for belt filters averaged 0.96 lbs./ton cane. Less than 30% of bagacillo in
filter cake was added as screened bagacillo from mill-run bagasse with the vast majority
provided from the clarifier underflow.
Figure 6. Bagacillo ratio for drum and belt filters.
The overall bagacillo ratio averaged 16.39 which was similar for both the drum filters (16.42)
and belt filters (16.33) as displayed in Figure 6. Internationally, bagacillo ratios of 80 are
recommended. To achieve this ratio about five times as much bagacillo as currently used would
be required.
0
1
2
3
4
1 2 3 4 5 6
BA
GA
CIL
LO
, L
BS
./T
ON
CA
NE
SAMPLE
DRUMS BELTS
0.96
1.45
0
5
10
15
20
25
30
1 2 3 4 5 6 7 8 9 10 11 12 13 14
BA
GA
CIL
LO
RA
TIO
SAMPLE
DRUMS BELTS
16.42 16.33
18
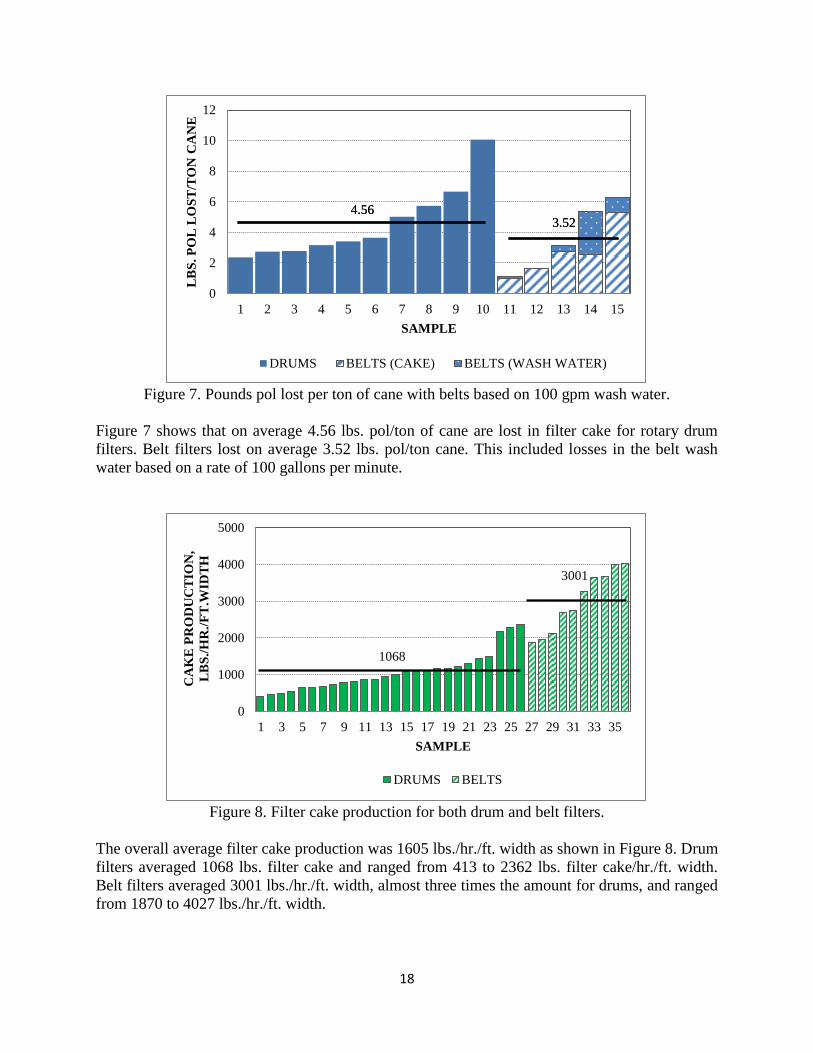
Figure 7. Pounds pol lost per ton of cane with belts based on 100 gpm wash water.
Figure 7 shows that on average 4.56 lbs. pol/ton of cane are lost in filter cake for rotary drum
filters. Belt filters lost on average 3.52 lbs. pol/ton cane. This included losses in the belt wash
water based on a rate of 100 gallons per minute.
Figure 8. Filter cake production for both drum and belt filters.
The overall average filter cake production was 1605 lbs./hr./ft. width as shown in Figure 8. Drum
filters averaged 1068 lbs. filter cake and ranged from 413 to 2362 lbs. filter cake/hr./ft. width.
Belt filters averaged 3001 lbs./hr./ft. width, almost three times the amount for drums, and ranged
from 1870 to 4027 lbs./hr./ft. width.
0
2
4
6
8
10
12
1 2 3 4 5 6 7 8 9 10 11 12 13 14 15
LB
S.
PO
L L
OS
T/T
ON
CA
NE
SAMPLE
DRUMS BELTS (CAKE) BELTS (WASH WATER)
4.56 3.52
4.56 3.52
0
1000
2000
3000
4000
5000
1 3 5 7 9 11 13 15 17 19 21 23 25 27 29 31 33 35
CA
KE
PR
OD
UC
TIO
N,
LB
S./
HR
./F
T.W
IDT
H
SAMPLE
DRUMS BELTS
1068
3001

19
Figure 9. Amount of mud removal for drum and belt filters.
Mud removal averaged 413.81 lbs./hr./ft. width for all filters tested. Figure 9 shows the average
mud removal for drum filters was 252 lbs. mud/hr./ft. width and ranged from 94 to 511 lbs. Mud
removal for belt filters is also shown, averaging 834 lbs. mud/hr./ft. width and varying from 275
to 1311 lbs./hr./ft. width.
SUMMARY
In general, filter operations are highly variable with much scope for improvement. Most of the
bagacillo is obtained from the underflow with very little coming from bagasse screening. The
bagacillo ratio (bagacillo/mud) of 16% is very low. Filter retention of 88% is generally very
good.
Regarding belt filters only, the capacity seems to be very high with sugar losses comparable to
that of drums. Maintenance costs have yet to be determined. Options for disposal of belt wash
water should be considered.
ACKNOWLEDGEMENTS
We would like to express our thanks and appreciation to the American Sugar Cane League and
all of the participating factories and personnel for their support of this project.
REFERENCES
Birkett, H. 1998. Cane Sampling Recommended Procedures. ASI.
Birkett, H. and J. Stein. 2004. Cane washing losses – part 1. Sugar Journal, 67 (4): 17:21.
Chen, J.C.P. and Chou, C.C. 1993. Cane Sugar Handbook. 12th
Edition, John Wiley & Sons,
New York.
0
200
400
600
800
1000
1200
1400
1 3 5 7 9 11 13 15 17 19 21 23 25 27 29 31 33 35
MU
D R
EM
OV
AL
,
LB
S./
HR
./F
T.W
IDT
H
SAMPLE
DRUMS BELTS
252
834
20
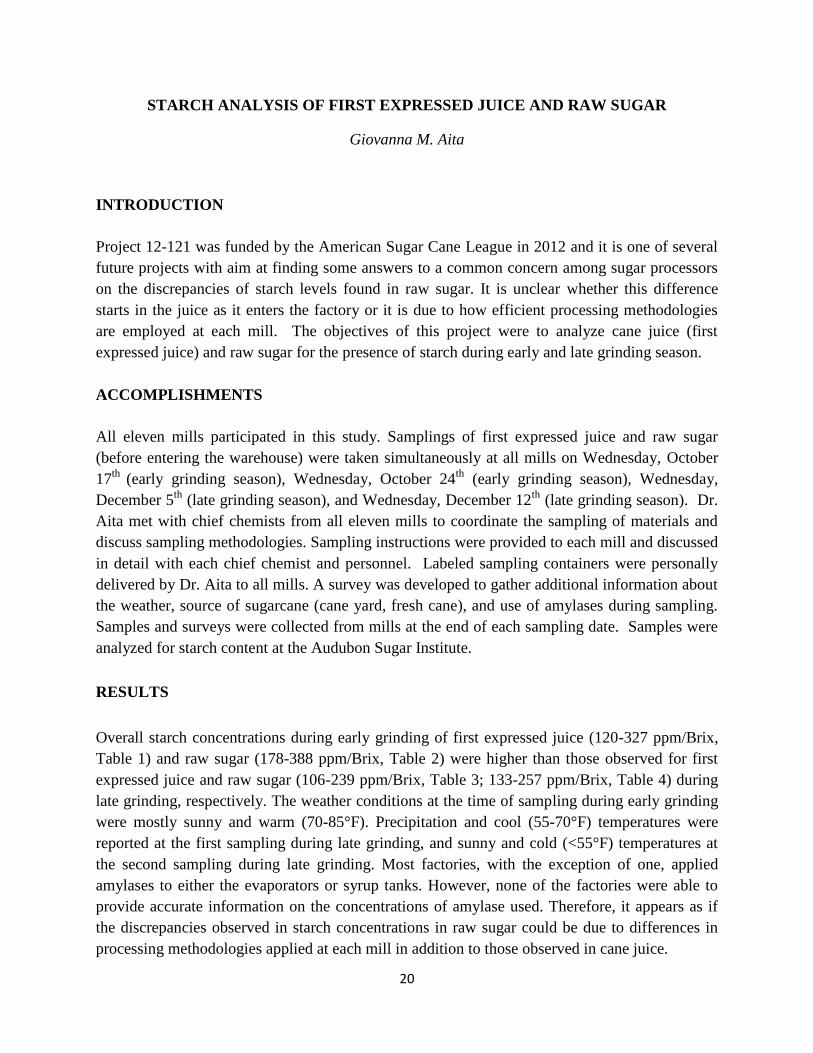
STARCH ANALYSIS OF FIRST EXPRESSED JUICE AND RAW SUGAR
Giovanna M. Aita
INTRODUCTION
Project 12-121 was funded by the American Sugar Cane League in 2012 and it is one of several
future projects with aim at finding some answers to a common concern among sugar processors
on the discrepancies of starch levels found in raw sugar. It is unclear whether this difference
starts in the juice as it enters the factory or it is due to how efficient processing methodologies
are employed at each mill. The objectives of this project were to analyze cane juice (first
expressed juice) and raw sugar for the presence of starch during early and late grinding season.
ACCOMPLISHMENTS
All eleven mills participated in this study. Samplings of first expressed juice and raw sugar
(before entering the warehouse) were taken simultaneously at all mills on Wednesday, October
17th
(early grinding season), Wednesday, October 24th
(early grinding season), Wednesday,
December 5th
(late grinding season), and Wednesday, December 12th
(late grinding season). Dr.
Aita met with chief chemists from all eleven mills to coordinate the sampling of materials and
discuss sampling methodologies. Sampling instructions were provided to each mill and discussed
in detail with each chief chemist and personnel. Labeled sampling containers were personally
delivered by Dr. Aita to all mills. A survey was developed to gather additional information about
the weather, source of sugarcane (cane yard, fresh cane), and use of amylases during sampling.
Samples and surveys were collected from mills at the end of each sampling date. Samples were
analyzed for starch content at the Audubon Sugar Institute.
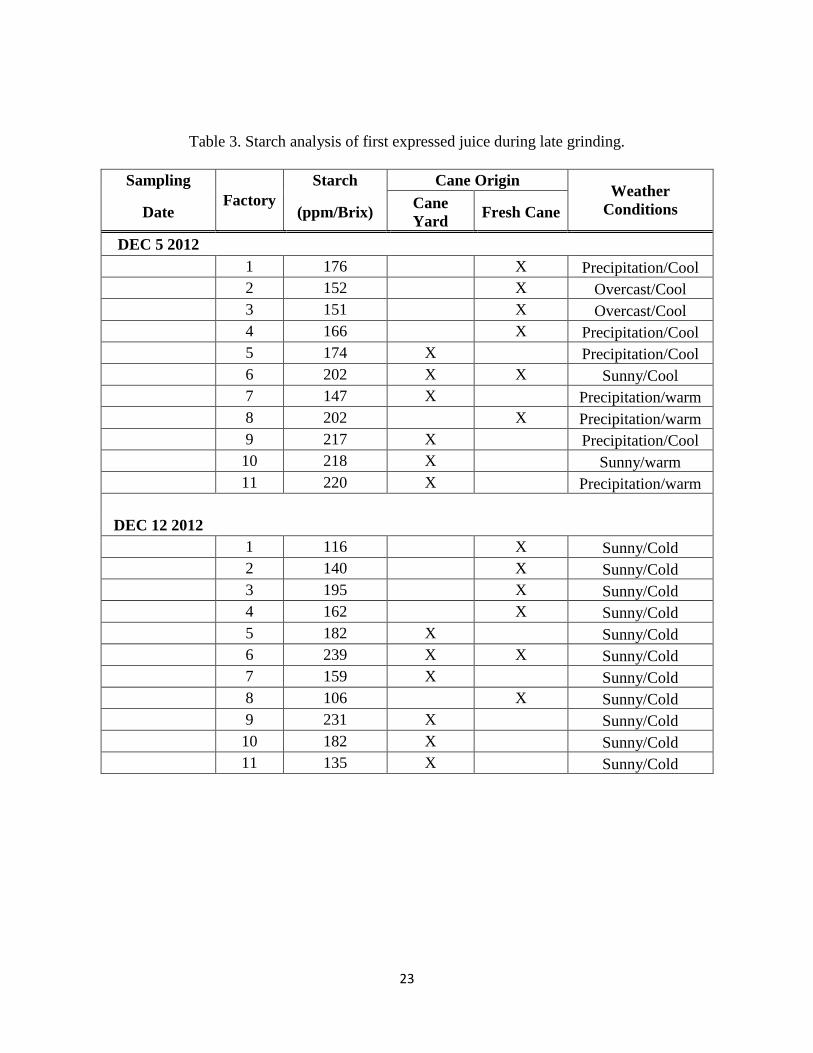
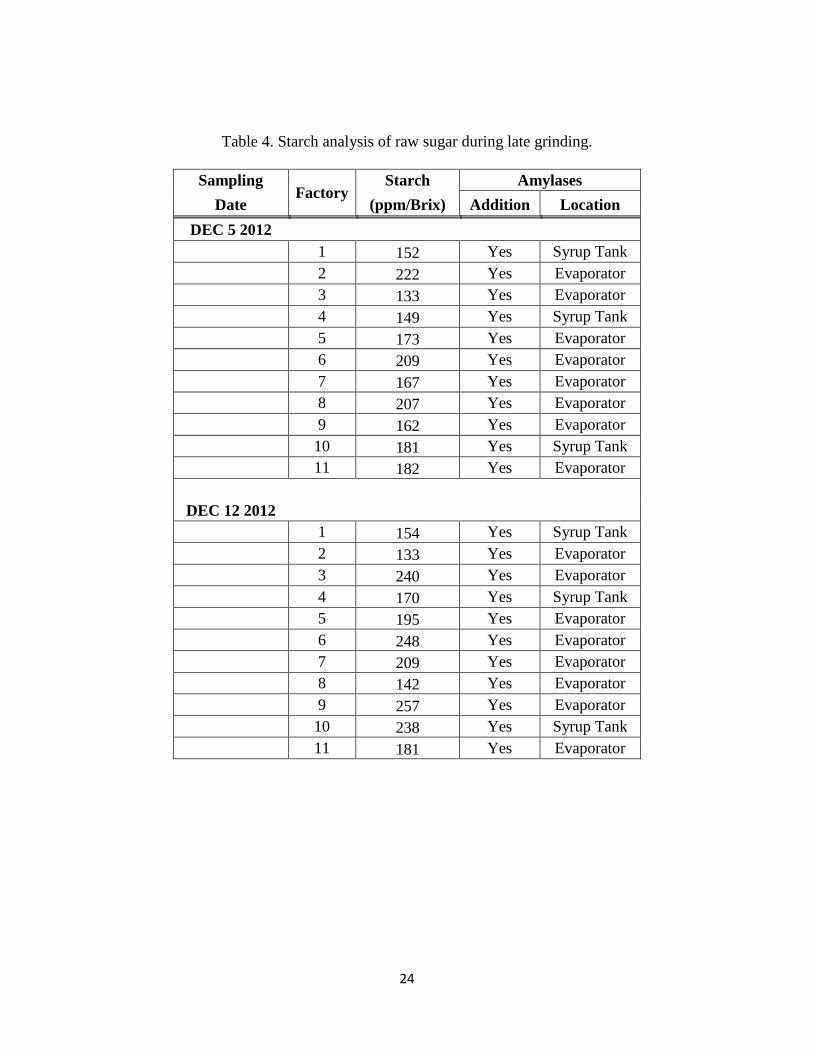
RESULTS
Overall starch concentrations during early grinding of first expressed juice (120-327 ppm/Brix,
Table 1) and raw sugar (178-388 ppm/Brix, Table 2) were higher than those observed for first
expressed juice and raw sugar (106-239 ppm/Brix, Table 3; 133-257 ppm/Brix, Table 4) during
late grinding, respectively. The weather conditions at the time of sampling during early grinding
were mostly sunny and warm (70-85°F). Precipitation and cool (55-70°F) temperatures were
reported at the first sampling during late grinding, and sunny and cold (<55°F) temperatures at
the second sampling during late grinding. Most factories, with the exception of one, applied
amylases to either the evaporators or syrup tanks. However, none of the factories were able to
provide accurate information on the concentrations of amylase used. Therefore, it appears as if
the discrepancies observed in starch concentrations in raw sugar could be due to differences in
processing methodologies applied at each mill in addition to those observed in cane juice.
21
ACKNOWLEDGEMENTS
Sincere appreciation and gratitude is extended to all sugar factory managers, chief chemists and
laboratory personnel for their time and support spent on this project. The author also thanks her
research team (Dr. Swetha Mahalaxmi, Ms. Akanksha Kanitkar, Mr. Zenghui Qiu, and Mr.
Saeed Oladi) and the staff from the chemistry laboratory (Ms. Chardcie Verret, Dr. Derek
Dorman, and Mrs. Shyue Lu) at the Audubon Sugar Institute for their analytical support.
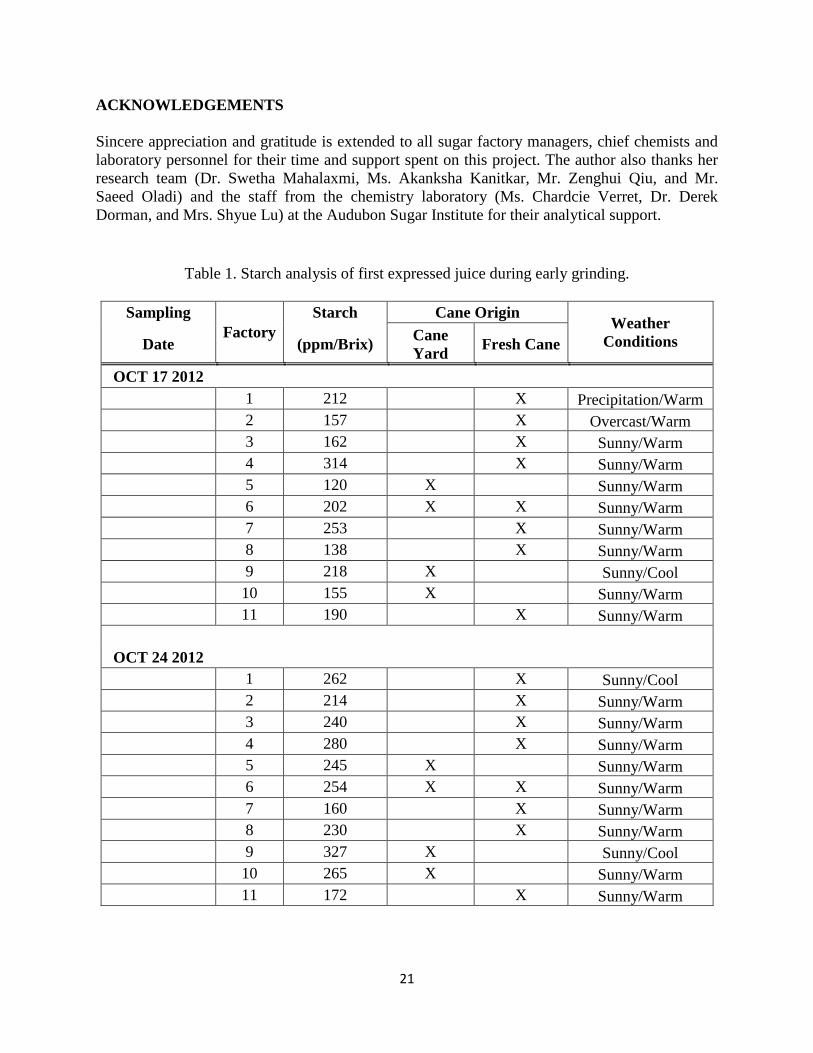
Table 1. Starch analysis of first expressed juice during early grinding.
Sampling
Factory
Starch Cane Origin Weather
Conditions Date (ppm/Brix) Cane
Yard Fresh Cane
OCT 17 2012
1 212 X Precipitation/Warm
2 157 X Overcast/Warm
3 162 X Sunny/Warm
4 314 X Sunny/Warm
5 120 X Sunny/Warm
6 202 X X Sunny/Warm
7 253 X Sunny/Warm
8 138 X Sunny/Warm
9 218 X Sunny/Cool
10 155 X Sunny/Warm
11 190 X Sunny/Warm
OCT 24 2012
1 262 X Sunny/Cool
2 214 X Sunny/Warm
3 240 X Sunny/Warm
4 280 X Sunny/Warm
5 245 X Sunny/Warm
6 254 X X Sunny/Warm
7 160 X Sunny/Warm
8 230 X Sunny/Warm
9 327 X Sunny/Cool
10 265 X Sunny/Warm
11 172 X Sunny/Warm

22
Table 2. Starch analysis of raw sugar during early grinding.
Sampling Factory
Starch Amylases
Date (ppm/Brix) Addition Location
OCT 17 2012
1 357 No N/A
2 302 Yes Evaporator
3 216 Yes Evaporator
4 199 Yes Syrup Tank
5 217 Yes Evaporator
6 286 Yes Evaporator
7 230 Yes Evaporator
8 388 Yes Evaporator
9 245 Yes Evaporator
10 305 Yes Syrup Tank
11 181 Yes Evaporator
OCT 24 2012
1 413 No N/A
2 318 Yes Evaporator
3 189 Yes Evaporator
4 240 Yes Syrup Tank
5 178 Yes Evaporator
6 290 Yes Evaporator
7 203 Yes Evaporator
8 255 Yes Evaporator
9 317 Yes Evaporator
10 267 Yes Syrup Tank
11 258 Yes Evaporator
N/A= Not Applicable
23
Table 3. Starch analysis of first expressed juice during late grinding.
Sampling
Factory
Starch Cane Origin Weather
Conditions Date (ppm/Brix) Cane
Yard Fresh Cane
DEC 5 2012
1 176 X Precipitation/Cool
2 152 X Overcast/Cool
3 151 X Overcast/Cool
4 166 X Precipitation/Cool
5 174 X Precipitation/Cool
6 202 X X Sunny/Cool
7 147 X Precipitation/warm
8 202 X Precipitation/warm
9 217 X Precipitation/Cool
10 218 X Sunny/warm
11 220 X Precipitation/warm
DEC 12 2012
1 116 X Sunny/Cold
2 140 X Sunny/Cold
3 195 X Sunny/Cold
4 162 X Sunny/Cold
5 182 X Sunny/Cold
6 239 X X Sunny/Cold
7 159 X Sunny/Cold
8 106 X Sunny/Cold
9 231 X Sunny/Cold
10 182 X Sunny/Cold
11 135 X Sunny/Cold
24
Table 4. Starch analysis of raw sugar during late grinding.
Sampling Factory
Starch Amylases
Date (ppm/Brix) Addition Location
DEC 5 2012
1 152 Yes Syrup Tank
2 222 Yes Evaporator
3 133 Yes Evaporator
4 149 Yes Syrup Tank
5 173 Yes Evaporator
6 209 Yes Evaporator
7 167 Yes Evaporator
8 207 Yes Evaporator
9 162 Yes Evaporator
10 181 Yes Syrup Tank
11 182 Yes Evaporator
DEC 12 2012
1 154 Yes Syrup Tank
2 133 Yes Evaporator
3 240 Yes Evaporator
4 170 Yes Syrup Tank
5 195 Yes Evaporator
6 248 Yes Evaporator
7 209 Yes Evaporator
8 142 Yes Evaporator
9 257 Yes Evaporator
10 238 Yes Syrup Tank
11 181 Yes Evaporator
25
IMPROVEMENTS OF RAW SUGAR QUALITY USING DOUBLE PURGE OF
C-MASSECUITE
L. S. Polanco1, V. Kochergin
1, S. Savoie
2, G. Carline
2
1Audubon Sugar Institute;
2Lula Sugar Factory, Belle Rose, Louisiana
INTRODUCTION
The color in raw sugar is influenced by many factors (Chen & Chou, 1993) such as: quality of
the cane processed (type of soil, variety, ripeness, deterioration level and trash content); juice
clarification (excess of lime salts and bagacillo in the juice); and evaporation and crystallization
systems (temperature and molasses recirculation). The main factors that can be controlled
insuring high raw sugar quality and maximizing sugar recovery are: (Rein, 2007; Chou, 2000)
Controlling pan operation (to avoid uneven and agglomerated grain, and overheating)
Guaranteeing the highest obtainable crystal content on each strike (reducing the recycle
of materials)
Reducing remelt to a minimum
Proper centrifugal operation for high and low grade massecuites (avoiding excessive
washing to minimize molasses production)
Chou (2000) and Bento (2008) stated that the best way to achieve a good sugar quality (low
color and low ash content) at the boiling house is insuring, independent of the boiling scheme, a
good C-magma quality (the seed for the first and/or the second strike).
The implementation of double purge to a three-boiling scheme does not involve significant
changes to the boiling house but will upgrade the quality of the seed used in the A and B strikes.
A lower recirculation of final molasses with the magma will improve not only the quality of the
raw sugar produced but also the quality of the first (A) and second massecuites. Improvement of
A and B strike quality will be due to a lower recirculation of non-sugars from the low grade
massecuites, reducing color and viscosity of the mother liquors. This may also benefit the sugar
yield from the first massecuites by lowering the purities of the A and B molasses.. The system
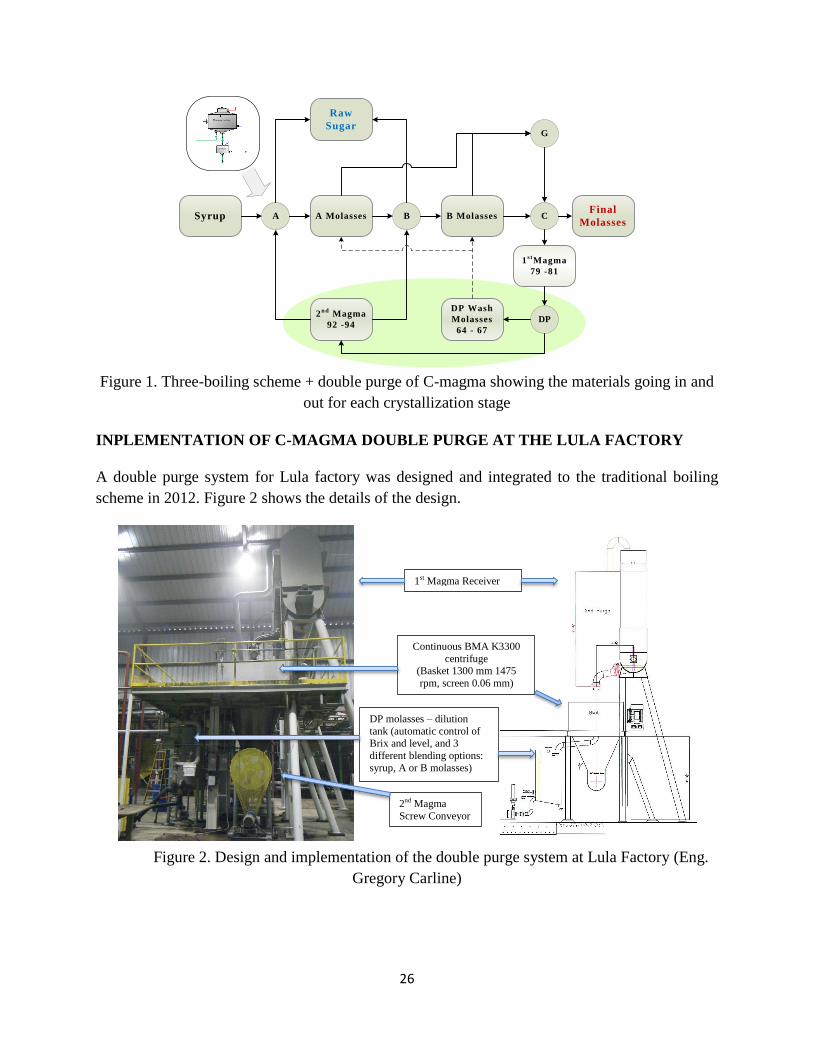
can be implemented, with minor changes to the traditional 3-boiling scheme, by addition of a
second centrifugation stage after the centrifugation of C–massecuite (Figure 1). Little or no water
is applied at the first stage, obtaining magma of 79 – 81 purity. In the second centrifugation, the
magma is affined producing 92 – 94 purity. The 64 to 67 purity wash molasses can be blended
with either B or A molasses. The higher purity magma becomes the footing for A and B
massecuites.
26
Figure 1. Three-boiling scheme + double purge of C-magma showing the materials going in and
out for each crystallization stage
INPLEMENTATION OF C-MAGMA DOUBLE PURGE AT THE LULA FACTORY
A double purge system for Lula factory was designed and integrated to the traditional boiling
scheme in 2012. Figure 2 shows the details of the design.
Figure 2. Design and implementation of the double purge system at Lula Factory (Eng.
Gregory Carline)
Syrup A B C
G
A Molasses B MolassesFinal
Molasses
Raw
Sugar
2n d
Magma
92 -94
1s t
Magma
79 -81
DP Wash
Molasses
64 - 67
DP
1st Magma Receiver
Continuous BMA K3300
centrifuge (Basket 1300 mm 1475
rpm, screen 0.06 mm)
DP molasses – dilution
tank (automatic control of Brix and level, and 3
different blending options:
syrup, A or B molasses)
2nd Magma
Screw Conveyor
27
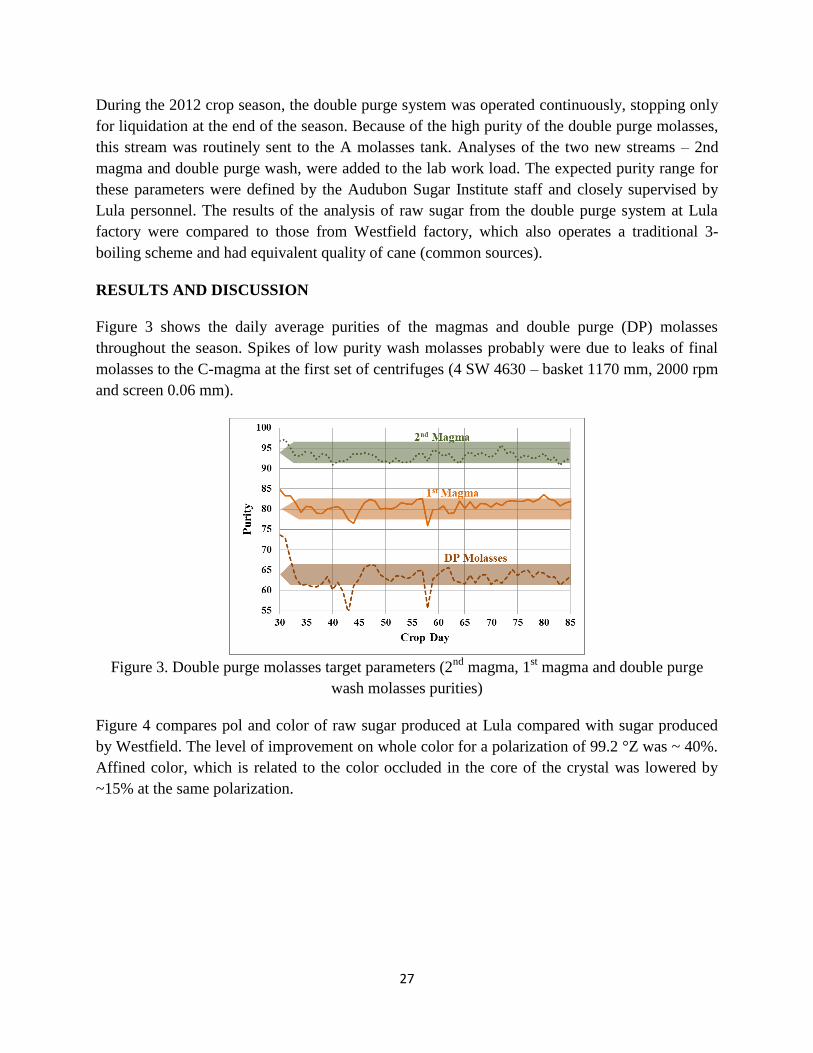
During the 2012 crop season, the double purge system was operated continuously, stopping only
for liquidation at the end of the season. Because of the high purity of the double purge molasses,
this stream was routinely sent to the A molasses tank. Analyses of the two new streams – 2nd
magma and double purge wash, were added to the lab work load. The expected purity range for
these parameters were defined by the Audubon Sugar Institute staff and closely supervised by
Lula personnel. The results of the analysis of raw sugar from the double purge system at Lula
factory were compared to those from Westfield factory, which also operates a traditional 3-
boiling scheme and had equivalent quality of cane (common sources).
RESULTS AND DISCUSSION
Figure 3 shows the daily average purities of the magmas and double purge (DP) molasses
throughout the season. Spikes of low purity wash molasses probably were due to leaks of final
molasses to the C-magma at the first set of centrifuges (4 SW 4630 – basket 1170 mm, 2000 rpm
and screen 0.06 mm).
Figure 3. Double purge molasses target parameters (2
nd magma, 1
st magma and double purge
wash molasses purities)
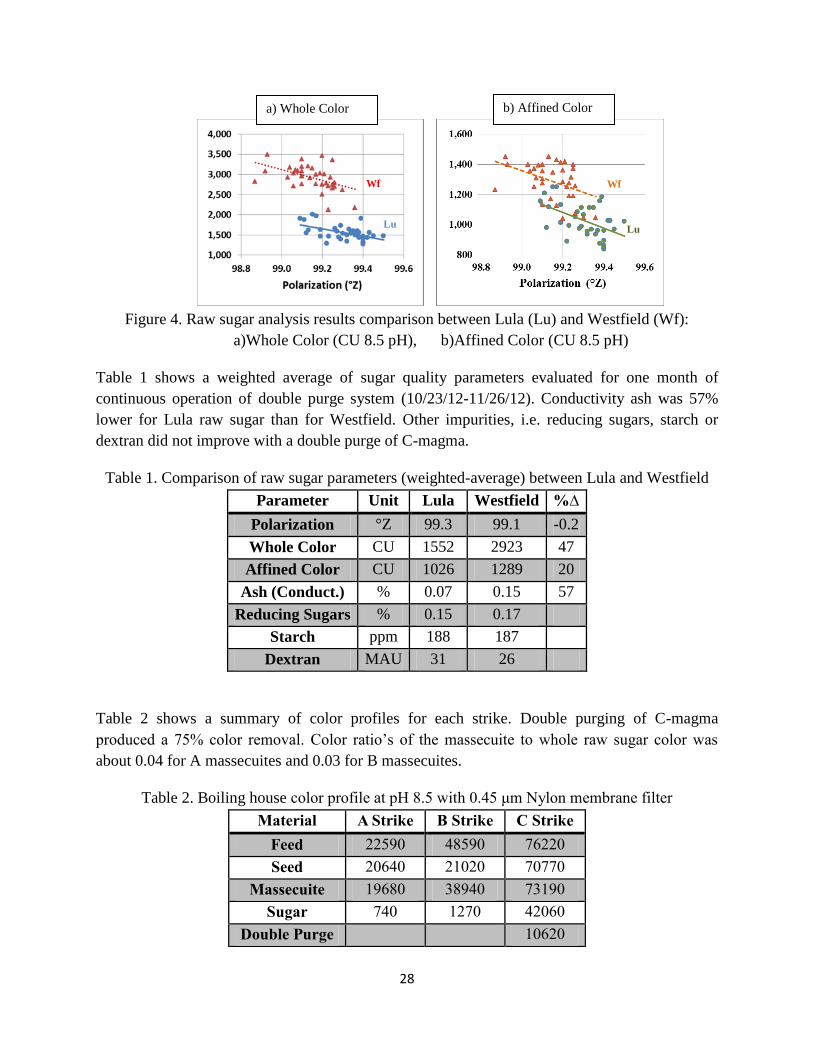
Figure 4 compares pol and color of raw sugar produced at Lula compared with sugar produced
by Westfield. The level of improvement on whole color for a polarization of 99.2 °Z was ~ 40%.
Affined color, which is related to the color occluded in the core of the crystal was lowered by
~15% at the same polarization.
28
Figure 4. Raw sugar analysis results comparison between Lula (Lu) and Westfield (Wf):
a)Whole Color (CU 8.5 pH), b)Affined Color (CU 8.5 pH)
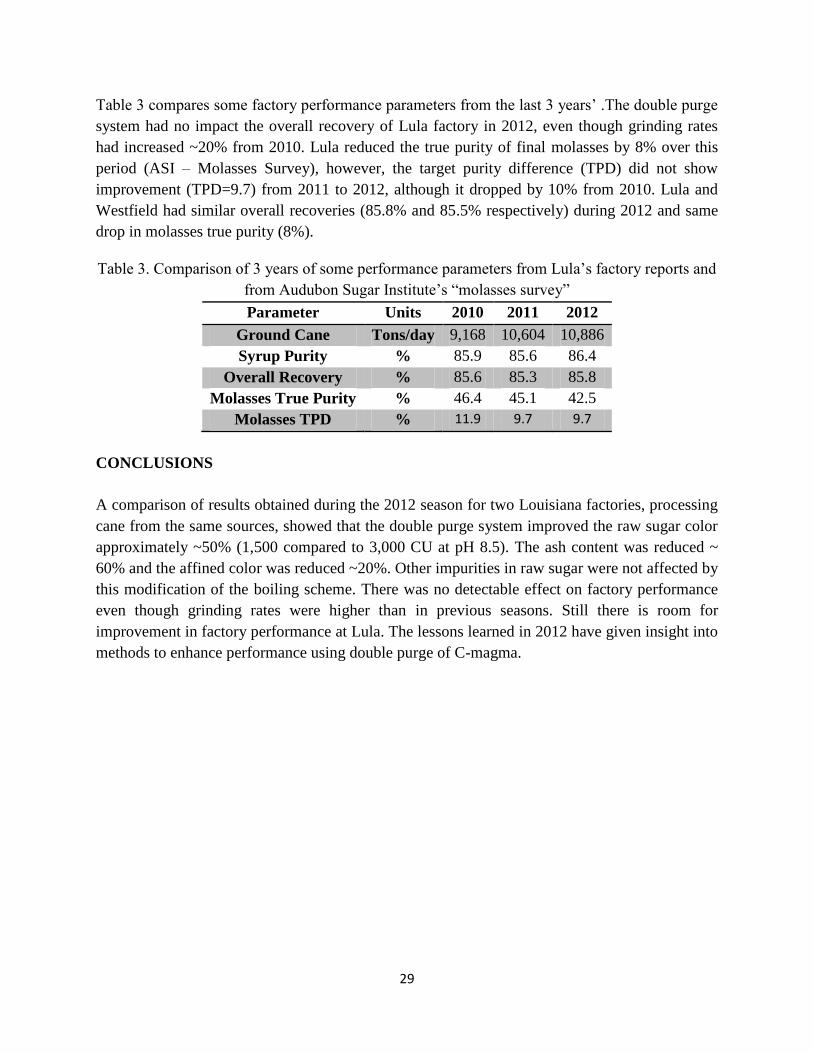
Table 1 shows a weighted average of sugar quality parameters evaluated for one month of
continuous operation of double purge system (10/23/12-11/26/12). Conductivity ash was 57%
lower for Lula raw sugar than for Westfield. Other impurities, i.e. reducing sugars, starch or
dextran did not improve with a double purge of C-magma.
Table 1. Comparison of raw sugar parameters (weighted-average) between Lula and Westfield
Parameter Unit Lula Westfield %∆
Polarization °Z 99.3 99.1 -0.2
Whole Color CU 1552 2923 47
Affined Color CU 1026 1289 20
Ash (Conduct.) % 0.07 0.15 57
Reducing Sugars % 0.15 0.17
Starch ppm 188 187
Dextran MAU 31 26
Table 2 shows a summary of color profiles for each strike. Double purging of C-magma
produced a 75% color removal. Color ratio’s of the massecuite to whole raw sugar color was
about 0.04 for A massecuites and 0.03 for B massecuites.
Table 2. Boiling house color profile at pH 8.5 with 0.45 μm Nylon membrane filter
Material A Strike B Strike C Strike
Feed 22590 48590 76220
Seed 20640 21020 70770
Massecuite 19680 38940 73190
Sugar 740 1270 42060
Double Purge 10620
Wf
Lu
Wf
Lu
b) Affined Color a) Whole Color
29
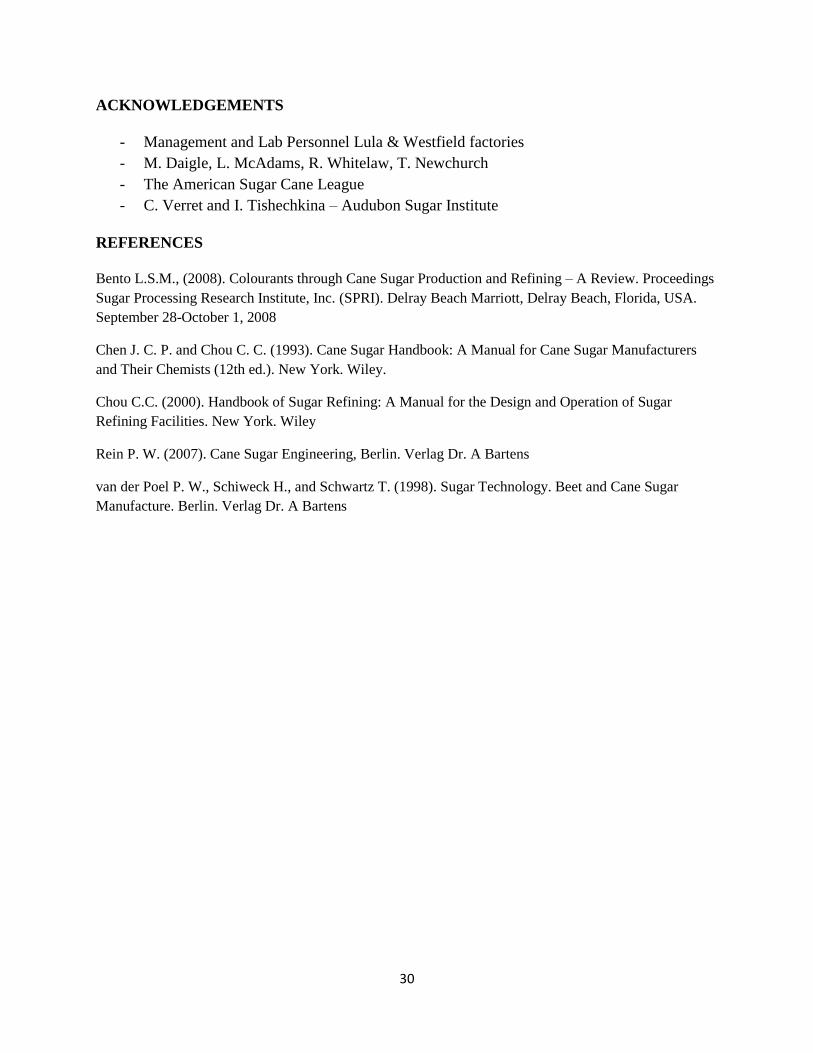
Table 3 compares some factory performance parameters from the last 3 years’ .The double purge
system had no impact the overall recovery of Lula factory in 2012, even though grinding rates
had increased ~20% from 2010. Lula reduced the true purity of final molasses by 8% over this
period (ASI – Molasses Survey), however, the target purity difference (TPD) did not show
improvement (TPD=9.7) from 2011 to 2012, although it dropped by 10% from 2010. Lula and
Westfield had similar overall recoveries (85.8% and 85.5% respectively) during 2012 and same
drop in molasses true purity (8%).
Table 3. Comparison of 3 years of some performance parameters from Lula’s factory reports and
from Audubon Sugar Institute’s “molasses survey”
Parameter Units 2010 2011 2012
Ground Cane Tons/day 9,168 10,604 10,886
Syrup Purity % 85.9 85.6 86.4
Overall Recovery % 85.6 85.3 85.8
Molasses True Purity % 46.4 45.1 42.5
Molasses TPD % 11.9 9.7 9.7
CONCLUSIONS
A comparison of results obtained during the 2012 season for two Louisiana factories, processing
cane from the same sources, showed that the double purge system improved the raw sugar color
approximately ~50% (1,500 compared to 3,000 CU at pH 8.5). The ash content was reduced ~
60% and the affined color was reduced ~20%. Other impurities in raw sugar were not affected by
this modification of the boiling scheme. There was no detectable effect on factory performance
even though grinding rates were higher than in previous seasons. Still there is room for
improvement in factory performance at Lula. The lessons learned in 2012 have given insight into
methods to enhance performance using double purge of C-magma.
30
ACKNOWLEDGEMENTS
- Management and Lab Personnel Lula & Westfield factories
- M. Daigle, L. McAdams, R. Whitelaw, T. Newchurch
- The American Sugar Cane League
- C. Verret and I. Tishechkina – Audubon Sugar Institute
REFERENCES
Bento L.S.M., (2008). Colourants through Cane Sugar Production and Refining – A Review. Proceedings
Sugar Processing Research Institute, Inc. (SPRI). Delray Beach Marriott, Delray Beach, Florida, USA.
September 28-October 1, 2008
Chen J. C. P. and Chou C. C. (1993). Cane Sugar Handbook: A Manual for Cane Sugar Manufacturers
and Their Chemists (12th ed.). New York. Wiley.
Chou C.C. (2000). Handbook of Sugar Refining: A Manual for the Design and Operation of Sugar
Refining Facilities. New York. Wiley
Rein P. W. (2007). Cane Sugar Engineering, Berlin. Verlag Dr. A Bartens
van der Poel P. W., Schiweck H., and Schwartz T. (1998). Sugar Technology. Beet and Cane Sugar
Manufacture. Berlin. Verlag Dr. A Bartens

31
THE MOLASSES SURVEY
C. Verret, D. Dorman, & S. Lu
INTRODUCTION
Since 2001, the Audubon Sugar Institute has analyzed the molasses provided weekly by each of
the Louisiana raw sugar factories. The results of our analyses are used to calculate a “target
purity (TP) and a true purity for the molasses. The TP is the theoretical concentration of sucrose
(sugar) where, regardless of effort, no further sugar can be crystallized. The model that is used to
calculate the TP originates from South Africa (Rein, 2007), and has been confirmed as
representative of the Louisiana industry (Saska et al., 2010).
The true purity is determined by HPLC and is free of the interferences (reducing sugars) that can
offset the accuracy of polarimetric determinations (particularly in molasses where purities are
very low). The formula for TP is given below, where RS is the total reducing sugar (glucose +
fructose) via HPLC (ICUMSA, 2002) and Ash is the approximate sulfated ash via conductivity
(Saska et al., 1999).
Ash
RSLogTP 104.139.33
The TP is subtracted from the true purity to give a target purity difference or TPD. The TPD is
used by the factories to determine how well they are recovering sugar from their massecuite
(which is reflected by residual sugar in the molasses). “True purity” is the sum of the non-
crystallizable sugar and that which was crystallized, but was lost across the centrifugals.
Generally, a lower TPD indicates greater efficiency as it relates to recovery of sugar.
MATERIALS AND METHODS
Composite samples of final molasses (seven day) were sent to us weekly from each of the 11
mills in Louisiana. The 2011 survey season stretched from 09-25-11 until 12-25-11 and the 2012
survey season stretched from 09-23-12 until 01-06-13. A total of 182 samples were analyzed in
duplicate for the 2011 season and 208 samples were analyzed in duplicate for the 2012 season.
Including standards, this totaled 532 samples for 2011 and 608 samples for 2012. Analyses
included:
1. Refractometer Brix (ICUMSA GS4-13)
2. Sucrose, glucose and fructose by HPLC (ICUMSA GS7/4/8-23)
3. Sucrose via polarimetry*
4. Conductivity ash (ICUMSA GS1/3/4/7/8-13)
*Because we measure sugar using HPLC, we perform a direct polarization of molasses clarified
using OctapolTM
(Baddley Chemical) so that we can obtain a pol/sucrose ratio.
32
4.0
6.0
8.0
10.0
12.0
14.0
16.0
1 2 3 4 5 6 7 8 9 10 11 12 13 14 15 16
TPD
, We
ekl
y A
vera
ge
Week
Average Weekly Target Purity Differences(TPD) 2011-2012
2011
2012
Double-blind quality control (QC) was performed each week. Briefly, a large sample of molasses
is collected during the first week of the season. This sample is sub sampled into enough small
containers to last the season (approximately 25-28 samples). Each week, two of these
subsamples are pulled and included randomly into the weekly sample set. Each sample in the
weekly set is mixed thoroughly and subsampled into containers identical to those used for the
QC. A number is applied to each container, and the identity of each sample is kept in confidence
until the analyses are complete.
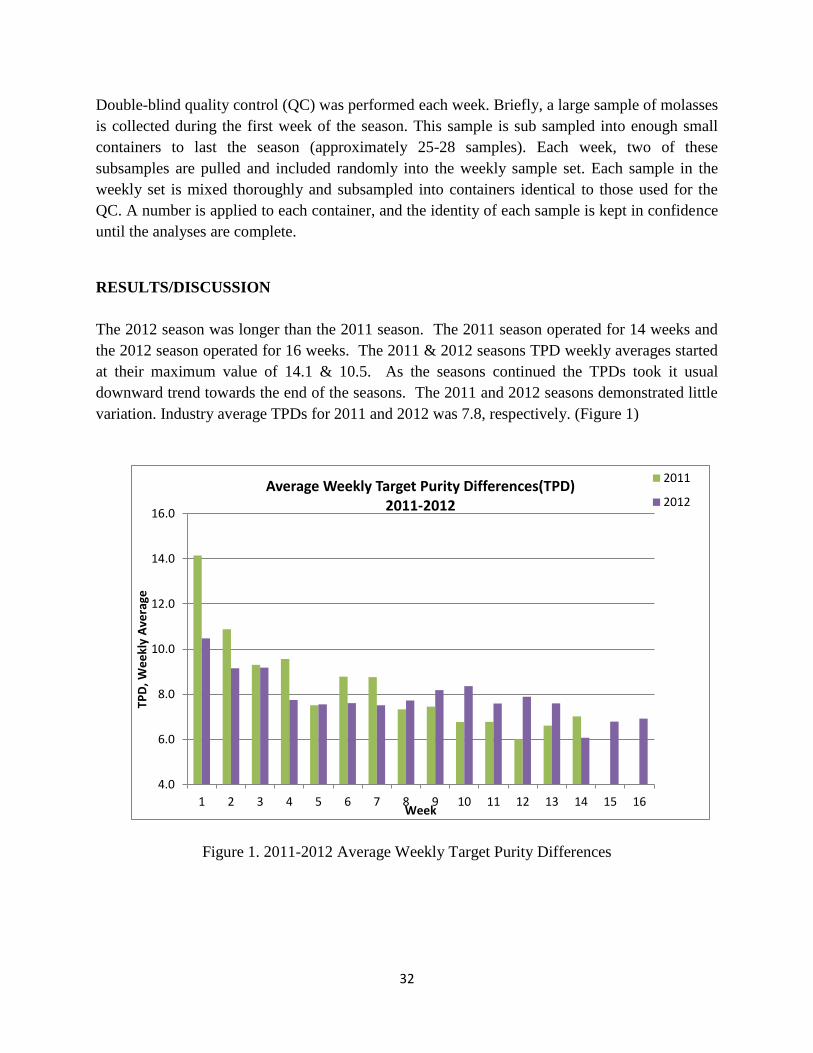
RESULTS/DISCUSSION
The 2012 season was longer than the 2011 season. The 2011 season operated for 14 weeks and
the 2012 season operated for 16 weeks. The 2011 & 2012 seasons TPD weekly averages started
at their maximum value of 14.1 & 10.5. As the seasons continued the TPDs took it usual
downward trend towards the end of the seasons. The 2011 and 2012 seasons demonstrated little
variation. Industry average TPDs for 2011 and 2012 was 7.8, respectively. (Figure 1)
Figure 1. 2011-2012 Average Weekly Target Purity Differences

33
The conductivity ash component for the 2011 & 2012 seasons were statistically consistent. They
both started their seasons at their minimum values of 11.5 and 12.1. As the seasons continued
the ash increased to their maximum values of 17.8 & 17.3. (Figure 2)
Figure 2. 2011-2012 Average Weekly Conductivity Ash
4.0
6.0
8.0
10.0
12.0
14.0
16.0
18.0
20.0
1 2 3 4 5 6 7 8 9 10 11 12 13 14 15 16
ASH
, %
To
tal S
olid
s
Weeks
Avergae Weekly ASH 2011-2012
ASH-2011
ASH-2012
34
4.0
6.0
8.0
10.0
12.0
14.0
16.0
18.0
1 2 3 4 5 6 7 8 9 10 11 12 13 14
TPD
& A
sh, W
ee
ly A
vera
ge
Week
Comparison of TPD & ASH Weekly Averages 2011
2011-TPD
2011-Ash
4.0
6.0
8.0
10.0
12.0
14.0
16.0
18.0
20.0
1 2 3 4 5 6 7 8 9 10 11 12 13 14 15 16
TPD
& A
sh, W
ee
kly
Ave
rage
Factory
Comparison of TPD & ASH Weekly Averages 2012
2012-TPD
2012-Ash
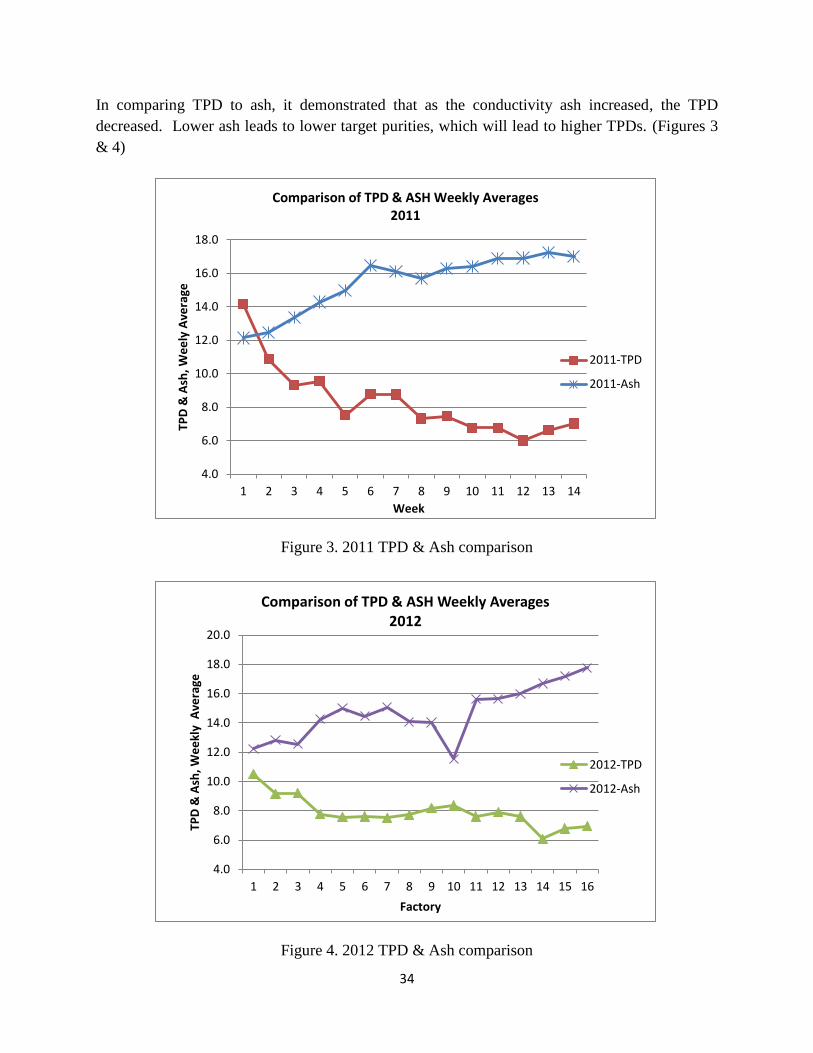
In comparing TPD to ash, it demonstrated that as the conductivity ash increased, the TPD
decreased. Lower ash leads to lower target purities, which will lead to higher TPDs. (Figures 3
& 4)
Figure 3. 2011 TPD & Ash comparison
Figure 4. 2012 TPD & Ash comparison
35
4.0
6.0
8.0
10.0
12.0
14.0
16.0
18.0
20.0
22.0
24.0
1 2 3 4 5 6 7 8 9 10 11 12 13 14 15 16
TPD
,& A
sh ,
We
ekl
y A
vera
ge
Week
Reducing Sugars Weekly Averages 2011-2012
2011-RS
2012-RS
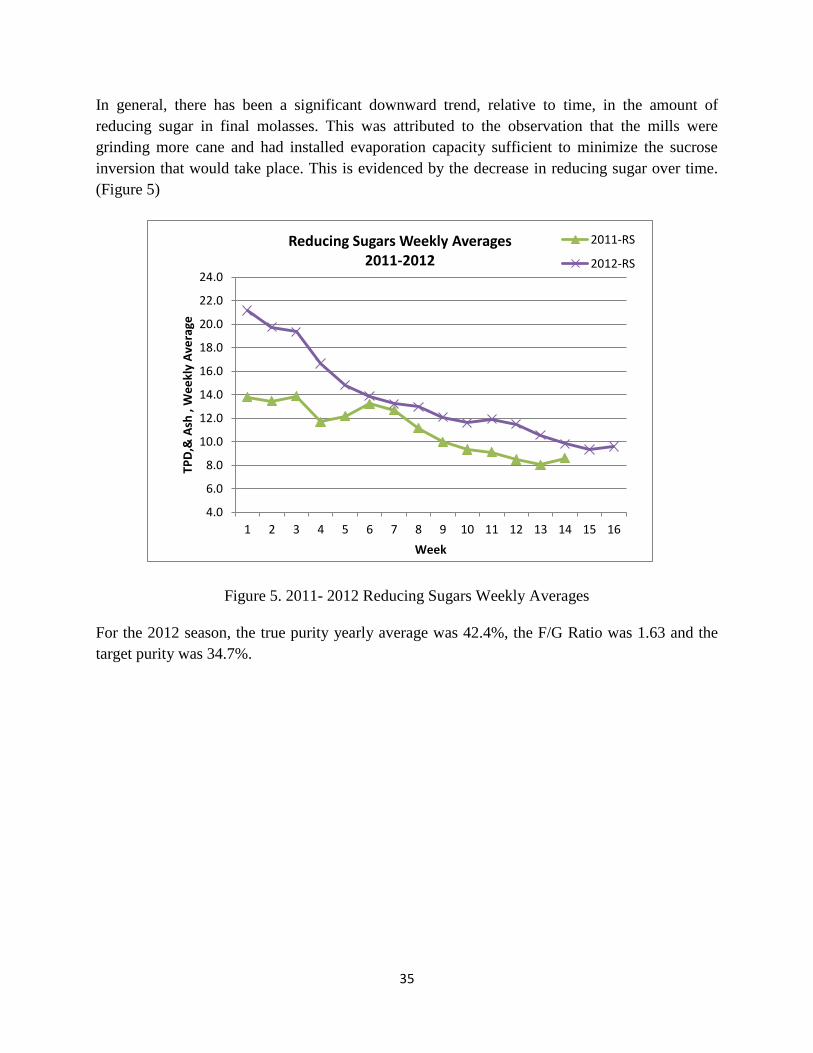
In general, there has been a significant downward trend, relative to time, in the amount of
reducing sugar in final molasses. This was attributed to the observation that the mills were
grinding more cane and had installed evaporation capacity sufficient to minimize the sucrose
inversion that would take place. This is evidenced by the decrease in reducing sugar over time.
(Figure 5)
Figure 5. 2011- 2012 Reducing Sugars Weekly Averages
For the 2012 season, the true purity yearly average was 42.4%, the F/G Ratio was 1.63 and the
target purity was 34.7%.
36
0.0
2.0
4.0
6.0
8.0
10.0
12.0
14.0
1 2 3 4 5 6 7 8 9 10 11
TPD
, Ye
ar A
vera
ge
Factory
Comparison of Yearly Average TPD 2010-2012
2010
2011
2012
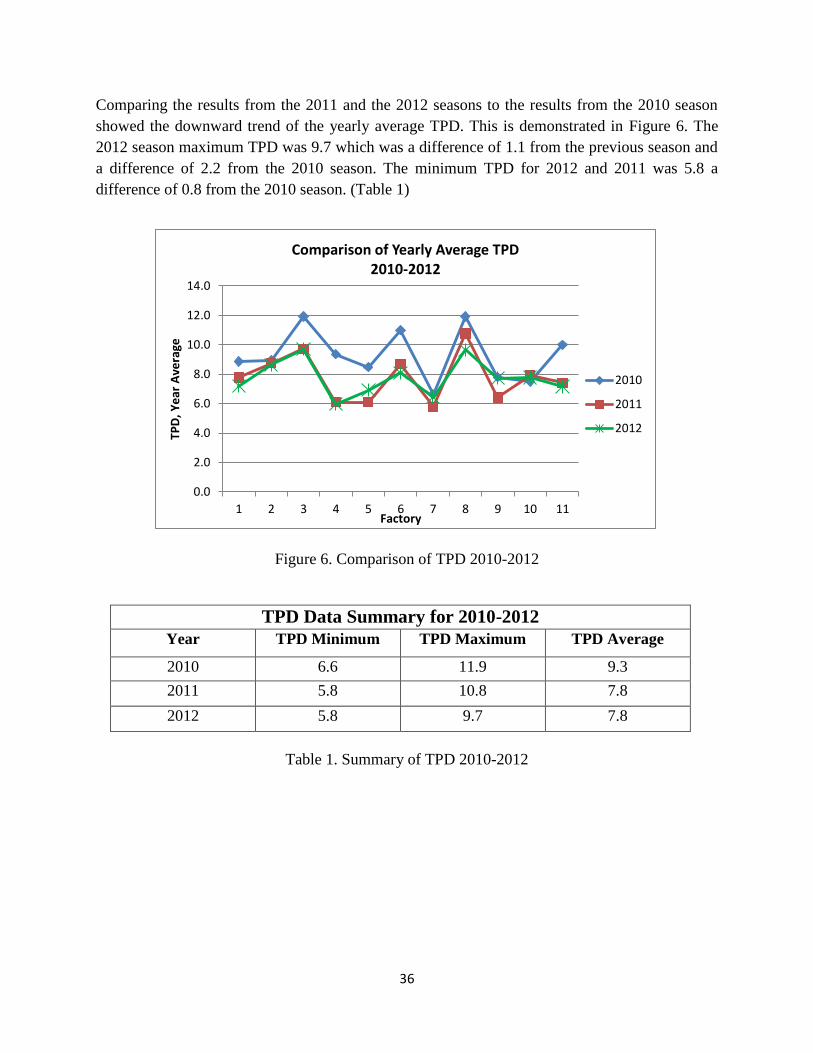
Comparing the results from the 2011 and the 2012 seasons to the results from the 2010 season
showed the downward trend of the yearly average TPD. This is demonstrated in Figure 6. The
2012 season maximum TPD was 9.7 which was a difference of 1.1 from the previous season and
a difference of 2.2 from the 2010 season. The minimum TPD for 2012 and 2011 was 5.8 a
difference of 0.8 from the 2010 season. (Table 1)
Figure 6. Comparison of TPD 2010-2012
TPD Data Summary for 2010-2012
Year TPD Minimum TPD Maximum TPD Average
2010 6.6 11.9 9.3
2011 5.8 10.8 7.8
2012 5.8 9.7 7.8
Table 1. Summary of TPD 2010-2012
37
CONCLUSIONS
The seasonal average TPD remained the same at 7.8 for the 2012 season. The ash decreased for
the 2012 season by 1.2% from the 2011 season which had an ash content of 15.9. The reducing
sugars increased for the 2012 season to 13.1% from 10.9% from the previous season. The true
purity, target purity and F/G ratio all decreased in the 2012 season.
The differences can be attributed to a wide range of factors which included favorable weather
and harvest conditions, the introduction of a new cane variety, cane maturity and increased
awareness at the cane delivery/mill level.
The mills are conscious of their TPD and are continuing to improve which is an encouraging
trend.
Historical data suggests that a TPD of five remains a rational and encouraging objective for the
2013-2014 grinding season.
REFERENCES
Baddley Chemical. (2001). Octapol and Octapol Plus. http://www.baddley.com/octapol.htm
ICUMSA. (1994). Method GS4-13: The Determination of Refractometric Dry Substance
(RDS %) of Molasses – Accepted. ICUMSA Methods Book. Verlag Dr. Albert Bartens KG-
Berlin. Supplement 2003. ISBN 3-87040-550-0.
ICUMSA. (2002). Method GS7/4/8-23: The Determination of Sucrose, Glucose and Fructose
by HPLC -in Cane Molasses - Official -and Sucrose in Beet Molasses – Official. ICUMSA
Methods Book. Verlag Dr. Albert Bartens KG-Berlin. Supplement 2003. ISBN 3-87040-550-0.
ICUMSA. (1994). Method GS1/3/4/7/8-13: The Determination of Conductivity Ash in Ra
Sugar, Brown Sugar, Juice, Syrup and Molasses - Official. ICUMSA Methods Book. Verlag
Dr. Albert Bartens KG-Berlin. Supplement 2003. ISBN 3-87040-550-0.
Rein, P. (2007). Cane Sugar Engineering. Verlag Dr. Albert Bartens KG-Berlin. ISBN 978-3-
87040-110-8. pp. 459.
Saska, M., Goudeau, S. and Andrews, L. (1999). Molasses Exhaustion and Target Purity
Formulas. Sug. J. 62. pp. 7, 20-24.
Saska, M., Goudeau, S. and Beyene, F. (2010). Exhaustibility of Louisiana Final Molasses
and the Target Purity Formula: The 2009-2010 Season Results. Ann. Meet. Am. Soc. Sug.
Cane Technol. La. Div. Hilton Lafayette, Feb. 1-3.
38
BIOFUELS UPDATE
D. F. Day
In 2011 the LSU AgCenter was awarded an AFRI-Cap Grant for $17.5 million. This is a multi-
state, multi-disciplinary grant with a goal of expanding the Southern Regional Agricultural
Sector by utilization of sweet sorghum and energy cane to produce butanol, gasoline, isoprene
and by-product chemicals. This multidisciplinary regional consortium of agricultural scientists,
biotechnologists, technology and engineering companies, economists and educators will address
multiple aspects associated with conversion of energy cane and sweet sorghum into a portfolio of
bio-based fuels and chemicals. LSU plans to use energy cane and sorghum to help reinvigorate
the Louisiana sugar and chemical industry through new and existing industrial partnerships.
Improving biomass cold tolerance and production characteristics can produce a steady stream of
biomass to be converted to economically viable sugars using existing Louisiana refinery
infrastructure. If successful, the project will contribute significantly to improving rural
prosperity and job creation in the region.
PROJECT OBJECTIVES
• Evaluation of selected energy cane and sweet sorghum crops and improvement in their
production through utilization of low-input, sustainable systems to ensure an
uninterrupted supply of carbohydrates and fiber to biofuel production facilities.
• Utilization of existing pilot and industrial facilities, incorporating multiple crops and
cutting edge processing technologies to demonstrate butanol, gasoline, isoprene and
specialty chemicals.
• Development of regionally appropriate business-marketing models that integrate bio-
based fuels and products into existing logistics and supply chain infrastructures based on
inputs from agricultural research and techno-economic analyses.
• Expansion of educational programs at the consortium universities to support a practical
training center in biofuel processing linked to an extension/outreach program targeting
supply chain participants.
39
The Sustainable Bioproducts Initiative (SUBI) at the LSU AgCenter is working to expand the
Southern Regional Agricultural Sector through the utilization of sweet sorghum and energy cane
crops for the manufacture of bio-based fuels and by-products. SUBI is a regional,
multidisciplinary consortium of agricultural scientists, biotechnologists, technology and
engineering providers, economists and educators that facilitate the development of regional crops
into a portfolio of bio-based fuels and chemicals. The project examines the areas of bio-based
fuel and chemical production from feedstock development to conversion. The agricultural
economics group examines production costs and economic viability of the proposed processes.
An education group seeks to develop educational opportunities in the bioenergy field for students
at several regional universities and beyond. The extension team plans, organizes and executes
events that reach out to stakeholders at all levels to turn research results into actual business
development.
FIRST YEAR PROGRESS BY TASK
Feedstock Development for energy cane has the objectives of optimizing yields, expanding
diversity and range of cultivation and reducing inputs through breeding. Cross pollination was
achieved between energycane and miscanthus. These crosses are now being evaluated for cold
tolerance. The goal is to extend the range for energycane to allow it to be grown as far north as
Arkansas. Both in order to speed up breeding analysis and develop it as a use for biomass crops
Near Infra-red Spectrometry (NIR) is being calibrated for sweet sorghum and energy cane and
analysis being expanded outside the traditional brix and sucrose to include invert, cellulose and
hemicellulose. Preliminary calibrations have been obtained for these parameters for sweet
sorghum and are progressing on energy cane, but will require many iterations to establish
reliable databases.
Sustainable Feedstock Production focuses on production of sweet sorghum and energy cane as
feedstocks for the biorefinery. For energy cane, the enhancement of cold tolerance and
optimization of its production potential under temperate climate regimes are being studied. For
sweet sorghum, the input requirements, the evaluation of geographic zone of adaptation,
inclusive of its ability to maintain juice quality into the fall season, the ability to produce
commercial yields on marginal soil and respond to low-input sustainable production practices are
being addressed. The baseline soil nutrient information gained from year one pre-treatment
sampling will identify any pre-treatment biases and serve as a basis for observing changes in soil
fertility and carbon resulting from establishment and management of these sugarcane cropping
systems. Four sweet sorghum plots established across state produced yields ranging from 17-38
wet ton/acre. N and P soil content measured. Ceres Corporation agreed to supply cold tolerant
varieties for testing.

40
Logistics and Pre-Processing involves with the assessment of harvesting biomass, transportation
to the plant, storage, treatment by milling or diffusion and bagasse drying for future usage.
Experiments have been planned to determine the harvest losses and leaf matter distribution of
each of these crops with two types of harvesters. Harvesting trials have been pre-planned in
collaboration with John Deere and harvester modifications are being made for sweet sorghum.
Protocols for the trials allow for the evaluation of losses of simple sugars during harvesting,
transportation and pre-processing storage. Literature has been prepared on bagasse storage
methods. The bagasse will be required to supply power to the biorefinery during the off season.
Work continued with our industrial partners to develop a use of industrial dryers for bagasse to
provide energy efficient solutions for a variety of biomass processing applications.
Fractionation (milling) of sweet sorghum and energy cane samples have been conducted to
determine the amount of simple vs. complex (bagasse) sugars from each crop as well as the
particle size distribution of stored bagasse. Our operational concept requires year round
operation of a primary processing plant operated that produces fermentable sugars that can act as
a shippable feedstock for centralized biorefineries. The primary processing facilities of necessity
will be biomass (bagasse) powered. A model has been developed based on SUGARS TM
software that allows calculation of heat and material balance for the primary processing plants
and estimates the required internal power generation and residual bagasse that can be used either
for power generation or as a source of additional sugars.

41
Feedstock Conversion and Refining Part of the task is to produce sufficient quantities of test
syrups, in a scalable manner for our industrial partners to develop their processes. The pilot plant
area for processing experimental lots of energy cane and sweet sorghum has been expanded to
accommodate new equipment designed for simulating a primary processing plant and produce
stable sugar syrups for future processing. A new facility capable of 1 ton/hr processing has been
completed. It is shown in comparison with the “old” Audubon facility that was on campus. This
will be used to produce syrups from the test feedstocks for our industrial partners to try in their
facilities. On site work for bioconversion has focused on ammonia pretreatment for
lignocellulosic biomass. This process has been optimized. Work with an industrial partner
(Optinol) has led to development of a continuous butanol production column around which they
are developing a process.
42
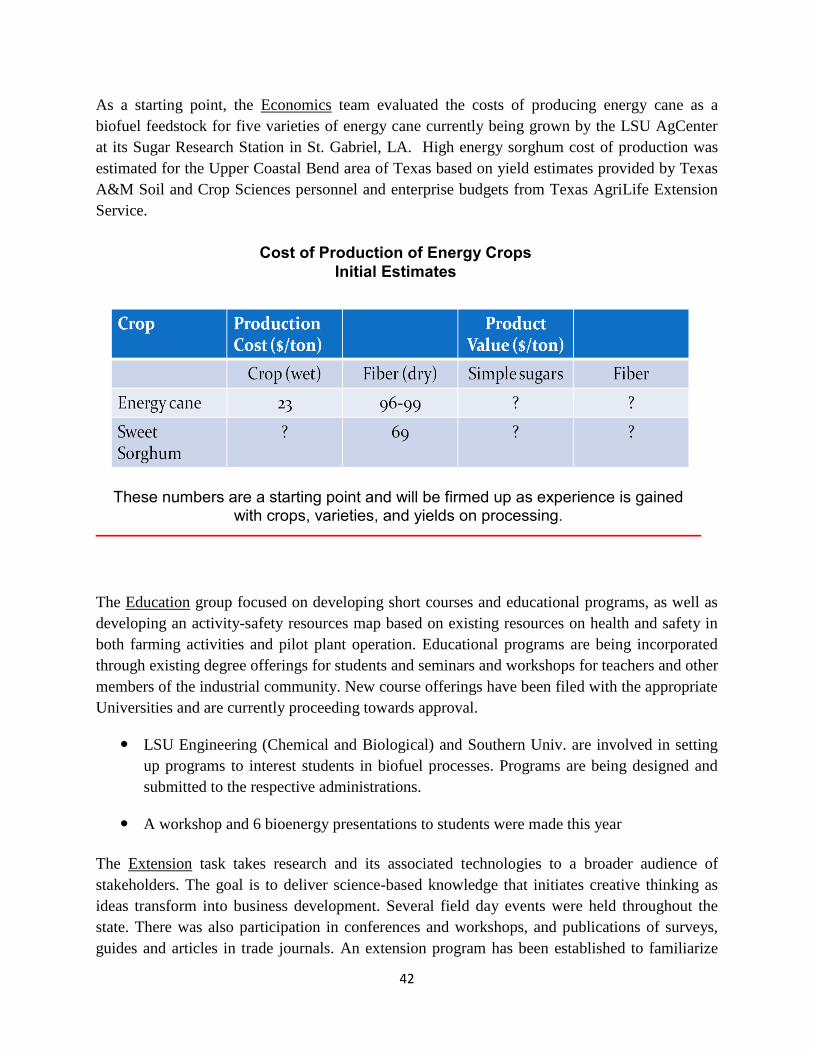
As a starting point, the Economics team evaluated the costs of producing energy cane as a
biofuel feedstock for five varieties of energy cane currently being grown by the LSU AgCenter
at its Sugar Research Station in St. Gabriel, LA. High energy sorghum cost of production was
estimated for the Upper Coastal Bend area of Texas based on yield estimates provided by Texas
A&M Soil and Crop Sciences personnel and enterprise budgets from Texas AgriLife Extension
Service.
The Education group focused on developing short courses and educational programs, as well as
developing an activity-safety resources map based on existing resources on health and safety in
both farming activities and pilot plant operation. Educational programs are being incorporated
through existing degree offerings for students and seminars and workshops for teachers and other
members of the industrial community. New course offerings have been filed with the appropriate
Universities and are currently proceeding towards approval.
LSU Engineering (Chemical and Biological) and Southern Univ. are involved in setting
up programs to interest students in biofuel processes. Programs are being designed and
submitted to the respective administrations.
A workshop and 6 bioenergy presentations to students were made this year
The Extension task takes research and its associated technologies to a broader audience of
stakeholders. The goal is to deliver science-based knowledge that initiates creative thinking as
ideas transform into business development. Several field day events were held throughout the
state. There was also participation in conferences and workshops, and publications of surveys,
guides and articles in trade journals. An extension program has been established to familiarize
Cost of Production of Energy Crops
Initial Estimates
These numbers are a starting point and will be firmed up as experience is gained with crops, varieties, and yields on processing.

43
farmers with these crops and an education program is being established for training people for
work in the biofuels industry.
A National energy cane/sweet sorghum field day was held at the USDA- Houma station.
A guide to identification of energy cane varieties was prepared and distributed.
A survey was conducted of growers about their feelings toward growing crops for biofuel
production.
The first year has seen the determination that sweet sorghum and energy cane are suitable crops
for the production of biofuel and bio-based chemicals in the Southeastern Region, and that the
approach of using crops with staggered harvest times is feasible. A pilot plant facility was
constructed and should be ready on schedule. Plant breeding programs have made a number of
successful crosses which are being evaluated for cold tolerance and range. Preliminary economic
analysis has been conducted on the proposed crops and information is being obtained for life
cycle analysis. Education programs are being established and research on product utilization is
proceeding on schedule
So what will constitute success of this program? A successful program will provide new crops
that can be produced sustainably in this region and the technology for converting them locally to
fermentable sugars, that in turn, can be used in centralized biofuel production facilities.