Embed Size (px)
Citation preview
NSWC T 36-26
CFILE CON
GAL ANIC CORROSION OF At17075-T6 AND STEEL-4340COUP)LED TO BRASS QQ-B-626,360 AND AI-7075-T6COUPLED TO STEEL-4130 AND STEEL-4340: EXPOSURE
'" TO AQUEOUS NaCI AND SALT-FOG ENVIRONMENTS
BY J F. McINTYRE S. M. HOOVER K. A. MUSSELMAN
RESEARCH AND TECHNOLOGY DEPARTMENT
30OJUNE 1986 L)t"ic
ApprovedA fc. public release; distribution is unlimited.
tS," NAVAL SURFACE WEAPONS CENTER
Dahigren, Virginia 22448-5000 S Silver Spring, Maryland 20903-5000
BestAvil Cle opy 4 5 102
UNCLASSIFIEDSECURITY CLASSIFICATION OF THIS PArE
REPORT DOCUMENTATION PAGEIa. REPORT SECURITY CLASSIFICATION lb RESTRICTIVE MARKINGS
Unclassified
2a. SECURITY CLASSIFICATION AUTHORITY 3. DISTRIBUTION/AVAILABILITY OF REPORT
Approved for public release; distribution2b. DECLASSIFICATION I DOWNGRADING SCHEDULE is unlimited.
4. PERFORMING ORGANIZATION REPORT NUMBER(S) 5. MONITORING ORGANIZATION REPORT NUMBER(S)
NSWC TR 86-26
6.. NAME OF PERFORMING ORGANIZATION 6b. OFFICE SYMBOL 7a. NAME OF MONITORING ORGANIZATIONNaval Surface Weapons Center (if appikable)
I R33
6c. ADDRESS (City, State, and ZIP Code) 7b. ADDRESS (City, State, and ZIP Code)10901 New Hampshire Ave
Silver Spring, MD 20903-5000
11. TITLE (Includa Security Classuficatioi Galvanic orrosion of Al-7075-T6 and Steel-4340 Coupled t
Brass QQ-B-626, 360 and Al-7075-T Coupled to Steel-4130 and Steel-4340; Exposure to
12. PERSONAL AUTHOR(S)McIntyre, J.F. (R33), Hoover, S.4 (R32), and Musselman, K.A. (R35)
13a, TYPE OF REPORT 13b TIME COVERoe 14. DATE OF REPORT (Year,Month,Day) 1S PAGE COUNTTechnical Review FROMPE TO_ -866/30 1 59
16, SUPPLEMENTARY NOTATION
17. COSATI CODES IM.UBIECT TERMS (Continue on reverse if necessary and identif~y by block number)FIELD GROUP SUB-GROUP Galvanic Corrosion, Polarization Resistance, Cathode,%
01 Anode, Salt-Fog, Cathodic Polarization, Zero-Impedance
studies on the corrosion behavior of four galvanic couples is discussed; the four couples
include: Al-7075-T6/Brass QQ-B-626, 360, Al-7075-T6/Steel-4340, Al-7075-T6/Steel-4l30, and
Steel-4340/Brass QQ-B-626, 360. Test samples were exposed to aqueous 3.5% NaC and to a
salt-fog environment. A measurement of the galvanic current generated for each coupletested was used to determine the magnitude of galvanic interaction. Results indicated thatthe corrosion rate of Al-7075-T6 was significantly accelerated when galvanically coupled" tobrass or the steel samples. In addition, it was discovered that Steel-4130 and Steel-440
corroded when coupled to A1-7075-T6, however, at a reduced rate when compared to the
uncoupled steel samples. In contrast, brass samples revealed no signs of corrosionAhencoupled to either Al-7075-T6 or Steel-4340. For the Steel-4340/Brass galvanic coople, itwas found that the corrosion rate of Steel-4340 was significantly increased whi the brass
sample remained unaffected. In addition to the discussion of experimental r ts, a
theoretical tretment relating galvanic currents to observed corrosion rate are presented
20. DISTRIBUTIONt/AVAILABILITY OF ABSTRATf 21. ABSTRACT SECURITY CLASSIFICATIONES UNCLASSIFIE 0/UNLIMITED 03 SAME AS i(*. 03 DTIC USERS UNCLASSIFIED .
22&. NAME OF RESPONSIBLE INDIVIDUAL 22b TELEPHONE (include Area Co7 -22c/ OFFICE SYMBOLJ. F. Mc-ntyre 10(202) 394-4115 R33
DD FORM 1473, 84 MAR 83f R edition moay be used until exhausted. SnRITY CLASSIFICATION OF THIS PAGEAll other editions are obsolete remae u*U.S. 0nditonoth susooepeieta re is, a 4120 2-LF-014-6602 UNCLASSIFIED
----- NA- O- -EPNIL -N)VD A - -'2 TE-H N I~ueAe od) FIESM O
NSWC TR 86-26
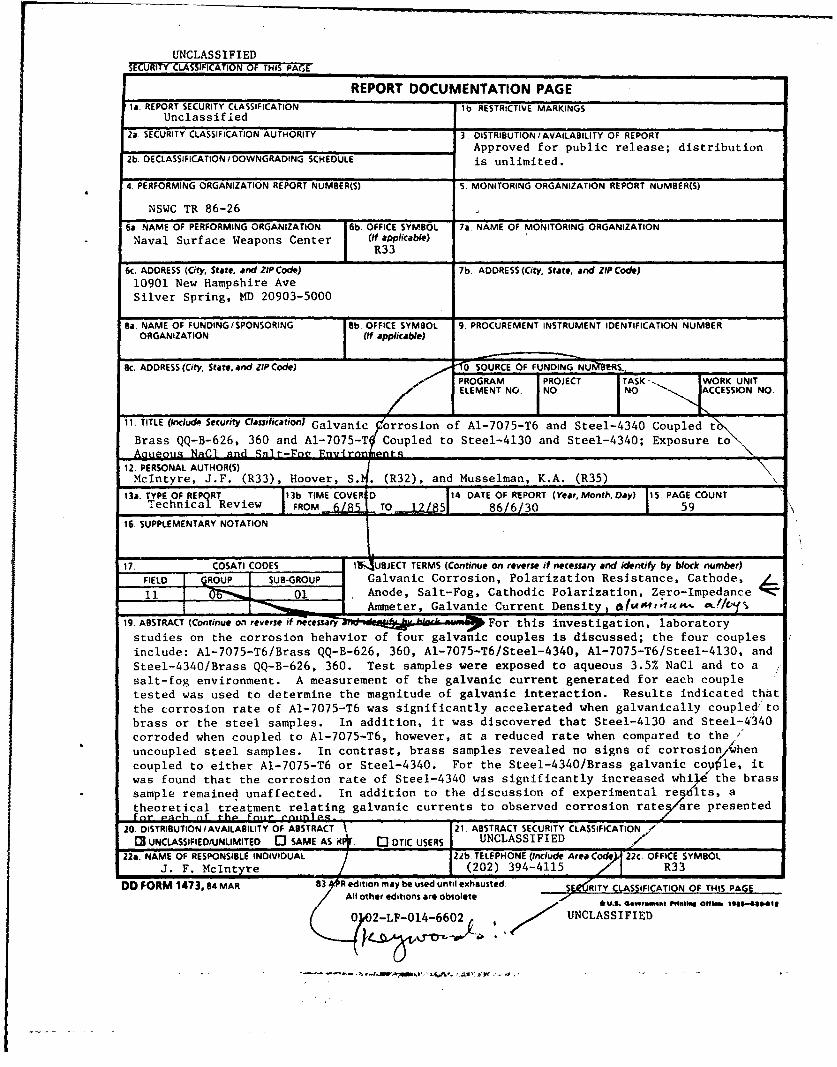
FOREWORD
Dissimilar metal corrosion is a persistent problem faced by the fleetbecause of the need to utilize a variety of different metals to constructcomplex structures as dictated by the increasing number of mechanical,metallurgical, and economical requirements. In light of these facts, it isimperative that laboratory testing be conducted in order to recognize potentialgalvanic problems in advance. This report is a compilation ol introductorygalvanic corrosion data obtained for several important metallic couples exposedto aggressive NaCI environments.
The potential risks of galvanic corrosion are particularly significant to
NAVY concerns, especially when dissimilar metals are employed in critical weaponsystems; therefore, this preliminary research was initiated to predict andestablish the galvanic corrosion behavior associated with the following metals:
Al-7075-T6, Steel-4130, Steel 4340, arid Brass QQ-B-626,360. The researchactivities reported herewithin are a first in a series of reports to bepublished on the galvanic corrosiou behavior of critical materials essential tuthe integrity of selected weapon sytems.
Approved by:
L..
pJCK R. DIXON, HeadMaterials Division
Accesior ForNTIS CRAMI
DT IC TABU aC1u d [U. 111 louf 'etd
y. ...................... ....DI t ib .Aio. :
Avabkibilily Codes
o * Avil :C1orit/
NSWC TR 86-26
CONTENTS
Chapter Page
I INTRODUCTION . . . . . . . . . . . .. . . 1
2 EXPERIMENTAL . . . . . . . . . ................. 5MATERIALS........................... 5TEST METHODS * ..... .............. .. 5
3 RESULTS AND DISCUSSION,.......................11
CORROSION RATES OF UNCOUPLED SAMPLES ... . . . 11
GALVANIC CURRENT MEASUREMENTS ... . . . . . .. ... . . 11EFFECT OF SURFACE AREA RATIO ................... 17CORROSION RATES FOR GALVANIC COUPLES. .............. 17CATHODIC POLARIZATION .............................. 22GALVANIC COUPLE EQUILIBRIUM POTENTIAL ..... ............... 22SALT-FOG TESTING......... . . . . . . . . ........ 25GALVANIC COUPLE BEHAVIOR . . . . . . . . . . . . . . . . ... 25UNCOUPLED METAL BEHAVIOR ........................ ..... 29
4 THEORETICAL RELATIONSHIP BETWEEN GALVANIC CURRENT ANDCORROSION RATE ................................ 36AI-7075-T6/BRASS GALVANIC COUPLE ... . . . . . ... ... 41STEEL-4340/BRASS GALVANIC COUPLE ................ 41A1-7075-T6/STEEL 4130 AND Al-7075-T6/STEEL-4340
GALVANIC COUPLES . ........ . . . . . . . 42CORROSION RATES FOR GALVANIC COUPLES . . . . .. ....... 43
5 CONCLUSIONS ............ ............................ 46
REFERENCES . . . . . . ...... . . . . . . . . . . . . . . . 49
DISTRIBUTION . . . . . . . . . . . . . . . . . . . . . . . . . . . (1)
NSWC TR 86-26
ILLUSTRATIONS
Figure Page
I ELECTROCHEMICAL CORROSION TESTING CELLS ....... .............. 6
2 POLARIZATION RESISTANCE PLOT ....... ................. .. 8
3 PHOTOGRAPHS OF GALVANIC COUPLES PRIOR TO SALT-FOG EXPOSURE . . .. 9
4 PHOTOGRAPHS OF GALVANIC COUPLES PRIOR TO SALT-FOG EXPOSURE . . .. 10
5 PLOT OF GALVANIC CURRENT AGAINST TIME FOR Al-7075-T6/
BRASS COUPLE EXPOSED TO 3.5X NaCI FOR 24 HOURS .. ......... .. 13
6 PLOT OF GALVANIC CURRENT AGAINST TIME FOR A1-7075-T6/STEEL-4340 COUPLE EXPOSED TO 3.5% NaCI FOR 24 HOURS ......... ... 13
7 PLOT OF GALVANIC CURRENT AGAINST TIME FOR STEEL-4340/
BRASS COUPLE EXPOSED TO 3.5% NaCl FOR 24 HOURS .. ......... .. 14
8 PLOT OF GALVANIC CURRENT AGAINST TIME FOR AI-7075-T6/STEEL-4340 COUPLE EXPOSED TO 3.5% NaCi FOR 20 HOURS ......... ... 14
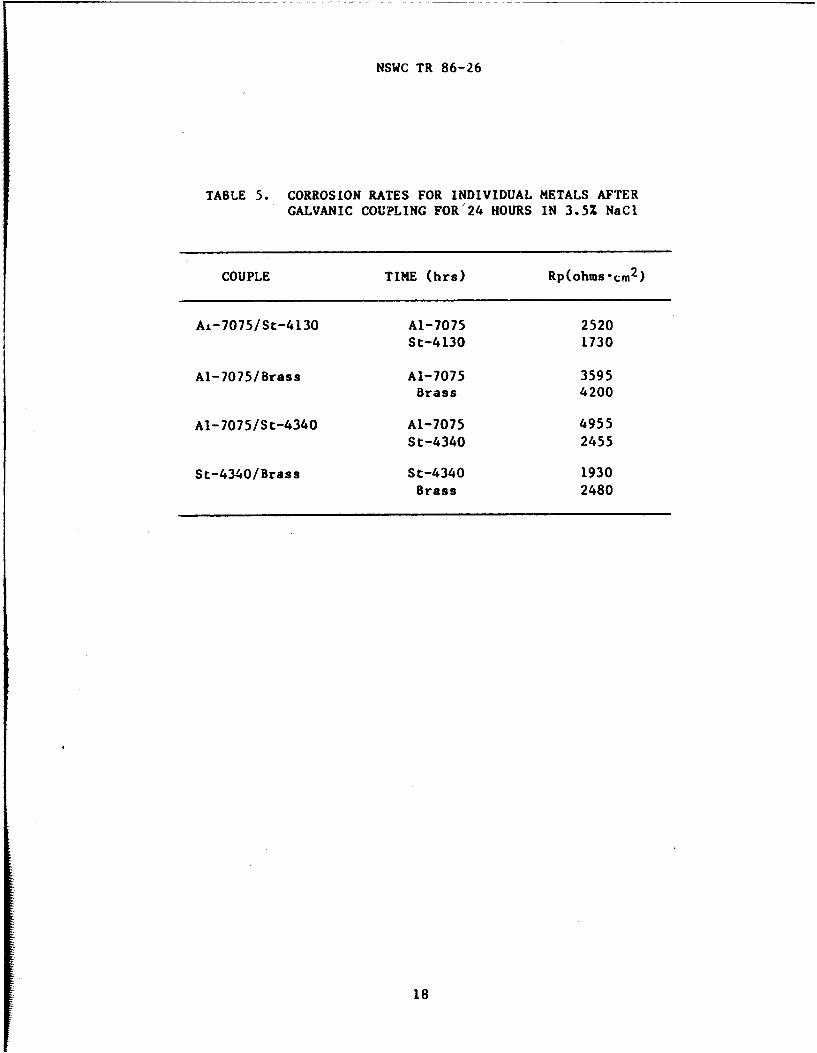
9 POLARIZATION RESISTANCE PLOT FOR Al-7075-T6 AFTER
GALVANIC COUPLING TO STEEL-4130 ...... ................. ... 19
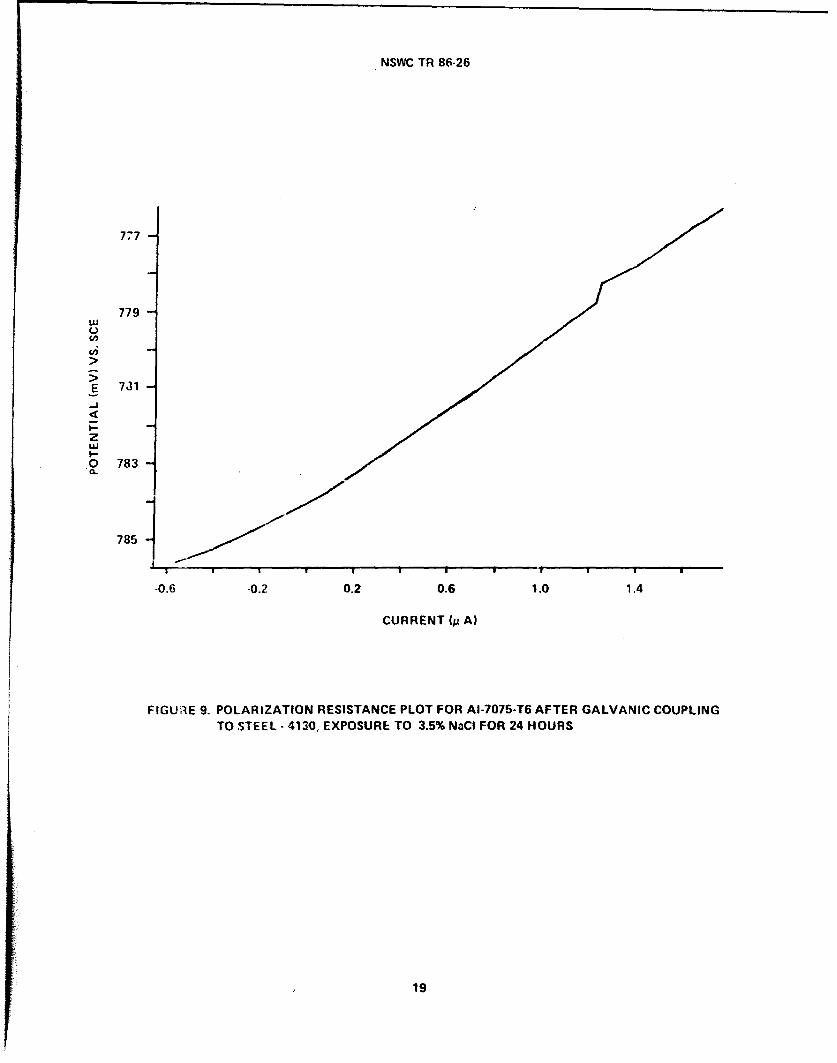
10 POLARIZATION RESISTANCE PLOT FOR BRASS AFTER GALVANIC
COUPLING TO AI-7075-T6 ................. . . . ........ 20
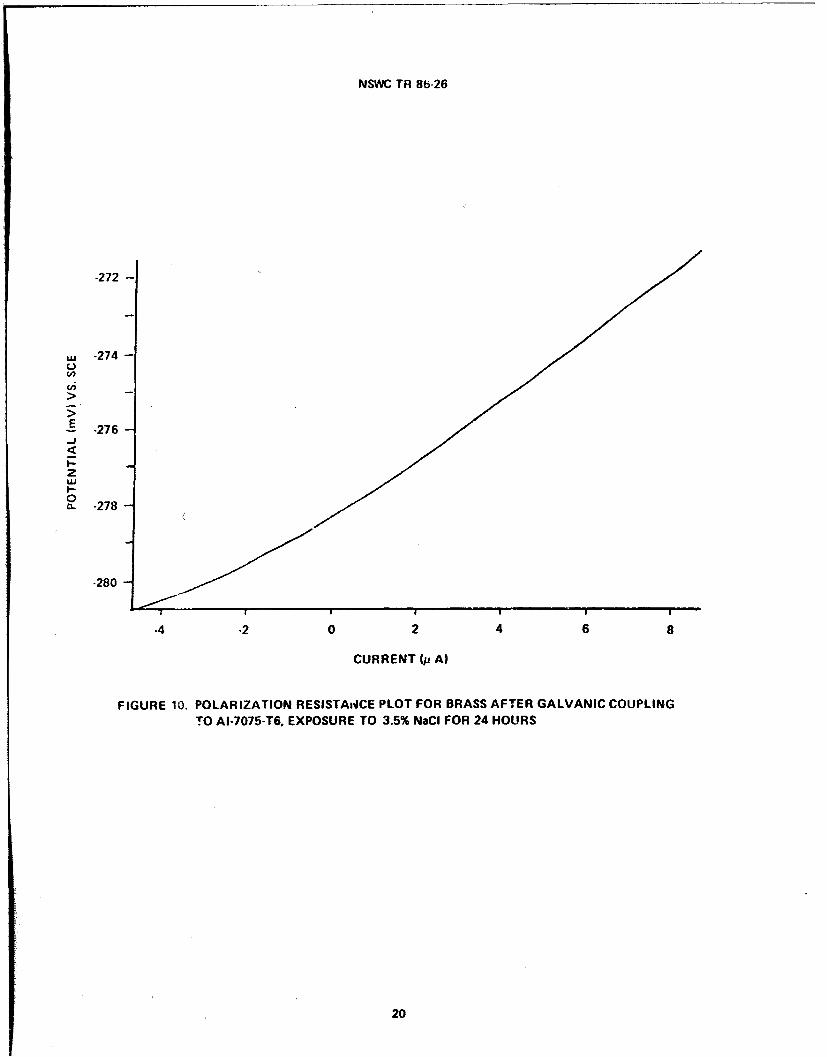
11 POLARIZATION RESISTANCE PLOT FOR STEEL-4130 AFTER
GALVANIC COUPLING TO A-7075-T6 ...... ................. ... 21
12 CATHODIC POLARIZATION CURVES FOR UNCOUPLED SAMPLESEXPOSED TO 3.5% NaCI ...................... 23
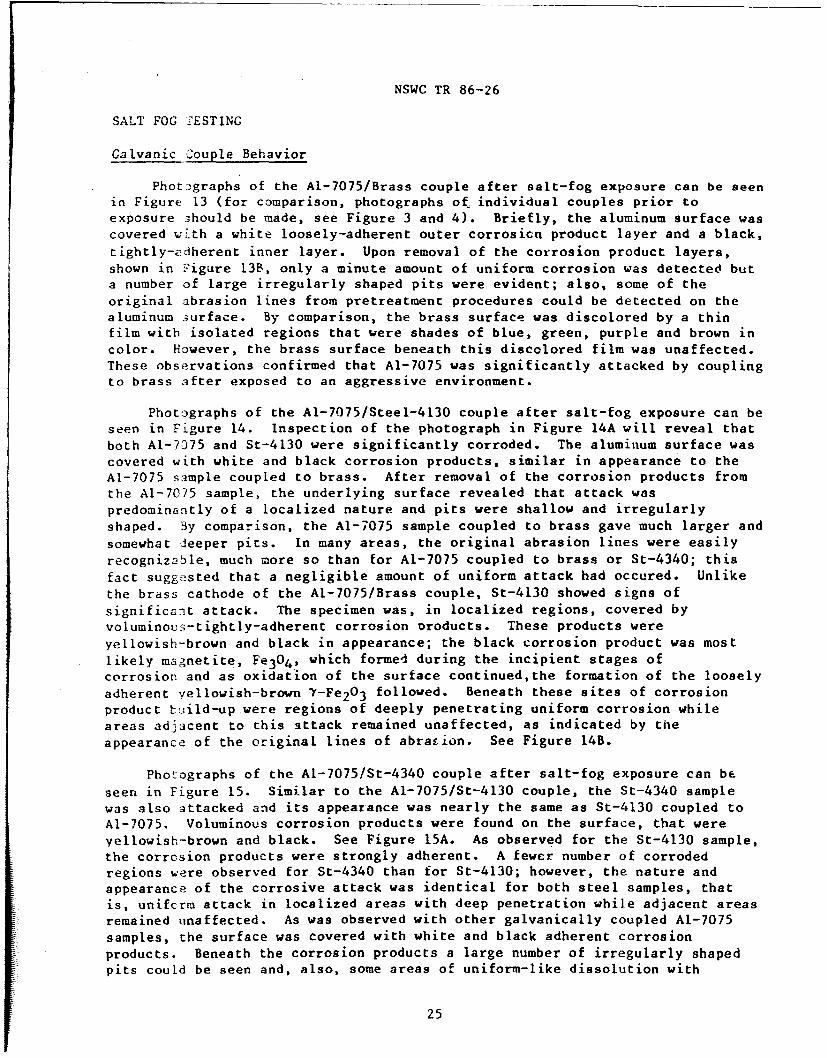
13 PHOTOGRAPHS OF A1-7075-T6/BRASS GALVANIC COUPLE AFTEREXPOSURE TO A SALT-FOG ENVIRONMENT FOR 96 HOURS .. ......... ... 26
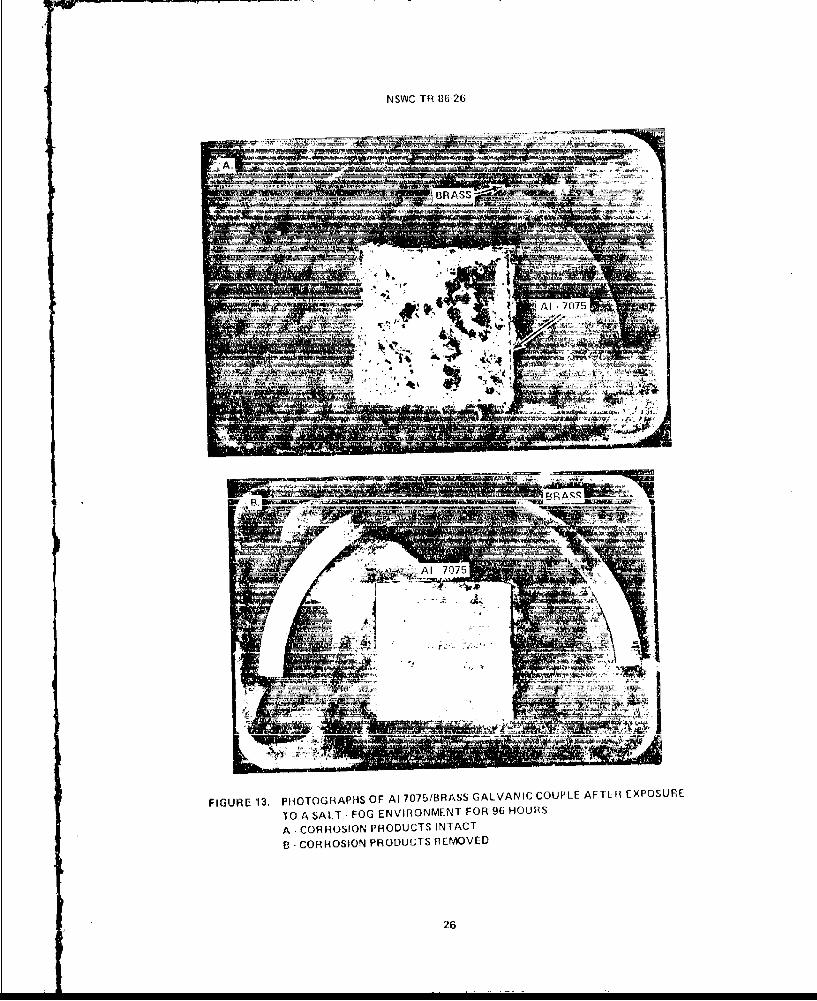
14 PHOTOGRAPHS OF A1-7075-T6/STEEL-4130 GALVANIC COUPLE AFTER
EXPOSURE TO A SALT-FOG ENVIRONMENT FOR 96 HOURS . . . . . . . . . 27
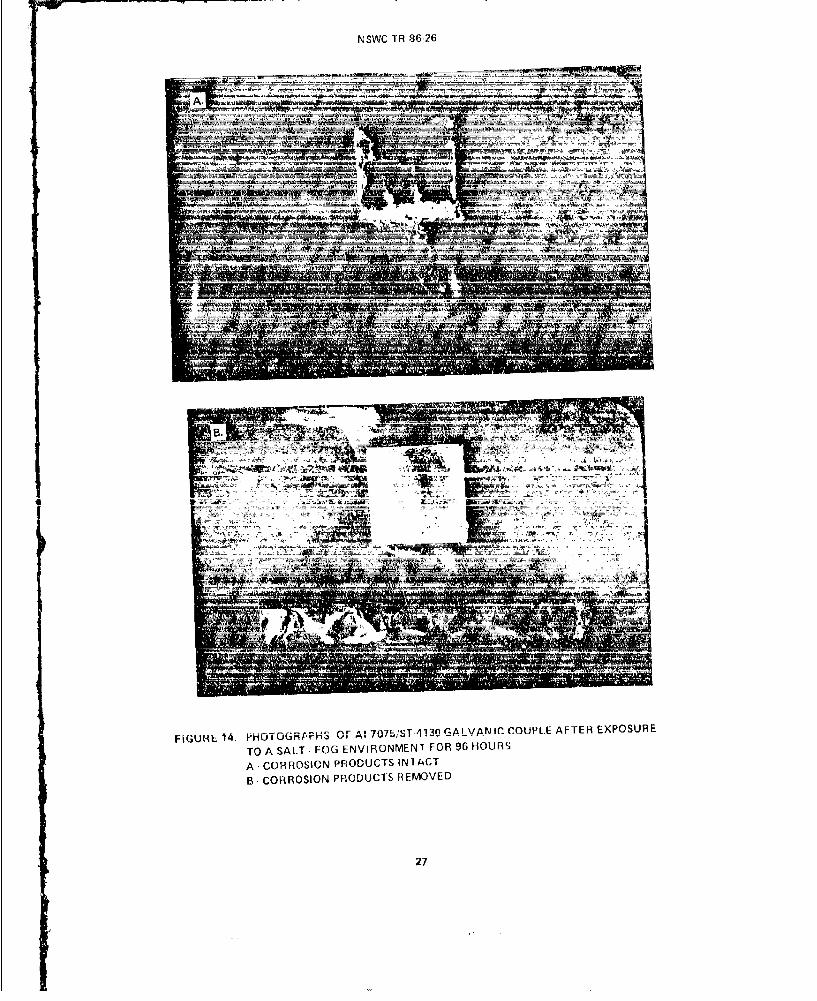
15 PHOTOGRAPHS OF Al-7075-T6/STEEL-4340 GALVANIC COUPLEAFTER EXPOSURE TO A SALT-FOG ENVIRONMENT FOR 96 HOURS . . . . . . 28
16 PHOTOGRAPHS OF STEEL-4340/BRASS GALVANIC COUPLE AFTEREXPOSURE TO A SALT-FOG ENVIRONMENT FOR 96 HOURS . . . . . . . . . 30
iii
NSWC TR 86-26
ILLUSTRATIONS (Cont.)
Figure Pg
17 PHOTOGRAPHS OF AI-7075-T6 EXPOSED TO A SALT-FOGENVIRONMENT FOR 96 HOURS ....... ..................... . 31
18 PHOTOGRAPHS OF BRASS EXPOSED TO A SALT-FOGENVIRONMENT FOR 96 HOURS . . . ............ . . . . .32
19 PHOTOGRAPHS OF STEEL-4340 EXPOSED TO A SALT-FOG
ENVIRONMENT FOR 96 HOURS .................... 33
20 PHOTOGRAPHS OF STEEL-4130 EXPOSED TO A SALT-FOG
ENVIRONMENT FOR 96 HOURS .... ...................... 35
iv
NSWC TR 86-26
TABLES
Table Page
I GALVANIC SERIES ............ .. .......................... 3
2 CORROSION RATES, REPORTED AS POLARIZATION RESISTANCE VALUES,
FOR UNCOUPLED METALS EXPOSED TO 3.5% NaCI ... ............ 12
GALVANIC CURRENT DENSITIES FOR DIFFERENT CATHODE ANODE AREAPUIrIos FOR VARIOUS TIMES OF EXPOSURE TO 3.5% NaC] .. .. .. .. 15
4 EQUILIBRIUM CORROSION POTENTIALS FOR UNCOUPLED SAMPLES
EYIPOSED TO 3.5% NaCl ......... ...................... 16
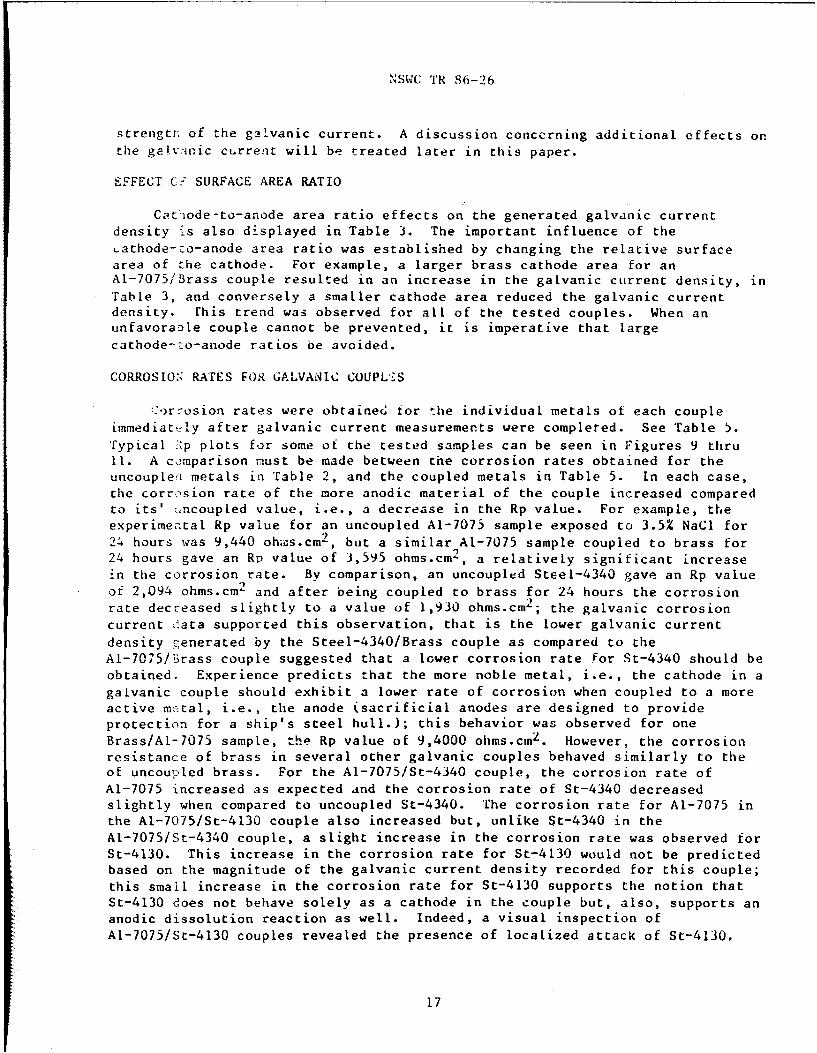
5 CORROSION RATES FOR INDIVIDUAL METALS AFTER GALVANIC
COUPLING FOR 24 HOURS IN 3.5% NaCl ..... .............. 18
6 COMPARISON OF THE INITIAL GALVANIC CURRENT DENSITY WITH
CURRENT DENSITY AT THE INTERSECTION OF THE CATHODICPOLARIZATION CURVE OF THE CATHODE AND THE ANODIC
POLARIZATION CURVE OF THE ANODE ....... ................ 24
7 ANODIC TAFEL CONSTANTS AND CORROSION CURRENT DENSITIES
FOR UNCOUPLED AI-7075-T6, STEEL-4130, AND STEEL-4340,EXPOSED TO 3.5% NaC. ......... ..................... 39
8 CATHODIC LIMITING DIFFUSION CURRENT DENSITY FOR UNCOUPLEDMETAL SAMPLES AND MEASURED GALVANIC CURRENT DENSITIES
FOR SEVERAL COUPLES .......... ....................... 40
9 SUMMARY OF GALVANIC CORROSION DATA ...... ................ 45
v/vi
NSWC TR 86-26
Chapter 1
INTRODUCTION
The corrosion of metals can be described as a step-wise interaction of
events involving chemical, electrical, and physical processes occurring at theinterface between a metal and its environment. Common to all corrosionmechanisms is the occurrence of Zwo distinct reactions involving oxidaLion andreduction processes. In general, these reactions take place at specific anodicand cathodic sites on the metal surface. Metal atoms are oxidized to metalions at anodic sites liberating electrons. These electrons migrate, i.e.
electrical interaction, to cathodic sites where they are consumed by the speciesbeing reduced.
A potentially dangerous situation may occur when two metals with different
electrochemical reactivities are physicslly joined. Corrosion involvingdissimilar metals in contact is known as galvanic or bimetallic corrosion. Most
galvanic corrosion is unwanted and often unexpected. For example, a shipconstructed of nickel alloy and steel rivets becomes unseaworthy because thesteel rivets are active and preferentially corrode at a high rate. Thehot-water tank in your home can be trouble.some if a steel tank is connected to
copper tubing.
Dissimilar metal corrosion is a persistent problem faced by design
engineers because of the need to utilize a variety of different metals toconstruct complex structures as dictated by the large number of mechanical,
metallurgical, and economical requirements. Care must be exercised when makingmaterial selection, however, proper testing of candidate materials shouldrecognize problem areas in advance.
When two dissimilar metals are placed in :he same environment, a potential
difference develops. When electrical contact is made between the two metals, a
current flows; the direction of current flow is dependent on the metal'selectrochemical activity in that environment and, in general, can be predicted
using the measured corrosion potentials of the Lncoupled metals. A metalexhibiting a more active corrosion potential, i.e., the more negative value,should act as the anode and the direction of current flow will be from the anodeto the cathode, i.e., the metal with the more poiitive or noble corrosionpotential. Corrosion of the more active metal will be significantly increased
and attack at the more noble metal will be decreaaed, as compared to theiruncoupled behavior. In order to prevent galvanic Corrosion, the potentialdifference between two metals in contact must be nade small or one of the metalsmust be electrically insulated.
Initially the standard reduction potential table was used to predict which
metal of an electrically or physically connected couple would act as the anodeor the cathode. This approach turns out to be dangerous and often incorrect.
NSWC TR 86-26
These potentials are measured against the standard hydrogen electrode in aqueous
solutions of unit activity of the metal of interest and this is not
representative of typically encountered environments; in addition, the behavior
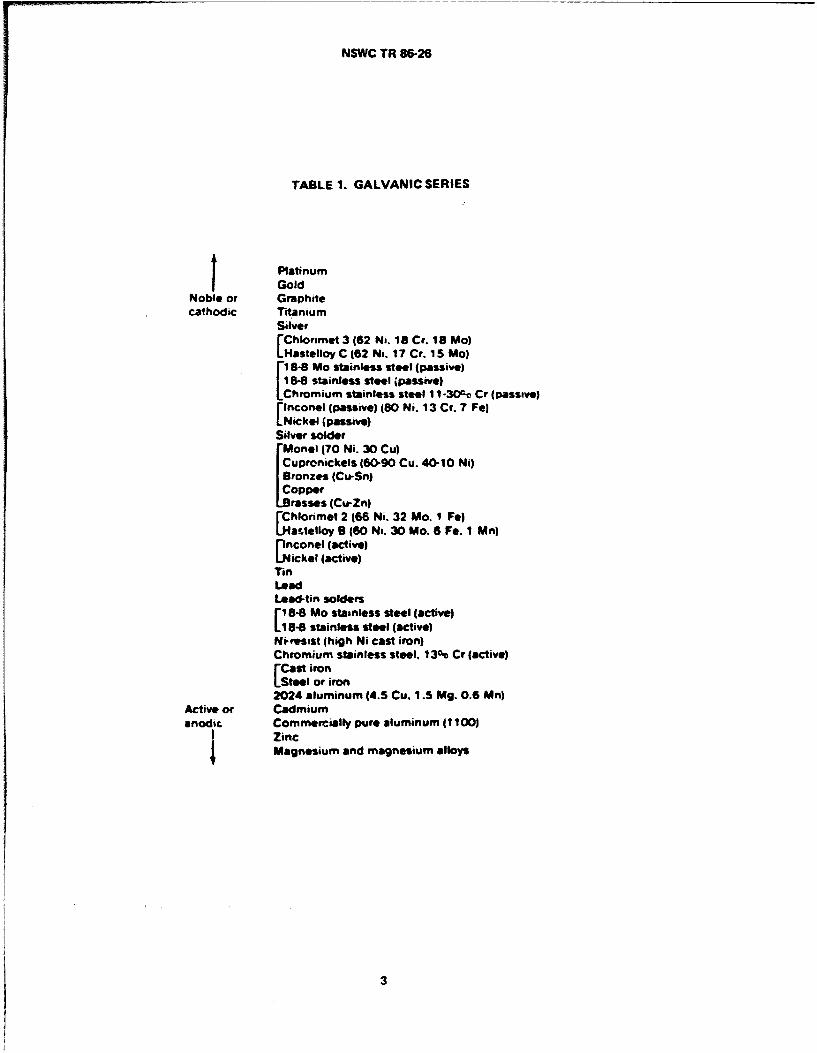
of alloys cannot be predicted using this table. A number of investigators haveassembled and constructed tables that predict the galvanic corrosion tendenciesof commonly used metals and alloys. One such galvanic series was constructed byThe International Nickel Company at Harbor Island, N.C., and is based onpotential measurements and corrosion tests in seawater. This series isreproduced in Table 1 where the relative positions of the metals are used rather
than their potentials and brackets are used to designate those metals which aresimilar in base composition and behavior. When metals within a given bracketare coupled, there is little chance of significant galvanic corrosionoccurring. This table and others like it only apply to the specific environmentin which the test data is collected and the position of a metal or alloy orgroups of metals or alloys may change as the env1 ronment changes. Ideally it
would be advantageous to construct galvanic tables for all possible combinationsof metal and/or alloy couples and their environments. Obviously this would
prove to be quite tedious and impractical; therefore, individual tests need to
be made on the inetal or alloy of choice in the environment of interest.
In order to effectively estimate the race of galvanic corrosion, the
current produced by galvanic action must be monitored. A large sustained
galvanic current suggests that significant corrosion will take place. Equallyfeasible is the occurrence of an initially high current which rapidly decreased
with time because of the accumulation of adherent corrosion products on theanode. In this case, a low rate of galvanic corrosion is likely. This
observation strongly indicates that galvanic couples must be monitored over anextended period of time. Mansfeld and Kenkel (1) and Baboian (2) review the
experimental techniques which can be used to follow galvanic corrosion currentswith time.
Another factor which influences the extent to which galvanic corrosion
occurs involves the polarizability of the metal cathode of the couple. A highly
efficient cathode will produce high cathodic currents serving to drive the
anodic reaction, i.e., an increase In the anodic dissolution raLe. rut cxample,
titanium Is a higily noble metal even when exposed to seawater and whel coupled
to a less corrosion resistant metal or alloy, one would intuitively expect that
rapid attack would occur; this is not the case, the corrosion rate is lowbecause titanium :is a poor catalyst for the cathodic reduction of oxygen.
Galvanic corrosion occurs in the immediate vicinity of the couple where the
galvanic currents are the strongest. As a general rule of thumb, the severity
of galvanic corrosion decreases as the distance from the coupled area
increases. Unfortunately galvanic influence in local areas can producecatastrophic resuts e.g., sudden failure of joined parts, leading to the loss
of structural integrity.
The cathode-to-anode area ratio of coupled metals strongly influences the
rate of galvanic :orrosion and requires careful consideration. For example, if
two steel panels are joined by copper rivets and exposed to seawater, the steelpanels will corrode, however, the bond between the two panels will remainintact. Copper Is more noble than steel and, therefore, acts as the cathode.
The generated arcdic current at the steel anode is distributed over a large area
2
NSWC TR 86-26
TABLE 1. GALVANIC SERIES
Platinumt GoldNoble or Graphitecathodic Titanium
Silver[Chlonmet 3 (82 Ni. 18a Cr. 18a Mo)Hastelloy C (62 Ni. 17 Cr. 1 5 Mo)
r18.8a Mo stainless steel (passive)18-8 stainless steel jpassive)
LChromium stainless steel 11 -30%c Cr (passive)
[ Inconel (passive) (80 Ni. 13 Cr. 7 Fe)Nickel (passive)
Silver solderLMontal (70 Ni. 30 Cu)Cupronickels 1(090 Cu. 4Q-10 NQ)Bronzes (Cu-Sn)copper.rasses (Cu-Zn)Fhlonimft 2 (68 Ni. 32 Mo. I Fe)
Liatelloy B (60 Ni. 30 Mo. 6 Fe. 1 Mn)rinconel (active)
Lickel (active)in
LeadLead-tin soldersE1848 Mo stainless steel (active)118-8 stainless steel (active)
Nioresist (high Ni cast iron)Chromium stainless steel. 13% Cr (active)ECast iron[Steel or iron
2024 aluminum (4.5 Cu. 1.5 Mg. 0.6 Mn)Active or4Cadmiumanodic Commercially pure aluminum (I1100)
Zinc
Magnesium and magnesium alloys
3
NSWC TR 8o-26
., as a result, small anodic current densities are produced. This smallanodic current densizj Erenslates into small corrosion rates. On the otherhand, connecting two copper panels together with steel rivets causes rapiddeterioration of the stee: rivets because of the reduced anode area which mustnow sustain large curr.nt densities, thus, significant corrosion occurs and thebond between the copper plates fail.
Reboul (3) and Mansfeld et al. (4) provide excellent reviews on thegalvanic corrosion behavior of aluminum coupled to a large number of metals andalloys exposed to seawater and tap water. Mansfeld et al. (4) constructed atable rank-ordering 95 galvanic couples, where one metal of the couple was analuminum alloy; a general ranking can be given in dezreasing order of galvanic
current generated by each of the following meLals when coupled to an aluminumalloy: Ag >Cu >4130 steel >>stainless steel Ni >Inconel 718 >> i-6Al-4V -Haynes 188 >Sn >Cd. Mansfeld et al. (4) summarizes the behavior of aluminum
alloys as follows; AI 1100 is only compatible with Cd, Al 6061 only with Al7075, 2021", 2219, and Al 7075 is only compatible with other aluminum alloys andZn. In general, it is almost impossible to couple aluminum and its alloys toany other metal and expose it to seawater without protecting the structure bypainting or insulating the dissimilar metals from one another.
In summary, the magnitude of galvanic corrosion is dependent on thepotential difference between dissimilar metals, the kinetics of the individualanodic and cathodic reactions, the nature of the environment, i.e., highlyconductive solutions will produce large currents, and the cathode-to-anode arearatio. The measurement of corrosion potentials can only be used to predict thedirection ot galvanic current flow and in no way can it be used to predict theextent -f galvanic corrosion; continuous monitoring of galvanic currentsprovides the only reliable and accurate method of assessing the galvanic effect.
4
NSWC TR 36-26
Chapter 2
EXPERImENTAL
MATERIALS
Four alloys were investigated for this galvanic sti'dv. They include:
Aluminum 7075-T6, Steel-4340, Steel-4130, and Brass QQ-B-626, 360. The
following couples were investigated: Al-7075/Steel-4340, AI-70T5/Brass,
Al-7O75/Seel-4130, and Steel-4340/Brass. The Brass, Al-7075, and Steel-4340
samples were machined into cylindrical shapes having a uniform height of 0.625"
with three diameters: 0.3125", 0.375", and o.4375" and, because of
availability, disk shaped Steel 4130 samples were used in place of cylinders.
In an attempt to maintain identical conditions for the Al-7075/Steel couple,
Al-7075-Th samples were also machined into disks. Lead wires were attached to
these samples followed by cold-mounting in an acrylic polymer; the disk samples
had the following diameters: 0.750", 0.45", and 0.375". Prior to testing, the
samples were wet-polished from 180 through 600 grit SiC finisih. All specimens
were degrdased in acetone followed by a methanol rinse prior to exposure.
Solutions were prepared from reagent grade chemicals ana distilled water.
Corrosion and galvanic couple potentials are reported with respect to the
Saturated Calomel Electrode (SCE).
TEST METHODS
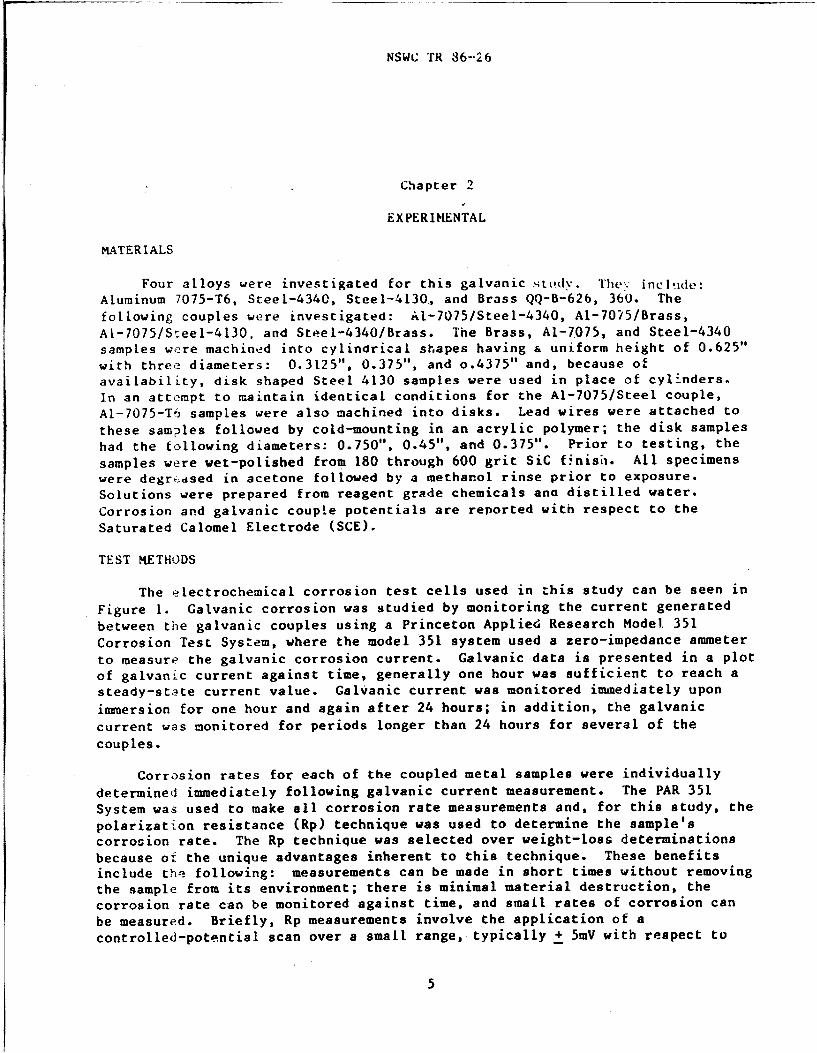
The electrochemical corrosion test cells used in this study can be seen in
Figure 1. Galvanic corrosion was studied by monitoring the current generated
between the galvanic couples using a Princeton Applied Research Model. 351
Corrosion Test System, where the model 351 system used a zero-impedance ammeter
to measure the galvanic corrosion current. Galvanic data is presented in a plot
of galvanic current against time, generally one hour was sufficient to reach asteady-state current value. Galvanic current was monitored immediately upon
immersion for one hour and again after 24 hours; in addition, the galvaniccurrent was monitored for periods longer than 24 hours for several of thecouples.
Corrosion rates for each of the coupled metal samples were individually
determined immediately following galvanic current measurement. The PAR 351System was used to make all corrosion rate measurements and, for this study, thepolarization resistance (Rp) technique was used to determine the sample'scorrosion rate. The Rp technique was selected over weight-loss determinationsbecause of the unique advantages inherent to this technique. These benefitsinclude the following: measurements can be made in short times without removing
the sample from its environment; there is minimal material destruction, the
corrosion rate can be monitored against time, and small rates of corrosion can
be measured. Briefly, Rp measurements involve the application of a
controlled-potential scan over a small range, typically + 5mV with respect to
5
NSWC TR 86-26
COUNTER ELECTRODES./\
F REFERENCE
WORKING ELECTRODE
ELECTRODE
I /'
REFERENCE
E'.ECTRODE
• GALVANIC COUPLES
A B
• FIGURE 1. ELECTROCHEMICAL CORROSION TESTING CELLS
A- ELECTROCHEMICAL CELL FOR Rp MEASUREMENT
B- GALVANIC CURRENT MEASUREMENT CELL
6
NSWC TR 8b-26
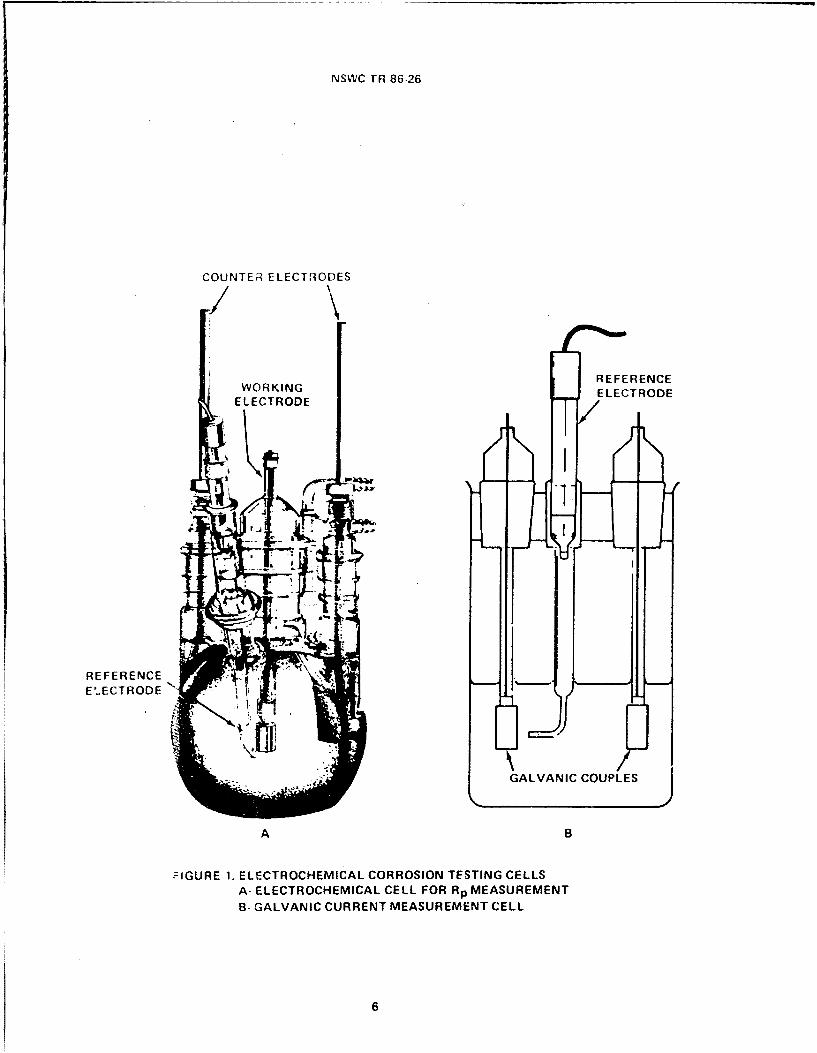
the corrosion potential. In this potential range the applied potential and
current are linearly related to a close approximation. The resultant current is
plotted against the applied potential and the slope of the straight line at the
potential. where the current passes through zero is equal to the polarization
resistance (See Figure 2). Measured Rp values are inversely proportional to the
corrosion current. See equation [11:
corr = -fafl (1)Rp 2.303(oa + 1c)
where icorr is the corrosion current, 1a is the anodic Tafel constant, and Oc
is the cathodic Tafel constant.
Cathodic polarization curves were obtained using a potentiodynamic
technique. All samples were equilibrated in a 3.5% NaCI for I hour prior to
measurement. The cathodic scan, at a rate of 0.5 mV/sec, was started at the
corrosion potential, Ecorr, and scanned in the negative direction to a final
value of -1.350 V (SCE). For Al-7075-T6 samples, a anodic polarization scan was
started at Ecorr and scanned to more positive potentials, i.e., + llOmV.
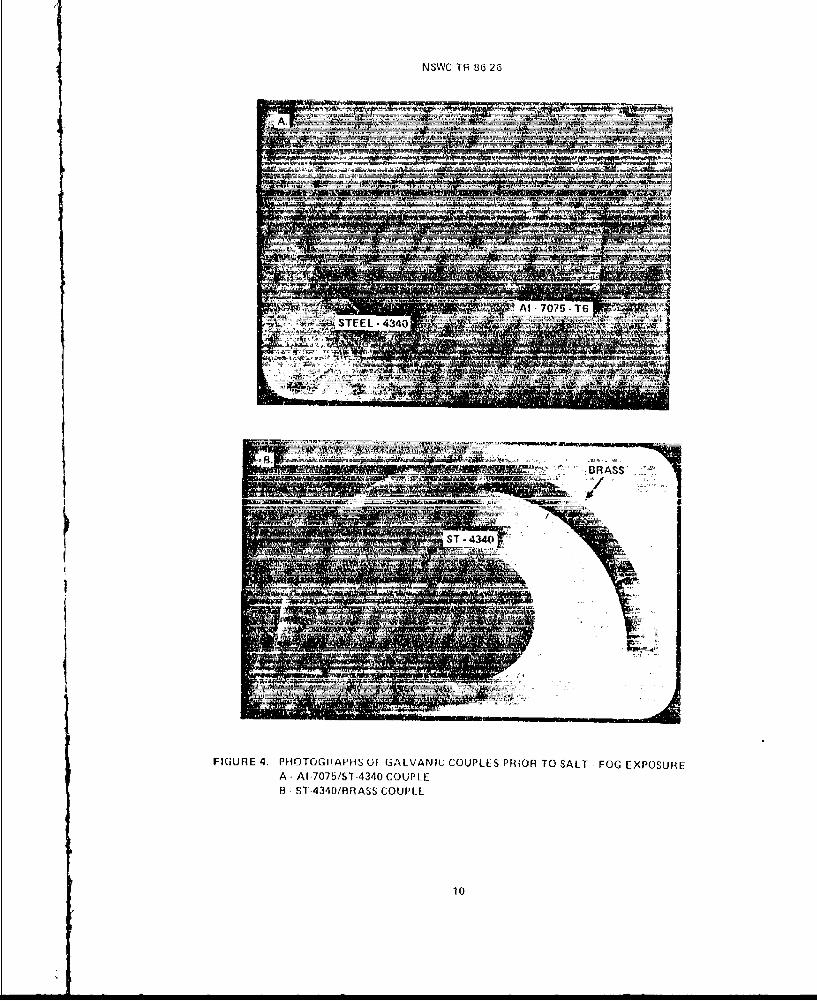
Galvanic couples and the individual uncoupled metals were exposed to a
salt-fog environment according to ASTM standard B-368 and Mil-S-810. Each
sample was cold-mounted in an acrylic polymer and placed in the salt-fog chamber
at an angie of 45 degrees and continuously exposed to a 3.5% NaCl fog at 9'JOC
for 96 hours. Galvanic coupling was accomplished by external connection ol lead
wires attached to the anode and cathode materials. Photographs were obtained
prior to exposure. See Figures 3 and 4. Subsequently, photographs were taken
immediately after removal from the salt-fog chamber and after the removal of
corrosion products. Corrosion products were removed from aluminum surfaces with
concentrated HNO 3 followed by a water rinse and further cleansing using a
rubber eraser. Adherent corrosion products on steel surfaces were removed with
concentrated HCI followed by rinsing with liberal amounts of distilled water and
additional cleaning with an eraser. Brass samples were easily cleaned using an
eraser.
7
NSWC TR 86.26
-500
-502
jI
~" -504:>
5/
E~~SLOPE = Rp !
-506
J-
.1. -508
/
-510 /
1 o3 0 103
CURRENT DENS11 Y (/i A/cm2)
FIGURE 2. POLARIZATION RESISTANCE PLOT
I i i I I i " i II° r i i
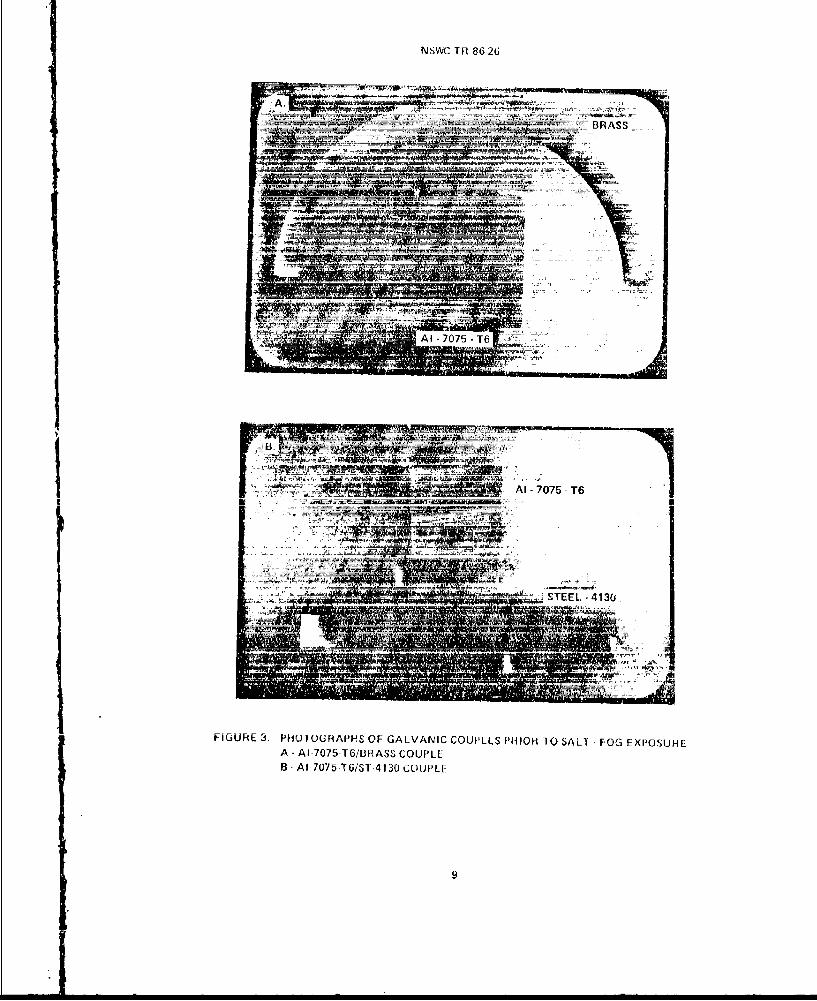
N~~A 7075 T6 82
A~~~ A707 705T/RASCUL
13. 1/ T/T430CUL
G
NSWC rR 86 26
........ 1 "-W :.__
04, 4
FIGURE 4. PHOTOGRAPHS OF GALVANIC COUPLES PRIOR lO SALT- FOG EXPOSURE
A - AI7075/ST4340 COUPLEB - Si-4340/BTRASS COUPLE
10
' O - 1 .-
NSWC rR 86-26
CHAPTER 3
RESULTS AND DISCUSSION
CORROSION RATES OF UNCOUPLED SAMPLES
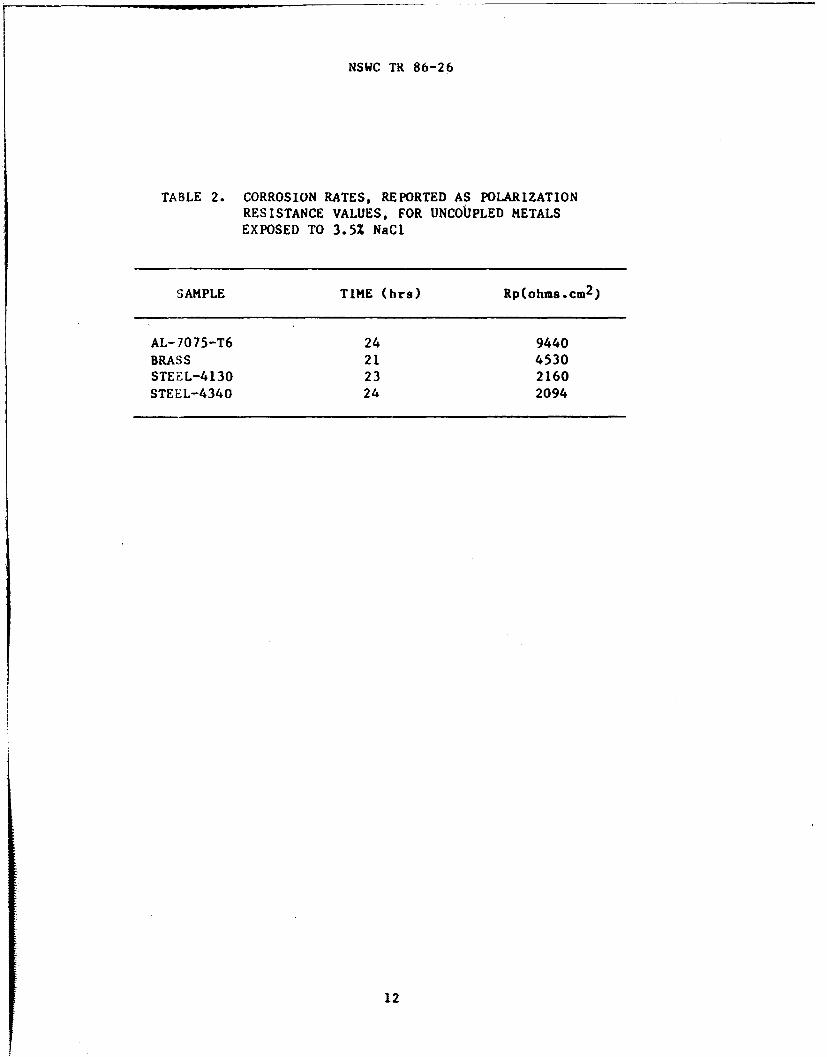
Corrosion rate data for uncoupled metals exposes to 3.5% NaCl, obtainedusing the polarization resistance technique, can be seen in Table 2. Results
revealed that A17075-T6 had the lowest corrosion rate, i.e. highest Rp value,
followed by Brass QQ-B-626, 360, Steel-4130, and Steel-4340. The lowercorrosion rate for A17075 can be attributed to the propensity of aluminum to
corrode by pitting, i.e. localized attack; consequently, the uniform corrosion
rate is much lower than observed for brass and the low-alloy steels exposed to
this environment.
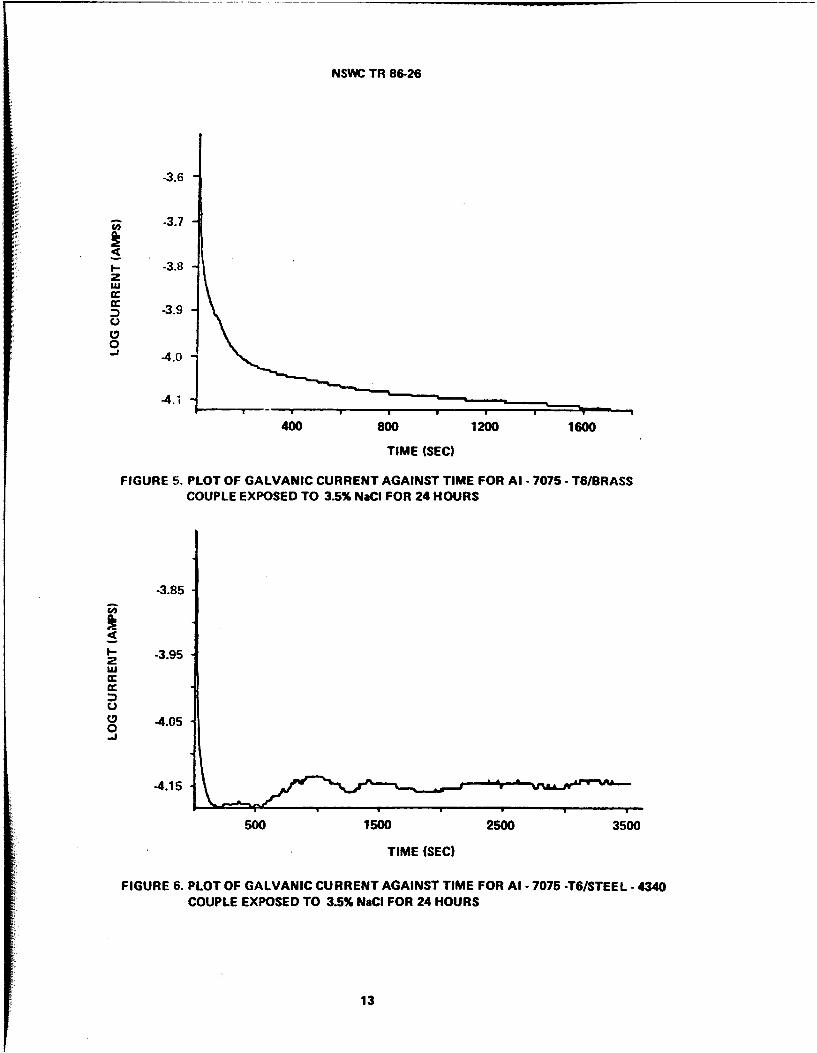
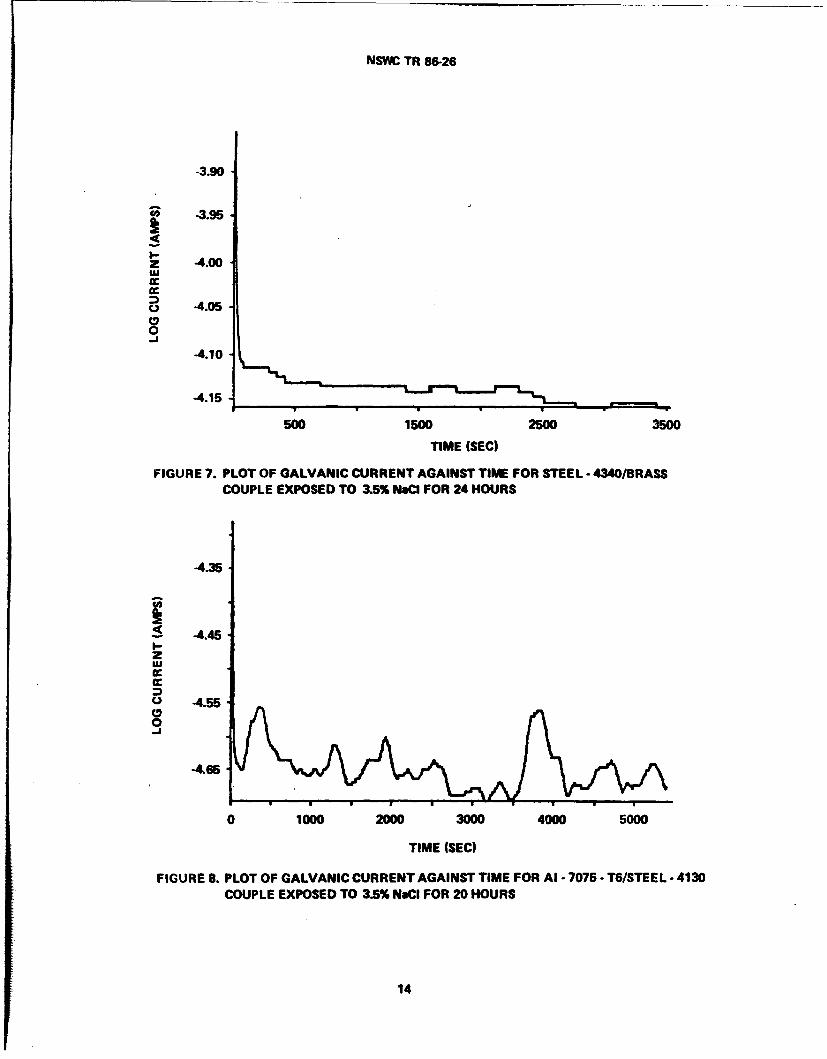
GALVANIC CURRENT MEASUREMENTS
Tpical galvanic current/time plots can be seen in Figures 5 thru 8.
Figure 5 gives results obtained for an A17075/Brass couple exposed to 3.5% NaCl
for 24 hours. The steady galvanic current density was approximately 15 pA/cm2
(galvanic current densities are calculated by using the area of the anode, e.g.,the area of Al-7075 is used for the Al-7075/Brass couple). A typical plot
obtained for an AI-7075/St-4340 couple. Figure 6, gives a steady galvaniccurrent density of 14.3 pA/cm 2 after about 23 hours of immersion. Results for
a St-43-O/Brass couple gave a steady galvanic current density of about 11.6
pA/cm 2 after 24 hours. See Figure 7. Lastly, the AI-7075/St-4130
couple gave a steady galvanic current density after 24 hours of about 20
MA/cm 2 . See Figure 8.
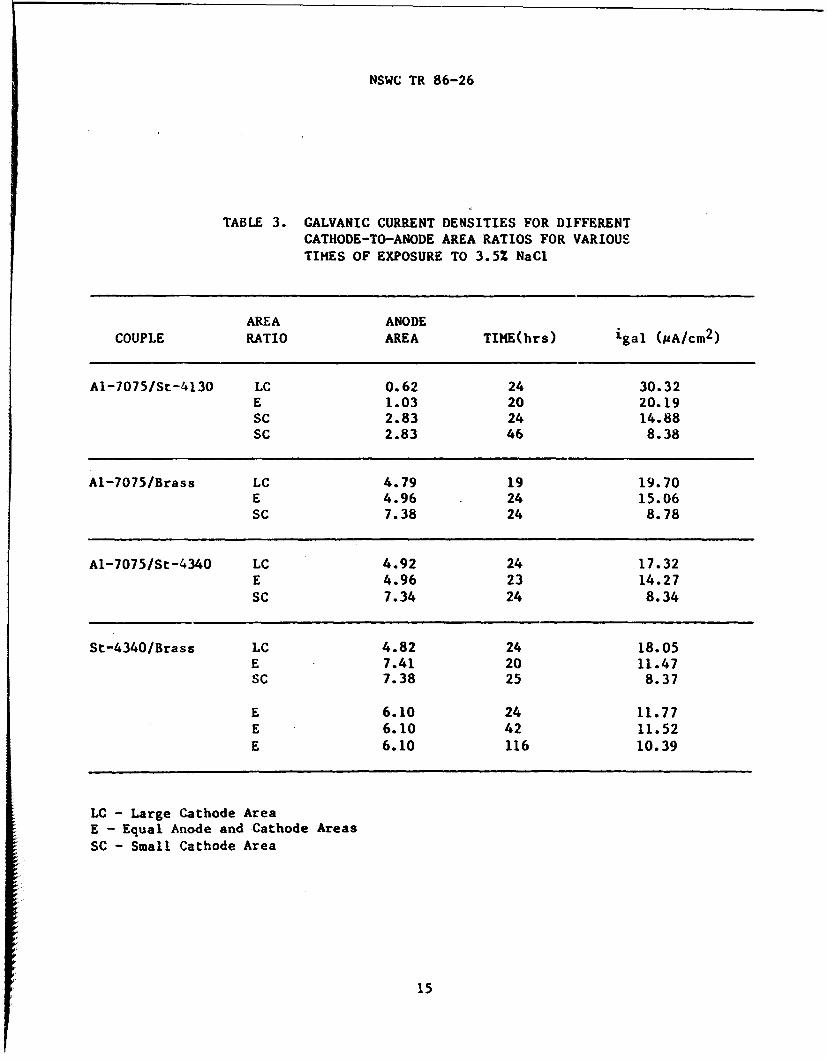
Table 3 summarizes the measured galvanic currents for each of the tested
couples. For couples of equal geowetric surface area, the highest galvaniccurrent density was obtained for- the A17075/St-4130 couple tollowed by
AI-7075/Brass, Al-7075/St-4340, and the St-4340/Brass couple. For comparison, a
reported literature value for an Al-7075-T76/Steel-4130 couple exposed to 3.5%
NaCI for 24 hours was 25pA/cm 2 (1). This value is not too different from the
galvanic current density generated by the Al-7075-T6/St-4130 couple in thisexperiment. The larger galvanic current density reported for the
Al-7075/St-4130 couple is surprising when compared to the AI-7075/St-4340 andAI-7075/Brass couples. St-4340 should be more corrosion resistant, i.e., more
noble, than St-4130 because of higher Mo content and the addition of Ni to
St-4340. In fact, the corrosion potential, Ecorr, in Table 4, for St-4340 was
more noble by about 45 mV suggesting that higher galvanic currents might indeedbe generated when St-4340 is coupled to AI-7075. On the other hand, brass with
the most noble Ecorr value suggests that even higher galvanic currents might beexpected when brass is coupled to Al-7075. Therefore, the relative nobility of
the cathode material in the galvanic couple does not determine the overall
II
NSWC TR 86-26
TABLE 2. CORROSION RATES, REPORTED AS POLARIZATIONRESISTANCE VALUES, FOR UNCOUPLED METALS
EXPOSED TO 3.5% NaCI
SAMPLE TIME (hrs) Rp(ohms.cm 2)
AL-7075-T6 24 9440BRASS 21 4530STEEL-4130 23 2160STEEL-4340 24 2094
12
NSVC TR 86-26
-3.6
-3.7
I.. -3.8z
-3.9
0-J -4.0
400 800 1200 1600
TIME (SEC)
FIGURE 5. PLOT OF GALVANIC CURRENT AGAINST TIME FOR Al - 7075.- T6/BRASS
COUPLE EXPOSED TO 3.5% NaCI FOR 24 HOURS
-3.85
-40
-4.15L
500 1500 2500 3500
TIME (SEC)
FIGURE 6. PLOT OF GALVANIC CURRENT AGAINST TIME FOR Al -7075 -T6/STEEL - 4340COUPLE EXPOSED TO 3.5% NaCI FOR 24 HOURS
13
NSWCE TR 86-26
-3.90
-3.95
2 -4.00
o 4.05
0
-4.10-
.4.15
500 1500 2500 3500
TIME (SEC)
FIGURE 7. PLOT OF GALVANIC CURRENT AGAINST TIME FOR STEEL -4340/B3RASSCOUPLE EXPOSED TO 3&5% NaCI FOR 24 HOURS
-4.35-
4 4.45
w
0
-4.65-
0 1000 2000 3000 4000 5000
TIME (SEC)
FIGURE 8. PLOT OF GALVANIC CURRENT AGAINST TIME FOR Al - 7075 -T6/STEEL - 4130COUPLE EXPOSED TO 3.5% NoCd FOR 20 HOURS
14
NSWC TR 86-26
TABLE 3. GALVANIC CURRENT DENSITIES FOR DIFFERENTCATHODE-TO-ANODE AREA RATIOS FOR VARIOUS
TIMES OF EXPOSURE TO 3.5% NaCl
AREA ANODECOUPLE RATIO AREA TIME(hrs) igal (MA/cm2 )
Al-7075/St-4130 LC 0.62 24 30.32E 1.03 20 20.19SC 2.83 24 14.88SC 2.83 46 8.38
Al-7075/Brass LC 4.79 19 19.70E 4.96 24 15.06SC 7.38 24 8.78
A1-7075/St-4340 LC 4.92 24 17.32E 4.96 23 14.27SC 7.34 24 8.34
St-4340/Brass LC 4.82 24 18.05E 7.41 20 11.47SC 7.38 25 8.37
E 6.10 24 11.77E 6.10 42 11.52
E 6.10 116 10.39
LC - Large Cathode AreaE - Equal Anode and Cathode AreasSC - Small Cathode Area
15
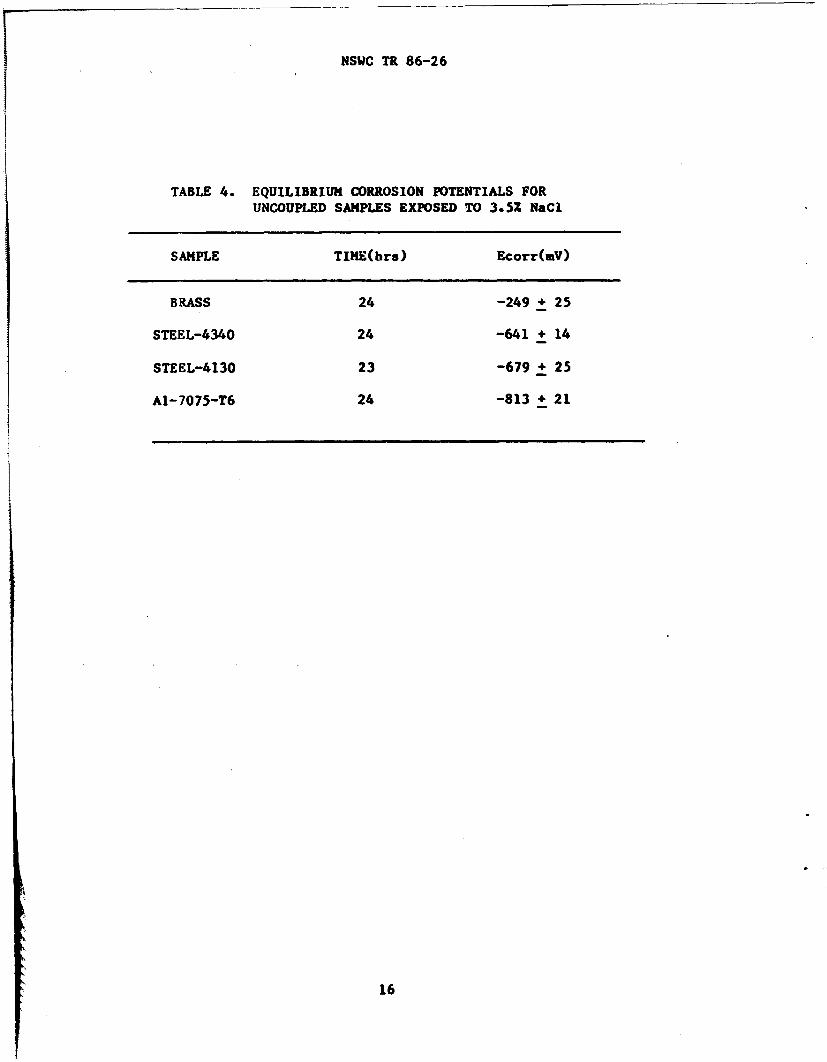
NSWC TR 86-26
TABLE 4. EQUILIBRIUM CORROSION POTENTIALS FORUNCOUPLED SAMPLES EXPOSED TO 3.5Z NaCi
SAMPLE TIME(hrs) Ecorr(mV)
BRASS 24 -249 + 25
STEEL-4340 24 -641 +14
STEEL-4130 23 -679 + 25
A1-7075-T6 24 -813 + 21
16
NSWC 'rR 86-26
strengtr. of the galvanic current. A discussion concerning additional effects on
the gaj.vinic cLrrent will be treated later in this paper.
EFFECT C-' SURFACE AREA RATIO
Cat iode-to-anode area ratio effects on the generated galvanic current
density is also displayed in Table 3. The important influence of the
Lathode-to-anode area ratio was established by changing the relative surface
area of the cathode. For example, a larger brass cathode area for anAl-7075/Brass couple resulted in an increase in the galvanic current density, in
Table 3, and conversely a smaller cathode area reduced the galvanic currentdensity. [his trend was observed for all of the tested couples. When anunfavorable couple cannot be prevented, it is imperative that large
cathode-to-anode ratios be avoided.
CORROSION RATES FOR GALVANIC COUPL-S
Corrosion rates were obtained for the individual metals of each couple
immediately after galvanic current measurements were complered. See Table 5.
Typical p plots for some of the tested samples can be seen in Figures 9 thru11. A comparison must be made between the corrosion rates obtained for theuncoupled metals in Table 2, and the coupled metals in Table 5. In each case,
the corrosion rate of the more anodic material of the couple increased comparedto its' uncoupled value, i.e., a decrease in the Rp value. For example, the
experimental Rp value for an uncoupled Al-7075 sample exposed to 3.5% NaCI for
24 hours was 9,440 ohizs.cm 2 , but a similar Al-7075 sample coupled to brass for24 hours gave an Rp value of 3,595 ohms.cm 2 , a relatively significant increase
in the corrosion rate. By comparison, an uncoupled Steel-4340 gave an Rp value
of 2,094 ohms.cm 2 and after being coupled to brass for 24 hours the corrosion
rate decreased slightly to a value of 1,930 ohms.cm 2; the galvanic corrosion
current data supported this observation, that is the lower galvanic current
density generated by the Steel-4340/Brass couple as compared to theAI-7075/Brass couple suggested that a lower corrosion rate for St-4340 should be
obtained. Experience predicts that the more noble metal, i.e., the cathode in a
galvanic couple should exhibit a lower rate of corrosion when coupled to a moreactive metal, i.e., the anode (sacrificial anodes are designed to provide
protection for a ship's steel hull.); this behavior was observed for one
Brass/Al-7075 sample, the Rp value of 9,4000 ohms.cmn2 . However, the corrosion
resistance of brass in several other galvanic couples behaved similarly to theof uncoupled brass. For the Al-7075/St-4340 couple, the corrosion rate ofAl-7075 increased as expected and the corrosion rate of St-4340 decreased
slightly when compared to uncoupled St-4340. The corrosion rate for AI-7075 in
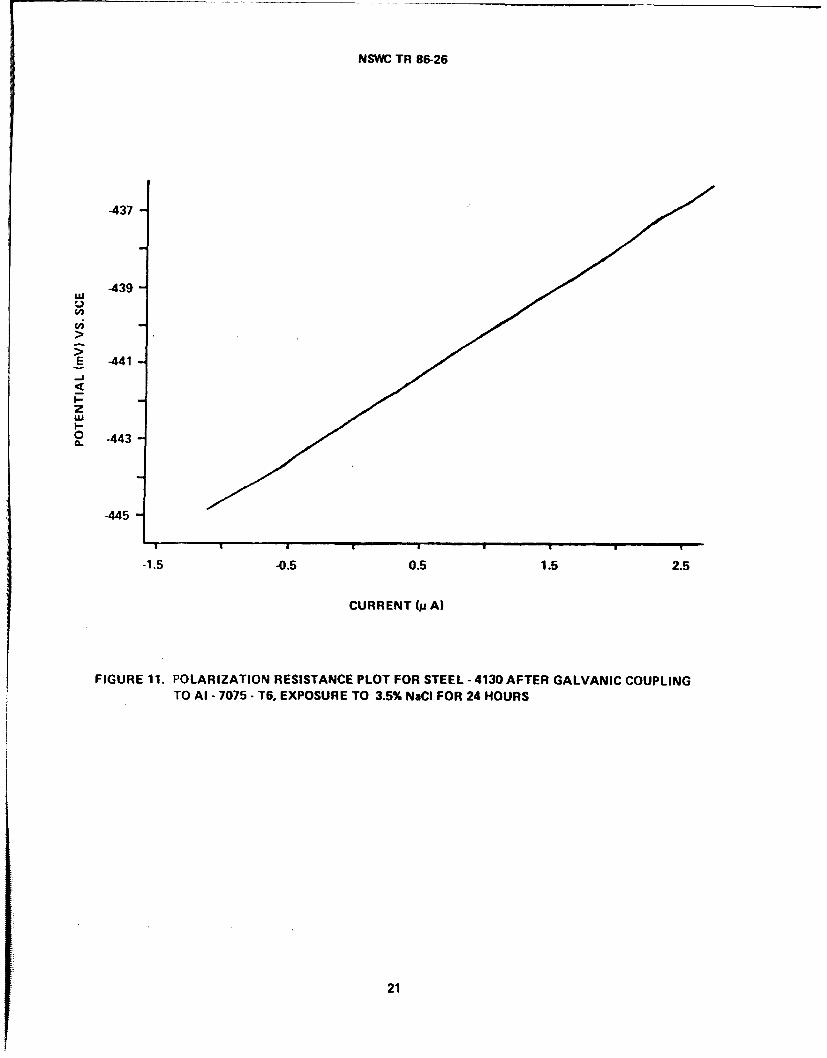
the AI-7075/St-4130 couple also increased but, unlike St-4340 in the
AI-7075/St-4340 couple, a slight increase in the corrosion rate was observed for
St-4130. This increase in the corrosion rate for St-4130 would not be predictedbased on the magnitude of the galvanic current density recorded for this couple;
this small increase in the corrosion rate for St-4130 supports the notion thatSt-4130 does not behave solely as a cathode in the couple but, also, supports an
anodic dissolution reaction as well. Indeed, a visual inspection of
Al-7075/St-4130 couples revealed the presence of localized attack of St-4130.
17
NSWC TR 86-26
TABLE 5. CORROSION RATES FOR INDIVIDUAL METALS AFTERGALVANIC COUPLING F0R 24 HOURS IN 3.5% NaCl
COUPLE TIME (hrs) Rp(ohms-cm2)
Ai-707515t-4130 Al-7075 2520St-4130 1730
Al-7075/Brass Al-7075 3595Brass 4200
Al-7075/St-4340 Al-7075 4955St-4340 2455
St-4340/Brass St-4340 1930Brass 2480
18
NSWC TR 86-26
777
779
E 731
zo 783
785
I I ,
-0.6 -0.2 0.2 0.6 1.0 1.4
CURRENT (j A)
FIGU;RE 9. POLARIZATION RESISTANCE PLOT FOR AI-7075-T6 AFTER GALVANIC COUPLINGTO STEEL- 4130, EXPOSURE TO 3.5% NaCI FOR 24 HOURS
19
NSVVC TA 8b-26
-272
u -274
-~.276
0.. -278
-280
-4 -2 0 2 4 6 8
CURRENT (p A)
FIGURE 10. POLARIZATION RESISTAW~CE PLOT FOR BRASS AFTER GALVANIC COUPLINGTO AI-7075-T6, EXPOSURE TO 3.5% NaCI FOR 24 HOURS
20
NSVC TR 86-26
-437
-439-
E -441
z
Oc -443
-445
-1.5 -0.5 0.5 1.5 2.5
CURRENT (pu A)
FIGURE 11. POLARIZATION RESISTANCE PLOT FOR STEEL -4130 AFTER GALVANIC COUPLINGTO Al - 7075 - T6. EXPOSURE TO 3.5% NaCI FOR 24 HOURS
21
NSWC TR 86-26
CATHODIC POLARIZATION BEHAVIOR
As mentioned in the introduction, a number of factors influeace the
magnitude of generated galvanic currents and one such factor involves the
kinetics of the cathodic reduction reaction. Cathodic behavior was studied by
running polarization curves for the individual uncoupled metal samples.
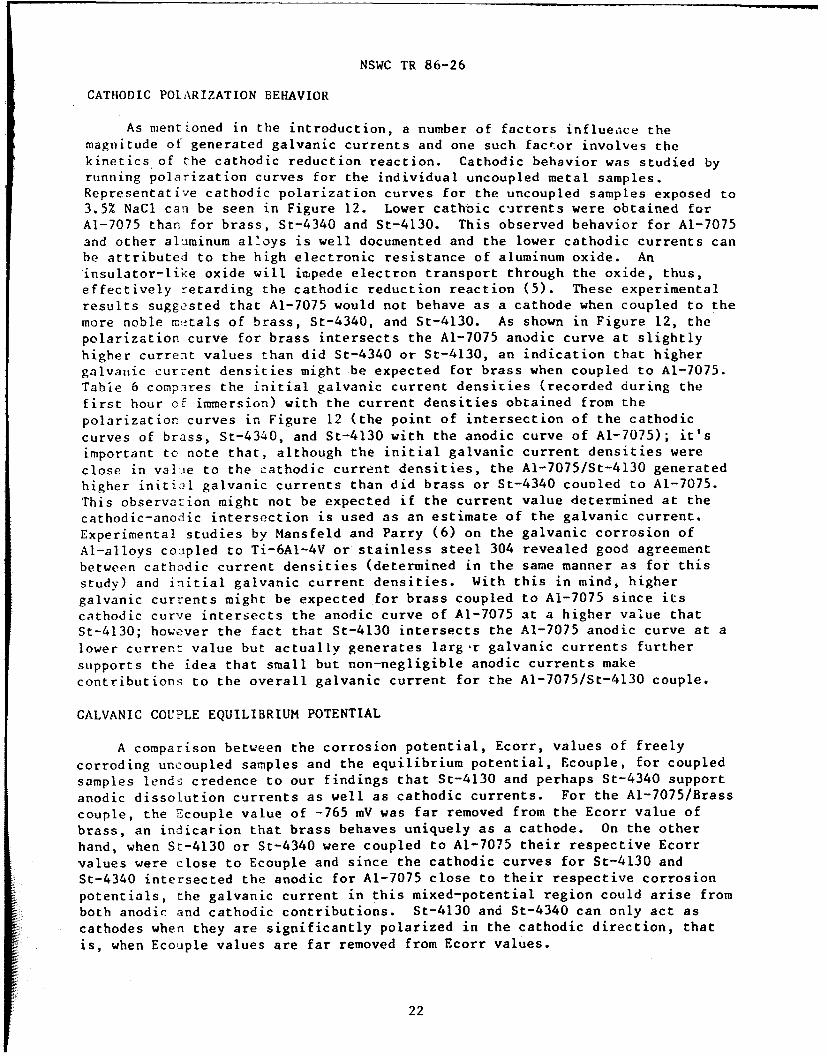
Representative cathodic polarization curves for the uncoupled samples exposed to
3.5% NaCI can be seen in Figure 12. Lower cathoic currents were obtained for
Al-7075 than for brass, St-4340 and St-4130. This observed behavior for AI-7075
3nd other aluminum alloys is well documented and the lower cathodic currents canbe attributed to the high electronic resistance of aluminum oxide. An
insulator-like oxide will impede electron transport through the oxide, thus,
effectively retarding the cathodic reduction reaction (5). These experimental
results suggested that Al-7075 would not behave as a cathode when coupled to the
more noble mentals of brass, St-4340, and St-4130. As shown in Figure 12, the
polarization curve for brass intersects the Al-7075 anodic curve at slightly
higher current values than did St-4340 or St-4130, an indication that higher
galvanic current densities might be expected for brass when coupled to Al-7075.
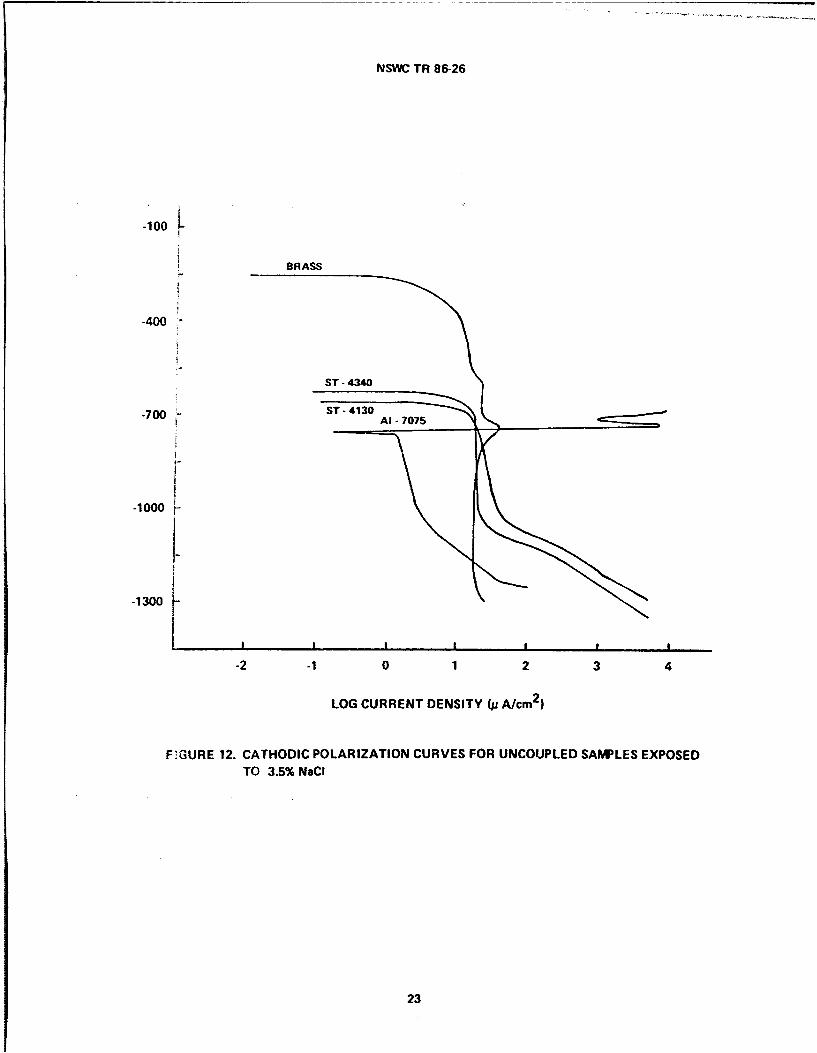
Tabie 6 compares the initial galvanic current densities (recorded during the
first hour of immersion) with the current densities obtained from the
polarization curves in Figure 12 (the point of intersection of the cathodic
curves of brass, St-4340, and St-4130 with the anodic curve of AI-7075); it's
important to note that, although the initial galvanic current densities were
close in value to the cathodic current densities, the Al-7075/St-4130 generated
higher initial galvanic currents than did brass or St-4340 couoled to AI-7075.
This observation might not be expected if the current value determined at the
cathodic-anodic intersection is used as an estimate of the galvanic current.
Experimental studies by Mansfeld and Parry (6) on the galvanic corrosion of
Al-alloys coupled to Ti-6AI-4V or stainless steel 304 revealed good agreement
between cathodic current densities (determined in the same manner as for this
study) and initial galvanic current densities. With this in mind, higher
galvanic currents might be expected for brass coupled to Al-7075 since its
cathodic curve intersects the anodic curve of AI-7075 at a higher value that
St-4130; however the fact that St-4130 intersects the Al-7075 anodic curve at a
lower current value but actually generates larg-r galvanic currents further
supports the idea that small but non-negligible anodic currents make
contributions to the overall galvanic current for the Al-7075/St-4130 couple.
CALVANIC COUPLE EQUILIBRIUM POTENTIAL
A comparison between the corrosion potential, Ecorr, values of freely
corroding uncoupled samples and the equilibrium potential, Ecouple, for coupled
samples lends credence to our findings that St-4130 and perhaps St-4340 support
anodic dissolution currents as well as cathodic currents. For the Al-7075/Brass
couple, the Ecouple value of -765 mV was far removed from the Ecorr value of
brass, an indicarion that brass behaves uniquely as a cathode. On the other
hand, when St-4130 or St-4340 were coupled to Al-7075 their respective Ecorr
values were close to Ecouple and since the cathodic curves for St-4130 and
St-4340 intersected the anodic for AI-7075 close to their respective corrosion
potentials, the galvanic current in this mixed-potential region could arise from
both anodic and cathodic contributions. St-4130 and St-4340 can only act as
cathodes when, they are significantly polarized in the cathodic direction, that
is, when Ecouple values are far removed from Ecorr values.
22
NSiWE TR 86-26
-100
BRASS
-400-
7100
-2 -1 0 1 2 3 4
LOG CURRENT DENSITY (pi A/cm2)
FIGURE 12. CATHODIC POLARIZATION CURVES FOR UNCOUPLED SAWMLES EXPOSEDTO 3.5% NaCI
23
NSWC TR 86-26
TABLE 6. COMPARISON OF THE INITIAL GALVANIC CURRENT DENSITYWITH CURRENT DENSITY AT THE INTERSECTION OF THECATHODIC POLARIZATION CURVE OF THE CATHODE AND THEANODIC POLARIZATION CURVE OF THE ANODE
INITIALCOUPLE igal(pA/cm 2 ) CATHODE icath(pA/cln2 )
AI-7075/Brass 15.0 Brass 38.0
AI-7075/St-4340 16.0 St-4340 20.0
Al-7075/St-4130 17.2 St-4130 24.0
St-4340/Brass 15.4 Brass 13.0
24
NSWC TR 86-26
SALT FOG TESTING
Galvanic Couple Behavior
Photographs of the AI-7075/Brass couple after salt-fog exposure can be seen
in Figure 13 (for comparison, photographs of individual couples prior to
exposure should be made, see Figure 3 and 4). Briefly, the aluminum surface was
covered with a white loosely-adherent outer corrosicn product layer and a black,
tightly-adherent inner layer. Upon removal of the corrosion product layers,
shown in Figure 13B, only a minute amount of uniform corrosion was detected but
a number of large irregularly shaped pits were evident; also, some of the
original abrasion lines from pretreatment procedures could be detected on the
aluminum surface. By comparison, the brass surface was discolored by a thin
film with isolated regions that were shades of blue, green, purple and brown in
color. However, the brass surface beneath this discolored film was unaffected.
These observations confirmed that Al-7075 was significantly attacked by coupling
to brass after exposed to an aggressive environment.
Photographs of the AI-7075/Steel-4130 couple after salt-fog exposure can be
seen in Figure 14. Inspection of the photograph in Figure 14A will reveal that
both Al-7075 and St-4130 were significantly corroded. The aluminum surface was
covered with white and black corrosion products, similar in appearance to the
AI-7075 sample coupled to brass. After removal of the corrosion products from
the Al-7075 sample, the underlying surface revealed that attack was
predominantly of a localized nature and pits were shallow and irregularly
shaped. By comparison, the AI-7075 sample coupled to brass gave much larger and
somewhat deeper pits. In many areas, the original abrasion lines were easily
recognizable, much more so than for Al-7075 coupled to brass or St-4340; this
fact suggested that a negligible amount of uniform attack had occured. Unlike
the brass cathode of the AI-7075/Brass couple, St-4130 showed signs of
significant attack. The specimen was, in localized regions, covered by
voluminous-tightly-adherent corrosion products. These products were
yellowish-brown and black in appearance; the black corrosion product was most
likely magnetite, Fe 304 , which formed during the incipient stages of
corrosion and as oxidation of the surface continued,the formation of the loosely
adherent yellowish-brown 11-Fe 2 0 3 followed. Beneath these sites of corrosion
product tuild-up were regions of deeply penetrating uniform corrosion while
areas adjacent to this 3ttack remained unaffected, as indicated by tile
appearance of the original lines of abrasion. See Figure 14B.
Photographs of the AI-7075/St-4340 couple after salt-fog exposure can be
seen in Figure 15. Similar to the Al-7075/St-4130 couple, the St-4340 sample
was also attacked and its appearance was nearly the same as St-4130 coupled to
Al-7075. Voluminous corrosion products were found on the surface, that were
yellowish-brown and black. See Figure 15A. As observed for the St-4130 sample,
the corrosion products were strongly adherent. A fewer number of corroded
regions were observed for St-4340 than for St-4130; however, the nature and
appearance of the corrosive attack was identical for both steel samples, that
is, uniform attack in localized areas with deep penetration while adjacent areas
remained unaffected. As was observed with other galvanically coupled AI-7075
samples, the surface was covered with white and black adherent corrosion
products. Beneath the corrosion products a large number of irregularly shaped
pits could be seen and, also, some areas of uniform-like dissolution with
25
NSWC T14 86-26
I' - 7 -A I-
FIGURE~~~~~~~~~~~~~A 7307T5APSO ~7ThBASGLANCCUL FTREPS
TO A SLT- FO ENVIRN~kNT ORf6HOR
A CROSO ROUT ITC
M ORSO ROUT EOE
261w
AlI7
N SWC I R 86-26
'01
A ~ ~ ~ ~ ~ -- ORSONPOUTSITC
A CORROSION PRODUCTS REMOVED
27
NA lB6 26
'I M
__A ~ I 7075 -16
:40A 4 1.I
NSWC TR 86-26
roughened surfaces were evident. Overall Al-7075 coupled to St-4340 wascorroded slightly more than when coupled to St-4130, but not as strongly as when
coupled to brass.
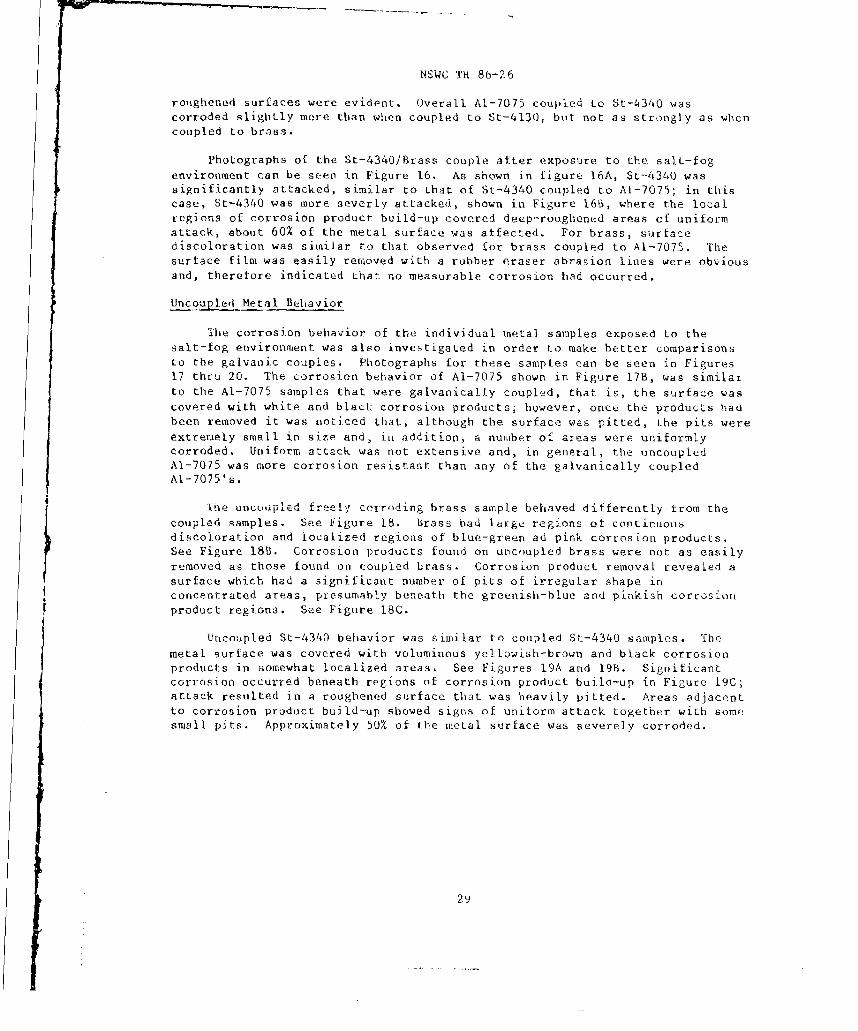
Photographs of the St-4340/Brass couple after exposure to the salt-fogenvironment can be seen in Figure 16. As shown in figure 16A, St-4340 wassignificantly attacked, similar to that of St-4340 coupled to AI-7075; in thiscase, St-4340 was more severly attacked, shown in Figure 16B, where the localregions of corrosion product build-up covered deep-roughened areas of uniformattack, about 60% of the metal surface was affected. For brass, surfacediscoloration was similar to that observed for brass coupled to AI-7075. 'the
surface film was easily removed with a rubber eraser abrasion lines were obviousand, therefore indicated that no measurable corrosion had occurred.
Uncoupled Metal Behavior
The corrosion behavior of the individual metal samples exposed to the
salt-fog environment was also investigated in order to make better comparisonsto the galvanic couples. Photographs for these samples can be seeni in Figures
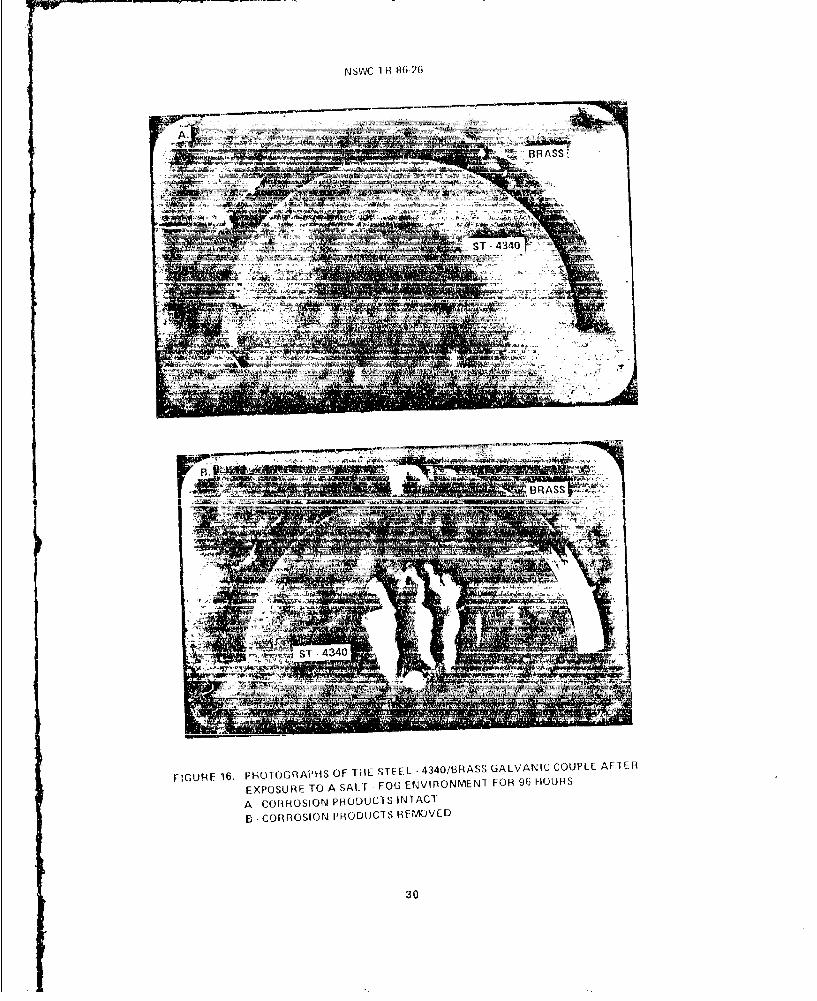
17 thru 20. The corrosion behavior of AI-7075 shown in Figure 17B, was similar
to the AI-7075 samples that were galvanically coupled, that is, the surface was
covered with white and black corrosion products; however, once the products haubeen removed it was noticed that, although the surface was pitted, the pits were
extremely small in size and, in addition, a number of areas were uniformlycorroded. Uniform attack was not extensive and, in general, the uncoupledAI-7075 was more corrosion resistant than any of the galvanically coupled
Al-7075's.
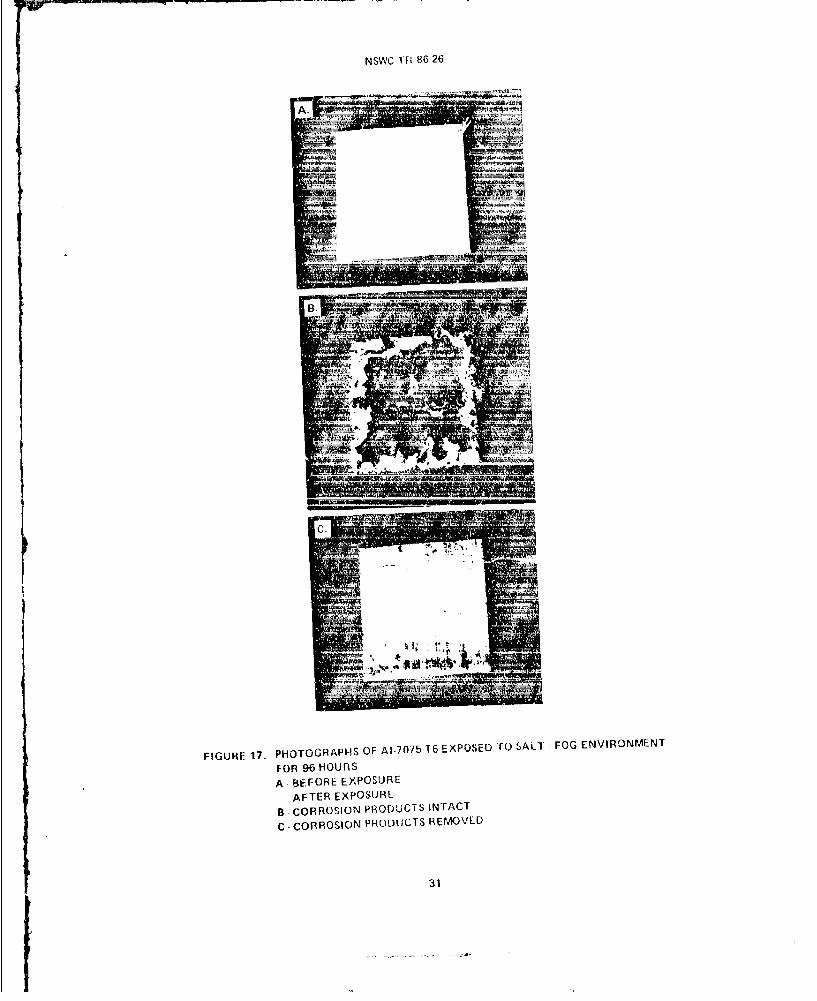
the uncu~ipled freely corroding brass sample behaved differently from the
coupled samples. See Figure 18. brass had large regions of continuousdiscoloration and localized regions of blue-green ad pink corrosion products.See Figure 18B. Corrosion products found on uncoupled brass were not as easilyremoved as those found on coupled brass. Corrosion product removal revealed a
surface which had a significant number of pits of irregular shape inconcentrated areas, presumably beneath the greenish-blue and pinkish corrosion
product regions. See Figure 18C.
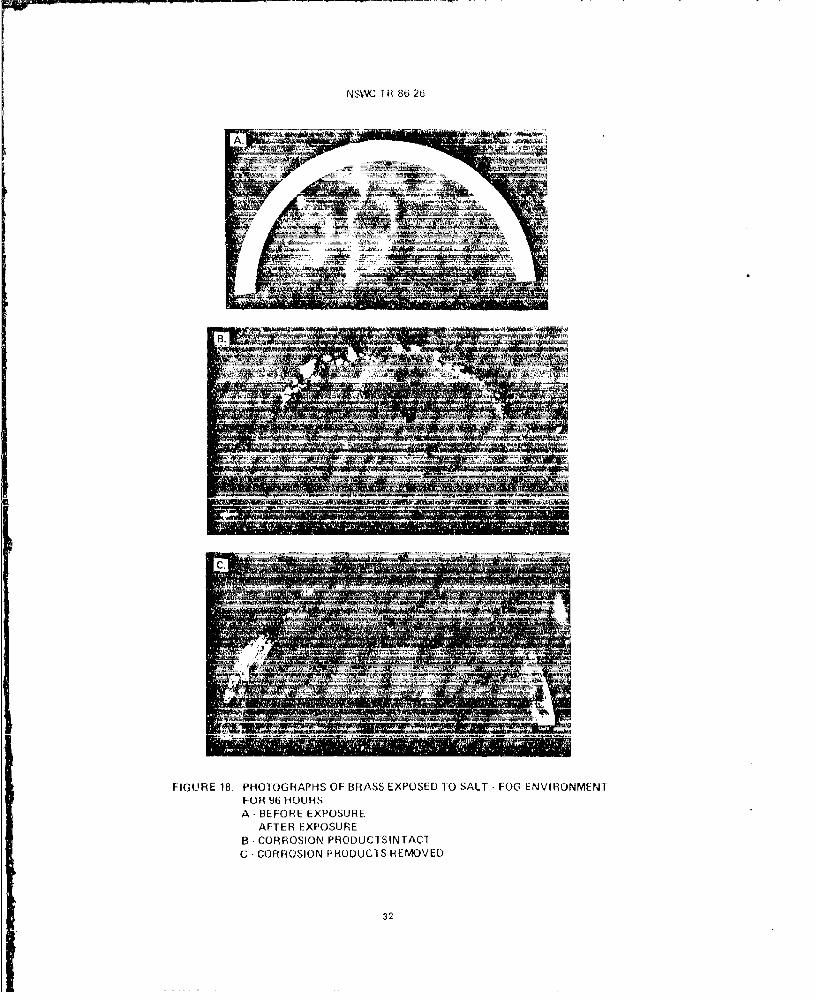
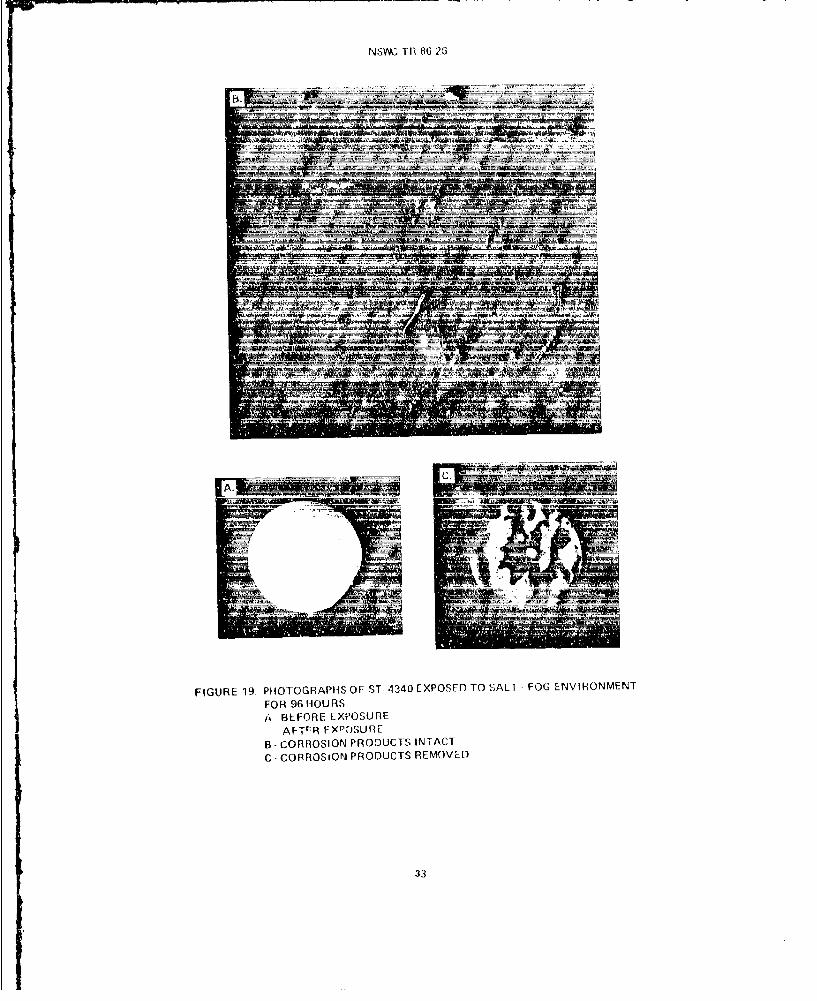
Uncoupled St-4340 behavior was similar to coupled St-4340 samples. The
metal surface was covered with voluminous yellowish-brown and black corrosionproducts in somewhat localized areas, See Figures 19A and 19B. Significantcorrosion occurred beneath regions of corrosion product build-up in Figure 19C;attack resulted in a roughened surface that was heavily pitted. Areas adjacentto corrosion product build-up showed signs of uniform attack together with somesmall pits. Approximately 50% of the metal surface was severely corroded.
29
NSWC TR 86 26
A AWL
2t BRASS'-
I,
FIGURE 16 PHOTOGRAPHS OF ItE STEEL 4340/BRASS GALVANIC COUPLE AFTER
EXPOSURE TO A SAL6. r FOG ENVIRONMENi FOR 96 COURS
A - CORROSION PHODUCTS INIACI
B - CORROSION PRODUCTS REMOVED
30
NSWC TH 86 26
FIGURE 17. PHOTOGRAPHS OF Al-7075-16 EXPOSED TO) SALT- FOG ENVIRONMENT
FOR 96 HOURS
A - BEFORL EXPOSURE
AFTER EXPOSUJRE
B - CORROSION PRODUCTS INTACT
C - CORROSION PRODUCTS REMOVED
31
NS0C 18i 86 26
FIUE 8POTGAPSO BASEXOED1 AL OGEVROMN
FORY6HOrS
A~ ~~ BEOI XOSR
AFTER EX~OSOR
B~~~~~~~ CORSO!P OCSNAT
C CRRSIO PODUTSREMVE
42
NSW& TI1 86 6
rB-- 01OPtSn
FIGURE 19. PHOTOGRAPHS OF ST- 4340 EXPOSED TO SALT -FOG E-NVIRONMENTFOR 96IIOU RSA BEFORE EXPOSURE
AF-TrR FXPCJSUREB - CORROSION PRODUCTS INTACTC - CORROSION PRODUCTS REMOVED
33
NSWC IR 86-26
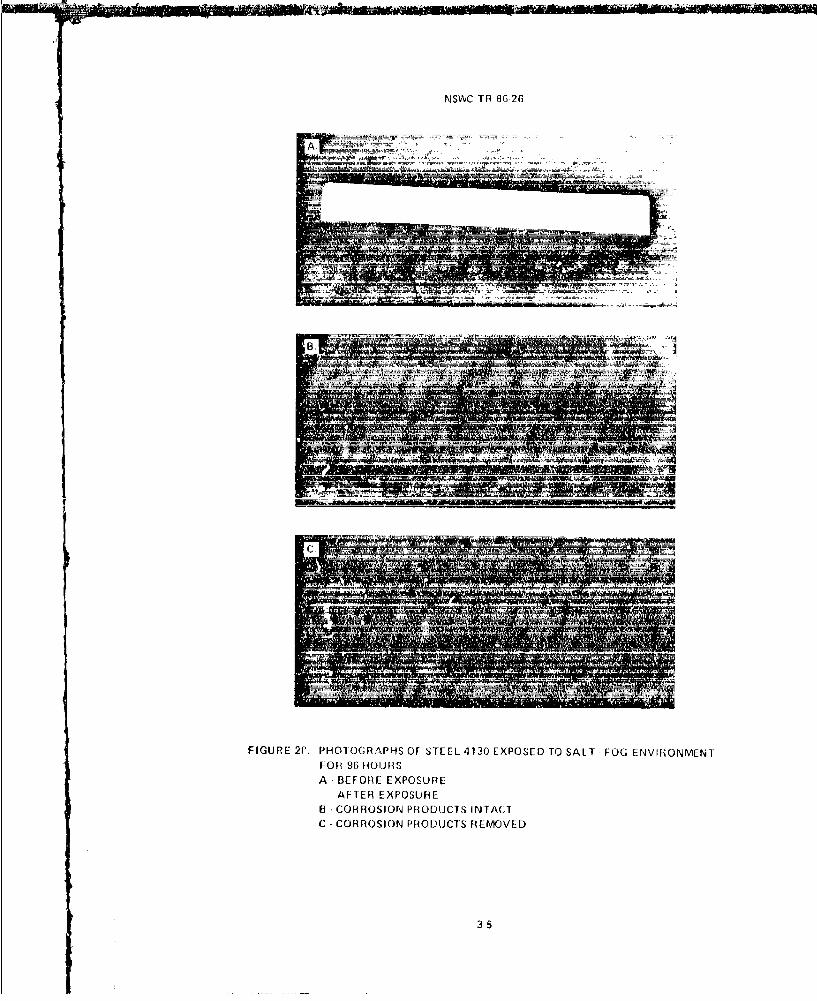
Surprisingly the uncoupled St-4130 sample was not corroded as severely asthe St-4130 sample coupled to Al-7075 (compare Figures 14A and 20B). However,the smaller regions of corrosion did show signs of increased activity, i.e.,deeper more uaiform attack, in two closely spaced areas that coveredapproximately 10-15% of the metal surface. See Figure 20C. These deeplycorroded areas were located on the lower-half of the metal in the position ofexposure in the salt-fog chamber, i.e., 45 degree angle. A concentratedbuild-up of liquid and corrosion products in these areas would explain whypreferential attaci, occurred there. Several other regions of less severeuniform attack were found in adjacent areas. In addition, small pits were foundrandomly dispersed along the metal surface.
A34
1- W
NSWC TR 86.26
II
FIGURE 21. PHOlOGRAPHS OF STEEL 4130 EXPOSED TO SALT -FOG ENVIHONMENi
FOH 96 HOUJRS
A- BEFORE EXPOSURE
AFTER EXPOSURE
B -CORROSION PRODUCTS INTACT
C -CORROSION PRODUCTS REMOVED
35
NSWC TR 86-25
Chapter 4
THEORETICAL RELATIONSHIP BETWEEN GALVANICCURRENT AND CORROSION RAVE
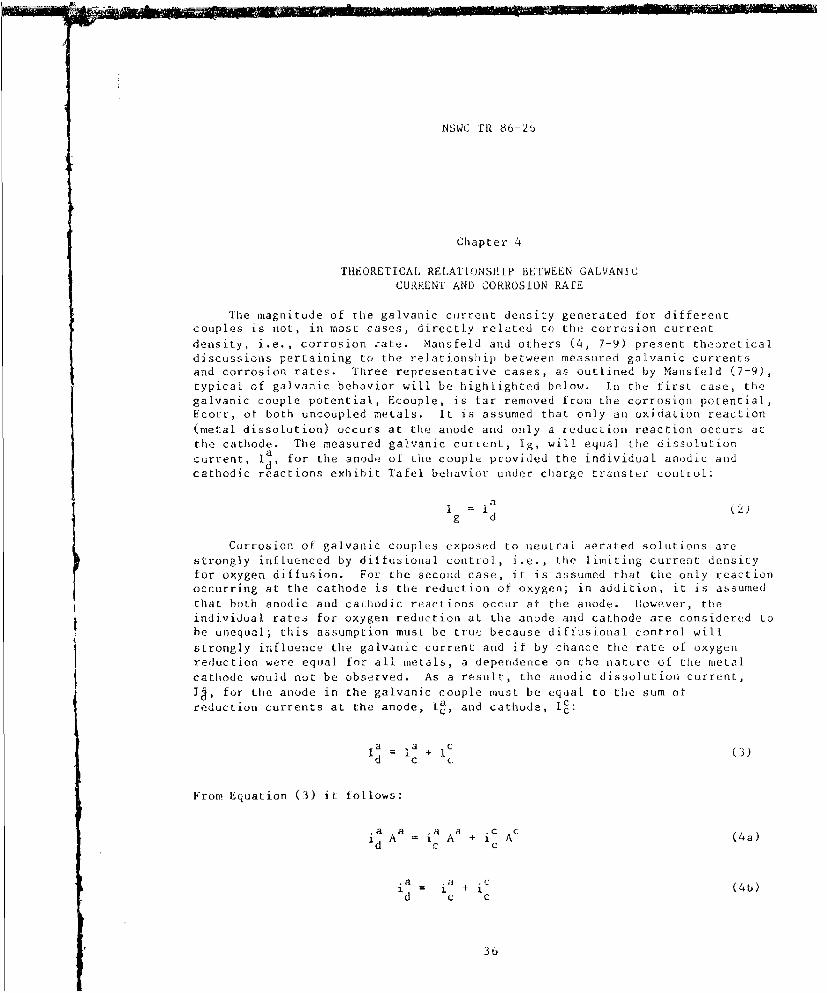
The magnitude of the galvanic current density generated for differentcouples is not, in most cases, directly related to the corrosion currentdensity, i.e., corrosion :ate. Mansfeld and others (4, 7-9) present theoreticaldiscussions pertaining to the relationship between measured galvanic currentsand corrosion rates. Three representative cases, as outlined by Mansfeld (7-9),typical of galvanic behavior will be highlighted below. In the first case, thegalvanic couple potential, Ecouple, is far removed from the corrosion potential,Ecort, of both uncoupled metals. It is assumed that only an oxidation reaction(metal dissolution) occurs at the anode and only a reduction reaction occurs atthe cathode. The measured galvanic current, Ig, will equal the dissolutioncurrent, I for the anode of the couple provided the individual anodic andcathodic reactions exhibit Tafel behavior under charge transfer control:
I~i d (2)g d
Corrosion of galvanic couples exposed to neutral aerated solutions arestrongly influenced by diffusional control, i.e., the limiting current densityfor oxygen diffusion. For the second case, it is assumed that the only reactionoccurring at the cathode is the reduction of oxygens; in addition, it is assumedthat both anodic and cathodic reactions occur at the anode. However, theindividual ratez for oxygen reduction at the anode and cathode are considered tobe unequal; this assumption must be true because diffusional control willstrongly influence the galvanic current and if by chance the rate of oxygenreduction were equal for all metals, a dependence on the nature of the metalcathode would not be observed. As a result, the anodic dissolution current,I2, for the anode in the galvanic couple must be equal to the sum ofreduction currents at the anode, a and cathode, 1c:
Ia = Ia + Ic (3)d c C
From Equation (3) it follows:
. a a a c ci d A i C A +i A (4a)
a a + i (4b)
d c c
36
NSWC TR 86-26
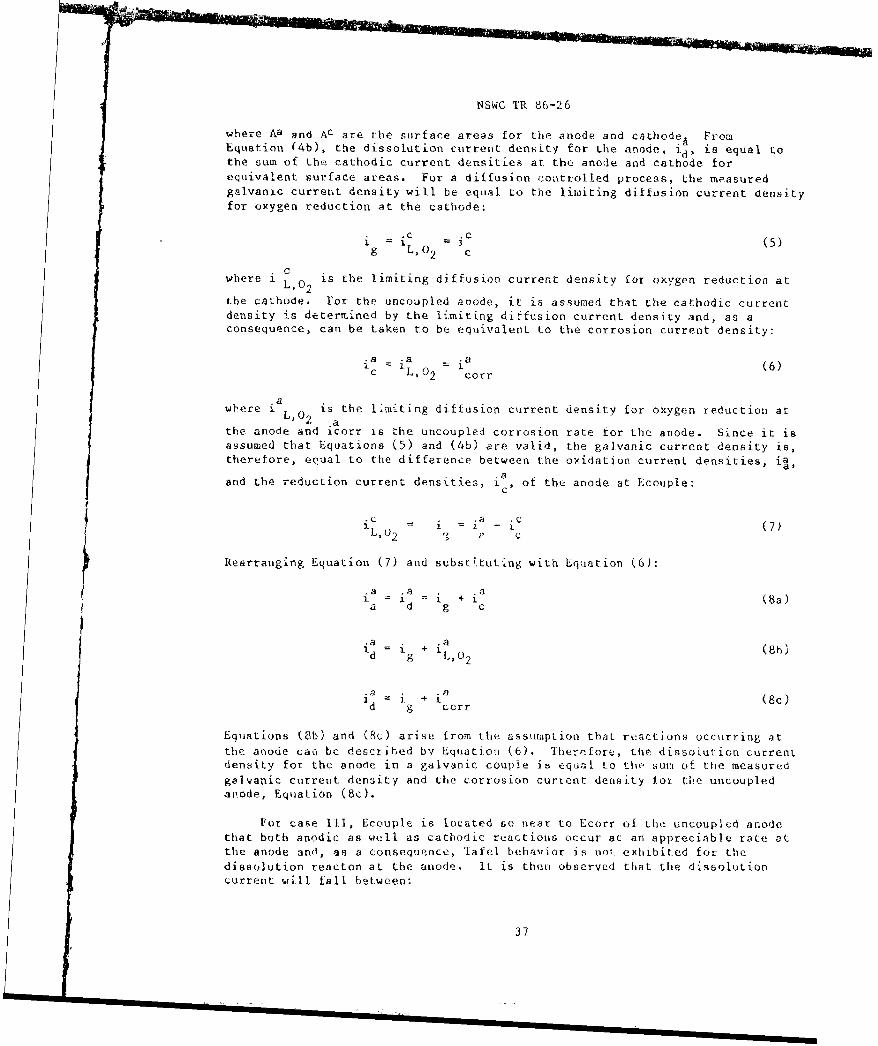
where Aa and Ac are the surface areas for the anode and cathode, FromEquation (4b), the dissolution current density for the anode, ' d is equal tothe sum of the cathodic current densities at the anode and cathode forequivalent surface areas. For a diffusion coatrolted process, the measuredgalvanic curreut density will be equal to the limiting diffusion current densityfor oxygen reduction at the cathode:
.C (5)g L,0 2 c
C
where i , is the limiting diffusion current density for oxygen reduction at
the cathode. For the uncoupled anode, it is assumed that the cathodic currentdensity is determined by the limiting diffusion current density and, as aconsequence, can be taken to be equivalent to the corrosion current density:
a a a
c L , 02 =corr
where i L,02 is the liiting diffusion current density for oxygen reduction at
the anode and icorr is the uncoupled corrosion rate for the anode. Since it isassumed that Equations (5) and (4b) are valid, the galvanic current density is,therefore, equal to the difference between the oxidation current densities, ia,
and the reduction current densities, ia of the anode at Ecouple:
.a .c(7)
L02 c
Rearranging Equation (7) and substituting with Equation (6):
.a .f aa d I + 1.- (8a )a d g c
a i a (8c)d corr
Equations (Sb) and (Sc) arise from the assumption that reactions occurring atthe anode can bc described by Equation (6). Therefore, the dissolution currentdensity for the anode in a galvanic couple is equal to thp sum of the measuredgAlvanic current density and the corrosion current density for the uncoupledanode, Equation (8c).
For case Il1, Ecouple is located so near to Ecorr of the uncoupled anodethat both anodic as well as cathodic reactions occur at an appreciable rate atthe anode and, as a consequence, Tafel behavior is not exhibited for thedissolution reacton at the anode. It is then observed that the dissolutioncurrent will fall between:
37
NSWC TR 86--26
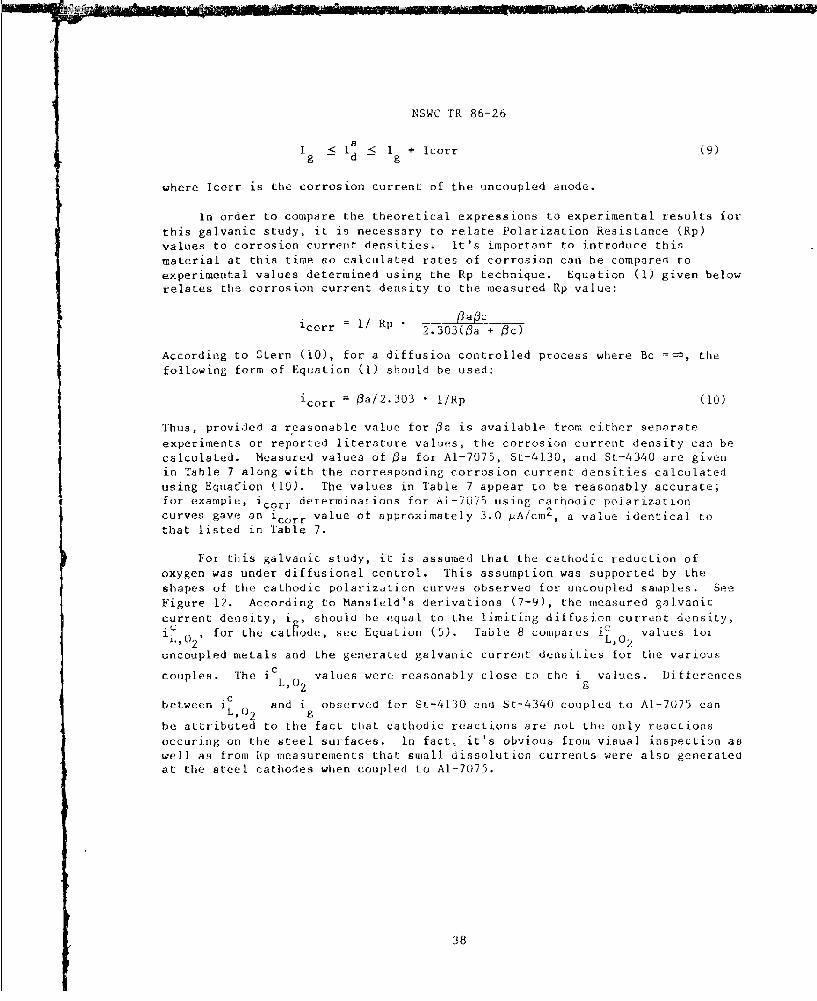
_< la I co r (9)g d g
where Icorr is the corrosion current of the uncoupled anode.
In order to compare the theoretical expressions to experimental results for
this galvanic study, it is necessary to relate Polarization Resistance (Rp)
values to corrosion current densities. It's important to introduce this
material at this time so calculated rates of corrosion can be compared to
experimental values determined using the Rp technique. Equation (I) given belowrelates the corrosion current density to the measured Rp value:
icorr = I/ Rp • 2.303(a + c)
According to Stern (t0), for a diffusion controlled process where Bc = , the
following form of Equation (1) should be used:
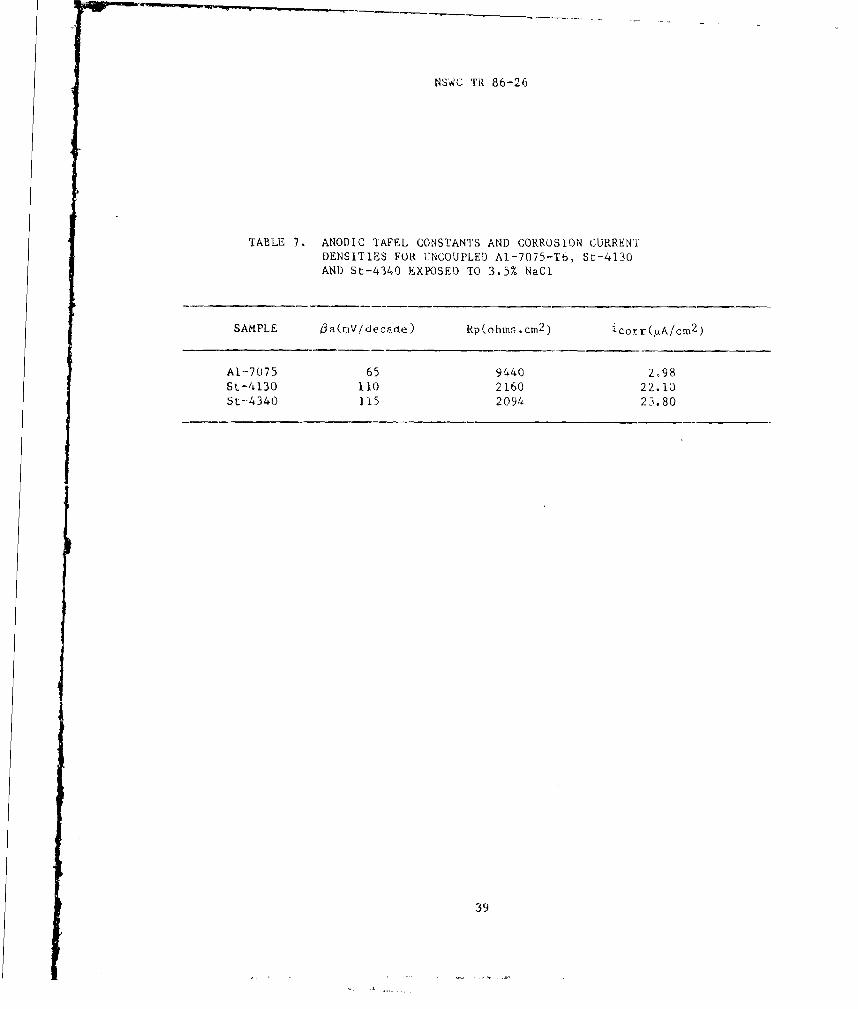
icorr = Oa/2.303 • l/Rp (10)
Thus, provided a reasonable value for 0a is available from either separate
experiments or reported literature values, the corrosion current density can be
calculated. Measured values of Oa for AP-7075, St-4]30, and St-4340 are givenin Table 7 along with the corresponding corrosion current densities calculated
using Equafion (10). The values in Table 7 appear to be reasonably accurate;
for example, icorr determinaLions for Ai-7075 using caEhIocic potarizacioncurves gave an 1 corr value of approximately 3.0 PA/cmt, a value identical tothat listed in Table 7.
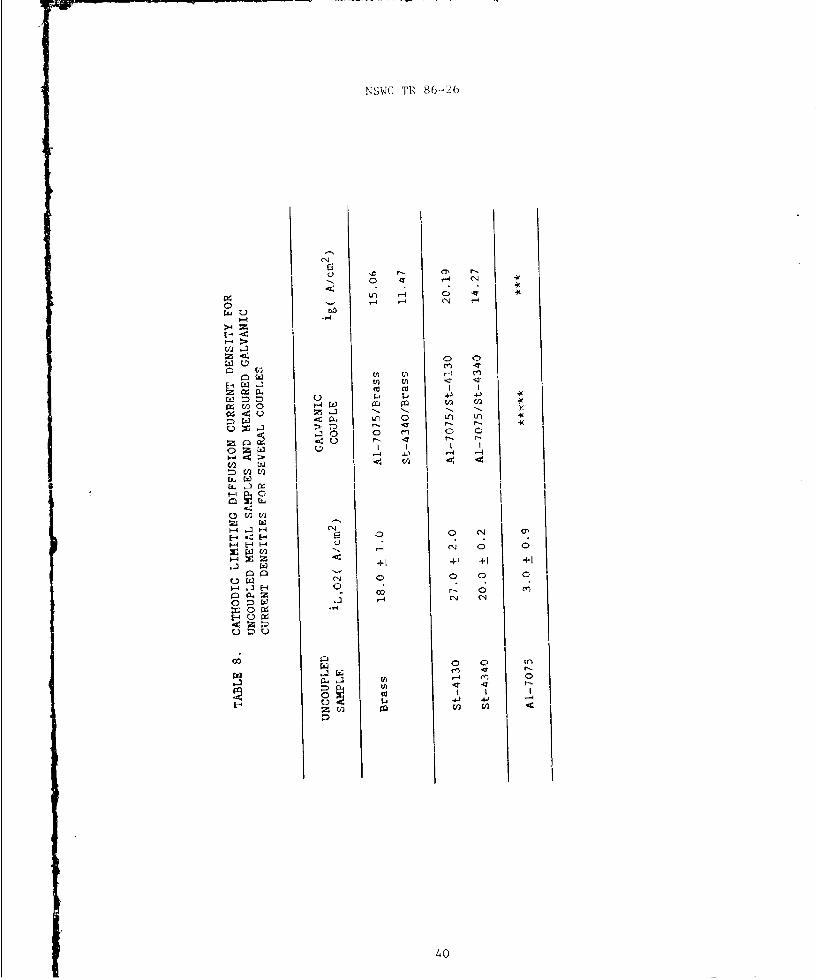
For this galvanic study, it is assumed that the cathodic reduction of
oxygen was under diffusional control. This assumption was supported by the
shapes of the cathodic polarizetion curves observed for uncoupled samples. See
Figure 12. According to MansfId's derivations (7-9), the measured galvanic
current density, i , shoula be equal to the limiting diffusion current density,iC , for the catnode, see Equation (5). Table 8 compares 'c values for
J ,21 L 02uncoupled metals and the generated galvanic current densities for the various
couples. The ic L values were reasonably close to the i values. Differences
between xc and i observed for St-4130 ann St-4340 coupled to A1-7075 can1L,0 2 g
be attributed to the fact that cathodic reactions are not the only reactions
occuring on the steel surfaces. in fact, it's obviou& from visual inspection aswell as from Rip measurements that small dissolution currenLs were also generated
at the steel cathodes when coupled to Al-7075.
38
NSWC TR 86-26
TABLE 7. ANODIC TAFEL CONSTANTS AND CORROSION CURRENTDENSITIES FOR UNCOUPLED AI-7075-Tb, St-4130AND St-4340 EXPOSED TO 3.5% NaCI
SAMPLE 0a(mV/decade) Rp(ohnsr.cm 2 ) icocr(uA/cm 2 )
AI-7075 65 9440 2,98St-4130 110 2160 22.10St-4340 115 2094 23.80
39
NSWC TIR 86-2-6
4 (
Or r4 r
4
>42(-4 >.
zO 0
w' CO
C) L La r 4-
r- - - 4r-cl V0 0
<) -) Ln -A '
.2 0 c?)
> -4
4
0 0 (
'AC000
C) cd
(-4 O
04
NSWC TR 8u-26
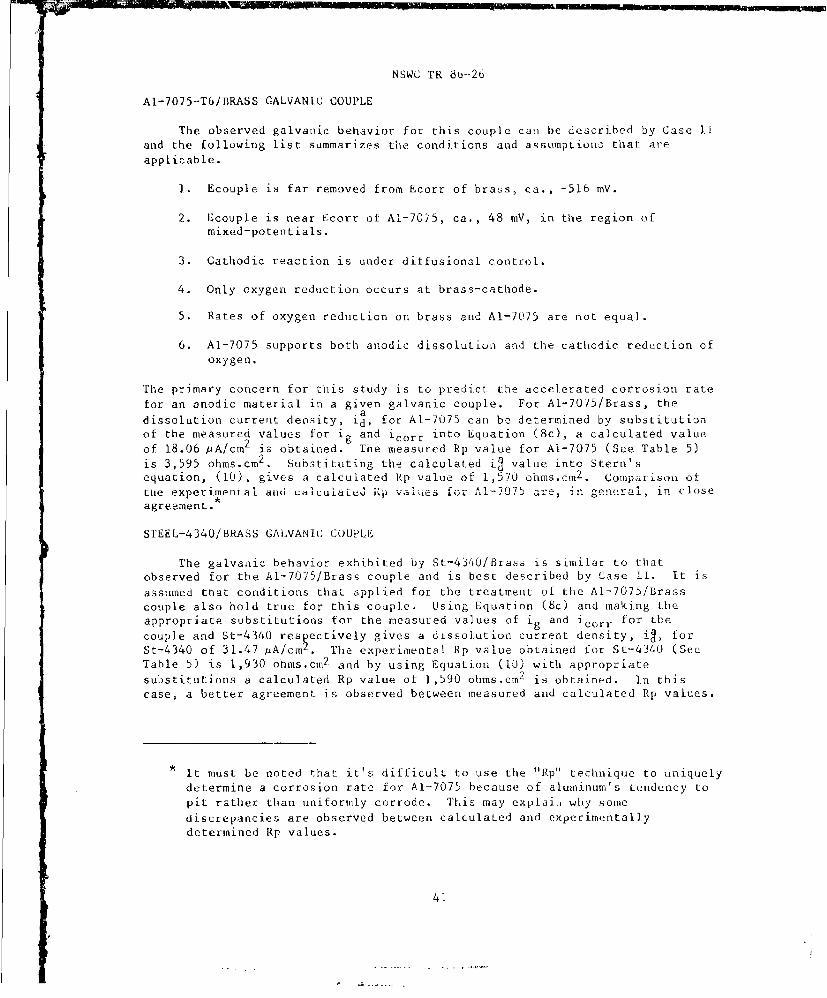
AI-7075-T6/BRASS GALVANIC COUPLE
The observed galvanic behavior for this couple can be described by Case 11
and the following list summarizes the conditions and assumption that are
applicable.
1. Ecouple is far removed from Ecorr of bras, ca., -516 mV.
2. Ecouple is near Ecorr of Al-705, ca., 48 mV, in the region ofmixed-potentials.
3. Cathodic reaction is under diffusional control.
4. Only oxygen reduction occurs at brass-cathode.
5. Rates of oxygen reduction on brass and Al-705 are not equal.
6. Al-7075 supports both anodic dissolution and the cathodic reduction of
oxygen.
The primary concern for this study is to predict. the accelerated corrosion rate
for an anodic material in a given galvanic couple. For AI-7075/Brass, the
dissolution current density, id, for Al-7075 can be determined by substitution
of the measured values for ig and icorr into Equation (8c), a calculated value
of 18.06 pA/cm2 is obtained. The measured Rp value for AI-7075 (See Table 5)is 3,595 ohms.cm 2 . Substituting the calculated i2 value into Stern's
equation, (10), gives a calculated Ep value of 1,570 ohms.Cmr2 . Comparison ofthe experimental and calculatd eup vaies for A-7075 general, in cioseagreement.
STEEL-4340/BRASS GALVANIC COUPLE
The galvanic behavior exhibited by St-4340/Brass is similar to that
observed for the Al-7075/Brass couple and is best described by Case I. It is
assumed that conditions that applied for the treatment of the Al-7075/Brasscouple also hold true for this couple. Using Equation (8c) and making the
appropriate substitutions for the measured values of i and icorr for the
couple and St-4340 respectively gives a dissolution current density, i, forSt-4340 of 31.47 uA/cm2 . The experimental Rp value obtained for St-4340 (SeeTable 5) is 1,930 ohms.cm2 and by using Equation (10) with appropriatesub)stitutions a calculated Rp value of 1,590 ohms.cm is obtained. In this
case, a better agreement is observed between measured and calculated Rp values.
it must be noted that it's difficult to use the "Rp" technique to uniquely
determine a corrosion rate for Al-7075 because of aluminum's tendency topit rather than uniformly corrode. This may explain why some
discrepancies are observed between calculated and experimentally
determined Rp values.
41
NSWC TR 86-26
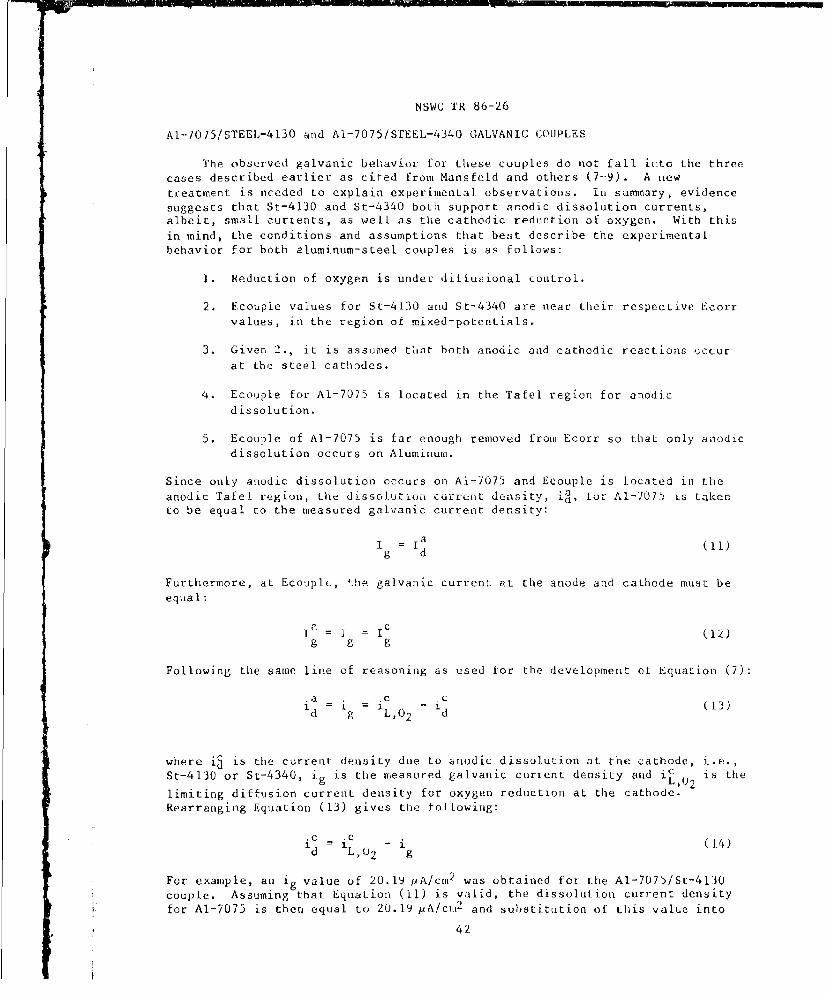
AI--7075/STEEL-4130 and AI-7075/STEEL-4340 GALVANIC COUPLES
The observed galvanic behavior for these couples do ,not fall into the threecases described earlier as cited from Mansfeld and others (7-9). A newtreatment is needed to explain experimental observations, in summary, evidencesuggests that St-4130 and St-4340 both support anodic dissolution currents,albeit, small currents, as well as the cathodic reduction of oxygen. With thisin mind, the conditions and assumptions that best describe the experimentalbehavior for both aluminum-steel couples is as follows:
1. Beduction of oxygen is under diffusional control.
2. Ecouple values for St-4130 and St-4340 are near their respective Ecorrvalues, in the region of mixed-potentials.
3. Given 2., it is assumed that both anodic and cathodic reactions ;ccurat the steel cathodes.
4. Ecouple for Al-7075 is located in the Tafel region for anodicdissolution.
5. Ecouole of Al-7075 is far enough removed from Ecorr so that only anodic
dissolution occurs on Aluminum.
Since only anodic dissolution occurs on Al-7075 and Ecouple is located in theanodic Tafel region, the dissolution current density, -a' fur AI-7075 is taken
to be equal to the measured galvanic current density:
I = C'1 (11)g d
Furthermore, at Ecouple, the galvanic current at the anode and cathode must beequal:
1' - I : Ic (12)g g g
Following the sane line of reasoning as used for the development of Equation (7):
id L g () L, 2 - d (
where i is the current density due to anodic dissolution at the cathode, i.e.,St-4130 or St-4340, ig is the measured galvanic curtent density and iL is the
limiting diffusion current density for oxygen reduction at the cathode.Rearranging Equation (13) gives the following:
.c .C. L, -i (14)d L , 0 2 g
For example, au i. value of 20.19 IA/cm2 was obtained for the Al-7075/St-4130couple. Assuming that Equation (11) is valid, the dissolution current densityfor Al-7075 is then equal to 20.19 pA/cr 2 and substitution of this value into
42
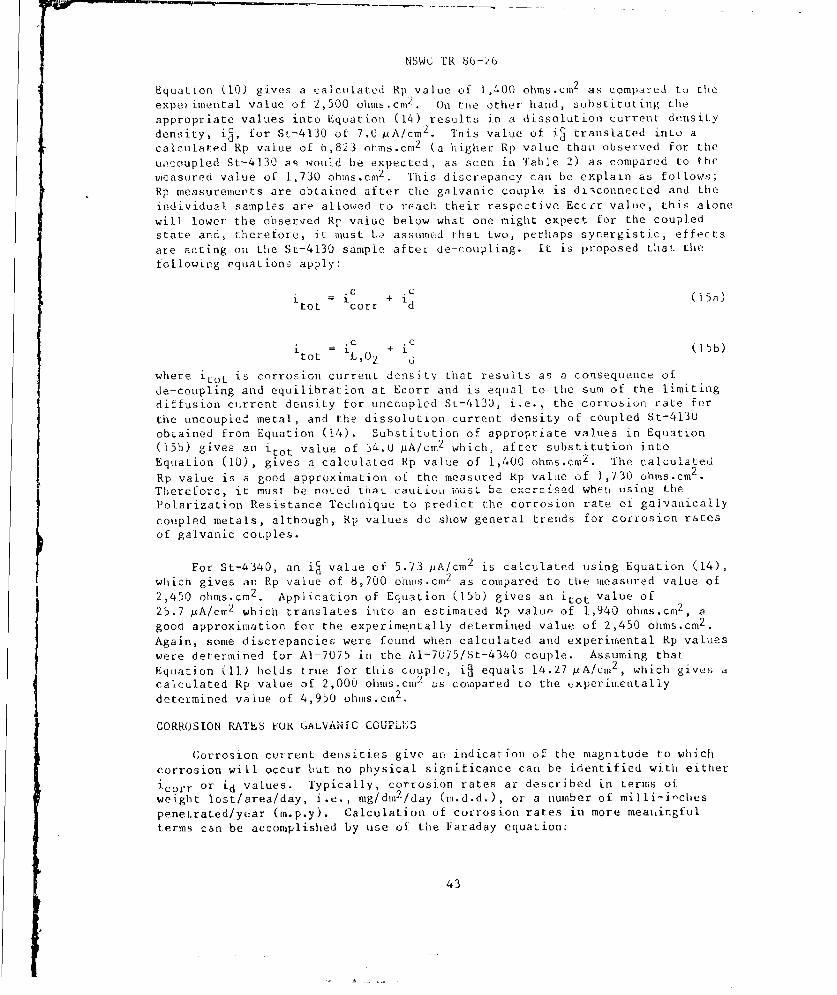
NSWC TR 8u-26
Equation (10) gives a calculated Rp value of 1,400 ohms.cm2 as compared to the
experimental value of 2,500 ohms.cm2 . On the other hand, substituting tile
appropriate values into Equation (14) results in a dissolution current density
density, ic, for St-4130 of 7.0 A/cm2 . This value of i' translated into a
calculated Rp value of 0,823 ohms.cm2 (a higher Rp value than observed for the
uozoupled St-4130 as would be expected, as seen in Table 2) as compared to the
measured value of 1,730 ohms.cnV-. This discrepancy can be explain as follows;
Rp measurements are obtained after the galvanic couple is disconnected and the
individual samples are allowed to reach their respective Eccrr value, this alone
will lower the observed Rp value below what one might expect for the coupled
state and, therefore, it must Lo assumed that two, perhaps synergistic, effects
are acting on the St-4130 sample after de-coupling. It is proposed that the
following equations apply:
IC , jd (15a)itot corr d
= t c + ld (15b)
tot ,02 d
where itot is corrosion currenL donsitV that results as a consequence of
de-coupling and equilibration at Ecorr and is equal to the sum of the limiting
diffusion current density for uncoupled St-4130, i.e., the corrosiou rate for
the uncoupled metal, and the dissolution current density of coupled St-4130
obtained from Equation (14). Substitution of appropriate values in Equation
(15b) gives an ito t value of 34.0 pA/cm2 which, after substitution into
Equation (10), gives a calculated Rp value of 1,400 ohms.cm2 . The calculated
Rp value is a good approximation of the measured Rp value of 1,730 ohms.cm2 .
Therefore, it must be noted thac cauLiua iust bc cxcrcised when 'ising the
Polarization Resistance Technique to predict the corrosion rate of galvanically
coupled metals, although, Rp values do show general trends for corrosion rates
of galvanic couples.
For St-4340, an i value of 5.73 pA/cm 2 is calculated using Equation (14),
which gives an Rp value of 8,700 ohns.cm2 as compared to the measured value of
2,450 ohms.cm 2 . Application of Equation (15b) gives an itot value of
25.7 pA/cm2 which translates into an estimated Rp value of 1,940 ohms.cM2 , a
good approximation for the experime ntally determined value of 2,450 ohms.cm2 .
Again, some discrepancies were fcund when calculated and experimental Rp values
were determined for AI-7075 in the Al-7075/St-4340 couple. Assuming that
Equation (11) holds true for this couple, ia equals 14.27 PA/cm2 , which givescalculated Rp value of 2,000 ohms.cm2 as compared to the experimentally
determined value of 4,950 ohms.cm2 .
CORROSION RATES OK GA.LVANIC COUPL
Corrosion current densities give an indication of the magnitude to which
corrosion will occur but no physical significance can be identified with either
icorr or id values. Typically, corrosion rates ar described in terms of
weight lost/area/day, i.e., mg/dnP2/day (m.d.d.), or a number of milli-i-,ches
penetrated/year (m.p.y). Calculation of corrosion rates in more meaningful
terms can be accomplished by use of the Faraday equation:
43
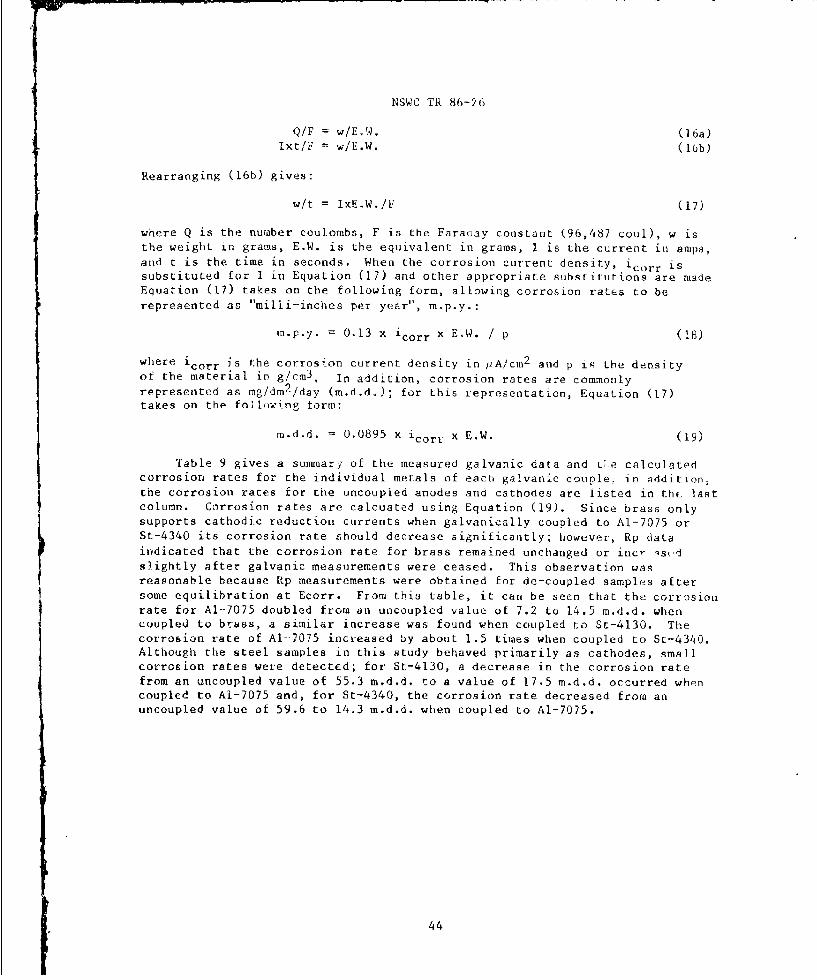
NSWC TR 86-26
Q/F = w/E W. (16a)
Ixt/F = w/E.W. (1ob)
Rearranging (16b) gives:
w/t = IxE.W./F (17)
where Q is the number coulombs, F is the Faracay constant (96,487 coul), w is
the weight in grams, E.W. is the equivalent in grams, 1 is the current in amps,and t is the time in seconds. When the corrosion current density, icorr issubstituted for 1 in Equation (17) and other appropriate substitutions are madeEquation (17) takes on the following form, allowing corrosion rates to be
represented as "milli-inches per year", m.p.y.:
m.p.y. = 0.13 x icorr x E.W. / p (08)
where icorr is the corrosion current density in jA/cm2 and p is the densityof the material in g/cm3 . In addition, corrosion rates are commonly
represented as mg/dm 2/day (m.d.d.); for this representation, Equation (17)takes on the following form:
m.d.d. = 0.0895 x icor X E.W. (19)
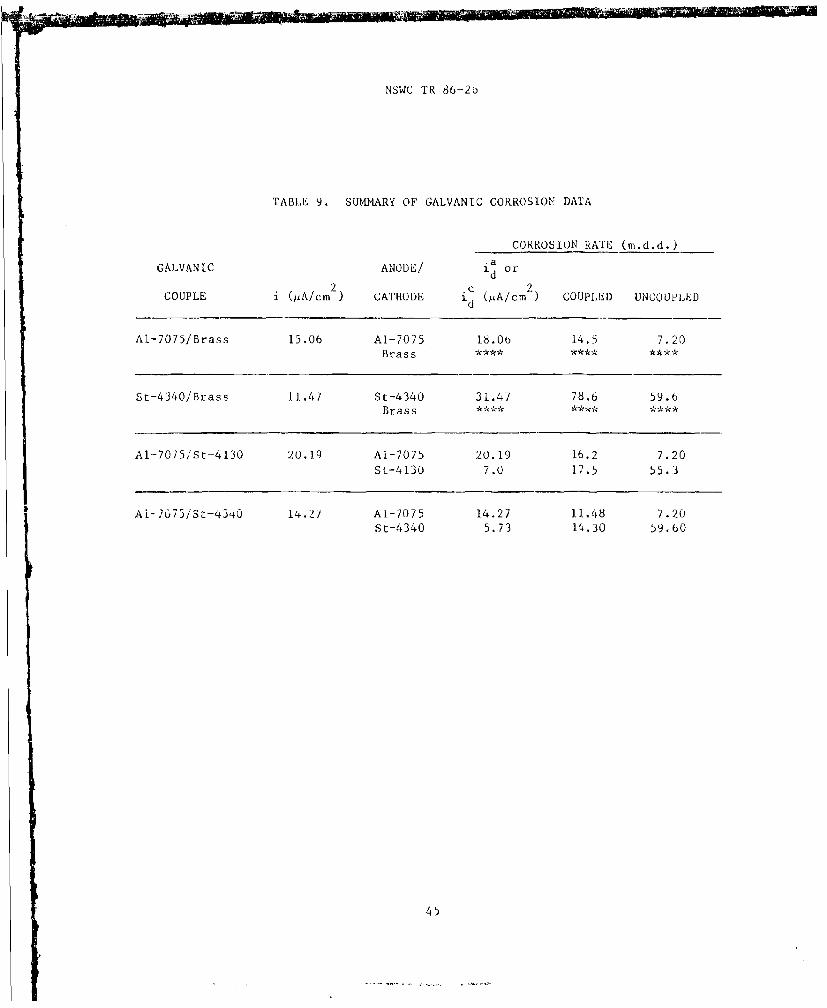
Table 9 gives a summary of the measured galvanic data and Ge calculatedcorrosion rates for the individual metals of each galvanic couple, in addition;
the corrosion rates tor the uncoupled anodes and cathodes are listed in tht lastcolumn. Corrosion rates are calcuated using Equation (19). Since brass onlysupports cathodic reduction currents when galvanically coupled to Al-7075 orSt-4340 its corrosion rate should decrease significantly; however, Rp data
indicated that the corrosion rate for brass remained unchanged or incr qs(dslightly after galvanic measurements were ceased. This observation wasreasonable because Rp measurements were obtained for de-coupled samples after
some equilibration at Ecorr. From this table, it cart be seen that the corrosionrate for Al-7075 doubled from an uncoupled value of 7.2 to 14.5 m.d.d. whencoupled to brass, a similar increase was found when coupled to St-4130. The
corrosion rate of Al--7075 increased by about 1.5 times when coupled to St-4340.Although the steel samples in this study behaved primarily as cathodes, smallcorrosion rates were detected; for St-4130, a decrease in the corrosion rate
from an uncoupled value of 55.3 m.d.d. to a value of 17.5 m-d.d. occurred whencoupled to AI-7075 and, for St-4340, the corrosion rate decreased from anuncoupled value of 59.6 to 14.3 m.d.d. when coupled to Al-7075.
44
NSWC TR 86--2b
TABLE 9. SUMMARY OF GALVANIC CORROSION DATA
CORROSION RATE (m.d.d.)
GALVANIC ANODE! a or
COUPLE i (pA/cm ) CATHtODE i d (,ttA/cm ) COUPLED UNCOUPLED
Ai-7075/Brass 15.06 Al-7075 18.06 14.5 7.20Brass ***
St-4340/Brass 11.47 St-4340 31.47 78.6 59.6Brass
AI-7075'St-4130 201.9 Ai-7075 20.19 16.2 7.20
St-4130 7.0 17.5 55,3j
Ai- O75/SL-43,0 14.27 Al-7075 14.27 11.48 7.20
St-4340 5.73 14,30 59,60
45
.SWC TR 86-26
CHAPTER 5
CONCLUS iONS
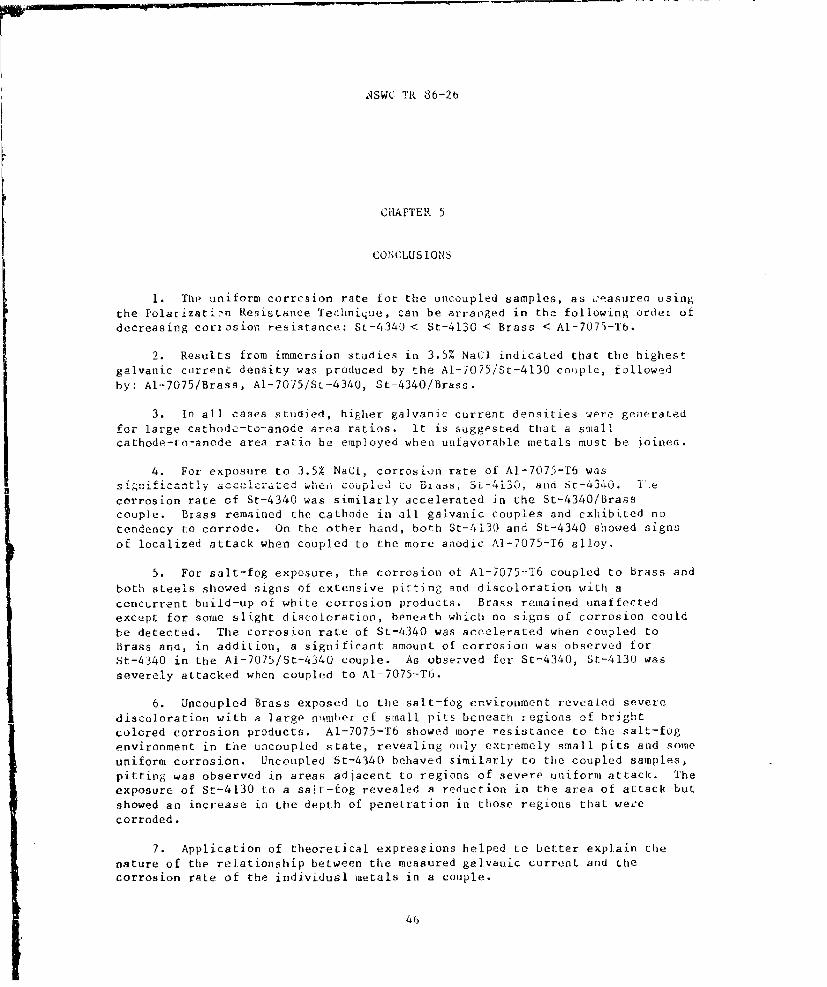
1. The? uniform corrosion rate for the uncoupled samples, as ,easured using
the Polarizati.rn Resistance Technique, can be arranged in the following order of
decreasing corr osion resistance: St-4340 < St-4130 < Brass < Al-7075-T6.
2. Results from immersion studies in 3.5% NaC] indicated that the highest
galvanic current density was produced by the Al-7075/St-4130 couple, followed
by: Al.-7075/Brass, A-7075/St-4340, St-4340/Brass.
3. in all cases studied, higher galvanic current densities were generated
for large cathode-to-anode area ratios. It is suggested that a smallcathode-to-anode area ratio be employed when unfavorable metals must be joined.
4. For exposure to 3.5% NaCl, corrosion rate of Ai-7075-T6 was
aIgnificantly aCCIc laULd w cu .. up. d Lu Dm5a, SL-4i30, and Sr-434u. I .e
corrosion rate of St-4340 was similarly accelerated in the St-4340/Brasscouple. Brass remained the cathode in all galvanic couples and exhibited no
tendency to corrode. On the other hand, both St-4130 and St-4340 showed signs
of localized attack when coupled to the more anodic AI-7075-T6 alloy.
5. For salt-fog exposure, the corrosion of Al-7075--T6 coupled to Brass and
both steels showed signs of extensive pitting and discoloration with a
concurrent build-up of white corrosion products. Brass remained unaffected
except for some slight discoloration, beneath which no signs of corrosion could
be detected. The corrosion rate of St-4340 was accelerated when coupled to
Brass and, in addition, a significant amount of corrosion was observed for
St-4340 in the Al-7075/St-4340 couple. As observed for St-4340, St-4130 was
severely attacked when coupled to Ai-7075-T6.
6. Uncoupled Brass exposed to the salt-fog environment reveaied severe
discoloration with a large number of small pits beneath regions of bright
colored corrosion products. AI-7075-T6 showed more resistance to the salt-fog
environment in the uncoupled state, revealing ouly ectremely small pits and some
uniform corrosion. Uncoupled St-4340 behaved similarly to the coupled samples,
pitting was observed in areas adjacent to regions of severe uniform attack. The
exposure of St-4130 to a salt-fog revealed a reduction in the area of attack but
showed an increase in the depth of penetration in those regions that wec'e
corroded.
7. Application of theoretical expressions helped to better explain the
nature of the relationship between the measured galvanic current and thecorrosion rate of the individual metals in a couple.
46
NSWC TR 86-26
8. Experlmental as well as theoretical treatments showed thatnon-negligible anodic reactions occurre-d aL the steel cathodes when galvanicallycoupled to AI-7075-T6, however, a decrease in1 the corrosion rate for bothSt-4340 and St-4130 cau be expected when coupling to AI-7075-T6 occurs.
9. A comparison was made between measured Rp values and calculatedcorrosion rate values. Careful consideration and caution must be exercised whenRp measurements are used to determine corrosion rates for galvanic couples.
47/48
NSVC TR 86-26
RI: FERENCES
S 1. M-msfeld, F., and Kenkel, J. V., Ed., Gavanic. and Pittin Corrosion-Field
and laboratory Studies (Philadelphia, PA: A.S.T.M., STP 576, 1976), p. 20.
2. Baboian, R,, ibid., p. 5.
3. Reboul, M. C., Corrosion, Vol. 35, No. 9, 1979, p. 423,
4. Nansfeld, F., lIcngstenbcrg, 1. It., and Kenkel, J. V., Corrosion, Vol. 30,No. 10, 1974, p. 343.
5. Stern, M., and Geary, A. L., J. Electrochem. Soc., Vol. 104, 1957, n. 56.
6 Pryor, M. J., and Kier, D, S., J. Electrochem. Soc., Vol. 102, No. 10, 1955,Fp. 605.
7. Mansfeld, F., and Parry, E. P., Corr. Sci., Vol. 13, 1973, p. 605.
___ 8. Mansfeld, F., Corrosion, Vol. 27, 1971, p. 436.
9. Mansfeid, F., Corro3ion, Vol.. 29, 1973, p. 403.
10. Stern, M., Corrosion, Vol. 14, 1958, p. 60.
-° 49
n --
NSWC TR 86-26
DISTRIBUTION
Cojjes Cop ies
Office of Naval hesearch Department of the Army
Attn: S. Fishman, Code 1131 2 Attn: A. Levitt 1
800 N. Quincy St. AMMRC
Arlington, VA 22217 DRXMR-MMC, Bldg. 39
Watertown, MA 02172
office of Deputy Undersecretary
of Defense Engineering Naval Research Laboratory
Staff Specialist for Materials Attn: R. Crowe, Code 6372 1
Attn: J. Persh 1 E. McCafferty 1
Washington, DC 20301 P. Trzaskoma 1
P. Natishan 1
Defense Advanced Research Washington, DC 20375
Attn: P. Parrish 1
1400 Wilson Blvd. Naval Material Command
Arlington, VA 22209 Office of Naval Technology
Attn: J.J. Kelly, Code 0725 1
Naval Ocean Systems Command A.J. Sedrike, Code 431 1
Attn: P.D. Burke, Code 932 1 Washington, DC 20360
San Diego, CA 92152Defense Technical Information Center
Nava . Surfac o , ..pons Center cameron Starion
Attn: K. Musselman, Code R35 2 Alexandria, VA 22314 12
J. Hall, Code R35 2
Dahlgren, VA 22448 Naval Sea Systems Command
Attn: S. Rodgers, SEA 05MI I
Naval Air Development Center H. Bliele, SEA 05MI i
Attn: V. Agarwala, Code 6062 2 Washington, DC 20362
J. Thompson, Code 6062 2
Warminster, PA 18974-5000 David Taylor Naval Ship Research
and Development Center
U.S. Bureau of the Mines Attn: I. Morton, Code 2813 1
Attn: C. O'Dell 1 H. 'ack, Code 2813 1
4900 LaSalle Road J. Scully, Code 2813 1
Avondale, MD 20782 D. Aylor, Code 2813 1
Bethesda, MD 2384
John Hopkins University
Dept. of Material Science and Vancc Sage
Engineering FMS 400C52 1
Attn: J. Kruger 1 NiC210S18
P. Moran 1 2521 Jefierson Davis Hwy.
J, Prentice 1 Arlington, VA 22202
Maryland Hall
Baltimore, MD 21.218 University of Virginia
Dept. of Materials Science
Librar Of Attn: G. Stoner 1
Attn: Cift and xchange Division G. Cohen
Washinlgtoni, 1)C 20 540C 4 Thornton HallCharlottesville, VA 22901
(1)
NSWC TR 86-26
DISTRIBUTION (Cont.)
Copiez
Internal Distribution:R33 (J.F. McIntyre) 10R33 (C.E. Mueller) 1R33 (D. Warburton) 1R33 (Staff) 25R30 2R32 (S. Hoover) 1R32 (K. Vasanth) 1R32 (J. Jarus) 1R32 (W. Leej 1R35 (E.P. Lefeave) 1E35 1E2 31 9E2 32 3
(2)