Embed Size (px)
Citation preview
Universidade Estadual de CampinasInstituto de Computação
INSTITUTO DECOMPUTAÇÃO
Luana Loubet Borges
BioGraph: Linking Biological Bases Across Organisms
BioGraph: Conectando Bases Biológicas de MúltiplosOrganismos
CAMPINAS2016
Luana Loubet Borges
BioGraph: Linking Biological Bases Across Organisms
BioGraph: Conectando Bases Biológicas de MúltiplosOrganismos
Dissertação apresentada ao Instituto deComputação da Universidade Estadual deCampinas como parte dos requisitos para aobtenção do título de Mestra em Ciência daComputação.
Thesis presented to the Institute of Computingof the University of Campinas in partialfulfillment of the requirements for the degree ofMaster in Computer Science.
Supervisor/Orientador: Prof. Dr. André Santanchè
Este exemplar corresponde à versão final daDissertação defendida por Luana LoubetBorges e orientada pelo Prof. Dr. AndréSantanchè.
CAMPINAS2016
Agência(s) de fomento e nº(s) de processo(s): CAPES, 01P-3501-2014
Ficha catalográficaUniversidade Estadual de Campinas
Biblioteca do Instituto de Matemática, Estatística e Computação CientíficaMaria Fabiana Bezerra Muller - CRB 8/6162
Borges, Luana Loubet, 1992- B644b BorBioGraph : linking biological bases across organisms / Luana Loubet
Borges. – Campinas, SP : [s.n.], 2016.
BorOrientador: André Santanchè. BorDissertação (mestrado) – Universidade Estadual de Campinas, Instituto de
Computação.
Bor1. Banco de dados. 2. Ontologias (Recuperação da informação). I.
Santanchè, André,1968-. II. Universidade Estadual de Campinas. Instituto deComputação. III. Título.
Informações para Biblioteca Digital
Título em outro idioma: BioGraph : conectando bases biológicas de múltiplos organismosPalavras-chave em inglês:DatabaseOntologies (Information retrieval)Área de concentração: Ciência da ComputaçãoTitulação: Mestre em Ciência da ComputaçãoBanca examinadora:André Santanchè [Orientador]Julio Cesar dos ReisDebora Pignatari DruckerData de defesa: 05-08-2016Programa de Pós-Graduação: Ciência da Computação
Powered by TCPDF (www.tcpdf.org)
Universidade Estadual de CampinasInstituto de Computação
INSTITUTO DECOMPUTAÇÃO
Luana Loubet Borges
BioGraph: Linking Biological Bases Across Organisms
BioGraph: Conectando Bases Biológicas de MúltiplosOrganismos
Banca Examinadora:
• Prof. Dr. André Santanchè (Orientador)Instituto de Computação - Unicamp
• Dr. Julio Cesar Dos ReisInstituto de Computação - Unicamp
• Dra. Debora Pignatari DruckerEMBRAPA
A ata da defesa com as respectivas assinaturas dos membros da banca encontra-se noprocesso de vida acadêmica do aluno.
Campinas, 05 de agosto de 2016
Dedico este trabalho aos meuspais, Marcos e Nereide, pelo
imenso amor e sacrifíciopara que eu chegasse até aqui.
Agradecimentos
"Mesmo longe dos meus, mesmo na solidão, te louvo, te louvo em verdade". Agradeçoprimeiramente a Deus, por ter me capacitado, amado e amparado durante toda a minhavida.
Ao professor André Santanchè, o orientador e amigo mais generoso que eu poderia ter.Que trouxe luz para o meu caminho. A quem eu serei eternamente grata.
Ao meu grande amor, a mulher mais doce, carinhosa e amorosa a quem eu tenho afelicidade de chamar de mãe. Ao meu pai, Marcos, o meu maior incentivador, por sempreter acreditado em mim e por todo o seu amor. Ao meu amado namorado, Junior, pelo seuprofundo amor, companheirismo, cuidado e paciência. Aos meus irmãos Marcos Aurélio,Kassio e Kamila. Vocês todos são os pilares do amor que me sustenta.
Ao Matheus, pela sua amizade, por estar sempre disposto a ouvir minhas inquietaçõese sempre me fazer rir, tornando os meus dias mais leves.
Ao Hércules, meu melhor amigo, por estar sempre presente com sua infinita bondade.À todos os membros do LIS, por criarem o melhor laboratório, o mais aconchegante
e acolhedor do qual eu poderia fazer parte, pelas contribuições ao longo deste projeto epelas amizades construídas. Especialmente a Fagner, Francisco, Márcio, Ive e Patrícia.
À todos os meus velhos e novos amigos que sempre me acompanham e me transmitemforça, em especial Bruna Strack, Victor, Daniela, Mariane, Yumi, Bruna Borges, Priscilla,Jacqueline e Lucas.
Aos professores da graduação, que foram igualmente importantes para mais essa con-quista, em especial Liana, Paulo Pagliosa, Débora, Francisco, Luciana e Nalvo.
Finalmente, agradeço à secretaria do IC e às agências de fomento pelo suporte fi-nanceiro que, direta ou indiretamente, contribuíram para a realização desta pesquisa:FAPESP (2013/02269-7), FAPESP/Cepid em Ciência e Engenharia da Computação (2013-/08293-7), Instituto Virtual de Pesquisa FAPESP-Microsoft (projeto NavScales - 11/52070-7), CNPq (projeto MuZOO), FAPESP-PRONEX (projeto eScience), INCT em CiênciaWeb, CNPq e CAPES (01P-3501-2014). As opiniões expressas neste trabalho não neces-sariamente refletem as opiniões das agência de fomento.
Resumo
A representação de dados como redes tem se mostrado uma poderosa abordagem paraanálises de dados em biodiversidade, e.g., interações entre organismos; relações entre ge-nes e fenótipos etc. Neste contexto, bancos de dados e repositórios seguindo um modelo degrafo (e.g., RDF) têm sido cada vez mais utilizados para interconectar informações e paradar suporte a análises dirigidas a redes. Usualmente, este tipo de análise requer a coletae ligação de dados advindos de várias fontes distintas e heterogêneas. Neste trabalho, nósinvestigamos este desafio no contexto de bases biológicas com foco na caracterização deorganismos vivos, especialmente seus fenótipos e doenças. Isto inclui a rica diversidade deModel Organisms Database (MODs) – repositórios especializados em um taxon particular– amplamente usados em estudos médicos e biológicos. Nós exploramos uma abordagemde integração leve, inspirada na iniciativa de Linked Open Data, mapeando várias basesbiológicas em um banco de dados de grafos unificado – nosso BioGraph – e interligandoelementos-chave para oferecer uma perspectiva interconectada sobre os dados. Apresen-tamos aqui experimentos práticos para validar a proposta e para demonstrar como oBioGraph pode contribuir para análises de dados biológicos em uma ótica de redes.
Abstract
Representing data as networks have been shown to be a powerful approach for dataanalysis in biodiversity, e.g., interactions among organisms; relations among genes andphenotypes etc. In this context, databases and repositories following a graph model (e.g.,RDF) have been increasingly used to interconnect information and to support network-driven analysis. Usually, this kind of analysis requires gathering together and linking datafrom several distinct and heterogeneous sources. In this work, we investigate this challengein the context of biological bases focusing on the characterization of living organisms,especially their phenotypes and diseases. It includes the rich diversity of Model OrganismDatabases (MODs) – repositories specialized in a particular taxon – widely used in thebiological and medical studies. We exploit a lightweight integration approach, inspiredin the Linked Open Data initiative, mapping several biological bases in a unified graphdatabase – our BioGraph – and linking key elements to offer an interconnected view overthe data. We present here practical experiments to validate the proposal and to showhow BioGraph can contribute for biological data analysis in a network perspective.
List of Figures
2.1 Example of Mutation Gene. Source: Kohler [24] . . . . . . . . . . . . . . . 182.2 Phenotype Description Approaches. . . . . . . . . . . . . . . . . . . . . . . 192.3 Structure of a ZP statement. . . . . . . . . . . . . . . . . . . . . . . . . . . 202.4 Example of a molecular function. Source: (http://amigo.geneontology.
org/amigo). . . . . . . . . . . . . . . . . . . . . . . . . . . . . . . . . . . . 222.5 Example of a biological process. Source: (http://amigo.geneontology.
org/amigo). . . . . . . . . . . . . . . . . . . . . . . . . . . . . . . . . . . . 232.6 Example of a cellular component. Source: (http://amigo.geneontology.
org/amigo). . . . . . . . . . . . . . . . . . . . . . . . . . . . . . . . . . . . 232.7 Graph of a Gene Ontology. Source: Marbach et al. [30]. . . . . . . . . . . . 242.8 Architecture Intermine. Source: Smith et al. [44] . . . . . . . . . . . . . . 242.9 Identifiers InterMine. . . . . . . . . . . . . . . . . . . . . . . . . . . . . . . 252.10 Mines from Intermine. . . . . . . . . . . . . . . . . . . . . . . . . . . . . . 262.11 MouseMine: To obtain data part 1. . . . . . . . . . . . . . . . . . . . . . . 262.12 MouseMine: To obtain data part 2. . . . . . . . . . . . . . . . . . . . . . . 272.13 MouseMine: To obtain data part 3. . . . . . . . . . . . . . . . . . . . . . . 282.14 Intermine Web Services. Source: Kalderimis et al. [22] . . . . . . . . . . . 282.15 Uberon. Source: Mungall et al. [32] . . . . . . . . . . . . . . . . . . . . . . 292.16 Uberon Classes. Source: (http://pt.slideshare.net/cmungall/ uberon-cl-
workshophaendel). . . . . . . . . . . . . . . . . . . . . . . . . . . . . . . . 292.17 Uberon Composition. Source: (http://pt.slideshare.net/cmungall/
uberon-cl-workshophaendel). . . . . . . . . . . . . . . . . . . . . . . . . 302.18 Uberpheno linking Mouse, Human and Zebrafish. Source: Kohler el. al. [25] 302.19 Performance test between Neo4j and PostGree by InterMine. Source: (https:
//intermineorg.wordpress.com/) . . . . . . . . . . . . . . . . . . . . . . 31
3.1 (a) ZFIN partial database model of phenotypes. (b) MGI partial databasemodel of phenotypes. . . . . . . . . . . . . . . . . . . . . . . . . . . . . . . 33
3.2 Unified Model. . . . . . . . . . . . . . . . . . . . . . . . . . . . . . . . . . 333.3 Mapped Model. . . . . . . . . . . . . . . . . . . . . . . . . . . . . . . . . . 343.4 Mapped Model to Graph. . . . . . . . . . . . . . . . . . . . . . . . . . . . 35
4.1 Architecture of project. . . . . . . . . . . . . . . . . . . . . . . . . . . . . . 374.2 Extract Transform Load. . . . . . . . . . . . . . . . . . . . . . . . . . . . . 374.3 Data downloaded from InterMine. . . . . . . . . . . . . . . . . . . . . . . . 384.4 Uberon and Uberpheno. . . . . . . . . . . . . . . . . . . . . . . . . . . . . 394.5 Example of terms interlinked by Uberon and Uberpheno. . . . . . . . . . . 404.6 Example of the interlinks among organisms. . . . . . . . . . . . . . . . . . 404.7 Example of the interlinks among organisms with disease and symptom. . . 41
4.8 Knowledge generation. . . . . . . . . . . . . . . . . . . . . . . . . . . . . . 424.9 Example of the knowledge generation. . . . . . . . . . . . . . . . . . . . . . 434.10 Domain Model. . . . . . . . . . . . . . . . . . . . . . . . . . . . . . . . . . 44
5.1 Graph template for the query that returns organisms with the same phe-notype. . . . . . . . . . . . . . . . . . . . . . . . . . . . . . . . . . . . . . . 46
5.2 Graph template for the query that returns all organisms with the phenotype"iris hypoplastic". . . . . . . . . . . . . . . . . . . . . . . . . . . . . . . . . 46
5.3 Correlating symptoms in BioGraph. . . . . . . . . . . . . . . . . . . . . . . 475.4 Example of the correlating symptoms in BioGraph. . . . . . . . . . . . . . 475.5 PageRank among symptoms that shared disease. . . . . . . . . . . . . . . . 485.6 PageRank among symptoms that shared entities. . . . . . . . . . . . . . . 495.7 A screenshot of Xper with zebrafish data. . . . . . . . . . . . . . . . . . . . 505.8 BioGraph–Xper connection; adapted from Cavoto el. al. [11]. . . . . . . . . 515.9 BioGraph to Xper mapping process. . . . . . . . . . . . . . . . . . . . . . . 51
Nomenclature
API Application Programming Interface
BED Browser Extensible Data
CSV Comma-Separated Values
DO Disease Ontology
EQ Entity - Quality
ETL Extract Transform Load
GFF General Feature Format
GO Gene Ontology
HP Human Phenotype Ontology
JSON Javascript Object Notation
MGI Mouse Genomic Informatics
MOD Model Organism Database
MP Mammalian Phenotype Ontology
OBO Open Biomedical Ontologies
OMIM Online Mendelian Inheritance in Man
OWL Web Ontology Language
PATO Phenotype and Trait Ontology
RDF Resource Description Framework
SDD Structured Descriptive Data
SO Sequence Ontology
SQL Structured Query Language
SYMP Symptom Ontology
UML Unified Modeling Language
Xenbase Xenopus Anatomical Ontology
XML Extensible Markup Language
ZFA Zebrafish Anatomy and Development Ontology
ZFIN Zebrafish Information Network
ZP Zebrafish Phenotype Ontology
Contents
1 Introduction 15
2 Foundations and Related Work 172.1 Genotype and Phenotype . . . . . . . . . . . . . . . . . . . . . . . . . . . . 172.2 Describing Phenotypes . . . . . . . . . . . . . . . . . . . . . . . . . . . . . 182.3 Data Sources . . . . . . . . . . . . . . . . . . . . . . . . . . . . . . . . . . 19
2.3.1 MOD . . . . . . . . . . . . . . . . . . . . . . . . . . . . . . . . . . . 192.3.2 Disease and Symptom . . . . . . . . . . . . . . . . . . . . . . . . . 20
2.4 Interlinking Datasets . . . . . . . . . . . . . . . . . . . . . . . . . . . . . . 202.5 Gene Ontology . . . . . . . . . . . . . . . . . . . . . . . . . . . . . . . . . 212.6 InterMine . . . . . . . . . . . . . . . . . . . . . . . . . . . . . . . . . . . . 23
2.6.1 Database . . . . . . . . . . . . . . . . . . . . . . . . . . . . . . . . 242.6.2 Web Application . . . . . . . . . . . . . . . . . . . . . . . . . . . . 252.6.3 Web Services . . . . . . . . . . . . . . . . . . . . . . . . . . . . . . 26
2.7 Uberon and Uberpheno . . . . . . . . . . . . . . . . . . . . . . . . . . . . . 272.8 Graph Databases and Biological Graph Databases . . . . . . . . . . . . . . 28
3 Unified Model 323.1 UML Model . . . . . . . . . . . . . . . . . . . . . . . . . . . . . . . . . . . 323.2 Graph Model . . . . . . . . . . . . . . . . . . . . . . . . . . . . . . . . . . 34
4 Building BioGraph 364.1 Architecture . . . . . . . . . . . . . . . . . . . . . . . . . . . . . . . . . . . 364.2 ETL Process . . . . . . . . . . . . . . . . . . . . . . . . . . . . . . . . . . . 364.3 Ingest and Linking . . . . . . . . . . . . . . . . . . . . . . . . . . . . . . . 384.4 Inference . . . . . . . . . . . . . . . . . . . . . . . . . . . . . . . . . . . . . 404.5 Statistics . . . . . . . . . . . . . . . . . . . . . . . . . . . . . . . . . . . . . 42
5 Experimental Results 455.1 Searching . . . . . . . . . . . . . . . . . . . . . . . . . . . . . . . . . . . . 455.2 Analyzing . . . . . . . . . . . . . . . . . . . . . . . . . . . . . . . . . . . . 465.3 Describing . . . . . . . . . . . . . . . . . . . . . . . . . . . . . . . . . . . . 48
6 Conclusion 52
Bibliography 53
A XQuery Code 58
B ZFA Terms in XML 59
C ZP Terms in XML 61
D PATO Terms in XML 63
E Result in SDD 65
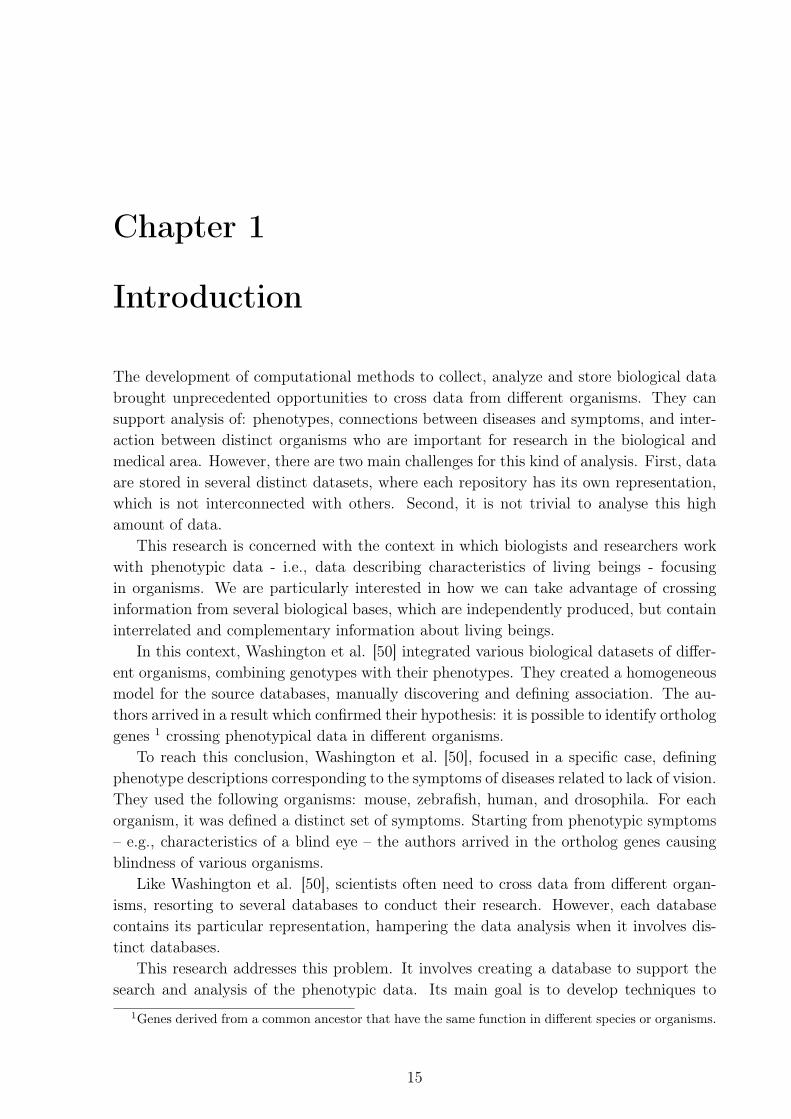
Chapter 1
Introduction
The development of computational methods to collect, analyze and store biological databrought unprecedented opportunities to cross data from different organisms. They cansupport analysis of: phenotypes, connections between diseases and symptoms, and inter-action between distinct organisms who are important for research in the biological andmedical area. However, there are two main challenges for this kind of analysis. First, dataare stored in several distinct datasets, where each repository has its own representation,which is not interconnected with others. Second, it is not trivial to analyse this highamount of data.
This research is concerned with the context in which biologists and researchers workwith phenotypic data - i.e., data describing characteristics of living beings - focusingin organisms. We are particularly interested in how we can take advantage of crossinginformation from several biological bases, which are independently produced, but containinterrelated and complementary information about living beings.
In this context, Washington et al. [50] integrated various biological datasets of differ-ent organisms, combining genotypes with their phenotypes. They created a homogeneousmodel for the source databases, manually discovering and defining association. The au-thors arrived in a result which confirmed their hypothesis: it is possible to identify orthologgenes 1 crossing phenotypical data in different organisms.
To reach this conclusion, Washington et al. [50], focused in a specific case, definingphenotype descriptions corresponding to the symptoms of diseases related to lack of vision.They used the following organisms: mouse, zebrafish, human, and drosophila. For eachorganism, it was defined a distinct set of symptoms. Starting from phenotypic symptoms– e.g., characteristics of a blind eye – the authors arrived in the ortholog genes causingblindness of various organisms.
Like Washington et al. [50], scientists often need to cross data from different organ-isms, resorting to several databases to conduct their research. However, each databasecontains its particular representation, hampering the data analysis when it involves dis-tinct databases.
This research addresses this problem. It involves creating a database to support thesearch and analysis of the phenotypic data. Its main goal is to develop techniques to
1Genes derived from a common ancestor that have the same function in different species or organisms.
15
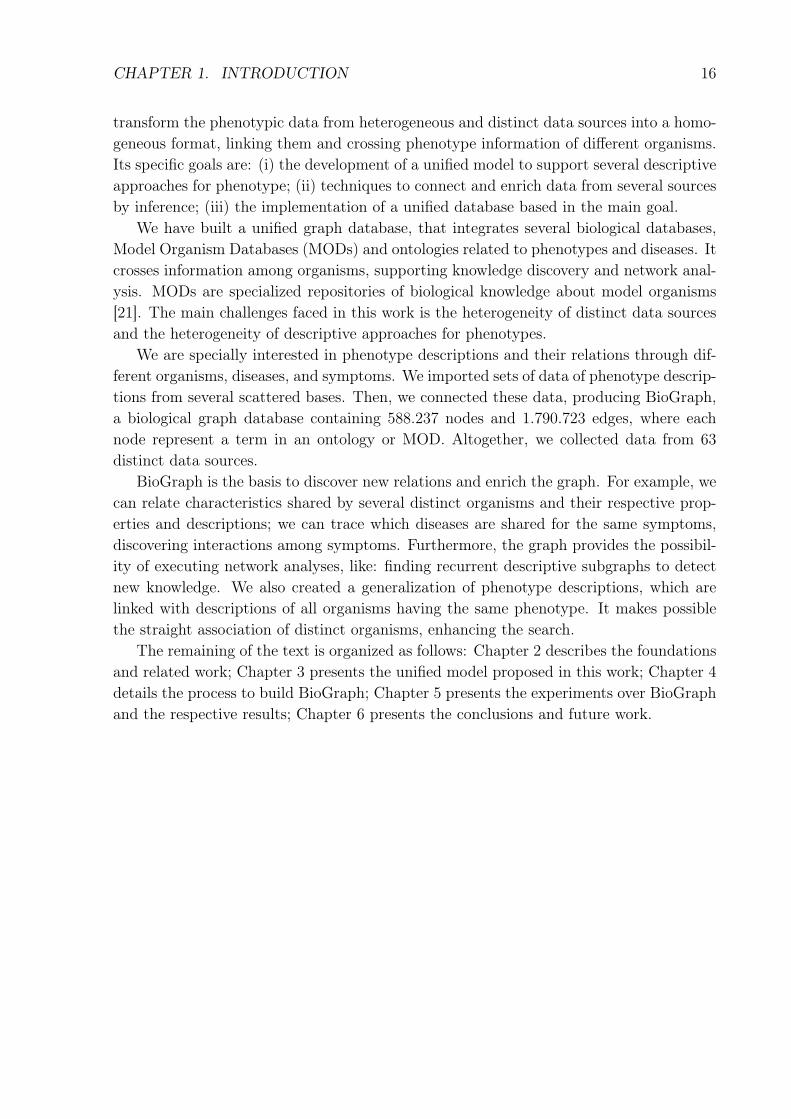
CHAPTER 1. INTRODUCTION 16
transform the phenotypic data from heterogeneous and distinct data sources into a homo-geneous format, linking them and crossing phenotype information of different organisms.Its specific goals are: (i) the development of a unified model to support several descriptiveapproaches for phenotype; (ii) techniques to connect and enrich data from several sourcesby inference; (iii) the implementation of a unified database based in the main goal.
We have built a unified graph database, that integrates several biological databases,Model Organism Databases (MODs) and ontologies related to phenotypes and diseases. Itcrosses information among organisms, supporting knowledge discovery and network anal-ysis. MODs are specialized repositories of biological knowledge about model organisms[21]. The main challenges faced in this work is the heterogeneity of distinct data sourcesand the heterogeneity of descriptive approaches for phenotypes.
We are specially interested in phenotype descriptions and their relations through dif-ferent organisms, diseases, and symptoms. We imported sets of data of phenotype descrip-tions from several scattered bases. Then, we connected these data, producing BioGraph,a biological graph database containing 588.237 nodes and 1.790.723 edges, where eachnode represent a term in an ontology or MOD. Altogether, we collected data from 63distinct data sources.
BioGraph is the basis to discover new relations and enrich the graph. For example, wecan relate characteristics shared by several distinct organisms and their respective prop-erties and descriptions; we can trace which diseases are shared for the same symptoms,discovering interactions among symptoms. Furthermore, the graph provides the possibil-ity of executing network analyses, like: finding recurrent descriptive subgraphs to detectnew knowledge. We also created a generalization of phenotype descriptions, which arelinked with descriptions of all organisms having the same phenotype. It makes possiblethe straight association of distinct organisms, enhancing the search.
The remaining of the text is organized as follows: Chapter 2 describes the foundationsand related work; Chapter 3 presents the unified model proposed in this work; Chapter 4details the process to build BioGraph; Chapter 5 presents the experiments over BioGraphand the respective results; Chapter 6 presents the conclusions and future work.
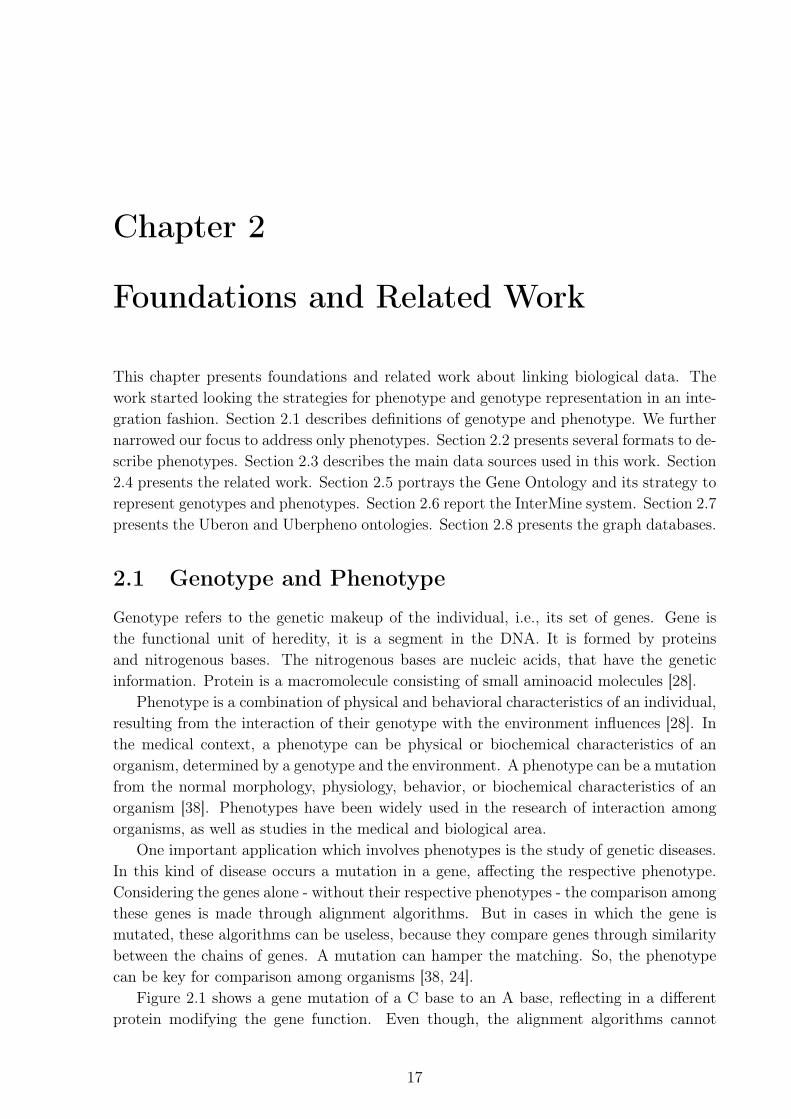
Chapter 2
Foundations and Related Work
This chapter presents foundations and related work about linking biological data. Thework started looking the strategies for phenotype and genotype representation in an inte-gration fashion. Section 2.1 describes definitions of genotype and phenotype. We furthernarrowed our focus to address only phenotypes. Section 2.2 presents several formats to de-scribe phenotypes. Section 2.3 describes the main data sources used in this work. Section2.4 presents the related work. Section 2.5 portrays the Gene Ontology and its strategy torepresent genotypes and phenotypes. Section 2.6 report the InterMine system. Section 2.7presents the Uberon and Uberpheno ontologies. Section 2.8 presents the graph databases.
2.1 Genotype and Phenotype
Genotype refers to the genetic makeup of the individual, i.e., its set of genes. Gene isthe functional unit of heredity, it is a segment in the DNA. It is formed by proteinsand nitrogenous bases. The nitrogenous bases are nucleic acids, that have the geneticinformation. Protein is a macromolecule consisting of small aminoacid molecules [28].
Phenotype is a combination of physical and behavioral characteristics of an individual,resulting from the interaction of their genotype with the environment influences [28]. Inthe medical context, a phenotype can be physical or biochemical characteristics of anorganism, determined by a genotype and the environment. A phenotype can be a mutationfrom the normal morphology, physiology, behavior, or biochemical characteristics of anorganism [38]. Phenotypes have been widely used in the research of interaction amongorganisms, as well as studies in the medical and biological area.
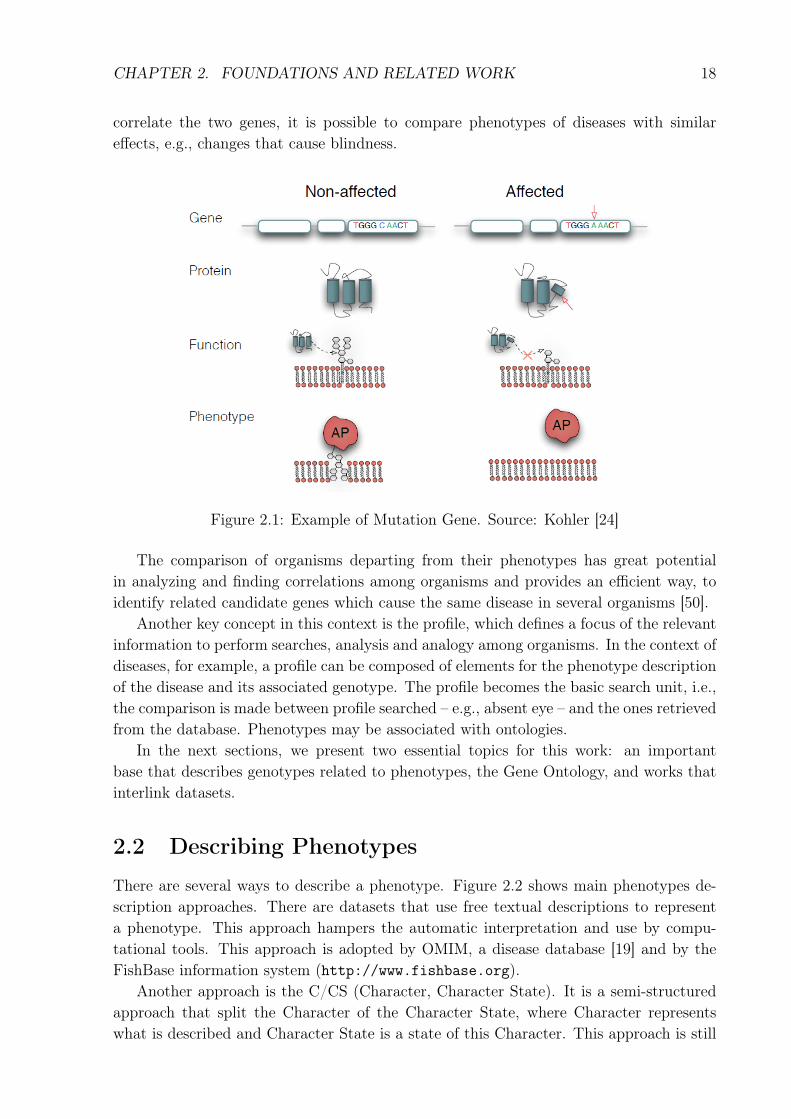
One important application which involves phenotypes is the study of genetic diseases.In this kind of disease occurs a mutation in a gene, affecting the respective phenotype.Considering the genes alone - without their respective phenotypes - the comparison amongthese genes is made through alignment algorithms. But in cases in which the gene ismutated, these algorithms can be useless, because they compare genes through similaritybetween the chains of genes. A mutation can hamper the matching. So, the phenotypecan be key for comparison among organisms [38, 24].
Figure 2.1 shows a gene mutation of a C base to an A base, reflecting in a differentprotein modifying the gene function. Even though, the alignment algorithms cannot
17
CHAPTER 2. FOUNDATIONS AND RELATED WORK 18
correlate the two genes, it is possible to compare phenotypes of diseases with similareffects, e.g., changes that cause blindness.
Figure 2.1: Example of Mutation Gene. Source: Kohler [24]
The comparison of organisms departing from their phenotypes has great potentialin analyzing and finding correlations among organisms and provides an efficient way, toidentify related candidate genes which cause the same disease in several organisms [50].
Another key concept in this context is the profile, which defines a focus of the relevantinformation to perform searches, analysis and analogy among organisms. In the context ofdiseases, for example, a profile can be composed of elements for the phenotype descriptionof the disease and its associated genotype. The profile becomes the basic search unit, i.e.,the comparison is made between profile searched – e.g., absent eye – and the ones retrievedfrom the database. Phenotypes may be associated with ontologies.
In the next sections, we present two essential topics for this work: an importantbase that describes genotypes related to phenotypes, the Gene Ontology, and works thatinterlink datasets.
2.2 Describing Phenotypes
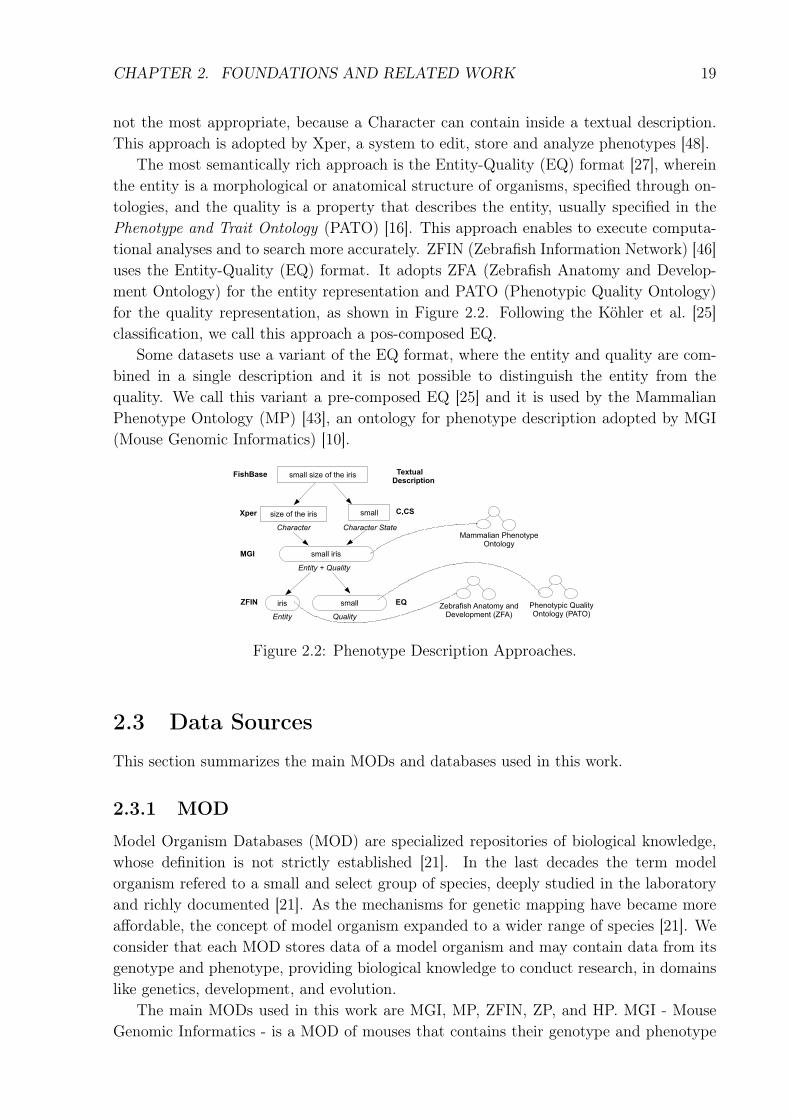
There are several ways to describe a phenotype. Figure 2.2 shows main phenotypes de-scription approaches. There are datasets that use free textual descriptions to representa phenotype. This approach hampers the automatic interpretation and use by compu-tational tools. This approach is adopted by OMIM, a disease database [19] and by theFishBase information system (http://www.fishbase.org).
Another approach is the C/CS (Character, Character State). It is a semi-structuredapproach that split the Character of the Character State, where Character representswhat is described and Character State is a state of this Character. This approach is still
CHAPTER 2. FOUNDATIONS AND RELATED WORK 19
not the most appropriate, because a Character can contain inside a textual description.This approach is adopted by Xper, a system to edit, store and analyze phenotypes [48].
The most semantically rich approach is the Entity-Quality (EQ) format [27], whereinthe entity is a morphological or anatomical structure of organisms, specified through on-tologies, and the quality is a property that describes the entity, usually specified in thePhenotype and Trait Ontology (PATO) [16]. This approach enables to execute computa-tional analyses and to search more accurately. ZFIN (Zebrafish Information Network) [46]uses the Entity-Quality (EQ) format. It adopts ZFA (Zebrafish Anatomy and Develop-ment Ontology) for the entity representation and PATO (Phenotypic Quality Ontology)for the quality representation, as shown in Figure 2.2. Following the Köhler et al. [25]classification, we call this approach a pos-composed EQ.
Some datasets use a variant of the EQ format, where the entity and quality are com-bined in a single description and it is not possible to distinguish the entity from thequality. We call this variant a pre-composed EQ [25] and it is used by the MammalianPhenotype Ontology (MP) [43], an ontology for phenotype description adopted by MGI(Mouse Genomic Informatics) [10].
Figure 2.2: Phenotype Description Approaches.
2.3 Data Sources
This section summarizes the main MODs and databases used in this work.
2.3.1 MOD
Model Organism Databases (MOD) are specialized repositories of biological knowledge,whose definition is not strictly established [21]. In the last decades the term modelorganism refered to a small and select group of species, deeply studied in the laboratoryand richly documented [21]. As the mechanisms for genetic mapping have became moreaffordable, the concept of model organism expanded to a wider range of species [21]. Weconsider that each MOD stores data of a model organism and may contain data from itsgenotype and phenotype, providing biological knowledge to conduct research, in domainslike genetics, development, and evolution.
The main MODs used in this work are MGI, MP, ZFIN, ZP, and HP. MGI - MouseGenomic Informatics - is a MOD of mouses that contains their genotype and phenotype
CHAPTER 2. FOUNDATIONS AND RELATED WORK 20
data [10]. MGI uses the ontology MP - Mammalian Phenotype Ontology - to describephenotype, as described in Section 2.2. HP - Human Phenotype Ontology - containsdata of the human phenotype [39], describes like MGI in Figure 2.2. Both MP and HPadopt the pre-composed EQ format [25], i.e., they join Entity+Quality in a single atomicconcept.
ZFIN - Zebrafish Information Network - is a MOD containing data from Zebrafish[46]. It uses ZFA - Zebrafish Anatomy and Development Ontology - an ontology of thezebrafish anatomical structure and PATO - Phenotypic Quality Ontology.
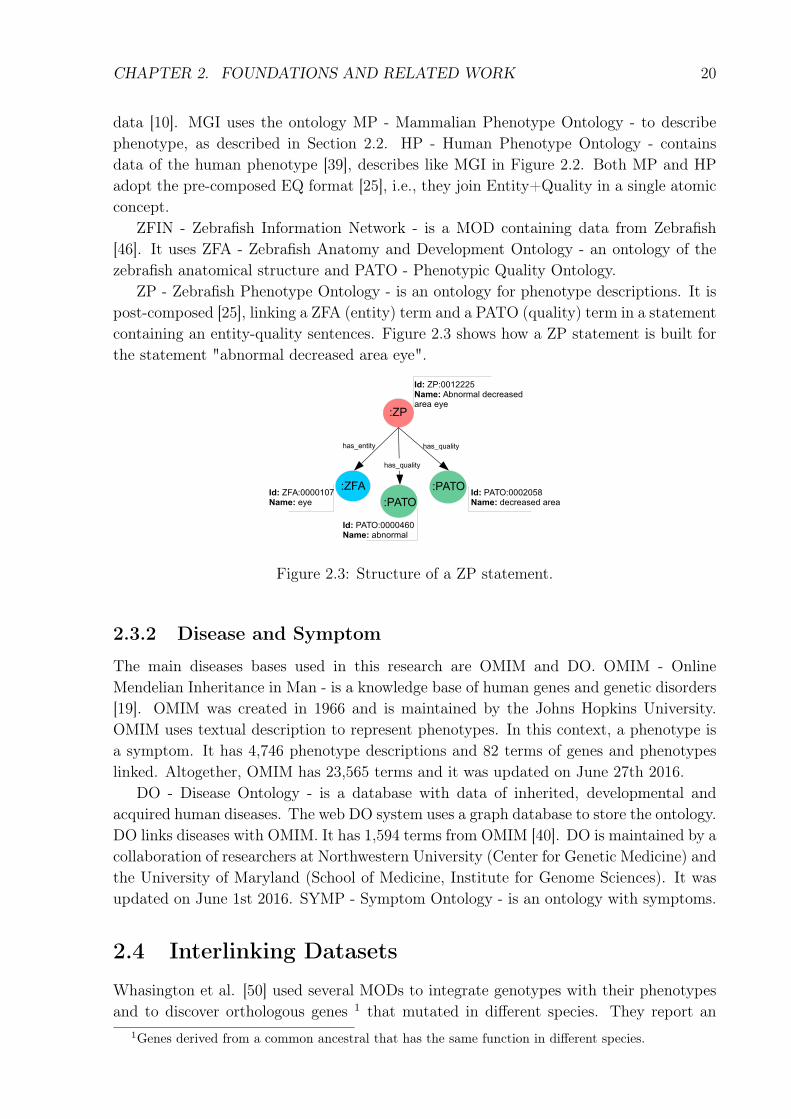
ZP - Zebrafish Phenotype Ontology - is an ontology for phenotype descriptions. It ispost-composed [25], linking a ZFA (entity) term and a PATO (quality) term in a statementcontaining an entity-quality sentences. Figure 2.3 shows how a ZP statement is built forthe statement "abnormal decreased area eye".
Figure 2.3: Structure of a ZP statement.
2.3.2 Disease and Symptom
The main diseases bases used in this research are OMIM and DO. OMIM - OnlineMendelian Inheritance in Man - is a knowledge base of human genes and genetic disorders[19]. OMIM was created in 1966 and is maintained by the Johns Hopkins University.OMIM uses textual description to represent phenotypes. In this context, a phenotype isa symptom. It has 4,746 phenotype descriptions and 82 terms of genes and phenotypeslinked. Altogether, OMIM has 23,565 terms and it was updated on June 27th 2016.
DO - Disease Ontology - is a database with data of inherited, developmental andacquired human diseases. The web DO system uses a graph database to store the ontology.DO links diseases with OMIM. It has 1,594 terms from OMIM [40]. DO is maintained by acollaboration of researchers at Northwestern University (Center for Genetic Medicine) andthe University of Maryland (School of Medicine, Institute for Genome Sciences). It wasupdated on June 1st 2016. SYMP - Symptom Ontology - is an ontology with symptoms.
2.4 Interlinking Datasets
Whasington et al. [50] used several MODs to integrate genotypes with their phenotypesand to discover orthologous genes 1 that mutated in different species. They report an
1Genes derived from a common ancestral that has the same function in different species.
CHAPTER 2. FOUNDATIONS AND RELATED WORK 21
example of mutated genes that resulted in blindness in different organisms. For thisstudy, they generated a unified model from various heterogeneous MODs containing genesto be considered in the comparison. 11 human genes were chosen which have orthologousgenes in mice, zebrafish, and drosophila from the OMIM database. Mouse, zebrafish, andfruitflies genes were obtained from different bases.
Whasington et al. [50] achieved the following conclusions: (i) variant alleles containmore similar phenotypes than other alleles of the same gene; (ii) it is possible to retrievemutant genes, responsible for phenotypic anomalies through the similarity analysis of therespective phenotypes; (iii) it is possible to identify orthologous genes from phenotypicdata that cross different species. These results would not be achieved only looking to thegenotypes, due to two major problems: (1) the genetic basis of most diseases are oftenunknown; (2) although the genetic basis is known, algorithms of sequence alignment areinadequate, as this comparison is based on the similarity of genes along the chains. Forthis reason, they propose a comparison through the phenotypes, in their case, the diseasesymptoms.
Whasington et al. [50] faced two major difficulties: (1) they had to manually createa homogeneous model and integrate various MODs focusing in the analyzed profiles; (2)to create a profile encompassing several ontologies, selecting the relevant terms for thesearch. Similarly, many researchers face the same difficulties, of integrating MODs andsetting profiles manually, as there is no computational tool to build a unified model fromseveral different MODs and to support profiles associated with ontologies.
Phenoscape is an ontology-driven database that integrates data from mouse, human,zebrafish, and frog, adopting Uberon for entity terms and PATO for quality terms.Phenoscape has data of genes and phenotypes. The main goal the Phenoscape is toadopt semantic similarity algorithms, e.g., the parsimony algorithm, to discover pheno-typic variations among species. It can match similar phenotypes to find related genes indifferent species [29].
2.5 Gene Ontology
Gene Ontology is an ontology that stores data from genotypes and descriptive related data,it was used in this work like data source. Guarino et al. [18] use three complementarydefinitions for ontology: (i) Gruber [17] defines ontology "as an explicit specification of aconceptualization"; (ii) Borst [8] includes the concept of sharing, defining an ontology asa "formal specification of a conceptualization shared"; (iii) Studer et al. [47] unified thetwo definitions: "an ontology is an explicit specification, formal of a conceptualizationshared."
The Gene Ontology arose from the need of having consistent descriptions of genes,when they appear in different databases, i.e., the association of different terms that havethe same meaning. Ashburner et al. [3] define Gene Ontology (GO) as a structurethat contains a controlled vocabulary and defines known genes and proteins. It cansupport the study of biological information associated with these genes, using structuresthat record information and assist in data analysis. For example, the Gene Ontology
CHAPTER 2. FOUNDATIONS AND RELATED WORK 22
helps in the study of genetics, where there are works attempting to identify functionalrelationships between genes and consequent results. The Gene Ontology is composed ofthree independent ontologies, divided by areas: molecular function, biological process, andcellular component [3]. Every publicly known gene has records representing the biologicalcharacteristics within those areas.
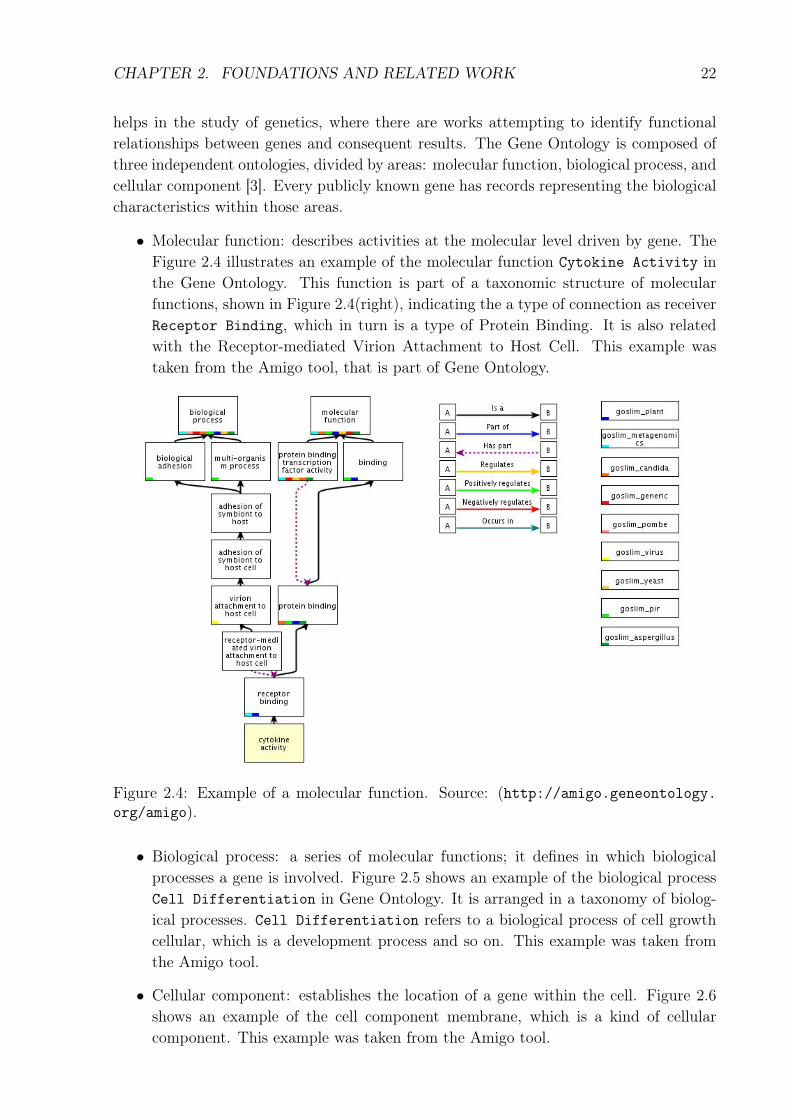
• Molecular function: describes activities at the molecular level driven by gene. TheFigure 2.4 illustrates an example of the molecular function Cytokine Activity inthe Gene Ontology. This function is part of a taxonomic structure of molecularfunctions, shown in Figure 2.4(right), indicating the a type of connection as receiverReceptor Binding, which in turn is a type of Protein Binding. It is also relatedwith the Receptor-mediated Virion Attachment to Host Cell. This example wastaken from the Amigo tool, that is part of Gene Ontology.
Figure 2.4: Example of a molecular function. Source: (http://amigo.geneontology.org/amigo).
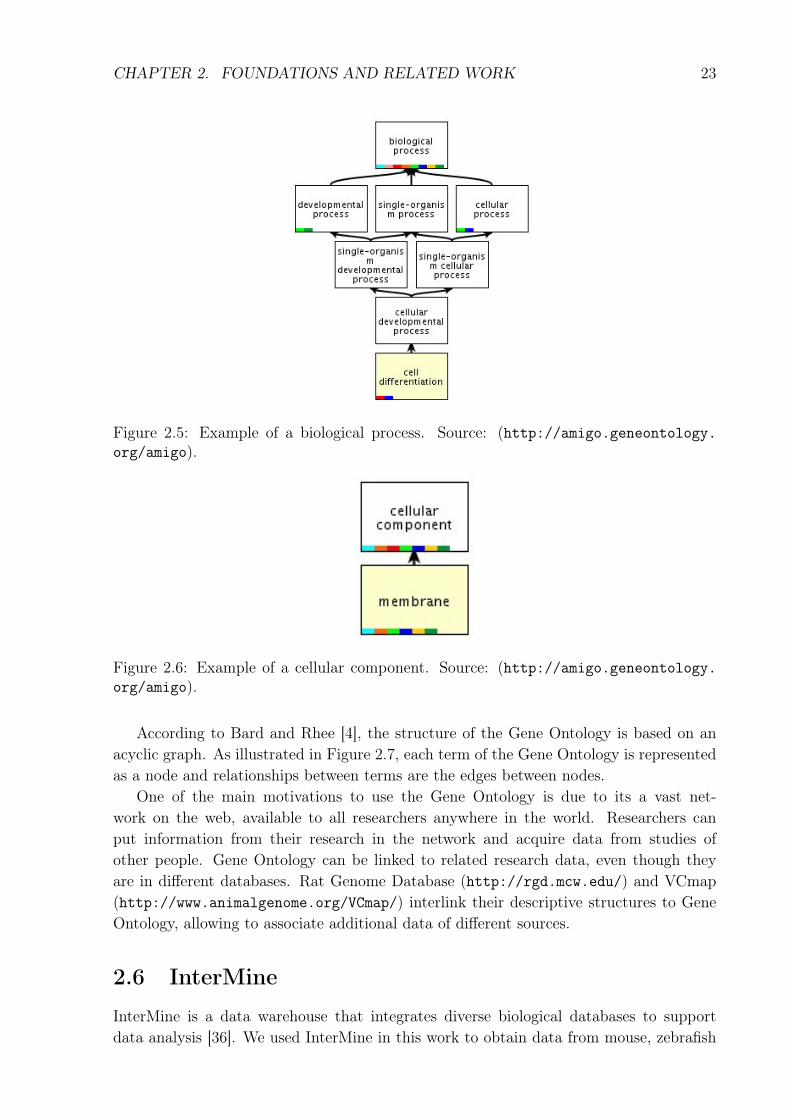
• Biological process: a series of molecular functions; it defines in which biologicalprocesses a gene is involved. Figure 2.5 shows an example of the biological processCell Differentiation in Gene Ontology. It is arranged in a taxonomy of biolog-ical processes. Cell Differentiation refers to a biological process of cell growthcellular, which is a development process and so on. This example was taken fromthe Amigo tool.
• Cellular component: establishes the location of a gene within the cell. Figure 2.6shows an example of the cell component membrane, which is a kind of cellularcomponent. This example was taken from the Amigo tool.
CHAPTER 2. FOUNDATIONS AND RELATED WORK 23
Figure 2.5: Example of a biological process. Source: (http://amigo.geneontology.org/amigo).
Figure 2.6: Example of a cellular component. Source: (http://amigo.geneontology.org/amigo).
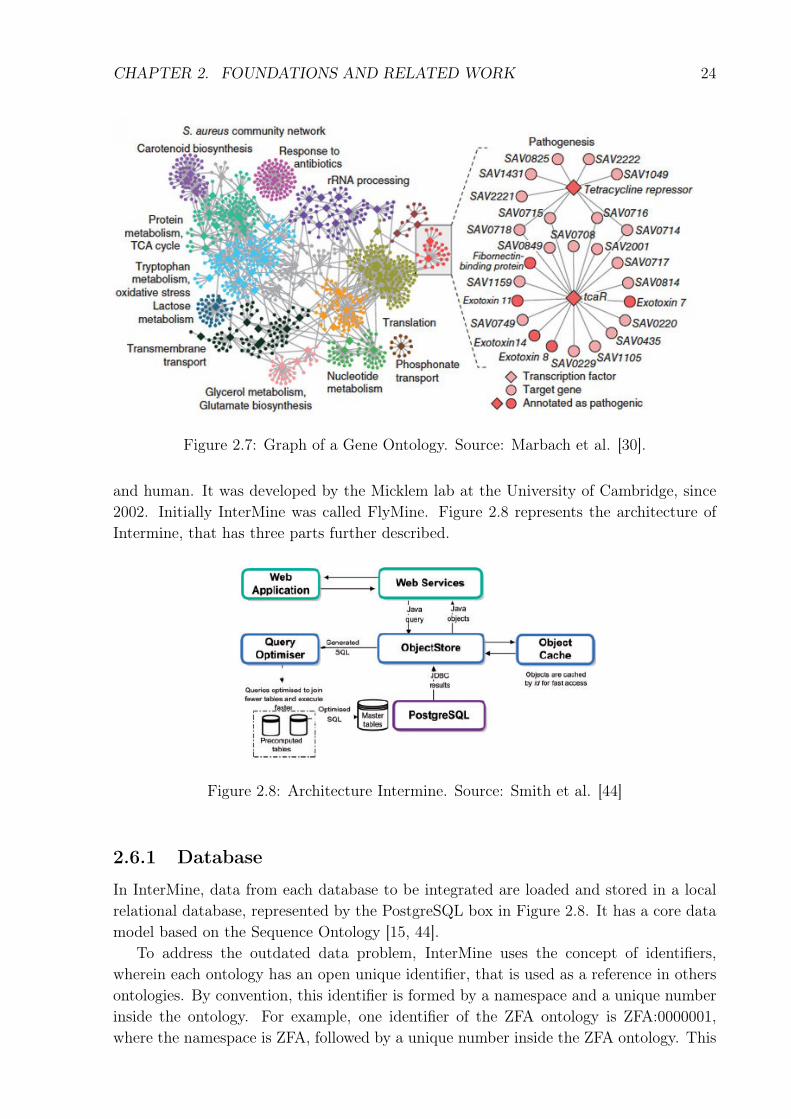
According to Bard and Rhee [4], the structure of the Gene Ontology is based on anacyclic graph. As illustrated in Figure 2.7, each term of the Gene Ontology is representedas a node and relationships between terms are the edges between nodes.
One of the main motivations to use the Gene Ontology is due to its a vast net-work on the web, available to all researchers anywhere in the world. Researchers canput information from their research in the network and acquire data from studies ofother people. Gene Ontology can be linked to related research data, even though theyare in different databases. Rat Genome Database (http://rgd.mcw.edu/) and VCmap(http://www.animalgenome.org/VCmap/) interlink their descriptive structures to GeneOntology, allowing to associate additional data of different sources.
2.6 InterMine
InterMine is a data warehouse that integrates diverse biological databases to supportdata analysis [36]. We used InterMine in this work to obtain data from mouse, zebrafish
CHAPTER 2. FOUNDATIONS AND RELATED WORK 24
Figure 2.7: Graph of a Gene Ontology. Source: Marbach et al. [30].
and human. It was developed by the Micklem lab at the University of Cambridge, since2002. Initially InterMine was called FlyMine. Figure 2.8 represents the architecture ofIntermine, that has three parts further described.
Figure 2.8: Architecture Intermine. Source: Smith et al. [44]
2.6.1 Database
In InterMine, data from each database to be integrated are loaded and stored in a localrelational database, represented by the PostgreSQL box in Figure 2.8. It has a core datamodel based on the Sequence Ontology [15, 44].
To address the outdated data problem, InterMine uses the concept of identifiers,wherein each ontology has an open unique identifier, that is used as a reference in othersontologies. By convention, this identifier is formed by a namespace and a unique numberinside the ontology. For example, one identifier of the ZFA ontology is ZFA:0000001,where the namespace is ZFA, followed by a unique number inside the ZFA ontology. This
CHAPTER 2. FOUNDATIONS AND RELATED WORK 25
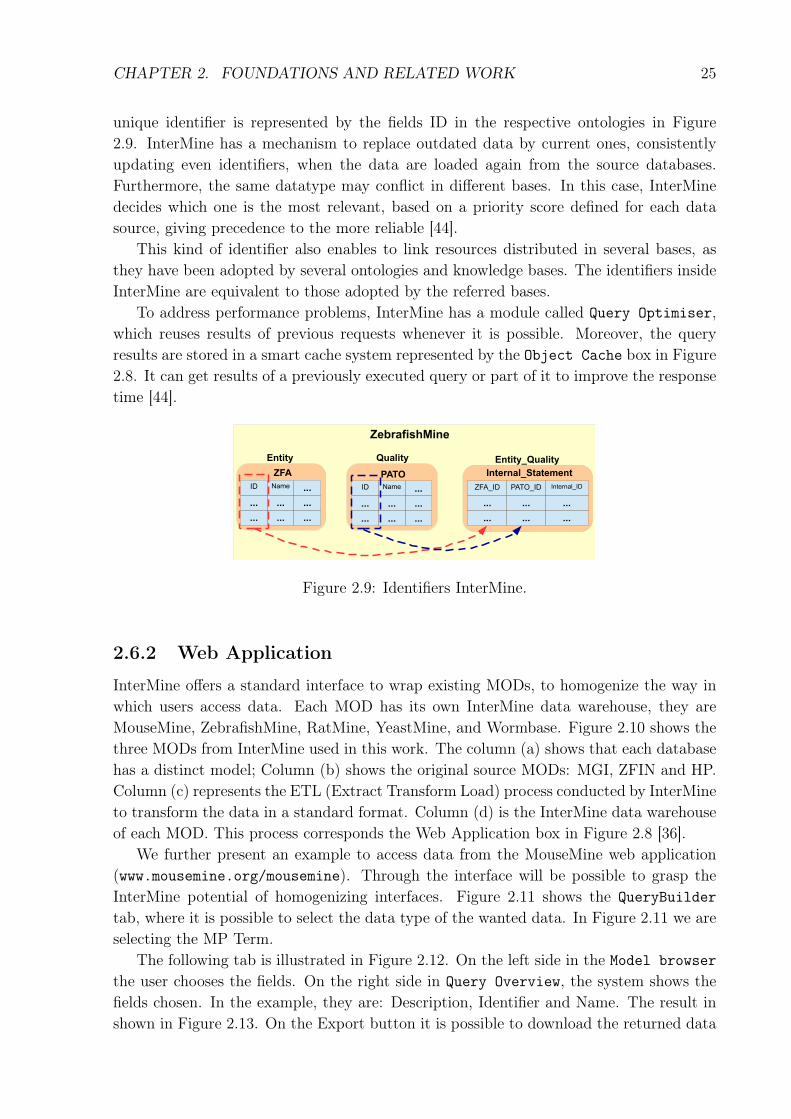
unique identifier is represented by the fields ID in the respective ontologies in Figure2.9. InterMine has a mechanism to replace outdated data by current ones, consistentlyupdating even identifiers, when the data are loaded again from the source databases.Furthermore, the same datatype may conflict in different bases. In this case, InterMinedecides which one is the most relevant, based on a priority score defined for each datasource, giving precedence to the more reliable [44].
This kind of identifier also enables to link resources distributed in several bases, asthey have been adopted by several ontologies and knowledge bases. The identifiers insideInterMine are equivalent to those adopted by the referred bases.
To address performance problems, InterMine has a module called Query Optimiser,which reuses results of previous requests whenever it is possible. Moreover, the queryresults are stored in a smart cache system represented by the Object Cache box in Figure2.8. It can get results of a previously executed query or part of it to improve the responsetime [44].
Figure 2.9: Identifiers InterMine.
2.6.2 Web Application
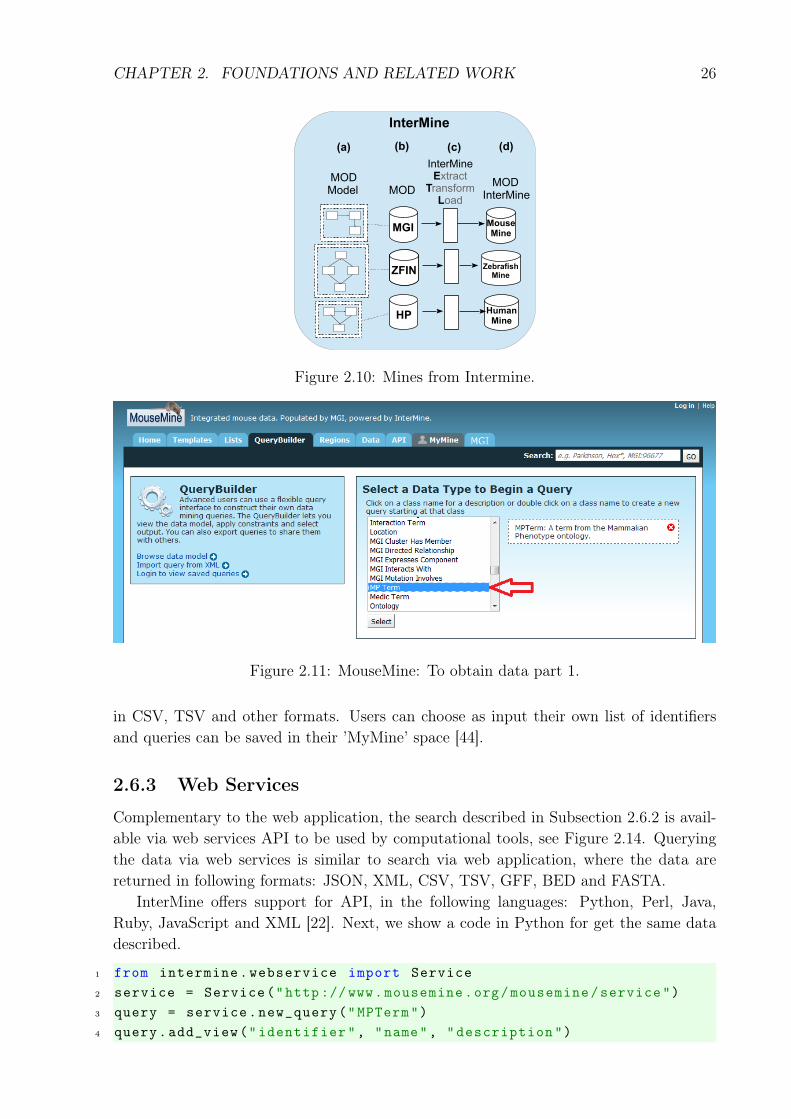
InterMine offers a standard interface to wrap existing MODs, to homogenize the way inwhich users access data. Each MOD has its own InterMine data warehouse, they areMouseMine, ZebrafishMine, RatMine, YeastMine, and Wormbase. Figure 2.10 shows thethree MODs from InterMine used in this work. The column (a) shows that each databasehas a distinct model; Column (b) shows the original source MODs: MGI, ZFIN and HP.Column (c) represents the ETL (Extract Transform Load) process conducted by InterMineto transform the data in a standard format. Column (d) is the InterMine data warehouseof each MOD. This process corresponds the Web Application box in Figure 2.8 [36].
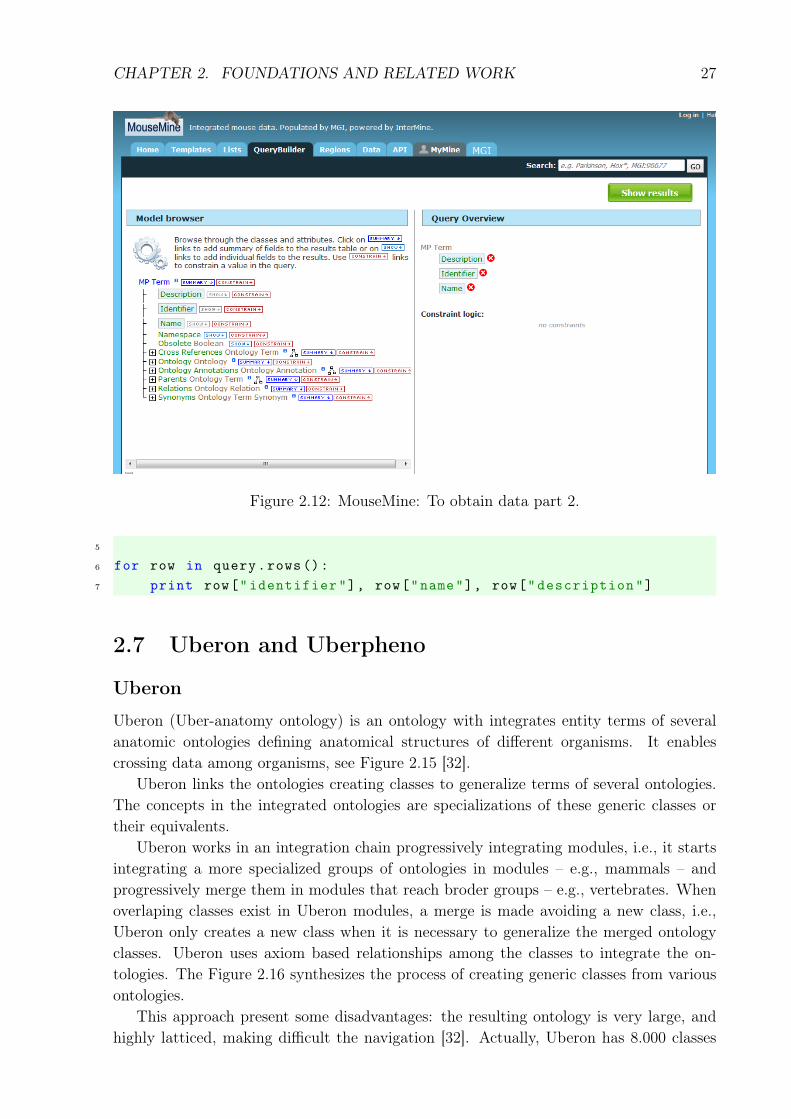
We further present an example to access data from the MouseMine web application(www.mousemine.org/mousemine). Through the interface will be possible to grasp theInterMine potential of homogenizing interfaces. Figure 2.11 shows the QueryBuildertab, where it is possible to select the data type of the wanted data. In Figure 2.11 we areselecting the MP Term.
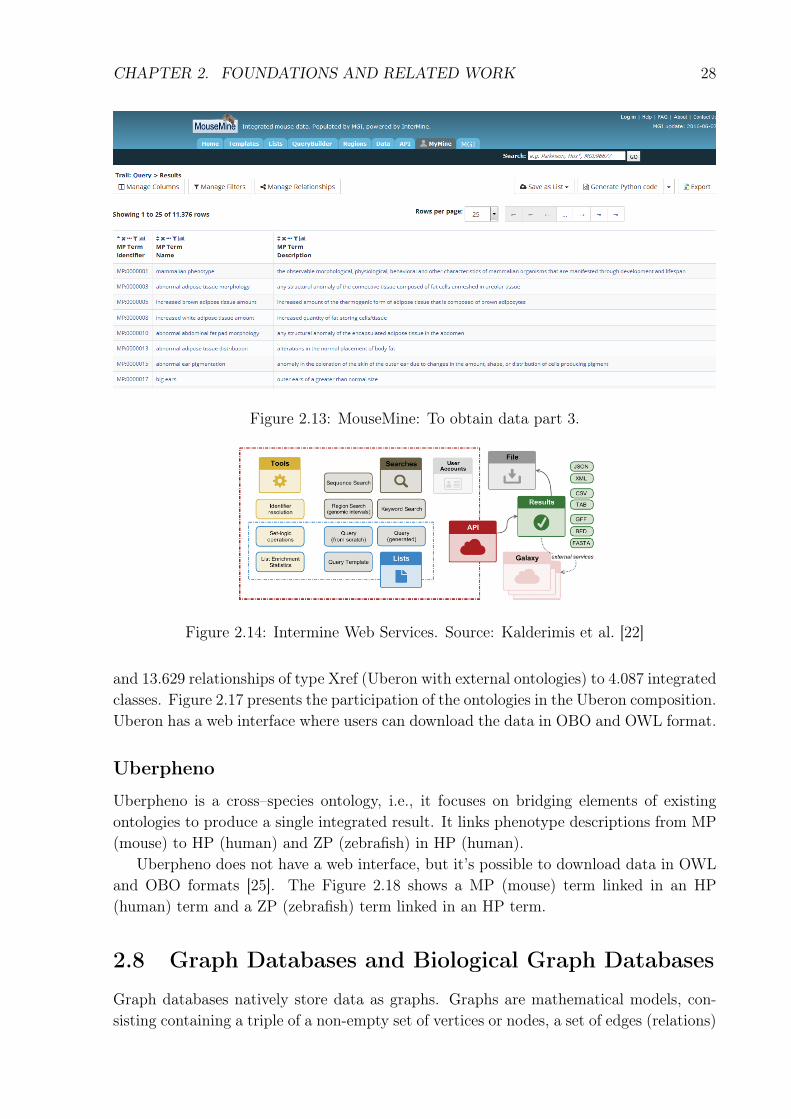
The following tab is illustrated in Figure 2.12. On the left side in the Model browserthe user chooses the fields. On the right side in Query Overview, the system shows thefields chosen. In the example, they are: Description, Identifier and Name. The result inshown in Figure 2.13. On the Export button it is possible to download the returned data
CHAPTER 2. FOUNDATIONS AND RELATED WORK 26
Figure 2.10: Mines from Intermine.
Figure 2.11: MouseMine: To obtain data part 1.
in CSV, TSV and other formats. Users can choose as input their own list of identifiersand queries can be saved in their ’MyMine’ space [44].
2.6.3 Web Services
Complementary to the web application, the search described in Subsection 2.6.2 is avail-able via web services API to be used by computational tools, see Figure 2.14. Queryingthe data via web services is similar to search via web application, where the data arereturned in following formats: JSON, XML, CSV, TSV, GFF, BED and FASTA.
InterMine offers support for API, in the following languages: Python, Perl, Java,Ruby, JavaScript and XML [22]. Next, we show a code in Python for get the same datadescribed.
1 from intermine.webservice import Service2 service = Service("http ://www.mousemine.org/mousemine/service")3 query = service.new_query("MPTerm")4 query.add_view("identifier", "name", "description")
CHAPTER 2. FOUNDATIONS AND RELATED WORK 27
Figure 2.12: MouseMine: To obtain data part 2.
5
6 for row in query.rows():7 print row["identifier"], row["name"], row["description"]
2.7 Uberon and Uberpheno
Uberon
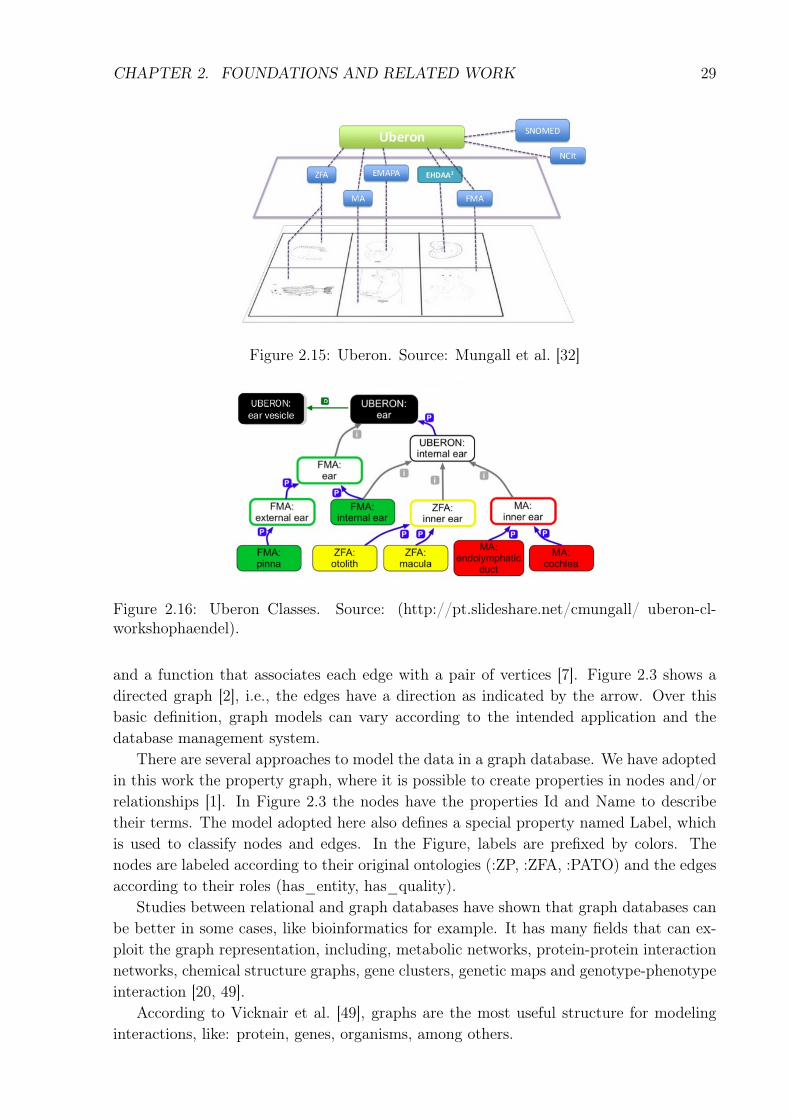
Uberon (Uber-anatomy ontology) is an ontology with integrates entity terms of severalanatomic ontologies defining anatomical structures of different organisms. It enablescrossing data among organisms, see Figure 2.15 [32].
Uberon links the ontologies creating classes to generalize terms of several ontologies.The concepts in the integrated ontologies are specializations of these generic classes ortheir equivalents.
Uberon works in an integration chain progressively integrating modules, i.e., it startsintegrating a more specialized groups of ontologies in modules – e.g., mammals – andprogressively merge them in modules that reach broder groups – e.g., vertebrates. Whenoverlaping classes exist in Uberon modules, a merge is made avoiding a new class, i.e.,Uberon only creates a new class when it is necessary to generalize the merged ontologyclasses. Uberon uses axiom based relationships among the classes to integrate the on-tologies. The Figure 2.16 synthesizes the process of creating generic classes from variousontologies.
This approach present some disadvantages: the resulting ontology is very large, andhighly latticed, making difficult the navigation [32]. Actually, Uberon has 8.000 classes
CHAPTER 2. FOUNDATIONS AND RELATED WORK 28
Figure 2.13: MouseMine: To obtain data part 3.
Figure 2.14: Intermine Web Services. Source: Kalderimis et al. [22]
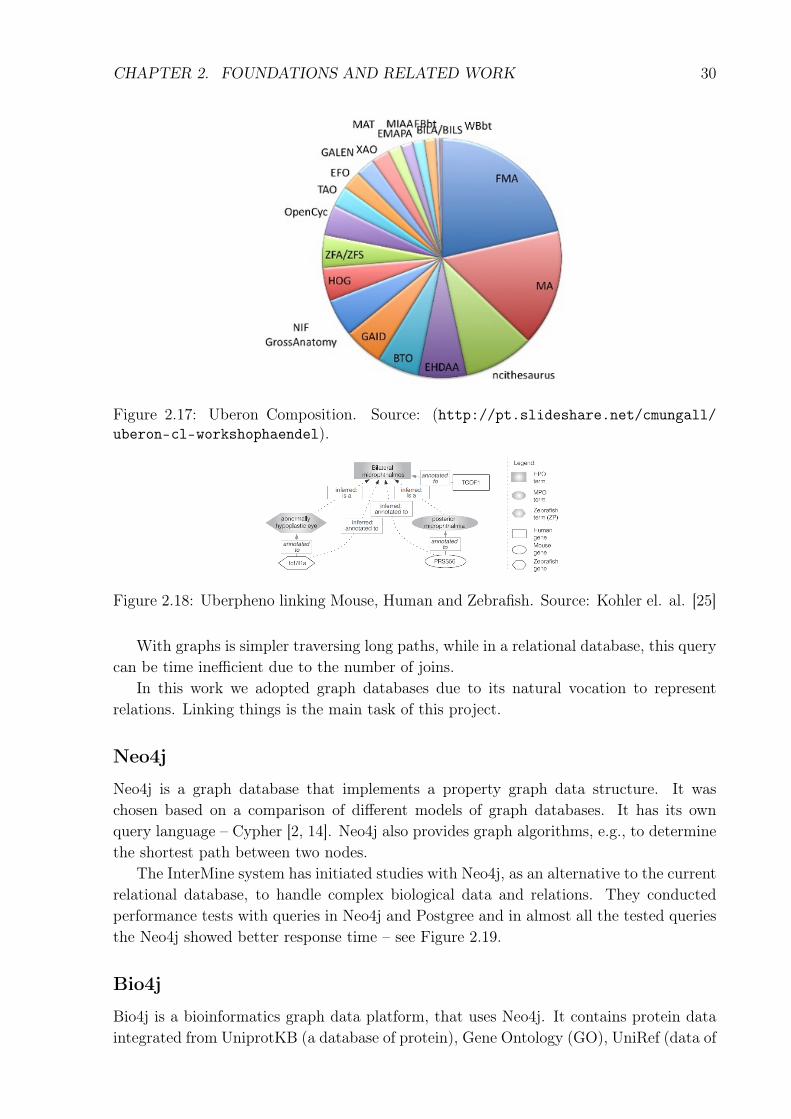
and 13.629 relationships of type Xref (Uberon with external ontologies) to 4.087 integratedclasses. Figure 2.17 presents the participation of the ontologies in the Uberon composition.Uberon has a web interface where users can download the data in OBO and OWL format.
Uberpheno
Uberpheno is a cross–species ontology, i.e., it focuses on bridging elements of existingontologies to produce a single integrated result. It links phenotype descriptions from MP(mouse) to HP (human) and ZP (zebrafish) in HP (human).
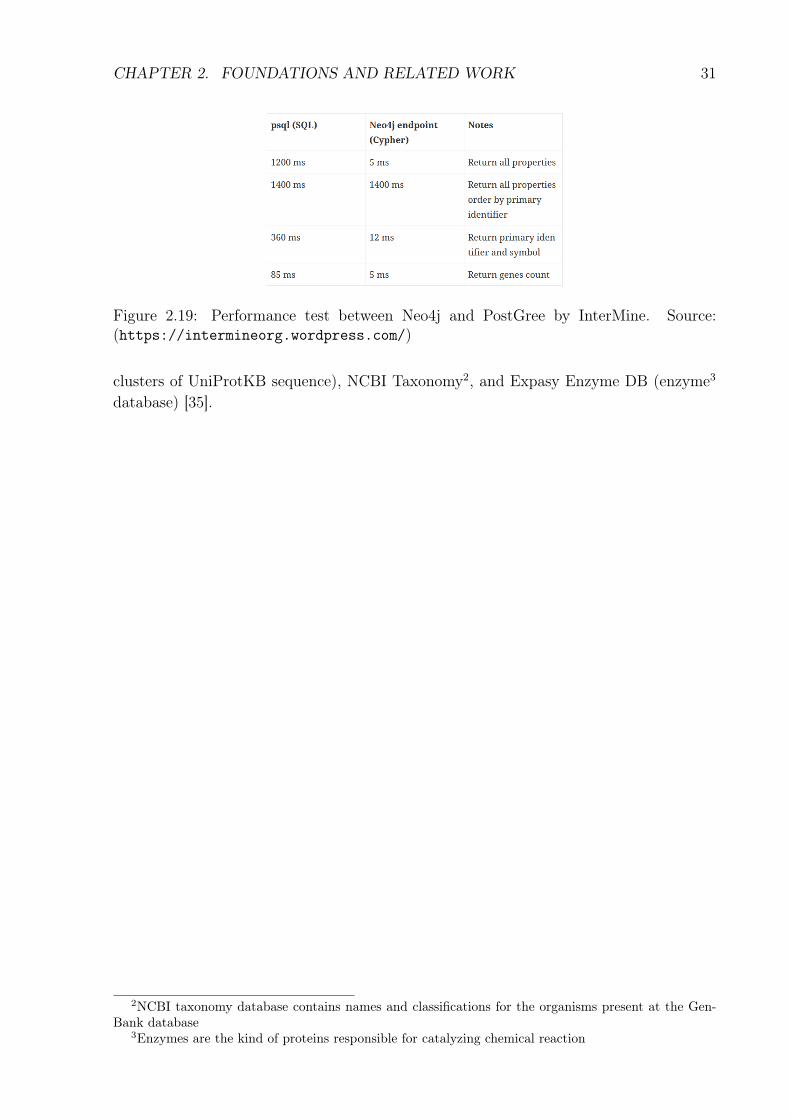
Uberpheno does not have a web interface, but it’s possible to download data in OWLand OBO formats [25]. The Figure 2.18 shows a MP (mouse) term linked in an HP(human) term and a ZP (zebrafish) term linked in an HP term.
2.8 Graph Databases and Biological Graph Databases
Graph databases natively store data as graphs. Graphs are mathematical models, con-sisting containing a triple of a non-empty set of vertices or nodes, a set of edges (relations)
CHAPTER 2. FOUNDATIONS AND RELATED WORK 29
Figure 2.15: Uberon. Source: Mungall et al. [32]
Figure 2.16: Uberon Classes. Source: (http://pt.slideshare.net/cmungall/ uberon-cl-workshophaendel).
and a function that associates each edge with a pair of vertices [7]. Figure 2.3 shows adirected graph [2], i.e., the edges have a direction as indicated by the arrow. Over thisbasic definition, graph models can vary according to the intended application and thedatabase management system.
There are several approaches to model the data in a graph database. We have adoptedin this work the property graph, where it is possible to create properties in nodes and/orrelationships [1]. In Figure 2.3 the nodes have the properties Id and Name to describetheir terms. The model adopted here also defines a special property named Label, whichis used to classify nodes and edges. In the Figure, labels are prefixed by colors. Thenodes are labeled according to their original ontologies (:ZP, :ZFA, :PATO) and the edgesaccording to their roles (has_entity, has_quality).
Studies between relational and graph databases have shown that graph databases canbe better in some cases, like bioinformatics for example. It has many fields that can ex-ploit the graph representation, including, metabolic networks, protein-protein interactionnetworks, chemical structure graphs, gene clusters, genetic maps and genotype-phenotypeinteraction [20, 49].
According to Vicknair et al. [49], graphs are the most useful structure for modelinginteractions, like: protein, genes, organisms, among others.
CHAPTER 2. FOUNDATIONS AND RELATED WORK 30
Figure 2.17: Uberon Composition. Source: (http://pt.slideshare.net/cmungall/uberon-cl-workshophaendel).
Figure 2.18: Uberpheno linking Mouse, Human and Zebrafish. Source: Kohler el. al. [25]
With graphs is simpler traversing long paths, while in a relational database, this querycan be time inefficient due to the number of joins.
In this work we adopted graph databases due to its natural vocation to representrelations. Linking things is the main task of this project.
Neo4j
Neo4j is a graph database that implements a property graph data structure. It waschosen based on a comparison of different models of graph databases. It has its ownquery language – Cypher [2, 14]. Neo4j also provides graph algorithms, e.g., to determinethe shortest path between two nodes.
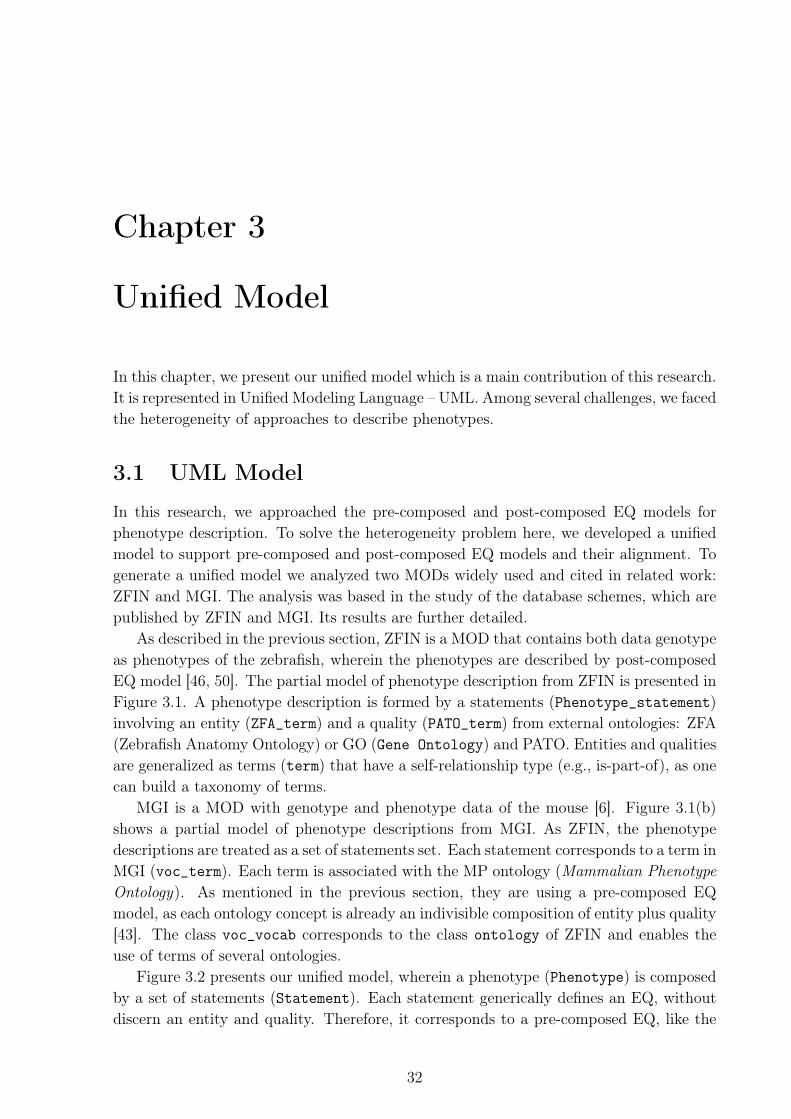
The InterMine system has initiated studies with Neo4j, as an alternative to the currentrelational database, to handle complex biological data and relations. They conductedperformance tests with queries in Neo4j and Postgree and in almost all the tested queriesthe Neo4j showed better response time – see Figure 2.19.
Bio4j
Bio4j is a bioinformatics graph data platform, that uses Neo4j. It contains protein dataintegrated from UniprotKB (a database of protein), Gene Ontology (GO), UniRef (data of
CHAPTER 2. FOUNDATIONS AND RELATED WORK 31
Figure 2.19: Performance test between Neo4j and PostGree by InterMine. Source:(https://intermineorg.wordpress.com/)
clusters of UniProtKB sequence), NCBI Taxonomy2, and Expasy Enzyme DB (enzyme3
database) [35].
2NCBI taxonomy database contains names and classifications for the organisms present at the Gen-Bank database
3Enzymes are the kind of proteins responsible for catalyzing chemical reaction
Chapter 3
Unified Model
In this chapter, we present our unified model which is a main contribution of this research.It is represented in Unified Modeling Language – UML. Among several challenges, we facedthe heterogeneity of approaches to describe phenotypes.
3.1 UML Model
In this research, we approached the pre-composed and post-composed EQ models forphenotype description. To solve the heterogeneity problem here, we developed a unifiedmodel to support pre-composed and post-composed EQ models and their alignment. Togenerate a unified model we analyzed two MODs widely used and cited in related work:ZFIN and MGI. The analysis was based in the study of the database schemes, which arepublished by ZFIN and MGI. Its results are further detailed.
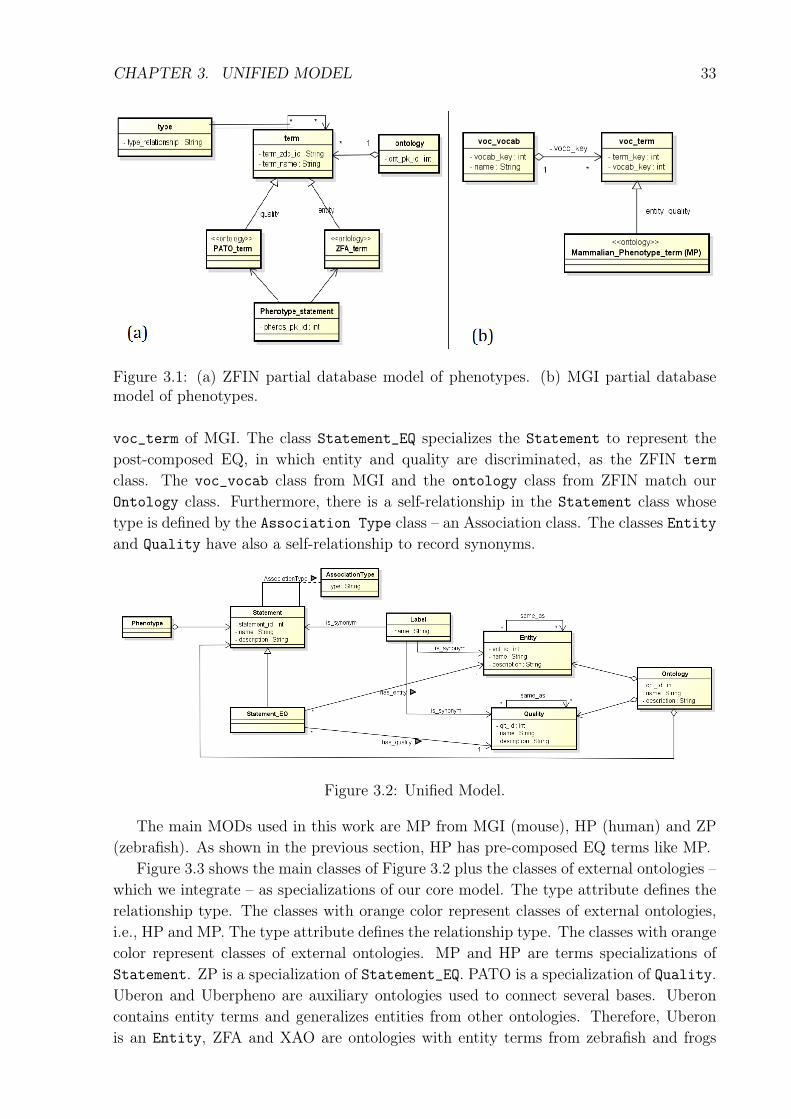
As described in the previous section, ZFIN is a MOD that contains both data genotypeas phenotypes of the zebrafish, wherein the phenotypes are described by post-composedEQ model [46, 50]. The partial model of phenotype description from ZFIN is presented inFigure 3.1. A phenotype description is formed by a statements (Phenotype_statement)involving an entity (ZFA_term) and a quality (PATO_term) from external ontologies: ZFA(Zebrafish Anatomy Ontology) or GO (Gene Ontology) and PATO. Entities and qualitiesare generalized as terms (term) that have a self-relationship type (e.g., is-part-of), as onecan build a taxonomy of terms.
MGI is a MOD with genotype and phenotype data of the mouse [6]. Figure 3.1(b)shows a partial model of phenotype descriptions from MGI. As ZFIN, the phenotypedescriptions are treated as a set of statements set. Each statement corresponds to a term inMGI (voc_term). Each term is associated with the MP ontology (Mammalian PhenotypeOntology). As mentioned in the previous section, they are using a pre-composed EQmodel, as each ontology concept is already an indivisible composition of entity plus quality[43]. The class voc_vocab corresponds to the class ontology of ZFIN and enables theuse of terms of several ontologies.
Figure 3.2 presents our unified model, wherein a phenotype (Phenotype) is composedby a set of statements (Statement). Each statement generically defines an EQ, withoutdiscern an entity and quality. Therefore, it corresponds to a pre-composed EQ, like the
32
CHAPTER 3. UNIFIED MODEL 33
Figure 3.1: (a) ZFIN partial database model of phenotypes. (b) MGI partial databasemodel of phenotypes.
voc_term of MGI. The class Statement_EQ specializes the Statement to represent thepost-composed EQ, in which entity and quality are discriminated, as the ZFIN termclass. The voc_vocab class from MGI and the ontology class from ZFIN match ourOntology class. Furthermore, there is a self-relationship in the Statement class whosetype is defined by the Association Type class – an Association class. The classes Entityand Quality have also a self-relationship to record synonyms.
Figure 3.2: Unified Model.
The main MODs used in this work are MP from MGI (mouse), HP (human) and ZP(zebrafish). As shown in the previous section, HP has pre-composed EQ terms like MP.
Figure 3.3 shows the main classes of Figure 3.2 plus the classes of external ontologies –which we integrate – as specializations of our core model. The type attribute defines therelationship type. The classes with orange color represent classes of external ontologies,i.e., HP and MP. The type attribute defines the relationship type. The classes with orangecolor represent classes of external ontologies. MP and HP are terms specializations ofStatement. ZP is a specialization of Statement_EQ. PATO is a specialization of Quality.Uberon and Uberpheno are auxiliary ontologies used to connect several bases. Uberoncontains entity terms and generalizes entities from other ontologies. Therefore, Uberonis an Entity, ZFA and XAO are ontologies with entity terms from zebrafish and frogs
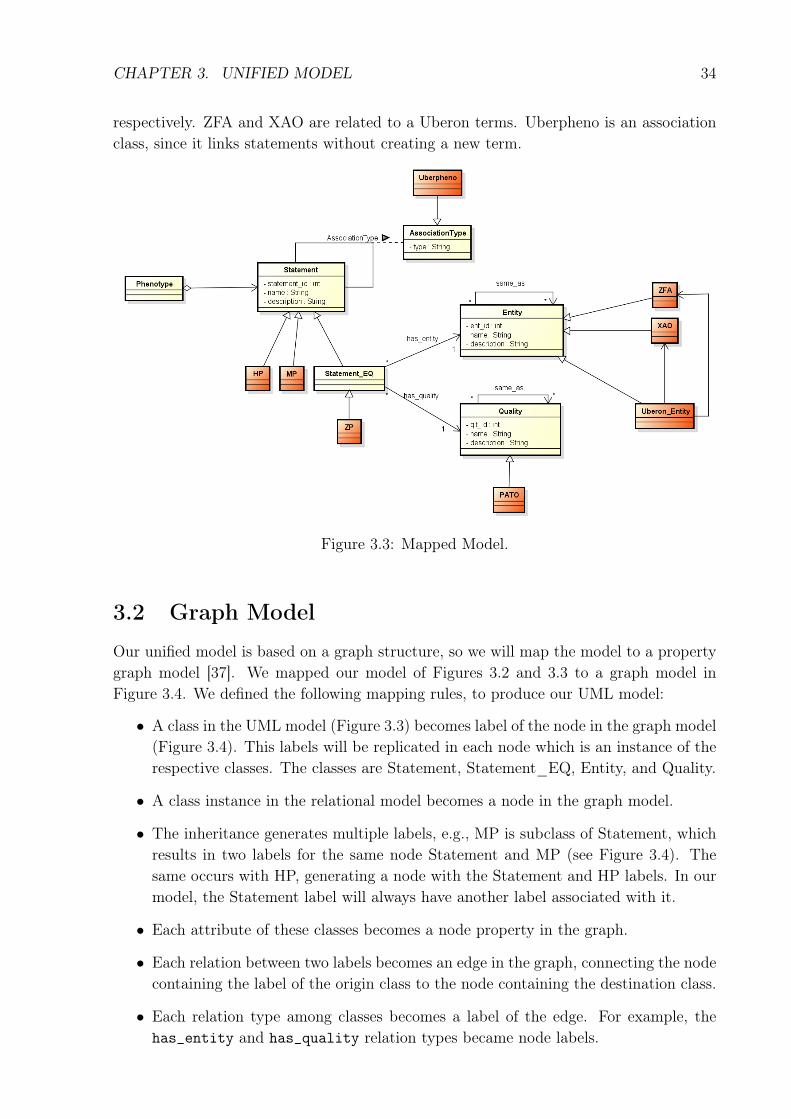
CHAPTER 3. UNIFIED MODEL 34
respectively. ZFA and XAO are related to a Uberon terms. Uberpheno is an associationclass, since it links statements without creating a new term.
Figure 3.3: Mapped Model.
3.2 Graph Model
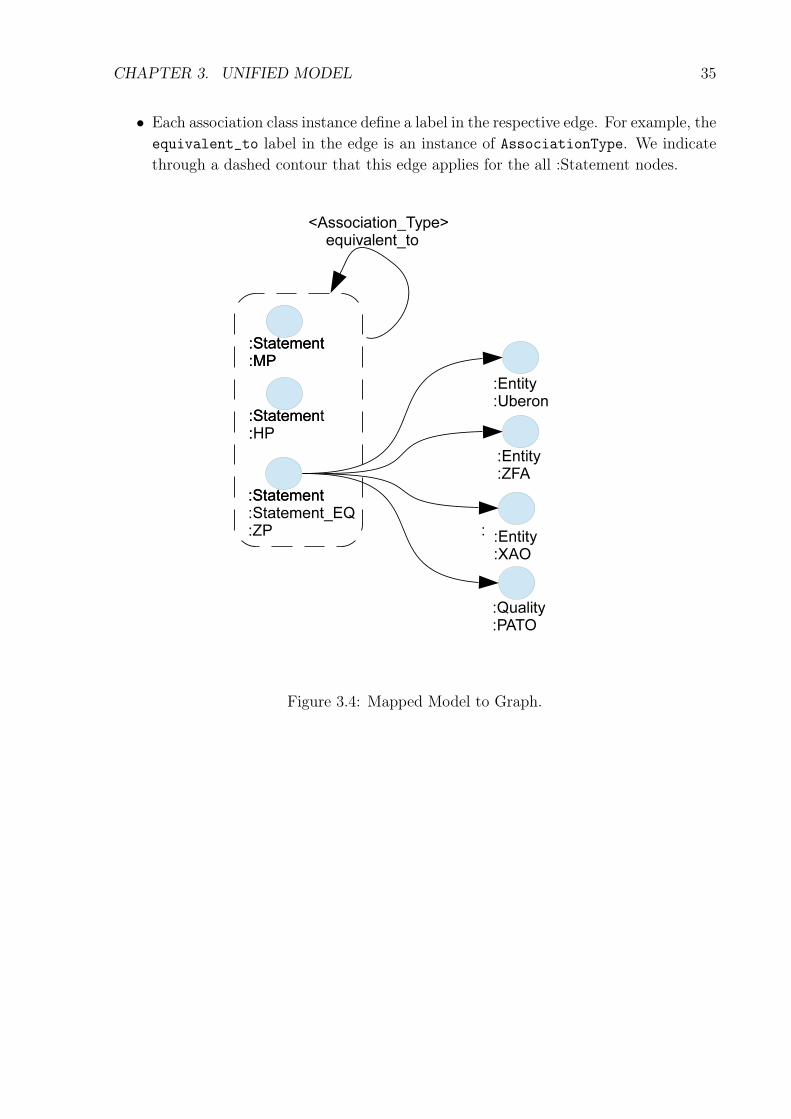
Our unified model is based on a graph structure, so we will map the model to a propertygraph model [37]. We mapped our model of Figures 3.2 and 3.3 to a graph model inFigure 3.4. We defined the following mapping rules, to produce our UML model:
• A class in the UML model (Figure 3.3) becomes label of the node in the graph model(Figure 3.4). This labels will be replicated in each node which is an instance of therespective classes. The classes are Statement, Statement_EQ, Entity, and Quality.
• A class instance in the relational model becomes a node in the graph model.
• The inheritance generates multiple labels, e.g., MP is subclass of Statement, whichresults in two labels for the same node Statement and MP (see Figure 3.4). Thesame occurs with HP, generating a node with the Statement and HP labels. In ourmodel, the Statement label will always have another label associated with it.
• Each attribute of these classes becomes a node property in the graph.
• Each relation between two labels becomes an edge in the graph, connecting the nodecontaining the label of the origin class to the node containing the destination class.
• Each relation type among classes becomes a label of the edge. For example, thehas_entity and has_quality relation types became node labels.
CHAPTER 3. UNIFIED MODEL 35
• Each association class instance define a label in the respective edge. For example, theequivalent_to label in the edge is an instance of AssociationType. We indicatethrough a dashed contour that this edge applies for the all :Statement nodes.
Figure 3.4: Mapped Model to Graph.
Chapter 4
Building BioGraph
In this research, we are interested in phenotype data. These kind of data is an access keyfor integration of biological data. Through phenotypes, it is possible to discover ortholo-gous genes in different organisms. It helps the research in the medical human area, like,to study new drugs and diseases. Phenotype data also allow linking anomalous behav-iors, e.g., the same disease in distinct organisms. In addition, we can integrate differentdatasets of the same organism, for example, it is possible to link diseases with symptomswhich in turn is linked with body parts reaching the genotype from the phenotype – inthis case, reading the genotype departing from the diseases.
This section details the process that we designed and implemented to integrate severalbiological knowledge bases, mainly focusing in phenotypes and model organism databases(MODs). As we have introduced in this section, we are also interested in integratingorganisms and diseases. The section starts presenting our architecture, including theapplications of our project, which are detailed in the next section.
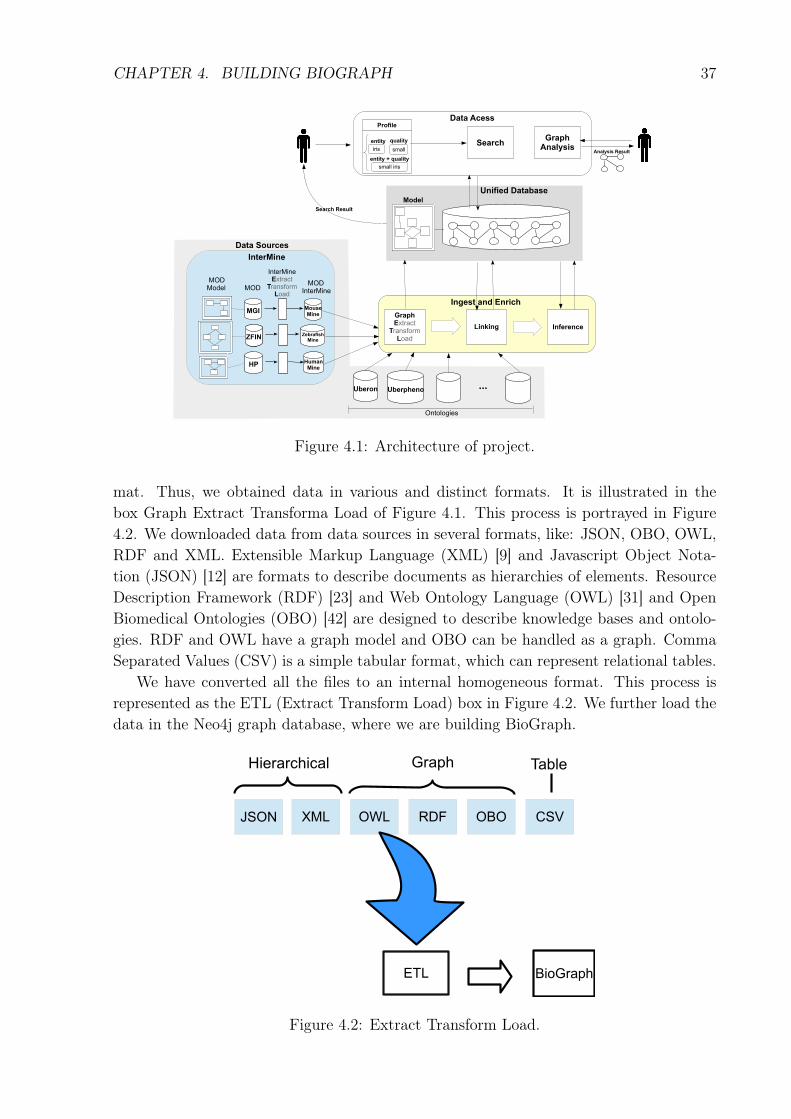
4.1 Architecture
Figure 4.1 represents the architecture of our project. In a nutshell, our architectureis organized in four parts. First, we have the data sources used in this research, like:intermine, MODs, Uberon, Uberpheno and other ontologies. Second, we show the stepsto ingest, link, and build BioGraph in a graph database. Third, we present the resultingunified database containing data from all these data sources. It is produced accordingto the unified model presented in the previous section. Fourth, we have the data access,where the user can search and analyze data in BioGraph.
In the following subsections, we detail the three steps inside the Ingest and Enrichprocess (see Figure 4.1), which involves the parts one to three of the architecture. In thenext section, we detail the fourth part.
4.2 ETL Process
As shown in Figure 4.1 there are several formats of data sources and their heterogeneityis a challenge. Each MOD and dataset used to build BioGraph have its specific for-
36
CHAPTER 4. BUILDING BIOGRAPH 37
Figure 4.1: Architecture of project.
mat. Thus, we obtained data in various and distinct formats. It is illustrated in thebox Graph Extract Transforma Load of Figure 4.1. This process is portrayed in Figure4.2. We downloaded data from data sources in several formats, like: JSON, OBO, OWL,RDF and XML. Extensible Markup Language (XML) [9] and Javascript Object Nota-tion (JSON) [12] are formats to describe documents as hierarchies of elements. ResourceDescription Framework (RDF) [23] and Web Ontology Language (OWL) [31] and OpenBiomedical Ontologies (OBO) [42] are designed to describe knowledge bases and ontolo-gies. RDF and OWL have a graph model and OBO can be handled as a graph. CommaSeparated Values (CSV) is a simple tabular format, which can represent relational tables.
We have converted all the files to an internal homogeneous format. This process isrepresented as the ETL (Extract Transform Load) box in Figure 4.2. We further load thedata in the Neo4j graph database, where we are building BioGraph.
Figure 4.2: Extract Transform Load.
CHAPTER 4. BUILDING BIOGRAPH 38
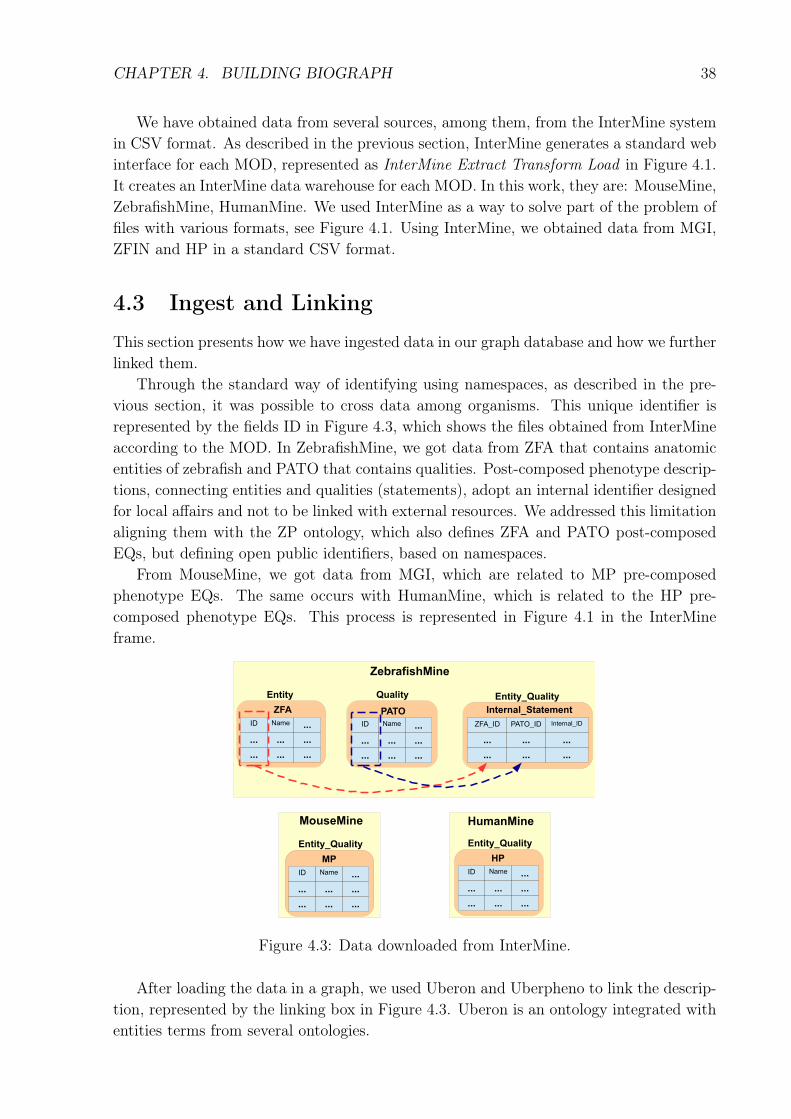
We have obtained data from several sources, among them, from the InterMine systemin CSV format. As described in the previous section, InterMine generates a standard webinterface for each MOD, represented as InterMine Extract Transform Load in Figure 4.1.It creates an InterMine data warehouse for each MOD. In this work, they are: MouseMine,ZebrafishMine, HumanMine. We used InterMine as a way to solve part of the problem offiles with various formats, see Figure 4.1. Using InterMine, we obtained data from MGI,ZFIN and HP in a standard CSV format.
4.3 Ingest and Linking
This section presents how we have ingested data in our graph database and how we furtherlinked them.
Through the standard way of identifying using namespaces, as described in the pre-vious section, it was possible to cross data among organisms. This unique identifier isrepresented by the fields ID in Figure 4.3, which shows the files obtained from InterMineaccording to the MOD. In ZebrafishMine, we got data from ZFA that contains anatomicentities of zebrafish and PATO that contains qualities. Post-composed phenotype descrip-tions, connecting entities and qualities (statements), adopt an internal identifier designedfor local affairs and not to be linked with external resources. We addressed this limitationaligning them with the ZP ontology, which also defines ZFA and PATO post-composedEQs, but defining open public identifiers, based on namespaces.
From MouseMine, we got data from MGI, which are related to MP pre-composedphenotype EQs. The same occurs with HumanMine, which is related to the HP pre-composed phenotype EQs. This process is represented in Figure 4.1 in the InterMineframe.
Figure 4.3: Data downloaded from InterMine.
After loading the data in a graph, we used Uberon and Uberpheno to link the descrip-tion, represented by the linking box in Figure 4.3. Uberon is an ontology integrated withentities terms from several ontologies.
CHAPTER 4. BUILDING BIOGRAPH 39
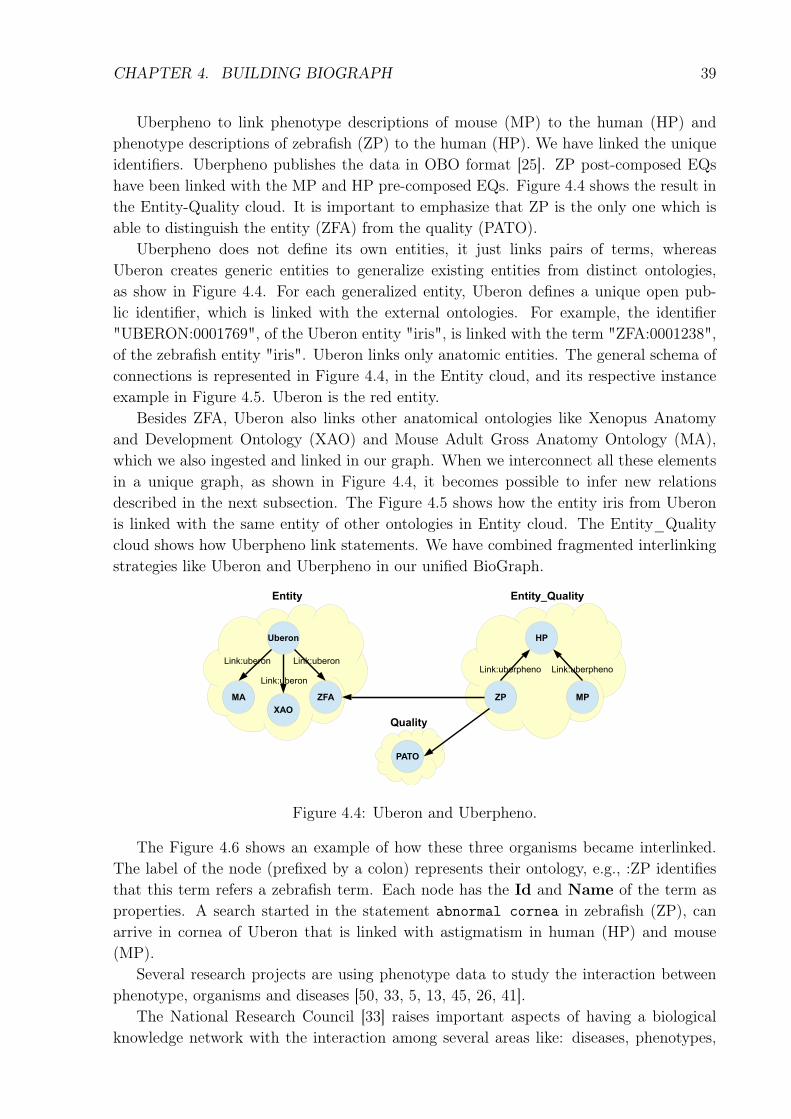
Uberpheno to link phenotype descriptions of mouse (MP) to the human (HP) andphenotype descriptions of zebrafish (ZP) to the human (HP). We have linked the uniqueidentifiers. Uberpheno publishes the data in OBO format [25]. ZP post-composed EQshave been linked with the MP and HP pre-composed EQs. Figure 4.4 shows the result inthe Entity-Quality cloud. It is important to emphasize that ZP is the only one which isable to distinguish the entity (ZFA) from the quality (PATO).
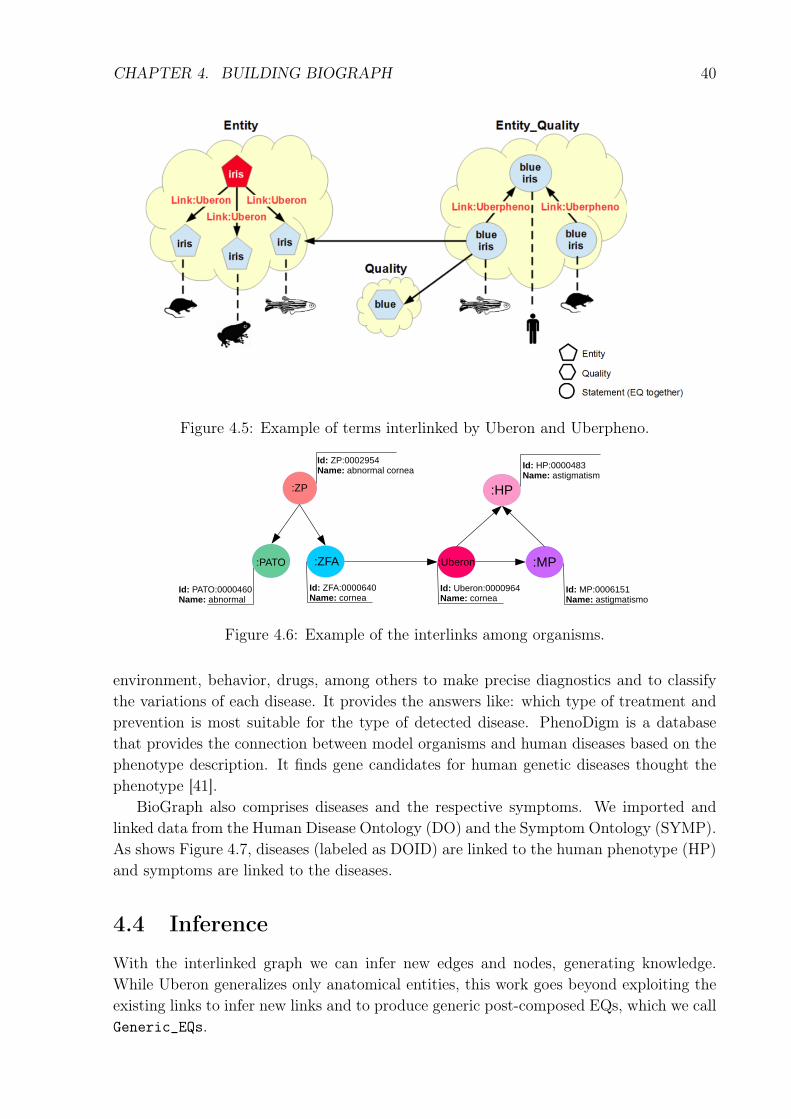
Uberpheno does not define its own entities, it just links pairs of terms, whereasUberon creates generic entities to generalize existing entities from distinct ontologies,as show in Figure 4.4. For each generalized entity, Uberon defines a unique open pub-lic identifier, which is linked with the external ontologies. For example, the identifier"UBERON:0001769", of the Uberon entity "iris", is linked with the term "ZFA:0001238",of the zebrafish entity "iris". Uberon links only anatomic entities. The general schema ofconnections is represented in Figure 4.4, in the Entity cloud, and its respective instanceexample in Figure 4.5. Uberon is the red entity.
Besides ZFA, Uberon also links other anatomical ontologies like Xenopus Anatomyand Development Ontology (XAO) and Mouse Adult Gross Anatomy Ontology (MA),which we also ingested and linked in our graph. When we interconnect all these elementsin a unique graph, as shown in Figure 4.4, it becomes possible to infer new relationsdescribed in the next subsection. The Figure 4.5 shows how the entity iris from Uberonis linked with the same entity of other ontologies in Entity cloud. The Entity_Qualitycloud shows how Uberpheno link statements. We have combined fragmented interlinkingstrategies like Uberon and Uberpheno in our unified BioGraph.
Figure 4.4: Uberon and Uberpheno.
The Figure 4.6 shows an example of how these three organisms became interlinked.The label of the node (prefixed by a colon) represents their ontology, e.g., :ZP identifiesthat this term refers a zebrafish term. Each node has the Id and Name of the term asproperties. A search started in the statement abnormal cornea in zebrafish (ZP), canarrive in cornea of Uberon that is linked with astigmatism in human (HP) and mouse(MP).
Several research projects are using phenotype data to study the interaction betweenphenotype, organisms and diseases [50, 33, 5, 13, 45, 26, 41].
The National Research Council [33] raises important aspects of having a biologicalknowledge network with the interaction among several areas like: diseases, phenotypes,
CHAPTER 4. BUILDING BIOGRAPH 40
Figure 4.5: Example of terms interlinked by Uberon and Uberpheno.
Figure 4.6: Example of the interlinks among organisms.
environment, behavior, drugs, among others to make precise diagnostics and to classifythe variations of each disease. It provides the answers like: which type of treatment andprevention is most suitable for the type of detected disease. PhenoDigm is a databasethat provides the connection between model organisms and human diseases based on thephenotype description. It finds gene candidates for human genetic diseases thought thephenotype [41].
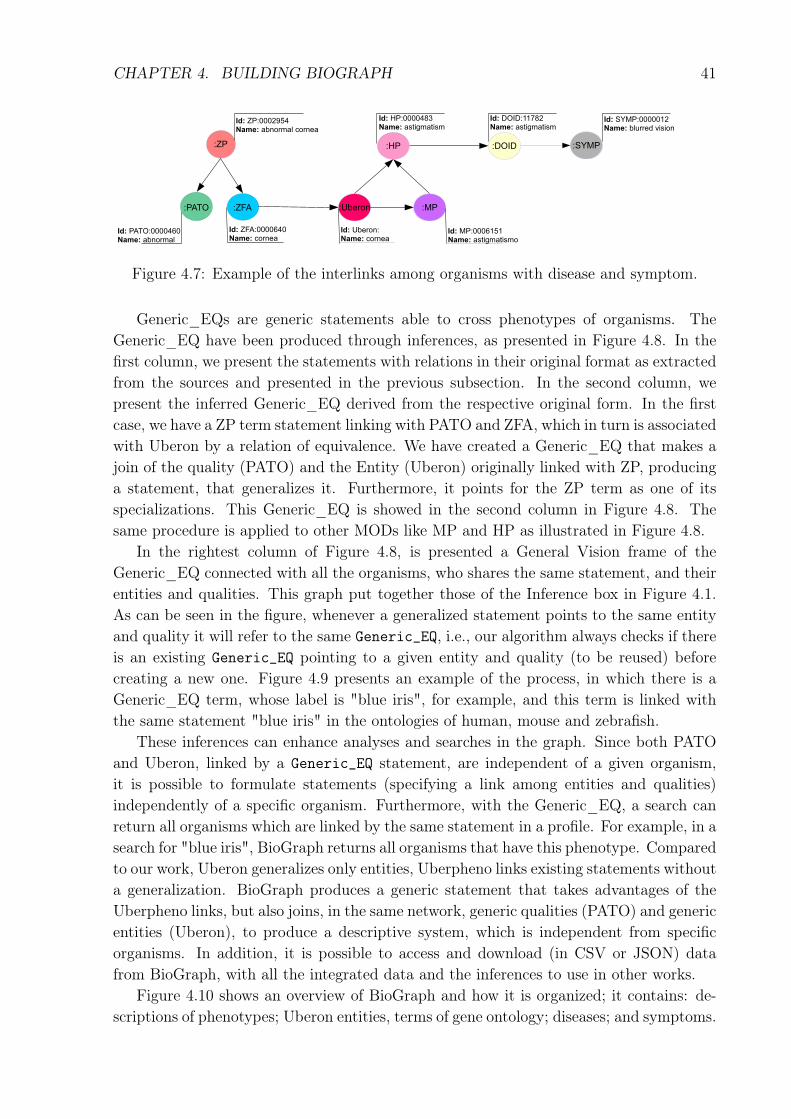
BioGraph also comprises diseases and the respective symptoms. We imported andlinked data from the Human Disease Ontology (DO) and the Symptom Ontology (SYMP).As shows Figure 4.7, diseases (labeled as DOID) are linked to the human phenotype (HP)and symptoms are linked to the diseases.
4.4 Inference
With the interlinked graph we can infer new edges and nodes, generating knowledge.While Uberon generalizes only anatomical entities, this work goes beyond exploiting theexisting links to infer new links and to produce generic post-composed EQs, which we callGeneric_EQs.
CHAPTER 4. BUILDING BIOGRAPH 41
Figure 4.7: Example of the interlinks among organisms with disease and symptom.
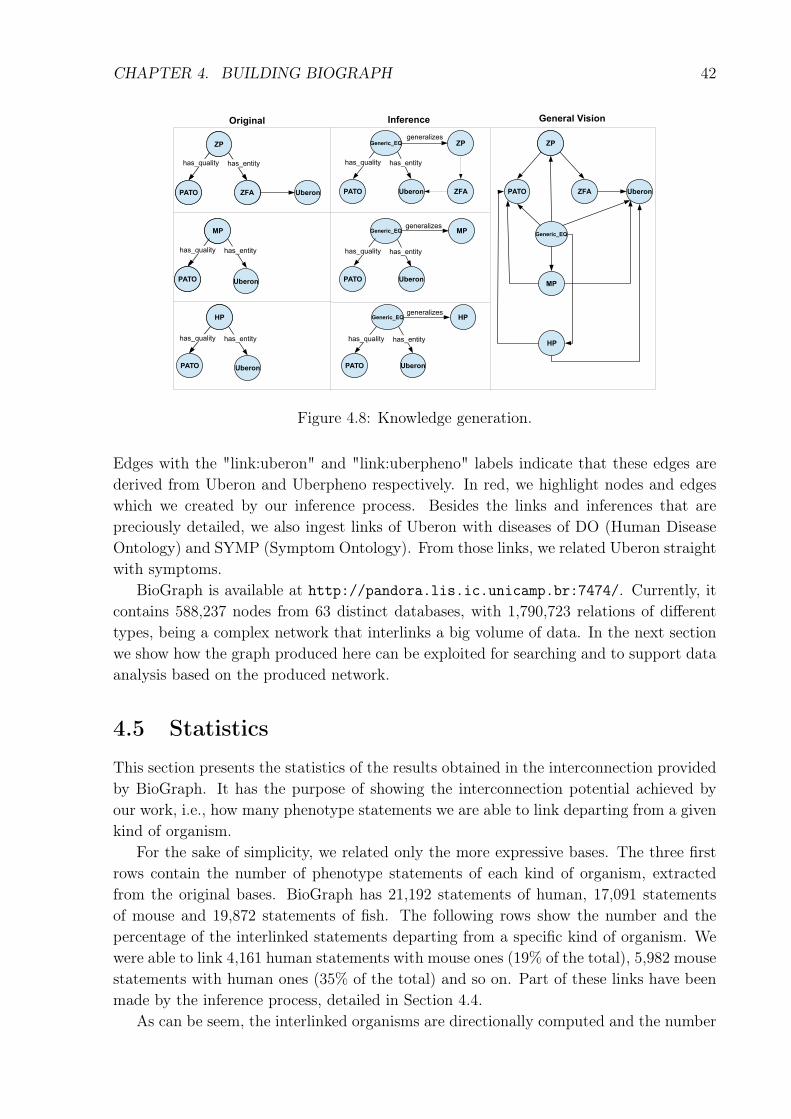
Generic_EQs are generic statements able to cross phenotypes of organisms. TheGeneric_EQ have been produced through inferences, as presented in Figure 4.8. In thefirst column, we present the statements with relations in their original format as extractedfrom the sources and presented in the previous subsection. In the second column, wepresent the inferred Generic_EQ derived from the respective original form. In the firstcase, we have a ZP term statement linking with PATO and ZFA, which in turn is associatedwith Uberon by a relation of equivalence. We have created a Generic_EQ that makes ajoin of the quality (PATO) and the Entity (Uberon) originally linked with ZP, producinga statement, that generalizes it. Furthermore, it points for the ZP term as one of itsspecializations. This Generic_EQ is showed in the second column in Figure 4.8. Thesame procedure is applied to other MODs like MP and HP as illustrated in Figure 4.8.
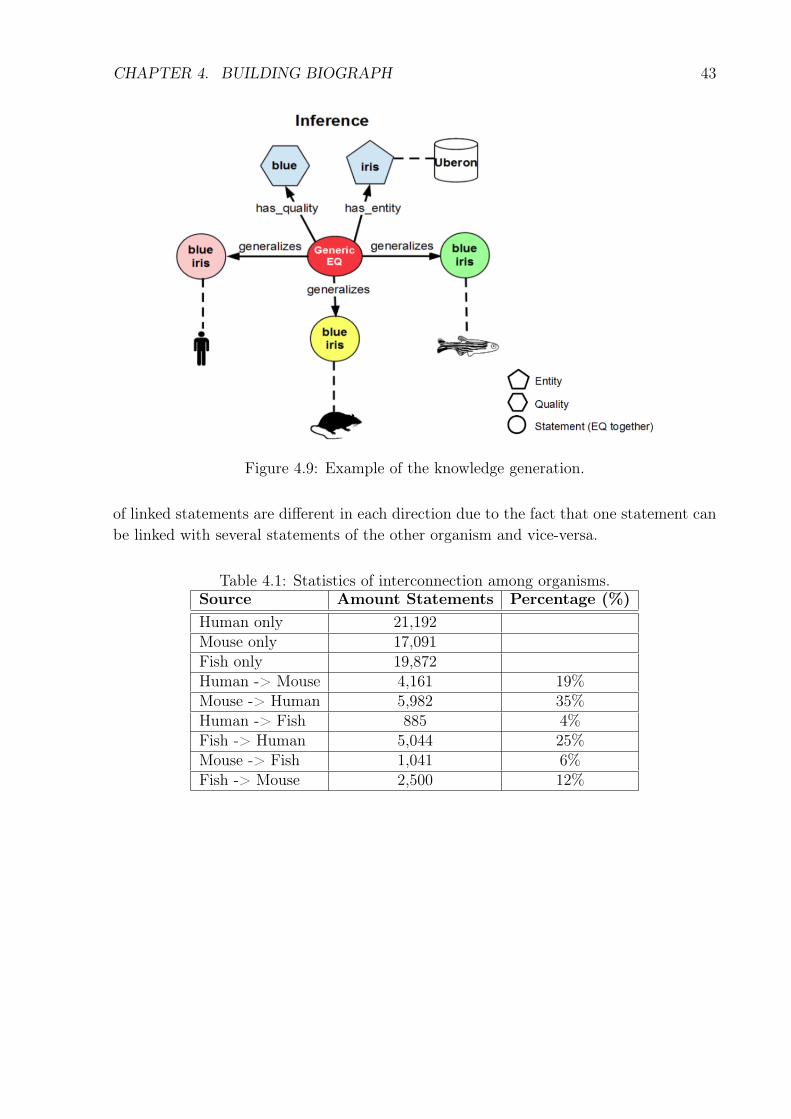
In the rightest column of Figure 4.8, is presented a General Vision frame of theGeneric_EQ connected with all the organisms, who shares the same statement, and theirentities and qualities. This graph put together those of the Inference box in Figure 4.1.As can be seen in the figure, whenever a generalized statement points to the same entityand quality it will refer to the same Generic_EQ, i.e., our algorithm always checks if thereis an existing Generic_EQ pointing to a given entity and quality (to be reused) beforecreating a new one. Figure 4.9 presents an example of the process, in which there is aGeneric_EQ term, whose label is "blue iris", for example, and this term is linked withthe same statement "blue iris" in the ontologies of human, mouse and zebrafish.
These inferences can enhance analyses and searches in the graph. Since both PATOand Uberon, linked by a Generic_EQ statement, are independent of a given organism,it is possible to formulate statements (specifying a link among entities and qualities)independently of a specific organism. Furthermore, with the Generic_EQ, a search canreturn all organisms which are linked by the same statement in a profile. For example, in asearch for "blue iris", BioGraph returns all organisms that have this phenotype. Comparedto our work, Uberon generalizes only entities, Uberpheno links existing statements withouta generalization. BioGraph produces a generic statement that takes advantages of theUberpheno links, but also joins, in the same network, generic qualities (PATO) and genericentities (Uberon), to produce a descriptive system, which is independent from specificorganisms. In addition, it is possible to access and download (in CSV or JSON) datafrom BioGraph, with all the integrated data and the inferences to use in other works.
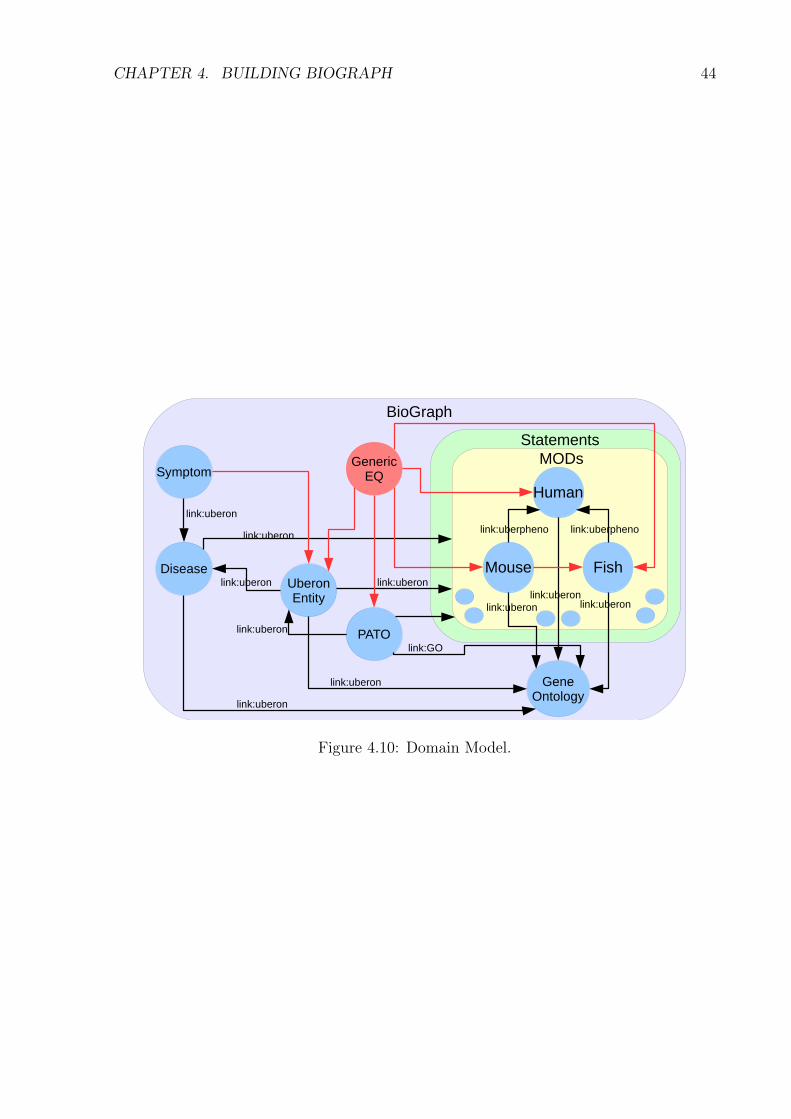
Figure 4.10 shows an overview of BioGraph and how it is organized; it contains: de-scriptions of phenotypes; Uberon entities, terms of gene ontology; diseases; and symptoms.
CHAPTER 4. BUILDING BIOGRAPH 42
Figure 4.8: Knowledge generation.
Edges with the "link:uberon" and "link:uberpheno" labels indicate that these edges arederived from Uberon and Uberpheno respectively. In red, we highlight nodes and edgeswhich we created by our inference process. Besides the links and inferences that arepreciously detailed, we also ingest links of Uberon with diseases of DO (Human DiseaseOntology) and SYMP (Symptom Ontology). From those links, we related Uberon straightwith symptoms.
BioGraph is available at http://pandora.lis.ic.unicamp.br:7474/. Currently, itcontains 588,237 nodes from 63 distinct databases, with 1,790,723 relations of differenttypes, being a complex network that interlinks a big volume of data. In the next sectionwe show how the graph produced here can be exploited for searching and to support dataanalysis based on the produced network.
4.5 Statistics
This section presents the statistics of the results obtained in the interconnection providedby BioGraph. It has the purpose of showing the interconnection potential achieved byour work, i.e., how many phenotype statements we are able to link departing from a givenkind of organism.
For the sake of simplicity, we related only the more expressive bases. The three firstrows contain the number of phenotype statements of each kind of organism, extractedfrom the original bases. BioGraph has 21,192 statements of human, 17,091 statementsof mouse and 19,872 statements of fish. The following rows show the number and thepercentage of the interlinked statements departing from a specific kind of organism. Wewere able to link 4,161 human statements with mouse ones (19% of the total), 5,982 mousestatements with human ones (35% of the total) and so on. Part of these links have beenmade by the inference process, detailed in Section 4.4.
As can be seem, the interlinked organisms are directionally computed and the number
CHAPTER 4. BUILDING BIOGRAPH 43
Figure 4.9: Example of the knowledge generation.
of linked statements are different in each direction due to the fact that one statement canbe linked with several statements of the other organism and vice-versa.
Table 4.1: Statistics of interconnection among organisms.Source Amount Statements Percentage (%)Human only 21,192Mouse only 17,091Fish only 19,872Human -> Mouse 4,161 19%Mouse -> Human 5,982 35%Human -> Fish 885 4%Fish -> Human 5,044 25%Mouse -> Fish 1,041 6%Fish -> Mouse 2,500 12%
CHAPTER 4. BUILDING BIOGRAPH 44
Figure 4.10: Domain Model.
Chapter 5
Experimental Results
This chapter presents some practical applications of our BioGraph in contexts like search-ing (Section 5.1), analyzing (Section 5.2) and describing (Section 5.3). Each section showsexperimental results of querying examples or preliminary prototypes aimed at illustratingand evaluating the potential of our network.
5.1 Searching
This section illustrates the querying potential provided by interconnection of our network.BioGraph enables searches across organisms in single queries – an operation that wouldrequire integrating and interconnecting several sources without BioGraph. We furthershow two questions that can be asked in BioGraph and the respective queries answeringthem:
1. Which phenotype statements (a composition of Entity and Quality) are shared bythe human, mouse, and fish?
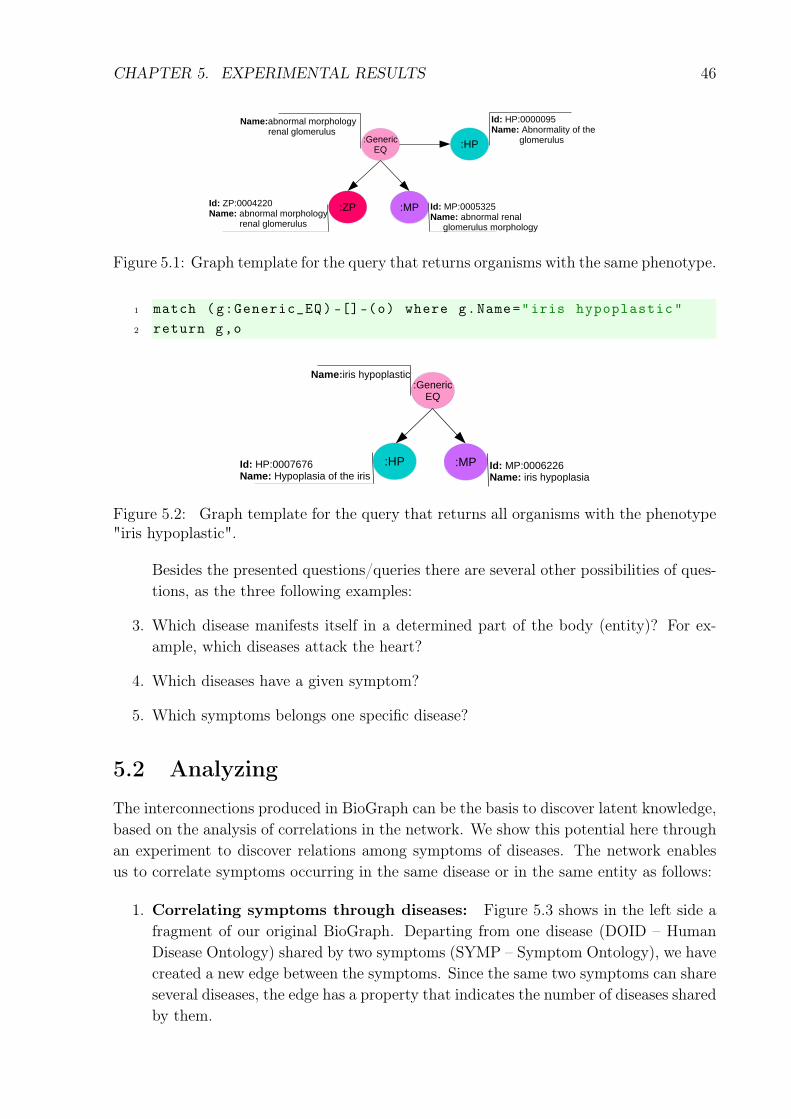
Figure 5.1 shows the graph template to answer this query. The requested statementsare specializations of the Generic_EQ. The figure also shows an instance returnedby the respective query in Cypher:
1 match(z:ZP)--(g:Generic_EQ)--(h:HP)2 match(m:MP)--(g)3 return z,g,h,m
The Cypher sentence presented here has two parts: MATCH (a sentence with atemplate that would match with some subgraph) and RETURN (the elements ofthe sentence to be returned). The MATCH reflects the graph of Figure 5.1, with:nodes represented between parenthesis; edges represented by to dashes --; labelspreceded by colons; and variables before the colons. In this case, z, g, h, m arevariables that receive instances of nodes which match the template.
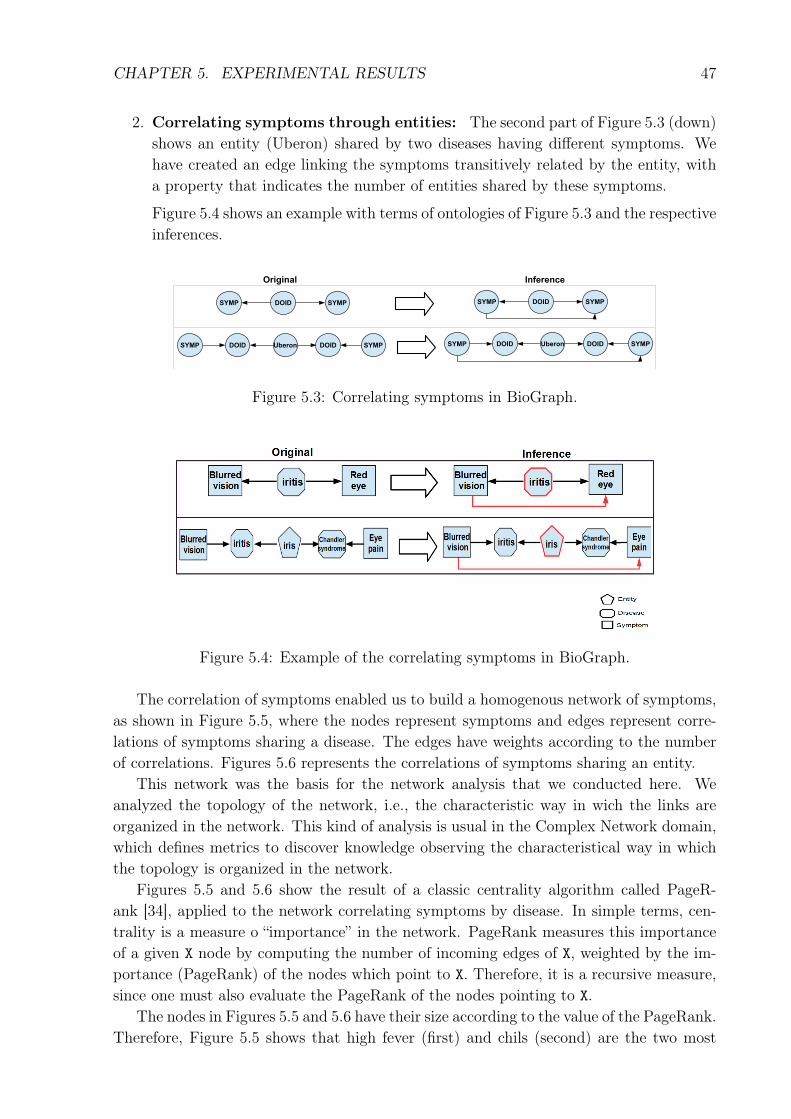
2. Which organisms have the phenotype "iris hypoplastic" or equivalents?
Figure 5.2 shows the graph template to answer this query and an instance returnedby the respective query.
45
CHAPTER 5. EXPERIMENTAL RESULTS 46
Figure 5.1: Graph template for the query that returns organisms with the same phenotype.
1 match (g:Generic_EQ) -[]-(o) where g.Name="iris hypoplastic"2 return g,o
Figure 5.2: Graph template for the query that returns all organisms with the phenotype"iris hypoplastic".
Besides the presented questions/queries there are several other possibilities of ques-tions, as the three following examples:
3. Which disease manifests itself in a determined part of the body (entity)? For ex-ample, which diseases attack the heart?
4. Which diseases have a given symptom?
5. Which symptoms belongs one specific disease?
5.2 Analyzing
The interconnections produced in BioGraph can be the basis to discover latent knowledge,based on the analysis of correlations in the network. We show this potential here throughan experiment to discover relations among symptoms of diseases. The network enablesus to correlate symptoms occurring in the same disease or in the same entity as follows:
1. Correlating symptoms through diseases: Figure 5.3 shows in the left side afragment of our original BioGraph. Departing from one disease (DOID – HumanDisease Ontology) shared by two symptoms (SYMP – Symptom Ontology), we havecreated a new edge between the symptoms. Since the same two symptoms can shareseveral diseases, the edge has a property that indicates the number of diseases sharedby them.
CHAPTER 5. EXPERIMENTAL RESULTS 47
2. Correlating symptoms through entities: The second part of Figure 5.3 (down)shows an entity (Uberon) shared by two diseases having different symptoms. Wehave created an edge linking the symptoms transitively related by the entity, witha property that indicates the number of entities shared by these symptoms.
Figure 5.4 shows an example with terms of ontologies of Figure 5.3 and the respectiveinferences.
Figure 5.3: Correlating symptoms in BioGraph.
Figure 5.4: Example of the correlating symptoms in BioGraph.
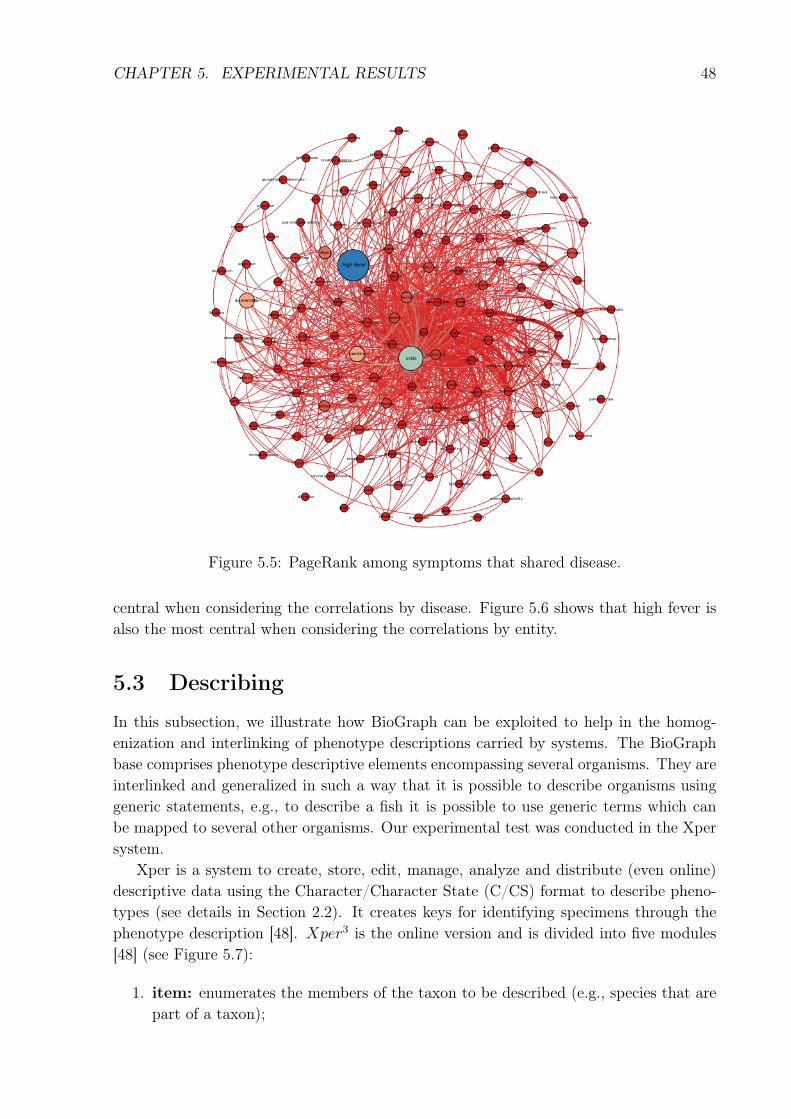
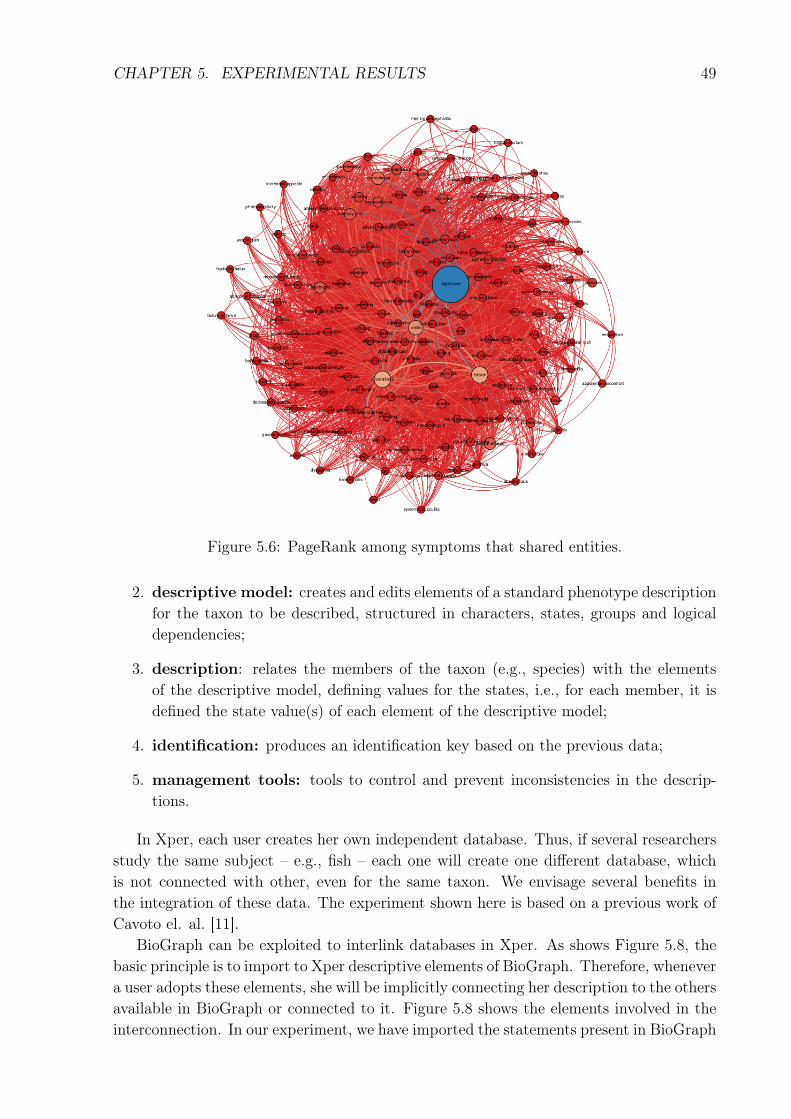
The correlation of symptoms enabled us to build a homogenous network of symptoms,as shown in Figure 5.5, where the nodes represent symptoms and edges represent corre-lations of symptoms sharing a disease. The edges have weights according to the numberof correlations. Figures 5.6 represents the correlations of symptoms sharing an entity.
This network was the basis for the network analysis that we conducted here. Weanalyzed the topology of the network, i.e., the characteristic way in wich the links areorganized in the network. This kind of analysis is usual in the Complex Network domain,which defines metrics to discover knowledge observing the characteristical way in whichthe topology is organized in the network.
Figures 5.5 and 5.6 show the result of a classic centrality algorithm called PageR-ank [34], applied to the network correlating symptoms by disease. In simple terms, cen-trality is a measure o “importance” in the network. PageRank measures this importanceof a given X node by computing the number of incoming edges of X, weighted by the im-portance (PageRank) of the nodes which point to X. Therefore, it is a recursive measure,since one must also evaluate the PageRank of the nodes pointing to X.
The nodes in Figures 5.5 and 5.6 have their size according to the value of the PageRank.Therefore, Figure 5.5 shows that high fever (first) and chils (second) are the two most
CHAPTER 5. EXPERIMENTAL RESULTS 48
Figure 5.5: PageRank among symptoms that shared disease.
central when considering the correlations by disease. Figure 5.6 shows that high fever isalso the most central when considering the correlations by entity.
5.3 Describing
In this subsection, we illustrate how BioGraph can be exploited to help in the homog-enization and interlinking of phenotype descriptions carried by systems. The BioGraphbase comprises phenotype descriptive elements encompassing several organisms. They areinterlinked and generalized in such a way that it is possible to describe organisms usinggeneric statements, e.g., to describe a fish it is possible to use generic terms which canbe mapped to several other organisms. Our experimental test was conducted in the Xpersystem.
Xper is a system to create, store, edit, manage, analyze and distribute (even online)descriptive data using the Character/Character State (C/CS) format to describe pheno-types (see details in Section 2.2). It creates keys for identifying specimens through thephenotype description [48]. Xper3 is the online version and is divided into five modules[48] (see Figure 5.7):
1. item: enumerates the members of the taxon to be described (e.g., species that arepart of a taxon);
CHAPTER 5. EXPERIMENTAL RESULTS 49
Figure 5.6: PageRank among symptoms that shared entities.
2. descriptive model: creates and edits elements of a standard phenotype descriptionfor the taxon to be described, structured in characters, states, groups and logicaldependencies;
3. description: relates the members of the taxon (e.g., species) with the elementsof the descriptive model, defining values for the states, i.e., for each member, it isdefined the state value(s) of each element of the descriptive model;
4. identification: produces an identification key based on the previous data;
5. management tools: tools to control and prevent inconsistencies in the descrip-tions.
In Xper, each user creates her own independent database. Thus, if several researchersstudy the same subject – e.g., fish – each one will create one different database, whichis not connected with other, even for the same taxon. We envisage several benefits inthe integration of these data. The experiment shown here is based on a previous work ofCavoto el. al. [11].
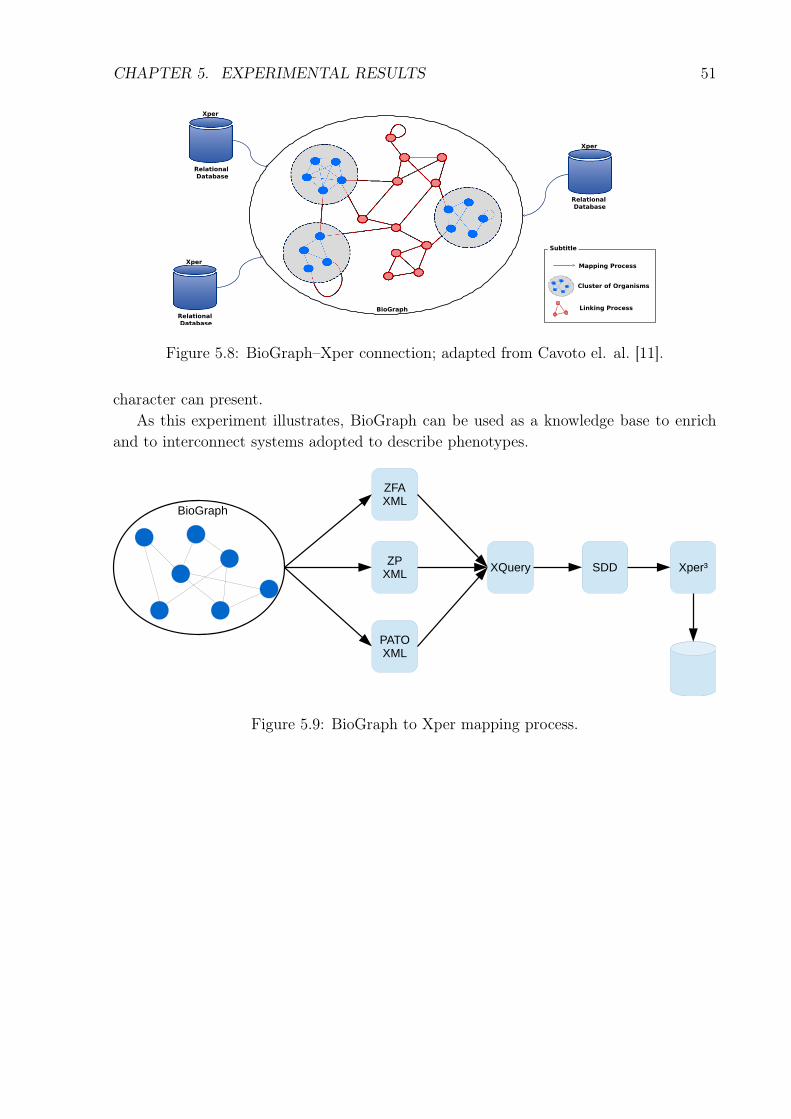
BioGraph can be exploited to interlink databases in Xper. As shows Figure 5.8, thebasic principle is to import to Xper descriptive elements of BioGraph. Therefore, whenevera user adopts these elements, she will be implicitly connecting her description to the othersavailable in BioGraph or connected to it. Figure 5.8 shows the elements involved in theinterconnection. In our experiment, we have imported the statements present in BioGraph
CHAPTER 5. EXPERIMENTAL RESULTS 50
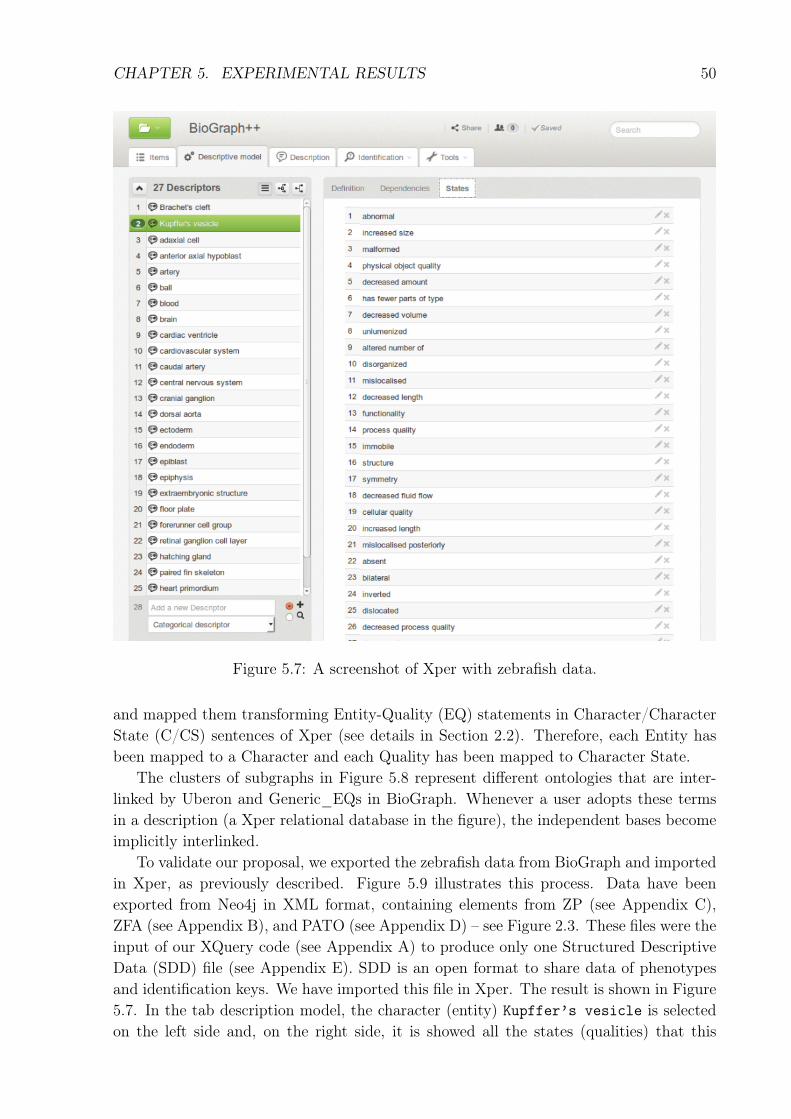
Figure 5.7: A screenshot of Xper with zebrafish data.
and mapped them transforming Entity-Quality (EQ) statements in Character/CharacterState (C/CS) sentences of Xper (see details in Section 2.2). Therefore, each Entity hasbeen mapped to a Character and each Quality has been mapped to Character State.
The clusters of subgraphs in Figure 5.8 represent different ontologies that are inter-linked by Uberon and Generic_EQs in BioGraph. Whenever a user adopts these termsin a description (a Xper relational database in the figure), the independent bases becomeimplicitly interlinked.
To validate our proposal, we exported the zebrafish data from BioGraph and importedin Xper, as previously described. Figure 5.9 illustrates this process. Data have beenexported from Neo4j in XML format, containing elements from ZP (see Appendix C),ZFA (see Appendix B), and PATO (see Appendix D) – see Figure 2.3. These files were theinput of our XQuery code (see Appendix A) to produce only one Structured DescriptiveData (SDD) file (see Appendix E). SDD is an open format to share data of phenotypesand identification keys. We have imported this file in Xper. The result is shown in Figure5.7. In the tab description model, the character (entity) Kupffer’s vesicle is selectedon the left side and, on the right side, it is showed all the states (qualities) that this
CHAPTER 5. EXPERIMENTAL RESULTS 51
Figure 5.8: BioGraph–Xper connection; adapted from Cavoto el. al. [11].
character can present.As this experiment illustrates, BioGraph can be used as a knowledge base to enrich
and to interconnect systems adopted to describe phenotypes.
Figure 5.9: BioGraph to Xper mapping process.
Chapter 6
Conclusion
Cross data of different organisms is crucial in medical and biological research. However,each organism is described in a distinct base. The bases are represented in heterogeneousformats, hampering their interconnection.
Sharing phenotypic descriptions is a key to cross data among organisms, due to thepossibility of comparing phenotypes. Furthermore, through phenotypes becomes possiblefinding candidate genes for diseases. It can also help in the diagnosis of diseases. However,even though there are several fragmented initiatives to describe phenotypes and to inter-connect them, there is a lack of a solution to combine them in a single unified base. Thisis the main challenges faced in this work, which addressed the heterogeneity of distinctdata sources, having different formats and descriptive approaches for phenotypes.
The main contributions of this work are: the unified model to support several descrip-tive approaches for phenotypes and the unified graph database, containing descriptionsof phenotypes from 63 distinct data sources. The main limitations of this work are: itsdomain dependency, i.e., the proposed model needs to be extend in order to be applied toother scenarios than phenotypes and there is no mechanism to import data automaticallyin Biograph.
Future work includes:
1. to import genes, linking them with their phenotypes and diseases;
2. to implement an interface for our system;
3. to improve the integration with Xper, even including features in the system thattakes advantage of BioGraph – e.g., the system can recommend phenotype elementsfrom BioGraph;
4. to further explore the possibility of searching and analysis provided by the network.
52
Bibliography
[1] Renzo Angles. A comparison of current graph database models. In Data EngineeringWorkshops (ICDEW), 2012 IEEE 28th International Conference on, pages 171–177.IEEE, 2012.
[2] Renzo Angles and Claudio Gutierrez. Survey of graph database models. ACM Com-puting Surveys (CSUR), 40(1):1, 2008.
[3] Michael Ashburner, Catherine A Ball, Judith A Blake, David Botstein, HeatherButler, J Michael Cherry, Allan P Davis, Kara Dolinski, Selina S Dwight, Janan TEppig, et al. Gene ontology: tool for the unification of biology. Nature genetics,25(1):25–29, 2000.
[4] Jonathan BL Bard and Seung Y Rhee. Ontologies in biology: design, applicationsand future challenges. Nature Reviews Genetics, 5(3):213–222, 2004.
[5] Àlex Bayés, Louie N van de Lagemaat, Mark O Collins, Mike DR Croning, Ian RWhittle, Jyoti S Choudhary, and Seth GN Grant. Characterization of the proteome,diseases and evolution of the human postsynaptic density. Nature neuroscience,14(1):19–21, 2011.
[6] Judith A Blake, Joel E Richardson, Carol J Bult, Jim A Kadin, Janan T Eppig,Mouse Genome Database Group, et al. Mgd: the mouse genome database. Nucleicacids research, 31(1):193–195, 2003.
[7] John Adrian Bondy and Uppaluri Siva Ramachandra Murty. Graph theory withapplications, volume 290. Citeseer, 1976.
[8] Willem Nico Borst. Construction of engineering ontologies for knowledge sharing andreuse. Universiteit Twente, 1997.
[9] Tim Bray, Jean Paoli, C Michael Sperberg-McQueen, Eve Maler, and FrançoisYergeau. Extensible markup language (xml). World Wide Web Consortium Recom-mendation REC-xml-19980210. http://www. w3. org/TR/1998/REC-xml-19980210,16:16, 1998.
[10] Carol J Bult, Janan T Eppig, James A Kadin, Joel E Richardson, Judith A Blake,Mouse Genome Database Group, et al. The mouse genome database (mgd): mousebiology and model systems. Nucleic acids research, 36(suppl 1):D724–D728, 2008.
53
BIBLIOGRAPHY 54
[11] Patrícia Cavoto, Victor Cardoso, Régine Vignes Lebbe, and André Santanchè. Fish-graph: A network-driven data analysis. In e-Science (e-Science), 2015 IEEE 11thInternational Conference on, pages 177–186. IEEE, 2015.
[12] Douglas Crockford. The application/json media type for javascript object notation(json). 2006.
[13] Sandra C Doelken, Sebastian Köhler, Christopher J Mungall, Georgios V Gkoutos,Barbara J Ruef, Cynthia Smith, Damian Smedley, Sebastian Bauer, Eva Klopocki,Paul N Schofield, et al. Phenotypic overlap in the contribution of individual genesto cnv pathogenicity revealed by cross-species computational analysis of single-genemutations in humans, mice and zebrafish. Disease Models and Mechanisms, 6(2):358–372, 2013.
[14] David Dominguez-Sal, P Urbón-Bayes, Aleix Giménez-Vanó, Sergio Gómez-Villamor,Norbert Martínez-Bazan, and Josep-Lluis Larriba-Pey. Survey of graph database per-formance on the hpc scalable graph analysis benchmark. In International Conferenceon Web-Age Information Management, pages 37–48. Springer, 2010.
[15] Karen Eilbeck, Suzanna E Lewis, Christopher J Mungall, Mark Yandell, LincolnStein, Richard Durbin, and Michael Ashburner. The sequence ontology: a tool forthe unification of genome annotations. Genome biology, 6(5):1, 2005.
[16] Anais Grand, Regine Vignes Lebbe, and Andre Santanche. From phenotypes to treesof life: A metamodel-driven approach for the integration of taxonomy models. Ine-Science (e-Science), 2014 IEEE 10th International Conference on, volume 1, pages65–72. IEEE, 2014.
[17] Thomas R Gruber. A translation approach to portable ontology specifications.Knowledge acquisition, 5(2):199–220, 1993.
[18] Nicola Guarino, Daniel Oberle, and Steffen Staab. What is an ontology? In Handbookon ontologies, pages 1–17. Springer, 2009.
[19] Ada Hamosh, Alan F Scott, Joanna S Amberger, Carol A Bocchini, and Victor AMcKusick. Online mendelian inheritance in man (omim), a knowledgebase of humangenes and genetic disorders. Nucleic acids research, 33(suppl 1):D514–D517, 2005.
[20] Christian Theil Have and Lars Juhl Jensen. Are graph databases ready for bioinfor-matics? Bioinformatics, 29(24):3107–3108, 2013.
[21] S Blair Hedges. The origin and evolution of model organisms. Nature ReviewsGenetics, 3(11):838–849, 2002.
[22] Alex Kalderimis, Rachel Lyne, Daniela Butano, Sergio Contrino, Mike Lyne, JoshuaHeimbach, Fengyuan Hu, Richard Smith, Radek Štěpán, Julie Sullivan, et al. In-termine: extensive web services for modern biology. Nucleic acids research, pagegku301, 2014.
BIBLIOGRAPHY 55
[23] Graham Klyne and Jeremy J Carroll. Resource description framework (rdf): Con-cepts and abstract syntax. 2006.
[24] Sebastian Köhler. Phenotype informatics: network approaches towards understandingthe diseasome. PhD thesis, Berlin Freie Universität, 2013.
[25] Sebastian Köhler, Sandra C Doelken, Barbara J Ruef, Sebastian Bauer, NicoleWashington, Monte Westerfield, George Gkoutos, Paul Schofield, Damian Smedley,Suzanna E Lewis, et al. Construction and accessibility of a cross-species phenotypeontology along with gene annotations for biomedical research. F1000Research, 2,2013.
[26] Sebastian Köhler, Uwe Schoeneberg, Johanna Christina Czeschik, Sandra C Doelken,Jayne Y Hehir-Kwa, Jonas Ibn-Salem, Christopher J Mungall, Damian Smedley,Melissa A Haendel, and Peter N Robinson. Clinical interpretation of cnvs with cross-species phenotype data. Journal of medical genetics, 51(11):766–772, 2014.
[27] Jacques Lebbe. Représentation des concepts en biologie et en médecine. Introductionà l’analyse des connaissances et à l’identification assistée par ordinateur. PhD thesis,1991.
[28] Martin Mahner and Michael Kary. What exactly are genomes, genotypes and phe-notypes? and what about phenomes? Journal of Theoretical Biology, 186(1):55–63,1997.
[29] Prashanti Manda, James P Balhoff, Hilmar Lapp, Paula Mabee, and Todd J Vision.Using the phenoscape knowledgebase to relate genetic perturbations to phenotypicevolution. genesis, 53(8):561–571, 2015.
[30] Daniel Marbach, James C Costello, Robert Küffner, Nicole M Vega, Robert JPrill, Diogo M Camacho, Kyle R Allison, Manolis Kellis, James J Collins, Gus-tavo Stolovitzky, et al. Wisdom of crowds for robust gene network inference. Naturemethods, 9(8):796–804, 2012.
[31] Deborah L McGuinness, Frank Van Harmelen, et al. Owl web ontology languageoverview. W3C recommendation, 10(10):2004, 2004.
[32] Christopher J Mungall, Carlo Torniai, Georgios V Gkoutos, Suzanna E Lewis,Melissa A Haendel, et al. Uberon, an integrative multi-species anatomy ontology.Genome Biol, 13(1):R5, 2012.
[33] National Research Council (US) Committee on A Framework for Developing a NewTaxonomy of Disease et al. Toward precision medicine: building a knowledge networkfor biomedical research and a new taxonomy of disease. National Academies Press(US), 2011.
[34] Lawrence Page, Sergey Brin, Rajeev Motwani, and Terry Winograd. The pagerankcitation ranking: bringing order to the web. 1999.
BIBLIOGRAPHY 56
[35] Pablo Pareja-Tobes, Raquel Tobes, Marina Manrique, Eduardo Pareja, and EduardoPareja-Tobes. Bio4j: a high-performance cloud-enabled graph-based data platform.bioRxiv, page 016758, 2015.
[36] Lyne Rachel, Sullivan Julie, Butano Daniela, Contrino Sergio, Heimbach Joshua,Hu Fengyuan, Kalderimis Alex, Lyne Mike, Smith N Richard, Štěpán Radek, et al.Cross-organism analysis using intermine. genesis, 2015.
[37] Ian Robinson, Jim Webber, and Emil Eifrem. Graph databases. O’Reilly, 2013.
[38] Peter N Robinson. Deep phenotyping for precision medicine. Human mutation,33(5):777–780, 2012.
[39] Peter N Robinson, Sebastian Köhler, Sebastian Bauer, Dominik Seelow, Denise Horn,and Stefan Mundlos. The human phenotype ontology: a tool for annotating andanalyzing human hereditary disease. The American Journal of Human Genetics,83(5):610–615, 2008.
[40] Lynn Marie Schriml, Cesar Arze, Suvarna Nadendla, Yu-Wei Wayne Chang, MarkMazaitis, Victor Felix, Gang Feng, and Warren Alden Kibbe. Disease ontology: abackbone for disease semantic integration. Nucleic acids research, 40(D1):D940–D946, 2012.
[41] Damian Smedley, Anika Oellrich, Sebastian Köhler, Barbara Ruef, Monte West-erfield, Peter Robinson, Suzanna Lewis, Christopher Mungall, et al. Phenodigm:analyzing curated annotations to associate animal models with human diseases.Database, 2013:bat025, 2013.
[42] Barry Smith, Michael Ashburner, Cornelius Rosse, Jonathan Bard, William Bug,Werner Ceusters, Louis J Goldberg, Karen Eilbeck, Amelia Ireland, Christopher JMungall, et al. The obo foundry: coordinated evolution of ontologies to supportbiomedical data integration. Nature biotechnology, 25(11):1251–1255, 2007.
[43] Cynthia L Smith, Carroll-Ann W Goldsmith, and Janan T Eppig. The mammalianphenotype ontology as a tool for annotating, analyzing and comparing phenotypicinformation. Genome biology, 6(1):R7, 2004.
[44] Richard N Smith, Jelena Aleksic, Daniela Butano, Adrian Carr, Sergio Contrino,Fengyuan Hu, Mike Lyne, Rachel Lyne, Alex Kalderimis, Kim Rutherford, et al.Intermine: a flexible data warehouse system for the integration and analysis of het-erogeneous biological data. Bioinformatics, 28(23):3163–3165, 2012.
[45] Jamie Soul, Timothy E Hardingham, Raymond P Boot-Handford, and Jean-MarcSchwartz. Phenomeexpress: A refined network analysis of expression datasets byinclusion of known disease phenotypes. Scientific reports, 5, 2015.
[46] Judy Sprague, Leyla Bayraktaroglu, Dave Clements, Tom Conlin, David Fashena,Ken Frazer, Melissa Haendel, Douglas G Howe, Prita Mani, Sridhar Ramachandran,
BIBLIOGRAPHY 57
et al. The zebrafish information network: the zebrafish model organism database.Nucleic acids research, 34(suppl 1):D581–D585, 2006.
[47] Rudi Studer, V Richard Benjamins, and Dieter Fensel. Knowledge engineering: prin-ciples and methods. Data & knowledge engineering, 25(1):161–197, 1998.
[48] Visotheary Ung, Guillaume Dubus, René Zaragüeta-Bagils, and Régine Vignes-Lebbe. Xper2: introducing e-taxonomy. Bioinformatics, 26(5):703–704, 2010.
[49] Chad Vicknair, Michael Macias, Zhendong Zhao, Xiaofei Nan, Yixin Chen, and DawnWilkins. A comparison of a graph database and a relational database: a data prove-nance perspective. In Proceedings of the 48th annual Southeast regional conference,page 42. ACM, 2010.
[50] Nicole L Washington, Melissa A Haendel, Christopher J Mungall, Michael Ashburner,Monte Westerfield, and Suzanna E Lewis. Linking human diseases to animal modelsusing ontology-based phenotype annotation. PLoS biology, 7(11):e1000247, 2009.
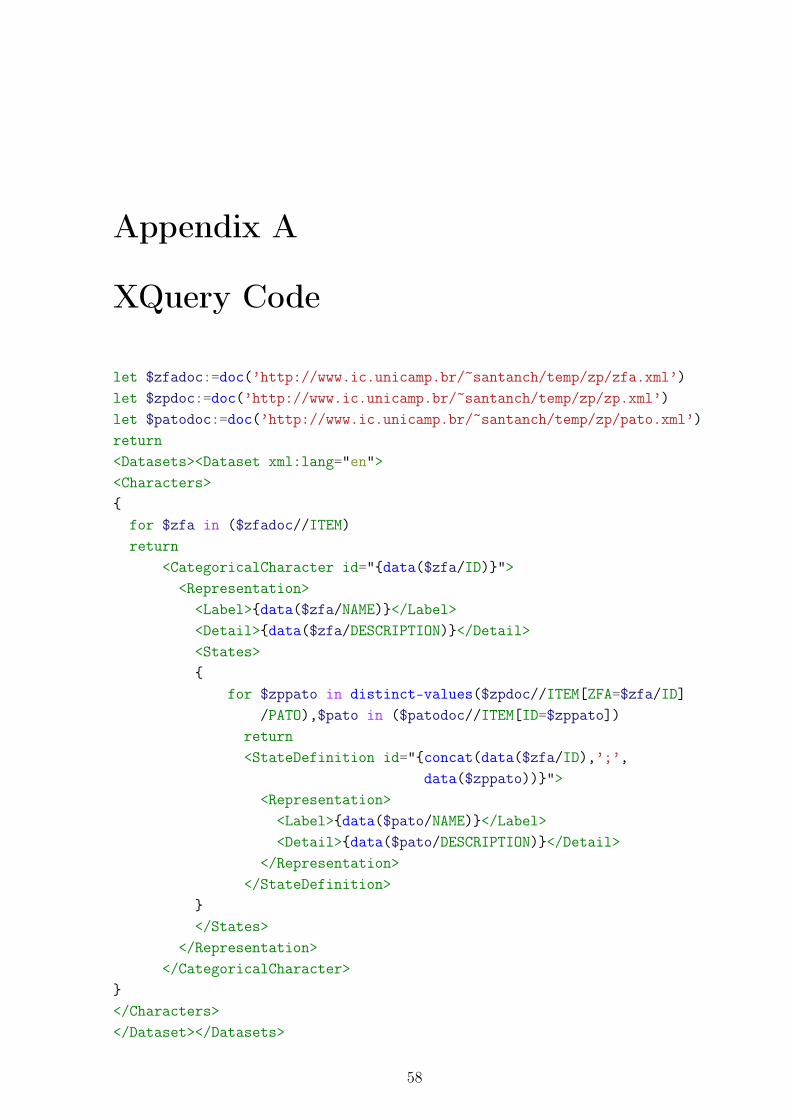
Appendix A
XQuery Code
let $zfadoc:=doc(’http://www.ic.unicamp.br/~santanch/temp/zp/zfa.xml’)let $zpdoc:=doc(’http://www.ic.unicamp.br/~santanch/temp/zp/zp.xml’)let $patodoc:=doc(’http://www.ic.unicamp.br/~santanch/temp/zp/pato.xml’)return<Datasets><Dataset xml:lang="en"><Characters>{
for $zfa in ($zfadoc//ITEM)return
<CategoricalCharacter id="{data($zfa/ID)}"><Representation>
<Label>{data($zfa/NAME)}</Label><Detail>{data($zfa/DESCRIPTION)}</Detail><States>{
for $zppato in distinct-values($zpdoc//ITEM[ZFA=$zfa/ID]/PATO),$pato in ($patodoc//ITEM[ID=$zppato])
return<StateDefinition id="{concat(data($zfa/ID),’;’,
data($zppato))}"><Representation>
<Label>{data($pato/NAME)}</Label><Detail>{data($pato/DESCRIPTION)}</Detail>
</Representation></StateDefinition>
}</States>
</Representation></CategoricalCharacter>
}</Characters></Dataset></Datasets>
58
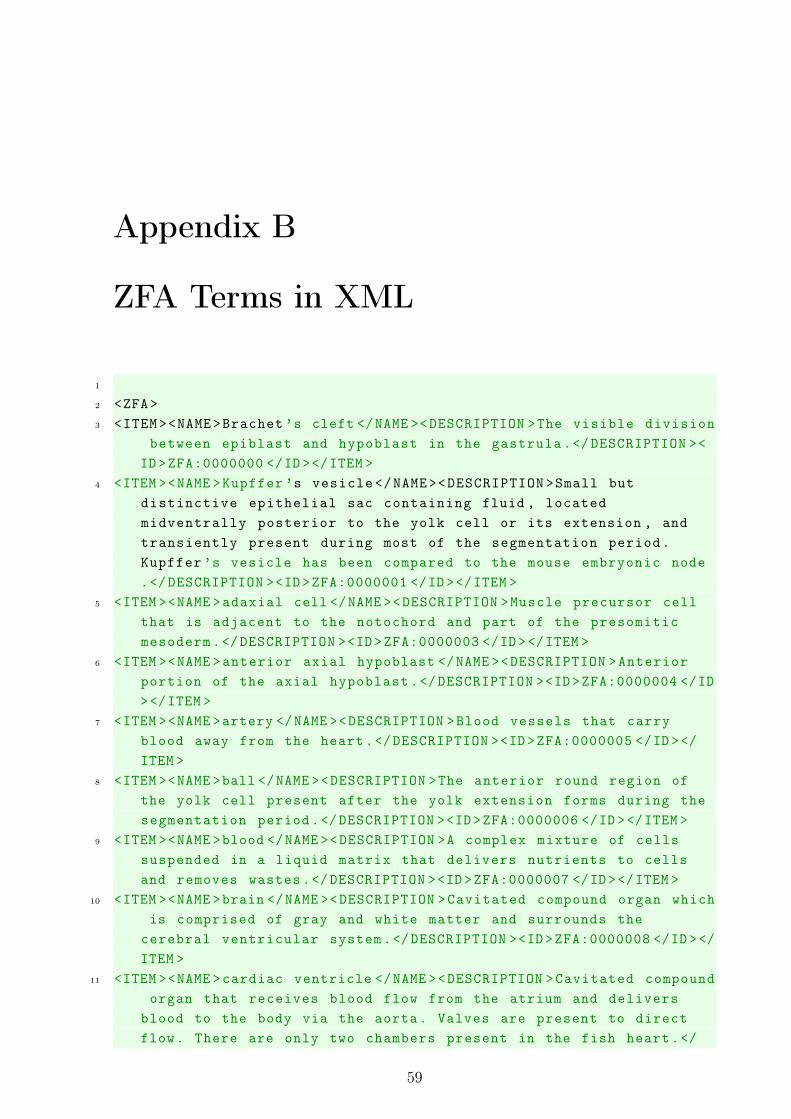
Appendix B
ZFA Terms in XML
1
2 <ZFA>3 <ITEM><NAME>Brachet ’s cleft </NAME ><DESCRIPTION >The visible division
between epiblast and hypoblast in the gastrula.</DESCRIPTION ><ID>ZFA:0000000 </ID ></ITEM >
4 <ITEM ><NAME >Kupffer ’s vesicle </NAME><DESCRIPTION >Small butdistinctive epithelial sac containing fluid , locatedmidventrally posterior to the yolk cell or its extension , andtransiently present during most of the segmentation period.Kupffer ’s vesicle has been compared to the mouse embryonic node.</DESCRIPTION ><ID>ZFA:0000001 </ID ></ITEM >
5 <ITEM ><NAME >adaxial cell </NAME ><DESCRIPTION >Muscle precursor cellthat is adjacent to the notochord and part of the presomiticmesoderm.</DESCRIPTION ><ID>ZFA:0000003 </ID ></ITEM >
6 <ITEM ><NAME >anterior axial hypoblast </NAME ><DESCRIPTION >Anteriorportion of the axial hypoblast.</DESCRIPTION ><ID>ZFA:0000004 </ID></ITEM >
7 <ITEM ><NAME >artery </NAME ><DESCRIPTION >Blood vessels that carryblood away from the heart.</DESCRIPTION ><ID>ZFA:0000005 </ID ></ITEM >
8 <ITEM ><NAME >ball </NAME ><DESCRIPTION >The anterior round region ofthe yolk cell present after the yolk extension forms during thesegmentation period.</DESCRIPTION ><ID>ZFA:0000006 </ID ></ITEM >
9 <ITEM ><NAME >blood </NAME ><DESCRIPTION >A complex mixture of cellssuspended in a liquid matrix that delivers nutrients to cellsand removes wastes.</DESCRIPTION ><ID>ZFA:0000007 </ID ></ITEM >
10 <ITEM ><NAME >brain </NAME ><DESCRIPTION >Cavitated compound organ whichis comprised of gray and white matter and surrounds the
cerebral ventricular system.</DESCRIPTION ><ID>ZFA:0000008 </ID ></ITEM >
11 <ITEM ><NAME >cardiac ventricle </NAME ><DESCRIPTION >Cavitated compoundorgan that receives blood flow from the atrium and delivers
blood to the body via the aorta. Valves are present to directflow. There are only two chambers present in the fish heart.</
59
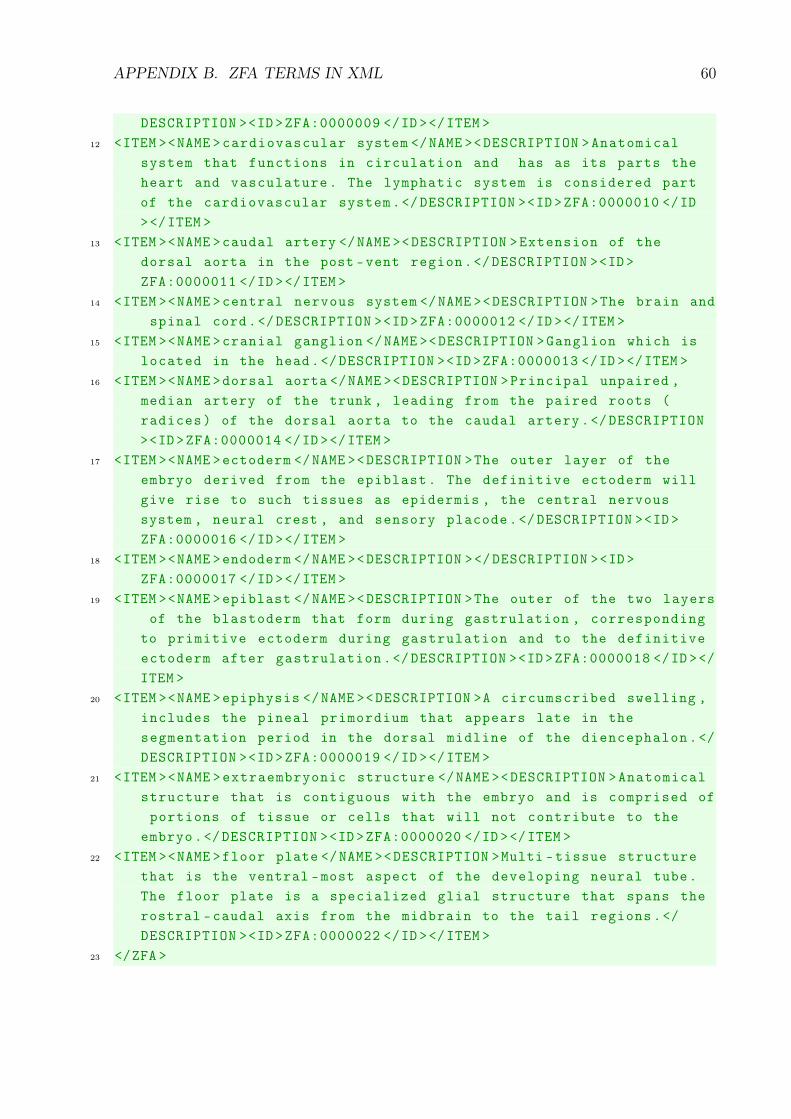
APPENDIX B. ZFA TERMS IN XML 60
DESCRIPTION ><ID>ZFA:0000009 </ID ></ITEM >12 <ITEM ><NAME >cardiovascular system </NAME ><DESCRIPTION >Anatomical
system that functions in circulation and has as its parts theheart and vasculature. The lymphatic system is considered partof the cardiovascular system.</DESCRIPTION ><ID>ZFA:0000010 </ID></ITEM >
13 <ITEM ><NAME >caudal artery </NAME ><DESCRIPTION >Extension of thedorsal aorta in the post -vent region.</DESCRIPTION ><ID>ZFA:0000011 </ID ></ITEM >
14 <ITEM ><NAME >central nervous system </NAME ><DESCRIPTION >The brain andspinal cord.</DESCRIPTION ><ID>ZFA:0000012 </ID ></ITEM >
15 <ITEM ><NAME >cranial ganglion </NAME ><DESCRIPTION >Ganglion which islocated in the head.</DESCRIPTION ><ID>ZFA:0000013 </ID ></ITEM >
16 <ITEM ><NAME >dorsal aorta </NAME ><DESCRIPTION >Principal unpaired ,median artery of the trunk , leading from the paired roots (radices) of the dorsal aorta to the caudal artery.</DESCRIPTION><ID>ZFA:0000014 </ID ></ITEM >
17 <ITEM ><NAME >ectoderm </NAME ><DESCRIPTION >The outer layer of theembryo derived from the epiblast. The definitive ectoderm willgive rise to such tissues as epidermis , the central nervoussystem , neural crest , and sensory placode.</DESCRIPTION ><ID>ZFA:0000016 </ID ></ITEM >
18 <ITEM ><NAME >endoderm </NAME ><DESCRIPTION ></DESCRIPTION ><ID>ZFA:0000017 </ID ></ITEM >
19 <ITEM ><NAME >epiblast </NAME ><DESCRIPTION >The outer of the two layersof the blastoderm that form during gastrulation , corresponding
to primitive ectoderm during gastrulation and to the definitiveectoderm after gastrulation .</DESCRIPTION ><ID>ZFA:0000018 </ID ></ITEM >
20 <ITEM ><NAME >epiphysis </NAME ><DESCRIPTION >A circumscribed swelling ,includes the pineal primordium that appears late in thesegmentation period in the dorsal midline of the diencephalon .</DESCRIPTION ><ID>ZFA:0000019 </ID ></ITEM >
21 <ITEM ><NAME >extraembryonic structure </NAME ><DESCRIPTION >Anatomicalstructure that is contiguous with the embryo and is comprised ofportions of tissue or cells that will not contribute to the
embryo.</DESCRIPTION ><ID>ZFA:0000020 </ID ></ITEM >22 <ITEM ><NAME >floor plate </NAME ><DESCRIPTION >Multi -tissue structure
that is the ventral -most aspect of the developing neural tube.The floor plate is a specialized glial structure that spans therostral -caudal axis from the midbrain to the tail regions.</DESCRIPTION ><ID>ZFA:0000022 </ID ></ITEM >
23 </ZFA >
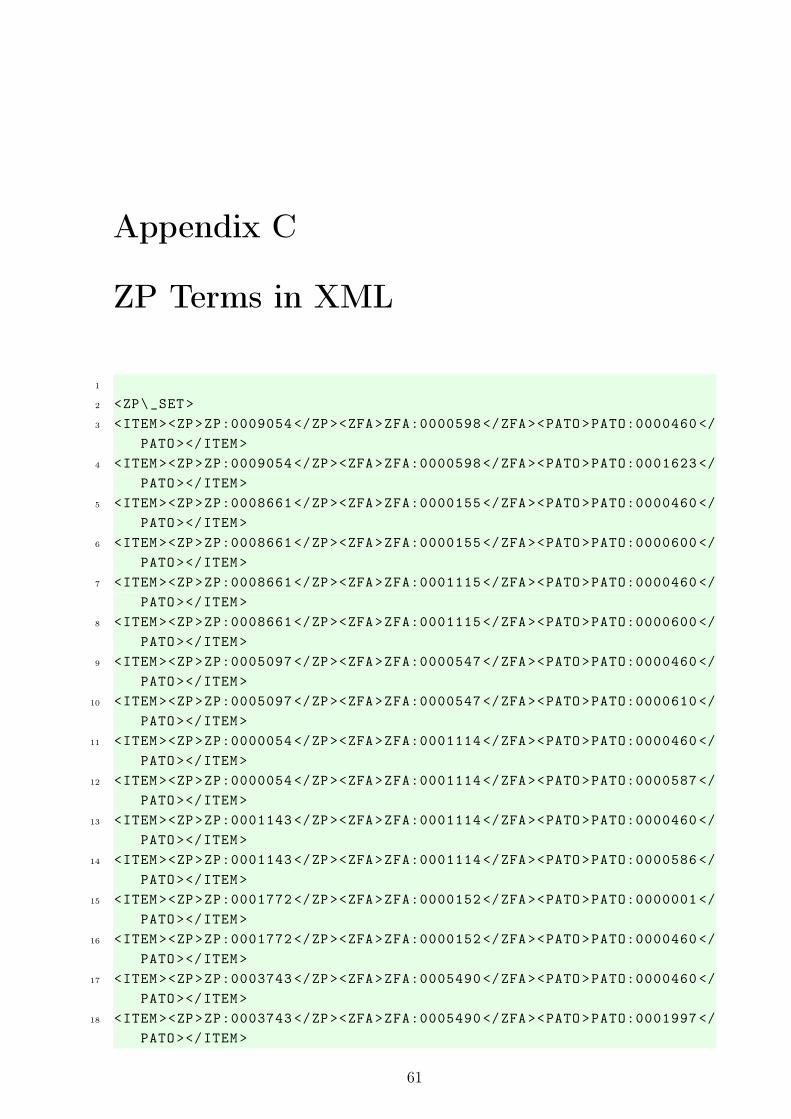
Appendix C
ZP Terms in XML
1
2 <ZP\_SET>3 <ITEM><ZP>ZP:0009054 </ZP><ZFA>ZFA:0000598 </ZFA><PATO>PATO:0000460 </
PATO></ITEM>4 <ITEM><ZP>ZP:0009054 </ZP><ZFA>ZFA:0000598 </ZFA><PATO>PATO:0001623 </
PATO></ITEM>5 <ITEM><ZP>ZP:0008661 </ZP><ZFA>ZFA:0000155 </ZFA><PATO>PATO:0000460 </
PATO></ITEM>6 <ITEM><ZP>ZP:0008661 </ZP><ZFA>ZFA:0000155 </ZFA><PATO>PATO:0000600 </
PATO></ITEM>7 <ITEM><ZP>ZP:0008661 </ZP><ZFA>ZFA:0001115 </ZFA><PATO>PATO:0000460 </
PATO></ITEM>8 <ITEM><ZP>ZP:0008661 </ZP><ZFA>ZFA:0001115 </ZFA><PATO>PATO:0000600 </
PATO></ITEM>9 <ITEM><ZP>ZP:0005097 </ZP><ZFA>ZFA:0000547 </ZFA><PATO>PATO:0000460 </
PATO></ITEM>10 <ITEM><ZP>ZP:0005097 </ZP><ZFA>ZFA:0000547 </ZFA><PATO>PATO:0000610 </
PATO></ITEM>11 <ITEM><ZP>ZP:0000054 </ZP><ZFA>ZFA:0001114 </ZFA><PATO>PATO:0000460 </
PATO></ITEM>12 <ITEM><ZP>ZP:0000054 </ZP><ZFA>ZFA:0001114 </ZFA><PATO>PATO:0000587 </
PATO></ITEM>13 <ITEM><ZP>ZP:0001143 </ZP><ZFA>ZFA:0001114 </ZFA><PATO>PATO:0000460 </
PATO></ITEM>14 <ITEM><ZP>ZP:0001143 </ZP><ZFA>ZFA:0001114 </ZFA><PATO>PATO:0000586 </
PATO></ITEM>15 <ITEM><ZP>ZP:0001772 </ZP><ZFA>ZFA:0000152 </ZFA><PATO>PATO:0000001 </
PATO></ITEM>16 <ITEM><ZP>ZP:0001772 </ZP><ZFA>ZFA:0000152 </ZFA><PATO>PATO:0000460 </
PATO></ITEM>17 <ITEM><ZP>ZP:0003743 </ZP><ZFA>ZFA:0005490 </ZFA><PATO>PATO:0000460 </
PATO></ITEM>18 <ITEM><ZP>ZP:0003743 </ZP><ZFA>ZFA:0005490 </ZFA><PATO>PATO:0001997 </
PATO></ITEM>
61
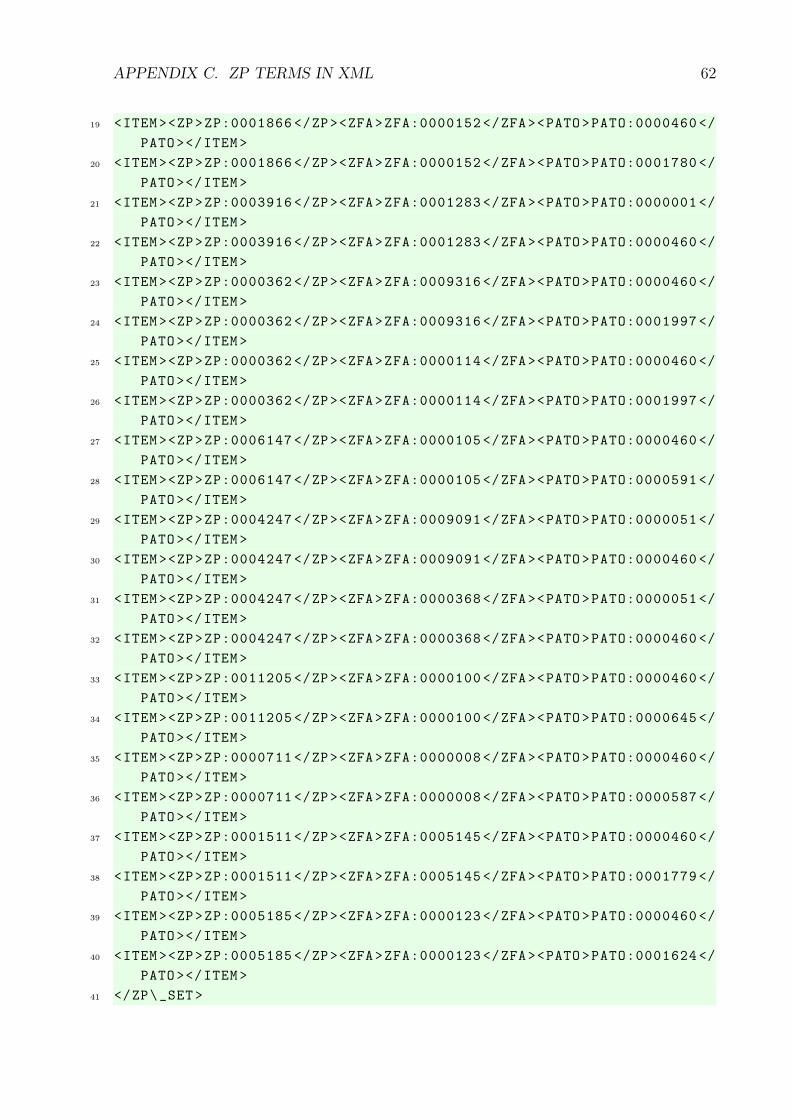
APPENDIX C. ZP TERMS IN XML 62
19 <ITEM><ZP>ZP:0001866 </ZP><ZFA>ZFA:0000152 </ZFA><PATO>PATO:0000460 </PATO></ITEM>
20 <ITEM><ZP>ZP:0001866 </ZP><ZFA>ZFA:0000152 </ZFA><PATO>PATO:0001780 </PATO></ITEM>
21 <ITEM><ZP>ZP:0003916 </ZP><ZFA>ZFA:0001283 </ZFA><PATO>PATO:0000001 </PATO></ITEM>
22 <ITEM><ZP>ZP:0003916 </ZP><ZFA>ZFA:0001283 </ZFA><PATO>PATO:0000460 </PATO></ITEM>
23 <ITEM><ZP>ZP:0000362 </ZP><ZFA>ZFA:0009316 </ZFA><PATO>PATO:0000460 </PATO></ITEM>
24 <ITEM><ZP>ZP:0000362 </ZP><ZFA>ZFA:0009316 </ZFA><PATO>PATO:0001997 </PATO></ITEM>
25 <ITEM><ZP>ZP:0000362 </ZP><ZFA>ZFA:0000114 </ZFA><PATO>PATO:0000460 </PATO></ITEM>
26 <ITEM><ZP>ZP:0000362 </ZP><ZFA>ZFA:0000114 </ZFA><PATO>PATO:0001997 </PATO></ITEM>
27 <ITEM><ZP>ZP:0006147 </ZP><ZFA>ZFA:0000105 </ZFA><PATO>PATO:0000460 </PATO></ITEM>
28 <ITEM><ZP>ZP:0006147 </ZP><ZFA>ZFA:0000105 </ZFA><PATO>PATO:0000591 </PATO></ITEM>
29 <ITEM><ZP>ZP:0004247 </ZP><ZFA>ZFA:0009091 </ZFA><PATO>PATO:0000051 </PATO></ITEM>
30 <ITEM><ZP>ZP:0004247 </ZP><ZFA>ZFA:0009091 </ZFA><PATO>PATO:0000460 </PATO></ITEM>
31 <ITEM><ZP>ZP:0004247 </ZP><ZFA>ZFA:0000368 </ZFA><PATO>PATO:0000051 </PATO></ITEM>
32 <ITEM><ZP>ZP:0004247 </ZP><ZFA>ZFA:0000368 </ZFA><PATO>PATO:0000460 </PATO></ITEM>
33 <ITEM><ZP>ZP:0011205 </ZP><ZFA>ZFA:0000100 </ZFA><PATO>PATO:0000460 </PATO></ITEM>
34 <ITEM><ZP>ZP:0011205 </ZP><ZFA>ZFA:0000100 </ZFA><PATO>PATO:0000645 </PATO></ITEM>
35 <ITEM><ZP>ZP:0000711 </ZP><ZFA>ZFA:0000008 </ZFA><PATO>PATO:0000460 </PATO></ITEM>
36 <ITEM><ZP>ZP:0000711 </ZP><ZFA>ZFA:0000008 </ZFA><PATO>PATO:0000587 </PATO></ITEM>
37 <ITEM><ZP>ZP:0001511 </ZP><ZFA>ZFA:0005145 </ZFA><PATO>PATO:0000460 </PATO></ITEM>
38 <ITEM><ZP>ZP:0001511 </ZP><ZFA>ZFA:0005145 </ZFA><PATO>PATO:0001779 </PATO></ITEM>
39 <ITEM><ZP>ZP:0005185 </ZP><ZFA>ZFA:0000123 </ZFA><PATO>PATO:0000460 </PATO></ITEM>
40 <ITEM><ZP>ZP:0005185 </ZP><ZFA>ZFA:0000123 </ZFA><PATO>PATO:0001624 </PATO></ITEM>
41 </ZP\_SET>
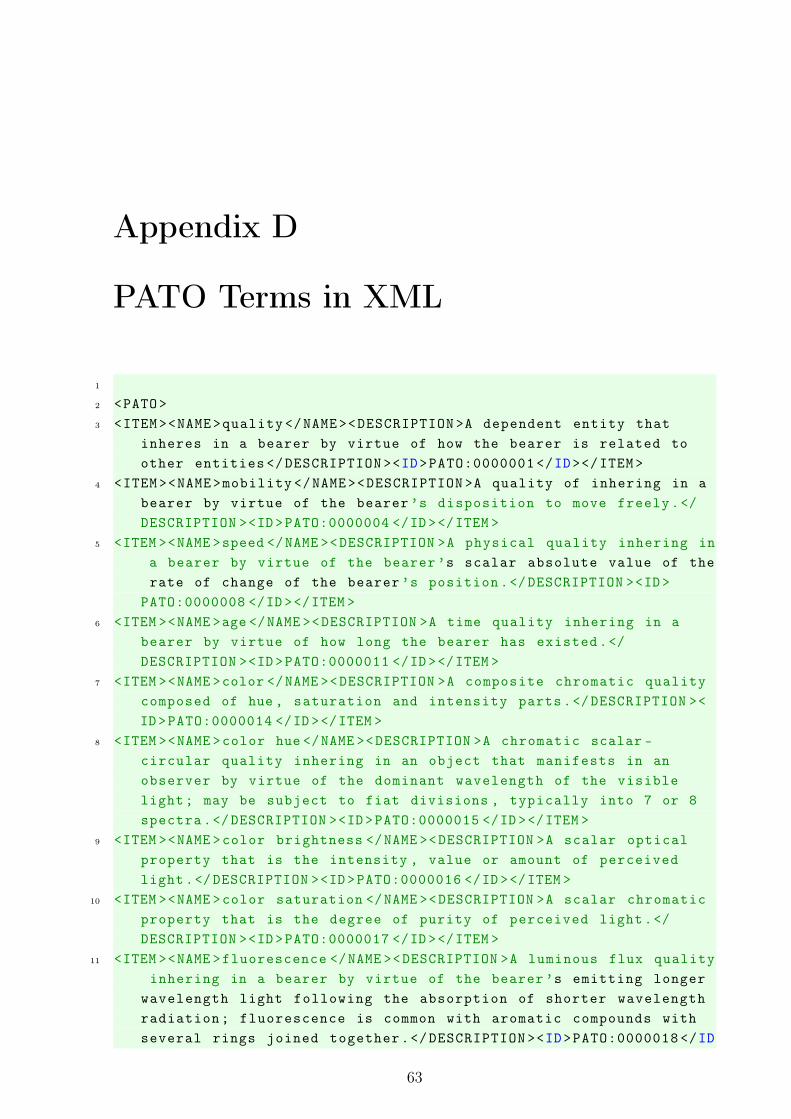
Appendix D
PATO Terms in XML
1
2 <PATO>3 <ITEM><NAME>quality </NAME><DESCRIPTION >A dependent entity that
inheres in a bearer by virtue of how the bearer is related toother entities </DESCRIPTION ><ID>PATO:0000001 </ID></ITEM>
4 <ITEM><NAME>mobility </NAME><DESCRIPTION >A quality of inhering in abearer by virtue of the bearer ’s disposition to move freely.</DESCRIPTION ><ID>PATO:0000004 </ID ></ITEM >
5 <ITEM ><NAME >speed </NAME ><DESCRIPTION >A physical quality inhering ina bearer by virtue of the bearer ’s scalar absolute value of therate of change of the bearer ’s position.</DESCRIPTION ><ID>
PATO:0000008 </ID ></ITEM >6 <ITEM ><NAME >age </NAME ><DESCRIPTION >A time quality inhering in a
bearer by virtue of how long the bearer has existed.</DESCRIPTION ><ID>PATO:0000011 </ID ></ITEM >
7 <ITEM ><NAME >color </NAME ><DESCRIPTION >A composite chromatic qualitycomposed of hue , saturation and intensity parts.</DESCRIPTION ><ID>PATO:0000014 </ID ></ITEM >
8 <ITEM ><NAME >color hue </NAME ><DESCRIPTION >A chromatic scalar -circular quality inhering in an object that manifests in anobserver by virtue of the dominant wavelength of the visiblelight; may be subject to fiat divisions , typically into 7 or 8spectra.</DESCRIPTION ><ID>PATO:0000015 </ID ></ITEM >
9 <ITEM ><NAME >color brightness </NAME ><DESCRIPTION >A scalar opticalproperty that is the intensity , value or amount of perceivedlight.</DESCRIPTION ><ID>PATO:0000016 </ID ></ITEM >
10 <ITEM ><NAME >color saturation </NAME ><DESCRIPTION >A scalar chromaticproperty that is the degree of purity of perceived light.</DESCRIPTION ><ID>PATO:0000017 </ID ></ITEM >
11 <ITEM ><NAME >fluorescence </NAME ><DESCRIPTION >A luminous flux qualityinhering in a bearer by virtue of the bearer ’s emitting longer
wavelength light following the absorption of shorter wavelengthradiation; fluorescence is common with aromatic compounds withseveral rings joined together.</DESCRIPTION ><ID>PATO:0000018 </ID
63
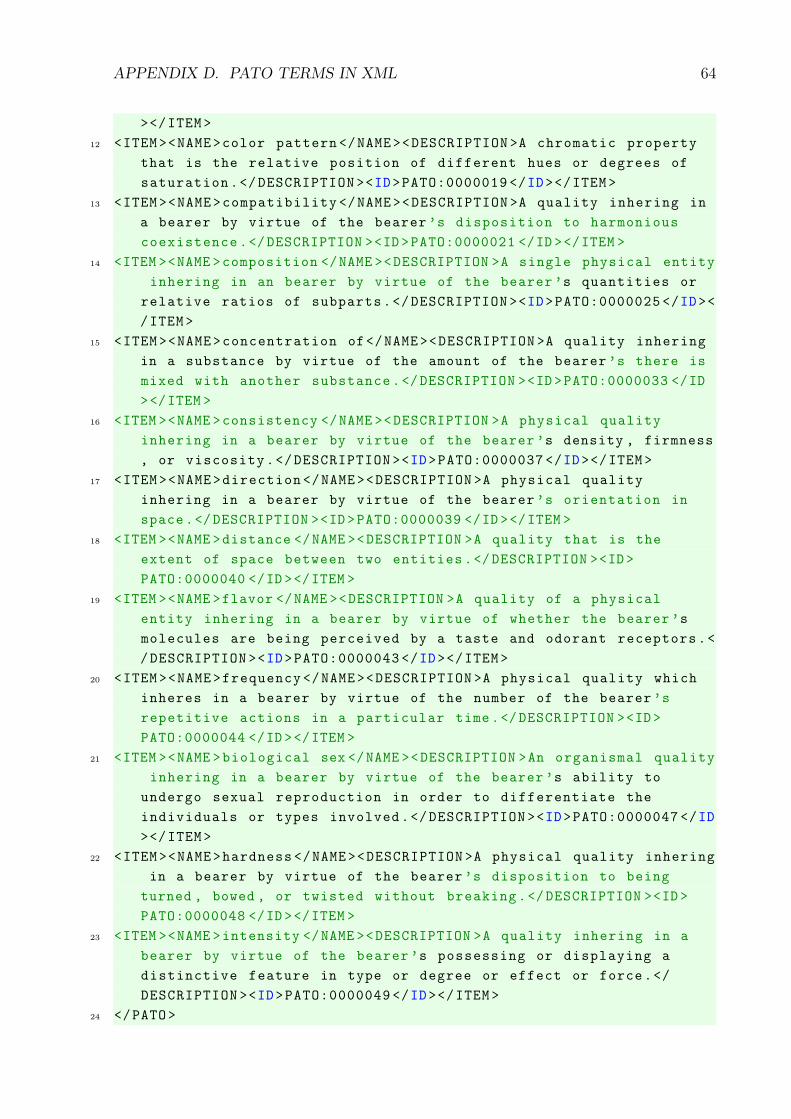
APPENDIX D. PATO TERMS IN XML 64
></ITEM>12 <ITEM><NAME>color pattern </NAME><DESCRIPTION >A chromatic property
that is the relative position of different hues or degrees ofsaturation.</DESCRIPTION ><ID>PATO:0000019 </ID></ITEM>
13 <ITEM><NAME>compatibility </NAME><DESCRIPTION >A quality inhering ina bearer by virtue of the bearer ’s disposition to harmoniouscoexistence .</DESCRIPTION ><ID >PATO:0000021 </ID ></ITEM >
14 <ITEM ><NAME >composition </NAME ><DESCRIPTION >A single physical entityinhering in an bearer by virtue of the bearer ’s quantities or
relative ratios of subparts.</DESCRIPTION ><ID>PATO:0000025 </ID></ITEM>
15 <ITEM><NAME>concentration of</NAME><DESCRIPTION >A quality inheringin a substance by virtue of the amount of the bearer ’s there ismixed with another substance.</DESCRIPTION ><ID>PATO:0000033 </ID></ITEM >
16 <ITEM ><NAME >consistency </NAME ><DESCRIPTION >A physical qualityinhering in a bearer by virtue of the bearer ’s density , firmness, or viscosity.</DESCRIPTION ><ID>PATO:0000037 </ID></ITEM>
17 <ITEM><NAME>direction </NAME><DESCRIPTION >A physical qualityinhering in a bearer by virtue of the bearer ’s orientation inspace.</DESCRIPTION ><ID>PATO:0000039 </ID ></ITEM >
18 <ITEM ><NAME >distance </NAME ><DESCRIPTION >A quality that is theextent of space between two entities.</DESCRIPTION ><ID>PATO:0000040 </ID ></ITEM >
19 <ITEM ><NAME >flavor </NAME ><DESCRIPTION >A quality of a physicalentity inhering in a bearer by virtue of whether the bearer ’smolecules are being perceived by a taste and odorant receptors.</DESCRIPTION ><ID>PATO:0000043 </ID></ITEM>
20 <ITEM><NAME>frequency </NAME><DESCRIPTION >A physical quality whichinheres in a bearer by virtue of the number of the bearer ’srepetitive actions in a particular time.</DESCRIPTION ><ID>PATO:0000044 </ID ></ITEM >
21 <ITEM ><NAME >biological sex </NAME ><DESCRIPTION >An organismal qualityinhering in a bearer by virtue of the bearer ’s ability to
undergo sexual reproduction in order to differentiate theindividuals or types involved.</DESCRIPTION ><ID>PATO:0000047 </ID></ITEM>
22 <ITEM><NAME>hardness </NAME><DESCRIPTION >A physical quality inheringin a bearer by virtue of the bearer ’s disposition to being
turned , bowed , or twisted without breaking.</DESCRIPTION ><ID>PATO:0000048 </ID ></ITEM >
23 <ITEM ><NAME >intensity </NAME ><DESCRIPTION >A quality inhering in abearer by virtue of the bearer ’s possessing or displaying adistinctive feature in type or degree or effect or force.</DESCRIPTION ><ID>PATO:0000049 </ID></ITEM>
24 </PATO>
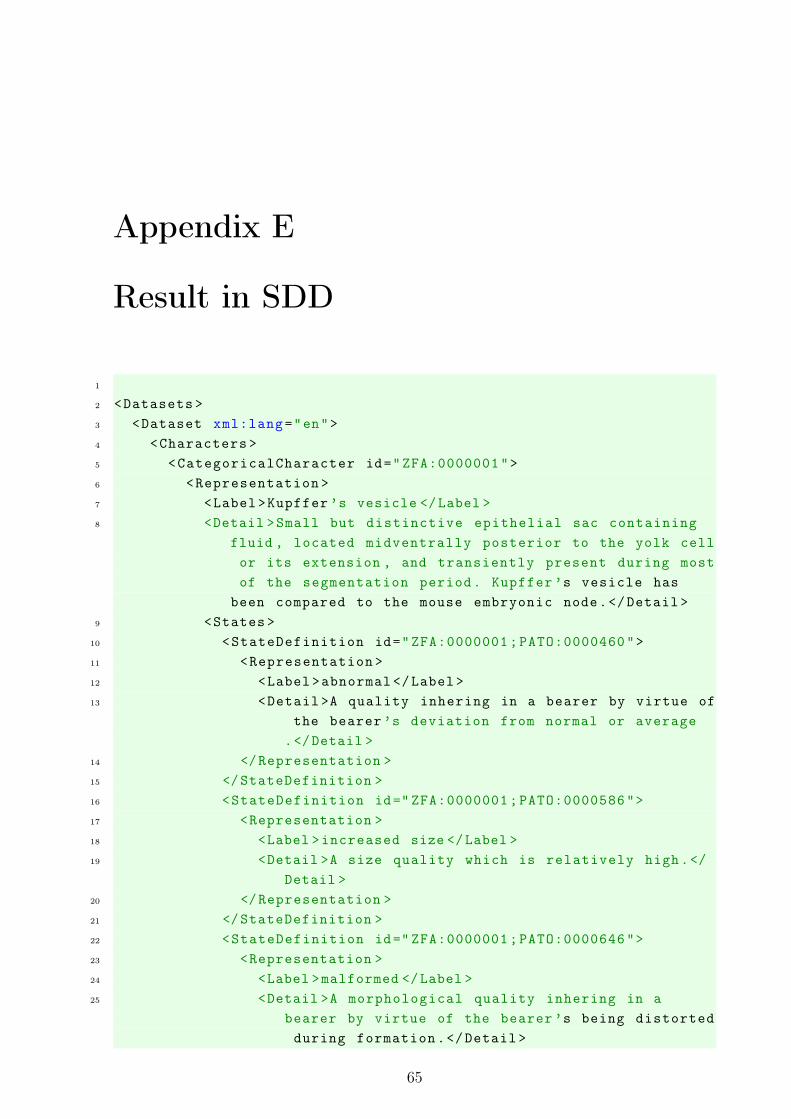
Appendix E
Result in SDD
1
2 <Datasets >3 <Dataset xml:lang="en">4 <Characters >5 <CategoricalCharacter id="ZFA:0000001">6 <Representation >7 <Label>Kupffer ’s vesicle </Label >8 <Detail >Small but distinctive epithelial sac containing
fluid , located midventrally posterior to the yolk cellor its extension , and transiently present during mostof the segmentation period. Kupffer ’s vesicle has
been compared to the mouse embryonic node.</Detail >9 <States >
10 <StateDefinition id="ZFA:0000001;PATO:0000460">11 <Representation >12 <Label>abnormal </Label>13 <Detail >A quality inhering in a bearer by virtue of
the bearer ’s deviation from normal or average.</Detail >
14 </Representation >15 </StateDefinition >16 <StateDefinition id=" ZFA:0000001;PATO:0000586">17 <Representation >18 <Label >increased size </Label >19 <Detail >A size quality which is relatively high.</
Detail >20 </Representation >21 </StateDefinition >22 <StateDefinition id=" ZFA:0000001;PATO:0000646">23 <Representation >24 <Label >malformed </Label >25 <Detail >A morphological quality inhering in a
bearer by virtue of the bearer ’s being distortedduring formation.</Detail >
65
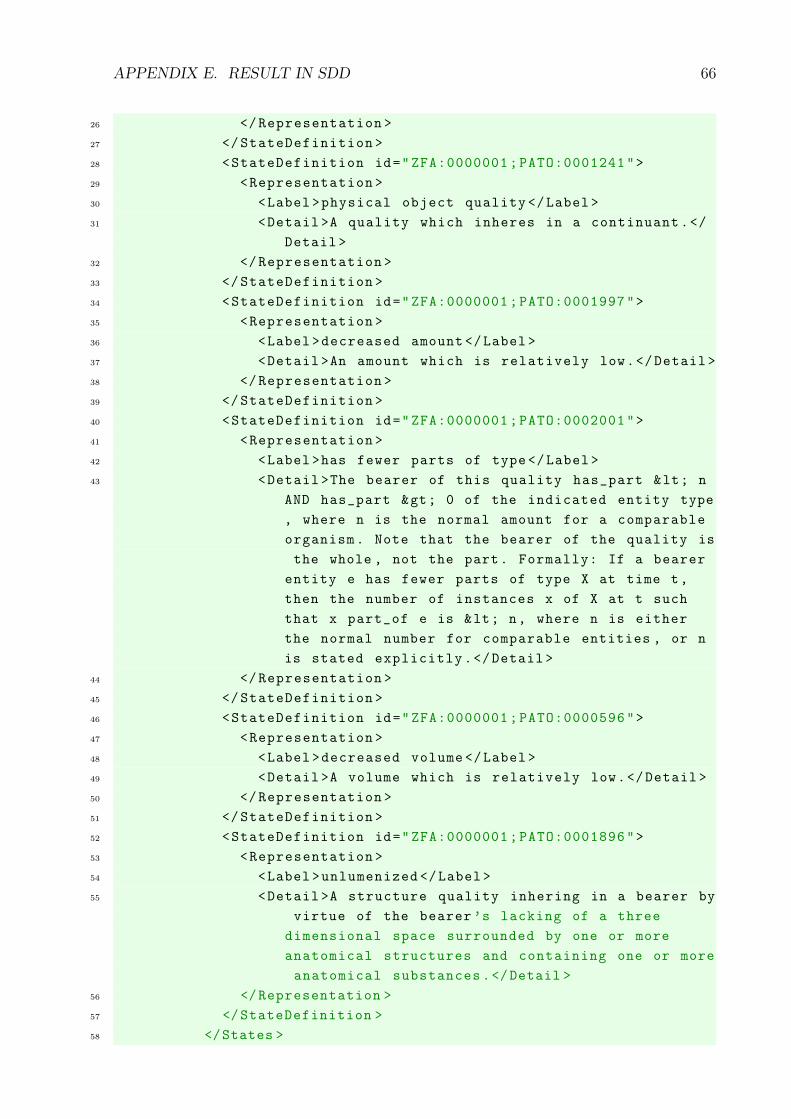
APPENDIX E. RESULT IN SDD 66
26 </Representation >27 </StateDefinition >28 <StateDefinition id="ZFA:0000001;PATO:0001241">29 <Representation >30 <Label>physical object quality </Label>31 <Detail >A quality which inheres in a continuant.</
Detail >32 </Representation >33 </StateDefinition >34 <StateDefinition id="ZFA:0000001;PATO:0001997">35 <Representation >36 <Label>decreased amount </Label>37 <Detail >An amount which is relatively low.</Detail >38 </Representation >39 </StateDefinition >40 <StateDefinition id="ZFA:0000001;PATO:0002001">41 <Representation >42 <Label>has fewer parts of type</Label>43 <Detail >The bearer of this quality has_part < n
AND has_part > 0 of the indicated entity type, where n is the normal amount for a comparableorganism. Note that the bearer of the quality isthe whole , not the part. Formally: If a bearer
entity e has fewer parts of type X at time t,then the number of instances x of X at t suchthat x part_of e is < n, where n is eitherthe normal number for comparable entities , or nis stated explicitly.</Detail >
44 </Representation >45 </StateDefinition >46 <StateDefinition id="ZFA:0000001;PATO:0000596">47 <Representation >48 <Label>decreased volume </Label>49 <Detail >A volume which is relatively low.</Detail >50 </Representation >51 </StateDefinition >52 <StateDefinition id="ZFA:0000001;PATO:0001896">53 <Representation >54 <Label>unlumenized </Label>55 <Detail >A structure quality inhering in a bearer by
virtue of the bearer ’s lacking of a threedimensional space surrounded by one or moreanatomical structures and containing one or moreanatomical substances .</Detail >
56 </Representation >57 </StateDefinition >58 </States >
APPENDIX E. RESULT IN SDD 67
59 </Representation >60 </CategoricalCharacter >61 </Characters >62 </Dataset >63 </Datasets >