Embed Size (px)
Citation preview
LubbockCity of
City of Lubbock, Texas Comprehensive Annual Financial Report
For the Fiscal Year EndedSeptember 30, 2017
i
Comprehensive Annual Financial Report List of Elected and Appointed Officials
For the Fiscal Year Ended September 30, 2017
City Council
Daniel M. Pope Mayor
Latrelle Joy Mayor Pro Tem - District 6
Juan Chadis Council Member - District 1
Shelia Patterson Harris Council Member - District 2
Jeff Griffith Council Member – District 3
Steve Massengale Council Member – District 4
Karen Gibson Council Member – District 5
Appointed Officials
W. Jarrett Atkinson City Manager
Chad Weaver City Attorney
Rebecca Garza City Secretary
Finance Staff
D. Blu Kostelich Chief Financial Officer
Linda Cuellar, CPA Director of Accounting
Cheryl Brock Executive Director of Budget
Brack Bullock Accounting Supervisor
Veronica Valderaz Accounting Supervisor
Deborah Hansard Senior Accountant
Amber Aguilar Senior Accountant
Amber Painter, CPA Senior Accountant
Meg Beverly Senior Accountant
Andy Burcham Assistant Director, LP&L
Chad Sales Financial Planning & Analysis Manager, LP&L
ii
City of Lubbock, Texas
Comprehensive Annual Financial Report
Year Ended September 30, 2017
TABLE OF CONTENTS
Page
List of Elected and Appointed Officials .................................................................. i
Table of Contents .................................................................................................... ii
INTRODUCTORY SECTION Letter of Transmittal ...............................................................................................1
Certificate of Achievement in Financial Reporting ...............................................16
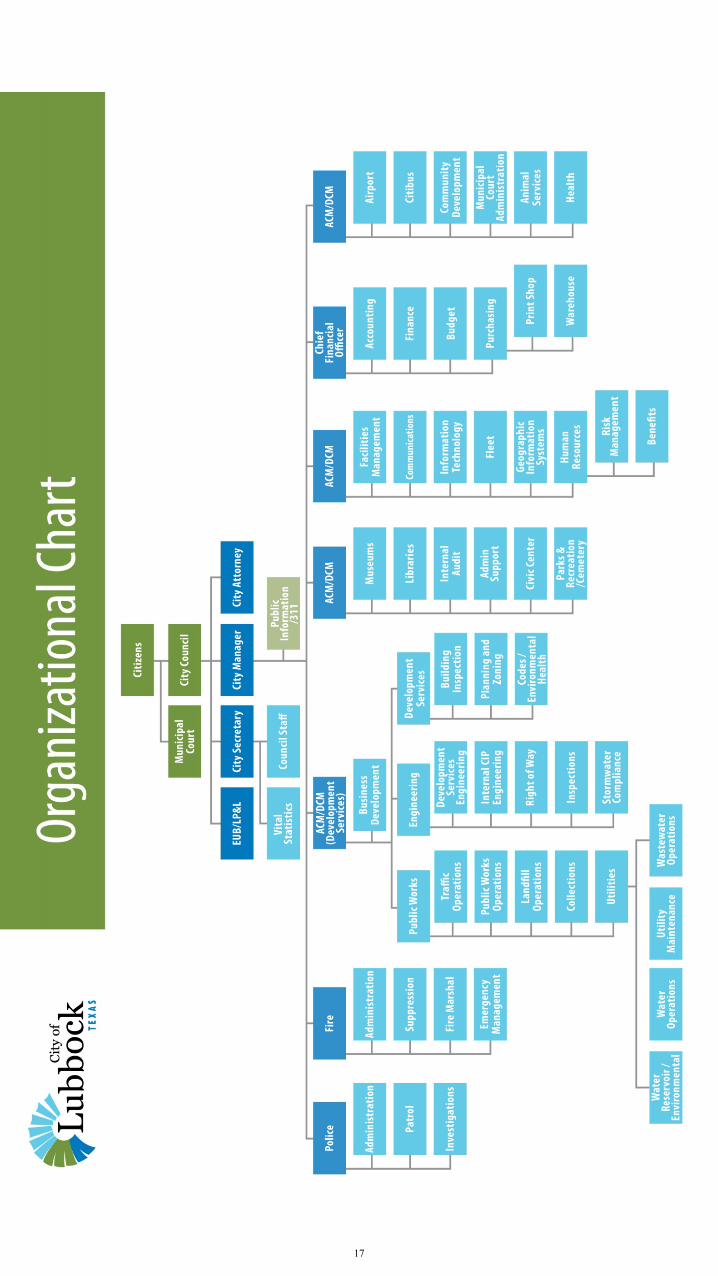
Organizational Chart .............................................................................................17
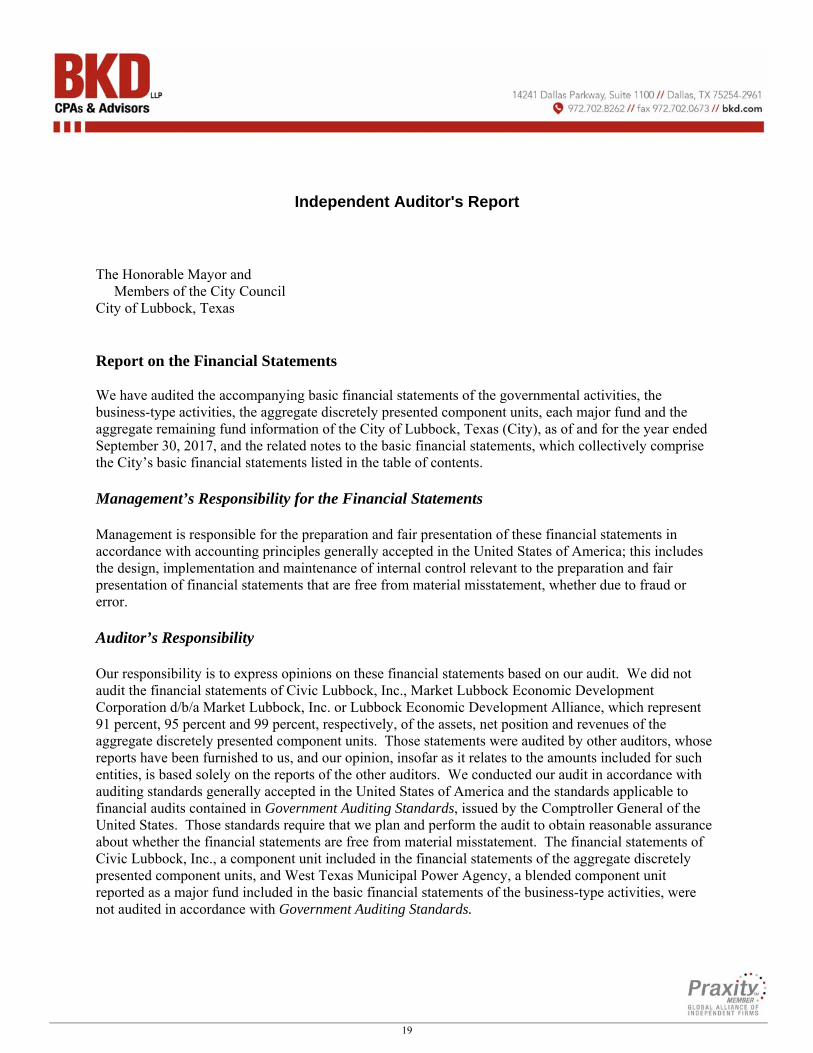
FINANCIAL SECTION Independent Auditor’s Report ................................................................................19
Management’s Discussion and Analysis ..............................................................23
Basic Financial Statements:
Government-wide Financial Statements:
Statement of Net Position ...............................................................................41
Statement of Activities ....................................................................................42
Fund Financial Statements:
Governmental Fund Financial Statements
Balance Sheet – Governmental Funds .............................................................44
Reconciliation of the Balance Sheet of Governmental Funds
to the Statement of Net Position ...................................................................45
Statement of Revenues, Expenditures, and Changes in
Fund Balances - Governmental Funds ..........................................................46
Reconciliation of the Statement of Revenues, Expenditures
and Changes in Fund Balances of Governmental Funds to the
Statement of Activities ..................................................................................47
Proprietary Fund Financial Statements
Statement of Net Position – Proprietary Funds................................................48
Reconciliation of the Statement of Net Position - Proprietary Funds to
the Statement of Net Position .......................................................................53
Statement of Revenues, Expenses and Changes in Fund Net Position -
Proprietary Funds ..........................................................................................54
Reconciliation of the Statement of Revenues, Expenses and Changes
in Fund Net Position - Proprietary Funds to the Statement
of Activities ...................................................................................................57
Statement of Cash Flows - Proprietary Funds .................................................58
Notes to Basic Financial Statements ......................................................................60 Required Supplementary Information:
Schedule of Changes in Net Pension Liability and Related Ratios – TMRS .........109
Schedule of Contributions – TMRS ........................................................................110
Schedule of Changes in Net Pension Liability and Related Ratios – Lubbock Fire
Pension Fund ........................................................................................................111
Schedule of Contributions – Lubbock Fire Pension Fund ......................................112
Schedule of Funding Progress ................................................................................113
General Fund Mandatory Budgetary Comparison Schedule ..................................114
iii
Combining Fund Statements and Schedules:
Nonmajor Governmental Funds
Combining Balance Sheet – Nonmajor Governmental Funds .......................120
Combining Statement of Revenues, Expenditures and Changes in Fund
Balances – Nonmajor Governmental Funds ...............................................126
Budgetary Comparison Schedule – Special Revenue Funds and
Debt Service Fund.......................................................................................132
Nonmajor Enterprise Funds
Combining Statement of Net Position – Nonmajor Enterprise Funds ...........136
Combining Statement of Revenues, Expenses and Changes in Fund Net
Position – Nonmajor Enterprise Funds ..........................................................140
Combining Statement of Cash Flows – Nonmajor Enterprise Funds ............142
Internal Service Funds Combining Statement of Net Position – Internal Service Funds ...................146
Combining Statement of Revenues, Expenses and
Changes in Fund Net Position – Internal Service Funds ............................150
Combining Statement of Cash Flows – Internal Service Funds ....................152
Nonmajor Component Units
Combining Statement of Net Position – Nonmajor Component Units ..........156
Combining Statement of Activities – Nonmajor Component Units ..............158
Discretely Presented Component Units
Statement of Net Position – Urban Renewal Agency. ...................................160
Statement of Revenues, Expenses and Changes in Fund
Net Position – Urban Renewal Agency .....................................................161
Statement of Cash Flows – Urban Renewal Agency……………………….162
Statement of Net Position – Vintage Township Public Facilities Corp. ........163
Statement of Revenues, Expenses and Changes in Fund
Net Position – Vintage Township Public Facilities Corp ..........................164
Statement of Cash Flows – Vintage Township Public Facilities Corp……...165
STATISTICAL SECTION (unaudited)
Table A: Net Position by Component ............................................................168
Table B: Changes in Net Position ..................................................................169
Table C: Fund Balance of Governmental Funds........................................... 171
Table D: Changes in Fund Balances of Governmental Funds .......................172
Table E: Tax Revenues by Source .................................................................173
Table F: Assessed and Estimated Actual Value of Taxable Property ...........174
Table G: Principal Taxpayers ........................................................................175
Table H: Property Tax Levies and Collections ..............................................176
Table I: Property Tax Rates – Direct and Overlapping Governments ..........177
Table J: Ratio of Outstanding Debt by Type ................................................178
Table K: Ratio of Net General Bonded Debt to Assessed Value and
Net Bonded Debt per Capita ....................................................................179
Table L: Computation of Legal Debt Margin ................................................180
Table M: Revenue Bond Coverage – LP&L and Water Bonds .....................181
Table N: Ratio of Annual Debt Service Expenditures for General
Obligation Bonded Debt to Total General Governmental
Expenditures ............................................................................................182
Table O: Computation of Direct and Overlapping Bonded Debt –
General Obligation Bonds in Governmental Activities ..........................183
iv
Table P: Demographic Statistics ....................................................................184
Table Q: Principal Employers ........................................................................185
Table R: Full-time Equivalents City Government Employees by Function ..186
Table S: Operating Indicators by Function/Program .....................................187
Table T: Capital Assets Statistics by Function/Program ...............................188
COMPLIANCE REPORTS
Schedule of Expenditures of Federal Awards .....................................................189
Independent Auditor’s Report on Internal Control Over Financial
Reporting and on Compliance and Other Matters Based on an Audit
of the Financial Statements Performed in Accordance with
Government Auditing Standards ...................................................................193
Report on Compliance for Each Major Federal Program and Report on
Internal Control Over Compliance - Independent Auditor’s Report ............195
Schedule of Findings and Questioned Costs .......................................................197
Summary Schedule of Prior Audit Findings .......................................................200

Introductory Section
P.O. Box • 1625 13th Street • Lubbock, Texas 79457
(806) 775-0000 • Fax (806) 775-0001
February 7, 2018
Honorable Mayor, City Council, and Citizens of Lubbock, Texas:
We are pleased to submit the Comprehensive Annual Financial Report (CAFR) of the City of Lubbock,
Texas (City) for the fiscal year ended September 30, 2017. The purpose of the CAFR is to provide accurate
and meaningful information concerning the City’s financial condition and performance. In addition,
independent auditors have verified that the City has fairly presented its financial position, in all material
respects, in accordance with accounting principles generally accepted in the United States of America.
The CAFR satisfies Section 103.001 of the Texas Local Government Code requiring annual audits of all
municipalities. Responsibility for both the accuracy of the data and the completeness and fairness of the
presentation, including all disclosures, rests with the City. We believe the data is accurate in all material
respects and is presented in a manner that fairly sets forth the financial position and results of the City. We
also believe all disclosures necessary to enable the reader to gain an understanding of the City’s financial
affairs are included. To provide a reasonable basis for making these representations, City management has
an established comprehensive internal control framework that is designed: 1) to protect the City's assets
from loss, theft, or misuse; and 2) to compile sufficient, reliable information for the preparation of the City’s
financial statements, in conformity with Generally Accepted Accounting Principles (GAAP). Because the
cost of internal controls should not outweigh their benefits, the City's comprehensive framework of internal
controls is designed to provide reasonable, rather than absolute, assurance that the financial statements are
free from material misstatement.
The City's financial statements were audited by BKD, LLP, a licensed certified public accountants’ firm.
The goal of the independent audit is to provide reasonable assurance that the financial statements are free
of material misstatement. The independent audit involves:
examining evidence on a test basis that supports the amounts and disclosures in the financial
statements,
assessing the accounting principles used and significant estimates made by management, and
evaluating the overall financial statement presentation.
1
Honorable Mayor, City Council,
And Citizens of the City of Lubbock, Texas
February 7, 2018
The independent accountants concluded that the City’s financial statements are in conformity with GAAP,
are fairly presented, and there is a reasonable basis for providing an unmodified opinion. The independent
auditor’s report is presented as the first component of the financial section of this report.
The independent accountants’ audit of the City’s financial statements is part of a broader, federally
mandated "Single Audit," which is designed to meet the special needs of federal granting agencies. These
reports are available in the City’s CAFR. The standards governing Single Audit engagements require the
independent auditor to report on several facets of the City’s financial processes and controls:
fair presentation of the financial statements,
internal controls over financial reporting and the administration of federal awards, and
compliance with legal and grant requirements.
GAAP requires management to provide a narrative introduction, overview, and analysis to accompany the
basic financial statements in the form of a Management Discussion and Analysis (MD&A). This letter of
transmittal is designed to complement the MD&A. The City's MD&A is found immediately following the
report of the independent auditors.
CITY OVERVIEW
Description of the City
The City is a political subdivision and municipal corporation of the State, duly organized and existing under
the laws of the State, including the City’s Home Rule Charter. The City was incorporated in 1909 and first
adopted its Home Rule Charter in 1917. The City operates under a Council/Manager form of government
with a City Council comprised of the Mayor and six Council members. The Mayor is elected at-large for
a two-year term ending in an even-numbered year. Each of the six members of the City Council is elected
from a single-member district for a four-year term of office. City Council elections are held every two
years, with elections for Council members in Districts 1, 3, and 5 being staggered with elections for Council
members in Districts 2, 4, and 6. The City Manager is the chief administrative officer of the City.
The City is empowered to levy a property tax on both real and personal properties located within its
boundaries. It is also empowered by state statute to extend its corporate limits by annexation, which occurs
periodically as the City Council deems appropriate. The 2010 Census population for the City was 229,573;
the estimated 2017 population is 254,565. The City covers approximately 129 square miles.1 The
organizational chart of the City is shown following the transmittal letter.
In accordance with generally accepted accounting principles and Codification of Governmental Accounting
Standards, Section 2100, “Defining the Financial Reporting Entity,” these financial statements present the
City (the primary government) and its component units. The component units discussed below are included
in the City’s financial reporting entity because of the significance of their operational or financial
relationship with the City. The criteria established by the GASB for determining the reporting entity
includes financial accountability and whether the financial statements would be misleading if data were not
included. West Texas Municipal Power Agency (WTMPA) and the Lubbock Metropolitan Planning
Organization are blended component units. Discretely presented component units include Urban Renewal
Agency (URA), Civic Lubbock, Inc., Market Lubbock Economic Development Corporation, dba Market
Lubbock, Inc., Lubbock Economic Development Alliance, and the Vintage Township Public Facilities
Corporation. Additional information on the component units is found in the footnotes.
1 City of Lubbock GIS Department.
2
Honorable Mayor, City Council,
And Citizens of the City of Lubbock, Texas
February 7, 2018
City Services
The City provides a full range of services including public safety (police and fire services), electric, water,
wastewater, storm water, solid waste, public transportation (airport and transit), health and social services,
cultural and recreation, highways and streets, planning and zoning, and general administrative services.
Public Safety: The Police Department serves and protects the public by conducting criminal investigations
and enforcing laws governing public safety and order. As part of an effort to reach the goal of two officers
for every 1,000 residents, the Police Department hired 84 new police recruits in FY 2017. As of September
30, 2017, the Police Department was staffed with 411 sworn officers plus an additional 25 Police Academy
Recruits. In FY 2017, the Police Department had 341,211 responses to primary and backup dispatched calls
for service with an average response time to Priority 1 calls of 4.59 minutes.
The Lubbock Fire Department is dedicated to providing unparalleled emergency response and life safety
services for the City. As of September 30, 2017, the Fire Department operated 19 fire stations and was
staffed with 404 sworn firefighters. The construction of Fire Station 1 began in August 2015 and was
completed December 2016. The construction of a new Emergency Operations Center began in December
2016 and is expected to be completed in early 2018. Improvements continue for fire stations citywide as a
result of funding for renovations appropriated in the FY 2016 budget. We will continue to improve and
renovate our facilities with $300,000 allocated for FY 2018. In FY 2017, the Fire Department responded to
18,307 calls, or an average of 50 calls per day.
Electric Utility: The City’s municipally owned electric utility system, known as Lubbock Power and Light
(LP&L), was established in 1916, and is at present the largest municipal system in the West Texas region
and the third largest municipal system in the State of Texas. Electric service in the City is provided by
LP&L, South Plains Electric Cooperative, and Southwestern Public Service (SPS). LP&L owns and
maintains 105,788 meters as of September 30, 2017, 37 substations, 4,322 total miles of primary and
secondary distribution lines, and approximately 105 miles of transmission lines. The average daily electric
consumption is roughly 7.309 MWh.
On November 2, 2004, Lubbock voters elected to amend the City Charter to provide for an Electric Utility
Board (EUB), which governs, manages, and operates LP&L today. The City Council retains authority for
appointment of board members, approval of the operating and capital budget, approval of rates for electric
service, eminent domain, and approval of debt financing.
A Transaction Agreement for Total Requirements Power Service (SPS Power Agreement) between the
West Texas Municipal Power Agency (WTMPA) and SPS provides that SPS serve the entire capacity and
energy requirements of WTMPA members (of which LP&L is a member). The term of the agreement is
through the hour ending at midnight on May 31, 2019, unless cancelled earlier. After the termination of
the SPS Power Agreement, capacity and energy supply will be provided by a 170MW partial requirements
contract with SPS, effective June 1, 2019 through May 31, 2044; a 400MW Capacity and Energy
Scheduling Contract with SPS, effective June 1, 2019 through May 31, 2021; a 100.8MW power purchase
agreement between WTMPA and Elk City II Wind, LLC, effective June 1, 2019 through May 31, 2032;
and 112 MW of dependable natural gas fired generation, with approximately 112MW anticipated to be
available in 2019 to meet LP&L’s load requirements.
On September 24, 2015 LP&L announced it’s the intent to join the Electric Reliability Council of Texas
(ERCOT). Shortly after the announcement, LP&L initiated the process to formally join the Texas intrastate
electric grid, and in February 2016 the PUC established Project No. 45633, Project to Identify Issues to
Lubbock Power & Light’s Proposal to become part of the Electric Reliability Council of Texas (the
“Project”). In March 2016, LP&L submitted a transmission integration study into the Project at the request
3
Honorable Mayor, City Council,
And Citizens of the City of Lubbock, Texas
February 7, 2018
of the PUC, and ERCOT submitted its transmission integration study into the Project in June 2016. LP&L’s
transmission integration study was conducted by expert engineering consultants who worked in close
coordination with LP&L staff. At the June 2016 PUC Open Meeting, the PUC identified the need for joint
cost-benefit studies by SPP and ERCOT followed by a public interest determination docket and a Certificate
of Convenience and Necessity (“CCN”) case. In addition to the cost-benefit studies conducted by SPP and
ERCOT, LP&L performed its own cost-benefit analysis, looking closely at every technical component of
the future transition. On June 30, 2017 and July 7, 2017 ERCOT and SPP respectively filed their studies
with the PUC and on September 1, 2017 LP&L filed its study and submitted its formal application to join
ERCOT.
The filing of Lubbock’s application with the Public Utility Council followed two years of extensive studies
and research conducted by multiple stakeholders, including LP&L, to determine how Lubbock’s entry to
the ERCOT would affect ERCOT, SPP and Lubbock ratepayers. LP&L requested the initiation of the
formal PUC hearing on the merits to determine if LP&L’s transition to ERCOT is in the public interest.
The PUC established Project No. 47576, Application of the City of Lubbock through LP&L for Authority
to Connect a Portion of its System with the ERCOT, and developed a procedural schedule that LP&L
believes will allow sufficient time for the contested case to be conducted and to receive a decision by the
PUC in the first quarter of 2018.
Once the PUC has approved LP&L’s interconnection with ERCOT, additional infrastructure needs to be
constructed to connect the LP&L system to the ERCOT power grid. A CCN case is expected to be initiated
shortly after receiving PUC approval in the public interest docket, if received.
Capital projects currently included in LP&L’s existing long-term capital improvement plan are largely
related to reliability and will cover a portion of system improvements necessary prior to a final transition.
Additional areas of construction needed, such as new transmission lines and substations, will be studied
and decided upon as part of the CCN case to take place through the PUC. The load proposed to interconnect
with ERCOT excludes all load related to the partial requirements agreement with SPS and the load related
to the WTMPA Elk City wind agreement. The SPS and Elk City loads will continue being served in SPP.
LP&L intends to honor the terms of the partial requirements contract by receiving power and energy from
SPS on the distribution system connected to SPS’s transmission system. This portion of LP&L load will
remain in SPP during the term of the agreement and is not included in the load interconnected to ERCOT.
West Texas Municipal Power Agency: In 1983, the cities of Lubbock, Brownfield, Floydada, and Tulia
(Cities), created the West Texas Municipal Power Agency (WTMPA) as a joint power agency. WTMPA
is a municipal power agency created to enhance the negotiating strength of the Cities in obtaining favorable
electric power contracts and in coordinating joint planning for additional generation. WTMPA is governed
by an eight-member Board of Directors. The board consists of two directors from each of the Cities;
however, an affirmative vote of the “majority in interest” is required to approve the operating budget,
capital projects, debt issuance, and any amendments to WTMPA rules and regulations. One member is
elected as the president who presides over monthly meetings. Directors serve without compensation.
WTMPA has no employees and instead contracts for services to meet its general operating needs. WTMPA
may engage in the business of generation, transmission, sale, and exchange of electric energy to the Cities.
WTMPA may also participate in power exchange of electric energy to the Cities. WTMPA may also
participate in power pooling and power exchange agreements with other entities. The City of Lubbock
maintains the “majority in interest” vote based on kilowatt purchases and consequently has majority voting
control. As the City purchases approximately 95.4 percent of the electricity brokered, WTMPA provides
services almost exclusively to the City and is therefore presented as a blended enterprise fund. Separate
audited financial statements are available through the City.
4
Honorable Mayor, City Council,
And Citizens of the City of Lubbock, Texas
February 7, 2018
Water Utility: The City’s current Strategic Water Supply Plan was adopted by the City Council in February
2013. The Plan includes an emphasis on water conservation strategies and includes strategies for supplying
Lubbock for the next 100-years. The City also works closely with the Region O Water Planning Group in
contributing to the preparation of a portion of the State Water Plan, which includes the City’s water supply
needs and alternatives.
The City used a total of 12.02 billion gallons of water in FY 2017. The City’s 5-year average per capita
consumption for FY 2017 was 156 gallons per capita per day (gpcd). The peak capacity of the City’s water
supply and treatment was 80 million gallons per day, with an average utilization of 32.4 million gallons per
day.
The City receives its water from four different sources: Roberts County Well Field, Lake Meredith, Bailey
County Well Field, and Lake Alan Henry. The Roberts County Well Field and Lake Meredith are owned
by the Canadian River Municipal Water Authority (CRMWA). Lubbock is one of CRMWA’s eleven
member cities. The Bailey County Well Field and Lake Alan Henry are owned by the City.
The City obtained 7.75 billion gallons of its annual water supply from CRMWA in FY 2017. At the
beginning of FY 2012, Lake Meredith reached its lowest historical level and was no longer usable. Lake
Meredith water levels began rising again about four years ago. It is now at 40.5% of its capacity. For the
past two fiscal years, CRMWA used water from Lake Meredith. Currently, CRMWA is blending
groundwater from the Ogallala Aquifer in Roberts County with some surface water from Lake Meredith to
help meet the needs of member cities. CRMWA owns 407,566 acres of ground water rights with an
estimated 22 million acre-feet of water within those rights. CRMWA can deliver up to 65,000 acre-feet of
water to its member cities each year from the Roberts County Well Field. They supply additional water
from Lake Meredith throughout the year to increase peak capacity by 10 million gallons per day. The
aqueduct supplying water to the southern cities cannot be filled with the existing well field infrastructure
and water supplied from Lake Meredith. Therefore, CRMWA is securing easements for a new pipeline
route to construct a second transmission line (CRMWA II) from the well field to the aqueduct. This allows
for the full utilization of the aqueduct to the southern cities. CRMWA II’s estimated completion is sometime
after 2020 when all of the member cities need the additional water.
Bailey County Well Field contains 175 active water wells with 83,305 acres of water rights, providing 1.89
billion gallons of the City’s annual water supply in FY 2017. In October 2011, the City completed the
construction of eight additional wells to maintain the well field production rates. The City is planning to
add additional wells to the Bailey County Well Field to restore a portion of the well field production
capacity.
The City finished construction on Lake Alan Henry in 1993. In 2010, the City began construction on Phase
I of the Lake Alan Henry project that included two new pump stations, a 51-mile raw water pipeline from
the Lake to the City, a new South Water Treatment Plant with membrane technology, and 19 miles of
treated water transmission lines. Phase I of the Lake Alan Henry project was completed in August 2012
and is capable of providing 15 million gallons of water per day to the City. Lake Alan Henry supplied 2.37
billion gallons of the City’s annual water supply in FY 2017. The lake is currently at greater than 87% of
its capacity. The South Water Treatment Plant includes a 225 million gallon terminal storage reservoir and
a high service pump station to transfer the treated water into the City's distribution system.
The City provides water service to over 82,761 meters through 1,727 miles of distribution lines as of
January 1, 2017. The City also provides treated wholesale water to Shallowater, Ransom Canyon, Buffalo
Springs Lake, Reese Redevelopment Authority, Lubbock Cooper ISD, and Roosevelt ISD.
Wastewater Utility: Wastewater collection and treatment is provided within the city limits to residential,
commercial, and industrial customers. As of December 31, 2016, the collection system consisted of
5
Honorable Mayor, City Council,
And Citizens of the City of Lubbock, Texas
February 7, 2018
approximately 1,152 miles of sanitary sewer lines and 34 lift stations. The wastewater treatment plant has
a permitted capacity of 31.5 million gallons per day and an average utilization of approximately 19 million
gallons per day. The peak utilization of the wastewater treatment plant is 25 million gallons per day. The
treated wastewater is disposed of or reused in various ways. In 2017, approximately 52 percent of the
wastewater was used to irrigate crops at the Lubbock Land Application Site and at the Hancock Land
Application Site. In addition, Xcel Energy used approximately 7 percent of the treated wastewater and 41
percent was discharged into the North Fork of the Double Mountain Fork of the Brazos River. Dewatered
solids generated during the wastewater treatment process are hauled and disposed of at the City’s regional
solid waste landfill in Abernathy, Texas.
As part of the City’s Strategic Water Supply Plan, projects are underway to improve the quality of the
treated wastewater so it can be reused in beneficial ways. The City completed Phase I, Phase II, and the
Digester Upgrade of Phase III of a four-phase project to upgrade the Southeast Water Reclamation Plant.
Phase I provided upgrades and improvements to the influent lift station. Phase II incorporated upgrades to
Plant 3 for filtration and ultraviolet disinfection, and Plant 4 for biological nutrient removal, filtration, and
ultraviolet disinfection. Phase III included design and construction improvements to anaerobic digesters
and the solids handling facility. The upgrades to digesters No. 8 and No. 9 were completed in May 2013
and included new covers, mixing system, heating system, and gas piping. Construction began in May 2014,
on the upgrades to the solids handling facility and will be complete in January 2018. The upgrades
implement new sludge thickening and dewatering equipment, sludge holding tank upgrades, odor control
for the solids handling facility a headworks influent lift station, and sludge loading facilities. Phase IV
includes upgrades to Plant 3 for biological removal. Design for rehabilitation of Plant 3 clarifiers and
improved aeration capabilities is expected to begin in 2018. These efforts will improve the quality of the
City’s effluent discharge and prepare it for future reuse opportunities. The high quality effluent can be
discharged into the North Fork.
The 2008 Wastewater Master Plan recommended several improvements to the collection system in order
to meet population growth as well as aging infrastructure replacement needs. The South Lubbock Sanitary
Sewer System Expansion Phase I and II are complete and Phase III is under design. This project consists
of engineering design and construction of large diameter sanitary sewer interceptors for the expansion of
the existing sanitary sewer system. In addition, the Canyon Lakes Interceptor Rehabilitation project is under
construction and will replace deteriorated line and manholes to improve aging infrastructure. Construction
of the Northwest Water Reclamation Plant began in February 2015 and is expected to be substantially
complete the first quarter of 2018. The new plant will relieve the surcharge of sewer mains serving north
Lubbock. The project will include a new membrane filtration reclamation plant, a new raw wastewater
diversion pipeline and a lift station, a new solids wastewater line, and a new outfall line, with anticipated
completion at the end of 2017. The City is updating the Wastewater Master Plan to evaluate the existing
collection system and provide a new master plan for meeting the City’s expected development and growth.
Storm Water Utility: The City’s storm water run-off is primarily conveyed through the City’s street system
that discharges into 146 playa lakes. The subsurface drainage, via storm sewer pipes with curb inlets and
intake structures, conveys water to two small intermittent streams (Blackwater Draw and Yellowhouse
Draw) which both converge at the upper reaches of the North Fork of the Double Mountain Fork of the
Brazos River.
The City’s municipal separate storm sewer system (MS4) is made up of approximately 1,189 miles of paved
and unpaved streets, 559 linear miles of paved and unpaved alleys, 1,240 storm sewer inlets, 96 miles of
subsurface storm sewer pipe, six detention basins, 146 playa lakes, and one pump station. Maintenance of
all of the storm sewers, including street cleaning, is funded through storm water fees.
Three major projects were the focus for FY 2017: Storm Water Master Plan, Storm Water Management
Plan (SWMP), and Complete Phase 2 Design of Northwest Lubbock Drainage Project. The Storm Water
6
Honorable Mayor, City Council,
And Citizens of the City of Lubbock, Texas
February 7, 2018
Master Plan is a multi-year year project that provides a comprehensive, holistic approach to storm water
management. This project updates the Drainage Criteria Manual (1997) and the Master Drainage Plan
(2010), which are the primary documents that regulate development, guide drainage design, and identify
improvement projects. The Storm Water Management Program implements changes to achieve compliance
with the City’s MS4 Permit Renewal issued by the Texas Commission on Environmental Quality (TCEQ)
in August of 2015. When completed with all phases, the Northwest Lubbock Drainage Project will connect
six playa lakes to a new drainage system to help reduce the risk of flooding in the northwest region of
Lubbock.
Solid Waste Utility: The City provides garbage collection and disposal services to 73,282 residential
customers and 2,747 commercial customers. One of the City's two landfill sites is the Caliche Canyon
Landfill and includes a citizen transfer station. The second site is the West Texas Regional Disposal Facility
located in Abernathy, Texas, which opened in 1999 and is one of the largest permitted areas for a landfill
in the State of Texas. With 1,260 acres, the expected useful life of this landfill is 124 years.
Public Transportation: A key component of Lubbock's transportation system is the Lubbock Preston Smith
International Airport, located seven miles north of the City's central business district on 3,000 acres of land
adjacent to Interstate 27. The Airport is operated as a department of the City, with the guidance of an
advisory board, and includes a 220,000 square foot passenger terminal building. The Airport has two
commercial service runways, 11,500 and 8,000 feet in length. Air traffic control services include a 24-hour
Federal Aviation Administration control tower and a full range of instrument approaches. The Airport is
served by three major passenger airlines and two major cargo airlines. It facilitates over 40 commercial
flights per day. A project to rehabilitate the 11,500 foot runway was completed during FY 2016-17. The
next major initiative is a multi-year project to renovate the terminal building.
Citibus provides public transportation for the City of Lubbock and is managed by McDonald Transit
Associates, Inc. Transit services provided by Citibus include Fixed Route, CitiAccess (paratransit), Evening
(NiteRide), in addition to other special services. There are nine fixed routes that traverse the City. The
Citibus evening service is designed to meet the needs of CitiAccess and fixed route passengers who make
use of public transportation. CitiAccess is a curb-to-curb service for passengers in the community who are
unable to utilize the regular fixed route service. A majority of evening service passengers work at night and
utilize the service for afterhours transportation to and from their jobs. In addition to the above transportation
services, Citibus provides route service to Texas Tech University and surrounding apartment complexes
with 35 buses. Citibus is also the contracted agent for passenger sales and freight shipping/receiving for
Greyhound Lines, Inc., which operates from the Citibus Downtown Transfer Plaza.
Health and Social Services: The City has a housing and community development program implemented
and administered through funding from the federal Community Development Block
Grant (CDBG) Program, HOME Investment Partnership Program (HOME), and Emergency Shelter Grant
(ESG) Program. With these programs, the City completed work on 91 houses in FY 2017 through the use
of CDBG and HOME funds and assisted 1,983 individuals through the ESG Program with emergency
shelter and essential homeless prevention services.
The City also received funding from the Texas Department of Housing and Community Affairs, which
allowed the City to offer additional programs to its citizens. Through these programs in FY 2017, 45
households received assistance in repairing the heating and/or cooling systems in their homes; 812
households received utility assistance; and 21 individuals graduated from the Self-Sufficiency Program.
Cultural and Recreation Activities: The City provides cultural and recreation services through 4 libraries
and 81 parks with 60 playgrounds. Other recreational facilities include 4 swimming pools, 61 tennis
courts, 53 baseball and softball fields, 50 soccer fields, 3 disc golf courses, a cultural arts center, 5
7
Honorable Mayor, City Council,
And Citizens of the City of Lubbock, Texas
February 7, 2018
community centers, and 5 older adult activity centers. To further enhance quality of life and to provide
support to tourism, the City operates the Memorial Civic Center, the City Bank Coliseum and Auditorium,
the Buddy Holly Center, the Wells Fargo Amphitheatre, and the Silent Wings Museum.
The City is financially accountable for a legally separate civic services corporation (Civic Lubbock, Inc.),
which is reported separately within the City's financial statements as a discretely presented component unit.
Additional information on this legally separate entity is found in the notes to the financial statements.
Highways and Streets: The City is responsible for the construction and maintenance of 1,178 miles of
paved streets, 57.4 miles of unpaved streets, and 624 miles of paved and unpaved alleys.
In 2004, the City Council established the Gateway Streets Program. The program, funded with 40 percent
of the franchise fees collected by the City, opens areas of the City for development through thoroughfare
construction. The Gateway Streets Program consists of the Northwest Passage, City thoroughfare streets,
and Texas Department of Transportation (TxDOT) improvements in northwest Lubbock, as well as other
thoroughfare improvements located in southwest Lubbock.
The City thoroughfare streets recently completed include: 98th Street between University Avenue and
Interstate 27 and North University Enhancement Project’s Phase 3 to improve the pedestrian way along
University Avenue from the Marsha Sharp Freeway to Amherst Street.
Other major street improvement projects under construction include the following:
The continuation of the City-wide street maintenance program. The City Street Maintenance
Program has a goal of achieving an average Pavement Condition Rating for the entire city of 80.
The current rating is 71 and the program is funded for FY 2018.
The widening of Erskine Avenue from Quaker/Loop 289 interchange east to Indiana Avenue began
in early 2017. This project will enhance the increased mobility of the Northwest Passage Projects.
The design of 98th Street from Upland Avenue to Milwaukee Avenue began in December 2016.
Construction is anticipated to begin in early 2018 with a completion in late 2018.
The design of Phases 3 and 4 of 34th Street from Slide Avenue to Quaker Avenue and Avenue Q to
Interstate 27 are underway and anticipated to be completed in early 2018.
Annual Budget Process
The annual operating budget serves as the foundation of the City's financial planning and control. All City
departments submit requests for appropriation to the City Manager each year. The City Manager uses these
requests as the starting point for developing the proposed Operating Budget and Capital Program. The City
Manager then presents the proposed Operating Budget and Capital Program to the City Council for review,
as required by City Charter. The City Council is required to hold a public hearing on the proposed Operating
Budget and Capital Program and to adopt it no later than September 30, the close of the City's fiscal year.
The adopted Operating Budget and Capital Program appropriates funding at the departmental level in the
General Fund, at the fund level in the other funds, and at the project level in the Capital Program. For FY
2018, the adopted Operating Budget and Capital Program appropriates funding at the fund level for all
funds and at the project level in the Capital Program.
The General Fund Operating Budget is adopted on a basis other than GAAP, with the main difference being
that related capital outlays are not budgeted. Budgetary control is maintained at the fund level.
8
Honorable Mayor, City Council,
And Citizens of the City of Lubbock, Texas
February 7, 2018
Management may make administrative transfers and increases or decreases between accounts below the
department level without City Council approval. However, any transfer of funds between departments, the
legal level of control, or higher level shall be presented to City Council for approval by ordinance before
such funds can be transferred between departments or expended. For FY 2018, the legal level of control is
at the fund level. Transfers between departments will no longer be presented to City Council. All annual
operating appropriations lapse at the end of the fiscal year. Capital Project and grant appropriations do not
lapse at fiscal year end, but remain in effect until the project or grant is completed and closed.
ECONOMIC CONDITION AND OUTLOOK
The information presented in the financial statements is best understood when it is considered within the
context of the City’s economy. The following information is provided to highlight a broad range of
economic forces that support the City’s operations.
Local Economy Concurrent trends in two broad measures of the Lubbock economy best represent its current and ongoing
health and status: general consumer spending (retail sales), and payroll employment.2 Economic indicators,
including sales tax receipts, construction activity, and unemployment all suggest that Lubbock will continue
to see solid future growth and expansion.
Lubbock has a stable economy with historically consistent and steady growth. Over the past forty years,
Lubbock’s agriculturally-based economy has diversified, which has minimized the effects of business
cycles experienced by individual sectors.
The Southern High Plains District, comprised of 16 counties surrounding Lubbock, is one of the most
productive agricultural areas in the United States. In 2017, 24.2 percent of the nation’s upland cotton crop
and 44.2 percent of the state’s upland cotton crop were planted by farmers in the Southern High Plains
District. The Southern High Plains production was 3,215,000 bales, down 4.3 percent from the 3,360,000
bales in 2016. 3
The City has strong manufacturing, wholesale and retail trade services, health care, education, and
government sectors. Manufacturing includes a diverse group of employers who support approximately
4,700 workers.4 A central location and access to transportation have contributed to Lubbock’s development
as a regional warehousing and distribution center. Lubbock serves as the major retail trade center for a 26-
county retail trade area of more than a half million people.
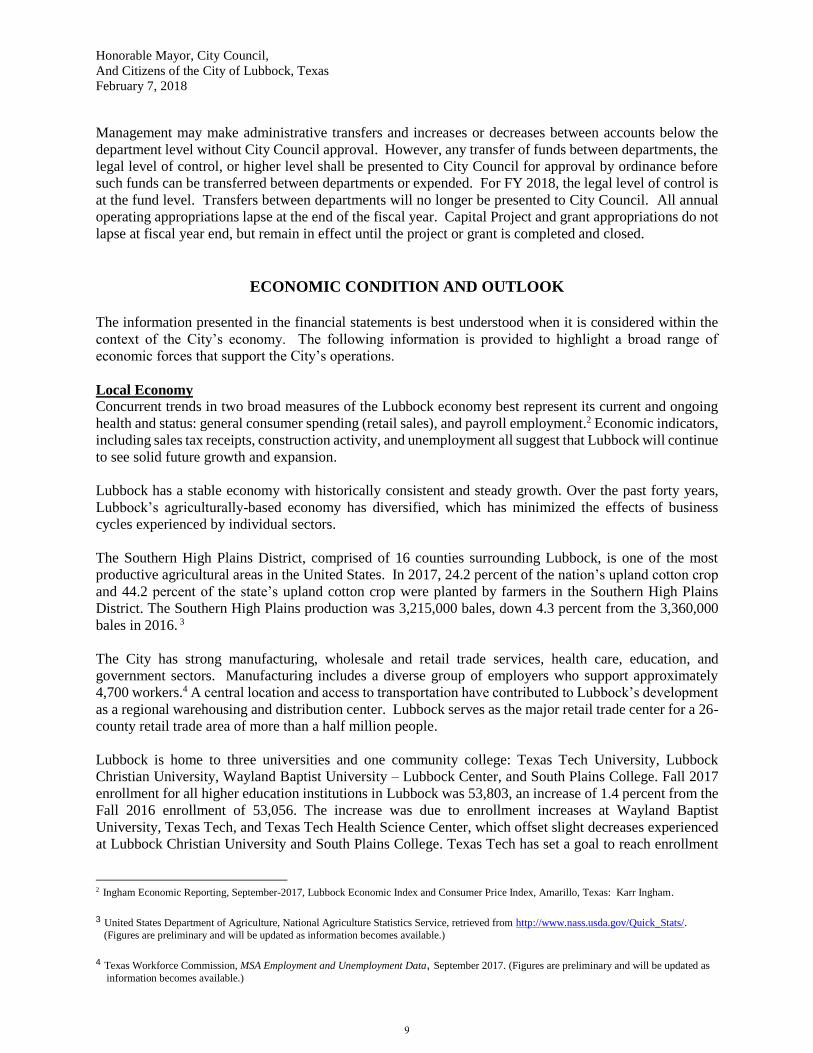
Lubbock is home to three universities and one community college: Texas Tech University, Lubbock
Christian University, Wayland Baptist University – Lubbock Center, and South Plains College. Fall 2017
enrollment for all higher education institutions in Lubbock was 53,803, an increase of 1.4 percent from the
Fall 2016 enrollment of 53,056. The increase was due to enrollment increases at Wayland Baptist
University, Texas Tech, and Texas Tech Health Science Center, which offset slight decreases experienced
at Lubbock Christian University and South Plains College. Texas Tech has set a goal to reach enrollment
2 Ingham Economic Reporting, September-2017, Lubbock Economic Index and Consumer Price Index, Amarillo, Texas: Karr Ingham.
3 United States Department of Agriculture, National Agriculture Statistics Service, retrieved from http://www.nass.usda.gov/Quick_Stats/. (Figures are preliminary and will be updated as information becomes available.)
4 Texas Workforce Commission, MSA Employment and Unemployment Data, September 2017. (Figures are preliminary and will be updated as
information becomes available.)
9
Honorable Mayor, City Council,
And Citizens of the City of Lubbock, Texas
February 7, 2018
of 40,000 students by 2020. The availability of graduates in the City is an added advantage to local
industries as the universities and colleges continue to produce a ready source of qualified labor.
The health care and social assistance sector is also a vital component of the Lubbock economy, with 23,151
employees and payroll exceeding $1 billion.5 Lubbock is home to several medical facilities including:
University Medical Center, Covenant Medical Center, The Lubbock Heart Hospital, and Grace Medical
Center. The Texas Tech University Health Sciences Center also provides health care, as well as training
and research opportunities for health care professionals.
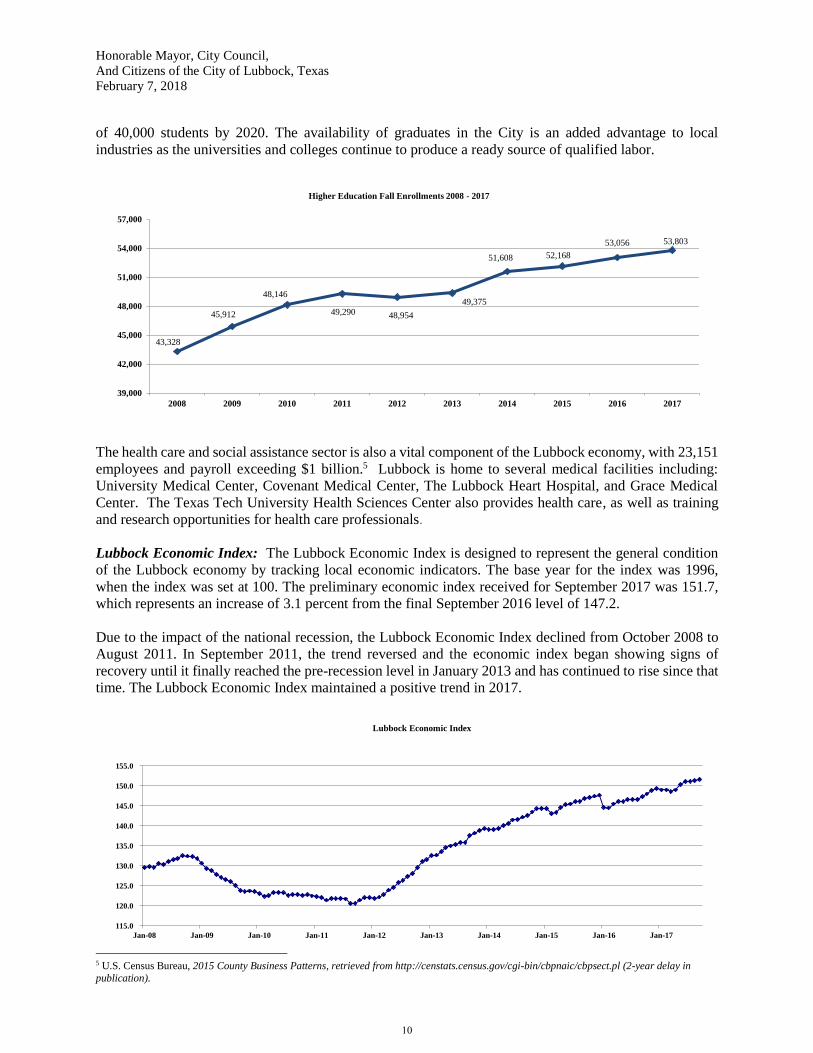
Lubbock Economic Index: The Lubbock Economic Index is designed to represent the general condition
of the Lubbock economy by tracking local economic indicators. The base year for the index was 1996,
when the index was set at 100. The preliminary economic index received for September 2017 was 151.7,
which represents an increase of 3.1 percent from the final September 2016 level of 147.2.
Due to the impact of the national recession, the Lubbock Economic Index declined from October 2008 to
August 2011. In September 2011, the trend reversed and the economic index began showing signs of
recovery until it finally reached the pre-recession level in January 2013 and has continued to rise since that
time. The Lubbock Economic Index maintained a positive trend in 2017.
5 U.S. Census Bureau, 2015 County Business Patterns, retrieved from http://censtats.census.gov/cgi-bin/cbpnaic/cbpsect.pl (2-year delay in
publication).
43,328
45,912
48,146
49,290 48,954
49,375
51,608 52,168
53,056 53,803
39,000
42,000
45,000
48,000
51,000
54,000
57,000
2008 2009 2010 2011 2012 2013 2014 2015 2016 2017
Higher Education Fall Enrollments 2008 - 2017
115.0
120.0
125.0
130.0
135.0
140.0
145.0
150.0
155.0
Jan-08 Jan-09 Jan-10 Jan-11 Jan-12 Jan-13 Jan-14 Jan-15 Jan-16 Jan-17
Lubbock Economic Index
10
Honorable Mayor, City Council,
And Citizens of the City of Lubbock, Texas
February 7, 2018
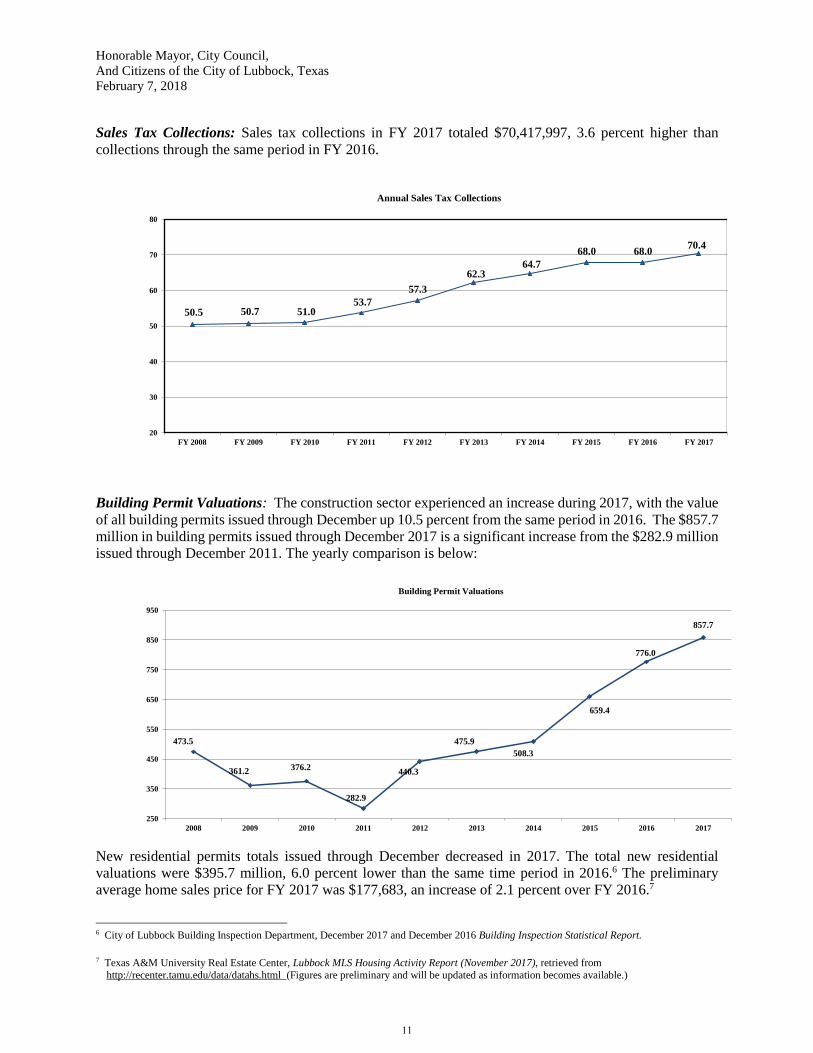
Sales Tax Collections: Sales tax collections in FY 2017 totaled $70,417,997, 3.6 percent higher than
collections through the same period in FY 2016.
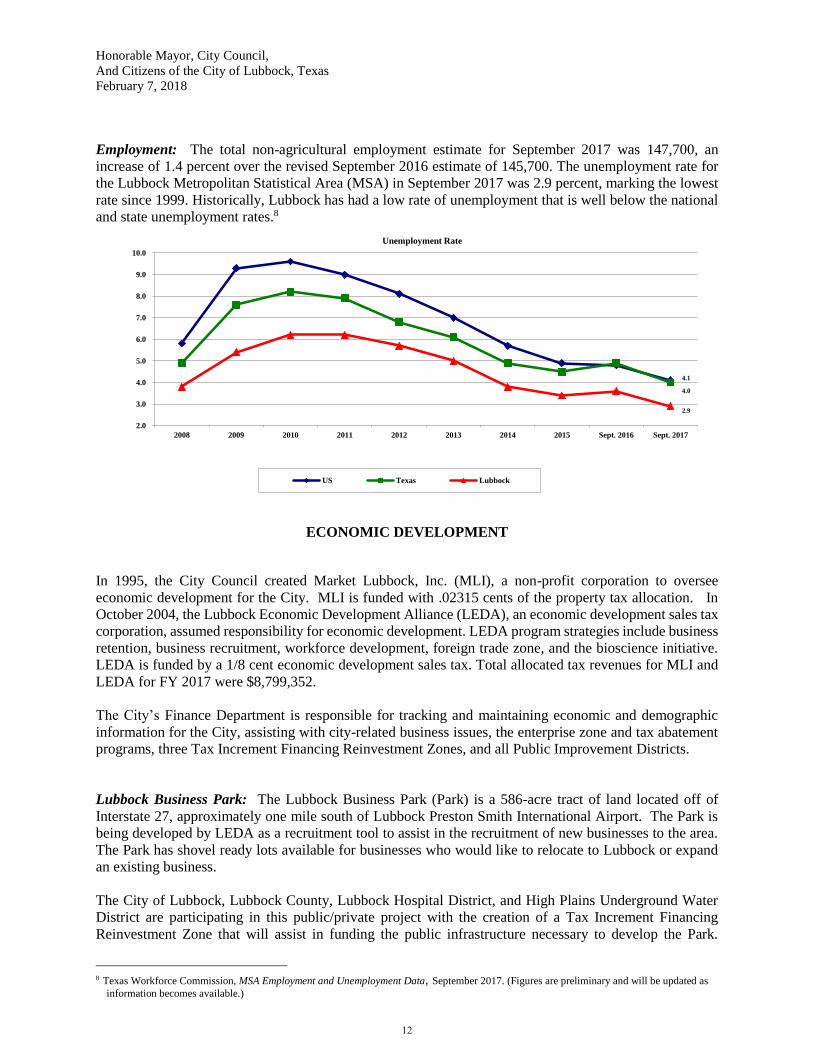
Building Permit Valuations: The construction sector experienced an increase during 2017, with the value
of all building permits issued through December up 10.5 percent from the same period in 2016. The $857.7
million in building permits issued through December 2017 is a significant increase from the $282.9 million
issued through December 2011. The yearly comparison is below:
New residential permits totals issued through December decreased in 2017. The total new residential
valuations were $395.7 million, 6.0 percent lower than the same time period in 2016.6 The preliminary
average home sales price for FY 2017 was $177,683, an increase of 2.1 percent over FY 2016.7
6 City of Lubbock Building Inspection Department, December 2017 and December 2016 Building Inspection Statistical Report.
7 Texas A&M University Real Estate Center, Lubbock MLS Housing Activity Report (November 2017), retrieved from
http://recenter.tamu.edu/data/datahs.html (Figures are preliminary and will be updated as information becomes available.)
50.5 50.7 51.053.7
57.3
62.364.7
68.0 68.070.4
20
30
40
50
60
70
80
FY 2008 FY 2009 FY 2010 FY 2011 FY 2012 FY 2013 FY 2014 FY 2015 FY 2016 FY 2017
Annual Sales Tax Collections
473.5
361.2 376.2
282.9
440.3
475.9
508.3
659.4
776.0
857.7
250
350
450
550
650
750
850
950
2008 2009 2010 2011 2012 2013 2014 2015 2016 2017
Building Permit Valuations
11
Honorable Mayor, City Council,
And Citizens of the City of Lubbock, Texas
February 7, 2018
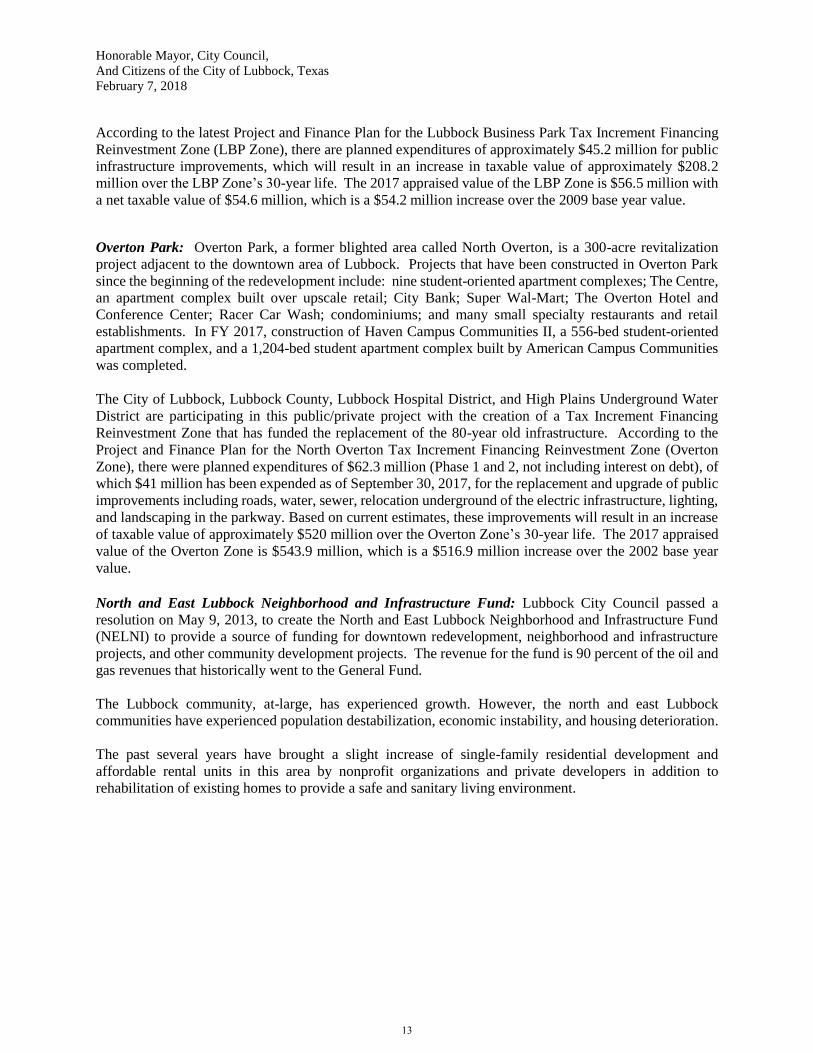
Employment: The total non-agricultural employment estimate for September 2017 was 147,700, an
increase of 1.4 percent over the revised September 2016 estimate of 145,700. The unemployment rate for
the Lubbock Metropolitan Statistical Area (MSA) in September 2017 was 2.9 percent, marking the lowest
rate since 1999. Historically, Lubbock has had a low rate of unemployment that is well below the national
and state unemployment rates.8
ECONOMIC DEVELOPMENT
In 1995, the City Council created Market Lubbock, Inc. (MLI), a non-profit corporation to oversee
economic development for the City. MLI is funded with .02315 cents of the property tax allocation. In
October 2004, the Lubbock Economic Development Alliance (LEDA), an economic development sales tax
corporation, assumed responsibility for economic development. LEDA program strategies include business
retention, business recruitment, workforce development, foreign trade zone, and the bioscience initiative.
LEDA is funded by a 1/8 cent economic development sales tax. Total allocated tax revenues for MLI and
LEDA for FY 2017 were $8,799,352.
The City’s Finance Department is responsible for tracking and maintaining economic and demographic
information for the City, assisting with city-related business issues, the enterprise zone and tax abatement
programs, three Tax Increment Financing Reinvestment Zones, and all Public Improvement Districts.
Lubbock Business Park: The Lubbock Business Park (Park) is a 586-acre tract of land located off of
Interstate 27, approximately one mile south of Lubbock Preston Smith International Airport. The Park is
being developed by LEDA as a recruitment tool to assist in the recruitment of new businesses to the area.
The Park has shovel ready lots available for businesses who would like to relocate to Lubbock or expand
an existing business.
The City of Lubbock, Lubbock County, Lubbock Hospital District, and High Plains Underground Water
District are participating in this public/private project with the creation of a Tax Increment Financing
Reinvestment Zone that will assist in funding the public infrastructure necessary to develop the Park.
8 Texas Workforce Commission, MSA Employment and Unemployment Data, September 2017. (Figures are preliminary and will be updated as
information becomes available.)
4.1
4.0
2.9
2.0
3.0
4.0
5.0
6.0
7.0
8.0
9.0
10.0
2008 2009 2010 2011 2012 2013 2014 2015 Sept. 2016 Sept. 2017
Unemployment Rate
US Texas Lubbock
12
Honorable Mayor, City Council,
And Citizens of the City of Lubbock, Texas
February 7, 2018
According to the latest Project and Finance Plan for the Lubbock Business Park Tax Increment Financing
Reinvestment Zone (LBP Zone), there are planned expenditures of approximately $45.2 million for public
infrastructure improvements, which will result in an increase in taxable value of approximately $208.2
million over the LBP Zone’s 30-year life. The 2017 appraised value of the LBP Zone is $56.5 million with
a net taxable value of $54.6 million, which is a $54.2 million increase over the 2009 base year value.
Overton Park: Overton Park, a former blighted area called North Overton, is a 300-acre revitalization
project adjacent to the downtown area of Lubbock. Projects that have been constructed in Overton Park
since the beginning of the redevelopment include: nine student-oriented apartment complexes; The Centre,
an apartment complex built over upscale retail; City Bank; Super Wal-Mart; The Overton Hotel and
Conference Center; Racer Car Wash; condominiums; and many small specialty restaurants and retail
establishments. In FY 2017, construction of Haven Campus Communities II, a 556-bed student-oriented
apartment complex, and a 1,204-bed student apartment complex built by American Campus Communities
was completed.
The City of Lubbock, Lubbock County, Lubbock Hospital District, and High Plains Underground Water
District are participating in this public/private project with the creation of a Tax Increment Financing
Reinvestment Zone that has funded the replacement of the 80-year old infrastructure. According to the
Project and Finance Plan for the North Overton Tax Increment Financing Reinvestment Zone (Overton
Zone), there were planned expenditures of $62.3 million (Phase 1 and 2, not including interest on debt), of
which $41 million has been expended as of September 30, 2017, for the replacement and upgrade of public
improvements including roads, water, sewer, relocation underground of the electric infrastructure, lighting,
and landscaping in the parkway. Based on current estimates, these improvements will result in an increase
of taxable value of approximately $520 million over the Overton Zone’s 30-year life. The 2017 appraised
value of the Overton Zone is $543.9 million, which is a $516.9 million increase over the 2002 base year
value.
North and East Lubbock Neighborhood and Infrastructure Fund: Lubbock City Council passed a
resolution on May 9, 2013, to create the North and East Lubbock Neighborhood and Infrastructure Fund
(NELNI) to provide a source of funding for downtown redevelopment, neighborhood and infrastructure
projects, and other community development projects. The revenue for the fund is 90 percent of the oil and
gas revenues that historically went to the General Fund.
The Lubbock community, at-large, has experienced growth. However, the north and east Lubbock
communities have experienced population destabilization, economic instability, and housing deterioration.
The past several years have brought a slight increase of single-family residential development and
affordable rental units in this area by nonprofit organizations and private developers in addition to
rehabilitation of existing homes to provide a safe and sanitary living environment.
13
Honorable Mayor, City Council,
And Citizens of the City of Lubbock, Texas
February 7, 2018
Downtown Redevelopment: The City of Lubbock Central Business District (CBD) has developed over the
years with traditional office, retail, and governmental agency uses. As with many cities in the last ten to
twenty years, retail has moved to shopping areas and other areas outside the CBD, and office development
has stagnated. In an effort to reverse the trend, the City of Lubbock, with participation from Lubbock
County, Lubbock Hospital District, and High Plains Underground Water District, created a Tax Increment
Financing Reinvestment Zone to assist in the redevelopment of downtown in December 2001, with a
termination date of December 31, 2020. On September 24, 2009, the City Council approved an extension
of the termination date to December 31, 2040 in order to provide additional funding to implement the
project and finance plan. According to the latest Project and Finance Plan for the Central Business District
Tax Increment Financing Reinvestment Zone (CBD Zone), planned expenditures amount to $40.8 million
for public infrastructure improvements, which will result in an increase in taxable value of approximately
$255.7 million over the CBD Zone’s 40-year life. The 2017 appraised value of the CBD Zone is $206.1
million, a $100.2 million increase over the 2001 base year value.
A Revitalization Action Plan for downtown Lubbock was completed in FY 2008. The Plan was approved
by the Planning and Zoning Commission and the City Council. In 2008, the City Council contracted with
McDougal Land Company, LT to provide Consulting/Master Developer services to implement the Plan,
and approved a five-year extension to the agreement in FY 2014. The implementation of the Plan is
underway with Phases I, II, and IIIa of the relocation of overhead utilities completed. The design of Phase
IIIb of the relocation of the overhead utilities will be complete in FY 2018. The City Council approved a
master zone case for the downtown area on December 15, 2010, with a revision on September 13, 2012.
The zone case assists in implementing design standards for exterior renovations of current buildings as well
as for new development in downtown.
FINANCIAL INFORMATION
Long-term financial planning
The City uses ten-year rate models for long-range planning in all major enterprise funds as a basis for
budget discussion and policy decision-making. These models are based on current projects and policies
and are continually monitored and updated throughout the year. The rates in the models are calculated to
provide financially sound net position reserves, as established by City Council Policy.
The City Council has approved goals for the General Fund unrestricted fund balance, which is set at a
minimum of an amount equal to 20 percent of operating revenues to meet unanticipated contingencies and
fluctuations in revenue. Enterprise funds also have appropriable net position reserve policies, ranging from
10 to 25 percent of operating revenue. LP&L must maintain three months gross retail electric revenue, as
determined by taking the average monthly gross retail electric revenue from the previous fiscal year. Water
and Wastewater funds maintain appropriable net position in an amount equal to 25 percent of operating
revenues. The Solid Waste, Airport, and Storm Water funds maintain appropriable net position of 15
percent of operating revenues. Appropriable net position has a slightly different definition than GAAP
unrestricted net position. Excesses and deficits are addressed in the subsequent year budget process.
Utility funds make payments in lieu of property taxes and franchise fees to the General Fund. The amount
LP&L pays in lieu of property tax is based on one percent of gross revenues. The payment in lieu of
property taxes for other utility funds is calculated by applying the property tax rate to the fixed assets of
the fund.
14
15
16
17

Financial Section
Independent Auditor's Report
The Honorable Mayor and Members of the City Council City of Lubbock, Texas Report on the Financial Statements We have audited the accompanying basic financial statements of the governmental activities, the business-type activities, the aggregate discretely presented component units, each major fund and the aggregate remaining fund information of the City of Lubbock, Texas (City), as of and for the year ended September 30, 2017, and the related notes to the basic financial statements, which collectively comprise the City’s basic financial statements listed in the table of contents. Management’s Responsibility for the Financial Statements Management is responsible for the preparation and fair presentation of these financial statements in accordance with accounting principles generally accepted in the United States of America; this includes the design, implementation and maintenance of internal control relevant to the preparation and fair presentation of financial statements that are free from material misstatement, whether due to fraud or error. Auditor’s Responsibility Our responsibility is to express opinions on these financial statements based on our audit. We did not audit the financial statements of Civic Lubbock, Inc., Market Lubbock Economic Development Corporation d/b/a Market Lubbock, Inc. or Lubbock Economic Development Alliance, which represent 91 percent, 95 percent and 99 percent, respectively, of the assets, net position and revenues of the aggregate discretely presented component units. Those statements were audited by other auditors, whose reports have been furnished to us, and our opinion, insofar as it relates to the amounts included for such entities, is based solely on the reports of the other auditors. We conducted our audit in accordance with auditing standards generally accepted in the United States of America and the standards applicable to financial audits contained in Government Auditing Standards, issued by the Comptroller General of the United States. Those standards require that we plan and perform the audit to obtain reasonable assurance about whether the financial statements are free from material misstatement. The financial statements of Civic Lubbock, Inc., a component unit included in the financial statements of the aggregate discretely presented component units, and West Texas Municipal Power Agency, a blended component unit reported as a major fund included in the basic financial statements of the business-type activities, were not audited in accordance with Government Auditing Standards.
19
The Honorable Mayor and Members of the City Council City of Lubbock, Texas
An audit involves performing procedures to obtain audit evidence about the amounts and disclosures in the financial statements. The procedures selected depend on the auditor’s judgment, including the assessment of the risks of material misstatement of the financial statements, whether due to fraud or error. In making those risk assessments, the auditor considers internal control relevant to the entity’s preparation and fair presentation of the financial statements in order to design audit procedures that are appropriate in the circumstances, but not for the purpose of expressing an opinion on the effectiveness of the entity’s internal control. Accordingly, we express no such opinion. An audit also includes evaluating the appropriateness of accounting policies used and the reasonableness of significant accounting estimates made by management, as well as evaluating the overall presentation of the financial statements. We believe that the audit evidence we have obtained is sufficient and appropriate to provide a basis for our audit opinions. Opinions In our opinion, based on our audit and the reports of the other auditors, the financial statements referred to above present fairly, in all material respects, the respective financial position of the governmental activities, the business-type activities, the aggregate discretely presented component units, each major fund and the aggregate remaining fund information of the City of Lubbock, Texas, as of September 30, 2017, and the respective changes in financial position and, where applicable, cash flows, thereof for the year then ended in accordance with accounting principles generally accepted in the United States of America. Other Matters Required Supplementary Information Accounting principles generally accepted in the United States of America require that the management’s discussion and analysis, budgetary comparison, pension and other post-employment benefits information listed in the table of contents be presented to supplement the basic financial statements. Such information, although not part of the basic financial statements, is required by the Governmental Accounting Standards Board, who considers it to be an essential part of financial reporting for placing the basic financial statements in an appropriate operational, economic or historical context. We have applied certain limited procedures to the required supplementary information in accordance with auditing standards generally accepted in the United States of America, which consisted of inquiries of management about the methods of preparing the information and comparing the information for consistency with management’s responses to our inquiries, the basic financial statements and other knowledge we obtained during our audit of the basic financial statements. We do not express an opinion or provide any assurance on the information because the limited procedures do not provide us with sufficient evidence to express an opinion or provide any assurance.
20
The Honorable Mayor and Members of the City Council City of Lubbock, Texas
Other Information Our audit was conducted for the purpose of forming opinions on the financial statements that collectively comprise the City's basic financial statements. The combining and individual fund statements and schedules, introductory and statistical sections, including the schedule of expenditures of federal awards required by Title 2 U.S. Code of Federal Regulations Part 200, Uniform Administrative Requirements, Cost Principles, and Audit Requirements for Federal Awards, as listed in the table of contents, are presented for purposes of additional analysis and are not a required part of the basic financial statements.
The combining and individual fund statements and schedule of expenditures of federal awards is the responsibility of management and was derived from and relates directly to the underlying accounting and other records used to prepare the basic financial statements. Such information has been subjected to the auditing procedures applied in the audit of the basic financial statements and certain additional procedures, including comparing and reconciling such information directly to the underlying accounting and other records used to prepare the basic financial statements or to the basic financial statements themselves, and other additional procedures in accordance with auditing standards generally accepted in the United States of America. In our opinion, the combining and individual fund statements and schedule of expenditures of federal awards is fairly stated in all material respects in relation to the basic financial statements as a whole.
The introductory and statistical sections have not been subjected to the auditing procedures applied in the audit of the basic financial statements, and accordingly, we do not express an opinion or provide any assurance on it.
Other Reporting Required by Government Auditing Standards In accordance with Government Auditing Standards, we have also issued our report dated February 7, 2018, on our consideration of the City’s internal control over financial reporting and our tests of its compliance with certain provisions of laws, regulations, contracts and grant agreements and other matters. The purpose of that report is to describe the scope of our testing of internal control over financial reporting and compliance and the results of that testing, and not to provide an opinion on the internal control over financial reporting or on compliance. That report is an integral part of an audit performed in accordance with Government Auditing Standards in considering the City’s internal control over financial reporting and compliance.
Dallas, Texas February 7, 2018
21
City of Lubbock, Texas
Management’s Discussion and Analysis
For the Year Ended September 30, 2017
The Management’s Discussion and Analysis (MD&A) provides a narrative overview and analysis of the
financial activities of the City of Lubbock for the fiscal year ended September 30, 2017.
Readers of the financial statements are encouraged to consider the information included in the transmittal
letter and in the other sections of the Comprehensive Annual Financial Report (CAFR) e.g., combining
statements and the statistical section in conjunction with the MD&A.
Financial Highlights
The following financial highlights summarize the City’s financial position and operations as presented in
more detail in the Basic Financial Statements (BFS).
The City’s total government-wide assets and deferred outflows exceeded its liabilities and deferred
inflows at September 30, 2017 by $896.6 million (net position).
The City’s total net position increased by $53.9 million as a result of operations during the fiscal
year.
The ending unassigned fund balance for the General Fund was $37.5 million, or 27.1 percent of
total General Fund revenues, an increase of $1.9 million from the prior year.
The City’s governmental funds reported combined ending fund balances of $152.1 million, of
which $36.9 million is available for spending at the City’s discretion.
The City’s enterprise funds reported combined ending net position of $862.8 million, of which
$93.5 million is available for spending at the City’s discretion.
During FY 2017, the City issued $131.1 million in bonded debt. Part of this was used to refund
debt, which decreased debt service requirements by $6.6 million.
Overview of the Financial Statements
Basic Financial Statements: The MD&A is intended to serve as an introduction to the City’s BFS. The
BFS are comprised of three components: 1) Government-Wide Financial Statements (GWFS), 2) Fund
Financial Statements (FFS), and 3) Notes to Basic Financial Statements (Notes). The CAFR contains other
supplementary information in addition to the BFS.
Government-Wide Financial Statements: The GWFS, shown on pages 41-43 of the CAFR, contain the
Statement of Net Position and the Statement of Activities, described below:
The Statement of Net Position presents information on the City’s assets, liabilities (including capital assets
and short- and long-term liabilities), and deferred inflows/outflows of resources with the difference reported
as net position using the accrual basis of accounting. Over time, increases or decreases in net position serve
as a useful indicator of whether the financial position of the City is improving or deteriorating.
The Statement of Activities presents a comparison between direct expenses and program revenues for each
of the City’s functions or programs. Direct expenses are specifically associated with an activity and are
therefore clearly identifiable with that activity. Program revenues include charges paid by the recipient of
the goods or services offered by the program. Program revenues also include grants and contributions
23
City of Lubbock, Texas
Management’s Discussion and Analysis
For the Year Ended September 30, 2017
restricted to meeting the operational or capital requirements of a particular activity. Revenues not directly
related to a specific activity are presented as general revenues. The comparison of direct expenses with
revenues from activities identifies the extent to which each activity is self-financing, or alternatively, draws
from any City generated general revenues.
Governmental activities (activities principally supported by taxes and intergovernmental revenues) of the
City include administrative services as well as general government, community services, cultural and
recreation, economic and business development, fire, health, police, other public safety, and streets and
traffic. Business-type activities (activities intended to recover all of their costs through user fees and
charges) of the City include electric, water, wastewater, solid waste, storm water, transit, airport, civic
centers, cemetery, and Lake Alan Henry Recreation. Electric includes Lubbock Power and Light (LP&L)
and West Texas Municipal Power Agency (WTMPA). All changes in net position are reported as soon as
the underlying event occurs (accrual basis), regardless of the timing of related cash flows. Thus, revenues
and expenses are reported in this statement for some items that will result in cash flows in future fiscal
periods, such as uncollected taxes and earned, but unused vacation leave.
Component Units: The GWFS include the City (the “primary government”), and six legally separate
entities (the “component units”) for which the City is financially accountable. The discretely presented
component units consist of: Urban Renewal Agency (URA), Market Lubbock Economic Development
Corporation, d/b/a Market Lubbock, Inc., Lubbock Economic Development Alliance, Civic Lubbock, Inc.,
and Vintage Township Public Facilities Corporation. West Texas Municipal Agency (WTMPA) and the
Lubbock Metropolitan Planning Organization are blended component units. The component units provide
community services, economic development services, arts and cultural activities, and public improvement
financing for the City. Financial information for the discretely presented component units is reported
separately in the GWFS to differentiate them from the City’s financial information.
Fund Financial Statements: A fund is defined as a fiscal and accounting entity with a self-balancing set
of accounts recording cash and other financial resources, together with all related liabilities and residual
equities or balances, and changes therein, which are segregated for the purpose of carrying on specific
activities or attaining certain objectives in accordance with special regulations, restrictions, or limitations.
The principal role of funds in the financial reporting model is to demonstrate fiscal accountability. The
City, as with other state and local governments, uses fund accounting to ensure and demonstrate compliance
with finance-related legal requirements.
The focus of the FFS is on major funds. Major funds are those that meet minimum criteria (a percentage
of assets, liabilities, revenue, or expenditures/expenses of fund category and of the governmental and
enterprise funds combined), or those that the City chooses to report as major funds given their qualitative
significance. Non-major funds are aggregated and shown in a single column in the appropriate financial
statements. Combining schedules of nonmajor funds are included in the CAFR following the Required
Supplementary Information (RSI) and Other Supplementary Information (OSI). All funds of the City can
be divided into two categories: governmental funds and proprietary funds.
Governmental FFS: Governmental funds are used to account for essentially the same functions reported
as governmental activities in the GWFS. However, unlike the GWFS, governmental FFS focus on near-
term inflows and outflows of spendable resources, as well as on balances of spendable resources available
at the end of the City’s fiscal year. Such information is useful in evaluating the City’s near-term financing
requirements.
24
City of Lubbock, Texas
Management’s Discussion and Analysis
For the Year Ended September 30, 2017
Because the focus of governmental funds is narrower than that of the GWFS (modified accrual versus
accrual basis of accounting, and current financial resources versus economic resources), it is useful to
compare the information presented for governmental funds with similar information presented for
governmental activities in the GWFS. By doing so, the reader may better understand the long-term impact
of near-term financing decisions. Reconciliations are provided for both the governmental fund balance
sheet and the governmental fund statement of revenues, expenditures, and changes in fund balances to
facilitate the comparison between governmental funds and governmental activities.
The City maintains 30 individual governmental funds. Information is presented separately in the
governmental fund balance sheet and in the governmental fund statement of revenues, expenditures, and
changes in fund balances for the General Fund and Governmental Capital Projects Fund, which are
considered to be major funds. The governmental FFS can be found on pages 44-47 of the CAFR. Data for
the other 28 governmental funds are combined into a single, aggregated presentation.
The City adopts a budget annually for the General Fund and most other funds. In the RSI section, a
budgetary comparison statement for the General Fund has been provided to demonstrate compliance with
the budget.
Proprietary FFS: The City maintains two different types of proprietary funds. Enterprise funds are used
to report the same functions presented as business-type activities in the GWFS. Enterprise FFS provide the
same type of information as the GWFS, only in more detail. The City uses enterprise funds to account for
LP&L, water, wastewater, WTMPA, storm water, transit, solid waste, airport, civic centers, cemetery, and
Lake Alan Henry Recreation activities, of which the first five activities are considered to be major funds
by the City and are presented separately. The latter six activities are considered non-major funds and are
combined into a single aggregated presentation.
Internal service funds are an accounting device used to accumulate and allocate costs internally among the
City’s various functions. The City uses internal service funds to account for vehicle service operations and
fueling, central warehouse and printing services, information technology services, risk management, health
benefits, and investment pool funds. The services provided by the internal service funds benefit both
governmental and business-type activities, and accordingly, they have been included within governmental
activities and business-type activities, as appropriate, in the GWFS. All internal service funds are combined
into a single aggregated presentation in the proprietary FFS. Reconciliations are provided for the
proprietary fund statement of net position and the proprietary fund statement of revenues, expenses, and
changes in fund net position for comparison between enterprise funds and business-type activities. The
proprietary FFS can be found on pages 48-59 of the CAFR.
Notes to Basic Financial Statements: The notes provide additional information that is essential to a full
understanding of the data provided in the GWFS and FFS. The notes can be found on pages 60-107 of the
CAFR.
Other Information: In addition to the basic financial statements and accompanying notes, this report also
presents certain RSI concerning the Schedule of Funding Progress for the City’s health/dental care
insurance plan. RSI also includes the Schedule of Changes in Net Pension Liability and Related Ratios and
the Schedule of Contributions for the City’s pension plans. The General Fund budgetary comparison
demonstrating the legal level of budgetary control can also be found as part of the RSI. The RSI can be
found on pages 109-116 of the CAFR.
25
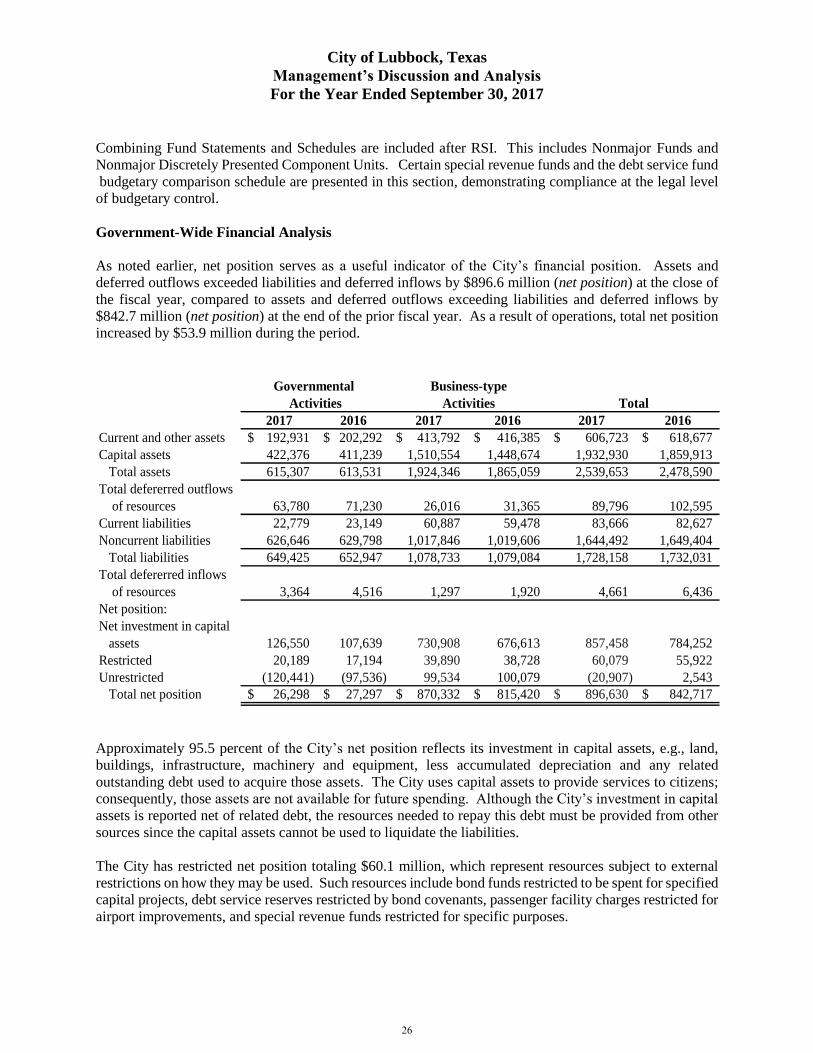
City of Lubbock, Texas
Management’s Discussion and Analysis
For the Year Ended September 30, 2017
Combining Fund Statements and Schedules are included after RSI. This includes Nonmajor Funds and
Nonmajor Discretely Presented Component Units. Certain special revenue funds and the debt service fund
budgetary comparison schedule are presented in this section, demonstrating compliance at the legal level
of budgetary control.
Government-Wide Financial Analysis
As noted earlier, net position serves as a useful indicator of the City’s financial position. Assets and
deferred outflows exceeded liabilities and deferred inflows by $896.6 million (net position) at the close of
the fiscal year, compared to assets and deferred outflows exceeding liabilities and deferred inflows by
$842.7 million (net position) at the end of the prior fiscal year. As a result of operations, total net position
increased by $53.9 million during the period.
2017 2016 2017 2016 2017 2016
Current and other assets 192,931$ 202,292$ 413,792$ 416,385$ 606,723$ 618,677$
Capital assets 422,376 411,239 1,510,554 1,448,674 1,932,930 1,859,913
Total assets 615,307 613,531 1,924,346 1,865,059 2,539,653 2,478,590
Total defererred outflows
of resources 63,780 71,230 26,016 31,365 89,796 102,595
Current liabilities 22,779 23,149 60,887 59,478 83,666 82,627
Noncurrent liabilities 626,646 629,798 1,017,846 1,019,606 1,644,492 1,649,404
Total liabilities 649,425 652,947 1,078,733 1,079,084 1,728,158 1,732,031
Total defererred inflows
of resources 3,364 4,516 1,297 1,920 4,661 6,436
Net position:
Net investment in capital
assets 126,550 107,639 730,908 676,613 857,458 784,252
Restricted 20,189 17,194 39,890 38,728 60,079 55,922
Unrestricted (120,441) (97,536) 99,534 100,079 (20,907) 2,543
Total net position 26,298$ 27,297$ 870,332$ 815,420$ 896,630$ 842,717$
Activities Activities Total
Governmental Business-type
Approximately 95.5 percent of the City’s net position reflects its investment in capital assets, e.g., land,
buildings, infrastructure, machinery and equipment, less accumulated depreciation and any related
outstanding debt used to acquire those assets. The City uses capital assets to provide services to citizens;
consequently, those assets are not available for future spending. Although the City’s investment in capital
assets is reported net of related debt, the resources needed to repay this debt must be provided from other
sources since the capital assets cannot be used to liquidate the liabilities.
The City has restricted net position totaling $60.1 million, which represent resources subject to external
restrictions on how they may be used. Such resources include bond funds restricted to be spent for specified
capital projects, debt service reserves restricted by bond covenants, passenger facility charges restricted for
airport improvements, and special revenue funds restricted for specific purposes.
26
City of Lubbock, Texas
Management’s Discussion and Analysis
For the Year Ended September 30, 2017
The unrestricted net position is the amount that may be used to meet the government’s ongoing obligation
to citizens and creditors. The adoption of GASB Statement No. 68 in FY 2015 resulted in the City’s
reporting of net pension liabilities, deferred inflows of resources, deferred outflows of resources and
recognition of pension expense for the City’s two pension plans – Texas Municipal Retirement System
(TMRS) and Lubbock Fire Pension Fund (LFPF). This had a significant negative effect on the Cities’ net
position and consequently unrestricted net position as of September 30, 2017.
At the end of the current fiscal year, the City is able to report positive balances in all three categories of net
position for business type activities. However, governmental activities as well as the government as a
whole report a deficit of $120.4 million and $20.9 million for unrestricted net position, respectively.
27
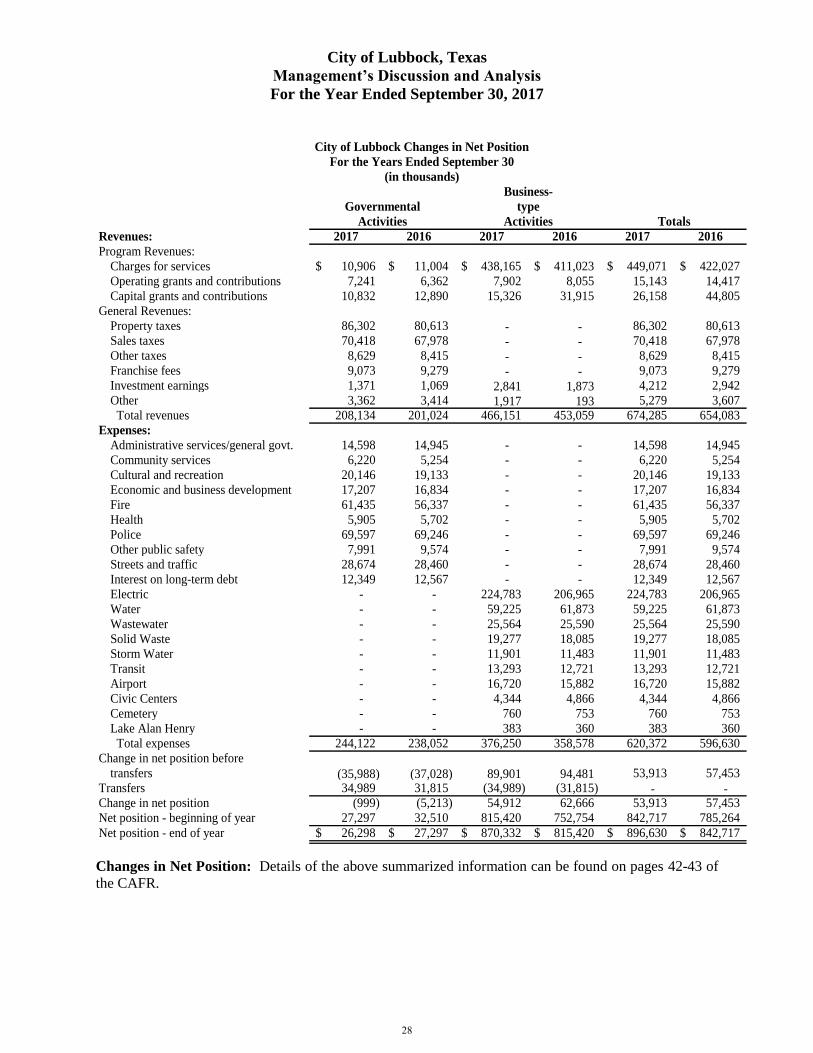
City of Lubbock, Texas
Management’s Discussion and Analysis
For the Year Ended September 30, 2017
Revenues: 2017 2016 2017 2016 2017 2016
Program Revenues:
Charges for services 10,906$ 11,004$ 438,165$ 411,023$ 449,071$ 422,027$
Operating grants and contributions 7,241 6,362 7,902 8,055 15,143 14,417
Capital grants and contributions 10,832 12,890 15,326 31,915 26,158 44,805
General Revenues:
Property taxes 86,302 80,613 - - 86,302 80,613
Sales taxes 70,418 67,978 - - 70,418 67,978
Other taxes 8,629 8,415 - - 8,629 8,415
Franchise fees 9,073 9,279 - - 9,073 9,279
Investment earnings 1,371 1,069 2,841 1,873 4,212 2,942
Other 3,362 3,414 1,917 193 5,279 3,607
Total revenues 208,134 201,024 466,151 453,059 674,285 654,083
Expenses:
Administrative services/general govt. 14,598 14,945 - - 14,598 14,945
Community services 6,220 5,254 - - 6,220 5,254
Cultural and recreation 20,146 19,133 - - 20,146 19,133
Economic and business development 17,207 16,834 - - 17,207 16,834
Fire 61,435 56,337 - - 61,435 56,337
Health 5,905 5,702 - - 5,905 5,702
Police 69,597 69,246 - - 69,597 69,246
Other public safety 7,991 9,574 - - 7,991 9,574
Streets and traffic 28,674 28,460 - - 28,674 28,460
Interest on long-term debt 12,349 12,567 - - 12,349 12,567
Electric - - 224,783 206,965 224,783 206,965
Water - - 59,225 61,873 59,225 61,873
Wastewater - - 25,564 25,590 25,564 25,590
Solid Waste - - 19,277 18,085 19,277 18,085
Storm Water - - 11,901 11,483 11,901 11,483
Transit - - 13,293 12,721 13,293 12,721
Airport - - 16,720 15,882 16,720 15,882
Civic Centers - - 4,344 4,866 4,344 4,866
Cemetery - - 760 753 760 753
Lake Alan Henry - - 383 360 383 360
Total expenses 244,122 238,052 376,250 358,578 620,372 596,630
transfers (35,988) (37,028) 89,901 94,481 53,913 57,453
Transfers 34,989 31,815 (34,989) (31,815) - - Change in net position (999) (5,213) 54,912 62,666 53,913 57,453
Net position - beginning of year 27,297 32,510 815,420 752,754 842,717 785,264
Net position - end of year 26,298$ 27,297$ 870,332$ 815,420$ 896,630$ 842,717$
Change in net position before
City of Lubbock Changes in Net Position
For the Years Ended September 30
(in thousands)
Governmental
Activities
Business-
type
Activities Totals
Changes in Net Position: Details of the above summarized information can be found on pages 42-43 of
the CAFR.
28
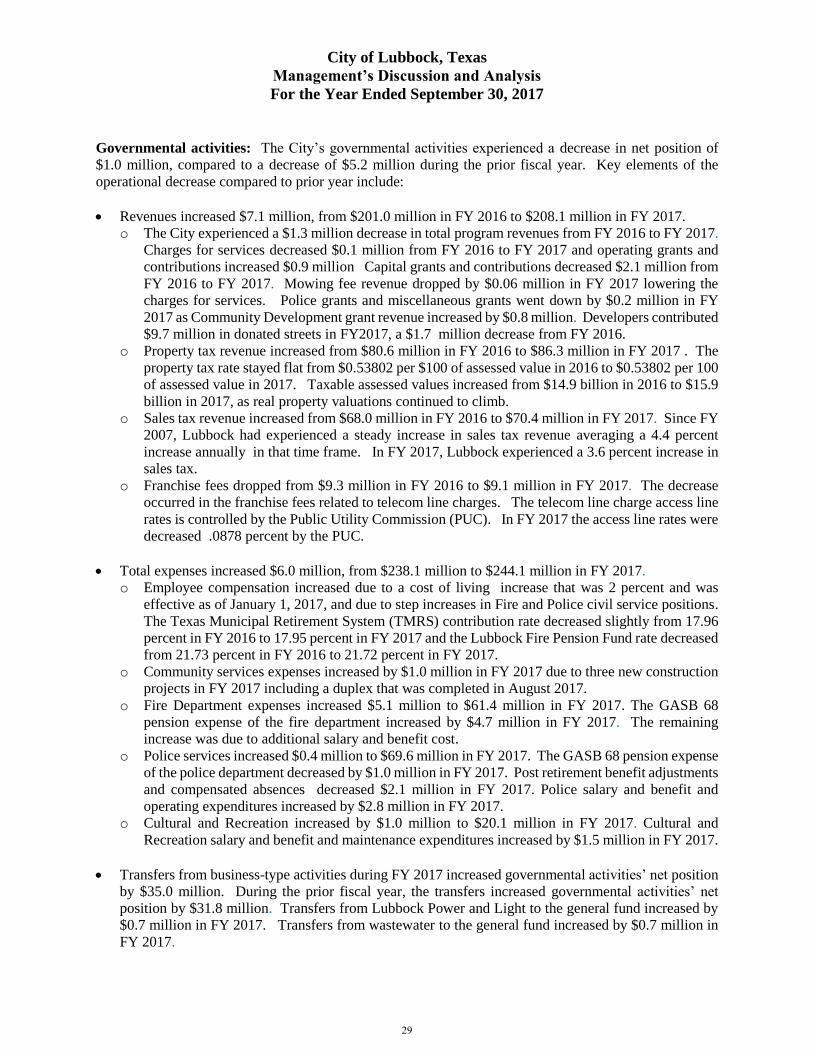
City of Lubbock, Texas
Management’s Discussion and Analysis
For the Year Ended September 30, 2017
Governmental activities: The City’s governmental activities experienced a decrease in net position of
$1.0 million, compared to a decrease of $5.2 million during the prior fiscal year. Key elements of the
operational decrease compared to prior year include:
Revenues increased $7.1 million, from $201.0 million in FY 2016 to $208.1 million in FY 2017.
o The City experienced a $1.3 million decrease in total program revenues from FY 2016 to FY 2017.
Charges for services decreased $0.1 million from FY 2016 to FY 2017 and operating grants and
contributions increased $0.9 million Capital grants and contributions decreased $2.1 million from
FY 2016 to FY 2017. Mowing fee revenue dropped by $0.06 million in FY 2017 lowering the
charges for services. Police grants and miscellaneous grants went down by $0.2 million in FY
2017 as Community Development grant revenue increased by $0.8 million. Developers contributed
$9.7 million in donated streets in FY2017, a $1.7 million decrease from FY 2016.
o Property tax revenue increased from $80.6 million in FY 2016 to $86.3 million in FY 2017 . The
property tax rate stayed flat from $0.53802 per $100 of assessed value in 2016 to $0.53802 per 100
of assessed value in 2017. Taxable assessed values increased from $14.9 billion in 2016 to $15.9
billion in 2017, as real property valuations continued to climb.
o Sales tax revenue increased from $68.0 million in FY 2016 to $70.4 million in FY 2017. Since FY
2007, Lubbock had experienced a steady increase in sales tax revenue averaging a 4.4 percent
increase annually in that time frame. In FY 2017, Lubbock experienced a 3.6 percent increase in
sales tax.
o Franchise fees dropped from $9.3 million in FY 2016 to $9.1 million in FY 2017. The decrease
occurred in the franchise fees related to telecom line charges. The telecom line charge access line
rates is controlled by the Public Utility Commission (PUC). In FY 2017 the access line rates were
decreased .0878 percent by the PUC.
Total expenses increased $6.0 million, from $238.1 million to $244.1 million in FY 2017.
o Employee compensation increased due to a cost of living increase that was 2 percent and was
effective as of January 1, 2017, and due to step increases in Fire and Police civil service positions.
The Texas Municipal Retirement System (TMRS) contribution rate decreased slightly from 17.96
percent in FY 2016 to 17.95 percent in FY 2017 and the Lubbock Fire Pension Fund rate decreased
from 21.73 percent in FY 2016 to 21.72 percent in FY 2017.
o Community services expenses increased by $1.0 million in FY 2017 due to three new construction
projects in FY 2017 including a duplex that was completed in August 2017.
o Fire Department expenses increased $5.1 million to $61.4 million in FY 2017. The GASB 68
pension expense of the fire department increased by $4.7 million in FY 2017. The remaining
increase was due to additional salary and benefit cost.
o Police services increased $0.4 million to $69.6 million in FY 2017. The GASB 68 pension expense
of the police department decreased by $1.0 million in FY 2017. Post retirement benefit adjustments
and compensated absences decreased $2.1 million in FY 2017. Police salary and benefit and
operating expenditures increased by $2.8 million in FY 2017.
o Cultural and Recreation increased by $1.0 million to $20.1 million in FY 2017. Cultural and
Recreation salary and benefit and maintenance expenditures increased by $1.5 million in FY 2017.
Transfers from business-type activities during FY 2017 increased governmental activities’ net position
by $35.0 million. During the prior fiscal year, the transfers increased governmental activities’ net
position by $31.8 million. Transfers from Lubbock Power and Light to the general fund increased by
$0.7 million in FY 2017. Transfers from wastewater to the general fund increased by $0.7 million in
FY 2017.
29
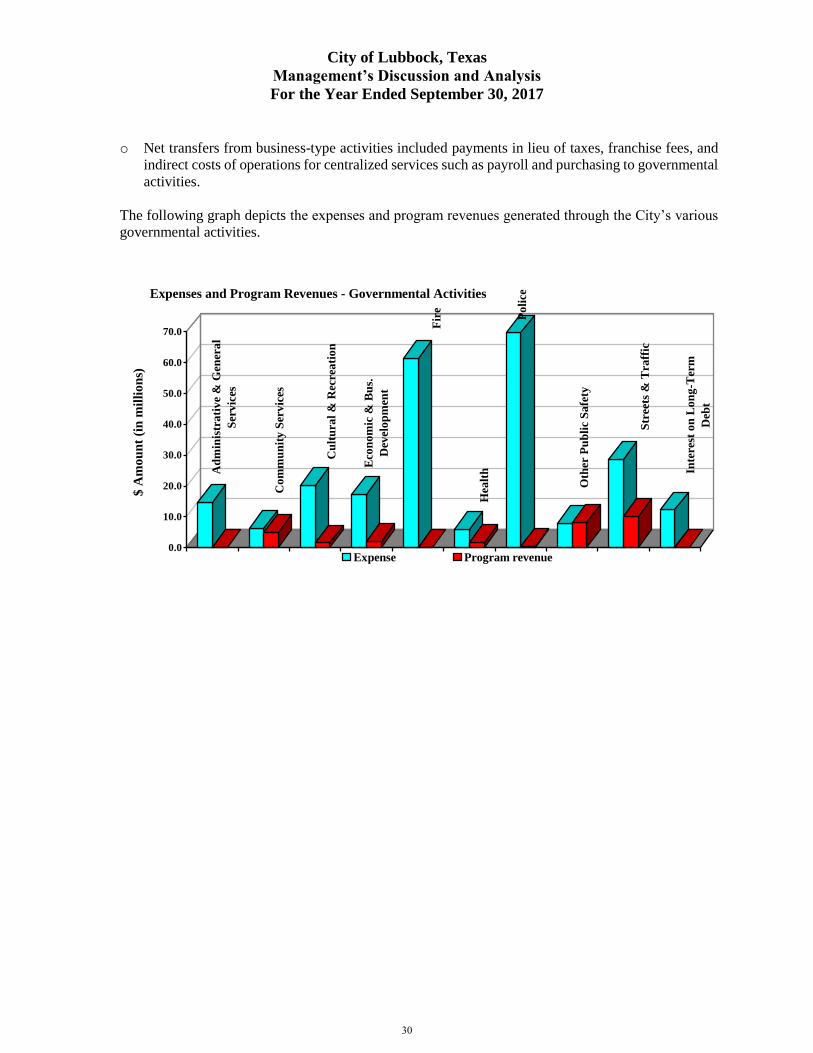
City of Lubbock, Texas
Management’s Discussion and Analysis
For the Year Ended September 30, 2017
o Net transfers from business-type activities included payments in lieu of taxes, franchise fees, and
indirect costs of operations for centralized services such as payroll and purchasing to governmental
activities.
The following graph depicts the expenses and program revenues generated through the City’s various
governmental activities.
Ad
min
istr
ati
ve
& G
ener
al
Ser
vic
es
Co
mm
un
ity
Ser
vic
es
Cu
ltu
ral
& R
ecre
ati
on
Eco
no
mic
& B
us.
Dev
elo
pm
ent
Fir
e
Hea
lth
Po
lice
Oth
er P
ub
lic
Sa
fety
Str
eets
& T
raff
ic
Inte
rest
on
Lo
ng
-Ter
m
Deb
t
0.0
10.0
20.0
30.0
40.0
50.0
60.0
70.0
$ A
mo
un
t (i
n m
illi
on
s)
Expenses and Program Revenues - Governmental Activities
Expense Program revenue
30
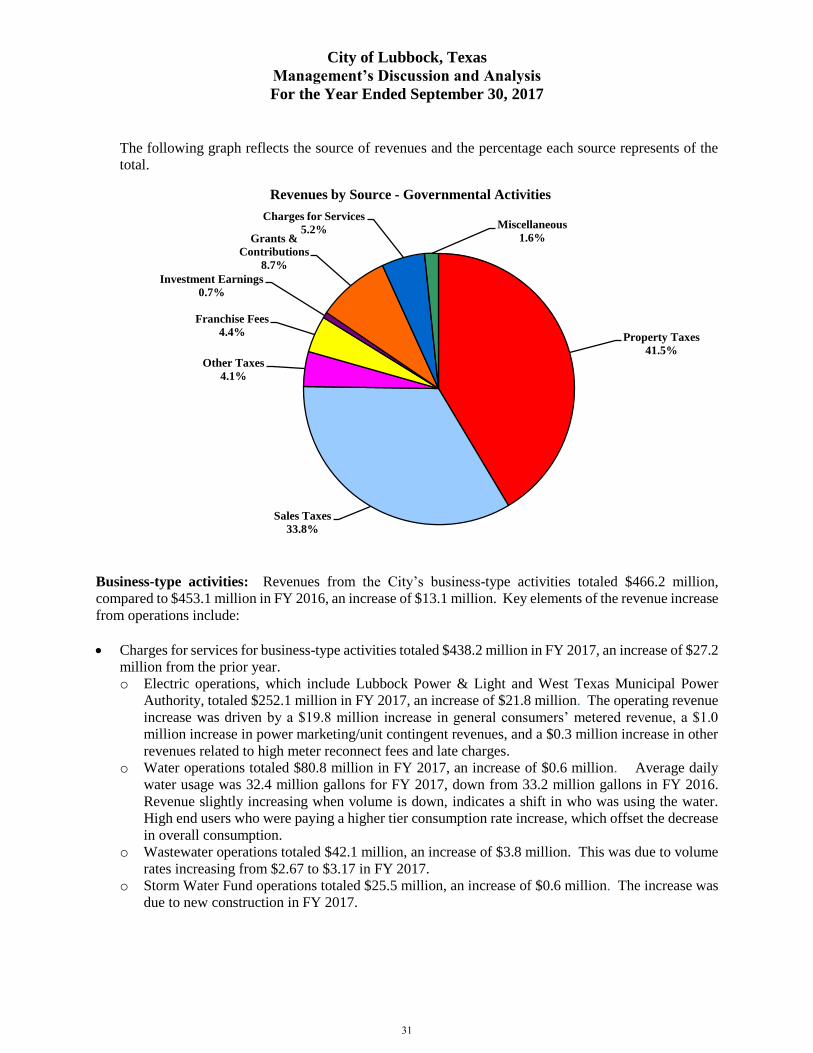
City of Lubbock, Texas
Management’s Discussion and Analysis
For the Year Ended September 30, 2017
The following graph reflects the source of revenues and the percentage each source represents of the
total.
Business-type activities: Revenues from the City’s business-type activities totaled $466.2 million,
compared to $453.1 million in FY 2016, an increase of $13.1 million. Key elements of the revenue increase
from operations include:
Charges for services for business-type activities totaled $438.2 million in FY 2017, an increase of $27.2
million from the prior year.
o Electric operations, which include Lubbock Power & Light and West Texas Municipal Power
Authority, totaled $252.1 million in FY 2017, an increase of $21.8 million. The operating revenue
increase was driven by a $19.8 million increase in general consumers’ metered revenue, a $1.0
million increase in power marketing/unit contingent revenues, and a $0.3 million increase in other
revenues related to high meter reconnect fees and late charges.
o Water operations totaled $80.8 million in FY 2017, an increase of $0.6 million. Average daily
water usage was 32.4 million gallons for FY 2017, down from 33.2 million gallons in FY 2016.
Revenue slightly increasing when volume is down, indicates a shift in who was using the water.
High end users who were paying a higher tier consumption rate increase, which offset the decrease
in overall consumption.
o Wastewater operations totaled $42.1 million, an increase of $3.8 million. This was due to volume
rates increasing from $2.67 to $3.17 in FY 2017.
o Storm Water Fund operations totaled $25.5 million, an increase of $0.6 million. The increase was
due to new construction in FY 2017.
Property Taxes
41.5%
Sales Taxes
33.8%
Other Taxes
4.1%
Franchise Fees
4.4%
Investment Earnings
0.7%
Grants &
Contributions
8.7%
Charges for Services
5.2% Miscellaneous
1.6%
Revenues by Source - Governmental Activities
31
City of Lubbock, Texas
Management’s Discussion and Analysis
For the Year Ended September 30, 2017
Operating grants, capital grants and contributions produced $23.2 million in revenue for business-type
activities during FY 2017, down $16.8 million from the prior year. Of that decrease, $14.0 million is
related to Airport capital grants and contributions, which decreased from $19.8 million in FY 2016 to
$5.8 million in FY 2017. Airport had two large runway projects that were 90% grant funded that were
in their final stages in FY 2017, so expenditures and grant reimbursements dropped.
Expenses for business-type activities were $376.3 million in FY 2017, an increase of $17.7 million.
Electric operating expenses were $224.8 million, an increase of $17.8 million from the prior year. The
primary operating expenses contributing to the increase included a $16.5 million increase in the
purchase of fuel and power. Other services and charges increased by $1.6 million which was offset by
a $1.5 million decrease in depreciation and amortization. Depreciation and amortization expenses
decreased in FY 2017 mainly due to two large assets that were acquired from Xcel in 2011 that fully
depreciated in FY 2016. Another factor was some changes in asset lives during the Federal Energy
Regulatory Commission (FERC) asset evaluation study in FY 2016, the capital asset lives were
compared to industry standards and were changed to reflect those standards. FY 2017 reflected a full
year’s worth of depreciation based on the new useful lives.
Expenses in the Water Fund were $59.2 million in FY 2017, down $2.7 million from FY 2016. Other
services and charges decreased by $1.8 million in FY 2017. A large increase in other services and
charges of $3.9 million in FY 2016 was caused by repairs on a Canadian River Municipal Water
Pipeline that the City of Lubbock cash funded. Personnel cost decreased by $0.3 million in FY 2017
to $9.9 million. Employees received a 2 percent compensation adjustment in January 2017.
Depreciation expense increased by $0.2 million in FY 2017 to $16.9 million.
Expenses in the Wastewater Fund stayed flat in FY 2017 at $25.6 million. Interest expense in FY 2017
decreased by $0.6 million. Personnel cost decreased by $0.1 million in FY 2017. The decrease was
offset by a $0.6 million increase in depreciation in FY 2017.
Expenses in the Storm Water Fund were $11.9 million in FY 2017, an increase of $0.4 million from
the prior year. Personnel cost increased by $0.2 million in FY 2017 to $2.3 million. Other services
and charges increased by $0.1 million in FY 2017. This was caused by a $0.2 million increase in
expenses related to the Storm Water master plan.
Expenses for transit, airport, civic centers, cemetery, and Lake Alan Henry were $35.5 million, a $.9
million increase from FY 2016. Transit Fund expenses increased by $0.6 million in FY 2017 to $13.3
million. Transit personnel cost increased by $0.5 million in FY 2017. Airport expenses increased by
$0.9 million in FY 2017 to $16.7 million. Airport other services and charges increased by $1.2 million
in FY 2017. A study analyzing existing conditions and recommendations for improvements regarding
rental car operations at the airport made up $0.9 million of the increase. Personnel cost and depreciation
both dropped by $0.1 million in FY 2017. Civic centers expenses decreased by $0.6 million in FY 2017.
Civic centers other services and charges dropped by $0.4 million in FY 2017. Maintenance work being
done in the Civic Center renovation project slowed in FY 2017 causing the reduction.
32
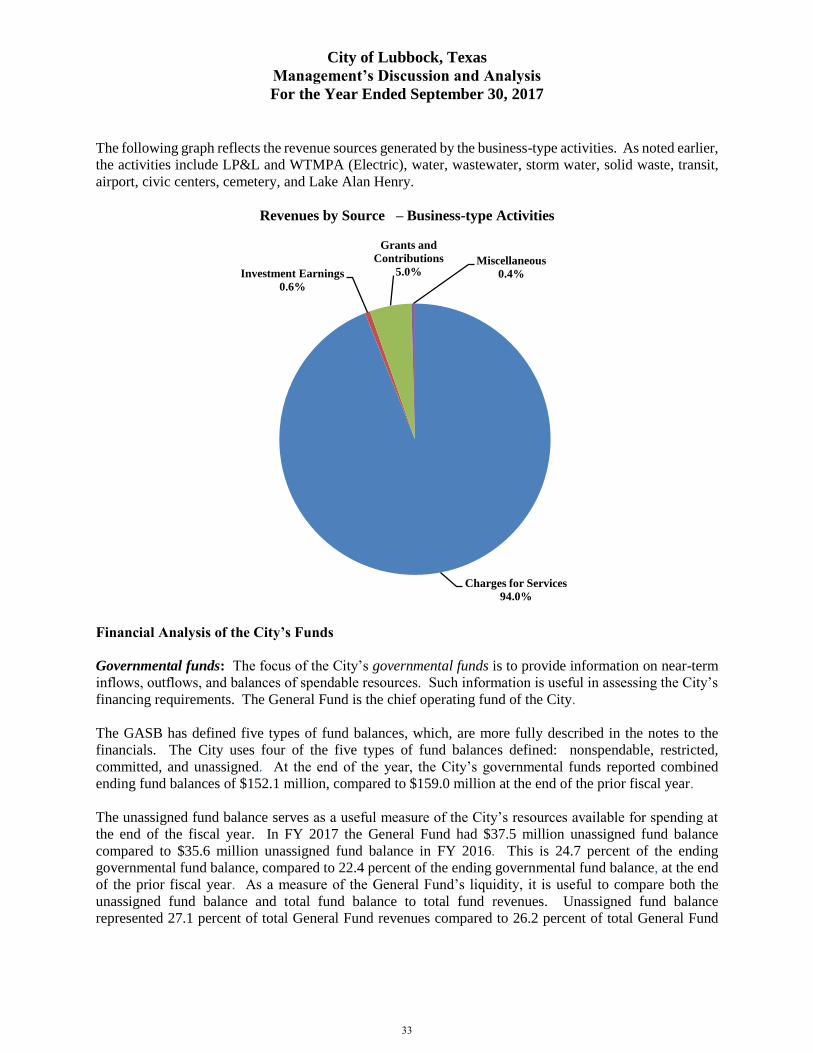
City of Lubbock, Texas
Management’s Discussion and Analysis
For the Year Ended September 30, 2017
The following graph reflects the revenue sources generated by the business-type activities. As noted earlier,
the activities include LP&L and WTMPA (Electric), water, wastewater, storm water, solid waste, transit,
airport, civic centers, cemetery, and Lake Alan Henry.
Revenues by Source – Business-type Activities
Financial Analysis of the City’s Funds
Governmental funds: The focus of the City’s governmental funds is to provide information on near-term
inflows, outflows, and balances of spendable resources. Such information is useful in assessing the City’s
financing requirements. The General Fund is the chief operating fund of the City.
The GASB has defined five types of fund balances, which, are more fully described in the notes to the
financials. The City uses four of the five types of fund balances defined: nonspendable, restricted,
committed, and unassigned. At the end of the year, the City’s governmental funds reported combined
ending fund balances of $152.1 million, compared to $159.0 million at the end of the prior fiscal year.
The unassigned fund balance serves as a useful measure of the City’s resources available for spending at
the end of the fiscal year. In FY 2017 the General Fund had $37.5 million unassigned fund balance
compared to $35.6 million unassigned fund balance in FY 2016. This is 24.7 percent of the ending
governmental fund balance, compared to 22.4 percent of the ending governmental fund balance, at the end
of the prior fiscal year. As a measure of the General Fund’s liquidity, it is useful to compare both the
unassigned fund balance and total fund balance to total fund revenues. Unassigned fund balance
represented 27.1 percent of total General Fund revenues compared to 26.2 percent of total General Fund
Charges for Services
94.0%
Investment Earnings
0.6%
Grants and
Contributions
5.0%Miscellaneous
0.4%
33
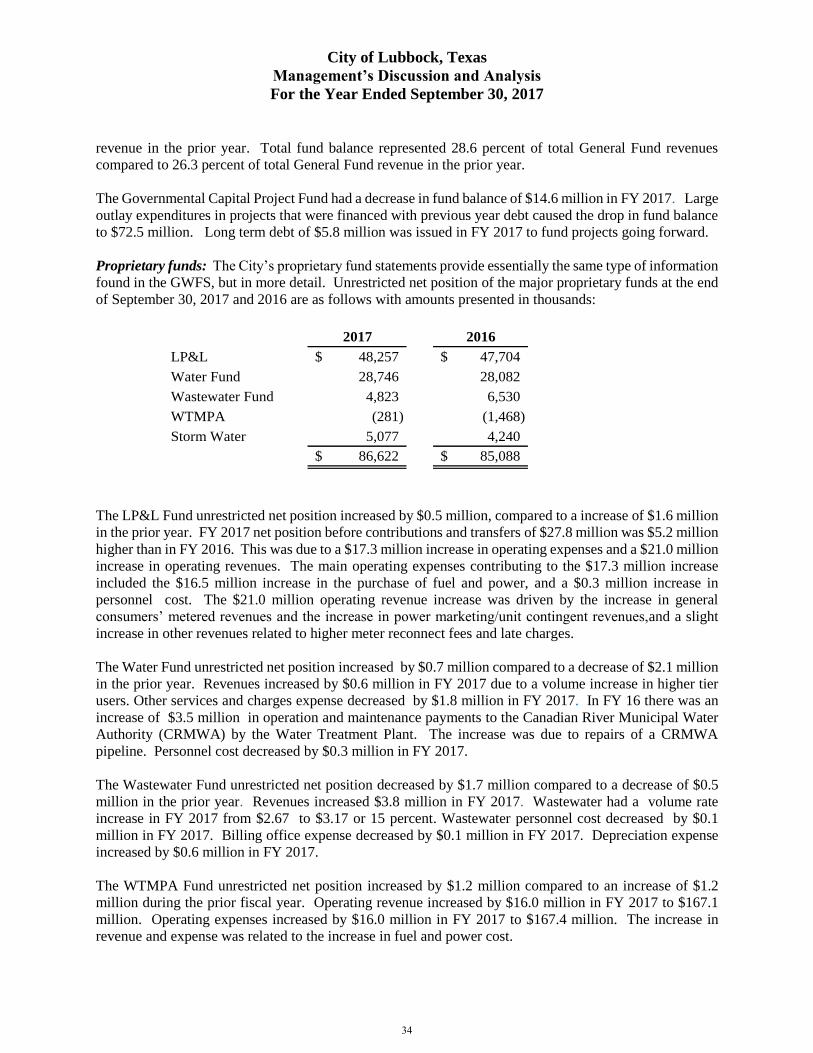
City of Lubbock, Texas
Management’s Discussion and Analysis
For the Year Ended September 30, 2017
revenue in the prior year. Total fund balance represented 28.6 percent of total General Fund revenues
compared to 26.3 percent of total General Fund revenue in the prior year.
The Governmental Capital Project Fund had a decrease in fund balance of $14.6 million in FY 2017. Large
outlay expenditures in projects that were financed with previous year debt caused the drop in fund balance
to $72.5 million. Long term debt of $5.8 million was issued in FY 2017 to fund projects going forward.
Proprietary funds: The City’s proprietary fund statements provide essentially the same type of information
found in the GWFS, but in more detail. Unrestricted net position of the major proprietary funds at the end
of September 30, 2017 and 2016 are as follows with amounts presented in thousands:
2017 2016
LP&L 48,257$ 47,704$
Water Fund 28,746 28,082
Wastewater Fund 4,823 6,530
WTMPA (281) (1,468)
Storm Water 5,077 4,240
86,622$ 85,088$
The LP&L Fund unrestricted net position increased by $0.5 million, compared to a increase of $1.6 million
in the prior year. FY 2017 net position before contributions and transfers of $27.8 million was $5.2 million
higher than in FY 2016. This was due to a $17.3 million increase in operating expenses and a $21.0 million
increase in operating revenues. The main operating expenses contributing to the $17.3 million increase
included the $16.5 million increase in the purchase of fuel and power, and a $0.3 million increase in
personnel cost. The $21.0 million operating revenue increase was driven by the increase in general
consumers’ metered revenues and the increase in power marketing/unit contingent revenues,and a slight
increase in other revenues related to higher meter reconnect fees and late charges.
The Water Fund unrestricted net position increased by $0.7 million compared to a decrease of $2.1 million
in the prior year. Revenues increased by $0.6 million in FY 2017 due to a volume increase in higher tier
users. Other services and charges expense decreased by $1.8 million in FY 2017. In FY 16 there was an
increase of $3.5 million in operation and maintenance payments to the Canadian River Municipal Water
Authority (CRMWA) by the Water Treatment Plant. The increase was due to repairs of a CRMWA
pipeline. Personnel cost decreased by $0.3 million in FY 2017.
The Wastewater Fund unrestricted net position decreased by $1.7 million compared to a decrease of $0.5
million in the prior year. Revenues increased $3.8 million in FY 2017. Wastewater had a volume rate
increase in FY 2017 from $2.67 to $3.17 or 15 percent. Wastewater personnel cost decreased by $0.1
million in FY 2017. Billing office expense decreased by $0.1 million in FY 2017. Depreciation expense
increased by $0.6 million in FY 2017.
The WTMPA Fund unrestricted net position increased by $1.2 million compared to an increase of $1.2
million during the prior fiscal year. Operating revenue increased by $16.0 million in FY 2017 to $167.1
million. Operating expenses increased by $16.0 million in FY 2017 to $167.4 million. The increase in
revenue and expense was related to the increase in fuel and power cost.
34
City of Lubbock, Texas
Management’s Discussion and Analysis
For the Year Ended September 30, 2017
The Storm Water Fund unrestricted net position increased by $0.8 million compared to a $3.4 million
increase in the prior fiscal year. Revenues increased by $0.6 million in comparison to FY 2016. Revenues
increased in FY 2017 because of new construction. Increases in personnel cost and cost attributable to the
Storm Water master plan offset the increase in revenues in FY 2017.
General Fund Budgetary Highlights
The Adopted Operating Budget for the General Fund, including transfers, totaled $169.3 million.
The final adopted budget revenue for FY 2017, including transfers in, totaled $169.3 million. The only
amendment made was to increase Park usage fee revenue by $39,000. Actual revenue was $170.3 million.
Revenue and transfers-in in the General Fund was less than budget by $1.0 million. The City’s sales tax
revenue was $0.7 million over budget. The transfer from LP&L was $0.5 million more than budget due to
the purchased power rate factor being higher than anticipated, which resulted in higher revenues than
projected. Interest earnings were $0.3 million over budget and franchise fees were over budget by $0.2
million. These were offset by fines and forfeitures, which were under budget by $0.5 million. Recoveries
of expenditures were also under budget by $0.2 million.
The original operating expenditure budget for the General Fund, including transfers out, totaled $170.5
million. Several amendments were passed during the year. The significant ones were $3.2 million for the
refunding of the principal portion of the master least debt, $1.4 million to cash fund street maintenance, and
$0.5 million to provide for the costs associated with updating the City’s Comprehensive Land Use Plan.
After supplements, the final General Fund expenditure budget totaled $176.3 million.
The City ended the fiscal year with expenditures and transfers out totaling $172.0 million, $4.3 million less
than budgeted. Expenditures were lower across the board due to compensation and benefits being less than
anticipated due to attrition, mostly from retirements and continued difficulty filling positions. Also, fuel
prices and electric utility costs were lower than anticipated which affected all areas. Public Works was
under budget by $1.2 million due to lower compensation and benefits as stated above and also lower street
maintenance costs. Parks was under budget by $0.6 million due to lower compensation and benefits as
stated above and also due to lower mowing contract expenses. Fire was over by $0.2 million due to terminal
pay and overtime expenditures being greater than anticipated. The Police Department expenditures were
under budget by $1.2 million due to lower fuel costs and the replacement of long term employees with
younger, less experienced staff. Administrative Services expenditures were under budget by $0.9 million
due to lower compensation and benefits associated with vacancy savings along with lower than projected
electric utility, professional services and training/travel costs.
The City budgets on a basis other than Generally Accepted Accounting Principles (GAAP), with the main
difference being that debt proceeds and related capital outlay are not budgeted.
Capital Assets and Debt Administration
Capital assets: The City’s investment in capital assets, net of accumulated depreciation, for its
governmental and business-type activities at September 30, 2017 totaled $1.93 billion, a $73.0 million
increase over the prior fiscal year’s balance of $1.86 billion. The investment in capital assets includes land,
buildings and improvements, equipment, construction in progress, and infrastructure.
35
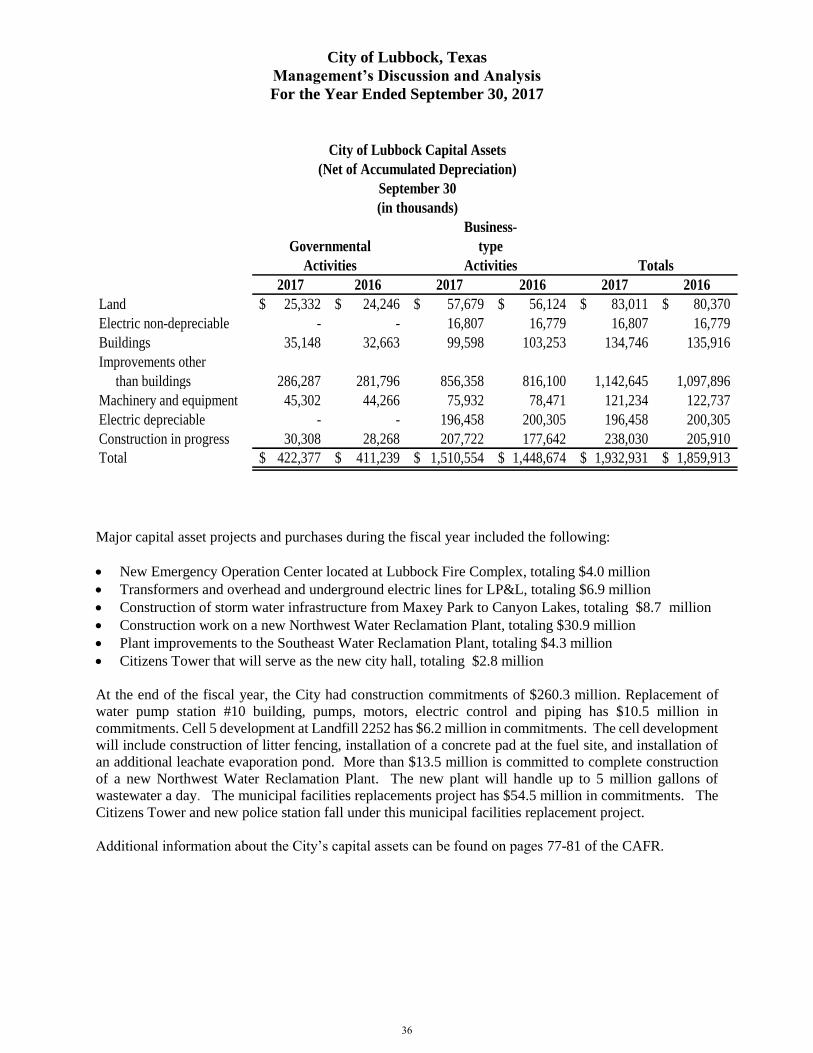
City of Lubbock, Texas
Management’s Discussion and Analysis
For the Year Ended September 30, 2017
2017 2016 2017 2016 2017 2016
Land 25,332$ 24,246$ 57,679$ 56,124$ 83,011$ 80,370$
Electric non-depreciable - - 16,807 16,779 16,807 16,779
Buildings 35,148 32,663 99,598 103,253 134,746 135,916
Improvements other
than buildings 286,287 281,796 856,358 816,100 1,142,645 1,097,896
Machinery and equipment 45,302 44,266 75,932 78,471 121,234 122,737
Electric depreciable - - 196,458 200,305 196,458 200,305
Construction in progress 30,308 28,268 207,722 177,642 238,030 205,910
Total 422,377$ 411,239$ 1,510,554$ 1,448,674$ 1,932,931$ 1,859,913$
Totals
Governmental type
Activities Activities
City of Lubbock Capital Assets
September 30
(in thousands)
Business-
(Net of Accumulated Depreciation)
Major capital asset projects and purchases during the fiscal year included the following:
New Emergency Operation Center located at Lubbock Fire Complex, totaling $4.0 million
Transformers and overhead and underground electric lines for LP&L, totaling $6.9 million
Construction of storm water infrastructure from Maxey Park to Canyon Lakes, totaling $8.7 million
Construction work on a new Northwest Water Reclamation Plant, totaling $30.9 million
Plant improvements to the Southeast Water Reclamation Plant, totaling $4.3 million
Citizens Tower that will serve as the new city hall, totaling $2.8 million
At the end of the fiscal year, the City had construction commitments of $260.3 million. Replacement of
water pump station #10 building, pumps, motors, electric control and piping has $10.5 million in
commitments. Cell 5 development at Landfill 2252 has $6.2 million in commitments. The cell development
will include construction of litter fencing, installation of a concrete pad at the fuel site, and installation of
an additional leachate evaporation pond. More than $13.5 million is committed to complete construction
of a new Northwest Water Reclamation Plant. The new plant will handle up to 5 million gallons of
wastewater a day. The municipal facilities replacements project has $54.5 million in commitments. The
Citizens Tower and new police station fall under this municipal facilities replacement project.
Additional information about the City’s capital assets can be found on pages 77-81 of the CAFR.
36
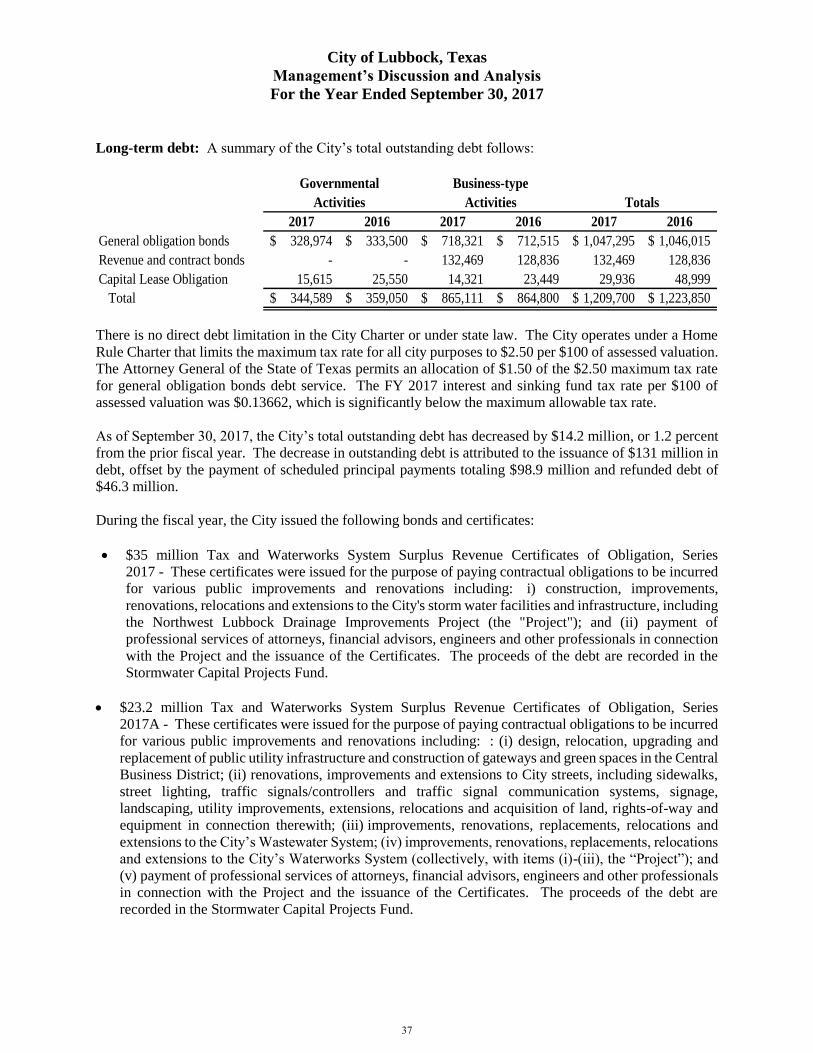
City of Lubbock, Texas
Management’s Discussion and Analysis
For the Year Ended September 30, 2017
Long-term debt: A summary of the City’s total outstanding debt follows:
2017 2016 2017 2016 2017 2016
General obligation bonds 328,974$ 333,500$ 718,321$ 712,515$ 1,047,295$ 1,046,015$
Revenue and contract bonds - - 132,469 128,836 132,469 128,836
Capital Lease Obligation 15,615 25,550 14,321 23,449 29,936 48,999
Total 344,589$ 359,050$ 865,111$ 864,800$ 1,209,700$ 1,223,850$
Totals
Governmental Business-type
Activities Activities
There is no direct debt limitation in the City Charter or under state law. The City operates under a Home
Rule Charter that limits the maximum tax rate for all city purposes to $2.50 per $100 of assessed valuation.
The Attorney General of the State of Texas permits an allocation of $1.50 of the $2.50 maximum tax rate
for general obligation bonds debt service. The FY 2017 interest and sinking fund tax rate per $100 of
assessed valuation was $0.13662, which is significantly below the maximum allowable tax rate.
As of September 30, 2017, the City’s total outstanding debt has decreased by $14.2 million, or 1.2 percent
from the prior fiscal year. The decrease in outstanding debt is attributed to the issuance of $131 million in
debt, offset by the payment of scheduled principal payments totaling $98.9 million and refunded debt of
$46.3 million.
During the fiscal year, the City issued the following bonds and certificates:
$35 million Tax and Waterworks System Surplus Revenue Certificates of Obligation, Series
2017 - These certificates were issued for the purpose of paying contractual obligations to be incurred
for various public improvements and renovations including: i) construction, improvements,
renovations, relocations and extensions to the City's storm water facilities and infrastructure, including
the Northwest Lubbock Drainage Improvements Project (the "Project"); and (ii) payment of
professional services of attorneys, financial advisors, engineers and other professionals in connection
with the Project and the issuance of the Certificates. The proceeds of the debt are recorded in the
Stormwater Capital Projects Fund.
$23.2 million Tax and Waterworks System Surplus Revenue Certificates of Obligation, Series
2017A - These certificates were issued for the purpose of paying contractual obligations to be incurred
for various public improvements and renovations including: : (i) design, relocation, upgrading and
replacement of public utility infrastructure and construction of gateways and green spaces in the Central
Business District; (ii) renovations, improvements and extensions to City streets, including sidewalks,
street lighting, traffic signals/controllers and traffic signal communication systems, signage,
landscaping, utility improvements, extensions, relocations and acquisition of land, rights-of-way and
equipment in connection therewith; (iii) improvements, renovations, replacements, relocations and
extensions to the City’s Wastewater System; (iv) improvements, renovations, replacements, relocations
and extensions to the City’s Waterworks System (collectively, with items (i)-(iii), the “Project”); and
(v) payment of professional services of attorneys, financial advisors, engineers and other professionals
in connection with the Project and the issuance of the Certificates. The proceeds of the debt are
recorded in the Stormwater Capital Projects Fund.
37
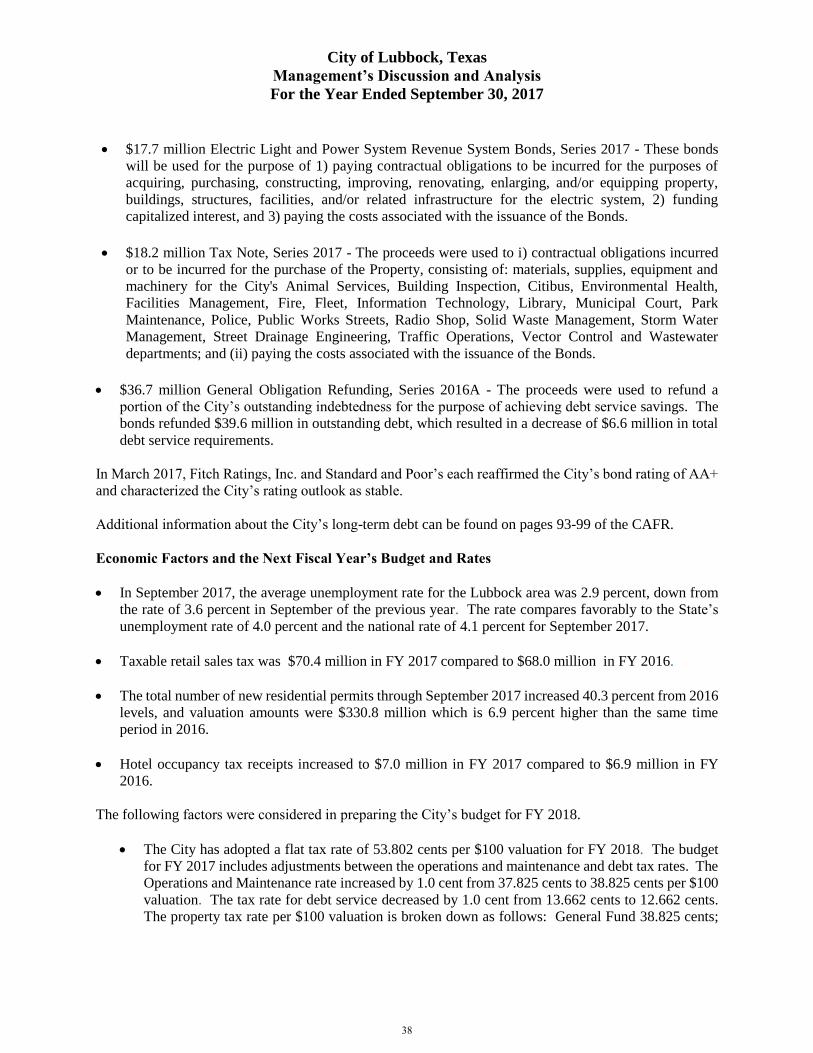
City of Lubbock, Texas
Management’s Discussion and Analysis
For the Year Ended September 30, 2017
$17.7 million Electric Light and Power System Revenue System Bonds, Series 2017 - These bonds
will be used for the purpose of 1) paying contractual obligations to be incurred for the purposes of
acquiring, purchasing, constructing, improving, renovating, enlarging, and/or equipping property,
buildings, structures, facilities, and/or related infrastructure for the electric system, 2) funding
capitalized interest, and 3) paying the costs associated with the issuance of the Bonds.
$18.2 million Tax Note, Series 2017 - The proceeds were used to i) contractual obligations incurred
or to be incurred for the purchase of the Property, consisting of: materials, supplies, equipment and
machinery for the City's Animal Services, Building Inspection, Citibus, Environmental Health,
Facilities Management, Fire, Fleet, Information Technology, Library, Municipal Court, Park
Maintenance, Police, Public Works Streets, Radio Shop, Solid Waste Management, Storm Water
Management, Street Drainage Engineering, Traffic Operations, Vector Control and Wastewater
departments; and (ii) paying the costs associated with the issuance of the Bonds.
$36.7 million General Obligation Refunding, Series 2016A - The proceeds were used to refund a
portion of the City’s outstanding indebtedness for the purpose of achieving debt service savings. The
bonds refunded $39.6 million in outstanding debt, which resulted in a decrease of $6.6 million in total
debt service requirements.
In March 2017, Fitch Ratings, Inc. and Standard and Poor’s each reaffirmed the City’s bond rating of AA+
and characterized the City’s rating outlook as stable.
Additional information about the City’s long-term debt can be found on pages 93-99 of the CAFR.
Economic Factors and the Next Fiscal Year’s Budget and Rates
In September 2017, the average unemployment rate for the Lubbock area was 2.9 percent, down from
the rate of 3.6 percent in September of the previous year. The rate compares favorably to the State’s
unemployment rate of 4.0 percent and the national rate of 4.1 percent for September 2017.
Taxable retail sales tax was $70.4 million in FY 2017 compared to $68.0 million in FY 2016.
The total number of new residential permits through September 2017 increased 40.3 percent from 2016
levels, and valuation amounts were $330.8 million which is 6.9 percent higher than the same time
period in 2016.
Hotel occupancy tax receipts increased to $7.0 million in FY 2017 compared to $6.9 million in FY
2016.
The following factors were considered in preparing the City’s budget for FY 2018.
The City has adopted a flat tax rate of 53.802 cents per $100 valuation for FY 2018. The budget
for FY 2017 includes adjustments between the operations and maintenance and debt tax rates. The
Operations and Maintenance rate increased by 1.0 cent from 37.825 cents to 38.825 cents per $100
valuation. The tax rate for debt service decreased by 1.0 cent from 13.662 cents to 12.662 cents.
The property tax rate per $100 valuation is broken down as follows: General Fund 38.825 cents;
38
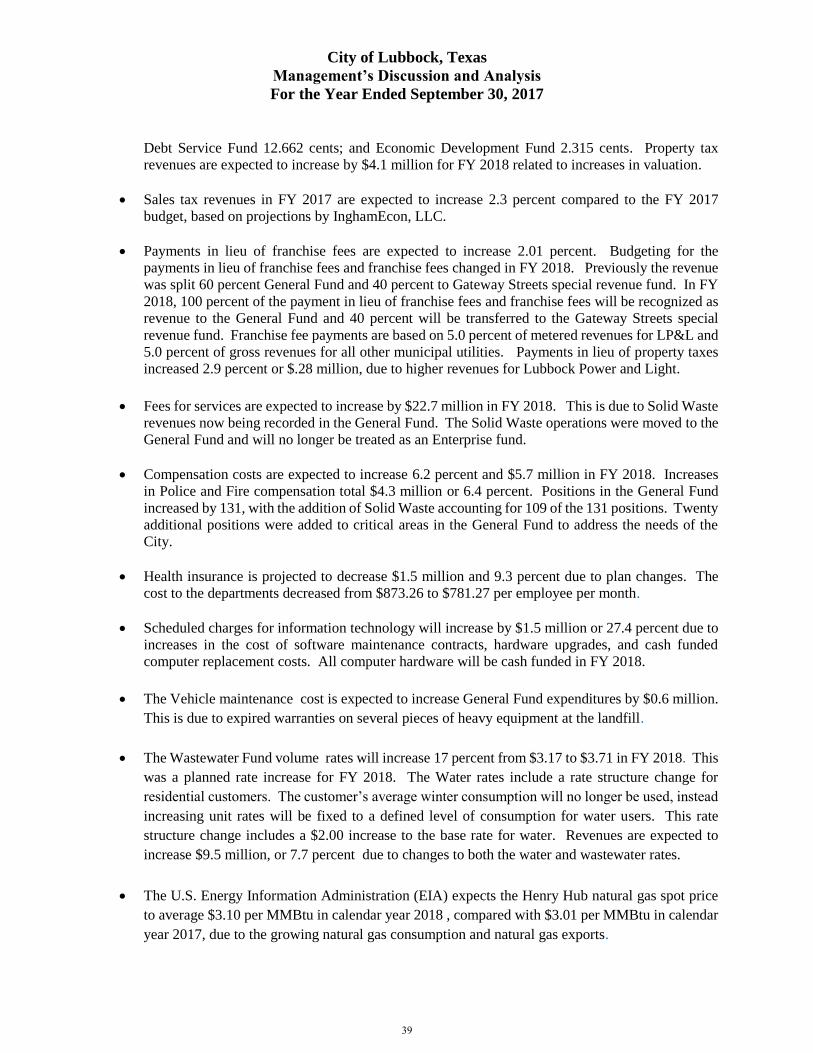
City of Lubbock, Texas
Management’s Discussion and Analysis
For the Year Ended September 30, 2017
Debt Service Fund 12.662 cents; and Economic Development Fund 2.315 cents. Property tax
revenues are expected to increase by $4.1 million for FY 2018 related to increases in valuation.
Sales tax revenues in FY 2017 are expected to increase 2.3 percent compared to the FY 2017
budget, based on projections by InghamEcon, LLC.
Payments in lieu of franchise fees are expected to increase 2.01 percent. Budgeting for the
payments in lieu of franchise fees and franchise fees changed in FY 2018. Previously the revenue
was split 60 percent General Fund and 40 percent to Gateway Streets special revenue fund. In FY
2018, 100 percent of the payment in lieu of franchise fees and franchise fees will be recognized as
revenue to the General Fund and 40 percent will be transferred to the Gateway Streets special
revenue fund. Franchise fee payments are based on 5.0 percent of metered revenues for LP&L and
5.0 percent of gross revenues for all other municipal utilities. Payments in lieu of property taxes
increased 2.9 percent or $.28 million, due to higher revenues for Lubbock Power and Light.
Fees for services are expected to increase by $22.7 million in FY 2018. This is due to Solid Waste
revenues now being recorded in the General Fund. The Solid Waste operations were moved to the
General Fund and will no longer be treated as an Enterprise fund.
Compensation costs are expected to increase 6.2 percent and $5.7 million in FY 2018. Increases
in Police and Fire compensation total $4.3 million or 6.4 percent. Positions in the General Fund
increased by 131, with the addition of Solid Waste accounting for 109 of the 131 positions. Twenty
additional positions were added to critical areas in the General Fund to address the needs of the
City.
Health insurance is projected to decrease $1.5 million and 9.3 percent due to plan changes. The
cost to the departments decreased from $873.26 to $781.27 per employee per month.
Scheduled charges for information technology will increase by $1.5 million or 27.4 percent due to
increases in the cost of software maintenance contracts, hardware upgrades, and cash funded
computer replacement costs. All computer hardware will be cash funded in FY 2018.
The Vehicle maintenance cost is expected to increase General Fund expenditures by $0.6 million.
This is due to expired warranties on several pieces of heavy equipment at the landfill.
The Wastewater Fund volume rates will increase 17 percent from $3.17 to $3.71 in FY 2018. This
was a planned rate increase for FY 2018. The Water rates include a rate structure change for
residential customers. The customer’s average winter consumption will no longer be used, instead
increasing unit rates will be fixed to a defined level of consumption for water users. This rate
structure change includes a $2.00 increase to the base rate for water. Revenues are expected to
increase $9.5 million, or 7.7 percent due to changes to both the water and wastewater rates.
The U.S. Energy Information Administration (EIA) expects the Henry Hub natural gas spot price
to average $3.10 per MMBtu in calendar year 2018 , compared with $3.01 per MMBtu in calendar
year 2017, due to the growing natural gas consumption and natural gas exports.
39
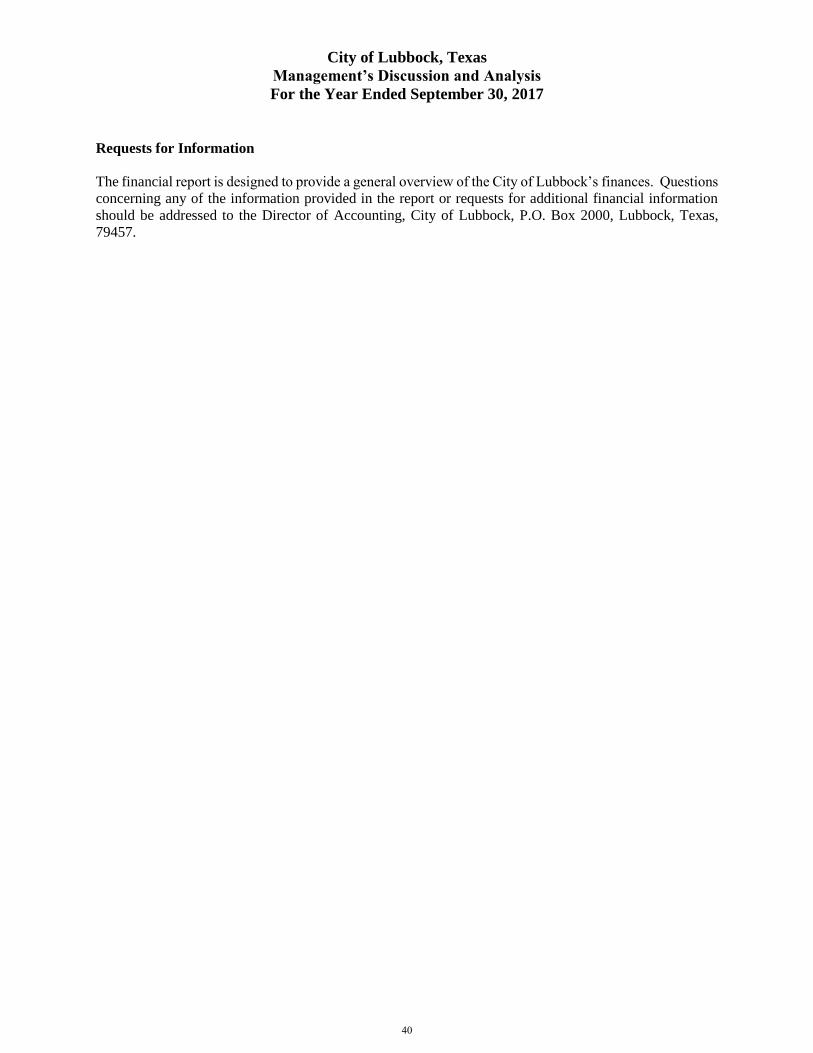
City of Lubbock, Texas
Management’s Discussion and Analysis
For the Year Ended September 30, 2017
Requests for Information
The financial report is designed to provide a general overview of the City of Lubbock’s finances. Questions
concerning any of the information provided in the report or requests for additional financial information
should be addressed to the Director of Accounting, City of Lubbock, P.O. Box 2000, Lubbock, Texas,
79457.
40

Basic Financial Section
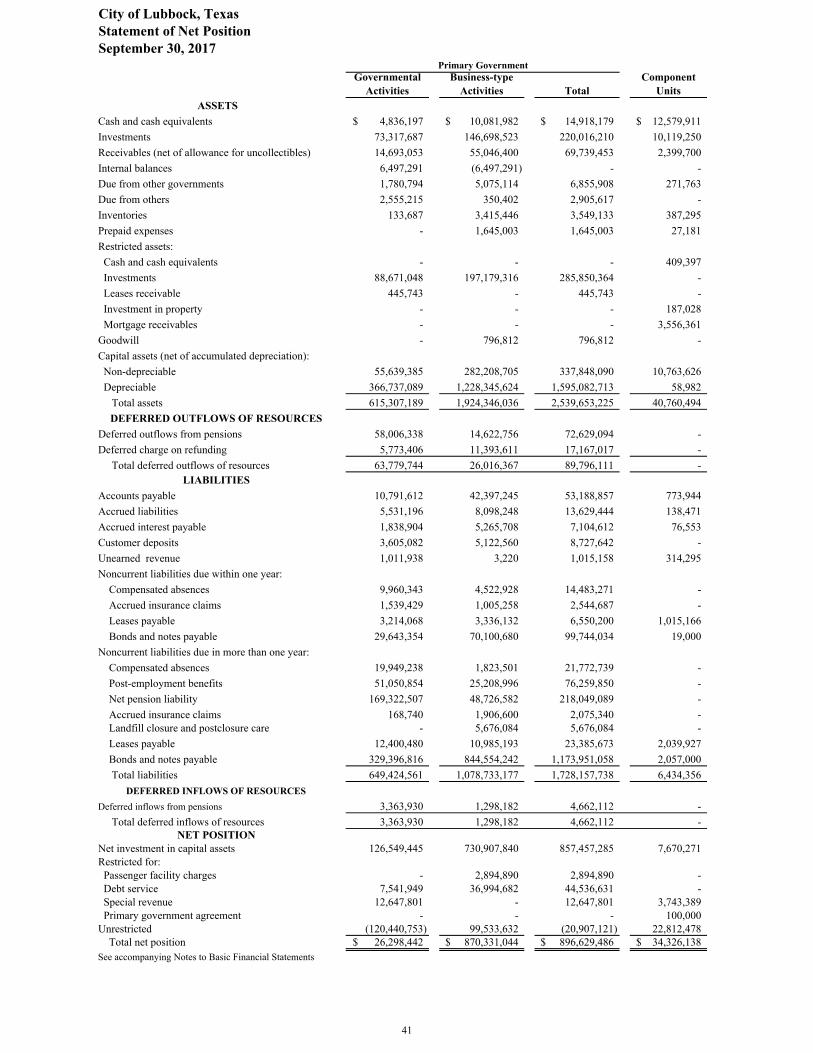
Governmental
ActivitiesBusiness-type
Activities TotalComponent
Units ASSETS
Cash and cash equivalents 4,836,197$ 10,081,982$ 14,918,179$ 12,579,911$ Investments 73,317,687 146,698,523 220,016,210 10,119,250Receivables (net of allowance for uncollectibles) 14,693,053 55,046,400 69,739,453 2,399,700Internal balances 6,497,291 (6,497,291) - -Due from other governments 1,780,794 5,075,114 6,855,908 271,763Due from others 2,555,215 350,402 2,905,617 -Inventories 133,687 3,415,446 3,549,133 387,295Prepaid expenses - 1,645,003 1,645,003 27,181Restricted assets:
Cash and cash equivalents - - - 409,397 Investments 88,671,048 197,179,316 285,850,364 - Leases receivable 445,743 - 445,743 - Investment in property - - - 187,028 Mortgage receivables - - - 3,556,361Goodwill - 796,812 796,812 -Capital assets (net of accumulated depreciation): Non-depreciable 55,639,385 282,208,705 337,848,090 10,763,626 Depreciable 366,737,089 1,228,345,624 1,595,082,713 58,982 Total assets 615,307,189 1,924,346,036 2,539,653,225 40,760,494
DEFERRED OUTFLOWS OF RESOURCES
Deferred outflows from pensions 58,006,338 14,622,756 72,629,094 -Deferred charge on refunding 5,773,406 11,393,611 17,167,017 - Total deferred outflows of resources 63,779,744 26,016,367 89,796,111 -
LIABILITIES
Accounts payable 10,791,612 42,397,245 53,188,857 773,944Accrued liabilities 5,531,196 8,098,248 13,629,444 138,471Accrued interest payable 1,838,904 5,265,708 7,104,612 76,553Customer deposits 3,605,082 5,122,560 8,727,642 -Unearned revenue 1,011,938 3,220 1,015,158 314,295Noncurrent liabilities due within one year:
Compensated absences 9,960,343 4,522,928 14,483,271 - Accrued insurance claims 1,539,429 1,005,258 2,544,687 - Leases payable 3,214,068 3,336,132 6,550,200 1,015,166 Bonds and notes payable 29,643,354 70,100,680 99,744,034 19,000Noncurrent liabilities due in more than one year: Compensated absences 19,949,238 1,823,501 21,772,739 - Post-employment benefits 51,050,854 25,208,996 76,259,850 - Net pension liability 169,322,507 48,726,582 218,049,089 - Accrued insurance claims 168,740 1,906,600 2,075,340 - Landfill closure and postclosure care - 5,676,084 5,676,084 - Leases payable 12,400,480 10,985,193 23,385,673 2,039,927 Bonds and notes payable 329,396,816 844,554,242 1,173,951,058 2,057,000 Total liabilities 649,424,561 1,078,733,177 1,728,157,738 6,434,356
DEFERRED INFLOWS OF RESOURCES
Deferred inflows from pensions 3,363,930 1,298,182 4,662,112 - Total deferred inflows of resources 3,363,930 1,298,182 4,662,112 -
NET POSITIONNet investment in capital assets 126,549,445 730,907,840 857,457,285 7,670,271Restricted for: Passenger facility charges - 2,894,890 2,894,890 - Debt service 7,541,949 36,994,682 44,536,631 - Special revenue 12,647,801 - 12,647,801 3,743,389 Primary government agreement - - - 100,000Unrestricted (120,440,753) 99,533,632 (20,907,121) 22,812,478 Total net position 26,298,442$ 870,331,044$ 896,629,486$ 34,326,138$ See accompanying Notes to Basic Financial Statements
City of Lubbock, TexasStatement of Net PositionSeptember 30, 2017
Primary Government
41
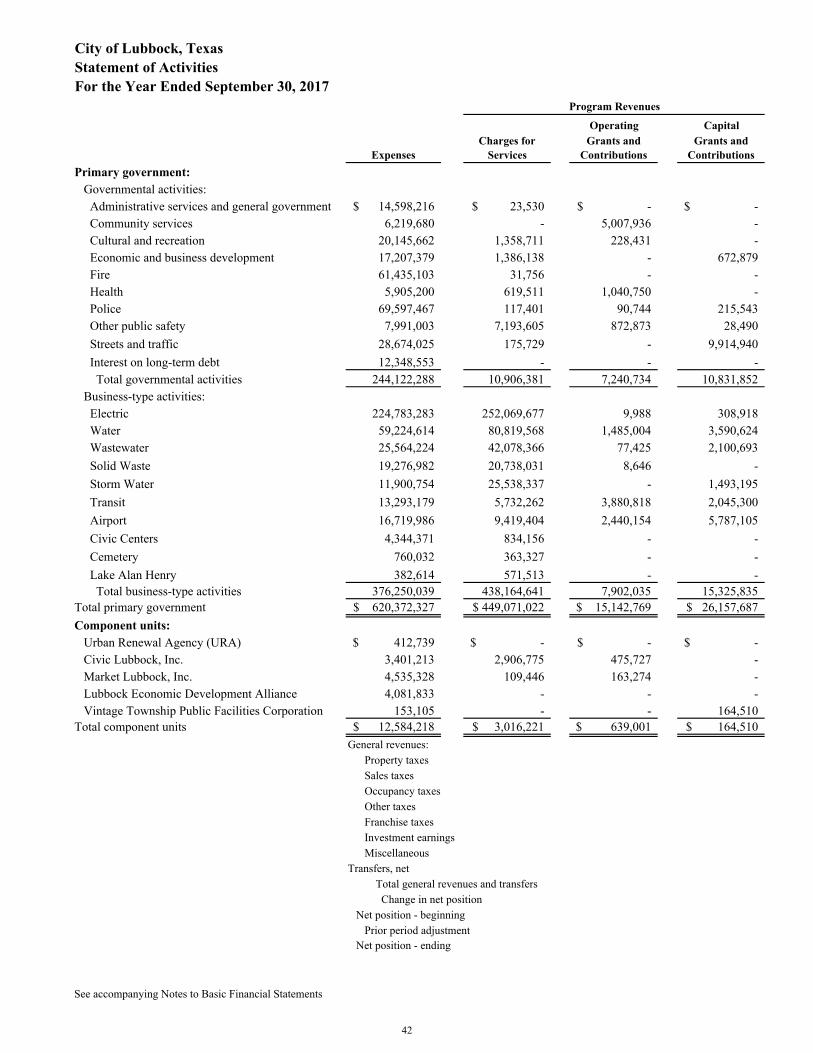
Operating Capital
ExpensesCharges for
ServicesGrants and
ContributionsGrants and
Contributions
Primary government: Governmental activities: Administrative services and general government 14,598,216$ 23,530$ -$ -$ Community services 6,219,680 - 5,007,936 - Cultural and recreation 20,145,662 1,358,711 228,431 - Economic and business development 17,207,379 1,386,138 - 672,879 Fire 61,435,103 31,756 - - Health 5,905,200 619,511 1,040,750 - Police 69,597,467 117,401 90,744 215,543 Other public safety 7,991,003 7,193,605 872,873 28,490 Streets and traffic 28,674,025 175,729 - 9,914,940 Interest on long-term debt 12,348,553 - - - Total governmental activities 244,122,288 10,906,381 7,240,734 10,831,852 Business-type activities: Electric 224,783,283 252,069,677 9,988 308,918 Water 59,224,614 80,819,568 1,485,004 3,590,624 Wastewater 25,564,224 42,078,366 77,425 2,100,693 Solid Waste 19,276,982 20,738,031 8,646 - Storm Water 11,900,754 25,538,337 - 1,493,195 Transit 13,293,179 5,732,262 3,880,818 2,045,300 Airport 16,719,986 9,419,404 2,440,154 5,787,105 Civic Centers 4,344,371 834,156 - - Cemetery 760,032 363,327 - - Lake Alan Henry 382,614 571,513 - - Total business-type activities 376,250,039 438,164,641 7,902,035 15,325,835Total primary government 620,372,327$ 449,071,022$ 15,142,769$ 26,157,687$ Component units: Urban Renewal Agency (URA) 412,739$ -$ -$ -$ Civic Lubbock, Inc. 3,401,213 2,906,775 475,727 - Market Lubbock, Inc. 4,535,328 109,446 163,274 - Lubbock Economic Development Alliance 4,081,833 - - - Vintage Township Public Facilities Corporation 153,105 - - 164,510Total component units 12,584,218$ 3,016,221$ 639,001$ 164,510$
See accompanying Notes to Basic Financial Statements
Program Revenues
Net position - ending
Change in net position Net position - beginning Prior period adjustment
City of Lubbock, TexasStatement of ActivitiesFor the Year Ended September 30, 2017
Transfers, net Total general revenues and transfers
General revenues: Property taxes Sales taxes Occupancy taxes Other taxes Franchise taxes Investment earnings Miscellaneous
42
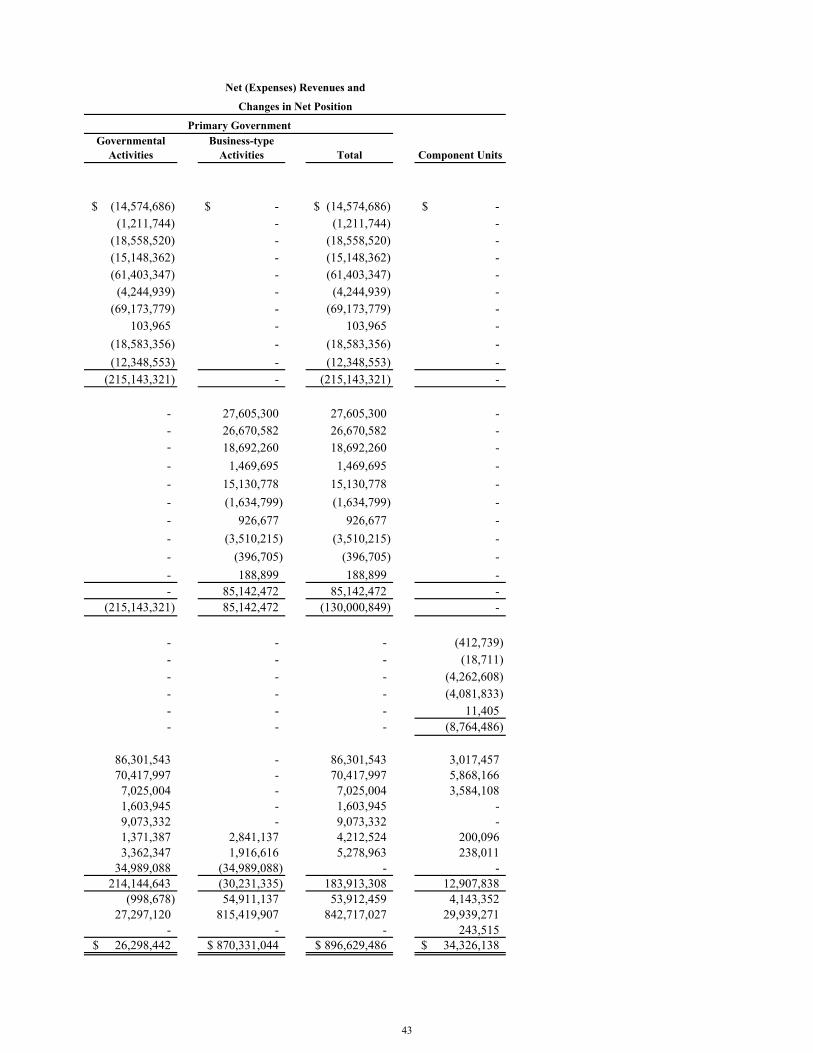
Governmental Activities
Business-type Activities Total Component Units
(14,574,686)$ -$ (14,574,686)$ -$ (1,211,744) - (1,211,744) -
(18,558,520) - (18,558,520) -(15,148,362) - (15,148,362) -(61,403,347) - (61,403,347) -
(4,244,939) - (4,244,939) -(69,173,779) - (69,173,779) -
103,965 - 103,965 -(18,583,356) - (18,583,356) -(12,348,553) - (12,348,553) -
(215,143,321) - (215,143,321) -
- 27,605,300 27,605,300 -- 26,670,582 26,670,582 -- 18,692,260 18,692,260 -- 1,469,695 1,469,695 -- 15,130,778 15,130,778 -- (1,634,799) (1,634,799) -- 926,677 926,677 -- (3,510,215) (3,510,215) -- (396,705) (396,705) -- 188,899 188,899 -- 85,142,472 85,142,472 -
(215,143,321) 85,142,472 (130,000,849) -
- - - (412,739)- - - (18,711)- - - (4,262,608)- - - (4,081,833)- - - 11,405- - - (8,764,486)
86,301,543 - 86,301,543 3,017,45770,417,997 - 70,417,997 5,868,1667,025,004 - 7,025,004 3,584,1081,603,945 - 1,603,945 -9,073,332 - 9,073,332 -1,371,387 2,841,137 4,212,524 200,0963,362,347 1,916,616 5,278,963 238,011
34,989,088 (34,989,088) - -214,144,643 (30,231,335) 183,913,308 12,907,838
(998,678) 54,911,137 53,912,459 4,143,35227,297,120 815,419,907 842,717,027 29,939,271
- - - 243,51526,298,442$ 870,331,044$ 896,629,486$ 34,326,138$
Net (Expenses) Revenues and
Changes in Net Position
Primary Government
43
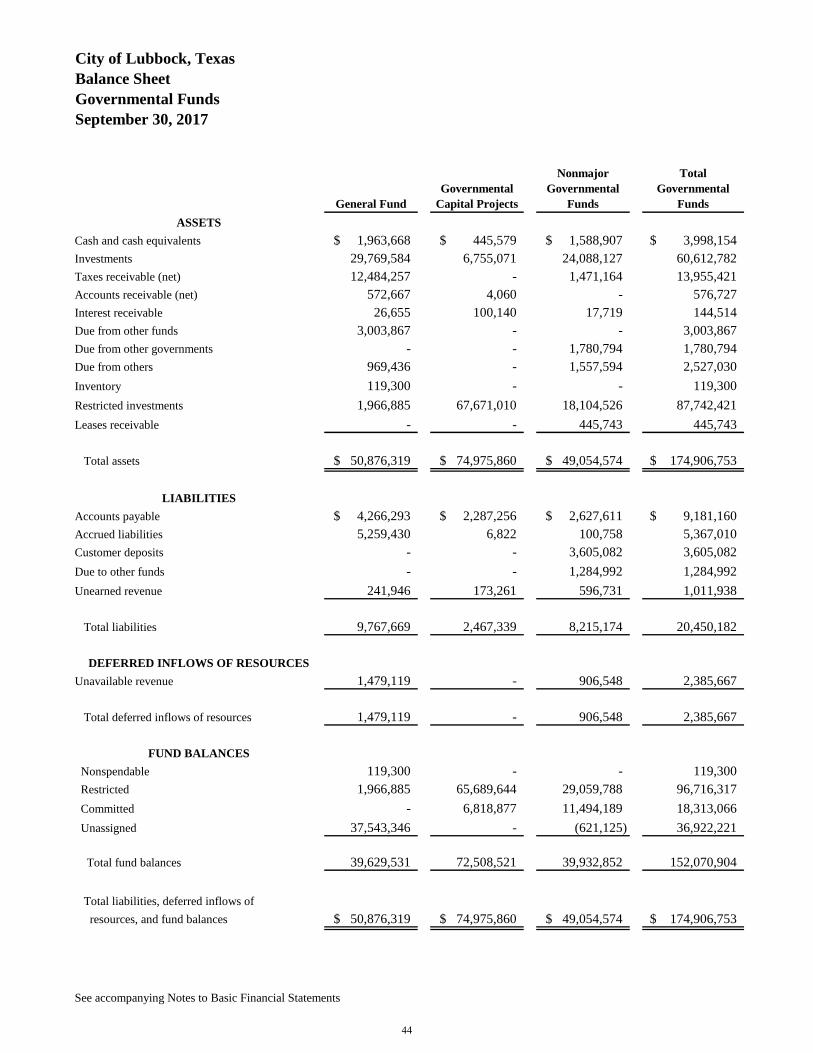
General Fund
Governmental
Capital Projects
Nonmajor
Governmental
Funds
Total
Governmental
Funds
ASSETS
Cash and cash equivalents 1,963,668$ 445,579$ 1,588,907$ 3,998,154$
Investments 29,769,584 6,755,071 24,088,127 60,612,782
Taxes receivable (net) 12,484,257 - 1,471,164 13,955,421
Accounts receivable (net) 572,667 4,060 - 576,727
Interest receivable 26,655 100,140 17,719 144,514
Due from other funds 3,003,867 - - 3,003,867
Due from other governments - - 1,780,794 1,780,794
Due from others 969,436 - 1,557,594 2,527,030
Inventory 119,300 - - 119,300
Restricted investments 1,966,885 67,671,010 18,104,526 87,742,421
Leases receivable - - 445,743 445,743
Total assets 50,876,319$ 74,975,860$ 49,054,574$ 174,906,753$
LIABILITIES
Accounts payable 4,266,293$ 2,287,256$ 2,627,611$ 9,181,160$
Accrued liabilities 5,259,430 6,822 100,758 5,367,010
Customer deposits - - 3,605,082 3,605,082
Due to other funds - - 1,284,992 1,284,992
Unearned revenue 241,946 173,261 596,731 1,011,938
Total liabilities 9,767,669 2,467,339 8,215,174 20,450,182
DEFERRED INFLOWS OF RESOURCES
Unavailable revenue 1,479,119 - 906,548 2,385,667
Total deferred inflows of resources 1,479,119 - 906,548 2,385,667
FUND BALANCES
Nonspendable 119,300 - - 119,300
Restricted 1,966,885 65,689,644 29,059,788 96,716,317
Committed - 6,818,877 11,494,189 18,313,066
Unassigned 37,543,346 - (621,125) 36,922,221
Total fund balances 39,629,531 72,508,521 39,932,852 152,070,904
Total liabilities, deferred inflows of
resources, and fund balances 50,876,319$ 74,975,860$ 49,054,574$ 174,906,753$
See accompanying Notes to Basic Financial Statements
City of Lubbock, Texas
Balance Sheet
Governmental Funds
September 30, 2017
44
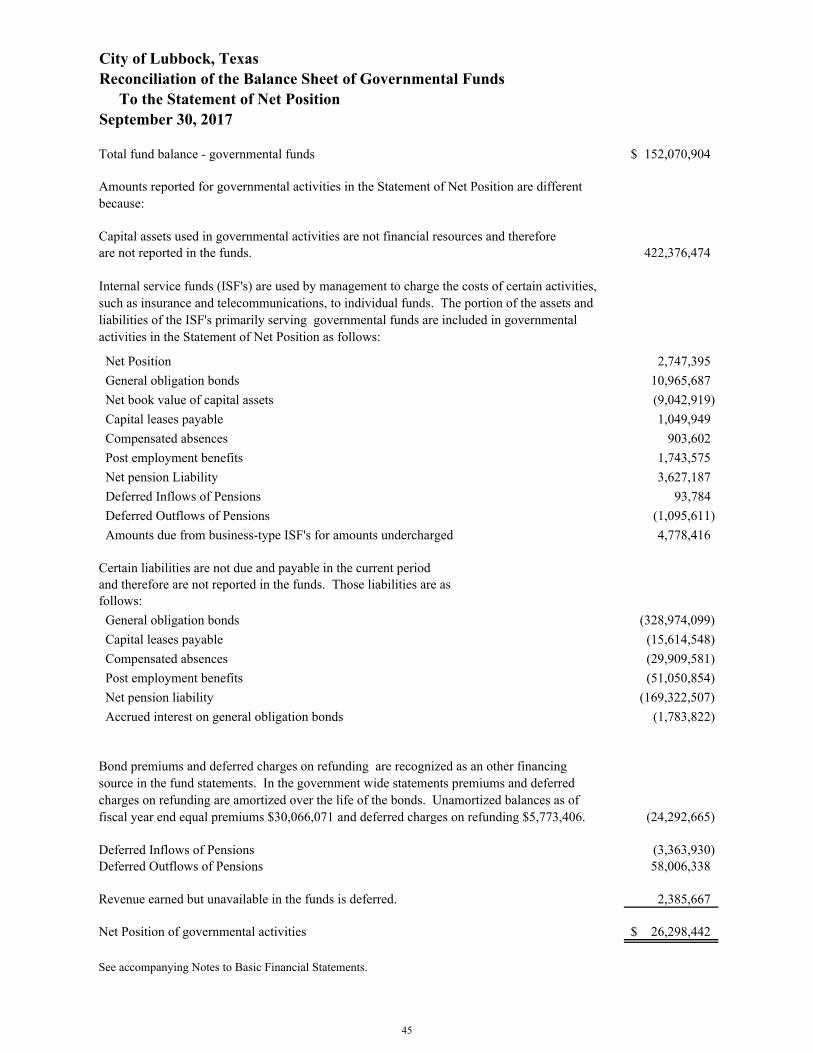
Total fund balance - governmental funds 152,070,904$
Amounts reported for governmental activities in the Statement of Net Position are different because:
Capital assets used in governmental activities are not financial resources and thereforeare not reported in the funds. 422,376,474
Internal service funds (ISF's) are used by management to charge the costs of certain activities, such as insurance and telecommunications, to individual funds. The portion of the assets and liabilities of the ISF's primarily serving governmental funds are included in governmental activities in the Statement of Net Position as follows:
Net Position 2,747,395 General obligation bonds 10,965,687 Net book value of capital assets (9,042,919) Capital leases payable 1,049,949 Compensated absences 903,602 Post employment benefits 1,743,575 Net pension Liability 3,627,187 Deferred Inflows of Pensions 93,784 Deferred Outflows of Pensions (1,095,611) Amounts due from business-type ISF's for amounts undercharged 4,778,416
Certain liabilities are not due and payable in the current periodand therefore are not reported in the funds. Those liabilities are asfollows: General obligation bonds (328,974,099) Capital leases payable (15,614,548) Compensated absences (29,909,581) Post employment benefits (51,050,854) Net pension liability (169,322,507) Accrued interest on general obligation bonds (1,783,822)
Bond premiums and deferred charges on refunding are recognized as an other financing source in the fund statements. In the government wide statements premiums and deferred charges on refunding are amortized over the life of the bonds. Unamortized balances as of fiscal year end equal premiums $30,066,071 and deferred charges on refunding $5,773,406. (24,292,665)
Deferred Inflows of Pensions (3,363,930) Deferred Outflows of Pensions 58,006,338
Revenue earned but unavailable in the funds is deferred. 2,385,667
Net Position of governmental activities 26,298,442$
See accompanying Notes to Basic Financial Statements.
City of Lubbock, TexasReconciliation of the Balance Sheet of Governmental Funds To the Statement of Net PositionSeptember 30, 2017
45
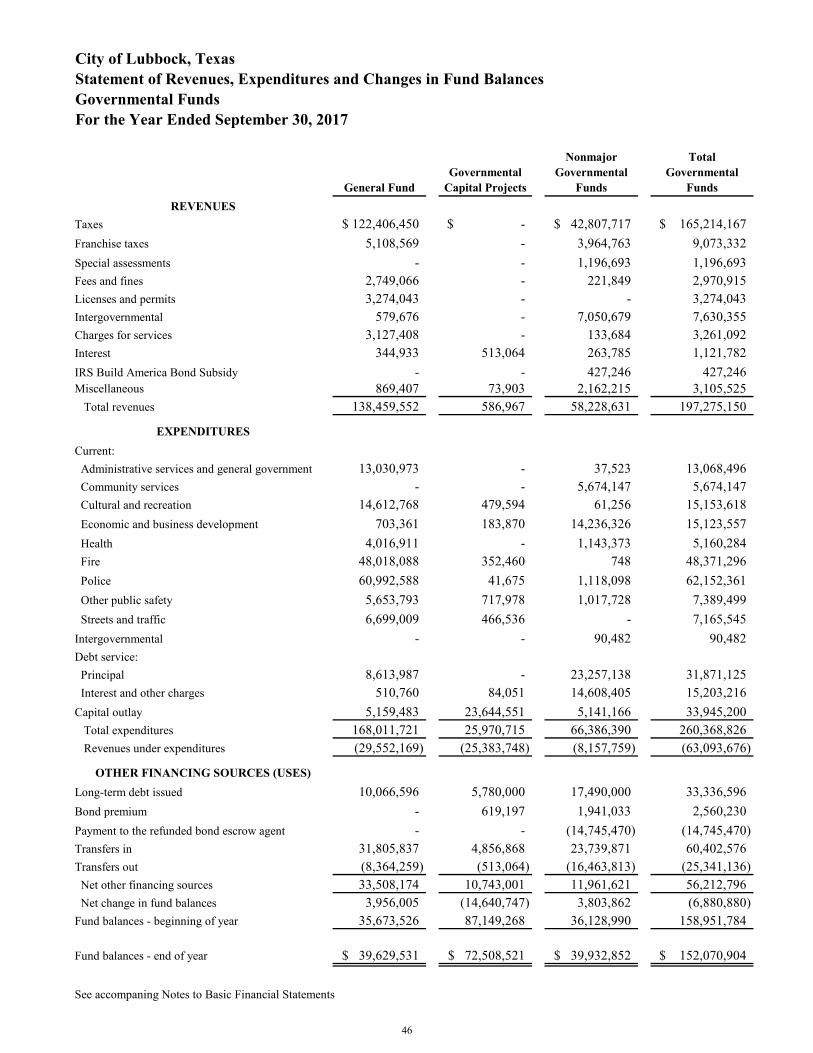
General FundGovernmental
Capital Projects
Nonmajor Governmental
Funds
Total Governmental
Funds
REVENUES
Taxes 122,406,450$ -$ 42,807,717$ 165,214,167$ Franchise taxes 5,108,569 - 3,964,763 9,073,332Special assessments - - 1,196,693 1,196,693Fees and fines 2,749,066 - 221,849 2,970,915Licenses and permits 3,274,043 - - 3,274,043Intergovernmental 579,676 - 7,050,679 7,630,355Charges for services 3,127,408 - 133,684 3,261,092Interest 344,933 513,064 263,785 1,121,782IRS Build America Bond Subsidy - - 427,246 427,246Miscellaneous 869,407 73,903 2,162,215 3,105,525 Total revenues 138,459,552 586,967 58,228,631 197,275,150
EXPENDITURES
Current: Administrative services and general government 13,030,973 - 37,523 13,068,496 Community services - - 5,674,147 5,674,147 Cultural and recreation 14,612,768 479,594 61,256 15,153,618 Economic and business development 703,361 183,870 14,236,326 15,123,557 Health 4,016,911 - 1,143,373 5,160,284 Fire 48,018,088 352,460 748 48,371,296 Police 60,992,588 41,675 1,118,098 62,152,361 Other public safety 5,653,793 717,978 1,017,728 7,389,499 Streets and traffic 6,699,009 466,536 - 7,165,545Intergovernmental - - 90,482 90,482Debt service: Principal 8,613,987 - 23,257,138 31,871,125 Interest and other charges 510,760 84,051 14,608,405 15,203,216Capital outlay 5,159,483 23,644,551 5,141,166 33,945,200 Total expenditures 168,011,721 25,970,715 66,386,390 260,368,826 Revenues under expenditures (29,552,169) (25,383,748) (8,157,759) (63,093,676)
OTHER FINANCING SOURCES (USES)
Long-term debt issued 10,066,596 5,780,000 17,490,000 33,336,596Bond premium - 619,197 1,941,033 2,560,230Payment to the refunded bond escrow agent - - (14,745,470) (14,745,470)Transfers in 31,805,837 4,856,868 23,739,871 60,402,576Transfers out (8,364,259) (513,064) (16,463,813) (25,341,136) Net other financing sources 33,508,174 10,743,001 11,961,621 56,212,796 Net change in fund balances 3,956,005 (14,640,747) 3,803,862 (6,880,880)Fund balances - beginning of year 35,673,526 87,149,268 36,128,990 158,951,784
Fund balances - end of year 39,629,531$ 72,508,521$ 39,932,852$ 152,070,904$
See accompaning Notes to Basic Financial Statements
City of Lubbock, TexasStatement of Revenues, Expenditures and Changes in Fund BalancesGovernmental FundsFor the Year Ended September 30, 2017
46
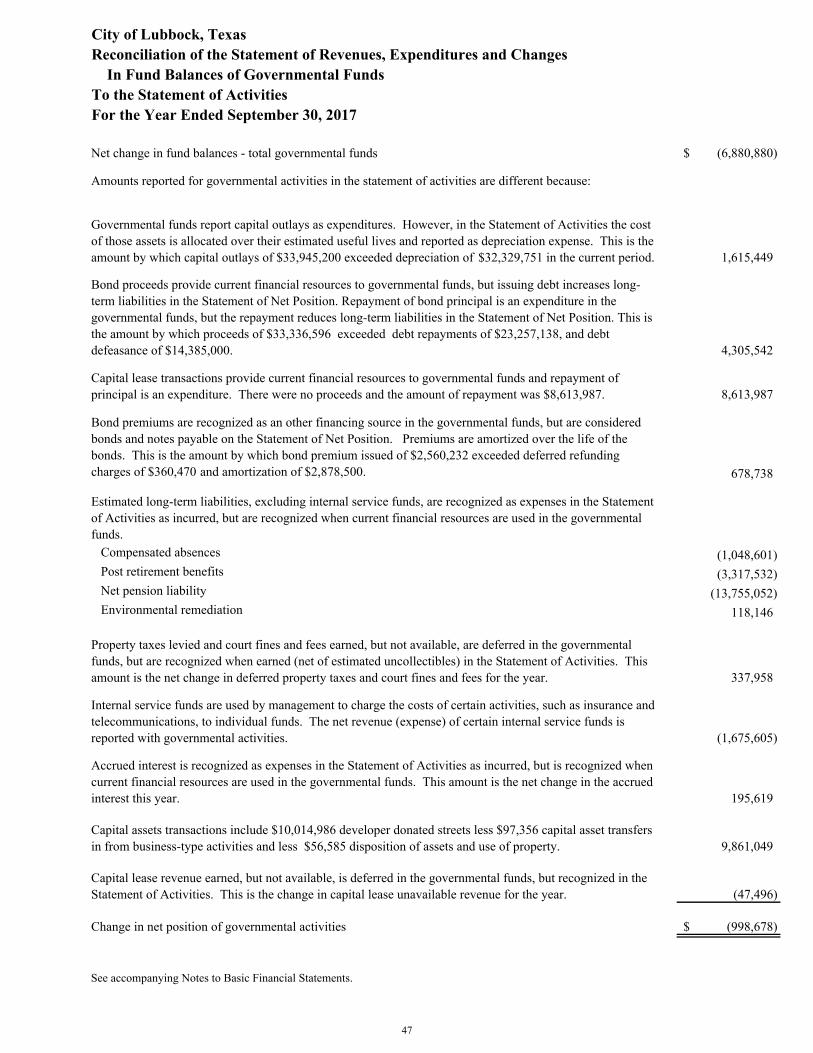
Net change in fund balances - total governmental funds (6,880,880)$
Amounts reported for governmental activities in the statement of activities are different because:
Governmental funds report capital outlays as expenditures. However, in the Statement of Activities the cost of those assets is allocated over their estimated useful lives and reported as depreciation expense. This is the amount by which capital outlays of $33,945,200 exceeded depreciation of $32,329,751 in the current period. 1,615,449
Bond proceeds provide current financial resources to governmental funds, but issuing debt increases long-term liabilities in the Statement of Net Position. Repayment of bond principal is an expenditure in the governmental funds, but the repayment reduces long-term liabilities in the Statement of Net Position. This is the amount by which proceeds of $33,336,596 exceeded debt repayments of $23,257,138, and debt defeasance of $14,385,000. 4,305,542
Capital lease transactions provide current financial resources to governmental funds and repayment of principal is an expenditure. There were no proceeds and the amount of repayment was $8,613,987. 8,613,987
Bond premiums are recognized as an other financing source in the governmental funds, but are considered bonds and notes payable on the Statement of Net Position. Premiums are amortized over the life of the bonds. This is the amount by which bond premium issued of $2,560,232 exceeded deferred refunding charges of $360,470 and amortization of $2,878,500. 678,738
Estimated long-term liabilities, excluding internal service funds, are recognized as expenses in the Statement of Activities as incurred, but are recognized when current financial resources are used in the governmental funds. Compensated absences (1,048,601) Post retirement benefits (3,317,532) Net pension liability (13,755,052) Environmental remediation 118,146
Property taxes levied and court fines and fees earned, but not available, are deferred in the governmental funds, but are recognized when earned (net of estimated uncollectibles) in the Statement of Activities. This amount is the net change in deferred property taxes and court fines and fees for the year. 337,958
Internal service funds are used by management to charge the costs of certain activities, such as insurance and telecommunications, to individual funds. The net revenue (expense) of certain internal service funds is reported with governmental activities. (1,675,605)
Accrued interest is recognized as expenses in the Statement of Activities as incurred, but is recognized when current financial resources are used in the governmental funds. This amount is the net change in the accrued interest this year. 195,619
Capital assets transactions include $10,014,986 developer donated streets less $97,356 capital asset transfers in from business-type activities and less $56,585 disposition of assets and use of property. 9,861,049
Capital lease revenue earned, but not available, is deferred in the governmental funds, but recognized in the Statement of Activities. This is the change in capital lease unavailable revenue for the year. (47,496)
Change in net position of governmental activities (998,678)$
See accompanying Notes to Basic Financial Statements.
City of Lubbock, TexasReconciliation of the Statement of Revenues, Expenditures and Changes
To the Statement of Activities For the Year Ended September 30, 2017
In Fund Balances of Governmental Funds
47
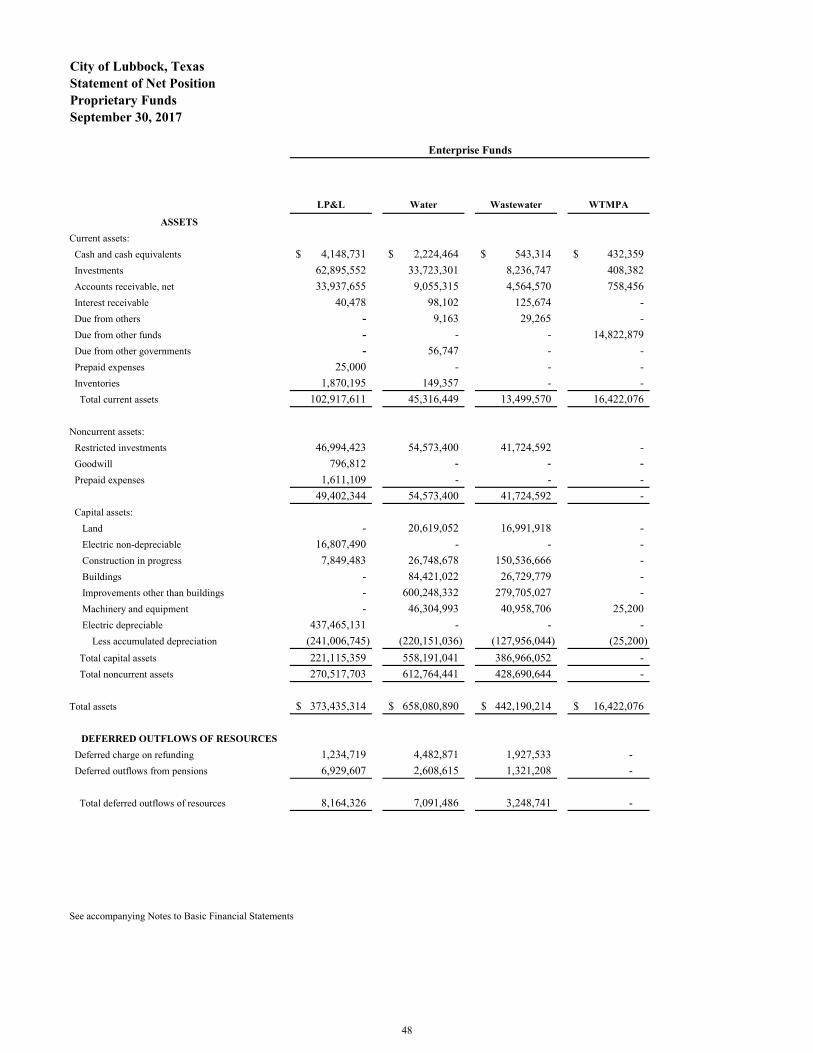
LP&L Water Wastewater WTMPA
ASSETS
Current assets: Cash and cash equivalents 4,148,731$ 2,224,464$ 543,314$ 432,359$ Investments 62,895,552 33,723,301 8,236,747 408,382 Accounts receivable, net 33,937,655 9,055,315 4,564,570 758,456 Interest receivable 40,478 98,102 125,674 - Due from others - 9,163 29,265 - Due from other funds - - - 14,822,879 Due from other governments - 56,747 - - Prepaid expenses 25,000 - - - Inventories 1,870,195 149,357 - - Total current assets 102,917,611 45,316,449 13,499,570 16,422,076
Noncurrent assets: Restricted investments 46,994,423 54,573,400 41,724,592 - Goodwill 796,812 - - -
Prepaid expenses 1,611,109 - - - 49,402,344 54,573,400 41,724,592 - Capital assets: Land - 20,619,052 16,991,918 - Electric non-depreciable 16,807,490 - - - Construction in progress 7,849,483 26,748,678 150,536,666 - Buildings - 84,421,022 26,729,779 - Improvements other than buildings - 600,248,332 279,705,027 - Machinery and equipment - 46,304,993 40,958,706 25,200 Electric depreciable 437,465,131 - - - Less accumulated depreciation (241,006,745) (220,151,036) (127,956,044) (25,200) Total capital assets 221,115,359 558,191,041 386,966,052 - Total noncurrent assets 270,517,703 612,764,441 428,690,644 -
Total assets 373,435,314$ 658,080,890$ 442,190,214$ 16,422,076$
DEFERRED OUTFLOWS OF RESOURCES
Deferred charge on refunding 1,234,719 4,482,871 1,927,533 - Deferred outflows from pensions 6,929,607 2,608,615 1,321,208 -
Total deferred outflows of resources 8,164,326 7,091,486 3,248,741 -
See accompanying Notes to Basic Financial Statements
Enterprise Funds
City of Lubbock, TexasStatement of Net Position
September 30, 2017Proprietary Funds
48
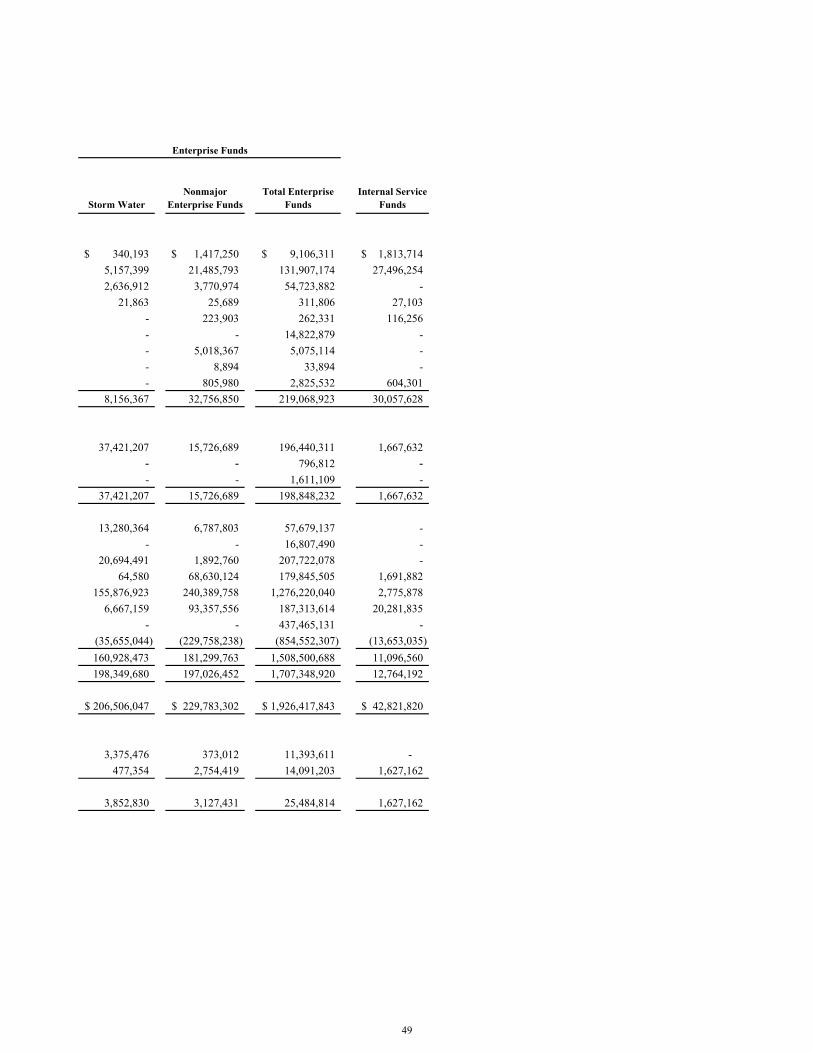
Storm WaterNonmajor
Enterprise FundsTotal Enterprise
FundsInternal Service
Funds
340,193$ 1,417,250$ 9,106,311$ 1,813,714$ 5,157,399 21,485,793 131,907,174 27,496,2542,636,912 3,770,974 54,723,882 -
21,863 25,689 311,806 27,103- 223,903 262,331 116,256- - 14,822,879 -- 5,018,367 5,075,114 -- 8,894 33,894 -- 805,980 2,825,532 604,301
8,156,367 32,756,850 219,068,923 30,057,628
37,421,207 15,726,689 196,440,311 1,667,632- - 796,812 -
- - 1,611,109 -37,421,207 15,726,689 198,848,232 1,667,632
13,280,364 6,787,803 57,679,137 -- - 16,807,490 -
20,694,491 1,892,760 207,722,078 -64,580 68,630,124 179,845,505 1,691,882
155,876,923 240,389,758 1,276,220,040 2,775,8786,667,159 93,357,556 187,313,614 20,281,835
- - 437,465,131 -(35,655,044) (229,758,238) (854,552,307) (13,653,035)160,928,473 181,299,763 1,508,500,688 11,096,560198,349,680 197,026,452 1,707,348,920 12,764,192
206,506,047$ 229,783,302$ 1,926,417,843$ 42,821,820$
3,375,476 373,012 11,393,611 - 477,354 2,754,419 14,091,203 1,627,162
3,852,830 3,127,431 25,484,814 1,627,162
Enterprise Funds
49
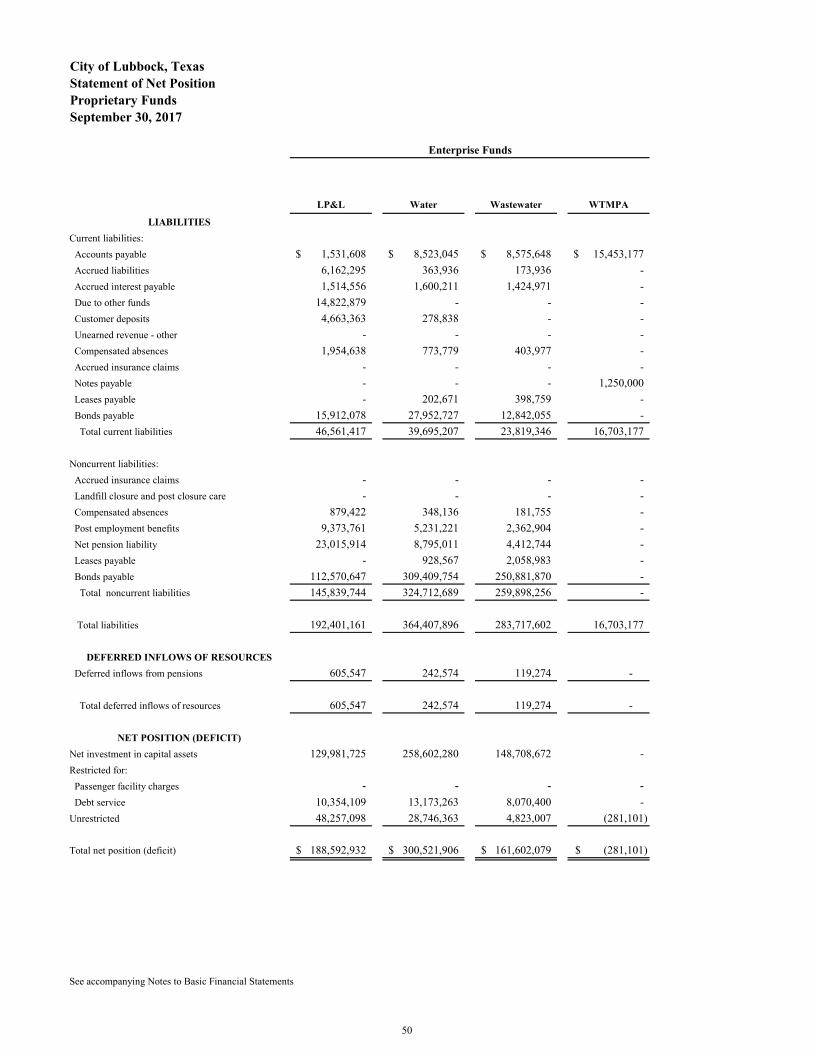
LP&L Water Wastewater WTMPA
Enterprise Funds
City of Lubbock, TexasStatement of Net Position
September 30, 2017Proprietary Funds
LIABILITIES
Current liabilities: Accounts payable 1,531,608$ 8,523,045$ 8,575,648$ 15,453,177$ Accrued liabilities 6,162,295 363,936 173,936 - Accrued interest payable 1,514,556 1,600,211 1,424,971 - Due to other funds 14,822,879 - - - Customer deposits 4,663,363 278,838 - - Unearned revenue - other - - - - Compensated absences 1,954,638 773,779 403,977 - Accrued insurance claims - - - - Notes payable - - - 1,250,000 Leases payable - 202,671 398,759 - Bonds payable 15,912,078 27,952,727 12,842,055 - Total current liabilities 46,561,417 39,695,207 23,819,346 16,703,177
Noncurrent liabilities: Accrued insurance claims - - - - Landfill closure and post closure care - - - - Compensated absences 879,422 348,136 181,755 - Post employment benefits 9,373,761 5,231,221 2,362,904 - Net pension liability 23,015,914 8,795,011 4,412,744 - Leases payable - 928,567 2,058,983 - Bonds payable 112,570,647 309,409,754 250,881,870 - Total noncurrent liabilities 145,839,744 324,712,689 259,898,256 -
Total liabilities 192,401,161 364,407,896 283,717,602 16,703,177
DEFERRED INFLOWS OF RESOURCES
Deferred inflows from pensions 605,547 242,574 119,274 -
Total deferred inflows of resources 605,547 242,574 119,274 -
NET POSITION (DEFICIT)
Net investment in capital assets 129,981,725 258,602,280 148,708,672 -Restricted for: Passenger facility charges - - - -
Debt service 10,354,109 13,173,263 8,070,400 -Unrestricted 48,257,098 28,746,363 4,823,007 (281,101)
Total net position (deficit) 188,592,932$ 300,521,906$ 161,602,079$ (281,101)$
See accompanying Notes to Basic Financial Statements
50
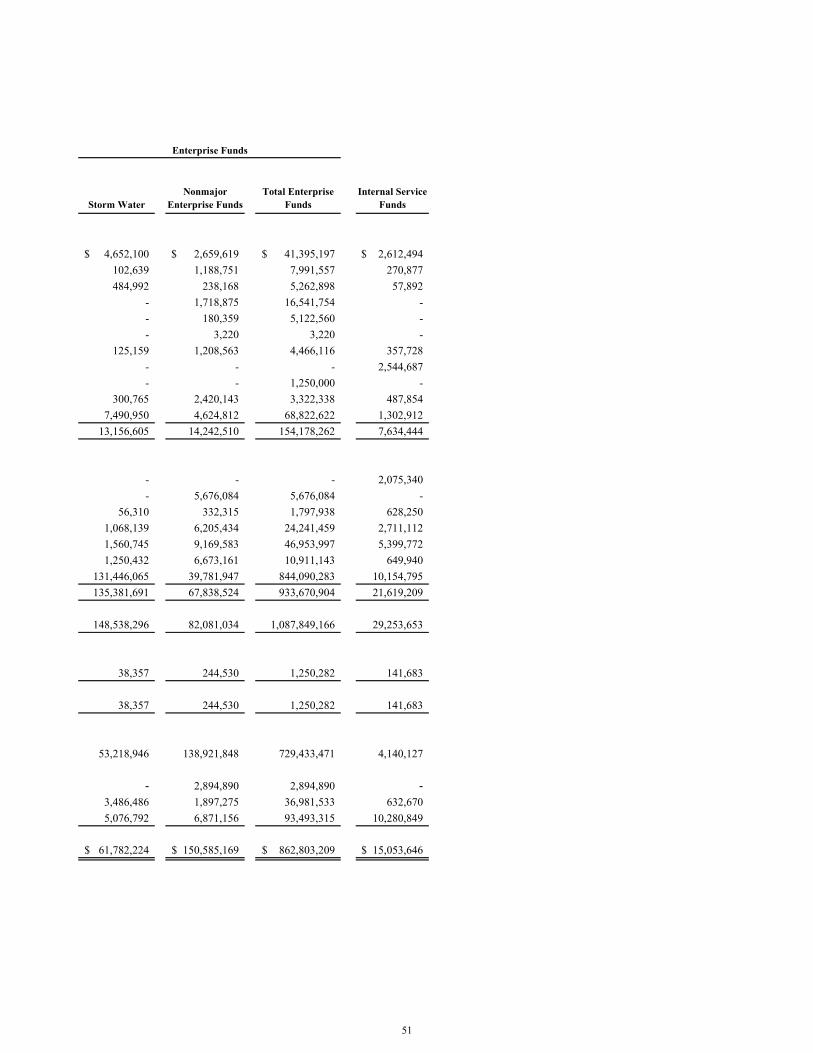
Storm WaterNonmajor
Enterprise FundsTotal Enterprise
FundsInternal Service
Funds
Enterprise Funds
4,652,100$ 2,659,619$ 41,395,197$ 2,612,494$ 102,639 1,188,751 7,991,557 270,877484,992 238,168 5,262,898 57,892
- 1,718,875 16,541,754 -- 180,359 5,122,560 -- 3,220 3,220 -
125,159 1,208,563 4,466,116 357,728- - - 2,544,687- - 1,250,000 -
300,765 2,420,143 3,322,338 487,8547,490,950 4,624,812 68,822,622 1,302,912
13,156,605 14,242,510 154,178,262 7,634,444
- - - 2,075,340- 5,676,084 5,676,084 -
56,310 332,315 1,797,938 628,2501,068,139 6,205,434 24,241,459 2,711,1121,560,745 9,169,583 46,953,997 5,399,7721,250,432 6,673,161 10,911,143 649,940
131,446,065 39,781,947 844,090,283 10,154,795135,381,691 67,838,524 933,670,904 21,619,209
148,538,296 82,081,034 1,087,849,166 29,253,653
38,357 244,530 1,250,282 141,683
38,357 244,530 1,250,282 141,683
53,218,946 138,921,848 729,433,471 4,140,127
- 2,894,890 2,894,890 -
3,486,486 1,897,275 36,981,533 632,6705,076,792 6,871,156 93,493,315 10,280,849
61,782,224$ 150,585,169$ 862,803,209$ 15,053,646$
51
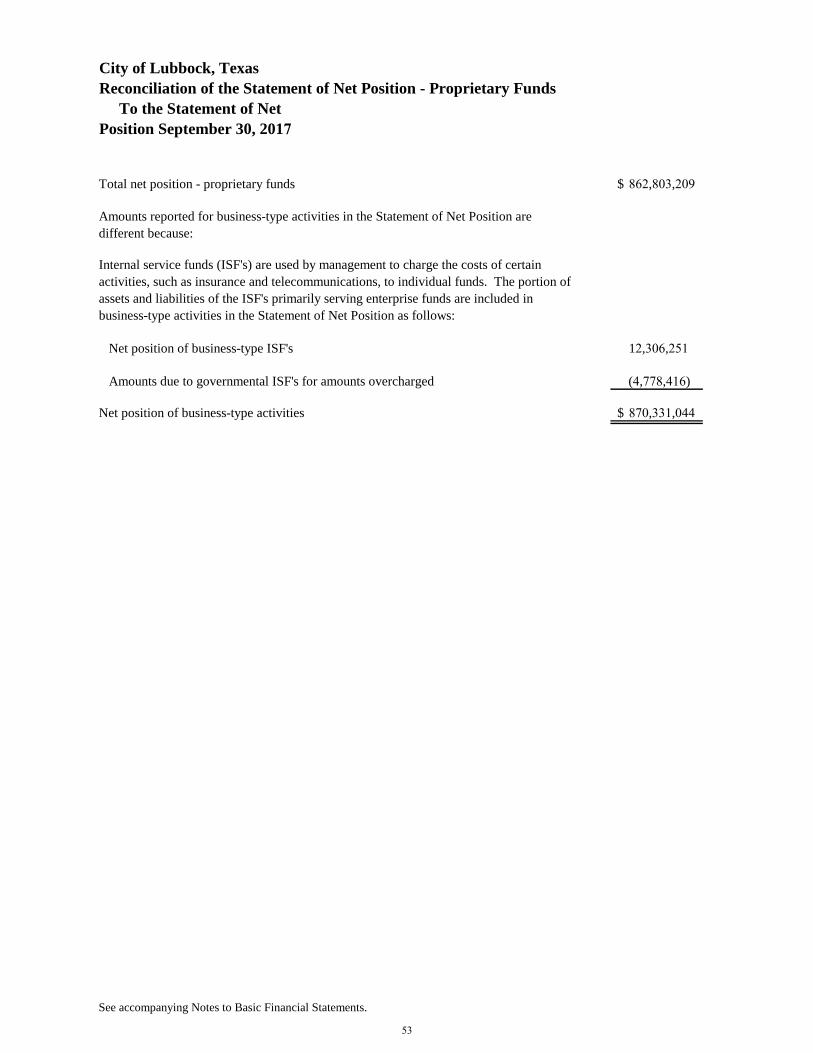
Total net position - proprietary funds $ 862,803,209
Amounts reported for business-type activities in the Statement of Net Position are
different because:
Internal service funds (ISF's) are used by management to charge the costs of certain
activities, such as insurance and telecommunications, to individual funds. The portion of
assets and liabilities of the ISF's primarily serving enterprise funds are included in
business-type activities in the Statement of Net Position as follows:
Net position of business-type ISF's 12,306,251
Amounts due to governmental ISF's for amounts overcharged (4,778,416)
Net position of business-type activities $ 870,331,044
See accompanying Notes to Basic Financial Statements.
City of Lubbock, Texas
Reconciliation of the Statement of Net Position - Proprietary Funds
To the Statement of Net
Position September 30, 2017
53
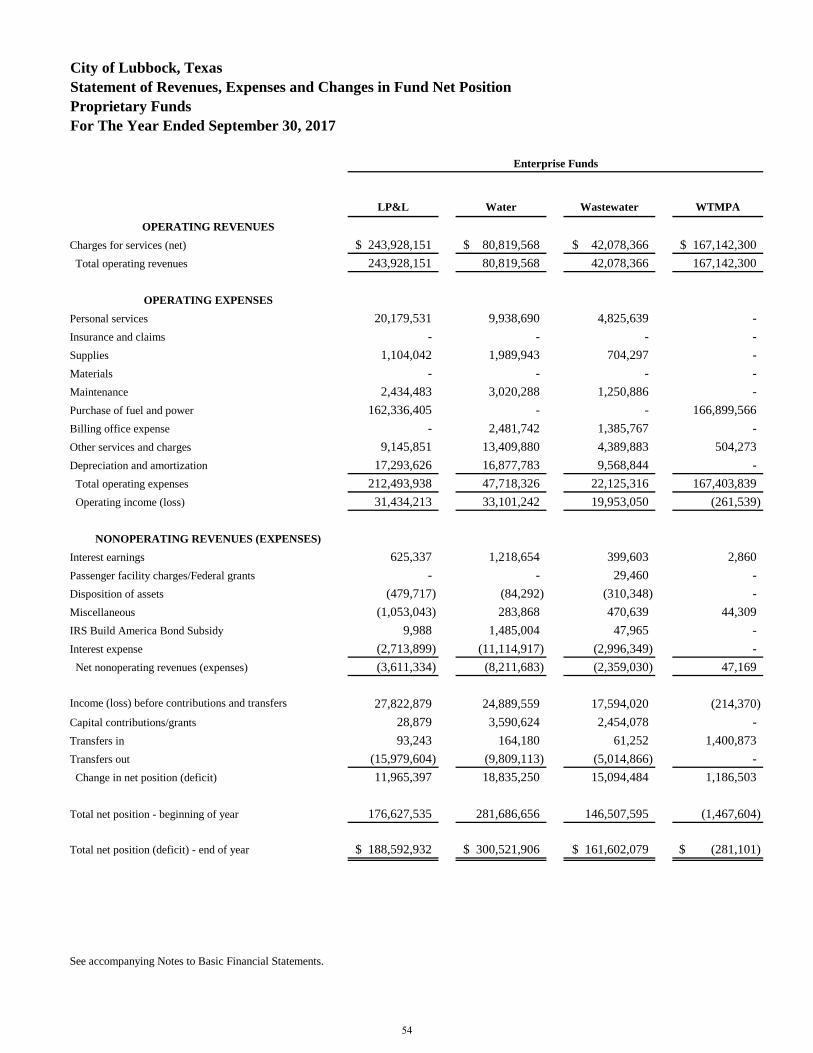
LP&L Water Wastewater WTMPA
OPERATING REVENUES
Charges for services (net) 243,928,151$ 80,819,568$ 42,078,366$ 167,142,300$
Total operating revenues 243,928,151 80,819,568 42,078,366 167,142,300
OPERATING EXPENSES
Personal services 20,179,531 9,938,690 4,825,639 -
Insurance and claims - - - -
Supplies 1,104,042 1,989,943 704,297 -
Materials - - - -
Maintenance 2,434,483 3,020,288 1,250,886 -
Purchase of fuel and power 162,336,405 - - 166,899,566
Billing office expense - 2,481,742 1,385,767 -
Other services and charges 9,145,851 13,409,880 4,389,883 504,273
Depreciation and amortization 17,293,626 16,877,783 9,568,844 -
Total operating expenses 212,493,938 47,718,326 22,125,316 167,403,839
Operating income (loss) 31,434,213 33,101,242 19,953,050 (261,539)
NONOPERATING REVENUES (EXPENSES)
Interest earnings 625,337 1,218,654 399,603 2,860
Passenger facility charges/Federal grants - - 29,460 -
Disposition of assets (479,717) (84,292) (310,348) -
Miscellaneous (1,053,043) 283,868 470,639 44,309
IRS Build America Bond Subsidy 9,988 1,485,004 47,965 -
Interest expense (2,713,899) (11,114,917) (2,996,349) -
Net nonoperating revenues (expenses) (3,611,334) (8,211,683) (2,359,030) 47,169
Income (loss) before contributions and transfers 27,822,879 24,889,559 17,594,020 (214,370)
Capital contributions/grants 28,879 3,590,624 2,454,078 -
Transfers in 93,243 164,180 61,252 1,400,873
Transfers out (15,979,604) (9,809,113) (5,014,866) -
Change in net position (deficit) 11,965,397 18,835,250 15,094,484 1,186,503
Total net position - beginning of year 176,627,535 281,686,656 146,507,595 (1,467,604)
Total net position (deficit) - end of year 188,592,932$ 300,521,906$ 161,602,079$ (281,101)$
See accompanying Notes to Basic Financial Statements.
Enterprise Funds
City of Lubbock, Texas
Statement of Revenues, Expenses and Changes in Fund Net Position
Proprietary Funds
For The Year Ended September 30, 2017
54
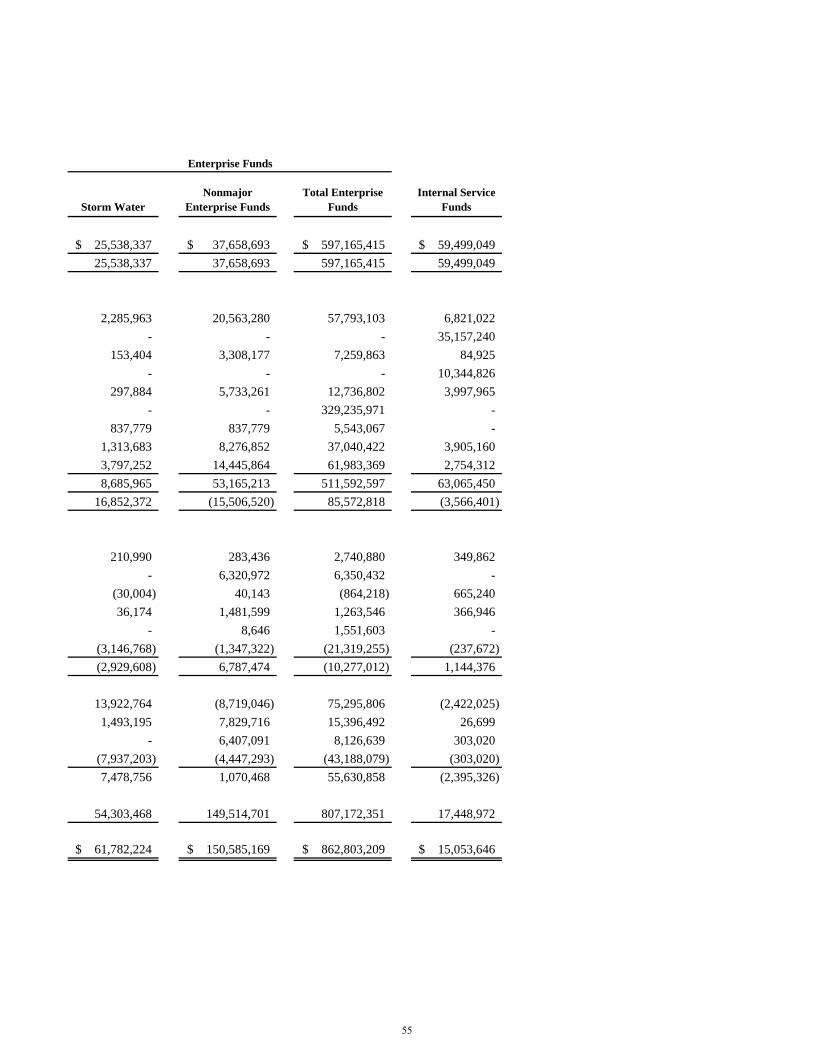
Storm Water
Nonmajor
Enterprise Funds
Total Enterprise
Funds
Internal Service
Funds
25,538,337$ 37,658,693$ 597,165,415$ 59,499,049$
25,538,337 37,658,693 597,165,415 59,499,049
2,285,963 20,563,280 57,793,103 6,821,022
- - - 35,157,240
153,404 3,308,177 7,259,863 84,925
- - - 10,344,826
297,884 5,733,261 12,736,802 3,997,965
- - 329,235,971 -
837,779 837,779 5,543,067 -
1,313,683 8,276,852 37,040,422 3,905,160
3,797,252 14,445,864 61,983,369 2,754,312
8,685,965 53,165,213 511,592,597 63,065,450
16,852,372 (15,506,520) 85,572,818 (3,566,401)
210,990 283,436 2,740,880 349,862
- 6,320,972 6,350,432 -
(30,004) 40,143 (864,218) 665,240
36,174 1,481,599 1,263,546 366,946
- 8,646 1,551,603 -
(3,146,768) (1,347,322) (21,319,255) (237,672)
(2,929,608) 6,787,474 (10,277,012) 1,144,376
13,922,764 (8,719,046) 75,295,806 (2,422,025)
1,493,195 7,829,716 15,396,492 26,699
- 6,407,091 8,126,639 303,020
(7,937,203) (4,447,293) (43,188,079) (303,020)
7,478,756 1,070,468 55,630,858 (2,395,326)
54,303,468 149,514,701 807,172,351 17,448,972
61,782,224$ 150,585,169$ 862,803,209$ 15,053,646$
Enterprise Funds
55
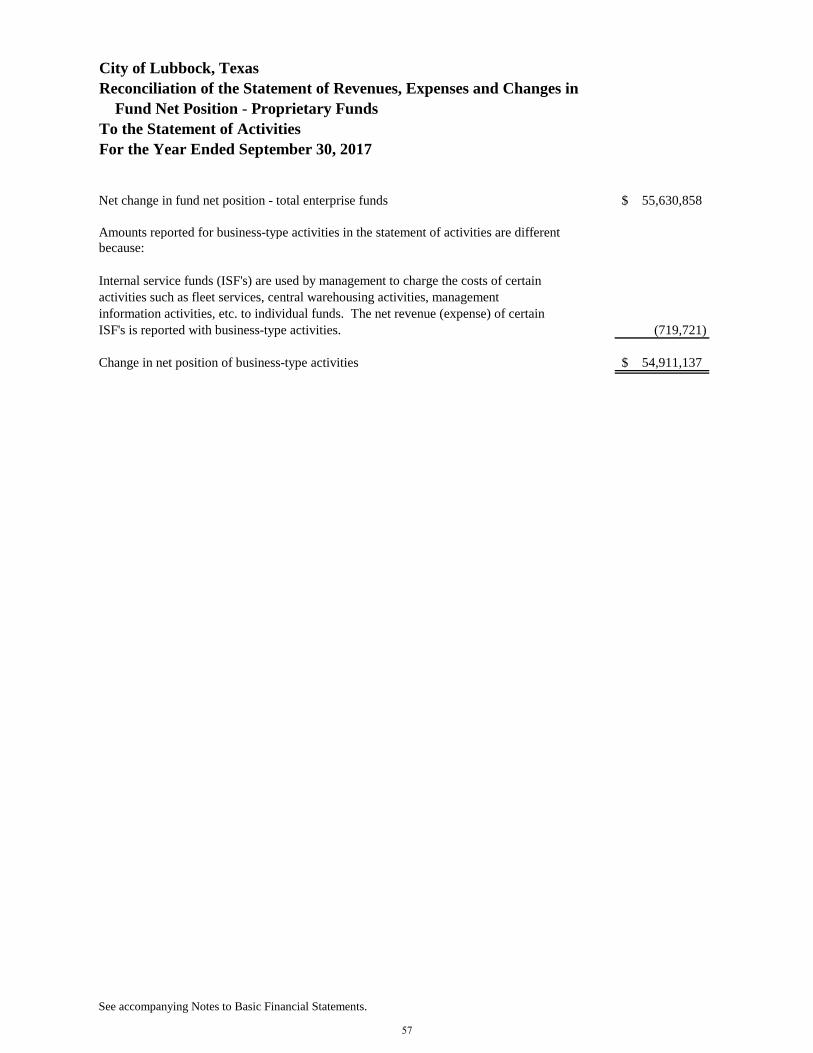
Net change in fund net position - total enterprise funds 55,630,858$
Amounts reported for business-type activities in the statement of activities are different
because:
Internal service funds (ISF's) are used by management to charge the costs of certain
activities such as fleet services, central warehousing activities, management
information activities, etc. to individual funds. The net revenue (expense) of certain
ISF's is reported with business-type activities. (719,721)
Change in net position of business-type activities 54,911,137$
See accompanying Notes to Basic Financial Statements.
For the Year Ended September 30, 2017
City of Lubbock, Texas
Reconciliation of the Statement of Revenues, Expenses and Changes in
Fund Net Position - Proprietary Funds
To the Statement of Activities
57
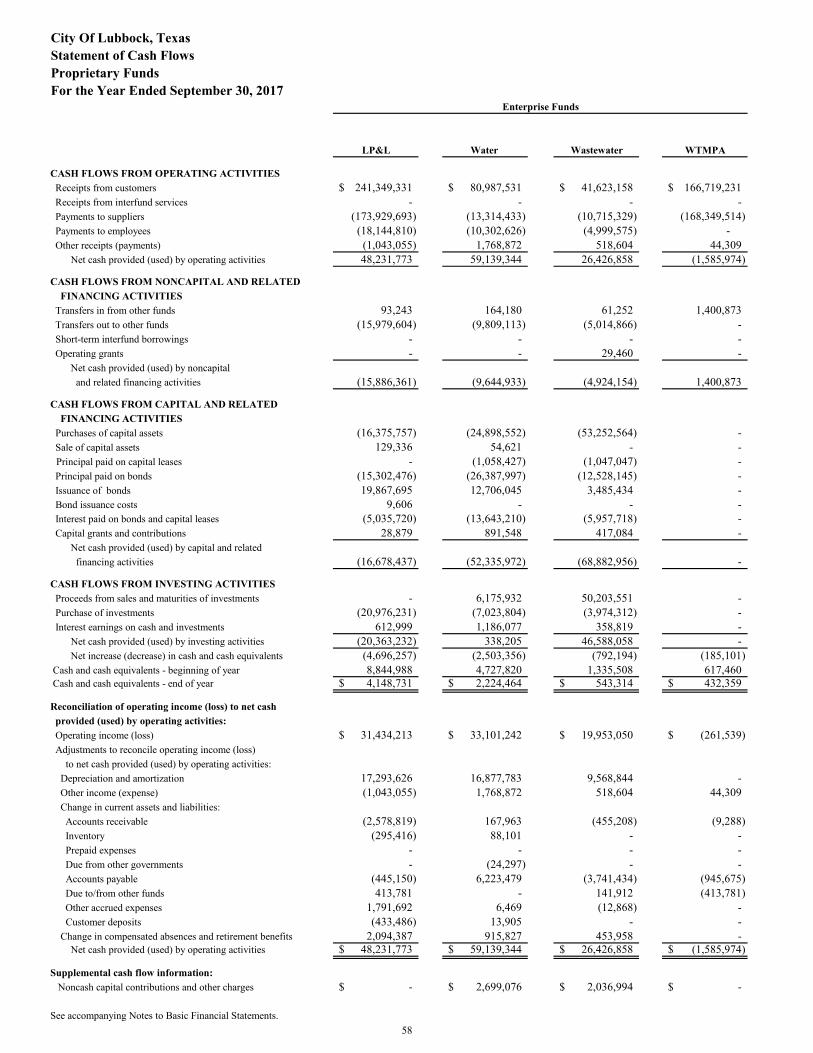
City Of Lubbock, TexasStatement of Cash FlowsProprietary Funds For the Year Ended September 30, 2017
LP&L Water Wastewater WTMPA
CASH FLOWS FROM OPERATING ACTIVITIES
Receipts from customers 241,349,331$ 80,987,531$ 41,623,158$ 166,719,231$ Receipts from interfund services - - - - Payments to suppliers (173,929,693) (13,314,433) (10,715,329) (168,349,514) Payments to employees (18,144,810) (10,302,626) (4,999,575) - Other receipts (payments) (1,043,055) 1,768,872 518,604 44,309 Net cash provided (used) by operating activities 48,231,773 59,139,344 26,426,858 (1,585,974) CASH FLOWS FROM NONCAPITAL AND RELATED
FINANCING ACTIVITIES
Transfers in from other funds 93,243 164,180 61,252 1,400,873 Transfers out to other funds (15,979,604) (9,809,113) (5,014,866) - Short-term interfund borrowings - - - - Operating grants - - 29,460 - Net cash provided (used) by noncapital and related financing activities (15,886,361) (9,644,933) (4,924,154) 1,400,873
CASH FLOWS FROM CAPITAL AND RELATED
FINANCING ACTIVITIES
Purchases of capital assets (16,375,757) (24,898,552) (53,252,564) - Sale of capital assets 129,336 54,621 - - Principal paid on capital leases - (1,058,427) (1,047,047) -
Principal paid on bonds (15,302,476) (26,387,997) (12,528,145) - Issuance of bonds 19,867,695 12,706,045 3,485,434 - Bond issuance costs 9,606 - - - Interest paid on bonds and capital leases (5,035,720) (13,643,210) (5,957,718) - Capital grants and contributions 28,879 891,548 417,084 - Net cash provided (used) by capital and related financing activities (16,678,437) (52,335,972) (68,882,956) -
CASH FLOWS FROM INVESTING ACTIVITIES
Proceeds from sales and maturities of investments - 6,175,932 50,203,551 - Purchase of investments (20,976,231) (7,023,804) (3,974,312) - Interest earnings on cash and investments 612,999 1,186,077 358,819 - Net cash provided (used) by investing activities (20,363,232) 338,205 46,588,058 - Net increase (decrease) in cash and cash equivalents (4,696,257) (2,503,356) (792,194) (185,101) Cash and cash equivalents - beginning of year 8,844,988 4,727,820 1,335,508 617,460 Cash and cash equivalents - end of year 4,148,731$ 2,224,464$ 543,314$ 432,359$
Reconciliation of operating income (loss) to net cash
provided (used) by operating activities:
Operating income (loss) 31,434,213$ 33,101,242$ 19,953,050$ (261,539)$ Adjustments to reconcile operating income (loss) to net cash provided (used) by operating activities: Depreciation and amortization 17,293,626 16,877,783 9,568,844 - Other income (expense) (1,043,055) 1,768,872 518,604 44,309 Change in current assets and liabilities: Accounts receivable (2,578,819) 167,963 (455,208) (9,288) Inventory (295,416) 88,101 - - Prepaid expenses - - - - Due from other governments - (24,297) - - Accounts payable (445,150) 6,223,479 (3,741,434) (945,675) Due to/from other funds 413,781 - 141,912 (413,781) Other accrued expenses 1,791,692 6,469 (12,868) - Customer deposits (433,486) 13,905 - - Change in compensated absences and retirement benefits 2,094,387 915,827 453,958 - Net cash provided (used) by operating activities 48,231,773$ 59,139,344$ 26,426,858$ (1,585,974)$
Supplemental cash flow information:
Noncash capital contributions and other charges -$ 2,699,076$ 2,036,994$ -$
See accompanying Notes to Basic Financial Statements.
Enterprise Funds
58
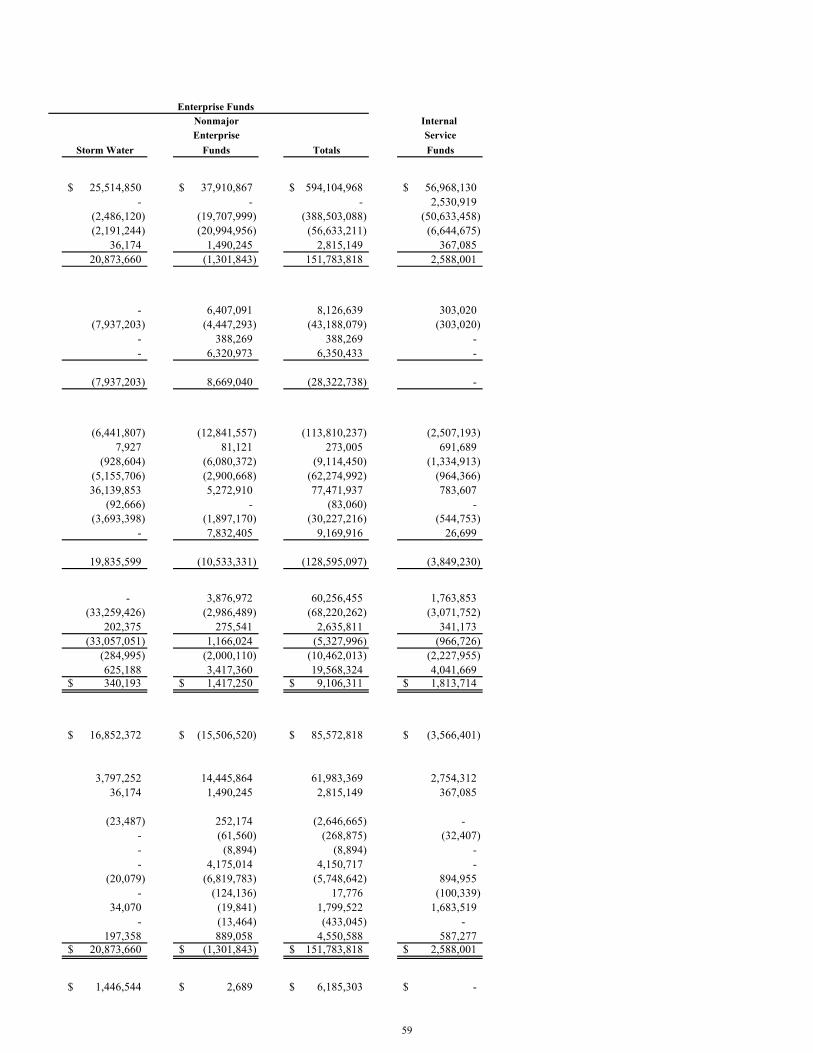
Nonmajor Internal
Enterprise Service
Storm Water Funds Totals Funds
25,514,850$ 37,910,867$ 594,104,968$ 56,968,130$ - - - 2,530,919
(2,486,120) (19,707,999) (388,503,088) (50,633,458) (2,191,244) (20,994,956) (56,633,211) (6,644,675)
36,174 1,490,245 2,815,149 367,085 20,873,660 (1,301,843) 151,783,818 2,588,001
- 6,407,091 8,126,639 303,020 (7,937,203) (4,447,293) (43,188,079) (303,020)
- 388,269 388,269 - - 6,320,973 6,350,433 -
(7,937,203) 8,669,040 (28,322,738) -
(6,441,807) (12,841,557) (113,810,237) (2,507,193) 7,927 81,121 273,005 691,689
(928,604) (6,080,372) (9,114,450) (1,334,913) (5,155,706) (2,900,668) (62,274,992) (964,366) 36,139,853 5,272,910 77,471,937 783,607
(92,666) - (83,060) - (3,693,398) (1,897,170) (30,227,216) (544,753)
- 7,832,405 9,169,916 26,699
19,835,599 (10,533,331) (128,595,097) (3,849,230)
- 3,876,972 60,256,455 1,763,853 (33,259,426) (2,986,489) (68,220,262) (3,071,752)
202,375 275,541 2,635,811 341,173 (33,057,051) 1,166,024 (5,327,996) (966,726)
(284,995) (2,000,110) (10,462,013) (2,227,955) 625,188 3,417,360 19,568,324 4,041,669 340,193$ 1,417,250$ 9,106,311$ 1,813,714$
16,852,372$ (15,506,520)$ 85,572,818$ (3,566,401)$
3,797,252 14,445,864 61,983,369 2,754,312
36,174 1,490,245 2,815,149 367,085
(23,487) 252,174 (2,646,665) - - (61,560) (268,875) (32,407) - (8,894) (8,894) - - 4,175,014 4,150,717 -
(20,079) (6,819,783) (5,748,642) 894,955 - (124,136) 17,776 (100,339)
34,070 (19,841) 1,799,522 1,683,519 - (13,464) (433,045) -
197,358 889,058 4,550,588 587,277 20,873,660$ (1,301,843)$ 151,783,818$ 2,588,001$
1,446,544$ 2,689$ 6,185,303$ -$
Enterprise Funds
59
City of Lubbock, Texas
Notes to Basic Financial Statements
September 30, 2017
NOTE I. SUMMARY OF SIGNIFICANT ACCOUNTING POLICIES
The Basic Financial Statements (BFS) of the City of Lubbock, Texas (City) have been prepared in conformity
with accounting principles generally accepted in the United States of America (GAAP) as applied to
government units, including specialized industry practices as specified in the American Institute of Certified
Public Accountants audit and accounting guide titled State and Local Governments. The Governmental
Accounting Standards Board (GASB) is the acknowledged standard-setting body for establishing
governmental accounting and financial reporting principles. With respect to proprietary activities related to
business-type activities and enterprise funds, including component units, the City applies all applicable GASB
pronouncements.
The more significant accounting policies are described below.
A. REPORTING ENTITY
The City is a municipal corporation governed by a Council-Manager form of government. The City,
incorporated in 1909, is located in the northwestern part of the state. The City currently occupies a land area
of 129.0 square miles and serves a population approximating 254,565. The City is empowered to levy a
property tax on both real and personal properties located within its boundaries. It is also empowered by state
statute to extend its corporate limits by annexation, which occurs periodically when deemed appropriate by the
City Council.
The City provides a full range of services including public safety (police and fire protection), electric, water
and wastewater, storm water, solid waste, public transportation, health and social services, cultural-recreation,
highways and streets, airport, planning and zoning, and general administrative services.
The BFS present the City and its component units and include all activities, organizations, and functions for
which the City is considered to be financially accountable. The criteria considered in determining activities to
be reported within the City’s BFS are based upon and consistent with those set forth in the Codification of
Governmental Accounting Standards, Section 2100, “Defining the Financial Reporting Entity.” The criteria
include the following:
The organization is legally separate (can sue and be sued in its own name);
The City holds the corporate powers of the organization;
The City appoints a voting majority of the organization’s board;
The City is able to impose its will on the organization;
The organization has the potential to impose a financial benefit or burden on the City; or
There is fiscal dependency by the organization on the City.
As required by GAAP, the BFS present the reporting entity which consists of the City (the primary
government), organizations for which the City is financially accountable, and other organizations for which
the nature and significance of their relationship with the City are such that exclusion could cause the City’s
BFS to be misleading or incomplete.
BLENDED COMPONENT UNIT
West Texas Municipal Power Agency (WTMPA) is a legally separate municipal corporation, a political
subdivision of Texas, and body politic and corporate, formed in 1983, governed by an eight-member Board of
Directors. The board consists of two directors from each participating city. One member is elected as the
president who presides over monthly meetings. Directors serve without compensation. WTMPA has no
employees and instead contracts for services to meet its general operating needs. WTMPA may engage in the
business of generation, transmission, sale, and exchange of electric energy to the four participating public
entities: Lubbock, Tulia, Brownfield, and Floydada. WTMPA may also participate in power pooling and
60
City of Lubbock, Texas
Notes to Basic Financial Statements
September 30, 2017
power exchange agreements with other entities. WTMPA provides electricity to its four member cities with
the City having a 95.4 percent interest in its operations. Each member city appoints two members to the
WTMPA board; however an affirmative vote of the “majority in interest” is required to approve the operating
budget, capital projects, debt issuance, and any amendments to WTMPA rules and regulations. The “majority
in interest” relates to the following items: 1) WTMPA’s operating budget or any budget amendment(s); 2)
capital projects; 3) certain energy sales or sale or exchange of property with a value in excess of $20,000; and
4) any amendments to WTMPA rules and regulations requiring a quorum of seven voting board members, an
affirmative vote of six voting board members, and an affirmative vote of the “majority in interest”. The
“majority in interest” weighted vote is assigned according to kilowatt purchases by each city during the
previous year. Lubbock has a 95.4 percent “majority in interest” vote since it accounts for 95.4 percent of
WTMPA’s electrical sales. WTMPA provides services almost exclusively to the City and is therefore
presented as a blended enterprise fund. Separate audited financial statements may be obtained through the
City.
Lubbock Metropolitan Planning Organization (the “MPO”). The Federal Aid Highway Act of 1962
mandated that as a condition for the receipt of federal funds, each urban area with a population over 50,000 in
the United States was required to carry on a continuing, cooperative, and comprehensive transportation
planning process. The law also designates additional responsibilities once you reach a 200,000 population
threshold.
The MPO is governed by a nine-member Board of Directors. The Board consists of four City of Lubbock
administrators, the City Manager, the Mayor of Lubbock, two Lubbock Council members, two Lubbock
County administrators, the Mayor of Wolfforth, a Texas Department of Transportation district engineer and
the General Manager from Citibus.
The City of Lubbock acts as the fiscal agent for the MPO, per an operating agreement between the City, the
MPO and the Texas Department of Transportation. The agreement is to develop transportation plans and
programs for urbanized areas of the State of Texas and to expend federal funds and to provide state matching
funds for allowable costs necessary for the improvement of roads not in the state highway system.
DISCRETELY PRESENTED COMPONENT UNITS
The financial data for the Component Units are shown in the Government-Wide Financial Statements. The
Component Units are reported in a separate column to emphasize that they are legally separate from the City.
The following Component Units are included in the reporting entity because the primary government is
financially accountable, is able to impose its will on the organization, or can significantly influence operations
and/or activities of the organization.
The Urban Renewal Agency (URA) is a legally separate entity that serves as an arm of the City. The URA
is governed by state law and was formed to help eliminate slum and blight within the City. The URA board
oversees loans made to businesses and citizens of Lubbock using funds accumulated by the City of Lubbock
community development program. The URA also oversees the acquisition and disposition of real property.
The URA manages the City of Lubbock Community Development loans and property program. The URA
Board is composed of nine members appointed by the City Council. There are no separate financial statements
available for the URA.
Civic Lubbock, Inc. is a legally separate entity that was organized to foster and promote the presentation of
wholesome educational, cultural, and entertainment programs for the general moral, intellectual and physical
improvement, and welfare of the citizens of Lubbock and the surrounding area. The eleven-member board is
appointed by the City Council. The City Council reviews and accepts the annual budget. Separate audited
financial statements for Civic Lubbock may be obtained from Civic Lubbock, Inc. at 1501 6th Street, Lubbock,
Texas.
61
City of Lubbock, Texas
Notes to Basic Financial Statements
September 30, 2017
Market Lubbock Economic Development Corporation, dba Market Lubbock, Inc. is a legally separate
entity that was formed on October 10, 1995 by the City Council to create, manage, operate, and supervise
programs and activities to promote, assist, and enhance economic development within and around the City.
The City Council appoints the seven-member board, and its operations are funded primarily through budgeted
allocations of the City’s property and hotel occupancy taxes. Separate audited financial statements may be
obtained from Market Lubbock, Inc. at 1500 Broadway, Sixth Floor, Lubbock, Texas.
Lubbock Economic Development Alliance, Inc. is a legally separate entity that was formed on June 1, 2004
by the City of Lubbock to create, manage, and supervise programs and activities to promote, assist, and enhance
economic development within and around the City. The City Council appoints the seven-member board, and
its operations are funded primarily through budgeted allocations of the City’s sales and use taxes. Separate
audited financial statements may be obtained from Lubbock Economic Development Alliance, Inc. at 1500
Broadway, Sixth Floor, Lubbock, Texas.
The Vintage Township Public Facilities Corporation is a legally separate entity that was formed in 2007
with the sole purpose to assist the City in financing, refinancing, providing, or otherwise assisting in the
acquisition, construction, and maintenance of certain public facilities benefiting the Vintage Township Public
Improvement District. The three-member board is appointed by the City Council. The City Council reviews
and accepts the annual budget. Separate audited financial statements are not available.
RELATED ORGANIZATIONS
The City Council is responsible for appointing the board members of some other organizations, but the City’s
accountability for these organizations do not extend beyond the board appointments. The City Council is not
able to impose its will on these entities and there is no financial benefit or burden relationship. Bonds issued
by these organizations do not constitute indebtedness of the City. The following related organizations are not
included in the reporting entity:
The Lubbock Fire Pension Fund (LFPF) operates under provisions of the Texas Local Fire Fighters’
Retirement Act for purposes of providing retirement benefits for the City’s firefighters. The Mayor’s designee,
the Chief Financial Officer or his designee, three firefighters elected by active firefighters and two at-large
members elected by the LFPF Board, govern its affairs. The Pension Fund is funded by contributions from the
firefighters and city matching contributions. As provided by enabling legislation, the City’s responsibility to
the LFPF is limited to matching bi-weekly contributions made by the members. Title to assets is vested in the
LFPF and not the City. The Texas State Pension Review Board is mandated to oversee all Texas public
retirement systems in regard to their actuarial soundness and compliance with state law. The City cannot
significantly influence the Pension Fund’s operations. Separate audited financial statements may be obtained
from the LFPF or from the City.
The Housing Authority of the City of Lubbock is a legally separate entity. The Mayor appoints the five-
member board.
The Lubbock Health Facilities Development Corporation promotes health facilities development. The City
Council appoints the seven-member board.
The Lubbock Education Facilities Authority, Inc. is a non-profit corporation and instrumentality of the City
and was created pursuant to the Higher Education Authority Act, Chapter 53 Texas Education Code, for the
purpose of aiding institutions of higher education, secondary schools, and primary schools in providing
educational facilities and housing facilities. The seven-member board is appointed by the City Council.
62
City of Lubbock, Texas
Notes to Basic Financial Statements
September 30, 2017
B. GOVERNMENT-WIDE AND FUND FINANCIAL STATEMENTS
The Government-Wide Financial Statements (GWFS) (i.e., the Statement of Net Position and the Statement of
Activities) report information on all of the activities of the City and its blended component unit as a whole.
The discretely presented component units are also aggregately presented within these statements. The effect
of interfund activity has been removed from these statements by allocation of the activities of the various
internal service funds to the governmental and business-type activities on a fund basis based on the
predominant users of the services. Interfund services are not eliminated in the process of consolidation.
Governmental activities, which are primarily supported by taxes and intergovernmental revenues, are reported
separately from business-type activities, which rely to a significant extent on fees and charges for support. All
activities, both governmental and business-type, are reported in the GWFS using the economic resources
measurement focus and the accrual basis of accounting, which includes long-term assets and receivables as
well as long-term debt and obligations. The GWFS focus more on the sustainability of the City as an entity and
the change in aggregate financial position resulting from the activities of the fiscal period.
The Government-Wide Statement of Net Position reports all financial and capital resources of the City. It is
displayed in the format of assets plus deferred outflows of resources equal liabilities plus deferred inflows of
resources, plus net position, with the assets and liabilities shown in order of their relative liquidity. Net position
represents the difference between all other elements in a statement of financial position and should be displayed
in three components: 1) net investment in capital assets; 2) restricted; and 3) unrestricted. Net investment in
capital assets equals capital assets net of accumulated depreciation and is reduced by outstanding balances of
any bonds, mortgages, notes, or other borrowings that are attributable to the acquisition, construction, or
improvement of those assets. Deferred outflows of resources and deferred inflows of resources that are
attributable to the acquisition, construction, or improvement of those assets or related debt also should be
included in this component of net position. If there are significant unspent related debt proceeds or deferred
inflows of resources at the end of the reporting period, the portion of the debt or deferred inflows of resources
attributable to the unspent amount should not be included in the calculation of net investment in capital assets.
Instead, that portion of the debt or deferred inflows of resources should be included in the same net position
component (restricted or unrestricted) as the unspent amount. Restricted net position are those with constraints
placed on their use as: 1) externally imposed by creditors (such as through debt covenants), grantors,
contributors, or laws or regulations of other governments; or 2) imposed by law through constitutional
provisions or enabling legislation. All net position not otherwise classified as net investment in capital assets
or restricted, is shown as unrestricted. Reservations or designations of net position imposed by the City,
whether by administrative policy or legislative actions of the City Council that do not otherwise meet the
definition of restricted net position, are considered unrestricted in the GWFS.
The Government-Wide Statement of Activities demonstrates the degree to which the direct expenses for a
given function or segment is offset by program revenues. Direct expenses are those that are clearly identifiable
with a specific function or segment. Program revenues include: 1) charges to customers or applicants who
purchase, use, or directly benefit from goods, services, or privileges provided by a given function or segment;
and 2) grants and contributions that are restricted to meeting the operational or capital requirements of a
particular function or segment. Taxes and other items not properly included among program revenues are
reported instead as general revenues. The general revenues support the net costs of the functions and segments
not covered by program revenues.
Fund Financial Statements (FFS) for governmental and proprietary funds are also part of the BFS. The focus
of the FFS is on major funds, as defined by GASB Statement No. 34. GASB Statement No. 34 sets forth
minimum criteria for the determination of major funds, i.e., a percentage of assets, liabilities, revenue, or
expenditures/expenses of fund category and of the governmental and enterprise funds combined. However, it
also gives governments the option of displaying other funds as major funds. The City can elect to add some
funds as major funds because of outstanding debt or community focus. Major individual governmental funds
and major individual enterprise funds are reported as separate columns in the FFS. Other non-major funds are
combined in a single column in the appropriate FFS.
63
City of Lubbock, Texas
Notes to Basic Financial Statements
September 30, 2017
C. MEASUREMENT FOCUS, BASIS OF ACCOUNTING, AND FINANCIAL STATEMENT
PRESENTATION
The GWFS are reported using the economic resources measurement focus and the accrual basis of accounting,
as are the proprietary FFS. Revenues are recorded when earned and expenses are recorded when a liability is
incurred, regardless of the timing of related cash flows. Property taxes are recognized as revenues in the year
for which they are levied. Grants and similar items are recognized as revenue as soon as all eligibility
requirements have been met.
Because the enterprise funds are combined into a single business-type activities column on the GWFS, certain
interfund activities between these funds are eliminated in the consolidation for the GWFS, but are included in
the fund columns in the proprietary FFS. The effect of interfund activity has been eliminated from the GWFS.
For instance, 95.4 percent of the operations of WTMPA representing transactions between WTMPA and
Lubbock Power & Light (LP&L) have been eliminated for the GWFS presentation and for the electric business-
type activities (BTA). Exceptions to this general rule are payments-in-lieu of taxes and other charges between
the City’s electric, water and wastewater functions and various other functions of the government. Elimination
of these charges would distort the direct costs and program revenues reported for the various functions
concerned.
Fund Financial Statements
Governmental FFS are reported using the current financial resources measurement focus and the modified
accrual basis of accounting. This is the traditional basis of accounting for governmental funds. This
presentation is necessary: 1) to demonstrate legal and covenant compliance; 2) to demonstrate the sources and
uses of liquid resources; and 3) to demonstrate how the City’s actual revenues and expenditures conform to the
annual budget. Revenues are recognized as soon as they are both measurable and available. Revenues are
considered to be available when they are collectible within the current period or soon enough thereafter to pay
liabilities of the current period. For this purpose, the government considers revenues to be available, generally,
if they are collected within 45 days of the end of the current fiscal period. The City considers the grant
availability period to be one year for revenue recognition. Expenditures generally are recorded when a liability
is incurred, as under accrual accounting. However, debt service expenditures, as well as expenditures related
to compensated absences, and claims and judgments are recorded only when the liability has matured. Because
the governmental FFS are presented on a different basis of accounting than the GWFS, reconciliations are
provided immediately following each fund statement. These reconciliations explain the adjustments necessary
to convert the FFS into the governmental activities column of the GWFS.
Property taxes, sales taxes, franchise taxes, occupancy taxes, grants, licenses, court fines, and interest
associated with the current fiscal period are all considered to be susceptible to accrual and have been recognized
as revenues of the current fiscal period. Only the portion of special assessments receivable due within the
current fiscal period is considered to be susceptible to accrual as revenue of the current period. All other
revenue items are considered to be measurable and available only when the City receives cash.
Fund Accounting
The City uses funds to report its financial position and the results of its operations. Fund accounting segregates
funds according to their intended purpose and is designed to demonstrate legal compliance and to aid financial
management by segregating transactions related to certain governmental functions or activities. A fund is a
separate accounting entity with a self-balancing set of accounts, which includes assets, deferred outflows,
deferred inflows, liabilities, fund balance/net position, revenues, and expenditures/expenses.
Governmental Funds are those through which most of the governmental functions of the City are financed.
The City reports two major governmental funds:
64
City of Lubbock, Texas
Notes to Basic Financial Statements
September 30, 2017
The General Fund, as the City’s primary operating fund, accounts for all financial resources of the general
government, except those required to be accounted for in another fund.
The Governmental Capital Projects Fund accounts for financing and construction of government capital
projects, except for North Overton and Central Business District Tax Increment Financing Reinvestment
Zone (TIF) capital projects and Gateway Streets Fund capital projects. Projects include public safety
improvements, park improvements, street improvements, purchase of and construction of municipal
buildings, and major maintenance, repair, and replacement of public buildings and facilities.
Enterprise Funds are used to account for operations: 1) that are financed and operated in a manner similar to
private business enterprises where the intent of the governing body is that the costs (expenses, including
depreciation) of providing goods or services to the general public on a continuing basis be financed or
recovered through user charges; or 2) where the governing body has decided that periodic determination of
revenues earned, expenses incurred, and/or net income is appropriate for capital maintenance, public policy,
management control, accountability, or other purposes. The City reports the following major enterprise funds:
LP&L Fund accounts for the activities of the city-owned electric production and distribution system.
The Water Fund accounts for the activities of the City’s water system.
The Wastewater Fund accounts for the activities of the City’s sanitary wastewater system.
The WTMPA Fund accounts for the activities of power generation and power brokering to member cities.
Member cities include Lubbock with 95.4 percent of power usage, Tulia, Brownfield, and Floydada
comprising the remaining 4.4 percent of power usage.
The Storm Water Fund accounts for the activities of the storm water utility.
The City also reports the following non-major funds:
Governmental Funds
Special Revenue Funds are used to account for and report the proceeds of specific revenue sources that
are restricted or committed to expenditures for specified purposes other than debt service or capital
projects.
The Debt Service Fund is used to account for and report financial resources that are restricted to
expenditures for principal and interest (other than debt service payments made by proprietary funds).
Capital Projects Funds are used to account for and report financial resources that are restricted,
committed, or assigned to expenditures for capital outlays (other than those recorded in the proprietary
funds).
Proprietary Funds distinguish operating revenues and expenses from non-operating items. Operating
revenues and expenses generally result from providing services or producing and delivering goods in
connection with a proprietary fund’s principal ongoing operations. The principal operating revenues of the
City’s enterprise funds and of the City’s internal service funds are charges to customers for sales and
services. Operating expenses for enterprise funds and internal service funds include the cost of sales and
services, administrative expenses, and depreciation on capital assets. All revenues and expenses not meeting
this definition are reported as non-operating revenues and expenses.
Enterprise Funds are used to account for services to outside users where the full cost of providing
services, including capital, is to be recovered through fees and charges, e.g., Lubbock Preston Smith
65
City of Lubbock, Texas
Notes to Basic Financial Statements
September 30, 2017
International Airport (Airport Fund), Citibus (Transit Fund), Solid Waste, Cemetery, Civic Centers and
Lake Alan Henry Recreational Funds.
Internal Service Funds are used to account for services provided to other departments, agencies of the
departments, or to other governments on a cost reimbursement basis (i.e., fleet maintenance, print shop
and warehouse, information technology, risk management, health benefits, and investment pool).
D. BUDGETARY ACCOUNTING
The City Manager submits a proposed operating budget and capital program to the City Council annually for
the upcoming fiscal year. Annual budgets are adopted for the General Fund, Debt Service Fund, Enterprise
Funds, Internal Service Funds, and certain Special Revenue Funds. Public hearings are conducted to obtain
citizen comments, and the budget is legally enacted through passage of an ordinance by the Council. City
Council action is also required for the approval of any supplemental appropriations.
All budget amounts presented in the General Fund Budgetary Comparison Schedule in the Required
Supplementary Information (RSI) section reflect the original budget and the amended budget, which have been
adjusted for legally authorized supplemental appropriations to the annual budget during the fiscal year. The
operating budget is adopted on a basis other than GAAP for the General Fund, with the main difference being
that capital lease proceeds and related capital outlay are not budgeted. Budgetary control is maintained at the
department level in the General Fund in the following expenditure categories: compensation, benefits, supplies,
maintenance, professional services/training, other charges, scheduled charges, and capital
outlay/reimbursements. Management may make administrative transfers and increases or decreases between
accounts below the department level without Council approval. However, to satisfy the legal level of control,
any transfer of funds between departments shall be presented to the Council for approval by ordinance before
such funds can be transferred between departments or expended. All annual operating appropriations lapse at
the end of the fiscal year.
All budget amounts presented in the Special Revenue Funds and Debt Service Fund Budgetary Comparison
Schedule in the Combining and Individual Fund Statements and Schedules section reflect the final budget
amounts, which have been adjusted for legally authorized supplemental appropriations to the annual budget
during the fiscal year. Budgetary control is maintained at the fund level, the legal level of control for Special
Revenue Funds and Debt Service Funds. The following Special Revenue Funds have legally adopted budgets:
Abandoned Motor Vehicle, Animal Assistance, Cable Services, Central Business District TIF, Community
Development Grant, Criminal Investigation, Debt Service, Department of Justice Asset Sharing, Economic
Development Incentive, Emergency Management Grant, Gateway Streets, Hotel Motel Tax, Lubbock Business
Park TIF, Lubbock Economic Development Alliance, Municipal Court, North and East Lubbock
Neighborhood and Infrastructure, North Overton PID, North Overton District TIF, North Point PID, Quincy
Park PID, Valencia PID, and Vintage Township PID.
Capital budgets and grant budgets do not lapse at fiscal year end, but remain in effect until the project is
completed and closed. The following funds have project length budgets: Donations, Community Services,
Health, Library, Police, and Other Grants Special Revenue Funds; and the Governmental, TIF, and Gateway
Streets Capital Projects Funds.
In addition to the tax levy for general operations, in accordance with state law, the City Council sets an ad
valorem tax levy for a sinking fund (General Obligation and Certificate of Obligation Debt Service) which,
with cash and investments in the fund, is sufficient to pay all debt service due during the fiscal year.
66
City of Lubbock, Texas
Notes to Basic Financial Statements
September 30, 2017
E. ENCUMBRANCES
At the end of the fiscal year, encumbrances for goods and services that have not been received are canceled
except in the Capital Projects Fund. Management has authority, by ordinance, to re-appropriate any
encumbrances that were open at the prior fiscal year end. At the beginning of the next fiscal year, management
reviews all open encumbrances and approves needed encumbrances. In FY 2017, management approved
reappropriation of $346,849 in various funds as follows: Central Warehouse - $250,000 and General Fund -
$96,849. There are no other significant encumbrances at year end that have not been restricted, committed, or
assigned.
F. ASSETS, LIABILITIES, AND FUND BALANCE/NET POSITION
Equity in Cash and Investments - The City pools the resources of the various funds in order to facilitate the
management of cash and enhance investment earnings. Records are maintained which reflect each fund’s
equity in the pooled account. Government agency bonds and municipal bond are stated at fair value; State
Pools (TexStar, Logic, Texas CLASS) are stated at net asset value; and Money Market and TexPool are stated
at amortized cost.
Cash and Cash Equivalents - Cash and cash equivalents include cash on hand and demand deposits.
Investments- Investments include securities in the Federal Home Loan Bank, Federal Home Loan Mortgage
Corporation, Federal National Mortgage Association, Farm Credit Notes, Federal Agricultural Mortgage
Corporation Municipal Bonds, Certificates of Deposit and Money Markets. Investments also include state
investment pools. Restricted investments include investments that have been restricted for bond financed
capital projects, funds that have been restricted by bond covenants for debt service requirements, funds
accumulated for passenger facility charges, and funds restricted for a Department of Justice consent decree.
Property Tax Receivable - The value of all real and business property located in the City is assessed annually
on January 1 in conformity with Subtitle E of the Texas Property Code. Property taxes are levied on October
1 on those assessed values and the taxes are due on receipt of the tax bill. On the following January 1, a tax
lien attaches to property to secure the payment of all taxes, penalties, and interest ultimately imposed. The
taxes are considered delinquent if not paid before February 1. Therefore, at fiscal year-end, all property taxes
receivable are delinquent, but are secured by a tax lien.
At the GWFS level, property tax revenue is recognized upon levy. In governmental funds, the City records
property taxes receivable upon levy and defers tax revenue until the taxes are collected or available. For each
fiscal year, the City recognizes revenue in the amount of taxes collected during the year plus an estimate of
taxes to be collected in the subsequent 45 days. The City allocates property tax revenue between the General,
certain Special Revenue, and Debt Service Funds based on tax rates adopted for the year of levy. The Lubbock
Central Appraisal District assesses property values, bills, collects, and remits the property taxes to the City.
The City adjusts the allowance for uncollectible taxes and deferred inflows of tax revenue at fiscal year-end
based upon historical collection experience. To write off property taxes receivable, the City eliminates the
receivable and reduces the allowance for uncollectible accounts.
Enterprise Funds Receivables - Within the LP&L, Water, Wastewater, Storm Water, and WTMPA Enterprise
Funds, services rendered but not billed as of the close of the fiscal year are accrued. This amount is reflected
in the accounts receivable balances of each fund. Amounts billed are reflected as accounts receivable net of
an allowance for uncollectible accounts.
Inventories - Inventories consist of expendable supplies held for consumption. Inventories are valued using
the average cost method of valuation, and are accounted for using the consumption method of accounting, i.e.,
inventory is expensed when used rather than when purchased.
67
City of Lubbock, Texas
Notes to Basic Financial Statements
September 30, 2017
Prepaid Items - Prepaid items are accounted for under the consumption method.
Capital Assets and Depreciation - Capital assets, including public domain infrastructure (streets, bridges,
sidewalks and other assets that are immovable and of value only to the City), are defined as assets with an
initial, individual cost of more than $5,000 and an estimated useful life in excess of one year. These capital
assets are reported in the GWFS and the proprietary funds. Capital assets are recorded at cost or estimated
historical cost if purchased or constructed. Donated assets are recorded at the estimated acquisition value on
the date of donation.
Major outlays for capital assets and improvements are capitalized as the projects are constructed. The cost of
normal maintenance and repairs that do not add to the value of the asset or materially extend the asset life are
not capitalized. Major improvements are capitalized and depreciated over the remaining useful lives of the
related capital assets.
Depreciation is computed using the straight-line method over the estimated useful lives as follows:
Improvements Other Than Buildings 10-60 years
Buildings 15-50 years
Machinery and Equipment
Water Rights
3-15 years
85 years
Interest Capitalization – Because the City issues general-purpose capital improvement bonds, which are
recorded within the proprietary funds, the City capitalizes interest costs for business-type activities and
enterprise funds according to GASB Statement No. 62. The City capitalized interest of approximately
$8,252,693 net of interest earned, for the business-type activities and the enterprise funds during the current
fiscal year.
Deferred Outflows/Inflows of Resources – Deferred outflows of resources represent a consumption of net
position that applies to a future period(s) and so will not be recognized as an outflow of resources (expense)
until then. The City has a deferred charge on a bond refunding, which is the difference in the carrying value
of refunded debt and its reacquisition price. This amount is deferred or amortized over the shorter of the life
of the refunded and new debt. The City also has deferred outflows for pensions related to contributions and
investment experience.
Deferred inflows of resources represent an acquisition of net position that applies to a future period(s) and so
will not be recognized as an inflow of resources (revenue) until then. The City’s deferred inflows include
property taxes and municipal court fines in the governmental funds and pension actuarial differences in
expected and actual experience in the proprietary and internal service funds.
For additional information on deferred outflows/inflows related to pensions, reference note III. G. Retirement
Plans.
Classification of Fund Equity - Fund balances are classified as nonspendable, restricted, committed, assigned,
or unassigned in governmental funds. Nonspendable fund balance cannot be spent, either because it is not in
spendable form or because of legal or contractual requirements. Restricted fund balances have constraints for
specific purposes which are externally imposed by providers, such as creditors, grantors, or other governments;
or by enabling legislation of the City Council. Committed fund balances can only be used for specific purposes
pursuant to constraints imposed by the City Council through an ordinance, which is the highest action level by
City Council. Assigned fund balances are constrained by intent to be used for specific purposes, but are neither
restricted nor committed. Assignments are made by city management based on Council direction. Unassigned
fund balances include residual positive fund balances within the General Fund that have not been classified
within the other mentioned categories. Unassigned fund balances may also include negative balances for any
68
City of Lubbock, Texas
Notes to Basic Financial Statements
September 30, 2017
governmental fund if expenditures exceed amounts restricted, committed, or assigned for those specific
purposes.
The City designates restricted amounts to be spent first if both restricted and unrestricted fund balances are
available unless there are legal documents/contracts that prohibit doing this, such as in grant agreements
requiring dollar for dollar spending. Additionally, the City would first use committed, followed by assigned,
and lastly unassigned amounts when expenditures are incurred for purposes for which amounts in any of those
unrestricted fund balance classifications could be used.
The proprietary funds and GWFS have three classifications of net position: 1) net investment in capital assets;
2) restricted net position; and 3) unrestricted net position. In the first category, capital assets are netted with
bonded and capital lease debt. Restricted net position includes debt service, grantor, and other government
restrictions for proprietary funds and the same categories as restricted fund balance for governmental activities.
The City Council has approved goals for the General Fund unrestricted fund balance, which is set at a minimum
of an amount equal to twenty percent of operating revenues in order to meet unanticipated contingencies and
fluctuations in revenue. Enterprise funds also have appropriable net position reserve policies, ranging from 8
to 25 percent of operating revenue. The LP&L Fund maintains general reserves equal to three months gross
revenue from all retail electric sales as determined by taking the average monthly retail electric sales from the
previous fiscal year.
Use of Estimates - The preparation of financial statements in conformity with GAAP requires management to
make estimates and assumptions that affect the reported amounts of assets, deferred outflows, liabilities,
deferred inflows, and disclosure of contingent assets and liabilities at the date of the financial statements along
with reported amounts of revenues and expenses/expenditures during the reporting period. Actual results could
differ from those estimates.
G. REVENUES, EXPENSES AND EXPENDITURES
Interest Income on pooled cash and investments is allocated monthly based on the percentage of a fund's
pooled cash and investments monthly balance compared to the total city-wide monthly balance in pooled cash
and investments. Bond funds and other separate non-pooled cash are distributed to the fund where the cash and
investment is recorded.
Sales Tax Revenue for the City results from an allocation of 1.5 percent of the total sales tax levy of 8.25
percent, which is collected by the State of Texas and remitted to the City monthly. The tax is collected by the
vendor and is required to be remitted to the State by the 20th of the month following collection. The tax is
then paid to the City by the Friday following the second Wednesday of the subsequent month.
Grant Revenue from federal and state grants is recognized as revenue as soon as all eligibility requirements
have been met. The availability period for grants is considered to be one year.
Interfund Transactions are accounted for as revenues, expenditures, expenses, or other financing sources or
uses. Transactions that constitute reimbursements to a fund for expenditures/expenses initially made from that
fund that are properly applicable to another fund are recorded as expenditures/expenses in the reimbursing fund
and as reductions of expenditures/expenses in the fund that is reimbursed. In addition, transfers are made
between funds to shift resources from a fund legally authorized to receive revenue to a fund authorized to
expend the revenue.
Compensated Absences consists of vacation leave, sick leave, and compensatory leave. Vacation leave of
10-20 days is granted to all regular employees dependent upon the date employed, years of service, and civil
service status. Currently, up to 40 hours of vacation leave may be “carried over” to the next calendar year.
69
City of Lubbock, Texas
Notes to Basic Financial Statements
September 30, 2017
The City is obligated to make payment upon retirement or termination for employees in good standing for any
available, unused vacation leave.
Sick leave for employees is accrued at 1 1/4 days per month with a maximum accrual status of 200 days. After
15 years of continuous full-time service for non-civil service personnel, vested sick leave is paid on retirement
or termination at the current hourly rate for up to 90 days. Upon retirement or termination, Police Civil Service
Personnel are paid for up to 90 days accrued sick leave regardless of reason for leaving or time with the City.
Firefighter Civil Service Personnel are paid for up to 90 days of accrued sick leave upon retirement or
termination. The Texas Civil Service laws dictate certain benefits and personnel policies above and beyond
the policies of the City.
In accordance with the Fair Labor Standards Act and city policy, non-exempt employees may accrue
compensatory time off instead of receiving payment for overtime hours worked. Compensatory time may be
accrued up to 45 hours (30 overtime hours at time and one half) and must be used within 26 pay periods. In
order to be eligible for compensatory time, each employee is required to sign an agreement with the City.
The liability for the accumulated vacation, sick, and compensatory time off is recorded in the GWFS and in
the FFS for proprietary fund employees when earned. The liability is recorded in the governmental FFS to the
extent it is due and payable.
Post-Employment Benefits for retirees of the City include the option to purchase health and life insurance
with health insurance benefits at a subsidized premium. However, employees that retire with 15 or more years
of service or Civil Service employees that retire who have a sick-leave balance in excess of 90 days will be
able to elect to continue receiving medical coverage in full 30-day periods for the term of the balance of their
sick leave. Retirees are required to pay a prorated premium for the days of coverage that are not funded by
their excess sick leave. Amounts to cover premiums and administrative costs, with an incremental charge for
reserve funding, are determined by the City’s health care administrator. Employer contributions are funded on
a pay-as-you-go basis and approximated $5.6 million for FY 2017.
H. PENSIONS
For purposes of measuring the net pension liability, deferred outflows of resources and deferred inflows of
resources related to pensions, and pension expense, information about fiduciary net position of the City’s
pension plans (Texas Municipal Retirement System - TMRS and the Lubbock Fire Pension Fund - LFPF) and
additions to/deductions from the pension plans’ fiduciary net position have been determined on the same basis
as they are reported by each plan. For this purpose, plan contributions are recognized in the period that
compensation is reported for the employee, which is when contributions are legally due. Benefit payments and
refunds are recognized when due and payable in accordance with the benefit terms. Investments are reported
at fair value.
I. NEW PRONOUNCEMENTS
In FY 2018, the City will implement GASB Statement No. 75, Accounting and Financial Reporting for
Postemployment Benefits Other Than Pensions (OPEB), such as retiree health insurance. This statement
addresses accounting and financial reporting by governments that provide OPEB to their employees or
employees of other governments.
In FY 2018, the City will implement GASB Statement No. 85, Omnibus 2017. This statement addresses
practice issues that have been identified during implementation and application of certain GASB Statements.
It addresses a variety of topics such as reporting amounts previously reported as goodwill and “negative”
goodwill for example.
70
City of Lubbock, Texas
Notes to Basic Financial Statements
September 30, 2017
In FY 2018, the City will also implement GASB Statement No. 86, Certain Debt Extinguishment Issues. This
statement addresses financial reporting for in-substance defeasance of debt by providing guidance for
transactions in which cash and other monetary assets acquired with only existing resources (resources other
than the proceeds of refunding debt) are placed in an irrevocable trust for the sole purpose of extinguishing
debt.
The effects of these standards on the City’s financial statements have not been determined.
NOTE II. STEWARDSHIP, COMPLIANCE AND ACCOUNTABILITY
A. RESTRICTED NET POSITION
Restricted net position is only used for its intended purpose. For the majority of projects funded by tax exempt
debt proceeds, the debt proceeds are used first, followed by unrestricted resources.
B. GENERAL FUND BUDGET COMPARISON
The General Fund FY 2017 amended budgeted expenditures and transfers out were $176,295,580, while actual
budgetary basis expenditures and transfers out were $172,006,346; a difference of $4,289,234.
NOTE III. DETAIL NOTES ON ALL ACTIVITIES AND FUNDS
A. DEPOSITS AND INVESTMENTS
On September 30, 2017, the bank balance of the City’s deposits was $14,413,510. All of the bank balances
are covered by federal depository insurance or are fully collateralized. Custodial credit risk is the risk that in
the event of a bank failure, a government’s deposits may not be returned. The City’s deposit policy for
custodial credit risk requires compliance with the provisions of Texas Public Funds Investment Act.
State law requires federal depository insurance or collateralization with the value of eligible securities having
an aggregate value at least equal to the amount of the deposits. The City’s Investment Policy requires the
minimum collateral level to be 102.0 percent of the market value of principal and accrued interest.
On September 30, 2017, bank balances were not exposed to custodial credit risk as follows:
Insured $ 750,000
Uninsured and collateral held by a third party financial institution in the
City’s name
13,663,510
$ 14,413,510
71
City of Lubbock, Texas
Notes to Basic Financial Statements
September 30, 2017
On September 30, 2017, the City had the following investments and maturities:
September 30, 2017
Maturities in Years
Type Fair Value
Less
Than 1
1-5
Federal Farm Credit Bank (FFCB) $ 12,935,307 $ 3,995,935 $ 8,939,372
Farmer Mac (FAMCA) 999,176 999,176
Federal Home Loan Bank (FHLB) 23,901,125 11,974,664 11,926,461
Federal Home Loan Mortgage
Corporation (FHLMC) 18,452,144 12,985,225 5,466,919
Federal National Mortgage
Association (FNMA) 15,864,130 7,984,525 7,879,605
Municipal Bonds 43,181,790 6,080,860 37,100,930
CD 618,917 618,917 -
Money Market 119,227 119,227 -
State Investment Pools * 389,794,758 389,794,758 - $ 505,866,574 $ 433,554,111 $ 76,312,463
*State Investment Pools are considered investments for financial reporting purposes.
Investment in State Investment Pools
The State Comptroller of Public Accounts exercises oversight responsibility over TexPool. Oversight includes
the ability to significantly influence operations, designation of management, and accountability for fiscal
matters. Additionally, the State Comptroller has established an Advisory Board composed both of participants
in TexPool and of other persons who do not have a business relationship with TexPool. The Advisory Board
members review the investment policy and management fee structure. Finally, TexPool is rated AAAm by
Standard & Poor’s. TexPool is not registered with the Securities and Exchange Commission (SEC) as an
investment company.
TexSTAR’s governing body is a five-member board of directors (the “Board”). Three directors are officers or
employees of Participants; one director is an officer or employee of First Southwest Company, LLC; and the
final director is an officer or employee of an affiliate of J.P. Morgan Investment Management Inc. TexSTAR’s
Bylaws also require the Board to appoint an advisory board. The Advisory Board currently consists of six
members, each of whom is either (1) a representative of a Participant or (2) a person who has no business
relationship with the Board, but who is qualified to advise the Board. The Advisory Board shall at all times
include at least one member of each such designation. The investment objective and strategy of the pool is to
seek preservation of principal, liquidity and current income through investment in a diversified portfolio of
short-term marketable securities. The pool offers same day access to investment funds.
LOGIC was established pursuant to an Interlocal Agreement, which was subsequently amended and is now
entitled Participation Agreement and Trust Instrument (the “Agreement”) between participating Government
Entities. Participation in the Pool is limited to those eligible Government Entities which have become parties
to the Agreement (“Participants”). Participants’ assets in the Pool are represented by units of beneficial interest
(“Units”), which are issued in discrete series (each a “Portfolio”), as authorized from time to time by the Board.
Assets invested in any Portfolio will be managed separately, and segregated from, the assets of every other
Portfolio. Since September 2005, J.P. Morgan Investment Management Inc. (JPMIM) has served as investment
adviser to LOGIC. FirstSouthwest, a Division of Hilltop Securities (FirstSouthwest) and JPMIM serve as co-
72
City of Lubbock, Texas
Notes to Basic Financial Statements
September 30, 2017
administrators to LOGIC, and FirstSouthwest provides administrative, participant support, and marketing
services. JPMorgan Chase Bank N.A. provides custodial services. The investment objective and strategy of
the pool is to seek preservation of principal, liquidity and current income through investment in a diversified
portfolio of short-term marketable securities. The pool offers same day access to investment funds.
Texas CLASS Texas Cooperative Liquid Assets Securities System (Texas CLASS). Texas CLASS was
created specifically for the use of Texas local government entities and seeks to provide safety, liquidity,
convenience, and competitive rates of return. Public Trust Advisors, LLC serves as the pool's administrator
and investment adviser. The marketing and operation functions of the portfolio are also performed by Public
Trust Advisors, LLC. The pool is subject to the general supervision of the Board of Trustees and its Advisory
Board, both of which are elected by the Texas CLASS Participants. Wells Fargo Bank, N.A. serves as custodian
for the pool. The investment objective and strategy of the pool is to seek preservation of principal, liquidity
and current income through investment in a diversified portfolio of short-term marketable securities. The pool
offers same day access to investment funds.
Interest Rate Risk - As a means of limiting its exposure to fair value losses due to rising interest rates, the
City’s investment policy limits investments to those that can be held to maturity and by limiting final maturity
to no more than five (5) years. The City uses the specific identification method for positions in fixed-rate
securities. The investment pools have laddered out maturities within their funds, but are redeemable in full
within one day to the governments investing in the pooled funds.
Credit Risk - Credit risk is the risk that the issuer or other counterparty to an investment will not fulfill its
obligations. The City’s policy allows investment in direct obligations of and other obligations guaranteed as
to principal of the U.S. Treasury and U.S. agencies and instrumentalities with the exception of mortgage backed
securities. It allows investment in obligations of the State of Texas or its agencies and obligations of states,
agencies, counties, cities, and other political subdivisions rated not less than A or its equivalent. The City may
also invest in collateralized certificates of deposit and constant dollar investment pools authorized by the City
Council. On September 30, 2017, Standard & Poor’s rated the investment pools AAAm. The senior unsecured
debt for investments in FHLB, FAMCA, FFCB, FHLMC, and FNMA are rated AA+ by Standard & Poor’s
and Aaa by Moody’s. The municipal bond investments are rated between an AAA and A- by S&P and between
an Aaa and A1 by Moody’s.
Custodial Credit Risk - For an investment, custodial credit risk is the risk that, in the event of the failure of
the counterparty, the City will not be able to recover the value of its investment or collateral securities that are
in the possession of an outside party. The City requires that deposits and repurchase agreements be held in an
institution that has a minimum collateral level of 102.0 percent of the market value. FNMA, FAMCA, FFCB,
FHLMC, FHLB and Municipal Bond investments are held in the City’s name in third party safekeeping by a
Federal Reserve member financial institution designated as a city depository. The City shall maintain a list of
authorized broker/dealers and financial institutions, which are approved by the Audit and Investment
Committee for investment purposes.
73
City of Lubbock, Texas
Notes to Basic Financial Statements
September 30, 2017
Concentration of Credit Risk - The City places limits on the amount that may be invested in any one issuer
with the exception of United States Treasury obligations and State Investment Pools. As of September 30,
2017, the City’s investments constituted the following percentages of total investments:
Investment Percentage
State Investment Pools 77.05
Municipal Bonds 8.54
FHLB 4.72
FHLMC 3.65
FNMA 3.14
FFCB 2.56
FAMCA .20
CD .12
Money Market .02
Foreign Currency Risk - This risk relates to adverse effects on the fair value of an investment from changes
in exchange rates. The City has no foreign currency risk.
Disclosures about Fair Value of Assets and Liabilities
Fair value is the price that would be received to sell an asset or paid to transfer a liability in an orderly
transaction between market participants at the measurement date. Fair value measurements must maximize
the use of observable inputs and minimize the use of unobservable inputs. There is a hierarchy of three levels
of inputs that may be used to measure fair value:
Level 1 Quoted prices in active markets for identical assets or liabilities
Level 2 Observable inputs other than Level 1 prices, such as quoted prices for similar assets or liabilities;
quoted prices in markets that are not active; or other inputs that are observable or can be corroborated
by observable market data for substantially the full term of the assets or liabilities
Level 3 Unobservable inputs supported by little or no market activity and are significant to the fair value of
the assets or liabilities
74
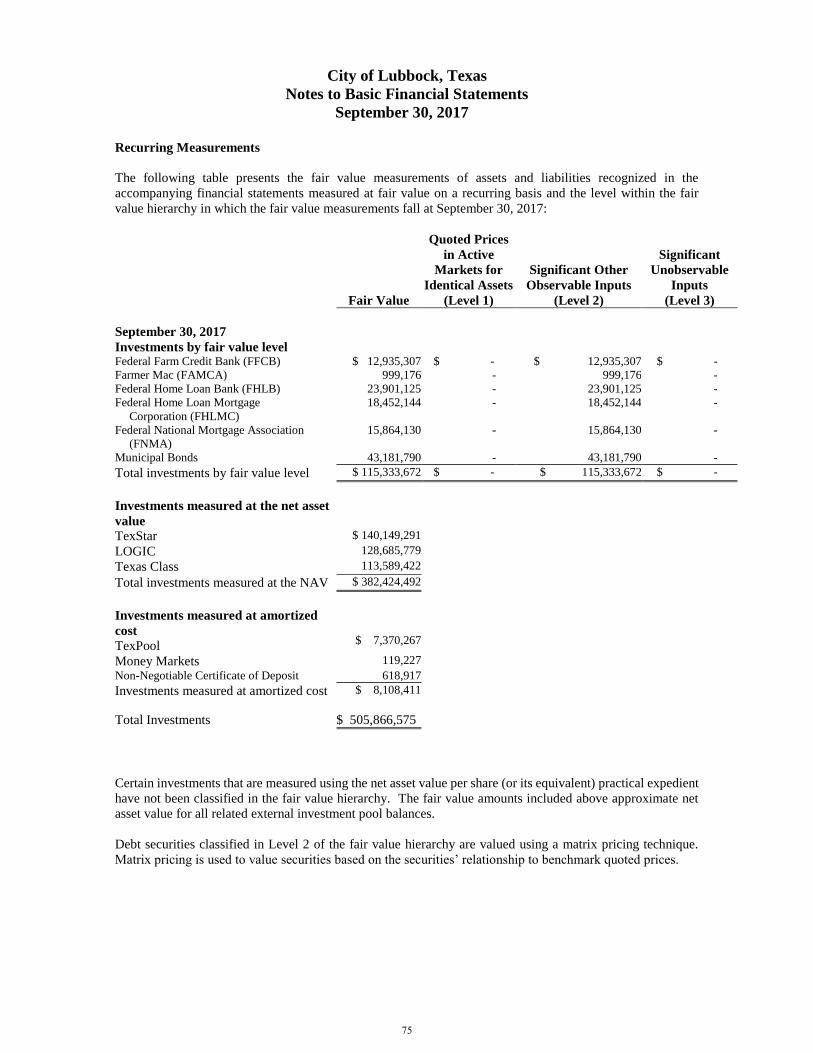
City of Lubbock, Texas
Notes to Basic Financial Statements
September 30, 2017
Recurring Measurements
The following table presents the fair value measurements of assets and liabilities recognized in the
accompanying financial statements measured at fair value on a recurring basis and the level within the fair
value hierarchy in which the fair value measurements fall at September 30, 2017:
Fair Value
Quoted Prices
in Active
Markets for
Identical Assets
(Level 1)
Significant Other
Observable Inputs
(Level 2)
Significant
Unobservable
Inputs
(Level 3)
September 30, 2017
Investments by fair value level Federal Farm Credit Bank (FFCB) $ 12,935,307 $ - $ 12,935,307 $ -
Farmer Mac (FAMCA) 999,176 - 999,176 -
Federal Home Loan Bank (FHLB) 23,901,125 - 23,901,125 -
Federal Home Loan Mortgage
Corporation (FHLMC)
18,452,144 - 18,452,144 -
Federal National Mortgage Association
(FNMA)
15,864,130 - 15,864,130 -
Municipal Bonds 43,181,790 - 43,181,790 -
Total investments by fair value level $ 115,333,672 $ - $ 115,333,672 $ -
Investments measured at the net asset
value
TexStar $ 140,149,291
LOGIC 128,685,779
Texas Class 113,589,422
Total investments measured at the NAV $ 382,424,492
Investments measured at amortized
cost
TexPool
$ 7,370,267
Money Markets 119,227 Non-Negotiable Certificate of Deposit 618,917
Investments measured at amortized cost $ 8,108,411
Total Investments $ 505,866,575
Certain investments that are measured using the net asset value per share (or its equivalent) practical expedient
have not been classified in the fair value hierarchy. The fair value amounts included above approximate net
asset value for all related external investment pool balances.
Debt securities classified in Level 2 of the fair value hierarchy are valued using a matrix pricing technique.
Matrix pricing is used to value securities based on the securities’ relationship to benchmark quoted prices.
75
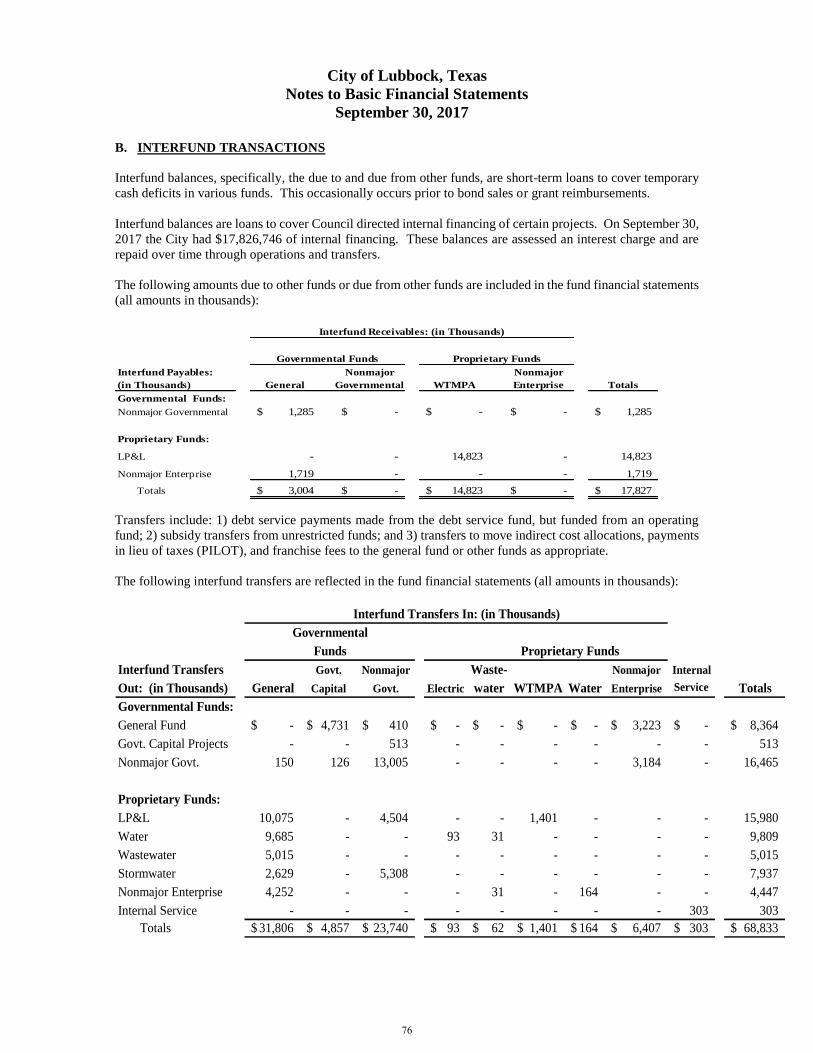
City of Lubbock, Texas
Notes to Basic Financial Statements
September 30, 2017
B. INTERFUND TRANSACTIONS
Interfund balances, specifically, the due to and due from other funds, are short-term loans to cover temporary
cash deficits in various funds. This occasionally occurs prior to bond sales or grant reimbursements.
Interfund balances are loans to cover Council directed internal financing of certain projects. On September 30,
2017 the City had $17,826,746 of internal financing. These balances are assessed an interest charge and are
repaid over time through operations and transfers.
The following amounts due to other funds or due from other funds are included in the fund financial statements
(all amounts in thousands):
Transfers include: 1) debt service payments made from the debt service fund, but funded from an operating
fund; 2) subsidy transfers from unrestricted funds; and 3) transfers to move indirect cost allocations, payments
in lieu of taxes (PILOT), and franchise fees to the general fund or other funds as appropriate.
The following interfund transfers are reflected in the fund financial statements (all amounts in thousands):
Proprietary Funds
Interfund Transfers Govt. Nonmajor Waste- Nonmajor Internal
Out: (in Thousands) General Capital Govt. Electric water WTMPA Water Enterprise Service Totals
Governmental Funds:
General Fund -$ 4,731$ 410$ -$ -$ -$ -$ 3,223$ -$ 8,364$
Govt. Capital Projects - - 513 - - - - - - 513
Nonmajor Govt. 150 126 13,005 - - - - 3,184 - 16,465
Proprietary Funds:
LP&L 10,075 - 4,504 - - 1,401 - - - 15,980
Water 9,685 - - 93 31 - - - - 9,809
Wastewater 5,015 - - - - - - - - 5,015
Stormwater 2,629 - 5,308 - - - - - - 7,937
Nonmajor Enterprise 4,252 - - - 31 - 164 - - 4,447
Internal Service - - - - - - - - 303 303
Totals 31,806$ 4,857$ 23,740$ 93$ 62$ 1,401$ 164$ 6,407$ 303$ 68,833$
Interfund Transfers In: (in Thousands)
Governmental
Funds
Interfund Payables: Nonmajor Nonmajor
(in Thousands) General Governmental WTMPA Enterprise Totals
Governmental Funds:
Nonmajor Governmental 1,285$ -$ -$ -$ 1,285$
Proprietary Funds:
LP&L - - 14,823 - 14,823
Nonmajor Enterprise 1,719 - - - 1,719
Totals 3,004$ -$ 14,823$ -$ 17,827$
Interfund Receivables: (in Thousands)
Governmental Funds Proprietary Funds
76
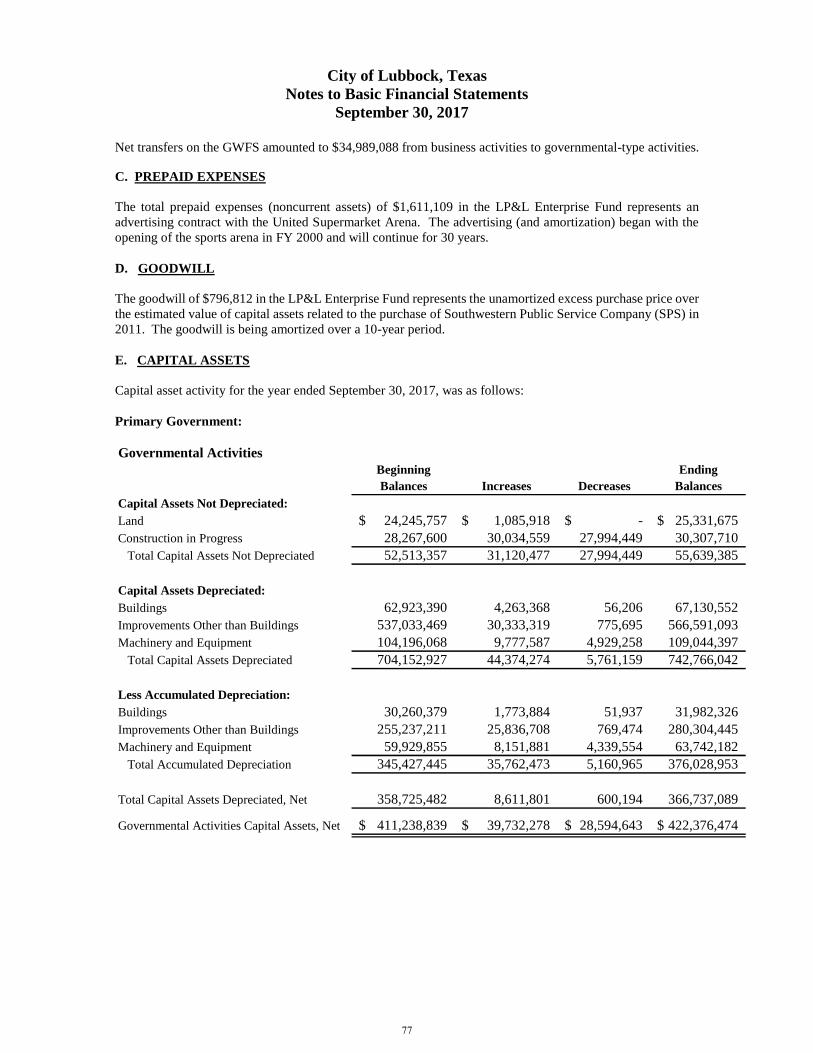
City of Lubbock, Texas
Notes to Basic Financial Statements
September 30, 2017
Net transfers on the GWFS amounted to $34,989,088 from business activities to governmental-type activities.
C. PREPAID EXPENSES
The total prepaid expenses (noncurrent assets) of $1,611,109 in the LP&L Enterprise Fund represents an
advertising contract with the United Supermarket Arena. The advertising (and amortization) began with the
opening of the sports arena in FY 2000 and will continue for 30 years.
D. GOODWILL
The goodwill of $796,812 in the LP&L Enterprise Fund represents the unamortized excess purchase price over
the estimated value of capital assets related to the purchase of Southwestern Public Service Company (SPS) in
2011. The goodwill is being amortized over a 10-year period.
E. CAPITAL ASSETS
Capital asset activity for the year ended September 30, 2017, was as follows:
Primary Government:
Governmental Activities
Beginning Ending
Balances Increases Decreases Balances
Capital Assets Not Depreciated:
Land 24,245,757$ 1,085,918$ -$ 25,331,675$
Construction in Progress 28,267,600 30,034,559 27,994,449 30,307,710
Total Capital Assets Not Depreciated 52,513,357 31,120,477 27,994,449 55,639,385
Capital Assets Depreciated:
Buildings 62,923,390 4,263,368 56,206 67,130,552
Improvements Other than Buildings 537,033,469 30,333,319 775,695 566,591,093
Machinery and Equipment 104,196,068 9,777,587 4,929,258 109,044,397
Total Capital Assets Depreciated 704,152,927 44,374,274 5,761,159 742,766,042
Less Accumulated Depreciation:
Buildings 30,260,379 1,773,884 51,937 31,982,326
Improvements Other than Buildings 255,237,211 25,836,708 769,474 280,304,445
Machinery and Equipment 59,929,855 8,151,881 4,339,554 63,742,182
Total Accumulated Depreciation 345,427,445 35,762,473 5,160,965 376,028,953
Total Capital Assets Depreciated, Net 358,725,482 8,611,801 600,194 366,737,089
Governmental Activities Capital Assets, Net 411,238,839$ 39,732,278$ 28,594,643$ 422,376,474$
77
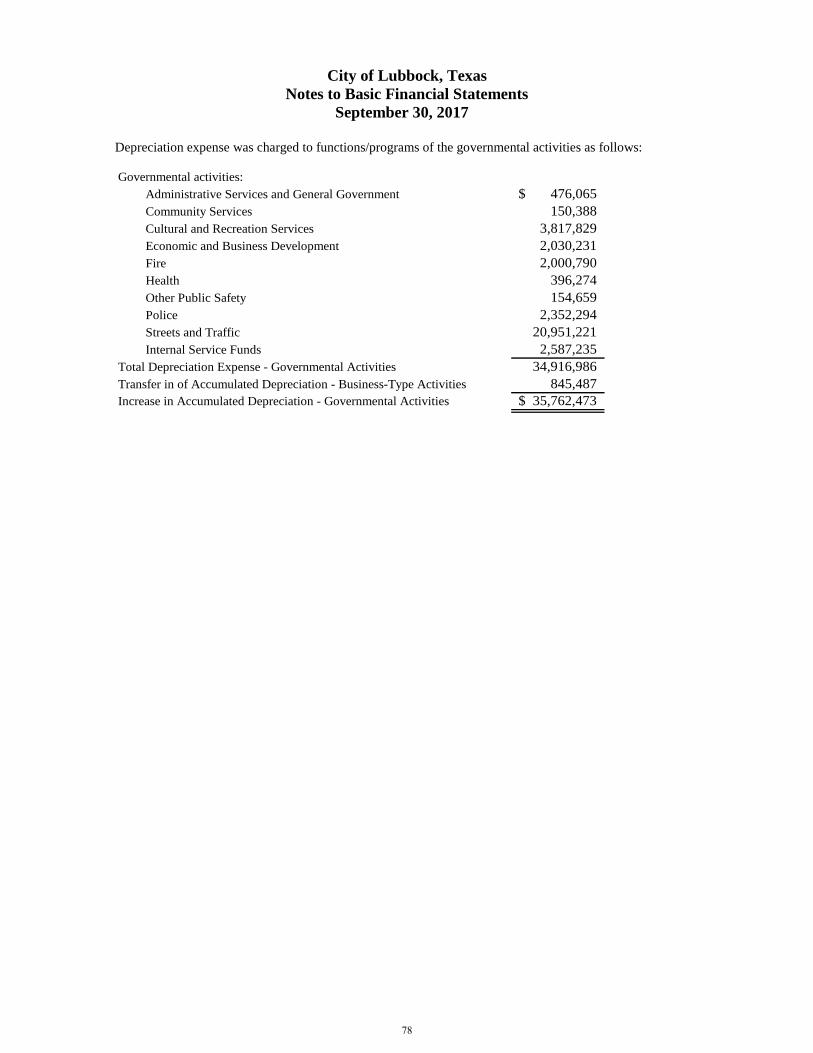
City of Lubbock, Texas
Notes to Basic Financial Statements
September 30, 2017
Depreciation expense was charged to functions/programs of the governmental activities as follows:
Governmental activities:
Administrative Services and General Government 476,065$
Community Services 150,388
Cultural and Recreation Services 3,817,829
Economic and Business Development 2,030,231
Fire 2,000,790
Health 396,274
Other Public Safety 154,659
Police 2,352,294
Streets and Traffic 20,951,221
Internal Service Funds 2,587,235
Total Depreciation Expense - Governmental Activities 34,916,986
Transfer in of Accumulated Depreciation - Business-Type Activities 845,487
Increase in Accumulated Depreciation - Governmental Activities 35,762,473$
78
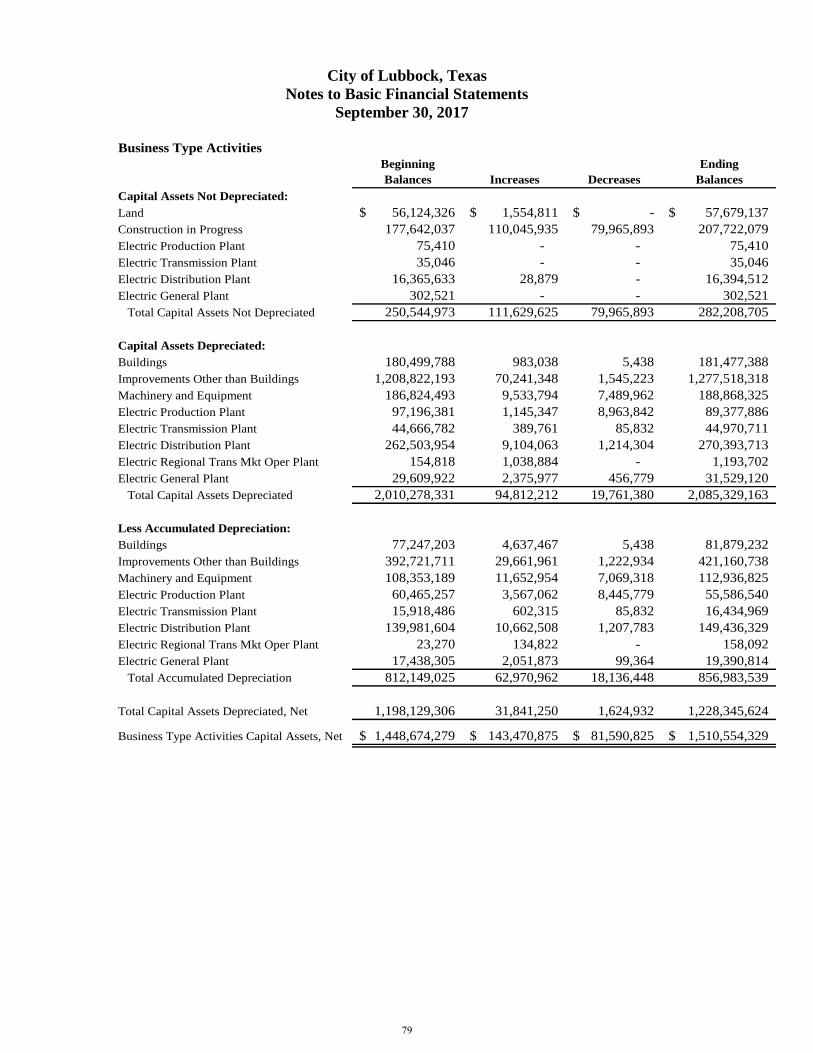
City of Lubbock, Texas
Notes to Basic Financial Statements
September 30, 2017
Business Type Activities
Beginning Ending
Balances Increases Decreases Balances
Capital Assets Not Depreciated:
Land 56,124,326$ 1,554,811$ -$ 57,679,137$
Construction in Progress 177,642,037 110,045,935 79,965,893 207,722,079
Electric Production Plant 75,410 - - 75,410
Electric Transmission Plant 35,046 - - 35,046
Electric Distribution Plant 16,365,633 28,879 - 16,394,512
Electric General Plant 302,521 - - 302,521
Total Capital Assets Not Depreciated 250,544,973 111,629,625 79,965,893 282,208,705
Capital Assets Depreciated:
Buildings 180,499,788 983,038 5,438 181,477,388
Improvements Other than Buildings 1,208,822,193 70,241,348 1,545,223 1,277,518,318
Machinery and Equipment 186,824,493 9,533,794 7,489,962 188,868,325
Electric Production Plant 97,196,381 1,145,347 8,963,842 89,377,886
Electric Transmission Plant 44,666,782 389,761 85,832 44,970,711
Electric Distribution Plant 262,503,954 9,104,063 1,214,304 270,393,713
Electric Regional Trans Mkt Oper Plant 154,818 1,038,884 - 1,193,702
Electric General Plant 29,609,922 2,375,977 456,779 31,529,120
Total Capital Assets Depreciated 2,010,278,331 94,812,212 19,761,380 2,085,329,163
Less Accumulated Depreciation:
Buildings 77,247,203 4,637,467 5,438 81,879,232
Improvements Other than Buildings 392,721,711 29,661,961 1,222,934 421,160,738
Machinery and Equipment 108,353,189 11,652,954 7,069,318 112,936,825
Electric Production Plant 60,465,257 3,567,062 8,445,779 55,586,540
Electric Transmission Plant 15,918,486 602,315 85,832 16,434,969
Electric Distribution Plant 139,981,604 10,662,508 1,207,783 149,436,329
Electric Regional Trans Mkt Oper Plant 23,270 134,822 - 158,092
Electric General Plant 17,438,305 2,051,873 99,364 19,390,814
Total Accumulated Depreciation 812,149,025 62,970,962 18,136,448 856,983,539
Total Capital Assets Depreciated, Net 1,198,129,306 31,841,250 1,624,932 1,228,345,624
Business Type Activities Capital Assets, Net 1,448,674,279$ 143,470,875$ 81,590,825$ 1,510,554,329$
79
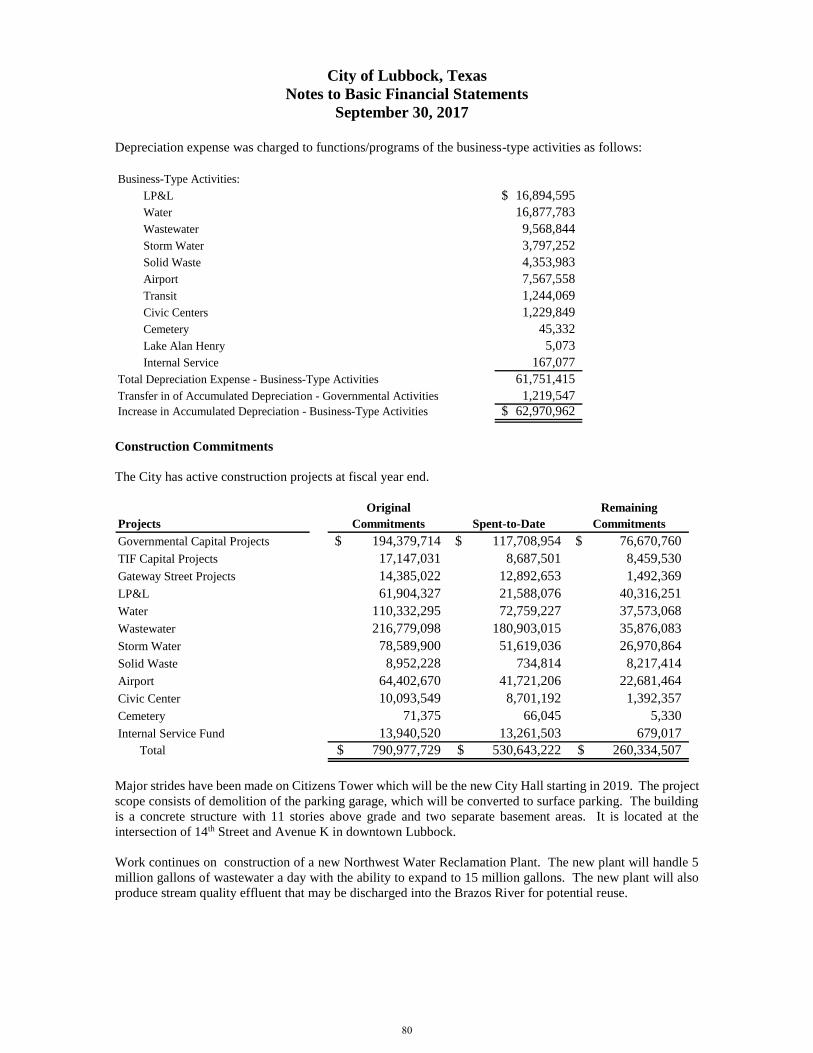
City of Lubbock, Texas
Notes to Basic Financial Statements
September 30, 2017
Depreciation expense was charged to functions/programs of the business-type activities as follows:
Business-Type Activities:
LP&L 16,894,595$
Water 16,877,783
Wastewater 9,568,844
Storm Water 3,797,252
Solid Waste 4,353,983
Airport 7,567,558
Transit 1,244,069
Civic Centers 1,229,849
Cemetery 45,332
Lake Alan Henry 5,073
Internal Service 167,077
Total Depreciation Expense - Business-Type Activities 61,751,415
Transfer in of Accumulated Depreciation - Governmental Activities 1,219,547
Increase in Accumulated Depreciation - Business-Type Activities 62,970,962$
Construction Commitments
The City has active construction projects at fiscal year end.
Original Remaining
Projects Commitments Spent-to-Date Commitments
Governmental Capital Projects 194,379,714$ 117,708,954$ 76,670,760$
TIF Capital Projects 17,147,031 8,687,501 8,459,530
Gateway Street Projects 14,385,022 12,892,653 1,492,369
LP&L 61,904,327 21,588,076 40,316,251
Water 110,332,295 72,759,227 37,573,068
Wastewater 216,779,098 180,903,015 35,876,083
Storm Water 78,589,900 51,619,036 26,970,864
Solid Waste 8,952,228 734,814 8,217,414
Airport 64,402,670 41,721,206 22,681,464
Civic Center 10,093,549 8,701,192 1,392,357
Cemetery 71,375 66,045 5,330
Internal Service Fund 13,940,520 13,261,503 679,017
Total 790,977,729$ 530,643,222$ 260,334,507$
Major strides have been made on Citizens Tower which will be the new City Hall starting in 2019. The project
scope consists of demolition of the parking garage, which will be converted to surface parking. The building
is a concrete structure with 11 stories above grade and two separate basement areas. It is located at the
intersection of 14th Street and Avenue K in downtown Lubbock.
Work continues on construction of a new Northwest Water Reclamation Plant. The new plant will handle 5
million gallons of wastewater a day with the ability to expand to 15 million gallons. The new plant will also
produce stream quality effluent that may be discharged into the Brazos River for potential reuse.
80
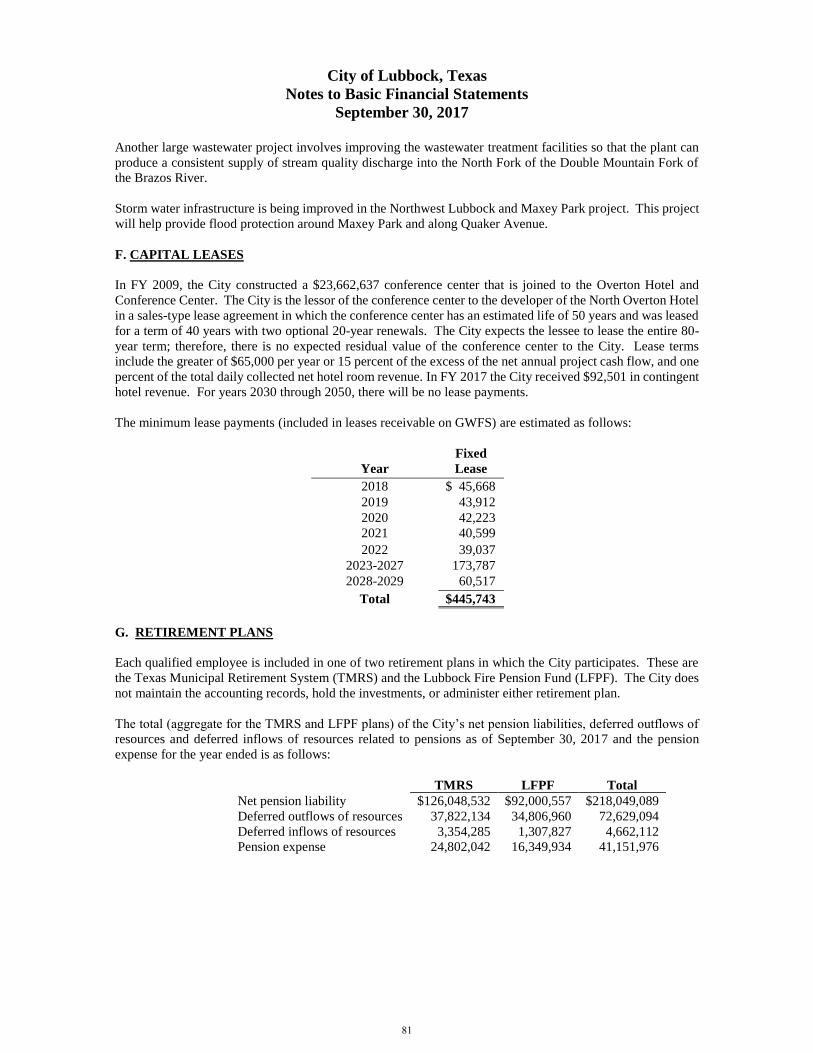
City of Lubbock, Texas
Notes to Basic Financial Statements
September 30, 2017
Another large wastewater project involves improving the wastewater treatment facilities so that the plant can
produce a consistent supply of stream quality discharge into the North Fork of the Double Mountain Fork of
the Brazos River.
Storm water infrastructure is being improved in the Northwest Lubbock and Maxey Park project. This project
will help provide flood protection around Maxey Park and along Quaker Avenue.
F. CAPITAL LEASES
In FY 2009, the City constructed a $23,662,637 conference center that is joined to the Overton Hotel and
Conference Center. The City is the lessor of the conference center to the developer of the North Overton Hotel
in a sales-type lease agreement in which the conference center has an estimated life of 50 years and was leased
for a term of 40 years with two optional 20-year renewals. The City expects the lessee to lease the entire 80-
year term; therefore, there is no expected residual value of the conference center to the City. Lease terms
include the greater of $65,000 per year or 15 percent of the excess of the net annual project cash flow, and one
percent of the total daily collected net hotel room revenue. In FY 2017 the City received $92,501 in contingent
hotel revenue. For years 2030 through 2050, there will be no lease payments.
The minimum lease payments (included in leases receivable on GWFS) are estimated as follows:
Year
Fixed
Lease
2018 $ 45,668
2019 43,912
2020 42,223
2021 40,599
2022 39,037
2023-2027 173,787
2028-2029 60,517
Total $445,743
G. RETIREMENT PLANS
Each qualified employee is included in one of two retirement plans in which the City participates. These are
the Texas Municipal Retirement System (TMRS) and the Lubbock Fire Pension Fund (LFPF). The City does
not maintain the accounting records, hold the investments, or administer either retirement plan.
The total (aggregate for the TMRS and LFPF plans) of the City’s net pension liabilities, deferred outflows of
resources and deferred inflows of resources related to pensions as of September 30, 2017 and the pension
expense for the year ended is as follows:
TMRS LFPF Total
Net pension liability $126,048,532 $92,000,557 $218,049,089
Deferred outflows of resources 37,822,134 34,806,960 72,629,094
Deferred inflows of resources 3,354,285 1,307,827 4,662,112
Pension expense 24,802,042 16,349,934 41,151,976
81
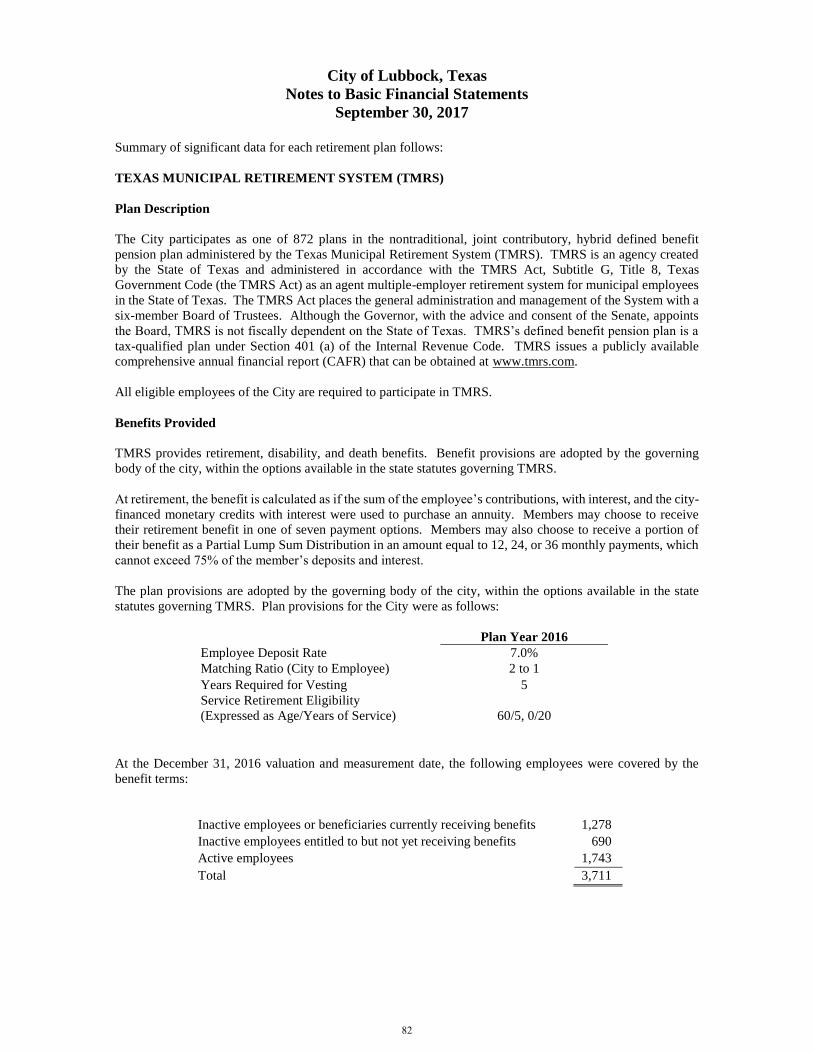
City of Lubbock, Texas
Notes to Basic Financial Statements
September 30, 2017
Summary of significant data for each retirement plan follows:
TEXAS MUNICIPAL RETIREMENT SYSTEM (TMRS)
Plan Description
The City participates as one of 872 plans in the nontraditional, joint contributory, hybrid defined benefit
pension plan administered by the Texas Municipal Retirement System (TMRS). TMRS is an agency created
by the State of Texas and administered in accordance with the TMRS Act, Subtitle G, Title 8, Texas
Government Code (the TMRS Act) as an agent multiple-employer retirement system for municipal employees
in the State of Texas. The TMRS Act places the general administration and management of the System with a
six-member Board of Trustees. Although the Governor, with the advice and consent of the Senate, appoints
the Board, TMRS is not fiscally dependent on the State of Texas. TMRS’s defined benefit pension plan is a
tax-qualified plan under Section 401 (a) of the Internal Revenue Code. TMRS issues a publicly available
comprehensive annual financial report (CAFR) that can be obtained at www.tmrs.com.
All eligible employees of the City are required to participate in TMRS.
Benefits Provided
TMRS provides retirement, disability, and death benefits. Benefit provisions are adopted by the governing
body of the city, within the options available in the state statutes governing TMRS.
At retirement, the benefit is calculated as if the sum of the employee’s contributions, with interest, and the city-
financed monetary credits with interest were used to purchase an annuity. Members may choose to receive
their retirement benefit in one of seven payment options. Members may also choose to receive a portion of
their benefit as a Partial Lump Sum Distribution in an amount equal to 12, 24, or 36 monthly payments, which
cannot exceed 75% of the member’s deposits and interest.
The plan provisions are adopted by the governing body of the city, within the options available in the state
statutes governing TMRS. Plan provisions for the City were as follows:
Plan Year 2016
Employee Deposit Rate 7.0%
Matching Ratio (City to Employee) 2 to 1
Years Required for Vesting 5
Service Retirement Eligibility
(Expressed as Age/Years of Service)
60/5, 0/20
At the December 31, 2016 valuation and measurement date, the following employees were covered by the
benefit terms:
Inactive employees or beneficiaries currently receiving benefits 1,278
Inactive employees entitled to but not yet receiving benefits 690
Active employees 1,743
Total 3,711
82
City of Lubbock, Texas
Notes to Basic Financial Statements
September 30, 2017
Contributions
The contribution rates for employees in TMRS are either 5%, 6%, or 7% of employee gross earnings, and the
city matching percentages are either 100%, 150%, or 200%, both as adopted by the governing body of the city.
Under the state law governing TMRS, the contribution rate for each city is determined annually by the actuary,
using the Entry Age Normal (EAN) actuarial cost method. The actuarially determined rate is the estimated
amount necessary to finance the cost of benefits earned by employees during the year, with an additional
amount to finance any unfunded accrued liability.
Employees for the City were required to contribute 7% of their annual gross earnings during the fiscal year.
The contribution rates for the City were 17.96% and 17.95% in calendar years 2016 and 2017, respectively.
The City’s contribution to TMRS for the year ended September 30, 2017, were $17,128,597, and were equal
to the required contributions.
Net Pension Liability
The City’s net pension liability (NPL) was measured as of December 31, 2016, and the total pension liability
(TPL) used to calculate the net pension liability was determined by an actuarial valuation as of that date.
Actuarial assumptions
The total pension liability in the December 31, 2016 actuarial valuation was determined using the following
actuarial assumptions:
Inflation 2.5% per year
Overall payroll growth 3.0% per year
Investment Rate of Return 6.75%, net of pension investment expense, including inflation
Salary increases were based on a service-related table. Mortality rates for active members, retirees, and
beneficiaries were based on the gender-distinct RP2000 Combined Healthy Mortality Table, with male rates
multiplied by 109% and female rates multiplied by 103%. The rates are projected on a fully generational basis
by scale BB to account for future mortality improvements. For disabled annuitants, the gender-distinct RP2000
Combined Healthy Tables with Blue Collar Adjustment are used with male rates multiplied by 109% and
female rates multiplied by 103% with a 3-year set-forward for both males and females. In addition, a 3%
minimum mortality rate is applied to reflect the impairment for younger members who become disabled. The
rates are projected on a fully generational basis by scale BB to account for future mortality improvements
subject to the 3% floor.
Actuarial assumptions used in the December 31, 2016, valuation were based on the results of actuarial
experience studies. The experience study in TMRS was for the period December 31, 2010 through December
31, 2014. Healthy post-retirement mortality rates and annuity purchase rates were updated based on a Mortality
Experience Investigation Study covering 2009 through 2011, and dated December 31, 2013. Those
assumptions were first used in the December 31, 2013 valuation, along with a change to Entry Age Normal
(EAN) actuarial cost method. Assumptions are reviewed annually. Plan assets are managed on a total return
basis with an emphasis on both capital appreciation as well as the production of income, in order to satisfy the
short-term and long-term funding needs of TMRS.
The long-term expected rate of return on pension plan investments was determined using a building-block
method in which best estimate ranges of expected future real rates of return (expected returns, net of pension
plan investment expense and inflation) are developed for each major asset class. These ranges are combined
to produce the long-term expected rate of return by weighting the expected future real rates of return by the
target asset allocation percentage and by adding expected inflation. In determining their best estimate of a
recommended investment return assumption under the various alternative asset allocation portfolios, GRS
83
City of Lubbock, Texas
Notes to Basic Financial Statements
September 30, 2017
focused on the area between (1) arithmetic mean (aggressive) without an adjustment for time (conservative)
and (2) the geometric mean (conservative) with and adjustment for time (aggressive). The target allocation
and best estimates of real rates of return for each major asset class in fiscal year 2017 are summarized in the
following table:
Asset Class
Target
Allocation
Long-Term Expected Real Rate of Return (Arithmetic)
Domestic Equity 17.5% 4.55%
International Equity 17.5% 6.35%
Core Fixed Income 10.0% 1.00%
Non-Core Fixed
Income
20.0% 4.15%
Real Return 10.0% 4.15%
Real Estate 10.0% 4.75%
Absolute Return 10.0% 4.00%
Private Equity 5.0% 7.75%
Total 100.0%
Discount rate
The discount rate used to measure the total pension liability was 6.75%. The projection of cash flows used to
determine the discount rate assumed that employee and employer contributions will be made at the rates
specified in statute. Based on that assumption, the pension plan’s fiduciary net position was projected to be
available to make all projected future benefit payments of current active and inactive plan members. Therefore,
the long-term expected rate of return on pension plan investments was applied to all periods of projected benefit
payments to determine the total pension liability.
Changes in the Net Pension Liability Increase (Decrease)
Total Pension
Liability
(a)
Plan Fiduciary
Net Position
(b)
Net Pension
Liability
(a)-(b)
Balance at September 30, 2016 $ 653,584,576 $ 528,295,289 $125,289,287
Changes for the year:
Service cost 15,823,941 - 15,823,941
Interest 43,569,660 - 43,569,660
Difference between expected and actual
experience
(116,124)
-
(116,124)
Contributions – employer - 16,727,368 (16,727,368)
Contributions - employee - 6,519,575 (6,519,575)
Net investment income - 35,696,237 (35,696,237)
Benefit payments, including refunds of
employee contributions
(32,040,199)
(32,040,199)
-
Administrative expense - (403,223) 403,223
Other changes - (21,725) 21,725
Net changes $ 27,237,278 $ 26,478,033 759,245
Balance at September 30, 2017 $680,821,854 $ 554,773,322 $126,048,532
84
City of Lubbock, Texas
Notes to Basic Financial Statements
September 30, 2017
Sensitivity of the net pension liability to changes in the discount rate
The following represents the net pension liability of the City, calculated using the discount rate of 6.75, as well
as what the City’s net pension liability would be if it were calculated using a discount rate that is1-percentage-
point lower (5.75) or 1-percentage-point higher (7.75%) than the current rate:
1% Decrease in
Discount Rate (5.75%)
Discount Rate (6.75%)
1% Increase in
Discount Rate (7.75)
City’s net pension liability $218,409,064 $126,048,532 $50,078,881
Pension Plan Fiduciary Net Position
Detailed information about the pension plan’s fiduciary net position is available in a separately-issued TMRS
financial report. That report may be obtained on the Internet at www.tmrs.com.
Pension Expense and Deferred Outflow of Resources and Deferred Inflows of Resources Related to
Pensions
For the year ended September 30, 2017 the City recognized pension expense of $24,802,042.
At September 30, 2017, the City reported deferred outflows of resources and deferred inflows of resources
related to pensions from the following sources:
Deferred
Outflows of
Resources
Deferred
Inflows of
Resources
Difference in expected and actual experience $ - $ 3,354,285
Difference in assumption changes 604,082 -
Difference between projected and actual
investment earnings
24,644,073
-
Contributions subsequent to the measurement
date
12,573,979
-
Total $ 37,822,134 $ 3,354,285
$12,573,979 reported as deferred outflows of resources related to pensions resulting from contributions
subsequent to the measurement date will be recognized as a reduction of the net pension liability as of
September 30, 2018. Other amounts reported as deferred outflows and inflows of resources related to pensions
will be recognized in pension expense as follows:
Year ending September 30:
2018 $ 7,163,000
2019 7,576,221
2020 7,174,814
2021 (20,165)
Total $21,893,870
85
City of Lubbock, Texas
Notes to Basic Financial Statements
September 30, 2017
LUBBOCK FIRE PENSION FUND (LFPF)
Plan Description
The Board of Trustees of the LFPF is the administrator of a single-employer defined benefit pension plan. This
pension fund is a trust fund. It is reported by the City as a related organization and is not considered to be a
part of the City financial reporting entity. Firefighters in the Lubbock Fire Department are covered by the
LFPF.
Benefits Provided
The LFPF provides service retirement, death, disability, and withdrawal benefits. These benefits fully vest
after 20 years of credited service. A partially vested benefit is provided for firefighters who terminate
employment with at least 10 but less than 20 years of service. Employees may retire at age 50 with 20 years
of service. A reduced early service retirement benefit is provided for employees who terminate employment
with 20 or more years of service. The LFPF Plan, most recently amended on September 9, 2015, provides a
monthly normal service retirement benefit, payable in a Joint and Two-Thirds to Spouse form of annuity, equal
to 68.92 percent of final 48-month average salary plus $335.05 per month for each year of service in excess of
20 years.
A firefighter has the option to participate in a Retroactive Deferred Retirement Option Plan (RETRO DROP)
which provides a lump sum benefit and a reduced annuity upon termination of employment. Firefighters must
be at least 51 years of age with 21 years of service at the selected “RETRO DROP benefit calculation date”
(which is prior to date of employment termination). Early RETRO DROP with benefit reductions is available
at age 50 with 20 years of service for the selected “early RETRO DROP benefit calculation date.” A Partial
Lump Sum option is also available where a reduced monthly benefit is determined based on an elected lump
sum amount such that the combined present value of the benefits under the option is actuarially equivalent to
that of the normal form of the monthly benefit. Optional forms are also available at varying levels of surviving
spouse benefits instead of the standard two-thirds form.
There is no provision for automatic post-retirement benefit increases. LFPF has the authority to provide, and
has periodically provided for in the past, ad hoc post-retirement benefit increases. The benefit provisions of
this plan are authorized by the Texas Local Fire Fighter's Retirement Act (TLFFRA). TLFFRA provides the
authority and procedure to amend benefit provisions. Amending the plan requires approval of any proposed
change by: a) an eligible actuary and b) a majority of the participating members of the fund.
At the December 31, 2016 measurement date, the following employees were covered by the benefit terms:
Retirees and beneficiaries currently receiving benefits 289
Terminated employees entitled to but not yet receiving benefits 2
Active employees 402
Total 693
Contributions
The contribution provisions of this plan are authorized by TLFFRA. TLFFRA provides the authority and
procedure to change the amount of contributions determined as a percentage of pay by each firefighter and a
percentage of payroll by the city. While the actual contribution rates are not actuarially determined, state law
requires that each plan of benefits adopted by LFPF be approved by an eligible actuary. The actuary certifies
that the contribution commitment by the firefighters and the city provides an adequate financing arrangement.
Using the entry age actuarial cost method, LFPF’s service cost contribution rate is determined as a percentage
86
City of Lubbock, Texas
Notes to Basic Financial Statements
September 30, 2017
of payrolls. The excess of the total contribution rate over the service cost contribution is used to amortize
LFPF’s net pension liability, if any, and the number of years needed to amortize LFPF’s net pension liability,
if any is determined using a level percentage of payroll method. The costs of administering the plan are
financed by LFPF.
Employees were required to contribute 12.43% of their annual gross earnings during the fiscal year. The
contribution rates for the City were 21.73% and 21.72% in calendar years 2016 and 2017, respectively. The
City’s contributions to LFPF for the year ended September 30, 2017 were $7,071,721 and were equal to the
required contributions.
Net Pension Liability
The LFPF’s net pension liability (NPL) was measured as of December 31, 2016, and the total pension liability
(TPL) used to calculate the net pension liability was determined by an actuarial valuation as of that date.
Actuarial assumptions
The total pension liability in the December 31, 2016 actuarial valuation was determined using the following
actuarial assumptions:
Inflation 3.0% per year
Overall payroll growth 4.0% per year, compounded annually
Investment Rate of Return 7.75%, compounded annually
The mortality, disability, and termination decrements are assumed to be annual rates, rather than probabilities,
and are adjusted for the interaction between competing decrements. There was no adjustment for the
interaction between those three decrements and the retirement decrement. The 7.75 percent rate of return was
set by examining the fund’s rate of return history and by taking into account future expected rates of return for
portfolios with similar asset allocations. The assumed 7.75 percent rate can be considered to include provision
for inflation at 3.00 percent per year, although other combinations of real return, risk premium, and inflation
are also accounted for by a 7.75 assumed rate. The rate of return is net of trust expenses. The same inflation
component was used in the assumed rate of return on the actuarial value of assets, the assumed increases in
compensation for individual members, and the other actuarial assumptions.
The valuation includes provisions for mortality improvement to 2024. The mortality table used in the valuation
is updated periodically. The actuaries are not aware of any significant event that has occurred since the
valuation date that would have materially changed any of the demographic assumptions selected for the
valuation.
The assumed rate of return was developed using both the plan’s historical rates of return and expected future
rates of return. Rate of return experience studies have been performed in connection with the Plan’s valuations.
87
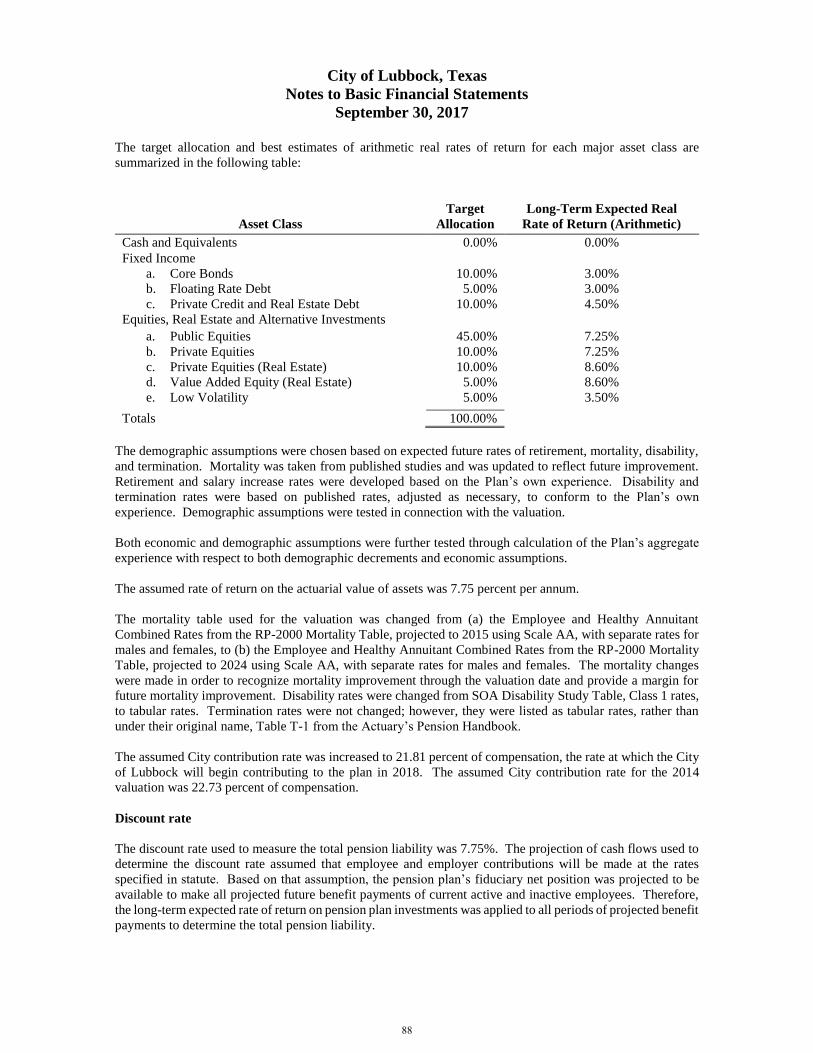
City of Lubbock, Texas
Notes to Basic Financial Statements
September 30, 2017
The target allocation and best estimates of arithmetic real rates of return for each major asset class are
summarized in the following table:
Asset Class
Target
Allocation
Long-Term Expected Real
Rate of Return (Arithmetic)
Cash and Equivalents 0.00% 0.00%
Fixed Income
a. Core Bonds
b. Floating Rate Debt
c. Private Credit and Real Estate Debt
10.00%
5.00%
10.00%
3.00%
3.00%
4.50%
Equities, Real Estate and Alternative Investments
a. Public Equities
b. Private Equities
c. Private Equities (Real Estate)
d. Value Added Equity (Real Estate)
e. Low Volatility
45.00%
10.00%
10.00%
5.00%
5.00%
7.25%
7.25%
8.60%
8.60%
3.50%
Totals 100.00%
The demographic assumptions were chosen based on expected future rates of retirement, mortality, disability,
and termination. Mortality was taken from published studies and was updated to reflect future improvement.
Retirement and salary increase rates were developed based on the Plan’s own experience. Disability and
termination rates were based on published rates, adjusted as necessary, to conform to the Plan’s own
experience. Demographic assumptions were tested in connection with the valuation.
Both economic and demographic assumptions were further tested through calculation of the Plan’s aggregate
experience with respect to both demographic decrements and economic assumptions.
The assumed rate of return on the actuarial value of assets was 7.75 percent per annum.
The mortality table used for the valuation was changed from (a) the Employee and Healthy Annuitant
Combined Rates from the RP-2000 Mortality Table, projected to 2015 using Scale AA, with separate rates for
males and females, to (b) the Employee and Healthy Annuitant Combined Rates from the RP-2000 Mortality
Table, projected to 2024 using Scale AA, with separate rates for males and females. The mortality changes
were made in order to recognize mortality improvement through the valuation date and provide a margin for
future mortality improvement. Disability rates were changed from SOA Disability Study Table, Class 1 rates,
to tabular rates. Termination rates were not changed; however, they were listed as tabular rates, rather than
under their original name, Table T-1 from the Actuary’s Pension Handbook.
The assumed City contribution rate was increased to 21.81 percent of compensation, the rate at which the City
of Lubbock will begin contributing to the plan in 2018. The assumed City contribution rate for the 2014
valuation was 22.73 percent of compensation.
Discount rate
The discount rate used to measure the total pension liability was 7.75%. The projection of cash flows used to
determine the discount rate assumed that employee and employer contributions will be made at the rates
specified in statute. Based on that assumption, the pension plan’s fiduciary net position was projected to be
available to make all projected future benefit payments of current active and inactive employees. Therefore,
the long-term expected rate of return on pension plan investments was applied to all periods of projected benefit
payments to determine the total pension liability.
88
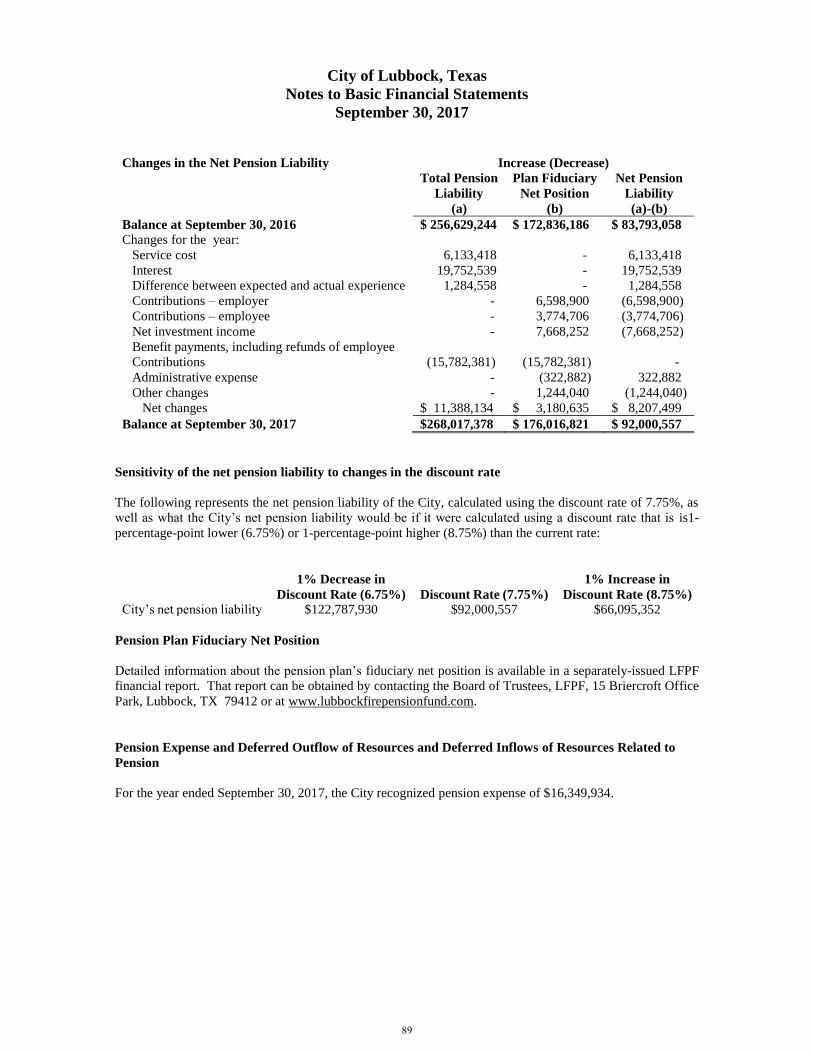
City of Lubbock, Texas
Notes to Basic Financial Statements
September 30, 2017
Changes in the Net Pension Liability Increase (Decrease)
Total Pension
Liability
(a)
Plan Fiduciary
Net Position
(b)
Net Pension
Liability
(a)-(b)
Balance at September 30, 2016 $ 256,629,244 $ 172,836,186 $ 83,793,058
Changes for the year:
Service cost 6,133,418 - 6,133,418
Interest 19,752,539 - 19,752,539
Difference between expected and actual experience 1,284,558 - 1,284,558
Contributions – employer - 6,598,900 (6,598,900)
Contributions – employee - 3,774,706 (3,774,706)
Net investment income - 7,668,252 (7,668,252)
Benefit payments, including refunds of employee
Contributions
(15,782,381)
(15,782,381)
-
Administrative expense - (322,882) 322,882
Other changes - 1,244,040 (1,244,040)
Net changes $ 11,388,134 $ 3,180,635 $ 8,207,499
Balance at September 30, 2017 $268,017,378 $ 176,016,821 $ 92,000,557
Sensitivity of the net pension liability to changes in the discount rate
The following represents the net pension liability of the City, calculated using the discount rate of 7.75%, as
well as what the City’s net pension liability would be if it were calculated using a discount rate that is is1-
percentage-point lower (6.75%) or 1-percentage-point higher (8.75%) than the current rate:
1% Decrease in
Discount Rate (6.75%)
Discount Rate (7.75%)
1% Increase in
Discount Rate (8.75%)
City’s net pension liability $122,787,930 $92,000,557 $66,095,352
Pension Plan Fiduciary Net Position
Detailed information about the pension plan’s fiduciary net position is available in a separately-issued LFPF
financial report. That report can be obtained by contacting the Board of Trustees, LFPF, 15 Briercroft Office
Park, Lubbock, TX 79412 or at www.lubbockfirepensionfund.com.
Pension Expense and Deferred Outflow of Resources and Deferred Inflows of Resources Related to
Pension
For the year ended September 30, 2017, the City recognized pension expense of $16,349,934.
89
City of Lubbock, Texas
Notes to Basic Financial Statements
September 30, 2017
At September 30, 2017, the City reported deferred outflows of resources and deferred inflows of resources
related to pensions from the following sources:
Deferred
Outflows of Resources
Deferred
Inflows of Resources
Difference between expected and actual
economic experience
$ 1,159,725
$ 1,307,827
Changes in actuarial assumptions 7,258,794 -
Difference between projected and actual
investment earnings
21,106,610
-
Contributions subsequent to the measurement
date
5,281,831
-
Total $ 34,806,960 $ 1,307,827
$5,281,831 reported as deferred outflows of resources related to pensions resulting from contributions
subsequent to the measurement date will be recognized as a reduction of the net pension liability as of
September 30, 2018. Other amounts reported as deferred outflows and inflows of resources related to pensions
will be recognized in pension expense as follows:
Year ending September 30:
2018 $ 8,380,750
2019 8,380,751
2020 5,776,834
2021 1,957,952
2022 847,419
Thereafter 2,873,596
Total $28,217,302
H. OTHER POST-EMPLOYMENT BENEFITS (OPEB)
Plan Description
The City sponsors and administers an informal single-employer health/dental plan. Texas statute provides that
retirees from a municipality with a population of 25,000 or more and that receive retirement benefits from a
municipal retirement plan are entitled to purchase continued health benefits coverage for the person and the
person’s dependents unless the person is eligible for group health benefits coverage through another employer.
The State of Texas has the authority to establish and amend the requirements of this statute. The City does not
issue stand-alone financial statements for the health/dental plan. However, all required information is
presented in this report.
Funding Policy
The contribution requirements of plan members are established by the City and may be amended as needed.
Retiree medical/dental coverage levels for retirees are the same as coverage provided to active city employees
in accordance with the terms and conditions of the current City Benefit Plan. Employees who retire with 15
or more years of service or Civil Service employees that retire who have a balance in excess of 90 days sick
leave are eligible to continue receiving medical coverage in full 30-day periods for the term of their sick leave
balance. They are required to pay a prorated premium for the days of coverage that are not funded by their
excess sick leave. Plan members may purchase retiree health/dental care coverage for eligible spouses and
dependents at their own expense and receive a benefit from the blended premium rate from all of the employees
90
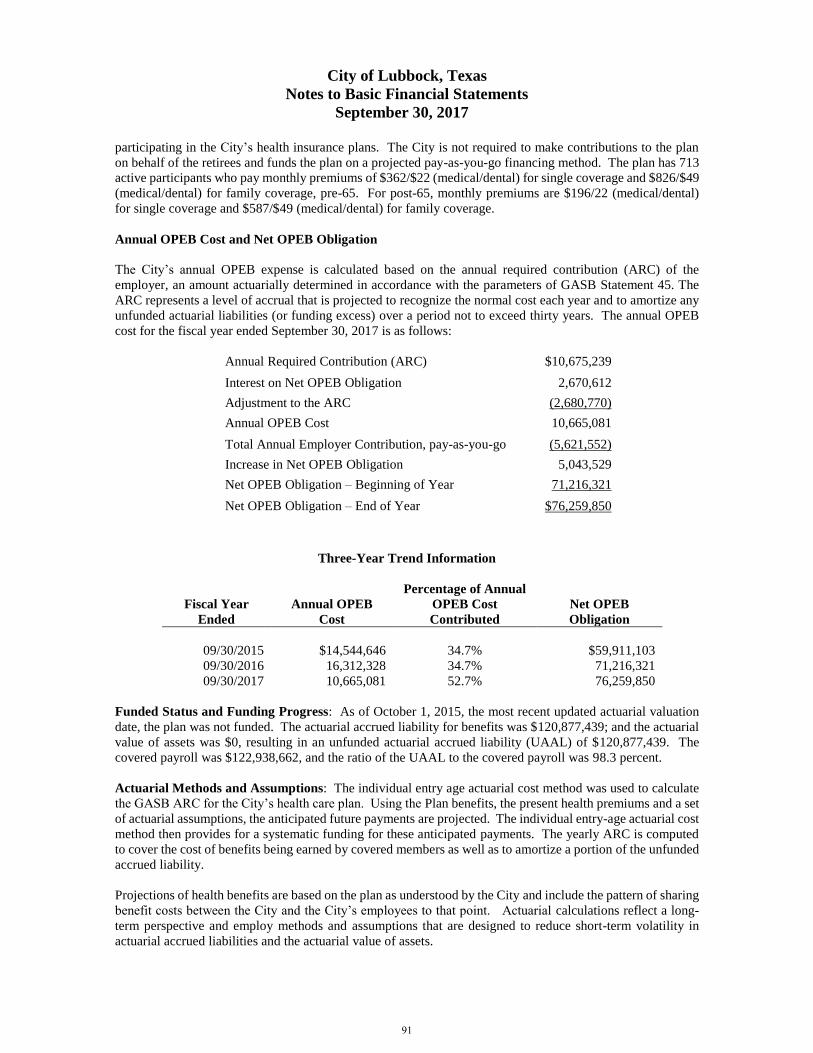
City of Lubbock, Texas
Notes to Basic Financial Statements
September 30, 2017
participating in the City’s health insurance plans. The City is not required to make contributions to the plan
on behalf of the retirees and funds the plan on a projected pay-as-you-go financing method. The plan has 713
active participants who pay monthly premiums of $362/$22 (medical/dental) for single coverage and $826/$49
(medical/dental) for family coverage, pre-65. For post-65, monthly premiums are $196/22 (medical/dental)
for single coverage and $587/$49 (medical/dental) for family coverage.
Annual OPEB Cost and Net OPEB Obligation
The City’s annual OPEB expense is calculated based on the annual required contribution (ARC) of the
employer, an amount actuarially determined in accordance with the parameters of GASB Statement 45. The
ARC represents a level of accrual that is projected to recognize the normal cost each year and to amortize any
unfunded actuarial liabilities (or funding excess) over a period not to exceed thirty years. The annual OPEB
cost for the fiscal year ended September 30, 2017 is as follows:
Annual Required Contribution (ARC) $10,675,239
Interest on Net OPEB Obligation 2,670,612
Adjustment to the ARC (2,680,770)
Annual OPEB Cost 10,665,081
Total Annual Employer Contribution, pay-as-you-go (5,621,552)
Increase in Net OPEB Obligation 5,043,529
Net OPEB Obligation – Beginning of Year 71,216,321
Net OPEB Obligation – End of Year $76,259,850
Three-Year Trend Information
Fiscal Year
Ended
Annual OPEB
Cost
Percentage of Annual
OPEB Cost
Contributed
Net OPEB
Obligation
09/30/2015 $14,544,646 34.7% $59,911,103
09/30/2016 16,312,328 34.7% 71,216,321
09/30/2017 10,665,081 52.7% 76,259,850
Funded Status and Funding Progress: As of October 1, 2015, the most recent updated actuarial valuation
date, the plan was not funded. The actuarial accrued liability for benefits was $120,877,439; and the actuarial
value of assets was $0, resulting in an unfunded actuarial accrued liability (UAAL) of $120,877,439. The
covered payroll was $122,938,662, and the ratio of the UAAL to the covered payroll was 98.3 percent.
Actuarial Methods and Assumptions: The individual entry age actuarial cost method was used to calculate
the GASB ARC for the City’s health care plan. Using the Plan benefits, the present health premiums and a set
of actuarial assumptions, the anticipated future payments are projected. The individual entry-age actuarial cost
method then provides for a systematic funding for these anticipated payments. The yearly ARC is computed
to cover the cost of benefits being earned by covered members as well as to amortize a portion of the unfunded
accrued liability.
Projections of health benefits are based on the plan as understood by the City and include the pattern of sharing
benefit costs between the City and the City’s employees to that point. Actuarial calculations reflect a long-
term perspective and employ methods and assumptions that are designed to reduce short-term volatility in
actuarial accrued liabilities and the actuarial value of assets.
91
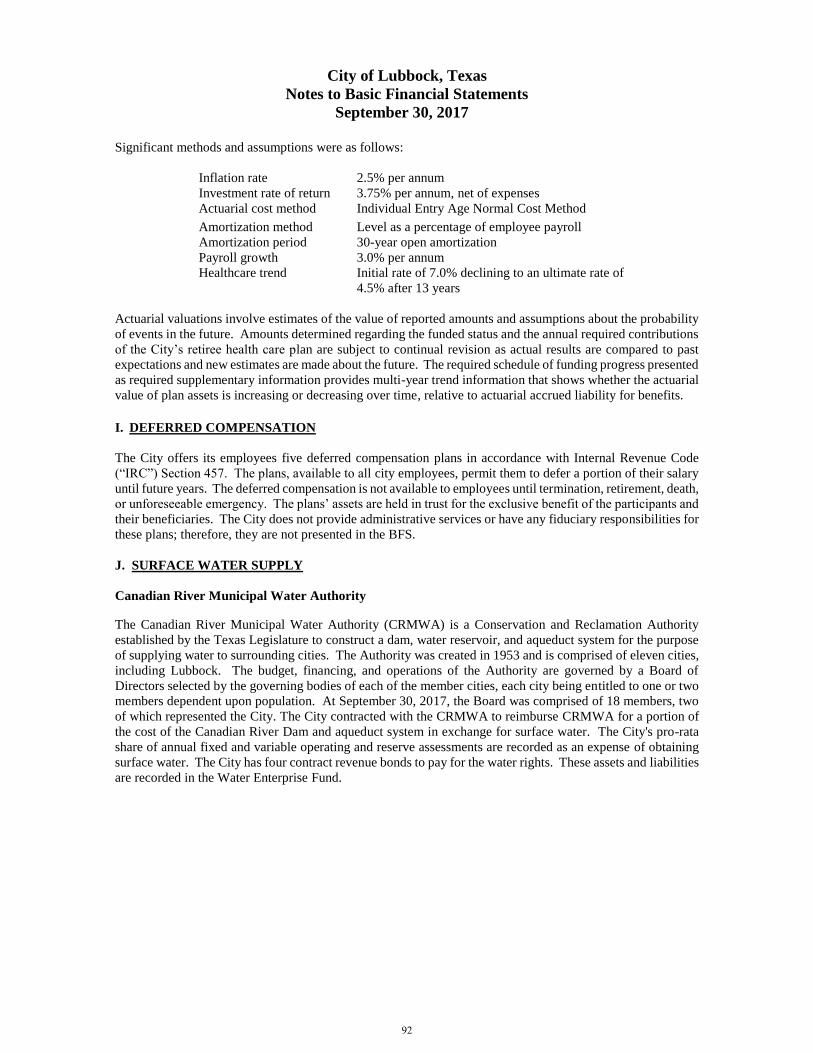
City of Lubbock, Texas
Notes to Basic Financial Statements
September 30, 2017
Significant methods and assumptions were as follows:
Inflation rate 2.5% per annum
Investment rate of return 3.75% per annum, net of expenses
Actuarial cost method Individual Entry Age Normal Cost Method
Amortization method Level as a percentage of employee payroll
Amortization period 30-year open amortization
Payroll growth
Healthcare trend
3.0% per annum
Initial rate of 7.0% declining to an ultimate rate of
4.5% after 13 years
Actuarial valuations involve estimates of the value of reported amounts and assumptions about the probability
of events in the future. Amounts determined regarding the funded status and the annual required contributions
of the City’s retiree health care plan are subject to continual revision as actual results are compared to past
expectations and new estimates are made about the future. The required schedule of funding progress presented
as required supplementary information provides multi-year trend information that shows whether the actuarial
value of plan assets is increasing or decreasing over time, relative to actuarial accrued liability for benefits.
I. DEFERRED COMPENSATION
The City offers its employees five deferred compensation plans in accordance with Internal Revenue Code
(“IRC”) Section 457. The plans, available to all city employees, permit them to defer a portion of their salary
until future years. The deferred compensation is not available to employees until termination, retirement, death,
or unforeseeable emergency. The plans’ assets are held in trust for the exclusive benefit of the participants and
their beneficiaries. The City does not provide administrative services or have any fiduciary responsibilities for
these plans; therefore, they are not presented in the BFS.
J. SURFACE WATER SUPPLY
Canadian River Municipal Water Authority
The Canadian River Municipal Water Authority (CRMWA) is a Conservation and Reclamation Authority
established by the Texas Legislature to construct a dam, water reservoir, and aqueduct system for the purpose
of supplying water to surrounding cities. The Authority was created in 1953 and is comprised of eleven cities,
including Lubbock. The budget, financing, and operations of the Authority are governed by a Board of
Directors selected by the governing bodies of each of the member cities, each city being entitled to one or two
members dependent upon population. At September 30, 2017, the Board was comprised of 18 members, two
of which represented the City. The City contracted with the CRMWA to reimburse CRMWA for a portion of
the cost of the Canadian River Dam and aqueduct system in exchange for surface water. The City's pro-rata
share of annual fixed and variable operating and reserve assessments are recorded as an expense of obtaining
surface water. The City has four contract revenue bonds to pay for the water rights. These assets and liabilities
are recorded in the Water Enterprise Fund.
92
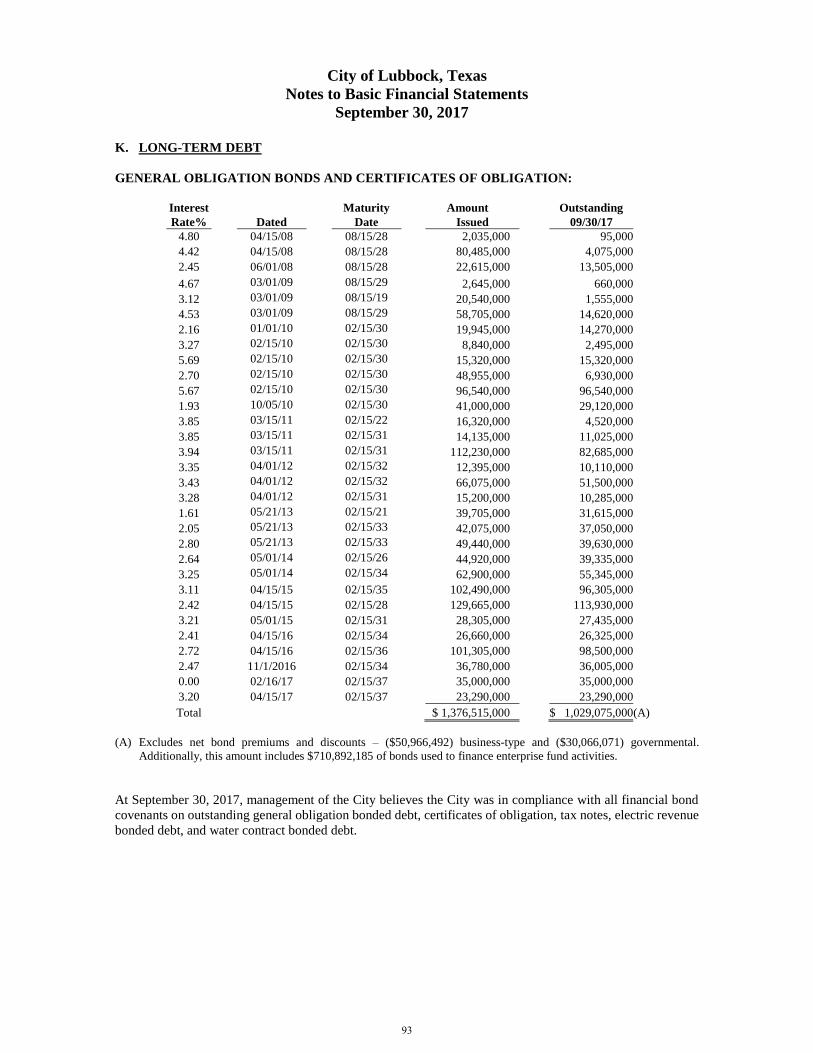
City of Lubbock, Texas
Notes to Basic Financial Statements
September 30, 2017
K. LONG-TERM DEBT
GENERAL OBLIGATION BONDS AND CERTIFICATES OF OBLIGATION:
Interest Maturity Amount Outstanding
Rate% Dated Date Issued 09/30/17
4.80 04/15/08 08/15/28 2,035,000 95,000
4.42 04/15/08 08/15/28 80,485,000 4,075,000
2.45 06/01/08 08/15/28 22,615,000 13,505,000
4.67 03/01/09 08/15/29 2,645,000 660,000
3.12 03/01/09 08/15/19 20,540,000 1,555,000
4.53 03/01/09 08/15/29 58,705,000 14,620,000
2.16 01/01/10 02/15/30 19,945,000 14,270,000
3.27 02/15/10 02/15/30 8,840,000 2,495,000
5.69 02/15/10 02/15/30 15,320,000 15,320,000
2.70 02/15/10 02/15/30 48,955,000 6,930,000
5.67 02/15/10 02/15/30 96,540,000 96,540,000
1.93 10/05/10 02/15/30 41,000,000 29,120,000
3.85 03/15/11 02/15/22 16,320,000 4,520,000
3.85 03/15/11 02/15/31 14,135,000 11,025,000
3.94 03/15/11 02/15/31 112,230,000 82,685,000
3.35 04/01/12 02/15/32 12,395,000 10,110,000
3.43 04/01/12 02/15/32 66,075,000 51,500,000
3.28 04/01/12 02/15/31 15,200,000 10,285,000
1.61 05/21/13 02/15/21 39,705,000 31,615,000
2.05 05/21/13 02/15/33 42,075,000 37,050,000
2.80 05/21/13 02/15/33 49,440,000 39,630,000
2.64 05/01/14 02/15/26 44,920,000 39,335,000
3.25 05/01/14 02/15/34 62,900,000 55,345,000
3.11 04/15/15 02/15/35 102,490,000 96,305,000
2.42 04/15/15 02/15/28 129,665,000 113,930,000
3.21 05/01/15 02/15/31 28,305,000 27,435,000
2.41 04/15/16 02/15/34 26,660,000 26,325,000
2.72 04/15/16 02/15/36 101,305,000 98,500,000
2.47 11/1/2016 02/15/34 36,780,000 36,005,000
0.00 02/16/17 02/15/37 35,000,000 35,000,000
3.20 04/15/17 02/15/37 23,290,000 23,290,000
Total $ 1,376,515,000 $ 1,029,075,000 (A)
(A) Excludes net bond premiums and discounts – ($50,966,492) business-type and ($30,066,071) governmental.
Additionally, this amount includes $710,892,185 of bonds used to finance enterprise fund activities.
At September 30, 2017, management of the City believes the City was in compliance with all financial bond
covenants on outstanding general obligation bonded debt, certificates of obligation, tax notes, electric revenue
bonded debt, and water contract bonded debt.
93
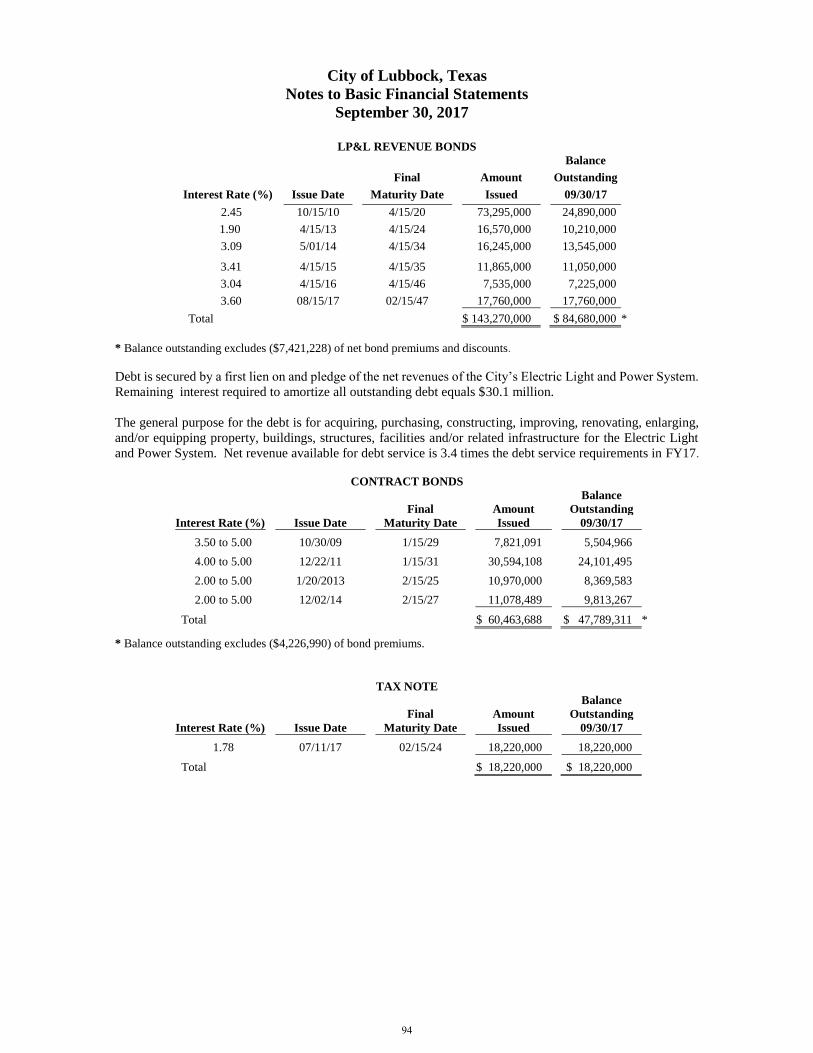
City of Lubbock, Texas
Notes to Basic Financial Statements
September 30, 2017
LP&L REVENUE BONDS
Balance
Final Amount Outstanding
Interest Rate (%) Issue Date Maturity Date Issued 09/30/17
2.45 10/15/10 4/15/20 73,295,000 24,890,000
1.90 4/15/13 4/15/24 16,570,000 10,210,000
3.09 5/01/14 4/15/34 16,245,000 13,545,000
3.41 4/15/15 4/15/35 11,865,000 11,050,000
3.04 4/15/16 4/15/46 7,535,000 7,225,000
3.60 08/15/17 02/15/47 17,760,000 17,760,000
Total $ 143,270,000 $ 84,680,000 *
* Balance outstanding excludes ($7,421,228) of net bond premiums and discounts.
Debt is secured by a first lien on and pledge of the net revenues of the City’s Electric Light and Power System.
Remaining interest required to amortize all outstanding debt equals $30.1 million.
The general purpose for the debt is for acquiring, purchasing, constructing, improving, renovating, enlarging,
and/or equipping property, buildings, structures, facilities and/or related infrastructure for the Electric Light
and Power System. Net revenue available for debt service is 3.4 times the debt service requirements in FY17.
CONTRACT BONDS
Balance
Final Amount Outstanding
Interest Rate (%) Issue Date Maturity Date Issued 09/30/17
3.50 to 5.00 10/30/09 1/15/29 7,821,091 5,504,966
4.00 to 5.00 12/22/11 1/15/31 30,594,108 24,101,495
2.00 to 5.00 1/20/2013 2/15/25 10,970,000 8,369,583
2.00 to 5.00 12/02/14 2/15/27 11,078,489 9,813,267
Total $ 60,463,688 $ 47,789,311 *
* Balance outstanding excludes ($4,226,990) of bond premiums.
TAX NOTE
Balance
Final Amount Outstanding
Interest Rate (%) Issue Date Maturity Date Issued 09/30/17
1.78 07/11/17 02/15/24 18,220,000 18,220,000
Total $ 18,220,000 $ 18,220,000
94
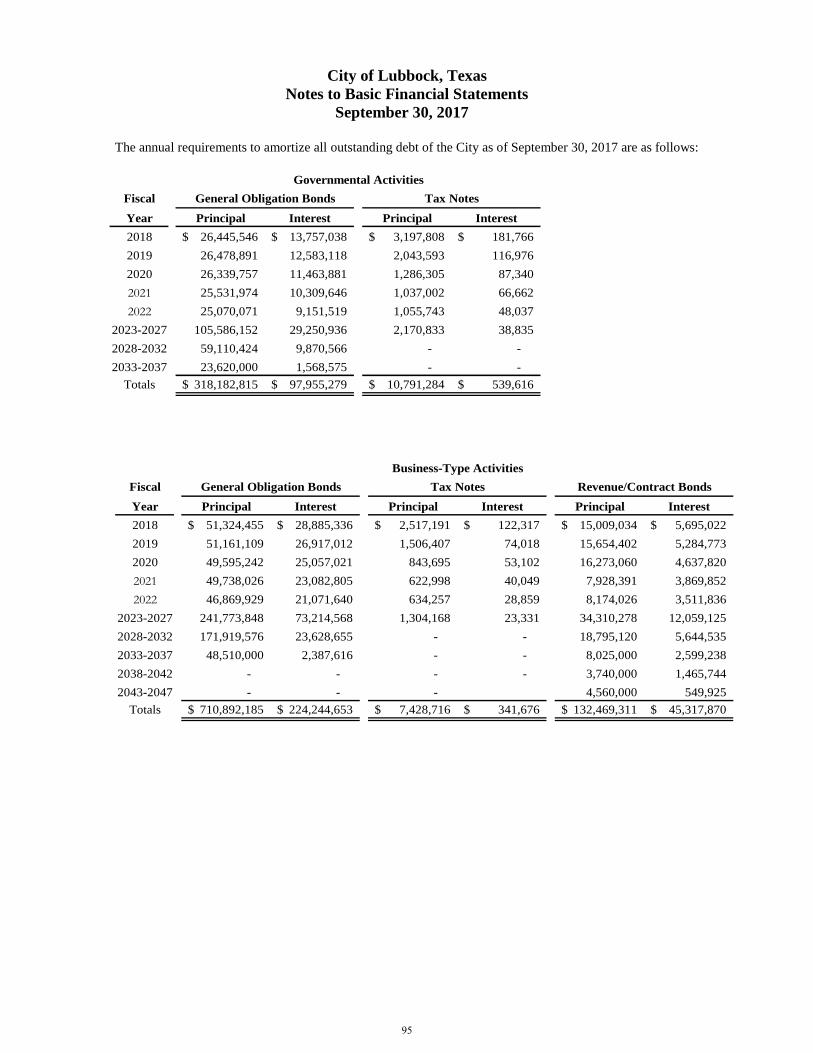
City of Lubbock, Texas
Notes to Basic Financial Statements
September 30, 2017
The annual requirements to amortize all outstanding debt of the City as of September 30, 2017 are as follows:
Fiscal
Year Principal Interest Principal Interest
2018 26,445,546$ 13,757,038$ 3,197,808$ 181,766$
2019 26,478,891 12,583,118 2,043,593 116,976
2020 26,339,757 11,463,881 1,286,305 87,340
2021 25,531,974 10,309,646 1,037,002 66,662
2022 25,070,071 9,151,519 1,055,743 48,037
2023-2027 105,586,152 29,250,936 2,170,833 38,835
2028-2032 59,110,424 9,870,566 - -
2033-2037 23,620,000 1,568,575 - -
Totals 318,182,815$ 97,955,279$ 10,791,284$ 539,616$
General Obligation Bonds Tax Notes
Governmental Activities
Fiscal
Year Principal Interest Principal Interest Principal Interest
2018 51,324,455$ 28,885,336$ 2,517,191$ 122,317$ 15,009,034$ 5,695,022$
2019 51,161,109 26,917,012 1,506,407 74,018 15,654,402 5,284,773
2020 49,595,242 25,057,021 843,695 53,102 16,273,060 4,637,820
2021 49,738,026 23,082,805 622,998 40,049 7,928,391 3,869,852
2022 46,869,929 21,071,640 634,257 28,859 8,174,026 3,511,836
2023-2027 241,773,848 73,214,568 1,304,168 23,331 34,310,278 12,059,125
2028-2032 171,919,576 23,628,655 - - 18,795,120 5,644,535
2033-2037 48,510,000 2,387,616 - - 8,025,000 2,599,238
2038-2042 - - - - 3,740,000 1,465,744
2043-2047 - - - 4,560,000 549,925
Totals 710,892,185$ 224,244,653$ 7,428,716$ 341,676$ 132,469,311$ 45,317,870$
General Obligation Bonds Tax Notes Revenue/Contract Bonds
Business-Type Activities
95
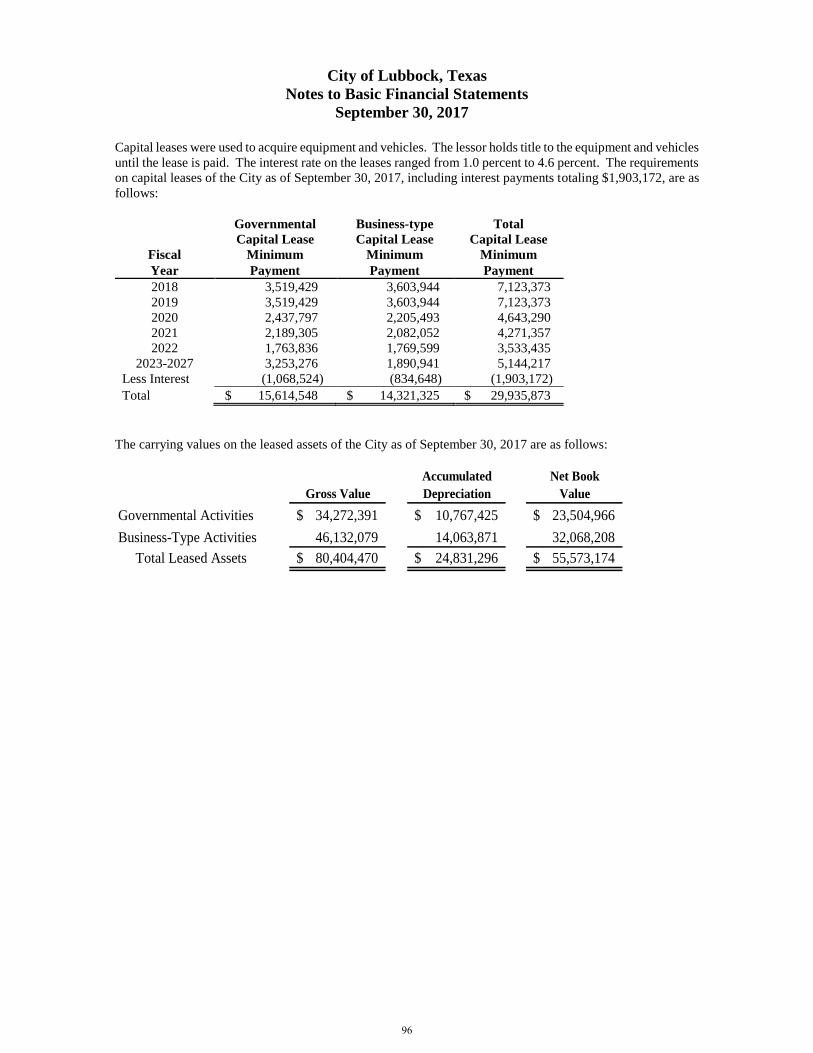
City of Lubbock, Texas
Notes to Basic Financial Statements
September 30, 2017
Capital leases were used to acquire equipment and vehicles. The lessor holds title to the equipment and vehicles
until the lease is paid. The interest rate on the leases ranged from 1.0 percent to 4.6 percent. The requirements
on capital leases of the City as of September 30, 2017, including interest payments totaling $1,903,172, are as
follows:
Governmental Business-type Total
Capital Lease Capital Lease Capital Lease
Fiscal Minimum Minimum Minimum
Year Payment Payment Payment
2018 3,519,429 3,603,944 7,123,373
2019 3,519,429 3,603,944 7,123,373
2020 2,437,797 2,205,493 4,643,290
2021 2,189,305 2,082,052 4,271,357
2022 1,763,836 1,769,599 3,533,435
2023-2027 3,253,276 1,890,941 5,144,217
Less Interest (1,068,524) (834,648) (1,903,172)
Total $ 15,614,548 $ 14,321,325 $ 29,935,873
The carrying values on the leased assets of the City as of September 30, 2017 are as follows:
Accumulated Net Book
Gross Value Depreciation Value
Governmental Activities 34,272,391$ 10,767,425$ 23,504,966$
Business-Type Activities 46,132,079 14,063,871 32,068,208
Total Leased Assets 80,404,470$ 24,831,296$ 55,573,174$
96
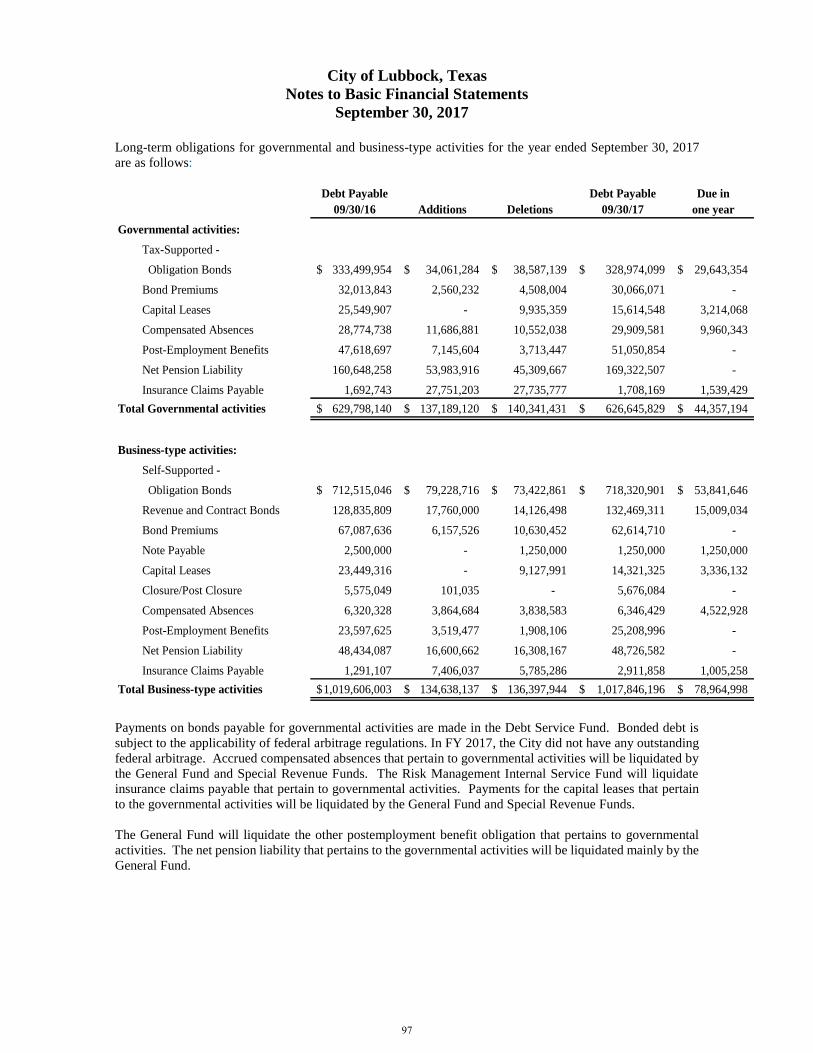
City of Lubbock, Texas
Notes to Basic Financial Statements
September 30, 2017
Long-term obligations for governmental and business-type activities for the year ended September 30, 2017
are as follows:
Debt Payable Debt Payable Due in
09/30/16 Additions Deletions 09/30/17 one year
Governmental activities:
Tax-Supported -
Obligation Bonds 333,499,954$ 34,061,284$ 38,587,139$ 328,974,099$ 29,643,354$
Bond Premiums 32,013,843 2,560,232 4,508,004 30,066,071 -
Capital Leases 25,549,907 - 9,935,359 15,614,548 3,214,068
Compensated Absences 28,774,738 11,686,881 10,552,038 29,909,581 9,960,343
Post-Employment Benefits 47,618,697 7,145,604 3,713,447 51,050,854 -
Net Pension Liability 160,648,258 53,983,916 45,309,667 169,322,507 -
Insurance Claims Payable 1,692,743 27,751,203 27,735,777 1,708,169 1,539,429
Total Governmental activities 629,798,140$ 137,189,120$ 140,341,431$ 626,645,829$ 44,357,194$
Business-type activities:
Self-Supported -
Obligation Bonds 712,515,046$ 79,228,716$ 73,422,861$ 718,320,901$ 53,841,646$
Revenue and Contract Bonds 128,835,809 17,760,000 14,126,498 132,469,311 15,009,034
Bond Premiums 67,087,636 6,157,526 10,630,452 62,614,710 -
Note Payable 2,500,000 - 1,250,000 1,250,000 1,250,000
Capital Leases 23,449,316 - 9,127,991 14,321,325 3,336,132
Closure/Post Closure 5,575,049 101,035 - 5,676,084 -
Compensated Absences 6,320,328 3,864,684 3,838,583 6,346,429 4,522,928
Post-Employment Benefits 23,597,625 3,519,477 1,908,106 25,208,996 -
Net Pension Liability 48,434,087 16,600,662 16,308,167 48,726,582 -
Insurance Claims Payable 1,291,107 7,406,037 5,785,286 2,911,858 1,005,258
Total Business-type activities 1,019,606,003$ 134,638,137$ 136,397,944$ 1,017,846,196$ 78,964,998$
Payments on bonds payable for governmental activities are made in the Debt Service Fund. Bonded debt is
subject to the applicability of federal arbitrage regulations. In FY 2017, the City did not have any outstanding
federal arbitrage. Accrued compensated absences that pertain to governmental activities will be liquidated by
the General Fund and Special Revenue Funds. The Risk Management Internal Service Fund will liquidate
insurance claims payable that pertain to governmental activities. Payments for the capital leases that pertain
to the governmental activities will be liquidated by the General Fund and Special Revenue Funds.
The General Fund will liquidate the other postemployment benefit obligation that pertains to governmental
activities. The net pension liability that pertains to the governmental activities will be liquidated mainly by the
General Fund.
97
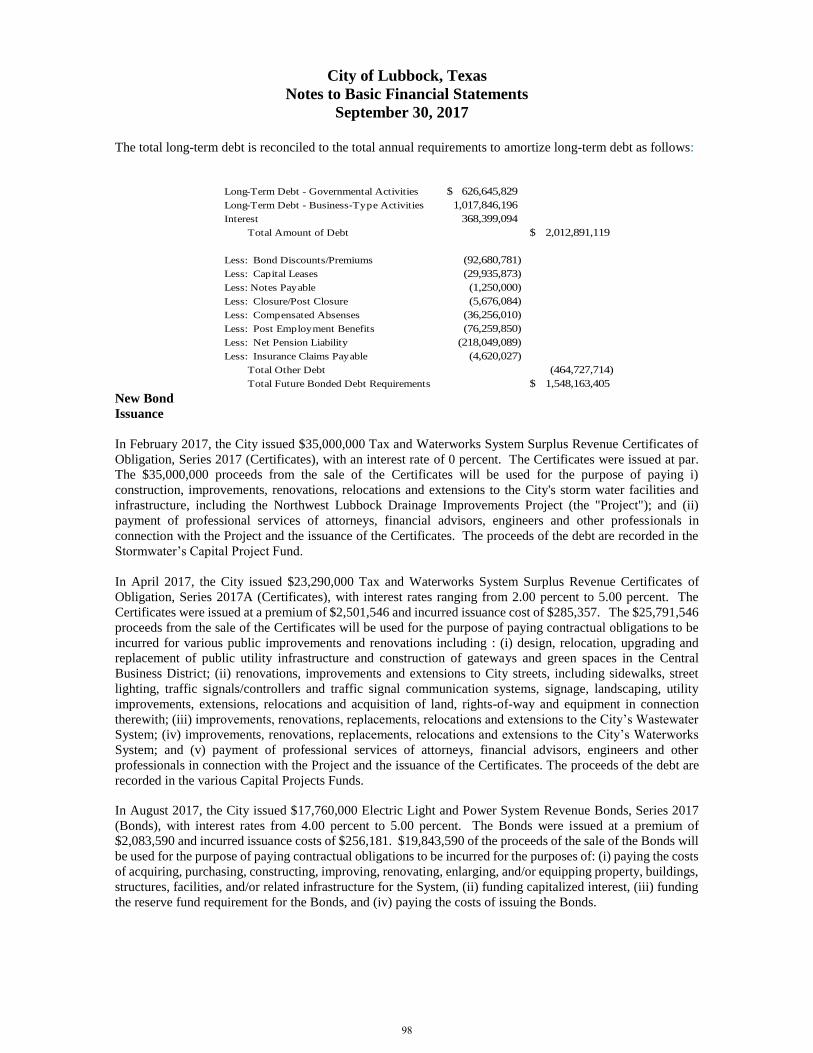
City of Lubbock, Texas
Notes to Basic Financial Statements
September 30, 2017
The total long-term debt is reconciled to the total annual requirements to amortize long-term debt as follows:
New Bond
Issuance
In February 2017, the City issued $35,000,000 Tax and Waterworks System Surplus Revenue Certificates of
Obligation, Series 2017 (Certificates), with an interest rate of 0 percent. The Certificates were issued at par.
The $35,000,000 proceeds from the sale of the Certificates will be used for the purpose of paying i)
construction, improvements, renovations, relocations and extensions to the City's storm water facilities and
infrastructure, including the Northwest Lubbock Drainage Improvements Project (the "Project"); and (ii)
payment of professional services of attorneys, financial advisors, engineers and other professionals in
connection with the Project and the issuance of the Certificates. The proceeds of the debt are recorded in the
Stormwater’s Capital Project Fund.
In April 2017, the City issued $23,290,000 Tax and Waterworks System Surplus Revenue Certificates of
Obligation, Series 2017A (Certificates), with interest rates ranging from 2.00 percent to 5.00 percent. The
Certificates were issued at a premium of $2,501,546 and incurred issuance cost of $285,357. The $25,791,546
proceeds from the sale of the Certificates will be used for the purpose of paying contractual obligations to be
incurred for various public improvements and renovations including : (i) design, relocation, upgrading and
replacement of public utility infrastructure and construction of gateways and green spaces in the Central
Business District; (ii) renovations, improvements and extensions to City streets, including sidewalks, street
lighting, traffic signals/controllers and traffic signal communication systems, signage, landscaping, utility
improvements, extensions, relocations and acquisition of land, rights-of-way and equipment in connection
therewith; (iii) improvements, renovations, replacements, relocations and extensions to the City’s Wastewater
System; (iv) improvements, renovations, replacements, relocations and extensions to the City’s Waterworks
System; and (v) payment of professional services of attorneys, financial advisors, engineers and other
professionals in connection with the Project and the issuance of the Certificates. The proceeds of the debt are
recorded in the various Capital Projects Funds.
In August 2017, the City issued $17,760,000 Electric Light and Power System Revenue Bonds, Series 2017
(Bonds), with interest rates from 4.00 percent to 5.00 percent. The Bonds were issued at a premium of
$2,083,590 and incurred issuance costs of $256,181. $19,843,590 of the proceeds of the sale of the Bonds will
be used for the purpose of paying contractual obligations to be incurred for the purposes of: (i) paying the costs
of acquiring, purchasing, constructing, improving, renovating, enlarging, and/or equipping property, buildings,
structures, facilities, and/or related infrastructure for the System, (ii) funding capitalized interest, (iii) funding
the reserve fund requirement for the Bonds, and (iv) paying the costs of issuing the Bonds.
Long-Term Debt - Governmental Activities 626,645,829$
Long-Term Debt - Business-Type Activities 1,017,846,196
Interest 368,399,094
Total Amount of Debt 2,012,891,119$
Less: Bond Discounts/Premiums (92,680,781)
Less: Capital Leases (29,935,873)
Less: Notes Payable (1,250,000)
Less: Closure/Post Closure (5,676,084)
Less: Compensated Absenses (36,256,010)
Less: Post Employment Benefits (76,259,850)
Less: Net Pension Liability (218,049,089)
Less: Insurance Claims Payable (4,620,027)
Total Other Debt (464,727,714)
Total Future Bonded Debt Requirements 1,548,163,405$
98
City of Lubbock, Texas
Notes to Basic Financial Statements
September 30, 2017
Advance Refunding
In November 2016, the City issued $36,780,000 General Obligation Refunding Bonds, Series 2016A (Bonds),
with interest rates ranging from 3.125 percent to 5.00 percent. The Bonds were issued at a premium of
$4,132,622 and incurred issuance cost of $375,746. The $40,912,622 bond proceeds were used to refund a
portion of the City’s outstanding indebtedness for the purpose of achieving debt service savings. The net
proceeds were deposited with the Escrow Agent in an amount necessary to accomplish, on their scheduled
redemption date, the discharge and final payment on the Refunded Bonds. These funds will be held by the
Escrow Agent in a special escrow fund and used to purchase direct obligations of the United States of America.
Under the escrow agreements between the City and the Escrow Agent, the escrow funds are irrevocably
pledged to the payment of principal and interest on the Refund Bonds. The bonds refunded $39,640,000 of
outstanding debt. As a result of the refunding, the City decreased total debt service requirements by
$6,680,610, which resulted in an accounting loss of $1,454,451 and an economic gain of $5,495,600, or a 13.86
percent savings on refunded bonds.
Prior year defeasance of debt. In prior years, the City defeased bonds by placing the proceeds of the new
bonds in an irrevocable trust account to provide for all future debt service payments on the old bonds.
Accordingly, the trust account assets and the liability for the defeased bonds are not included in the
government’s financial statements. At September 30, 2017, $195,960,000 of defeased bonds remain
outstanding.
L. CONDUIT DEBT
In the past, the City has approved the issuance of Health Facilities Development Corporation Bonds and
Education Facilities Authority Bonds to provide financial assistance to private sector entities for the acquisition
and construction of public facilities. The bonds are secured by the property financed. Upon repayment of the
bonds, ownership of the acquired facilities transfers to the private-sector entity served by the bond issuance.
The City, nor the State, nor any political subdivision thereof is obligated in any manner for repayment of the
bonds. Accordingly, the bonds are not reported as liabilities in the accompanying financial statements.
As of September 30, 2017, there was one series of Lubbock Health Facilities Development Corporation Bonds
outstanding with an aggregate principal amount payable of $70,580,000. The bonds were issued in 2008. Also
as of September 30, 2017, there was one series of Lubbock Education Facilities Authority Inc. Bonds
outstanding with an aggregate principal amount payable of $21,340,000. The bonds were issued in 2007 and
refunded in FY 2016.
M. SPECIAL ASSESSMENT DEBT
In FY 2008, the Vintage Township Public Facilities Corporation (PFC), a discretely presented component unit
of the City, issued special assessment debt for the acquisition and construction of certain public facilities
benefiting Vintage Township. The PFC had $2,076,000 outstanding special assessment debt as of September
30, 2017. The City collects assessments and forwards the collections to the bondholders. The City is not
obligated in any manner for special assessment debt and is not liable for repayment of the debt. As the PFC
completes construction of certain public facilities, the assets are donated to the City. As of September 30,
2017, $4,677,257 in completed construction costs was contributed to the City. The PFC has a deficit in
unrestricted net position, which is a result of the debt held in the PFC name while the assets are donated to the
City and held in the City’s name.
99
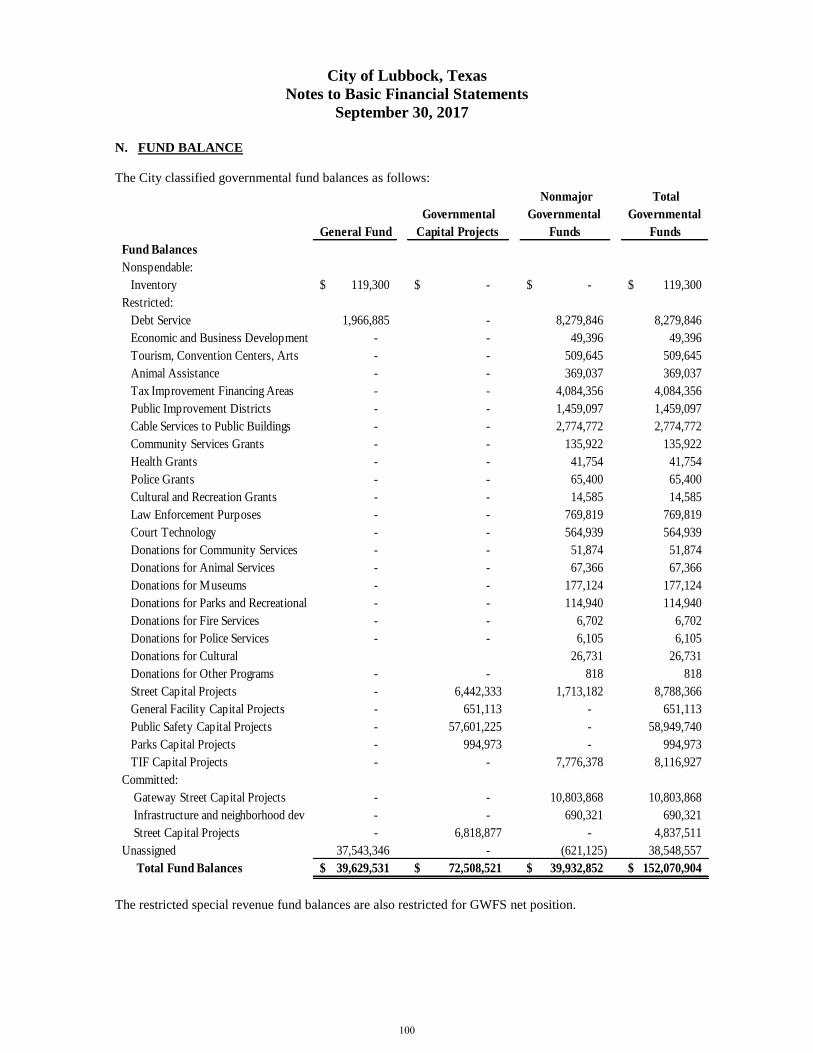
City of Lubbock, Texas
Notes to Basic Financial Statements
September 30, 2017
N. FUND BALANCE
The City classified governmental fund balances as follows:
General Fund
Governmental
Capital Projects
Nonmajor
Governmental
Funds
Total
Governmental
Funds
Fund Balances
Nonspendable:
Inventory 119,300$ -$ -$ 119,300$
Restricted:
Debt Service 1,966,885 - 8,279,846 8,279,846
Economic and Business Development - - 49,396 49,396
Tourism, Convention Centers, Arts - - 509,645 509,645
Animal Assistance - - 369,037 369,037
Tax Improvement Financing Areas - - 4,084,356 4,084,356
Public Improvement Districts - - 1,459,097 1,459,097
Cable Services to Public Buildings - - 2,774,772 2,774,772
Community Services Grants - - 135,922 135,922
Health Grants - - 41,754 41,754
Police Grants - - 65,400 65,400
Cultural and Recreation Grants - - 14,585 14,585
Law Enforcement Purposes - - 769,819 769,819
Court Technology - - 564,939 564,939
Donations for Community Services - - 51,874 51,874
Donations for Animal Services - - 67,366 67,366
Donations for Museums - - 177,124 177,124
Donations for Parks and Recreational - - 114,940 114,940
Donations for Fire Services - - 6,702 6,702
Donations for Police Services - - 6,105 6,105
Donations for Cultural 26,731 26,731
Donations for Other Programs - - 818 818
Street Capital Projects - 6,442,333 1,713,182 8,788,366
General Facility Capital Projects - 651,113 - 651,113
Public Safety Capital Projects - 57,601,225 - 58,949,740
Parks Capital Projects - 994,973 - 994,973
TIF Capital Projects - - 7,776,378 8,116,927
Committed:
Gateway Street Capital Projects - - 10,803,868 10,803,868
Infrastructure and neighborhood dev - - 690,321 690,321
Street Capital Projects - 6,818,877 - 4,837,511
Unassigned 37,543,346 - (621,125) 38,548,557
Total Fund Balances 39,629,531$ 72,508,521$ 39,932,852$ 152,070,904$
The restricted special revenue fund balances are also restricted for GWFS net position.
100
City of Lubbock, Texas
Notes to Basic Financial Statements
September 30, 2017
O. RISK MANAGEMENT
The Risk Management Fund was established to account for liability claims, workers’ compensation claims,
and premiums for property/casualty insurance coverage. The Risk Management Fund generates its revenue
through charges to other departments, which are based on costs.
In April 1999, the City purchased workers’ compensation coverage, with no deductible, from Texas Municipal
League Intergovernmental Risk Pool (TML-IRP) with continuous coverage through September 30, 2009.
Effective October 1, 2009 the City purchased workers’ compensation coverage from Texas Political
Subdivisions Joint Self-Insurance Fund (TPS). TPS operates as a self-insurance pool offering coverage to
municipalities and other political subdivisions in accordance with the local government code and the terms of
interlocal agreements among members. The City obtains workers’ compensation coverage through a
guaranteed-cost plan. Guaranteed-cost members combine their contributions to cover pooled losses and
expenses. As required by interlocal agreement, TPS obtains specific excess of loss coverage over and above
the self-insured retention stated in the agreement so that members will not have joint and several liabilities
beyond their required contribution. Prior to April 1999, the City was self-insured for workers’ compensation
claims. Any claims outstanding prior to April 1999 continue to be the City’s responsibility.
The City’s self-insurance liability program is funded on a cash flow basis, which means that the servicing
contractor processes, adjusts, and pays claims from a deposit account provided by the City. The City accounts
for the liability program by charging premiums to replenish funds based upon losses, administrative fees,
premiums, and reserve requirements. In order to control the risks associated with liability claims, the City
purchases excess liability coverage with an $18 million annual aggregate limit and is subject to a $500,000
self-insured retention per claim.
For self-insured coverage, the Risk Management Fund establishes claim liabilities based on estimates of the
ultimate cost of claims (including future claim adjustment expenses) that have been reported but not settled,
and of claims that have been incurred but not reported (IBNR). The length of time for which such costs must
be estimated varies depending on the coverage involved. Because actual claim costs depend on complex factors
such as inflation, changes in doctrines of legal liability, and damage awards, the process used in computing
claim liabilities does not necessarily result in an exact amount, particularly for liability coverage. Claim
liabilities are recomputed periodically using a variety of actuarial and statistical techniques to produce current
estimates that reflect recent settlements, claim frequency, and other economic and social factors. Adjustments
to claim liabilities are charged or credited to an expense account in the period in which they are incurred.
Additionally, property and boiler coverage is accounted for in the Risk Management Fund. The property
insurance policy was purchased from an outside insurance carrier. The policy has a $250,000 deductible per
occurrence, and the boiler coverage insurance deductible is up to $500,000, dependent upon the unit. Premiums
are charged to funds based upon estimated premiums for the upcoming year. Departments that sustain property
damage in excess of $10,000 are eligible to request assistance from the Risk Management Fund for payment
of those damages up to the $250,000 policy deductible.
Other small insurance policies, such as surety bond coverage and miscellaneous floaters, are also accounted
for in the Risk Management Fund. Funds are charged based on premium amounts and administrative charges.
Settlements in the current year and preceding two years have not exceeded insurance coverage. The City
accounts for all insurance activity in the Internal Service Funds.
101
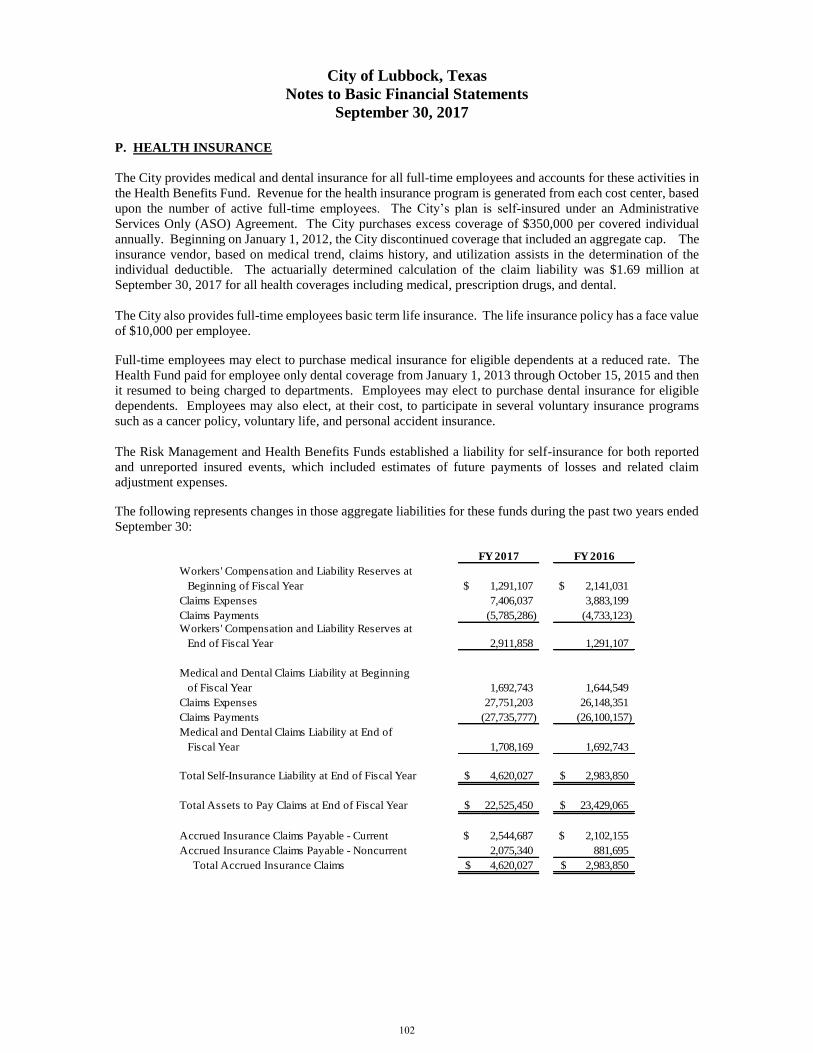
City of Lubbock, Texas
Notes to Basic Financial Statements
September 30, 2017
P. HEALTH INSURANCE
The City provides medical and dental insurance for all full-time employees and accounts for these activities in
the Health Benefits Fund. Revenue for the health insurance program is generated from each cost center, based
upon the number of active full-time employees. The City’s plan is self-insured under an Administrative
Services Only (ASO) Agreement. The City purchases excess coverage of $350,000 per covered individual
annually. Beginning on January 1, 2012, the City discontinued coverage that included an aggregate cap. The
insurance vendor, based on medical trend, claims history, and utilization assists in the determination of the
individual deductible. The actuarially determined calculation of the claim liability was $1.69 million at
September 30, 2017 for all health coverages including medical, prescription drugs, and dental.
The City also provides full-time employees basic term life insurance. The life insurance policy has a face value
of $10,000 per employee.
Full-time employees may elect to purchase medical insurance for eligible dependents at a reduced rate. The
Health Fund paid for employee only dental coverage from January 1, 2013 through October 15, 2015 and then
it resumed to being charged to departments. Employees may elect to purchase dental insurance for eligible
dependents. Employees may also elect, at their cost, to participate in several voluntary insurance programs
such as a cancer policy, voluntary life, and personal accident insurance.
The Risk Management and Health Benefits Funds established a liability for self-insurance for both reported
and unreported insured events, which included estimates of future payments of losses and related claim
adjustment expenses.
The following represents changes in those aggregate liabilities for these funds during the past two years ended
September 30:
FY 2017 FY 2016
Workers' Compensation and Liability Reserves at
Beginning of Fiscal Year $ 1,291,107 $ 2,141,031
Claims Expenses 7,406,037 3,883,199
Claims Payments (5,785,286) (4,733,123)
Workers' Compensation and Liability Reserves at
End of Fiscal Year 2,911,858 1,291,107
Medical and Dental Claims Liability at Beginning
of Fiscal Year 1,692,743 1,644,549
Claims Expenses 27,751,203 26,148,351
Claims Payments (27,735,777) (26,100,157)
Medical and Dental Claims Liability at End of
Fiscal Year 1,708,169 1,692,743
Total Self-Insurance Liability at End of Fiscal Year 4,620,027$ 2,983,850$
Total Assets to Pay Claims at End of Fiscal Year 22,525,450$ 23,429,065$
Accrued Insurance Claims Payable - Current $ 2,544,687 $ 2,102,155
Accrued Insurance Claims Payable - Noncurrent 2,075,340 881,695
Total Accrued Insurance Claims 4,620,027$ 2,983,850$
102
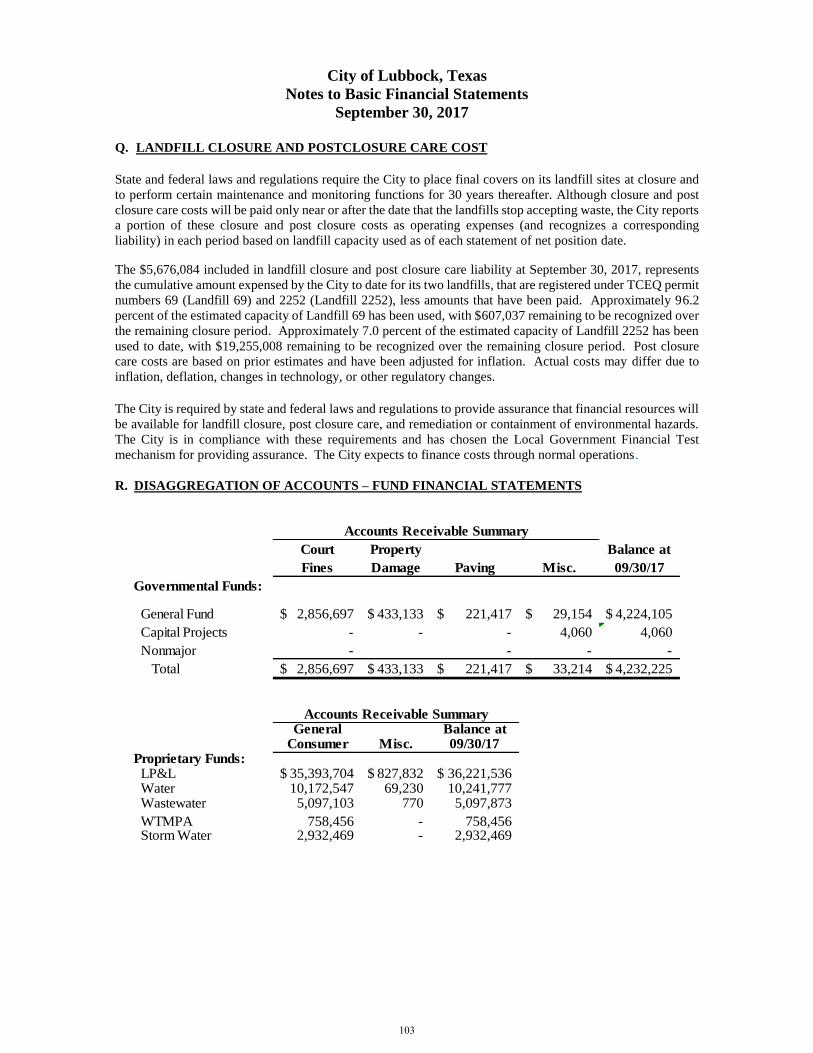
City of Lubbock, Texas
Notes to Basic Financial Statements
September 30, 2017
Q. LANDFILL CLOSURE AND POSTCLOSURE CARE COST
State and federal laws and regulations require the City to place final covers on its landfill sites at closure and
to perform certain maintenance and monitoring functions for 30 years thereafter. Although closure and post
closure care costs will be paid only near or after the date that the landfills stop accepting waste, the City reports
a portion of these closure and post closure costs as operating expenses (and recognizes a corresponding
liability) in each period based on landfill capacity used as of each statement of net position date.
The $5,676,084 included in landfill closure and post closure care liability at September 30, 2017, represents
the cumulative amount expensed by the City to date for its two landfills, that are registered under TCEQ permit
numbers 69 (Landfill 69) and 2252 (Landfill 2252), less amounts that have been paid. Approximately 96.2
percent of the estimated capacity of Landfill 69 has been used, with $607,037 remaining to be recognized over
the remaining closure period. Approximately 7.0 percent of the estimated capacity of Landfill 2252 has been
used to date, with $19,255,008 remaining to be recognized over the remaining closure period. Post closure
care costs are based on prior estimates and have been adjusted for inflation. Actual costs may differ due to
inflation, deflation, changes in technology, or other regulatory changes.
The City is required by state and federal laws and regulations to provide assurance that financial resources will
be available for landfill closure, post closure care, and remediation or containment of environmental hazards.
The City is in compliance with these requirements and has chosen the Local Government Financial Test
mechanism for providing assurance. The City expects to finance costs through normal operations.
R. DISAGGREGATION OF ACCOUNTS – FUND FINANCIAL STATEMENTS
Court Property Balance at
Fines Damage Paving Misc. 09/30/17
Governmental Funds:
General Fund 2,856,697$ 433,133$ 221,417$ 29,154$ 4,224,105$
Capital Projects - - - 4,060 4,060
Nonmajor - - - -
Total 2,856,697$ 433,133$ 221,417$ 33,214$ 4,232,225$
General Balance atConsumer Misc. 09/30/17
Proprietary Funds: LP&L 35,393,704$ 827,832$ 36,221,536$ Water 10,172,547 69,230 10,241,777 Wastewater 5,097,103 770 5,097,873
WTMPA 758,456 - 758,456 Storm Water 2,932,469 - 2,932,469
Accounts Receivable Summary
Accounts Receivable Summary
103
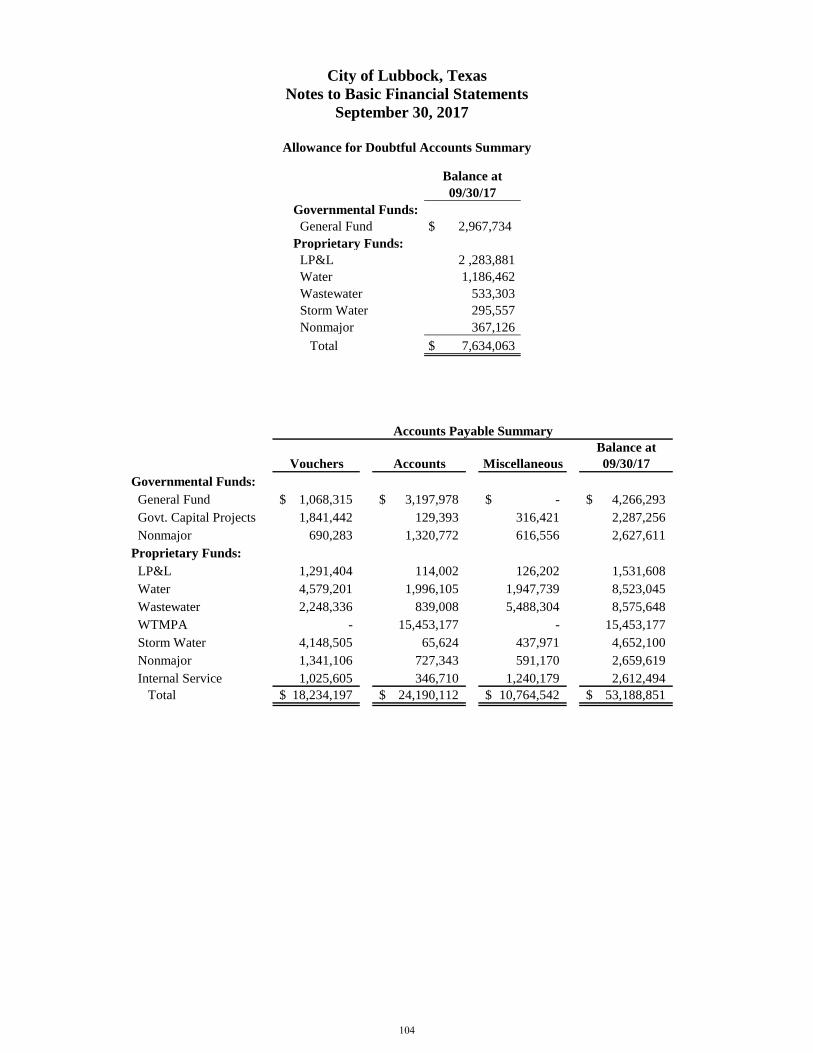
City of Lubbock, Texas
Notes to Basic Financial Statements
September 30, 2017
Allowance for Doubtful Accounts Summary
Balance at
Vouchers Accounts Miscellaneous 09/30/17
Governmental Funds:
General Fund 1,068,315$ 3,197,978$ -$ 4,266,293$
Govt. Capital Projects 1,841,442 129,393 316,421 2,287,256
Nonmajor 690,283 1,320,772 616,556 2,627,611
Proprietary Funds:
LP&L 1,291,404 114,002 126,202 1,531,608
Water 4,579,201 1,996,105 1,947,739 8,523,045
Wastewater 2,248,336 839,008 5,488,304 8,575,648
WTMPA - 15,453,177 - 15,453,177
Storm Water 4,148,505 65,624 437,971 4,652,100
Nonmajor 1,341,106 727,343 591,170 2,659,619
Internal Service 1,025,605 346,710 1,240,179 2,612,494
Total 18,234,197$ 24,190,112$ 10,764,542$ 53,188,851$
Accounts Payable Summary
Balance at
09/30/17
Governmental Funds:
General Fund $ 2,967,734
Proprietary Funds:
LP&L 2 ,283,881
Water 1,186,462
Wastewater 533,303
Storm Water 295,557
Nonmajor 367,126
Total $ 7,634,063
104
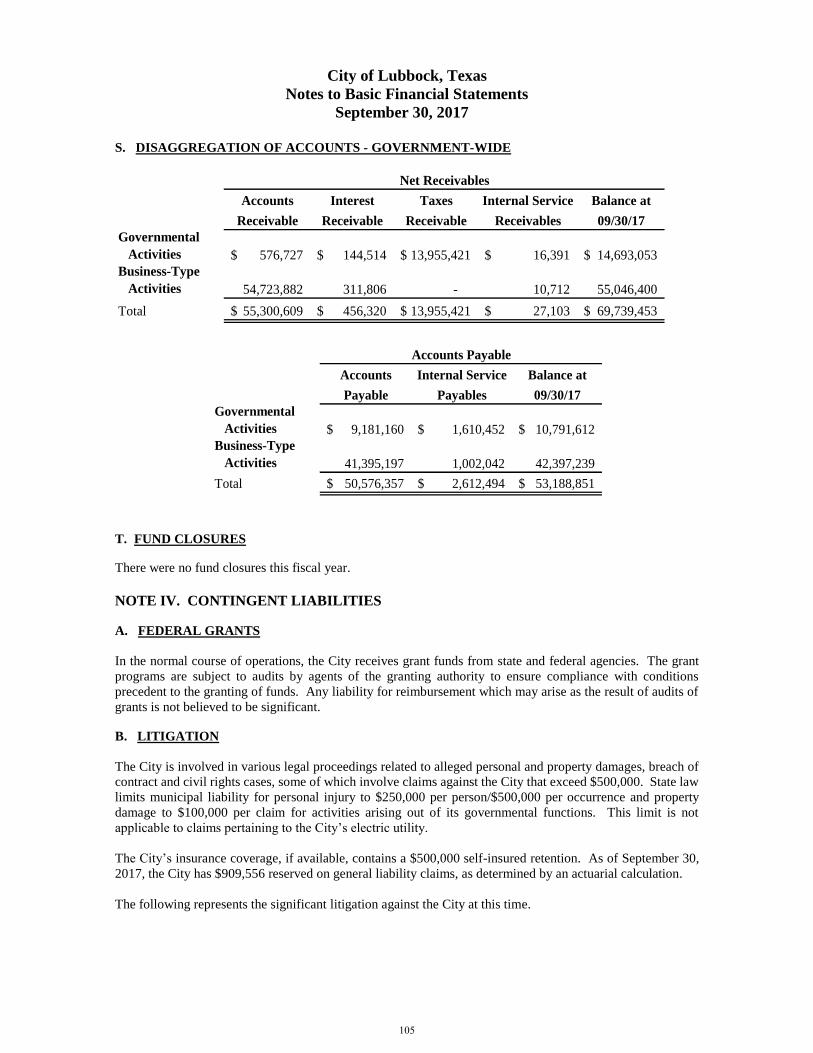
City of Lubbock, Texas
Notes to Basic Financial Statements
September 30, 2017
S. DISAGGREGATION OF ACCOUNTS - GOVERNMENT-WIDE
Accounts Interest Taxes Internal Service Balance at
Receivable Receivable Receivable Receivables 09/30/17
Governmental
Activities 576,727$ 144,514$ 13,955,421$ 16,391$ 14,693,053$
Business-Type
Activities 54,723,882 311,806 - 10,712 55,046,400
Total 55,300,609$ 456,320$ 13,955,421$ 27,103$ 69,739,453$
Net Receivables
Accounts Internal Service Balance at
Payable Payables 09/30/17
Governmental
Activities 9,181,160$ 1,610,452$ 10,791,612$
Business-Type
Activities 41,395,197 1,002,042 42,397,239
Total 50,576,357$ 2,612,494$ 53,188,851$
Accounts Payable
T. FUND CLOSURES
There were no fund closures this fiscal year.
NOTE IV. CONTINGENT LIABILITIES
A. FEDERAL GRANTS
In the normal course of operations, the City receives grant funds from state and federal agencies. The grant
programs are subject to audits by agents of the granting authority to ensure compliance with conditions
precedent to the granting of funds. Any liability for reimbursement which may arise as the result of audits of
grants is not believed to be significant.
B. LITIGATION
The City is involved in various legal proceedings related to alleged personal and property damages, breach of
contract and civil rights cases, some of which involve claims against the City that exceed $500,000. State law
limits municipal liability for personal injury to $250,000 per person/$500,000 per occurrence and property
damage to $100,000 per claim for activities arising out of its governmental functions. This limit is not
applicable to claims pertaining to the City’s electric utility.
The City’s insurance coverage, if available, contains a $500,000 self-insured retention. As of September 30,
2017, the City has $909,556 reserved on general liability claims, as determined by an actuarial calculation.
The following represents the significant litigation against the City at this time.
105
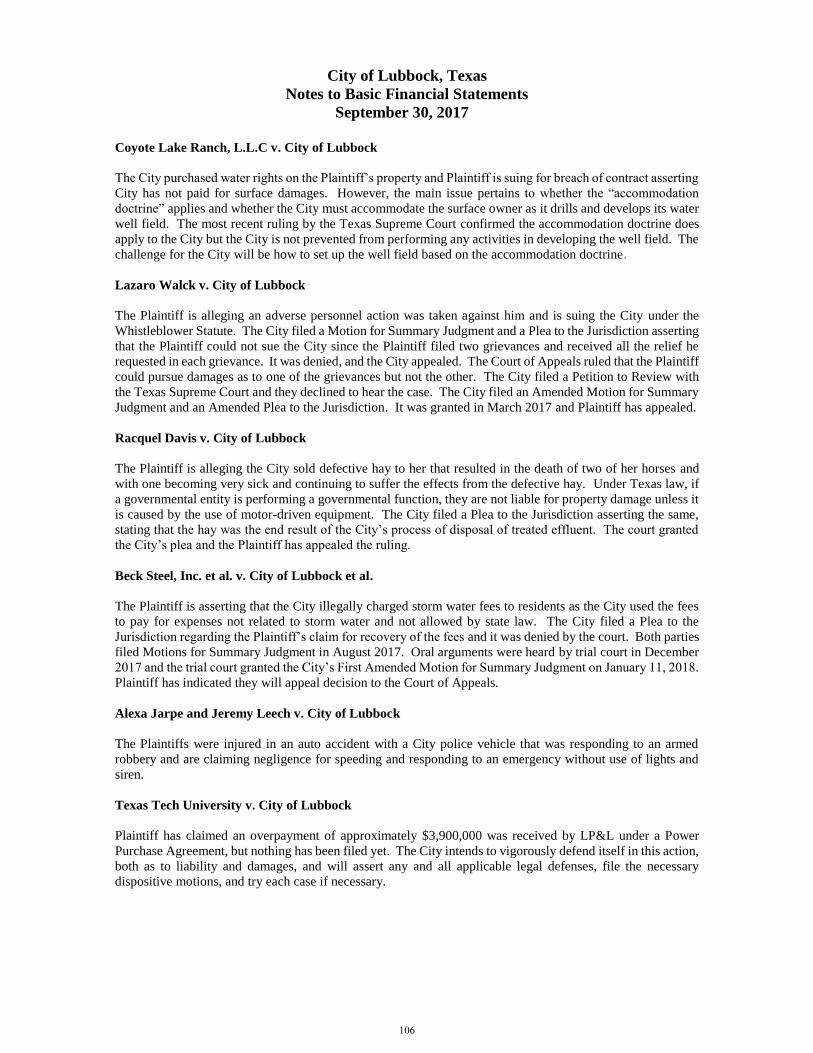
City of Lubbock, Texas
Notes to Basic Financial Statements
September 30, 2017
Coyote Lake Ranch, L.L.C v. City of Lubbock
The City purchased water rights on the Plaintiff’s property and Plaintiff is suing for breach of contract asserting
City has not paid for surface damages. However, the main issue pertains to whether the “accommodation
doctrine” applies and whether the City must accommodate the surface owner as it drills and develops its water
well field. The most recent ruling by the Texas Supreme Court confirmed the accommodation doctrine does
apply to the City but the City is not prevented from performing any activities in developing the well field. The
challenge for the City will be how to set up the well field based on the accommodation doctrine.
Lazaro Walck v. City of Lubbock
The Plaintiff is alleging an adverse personnel action was taken against him and is suing the City under the
Whistleblower Statute. The City filed a Motion for Summary Judgment and a Plea to the Jurisdiction asserting
that the Plaintiff could not sue the City since the Plaintiff filed two grievances and received all the relief he
requested in each grievance. It was denied, and the City appealed. The Court of Appeals ruled that the Plaintiff
could pursue damages as to one of the grievances but not the other. The City filed a Petition to Review with
the Texas Supreme Court and they declined to hear the case. The City filed an Amended Motion for Summary
Judgment and an Amended Plea to the Jurisdiction. It was granted in March 2017 and Plaintiff has appealed.
Racquel Davis v. City of Lubbock
The Plaintiff is alleging the City sold defective hay to her that resulted in the death of two of her horses and
with one becoming very sick and continuing to suffer the effects from the defective hay. Under Texas law, if
a governmental entity is performing a governmental function, they are not liable for property damage unless it
is caused by the use of motor-driven equipment. The City filed a Plea to the Jurisdiction asserting the same,
stating that the hay was the end result of the City’s process of disposal of treated effluent. The court granted
the City’s plea and the Plaintiff has appealed the ruling.
Beck Steel, Inc. et al. v. City of Lubbock et al.
The Plaintiff is asserting that the City illegally charged storm water fees to residents as the City used the fees
to pay for expenses not related to storm water and not allowed by state law. The City filed a Plea to the
Jurisdiction regarding the Plaintiff’s claim for recovery of the fees and it was denied by the court. Both parties
filed Motions for Summary Judgment in August 2017. Oral arguments were heard by trial court in December
2017 and the trial court granted the City’s First Amended Motion for Summary Judgment on January 11, 2018.
Plaintiff has indicated they will appeal decision to the Court of Appeals.
Alexa Jarpe and Jeremy Leech v. City of Lubbock
The Plaintiffs were injured in an auto accident with a City police vehicle that was responding to an armed
robbery and are claiming negligence for speeding and responding to an emergency without use of lights and
siren.
Texas Tech University v. City of Lubbock
Plaintiff has claimed an overpayment of approximately $3,900,000 was received by LP&L under a Power
Purchase Agreement, but nothing has been filed yet. The City intends to vigorously defend itself in this action,
both as to liability and damages, and will assert any and all applicable legal defenses, file the necessary
dispositive motions, and try each case if necessary.
106
City of Lubbock, Texas
Notes to Basic Financial Statements
September 30, 2017
Jillian Standley v. City of Lubbock and Lubbock Power and Light
The Plaintiff was injured in an auto accident with a City vehicle/employee and is claiming damages as a result
of the accident.
Paul Valderas v. Officer Billy Mitchell and City of Lubbock
This is a civil rights case in which the Plaintiff is alleging use of excessive force resulting in injury during his
arrest.
Angel Aleman v. Officer Ross Quarles
This is a civil rights case in which the Plaintiff is alleging use of excessive force during his arrest.
C. SITE REMEDIATION
The City accounts for pollution remediation obligations in accordance with Governmental Accounting
Standards Board (GASB) Statement No. 49, Accounting and Financial Reporting for Pollution Remediation
Obligations. The City contracts with an engineering firm to perform the necessary remediation activities and
cost estimates. Pollution remediation obligations are estimates and subject to changes resulting from price
increases or reductions, technology, or changes in applicable laws or regulations.
As of September 30, 2017, the City owns one property with environmental issues that meet the criteria for
“obligating events” and disclosure under GASB Statement No. 49. The LP&L Cook Plant issue resulted from
underground storage tanks. This property meeting the criteria has been in existence for several years and is at
the “remediation design and implementation, through and including operation and maintenance, and post
remediation monitoring” benchmark discussed in GASB 49. In fact, the City has been monitoring and
recording this obligation for at least ten years.
The City contracts with an engineering firm (eHT/Enprotec) to perform the necessary remediation activities.
Enprotec works closely with the Texas Commission on Environmental Quality (TCEQ) on this property. The
remediation activities the City is required to perform have been approved by TCEQ. The City has a set plan
of action for this property that TCEQ requires the City to follow.
The Cooke plan also requires asbestos remediation in the amount of $65,199. The City has an Asbestos
Coordinator who works with consultants to address these properties as they arise.
As of September 30, 2017, the City recorded pollution remediation obligation in the LP&L enterprise fund as
follows:
LP&L Cooke Plant - $307,467
107

Required Supplem
entaryInform
ation
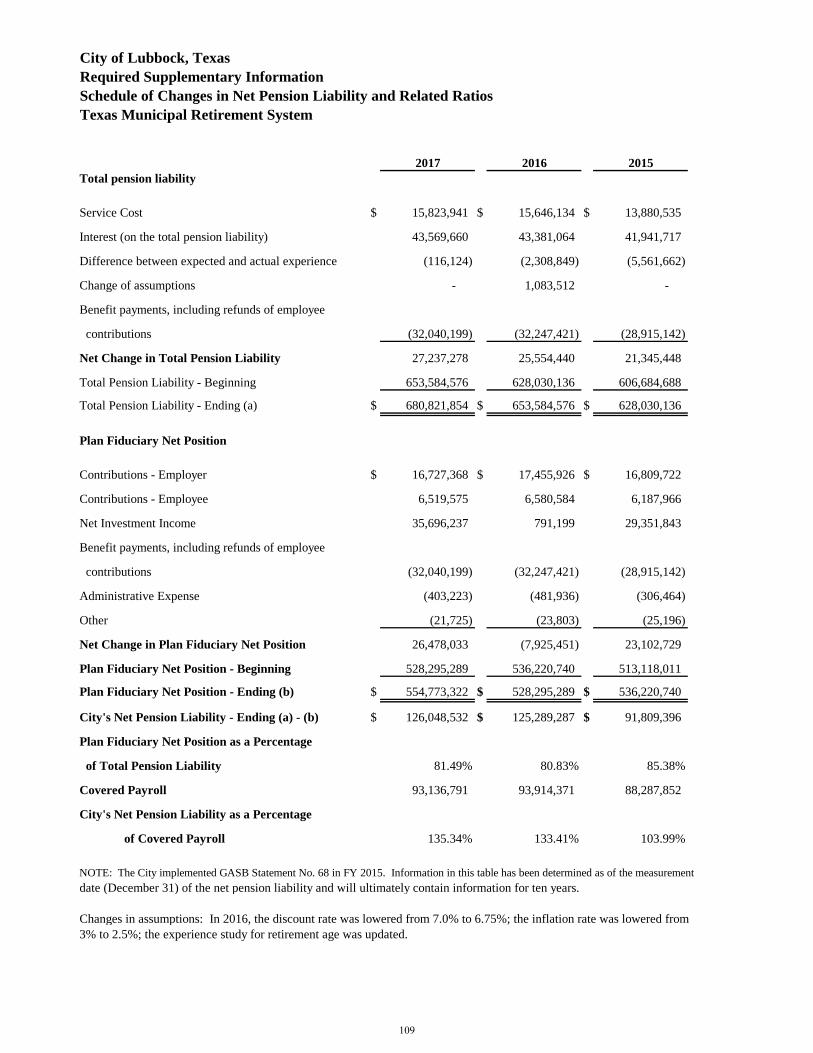
City of Lubbock, Texas
Required Supplementary Information
Schedule of Changes in Net Pension Liability and Related Ratios
Texas Municipal Retirement System
2017 2016 2015
Total pension liability
Service Cost $ 15,823,941 $ 15,646,134 $ 13,880,535
Interest (on the total pension liability) 43,569,660 43,381,064 41,941,717
Difference between expected and actual experience (116,124) (2,308,849) (5,561,662)
Change of assumptions - 1,083,512 -
Benefit payments, including refunds of employee
contributions (32,040,199) (32,247,421) (28,915,142)
Net Change in Total Pension Liability 27,237,278 25,554,440 21,345,448
Total Pension Liability - Beginning 653,584,576 628,030,136 606,684,688
Total Pension Liability - Ending (a) $ 680,821,854 $ 653,584,576 $ 628,030,136
Plan Fiduciary Net Position
Contributions - Employer $ 16,727,368 $ 17,455,926 $ 16,809,722
Contributions - Employee 6,519,575 6,580,584 6,187,966
Net Investment Income 35,696,237 791,199 29,351,843
Benefit payments, including refunds of employee
contributions (32,040,199) (32,247,421) (28,915,142)
Administrative Expense (403,223) (481,936) (306,464)
Other (21,725) (23,803) (25,196)
Net Change in Plan Fiduciary Net Position 26,478,033 (7,925,451) 23,102,729
Plan Fiduciary Net Position - Beginning 528,295,289 536,220,740 513,118,011
Plan Fiduciary Net Position - Ending (b) $ 554,773,322 $ 528,295,289 $ 536,220,740
City's Net Pension Liability - Ending (a) - (b) $ 126,048,532 $ 125,289,287 $ 91,809,396
Plan Fiduciary Net Position as a Percentage
of Total Pension Liability 81.49% 80.83% 85.38%
Covered Payroll 93,136,791 93,914,371 88,287,852
City's Net Pension Liability as a Percentage
of Covered Payroll 135.34% 133.41% 103.99%
NOTE: The City implemented GASB Statement No. 68 in FY 2015. Information in this table has been determined as of the measurement
date (December 31) of the net pension liability and will ultimately contain information for ten years.
Changes in assumptions: In 2016, the discount rate was lowered from 7.0% to 6.75%; the inflation rate was lowered from
3% to 2.5%; the experience study for retirement age was updated.
109
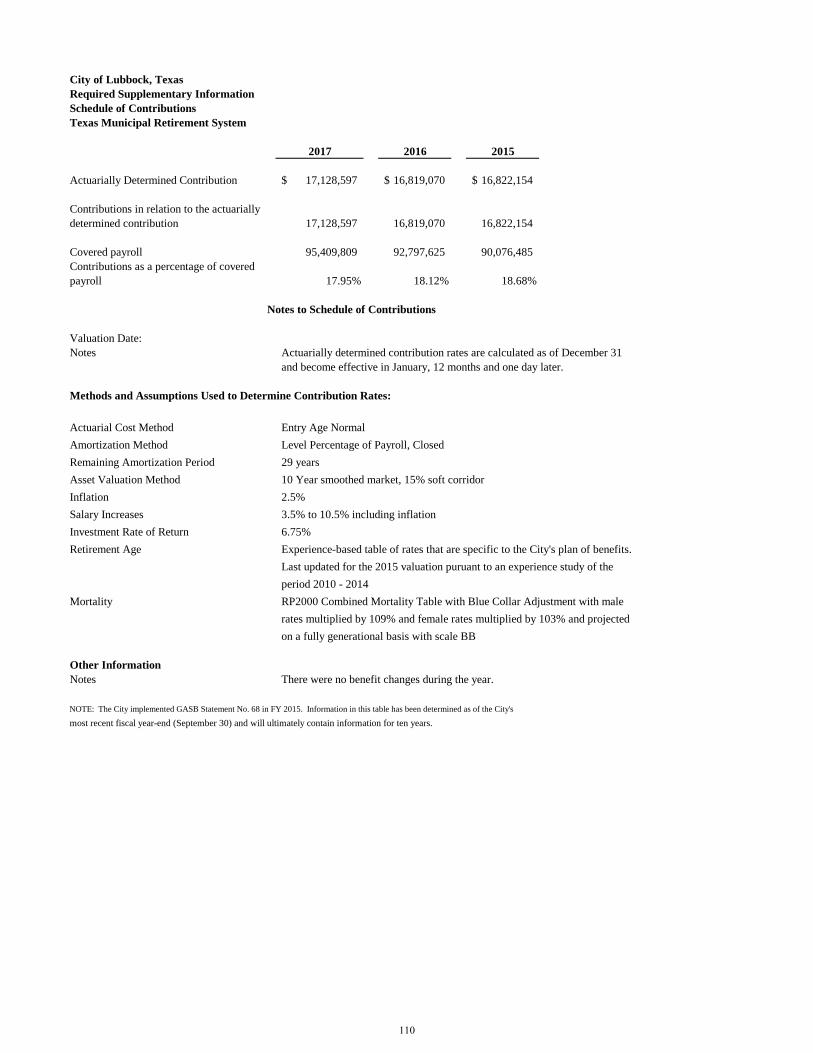
City of Lubbock, Texas
Required Supplementary Information
Schedule of Contributions
Texas Municipal Retirement System
2017 2016 2015
Actuarially Determined Contribution 17,128,597$ 16,819,070$ 16,822,154$
Contributions in relation to the actuarially
determined contribution 17,128,597 16,819,070 16,822,154
Covered payroll 95,409,809 92,797,625 90,076,485
Contributions as a percentage of covered
payroll 17.95% 18.12% 18.68%
Notes to Schedule of Contributions
Valuation Date:
Notes Actuarially determined contribution rates are calculated as of December 31
and become effective in January, 12 months and one day later.
Methods and Assumptions Used to Determine Contribution Rates:
Actuarial Cost Method Entry Age Normal
Amortization Method Level Percentage of Payroll, Closed
Remaining Amortization Period 29 years
Asset Valuation Method 10 Year smoothed market, 15% soft corridor
Inflation 2.5%
Salary Increases 3.5% to 10.5% including inflation
Investment Rate of Return 6.75%
Retirement Age Experience-based table of rates that are specific to the City's plan of benefits.
Last updated for the 2015 valuation puruant to an experience study of the
period 2010 - 2014
Mortality RP2000 Combined Mortality Table with Blue Collar Adjustment with male
rates multiplied by 109% and female rates multiplied by 103% and projected
on a fully generational basis with scale BB
Other Information
Notes There were no benefit changes during the year.
NOTE: The City implemented GASB Statement No. 68 in FY 2015. Information in this table has been determined as of the City's
most recent fiscal year-end (September 30) and will ultimately contain information for ten years.
110
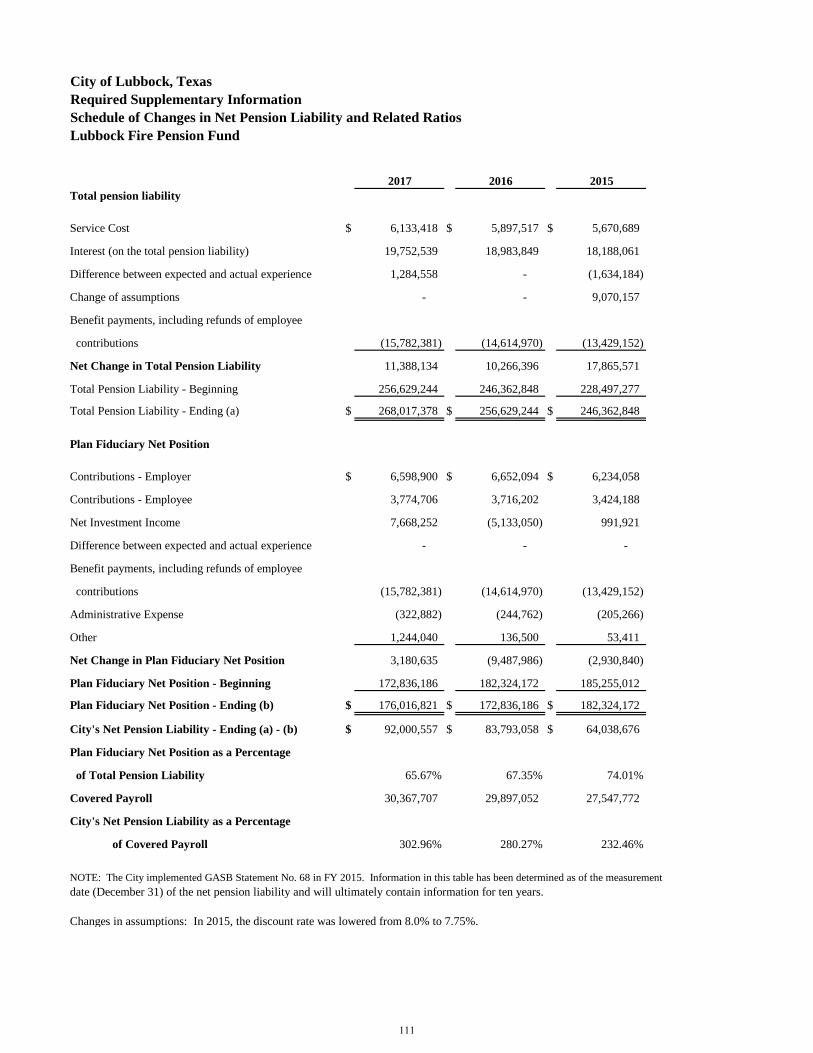
City of Lubbock, Texas
Required Supplementary Information
Schedule of Changes in Net Pension Liability and Related Ratios
Lubbock Fire Pension Fund
2017 2016 2015
Total pension liability
Service Cost $ 6,133,418 $ 5,897,517 $ 5,670,689
Interest (on the total pension liability) 19,752,539 18,983,849 18,188,061
Difference between expected and actual experience 1,284,558 - (1,634,184)
Change of assumptions - - 9,070,157
Benefit payments, including refunds of employee
contributions (15,782,381) (14,614,970) (13,429,152)
Net Change in Total Pension Liability 11,388,134 10,266,396 17,865,571
Total Pension Liability - Beginning 256,629,244 246,362,848 228,497,277
Total Pension Liability - Ending (a) $ 268,017,378 $ 256,629,244 $ 246,362,848
Plan Fiduciary Net Position
Contributions - Employer $ 6,598,900 $ 6,652,094 $ 6,234,058
Contributions - Employee 3,774,706 3,716,202 3,424,188
Net Investment Income 7,668,252 (5,133,050) 991,921
Difference between expected and actual experience - - -
Benefit payments, including refunds of employee
contributions (15,782,381) (14,614,970) (13,429,152)
Administrative Expense (322,882) (244,762) (205,266)
Other 1,244,040 136,500 53,411
Net Change in Plan Fiduciary Net Position 3,180,635 (9,487,986) (2,930,840)
Plan Fiduciary Net Position - Beginning 172,836,186 182,324,172 185,255,012
Plan Fiduciary Net Position - Ending (b) $ 176,016,821 $ 172,836,186 $ 182,324,172
City's Net Pension Liability - Ending (a) - (b) $ 92,000,557 $ 83,793,058 $ 64,038,676
Plan Fiduciary Net Position as a Percentage
of Total Pension Liability 65.67% 67.35% 74.01%
Covered Payroll 30,367,707 29,897,052 27,547,772
City's Net Pension Liability as a Percentage
of Covered Payroll 302.96% 280.27% 232.46%
NOTE: The City implemented GASB Statement No. 68 in FY 2015. Information in this table has been determined as of the measurement
date (December 31) of the net pension liability and will ultimately contain information for ten years.
Changes in assumptions: In 2015, the discount rate was lowered from 8.0% to 7.75%.
111
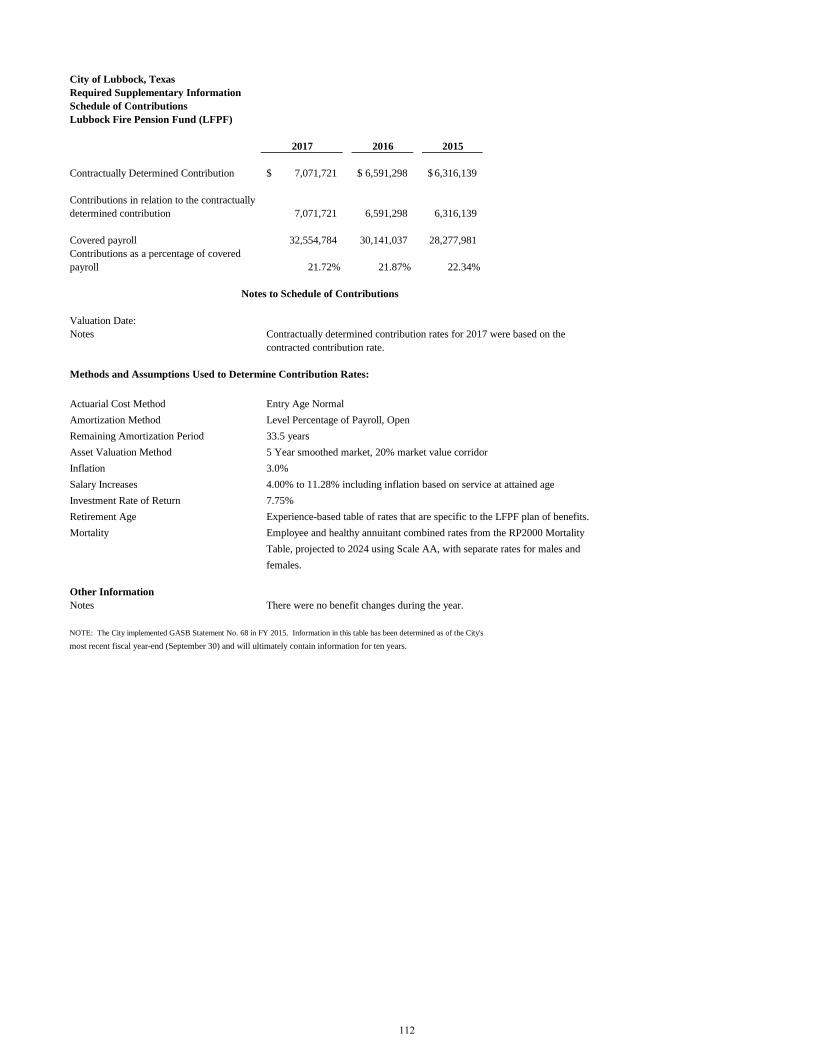
City of Lubbock, Texas
Required Supplementary Information
Schedule of Contributions
Lubbock Fire Pension Fund (LFPF)
2017 2016 2015
Contractually Determined Contribution 7,071,721$ 6,591,298$ 6,316,139$
Contributions in relation to the contractually
determined contribution 7,071,721 6,591,298 6,316,139
Covered payroll 32,554,784 30,141,037 28,277,981
Contributions as a percentage of covered
payroll 21.72% 21.87% 22.34%
Notes to Schedule of Contributions
Valuation Date:
Notes Contractually determined contribution rates for 2017 were based on the
contracted contribution rate.
Methods and Assumptions Used to Determine Contribution Rates:
Actuarial Cost Method Entry Age Normal
Amortization Method Level Percentage of Payroll, Open
Remaining Amortization Period 33.5 years
Asset Valuation Method 5 Year smoothed market, 20% market value corridor
Inflation 3.0%
Salary Increases 4.00% to 11.28% including inflation based on service at attained age
Investment Rate of Return 7.75%
Retirement Age Experience-based table of rates that are specific to the LFPF plan of benefits.
Mortality Employee and healthy annuitant combined rates from the RP2000 Mortality
Table, projected to 2024 using Scale AA, with separate rates for males and
females.
Other Information
Notes There were no benefit changes during the year.
NOTE: The City implemented GASB Statement No. 68 in FY 2015. Information in this table has been determined as of the City's
most recent fiscal year-end (September 30) and will ultimately contain information for ten years.
112
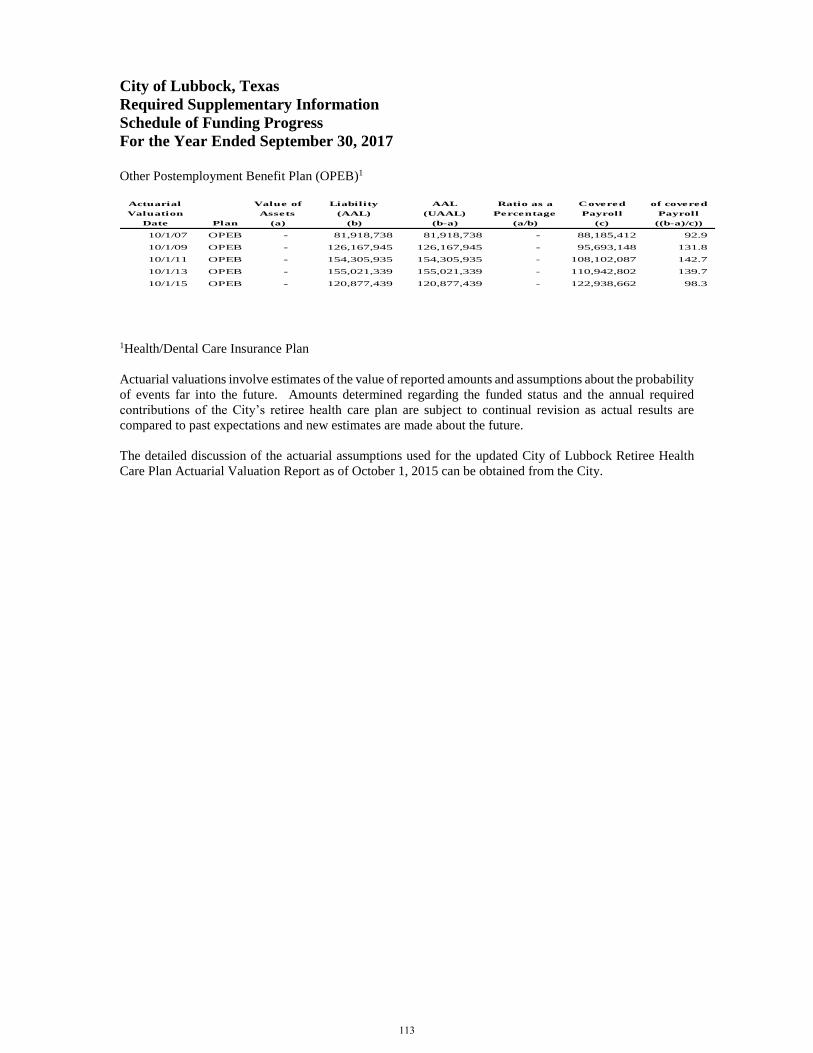
City of Lubbock, Texas
Required Supplementary Information
Schedule of Funding Progress
For the Year Ended September 30, 2017
Other Postemployment Benefit Plan (OPEB)1
Actuarial Value of Liability AAL Ratio as a Covered of covered
Valuation Assets (AAL) (UAAL) Percentage Payroll Payroll
Date Plan (a) (b) (b-a) (a/b) (c) ((b-a)/c))
10/1/07 OPEB - 81,918,738 81,918,738 - 88,185,412 92.9
10/1/09 OPEB - 126,167,945 126,167,945 - 95,693,148 131.8
10/1/11 OPEB - 154,305,935 154,305,935 - 108,102,087 142.7
10/1/13 OPEB - 155,021,339 155,021,339 - 110,942,802 139.7
10/1/15 OPEB - 120,877,439 120,877,439 - 122,938,662 98.3
1Health/Dental Care Insurance Plan
Actuarial valuations involve estimates of the value of reported amounts and assumptions about the probability
of events far into the future. Amounts determined regarding the funded status and the annual required
contributions of the City’s retiree health care plan are subject to continual revision as actual results are
compared to past expectations and new estimates are made about the future.
The detailed discussion of the actuarial assumptions used for the updated City of Lubbock Retiree Health
Care Plan Actuarial Valuation Report as of October 1, 2015 can be obtained from the City.
113
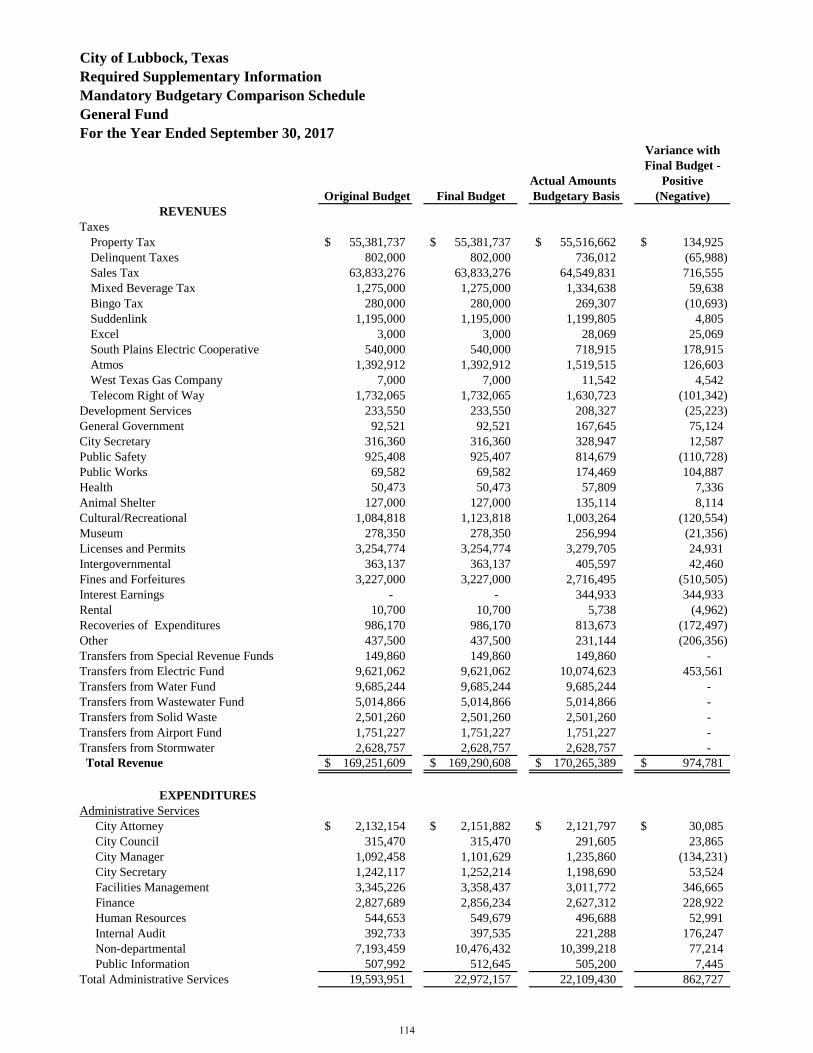
City of Lubbock, Texas
Required Supplementary Information
Mandatory Budgetary Comparison Schedule
General Fund
For the Year Ended September 30, 2017Variance with
Final Budget -
Actual Amounts Positive
Original Budget Final Budget Budgetary Basis (Negative)
REVENUES
Taxes
Property Tax 55,381,737$ 55,381,737$ 55,516,662$ 134,925$
Delinquent Taxes 802,000 802,000 736,012 (65,988)
Sales Tax 63,833,276 63,833,276 64,549,831 716,555
Mixed Beverage Tax 1,275,000 1,275,000 1,334,638 59,638
Bingo Tax 280,000 280,000 269,307 (10,693)
Suddenlink 1,195,000 1,195,000 1,199,805 4,805
Excel 3,000 3,000 28,069 25,069
South Plains Electric Cooperative 540,000 540,000 718,915 178,915
Atmos 1,392,912 1,392,912 1,519,515 126,603
West Texas Gas Company 7,000 7,000 11,542 4,542
Telecom Right of Way 1,732,065 1,732,065 1,630,723 (101,342)
Development Services 233,550 233,550 208,327 (25,223)
General Government 92,521 92,521 167,645 75,124
City Secretary 316,360 316,360 328,947 12,587
Public Safety 925,408 925,407 814,679 (110,728)
Public Works 69,582 69,582 174,469 104,887
Health 50,473 50,473 57,809 7,336
Animal Shelter 127,000 127,000 135,114 8,114
Cultural/Recreational 1,084,818 1,123,818 1,003,264 (120,554)
Museum 278,350 278,350 256,994 (21,356)
Licenses and Permits 3,254,774 3,254,774 3,279,705 24,931
Intergovernmental 363,137 363,137 405,597 42,460
Fines and Forfeitures 3,227,000 3,227,000 2,716,495 (510,505)
Interest Earnings - - 344,933 344,933
Rental 10,700 10,700 5,738 (4,962)
Recoveries of Expenditures 986,170 986,170 813,673 (172,497)
Other 437,500 437,500 231,144 (206,356)
Transfers from Special Revenue Funds 149,860 149,860 149,860 -
Transfers from Electric Fund 9,621,062 9,621,062 10,074,623 453,561
Transfers from Water Fund 9,685,244 9,685,244 9,685,244 -
Transfers from Wastewater Fund 5,014,866 5,014,866 5,014,866 -
Transfers from Solid Waste 2,501,260 2,501,260 2,501,260 -
Transfers from Airport Fund 1,751,227 1,751,227 1,751,227 -
Transfers from Stormwater 2,628,757 2,628,757 2,628,757 -
Total Revenue 169,251,609$ 169,290,608$ 170,265,389$ 974,781$
EXPENDITURES
Administrative Services
City Attorney 2,132,154$ 2,151,882$ 2,121,797$ 30,085$
City Council 315,470 315,470 291,605 23,865
City Manager 1,092,458 1,101,629 1,235,860 (134,231)
City Secretary 1,242,117 1,252,214 1,198,690 53,524
Facilities Management 3,345,226 3,358,437 3,011,772 346,665
Finance 2,827,689 2,856,234 2,627,312 228,922
Human Resources 544,653 549,679 496,688 52,991
Internal Audit 392,733 397,535 221,288 176,247
Non-departmental 7,193,459 10,476,432 10,399,218 77,214
Public Information 507,992 512,645 505,200 7,445
Total Administrative Services 19,593,951 22,972,157 22,109,430 862,727
114
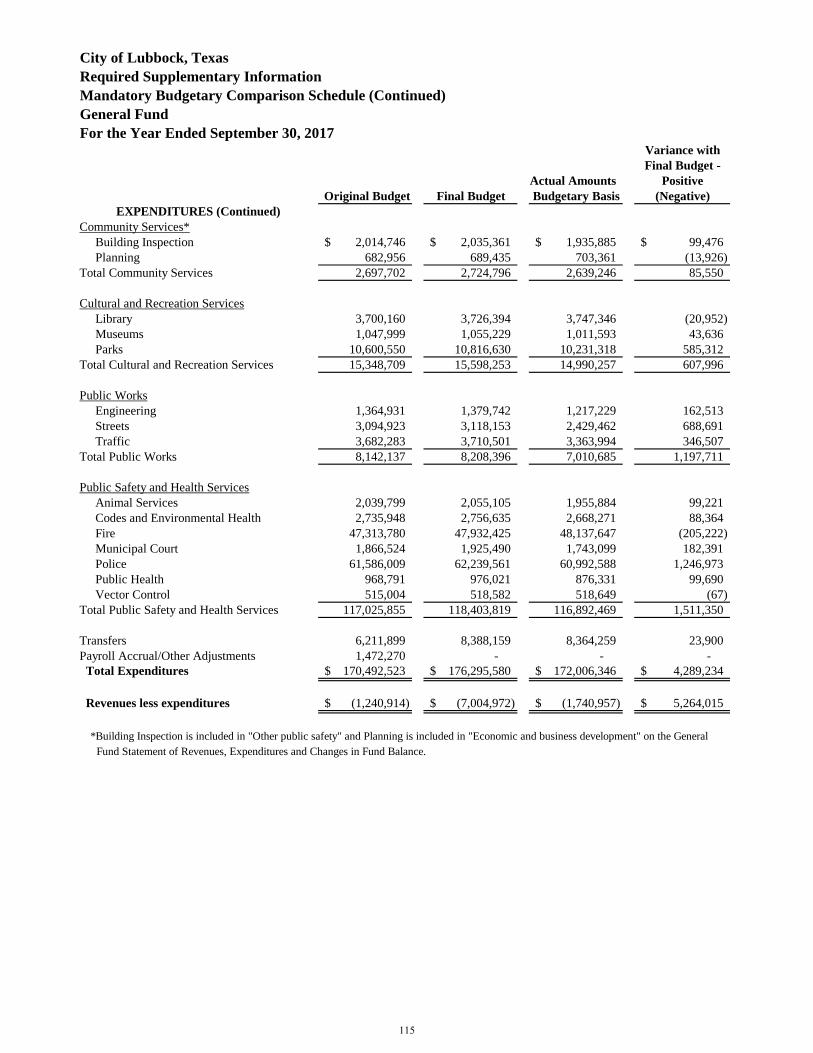
City of Lubbock, Texas
Required Supplementary Information
Mandatory Budgetary Comparison Schedule (Continued)
General Fund
For the Year Ended September 30, 2017Variance with
Final Budget -
Actual Amounts Positive
Original Budget Final Budget Budgetary Basis (Negative)
EXPENDITURES (Continued)
Community Services*
Building Inspection 2,014,746$ 2,035,361$ 1,935,885$ 99,476$
Planning 682,956 689,435 703,361 (13,926)
Total Community Services 2,697,702 2,724,796 2,639,246 85,550
Cultural and Recreation Services
Library 3,700,160 3,726,394 3,747,346 (20,952)
Museums 1,047,999 1,055,229 1,011,593 43,636
Parks 10,600,550 10,816,630 10,231,318 585,312
Total Cultural and Recreation Services 15,348,709 15,598,253 14,990,257 607,996
Public Works
Engineering 1,364,931 1,379,742 1,217,229 162,513
Streets 3,094,923 3,118,153 2,429,462 688,691
Traffic 3,682,283 3,710,501 3,363,994 346,507
Total Public Works 8,142,137 8,208,396 7,010,685 1,197,711
Public Safety and Health Services
Animal Services 2,039,799 2,055,105 1,955,884 99,221
Codes and Environmental Health 2,735,948 2,756,635 2,668,271 88,364
Fire 47,313,780 47,932,425 48,137,647 (205,222)
Municipal Court 1,866,524 1,925,490 1,743,099 182,391
Police 61,586,009 62,239,561 60,992,588 1,246,973
Public Health 968,791 976,021 876,331 99,690
Vector Control 515,004 518,582 518,649 (67)
Total Public Safety and Health Services 117,025,855 118,403,819 116,892,469 1,511,350
Transfers 6,211,899 8,388,159 8,364,259 23,900
Payroll Accrual/Other Adjustments 1,472,270 - - -
Total Expenditures 170,492,523$ 176,295,580$ 172,006,346$ 4,289,234$
Revenues less expenditures (1,240,914)$ (7,004,972)$ (1,740,957)$ 5,264,015$
*Building Inspection is included in "Other public safety" and Planning is included in "Economic and business development" on the General
Fund Statement of Revenues, Expenditures and Changes in Fund Balance.
115
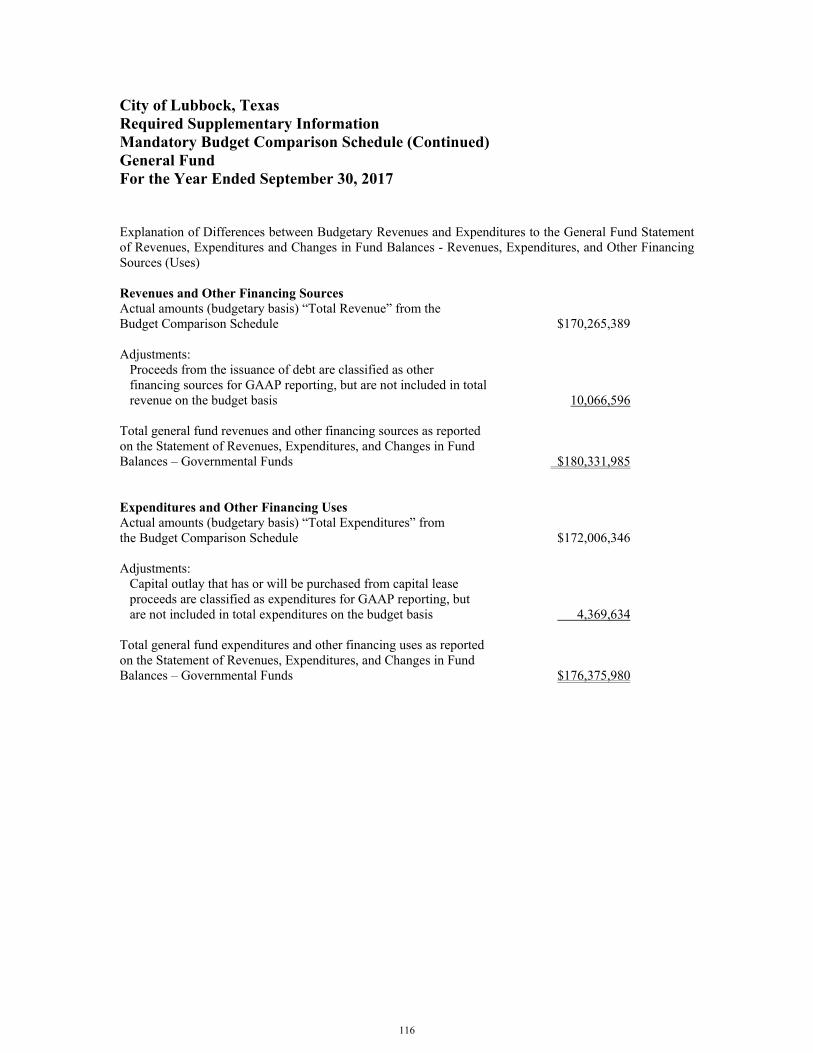
City of Lubbock, Texas Required Supplementary Information Mandatory Budget Comparison Schedule (Continued) General Fund For the Year Ended September 30, 2017 Explanation of Differences between Budgetary Revenues and Expenditures to the General Fund Statement of Revenues, Expenditures and Changes in Fund Balances - Revenues, Expenditures, and Other Financing Sources (Uses) Revenues and Other Financing Sources Actual amounts (budgetary basis) “Total Revenue” from the Budget Comparison Schedule $170,265,389 Adjustments: Proceeds from the issuance of debt are classified as other financing sources for GAAP reporting, but are not included in total revenue on the budget basis 10,066,596 Total general fund revenues and other financing sources as reported on the Statement of Revenues, Expenditures, and Changes in Fund Balances – Governmental Funds $180,331,985 Expenditures and Other Financing Uses Actual amounts (budgetary basis) “Total Expenditures” from the Budget Comparison Schedule $172,006,346 Adjustments: Capital outlay that has or will be purchased from capital lease proceeds are classified as expenditures for GAAP reporting, but are not included in total expenditures on the budget basis 4,369,634 Total general fund expenditures and other financing uses as reported on the Statement of Revenues, Expenditures, and Changes in Fund Balances – Governmental Funds $176,375,980
116

Com
bining FundStatem
ents & Schedules
CITY OF LUBBOCK, TEXAS
Special Revenue Funds Special Revenue Funds are used to account for the proceeds of specific revenue sources (other than special assessments, expendable trusts, or major capital projects) that are legally restricted or committed by City Council to expenditures for specified purposes. Criminal Investigation Fund – Accounts for the allocation of revenues derived from court ordered forfeitures of monies from criminal investigations and related activities. Municipal Court Fund – Accounts for certain revenues from municipal court fees collected to be used on court technology and juvenile case managers. Abandoned Motor Vehicle Fund – Accounts for the proceeds from the sale of abandoned vehicles and payments to wrecker services. Economic Development Incentive Fund – Accounts for a portion of tax revenues to promote industrial and economic development. Donations Fund – Accounts for various special interest donations and the distribution of those funds. Hotel/Motel Tax Fund – Accounts for total hotel/motel occupancy tax receipts and distributions. Animal Assistance Program – Accounts for registration/identification fees collected to be used to promote the sterilization program for dogs and cats. Lubbock Economic Development Alliance Fund – Accounts for sales tax received and distribution to Lubbock Economic Development Alliance. North Overton District Tax Increment Finance (TIF) Reinvestment Zone Fund – Accounts for incremental property tax funds dedicated to the development of the North Overton District. Central Business District (CBD) Tax Increment Finance (TIF) Reinvestment Zone Fund – Accounts for incremental property tax funds dedicated to the development of the Central Business District. Lubbock Business Park Tax Increment Finance (TIF) Fund – Accounts for incremental property tax funds dedicated to the development of the Lubbock Business Park. North Overton Public Improvement District (PID) Fund – Accounts for dedicated assessments, which are used in the payment of professional services and special security charges. North Point Public Improvement District (PID) Fund – Accounts for dedicated assessments, which are used to maintain the North Point area. This includes maintaining common areas and landscaping at the entry stations, and constructing a hike and bike trail. Vintage Township Public Improvement District (PID) Fund – Accounts for dedicated assessments, which are used to construct public improvements in the PID.
117
CITY OF LUBBOCK, TEXAS
Special Revenue Funds (Continued)
Quincy Park Public Improvement District (PID) Fund – Accounts for dedicated assessments, which are used to maintain the Quincy Park area. This includes maintaining common areas, landscaping on the boulevard and entrances, and the park at 91st and Quitman. Valencia Park Public Improvement District (PID) Fund – Accounts for dedicated assessments, which are used to maintain the amenities in the 87th Street right-of-way (ROW), median, and park. Gateway Streets Fund – Accounts for collection of franchise fees from various utility companies. Amounts are distributed to a Capital Projects Gateway Streets fund for street improvements. Cable Services – Accounts for franchise fees received on cable/video services to be used by the City as allowed by federal law. North and East Lubbock Neighborhood & Infrastructure Fund – Accounts for a percentage of mineral interest revenue to be used for downtown redevelopment, neighborhood infrastructure projects, and community development in the north and east portions of the City. Community Development Fund – Accounts for the receipt and disbursement of Community Development Block Grant funds from the United States Department of Housing and Urban Development. Community Services Fund – Accounts for the receipt and disbursement of funds received from the Texas Department of Housing and Community Affairs, United States Department of Energy, and United States Department of Health and Human Services. Health Fund – Accounts for the receipt and disbursement of funds received from the Texas Department of State Health Services and the United States Department of Health and Human Services. Library Fund – Accounts for the receipt and disbursement of funds received from the Texas State Library and Archives Commission and United States Department of Education. Police Fund – Accounts for the receipt and disbursement of funds received from the United States Department of Transportation, United States Department of Treasury, Texas Department of Highways and Public Transportation, Office of the Governor, Office of Justice Program, Criminal Justice Division, and United States Department of Justice. Other Grants Fund – Accounts for the receipt and disbursement of funds received from the United States Department of Commerce, Texas Department of Transportation, Texas Forest Service, United States Department of Energy, Texas Department of Aging and Disability Services, Lubbock Emergency Communication District and the Governor’s Emergency Management Grant.
118
CITY OF LUBBOCK, TEXAS
Debt Service Fund
This fund is used to account for the accumulation of financial resources for the payment of interest and principal on the general long-term debt of the City, other than debt service payments made by enterprise funds. Ad valorem taxes and interest earned on the investments of the Debt Service Funds are used for the payment of principal, interest, and commissions to fiscal agents on the City’s general obligation bonds, which are reflected in the Government-Wide Financial Statements.
Capital Project Funds
The Capital Projects Funds account for all capital improvements, except for those accounted for in proprietary funds, which are financed by the City's general obligation bond issues, certain sales taxes, certain Federal capital grants, and other specific receipts. Tax Increment Finance (TIF) Capital Projects Fund – Accounts for the financing and expenditures related to the Central Business and North Overton Districts. Gateway Streets Project Fund – Accounts for the financing and expenditures related to major street improvements.
119
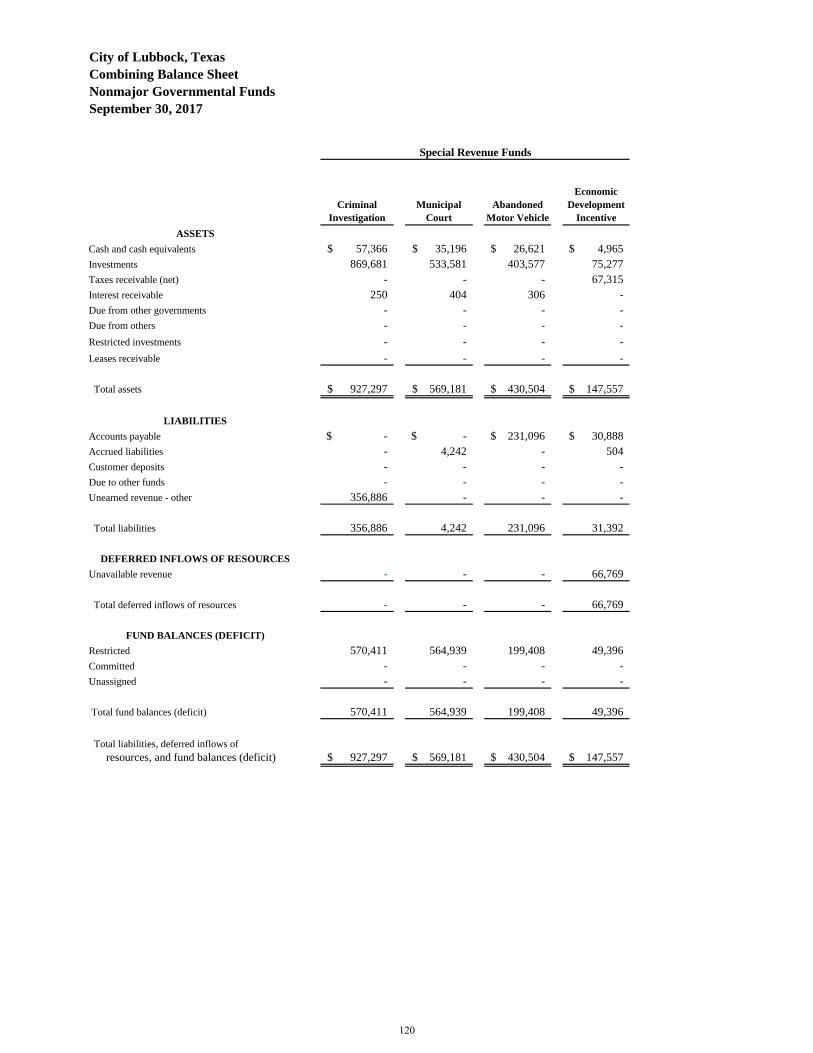
City of Lubbock, Texas
Combining Balance Sheet
Nonmajor Governmental Funds
September 30, 2017
Criminal
Investigation
Municipal
Court
Abandoned
Motor Vehicle
Economic
Development
Incentive
ASSETS
Cash and cash equivalents 57,366$ 35,196$ 26,621$ 4,965$
Investments 869,681 533,581 403,577 75,277
Taxes receivable (net) - - - 67,315
Interest receivable 250 404 306 -
Due from other governments - - - -
Due from others - - - -
Restricted investments - - - -
Leases receivable - - - -
Total assets 927,297$ 569,181$ 430,504$ 147,557$
LIABILITIES
Accounts payable -$ -$ 231,096$ 30,888$
Accrued liabilities - 4,242 - 504
Customer deposits - - - -
Due to other funds - - - -
Unearned revenue - other 356,886 - - -
Total liabilities 356,886 4,242 231,096 31,392
DEFERRED INFLOWS OF RESOURCES
Unavailable revenue - - - 66,769
Total deferred inflows of resources - - - 66,769
FUND BALANCES (DEFICIT)
Restricted 570,411 564,939 199,408 49,396
Committed - - - -
Unassigned - - - -
Total fund balances (deficit) 570,411 564,939 199,408 49,396
Total liabilities, deferred inflows of
resources, and fund balances (deficit) 927,297$ 569,181$ 430,504$ 147,557$
Special Revenue Funds
120
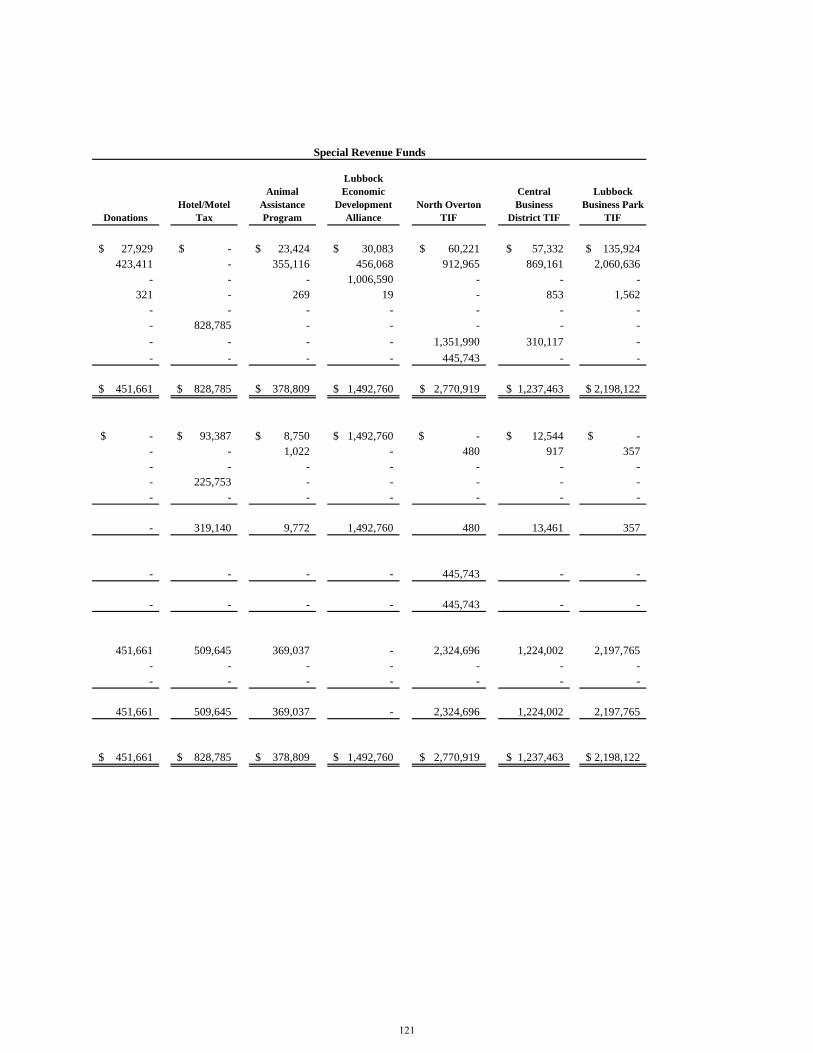
Donations
Hotel/Motel
Tax
Animal
Assistance
Program
Lubbock
Economic
Development
Alliance
North Overton
TIF
Central
Business
District TIF
Lubbock
Business Park
TIF
27,929$ -$ 23,424$ 30,083$ 60,221$ 57,332$ 135,924$
423,411 - 355,116 456,068 912,965 869,161 2,060,636
- - - 1,006,590 - - -
321 - 269 19 - 853 1,562
- - - - - - -
- 828,785 - - - - -
- - - - 1,351,990 310,117 -
- - - - 445,743 - -
451,661$ 828,785$ 378,809$ 1,492,760$ 2,770,919$ 1,237,463$ 2,198,122$
-$ 93,387$ 8,750$ 1,492,760$ -$ 12,544$ -$
- - 1,022 - 480 917 357
- - - - - - -
- 225,753 - - - - -
- - - - - - -
- 319,140 9,772 1,492,760 480 13,461 357
- - - - 445,743 - -
- - - - 445,743 - -
451,661 509,645 369,037 - 2,324,696 1,224,002 2,197,765
- - - - - - -
- - - - - - -
451,661 509,645 369,037 - 2,324,696 1,224,002 2,197,765
451,661$ 828,785$ 378,809$ 1,492,760$ 2,770,919$ 1,237,463$ 2,198,122$
Special Revenue Funds
121
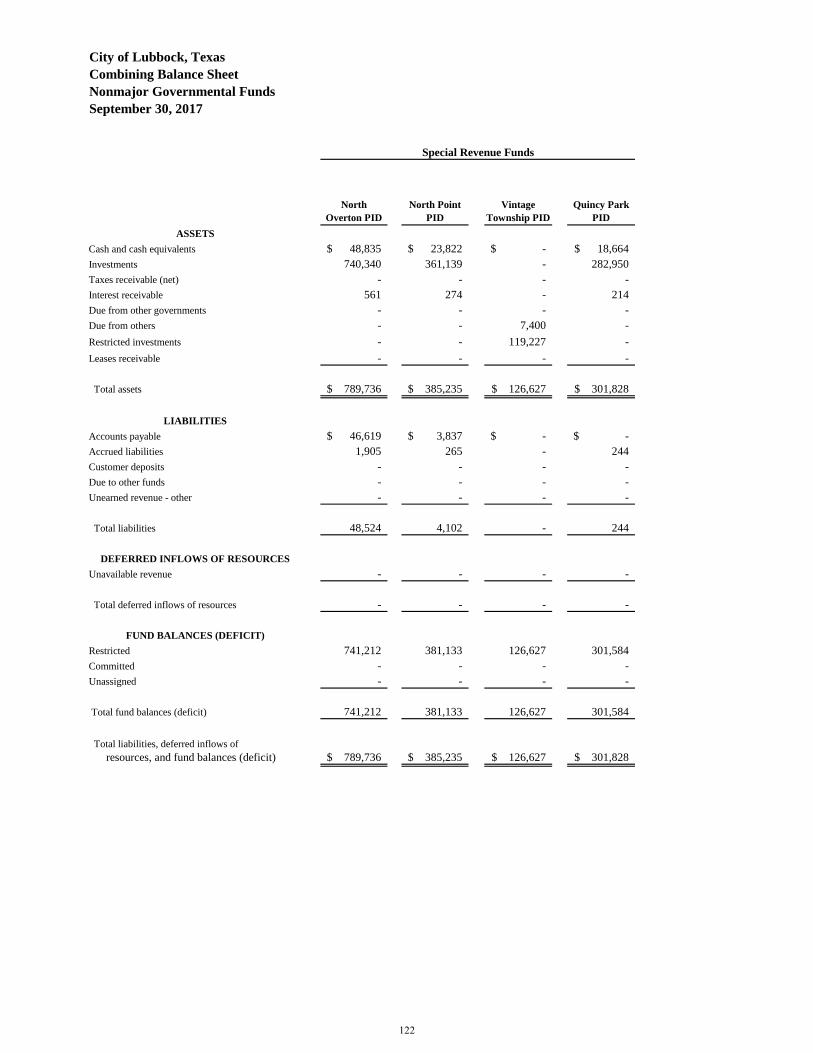
City of Lubbock, Texas
Combining Balance Sheet
Nonmajor Governmental Funds
September 30, 2017
North
Overton PID
North Point
PID
Vintage
Township PID
Quincy Park
PID
ASSETS
Cash and cash equivalents 48,835$ 23,822$ -$ 18,664$
Investments 740,340 361,139 - 282,950
Taxes receivable (net) - - - -
Interest receivable 561 274 - 214
Due from other governments - - - -
Due from others - - 7,400 -
Restricted investments - - 119,227 -
Leases receivable - - - -
Total assets 789,736$ 385,235$ 126,627$ 301,828$
LIABILITIES
Accounts payable 46,619$ 3,837$ -$ -$
Accrued liabilities 1,905 265 - 244
Customer deposits - - - -
Due to other funds - - - -
Unearned revenue - other - - - -
Total liabilities 48,524 4,102 - 244
DEFERRED INFLOWS OF RESOURCES
Unavailable revenue - - - -
Total deferred inflows of resources - - - -
FUND BALANCES (DEFICIT)
Restricted 741,212 381,133 126,627 301,584
Committed - - - -
Unassigned - - - -
Total fund balances (deficit) 741,212 381,133 126,627 301,584
Total liabilities, deferred inflows of
resources, and fund balances (deficit) 789,736$ 385,235$ 126,627$ 301,828$
Special Revenue Funds
122
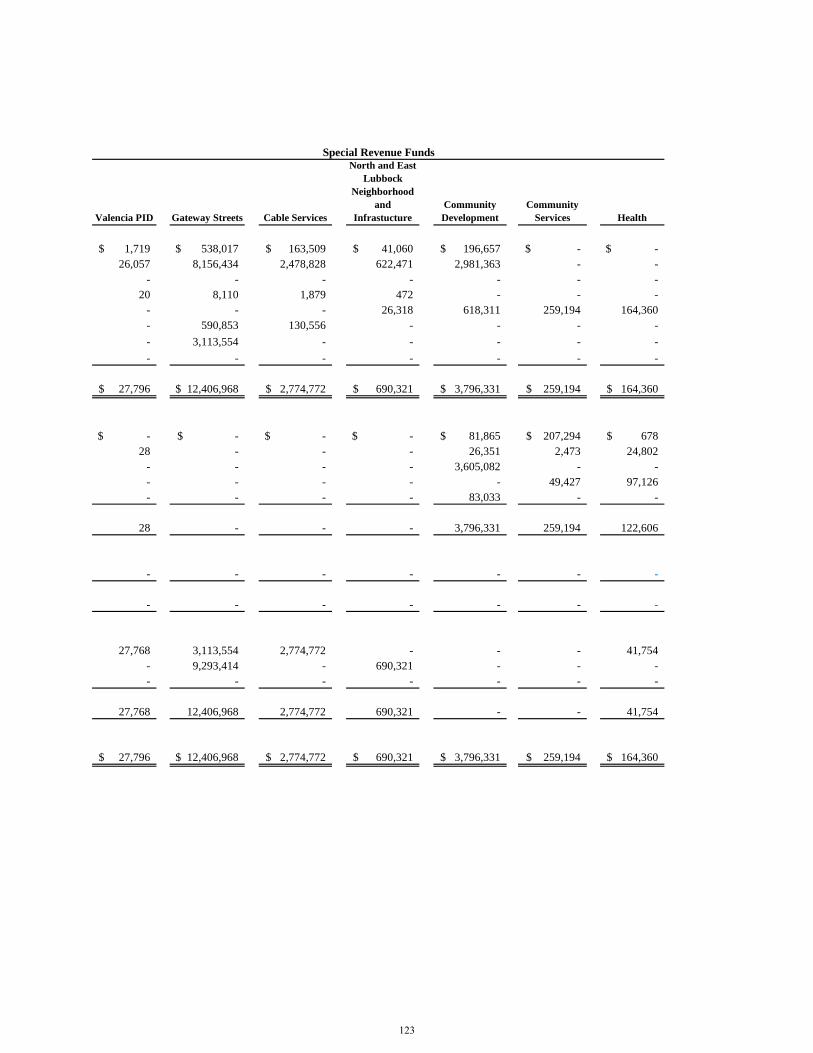
Valencia PID Gateway Streets Cable Services
North and East
Lubbock
Neighborhood
and
Infrastucture
Community
Development
Community
Services Health
1,719$ 538,017$ 163,509$ 41,060$ 196,657$ -$ -$
26,057 8,156,434 2,478,828 622,471 2,981,363 - -
- - - - - - -
20 8,110 1,879 472 - - -
- - - 26,318 618,311 259,194 164,360
- 590,853 130,556 - - - -
- 3,113,554 - - - - -
- - - - - - -
27,796$ 12,406,968$ 2,774,772$ 690,321$ 3,796,331$ 259,194$ 164,360$
-$ -$ -$ -$ 81,865$ 207,294$ 678$
28 - - - 26,351 2,473 24,802
- - - - 3,605,082 - -
- - - - - 49,427 97,126
- - - - 83,033 - -
28 - - - 3,796,331 259,194 122,606
- - - - - - -
- - - - - - -
27,768 3,113,554 2,774,772 - - - 41,754
- 9,293,414 - 690,321 - - -
- - - - - - -
27,768 12,406,968 2,774,772 690,321 - - 41,754
27,796$ 12,406,968$ 2,774,772$ 690,321$ 3,796,331$ 259,194$ 164,360$
Special Revenue Funds
123
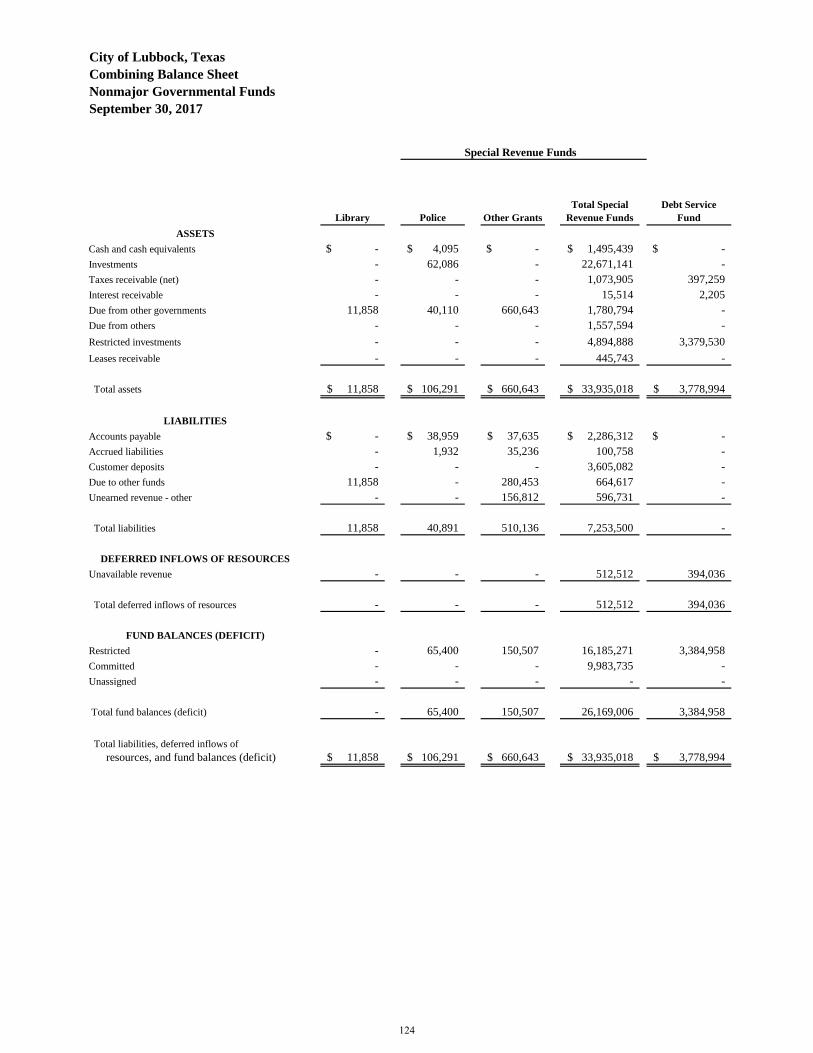
City of Lubbock, Texas
Combining Balance Sheet
Nonmajor Governmental Funds
September 30, 2017
Library Police Other Grants
Total Special
Revenue Funds
Debt Service
Fund
ASSETS
Cash and cash equivalents -$ 4,095$ -$ 1,495,439$ -$
Investments - 62,086 - 22,671,141 -
Taxes receivable (net) - - - 1,073,905 397,259
Interest receivable - - - 15,514 2,205
Due from other governments 11,858 40,110 660,643 1,780,794 -
Due from others - - - 1,557,594 -
Restricted investments - - - 4,894,888 3,379,530
Leases receivable - - - 445,743 -
Total assets 11,858$ 106,291$ 660,643$ 33,935,018$ 3,778,994$
LIABILITIES
Accounts payable -$ 38,959$ 37,635$ 2,286,312$ -$
Accrued liabilities - 1,932 35,236 100,758 -
Customer deposits - - - 3,605,082 -
Due to other funds 11,858 - 280,453 664,617 -
Unearned revenue - other - - 156,812 596,731 -
Total liabilities 11,858 40,891 510,136 7,253,500 -
DEFERRED INFLOWS OF RESOURCES
Unavailable revenue - - - 512,512 394,036
Total deferred inflows of resources - - - 512,512 394,036
FUND BALANCES (DEFICIT)
Restricted - 65,400 150,507 16,185,271 3,384,958
Committed - - - 9,983,735 -
Unassigned - - - - -
Total fund balances (deficit) - 65,400 150,507 26,169,006 3,384,958
Total liabilities, deferred inflows of
resources, and fund balances (deficit) 11,858$ 106,291$ 660,643$ 33,935,018$ 3,778,994$
Special Revenue Funds
124
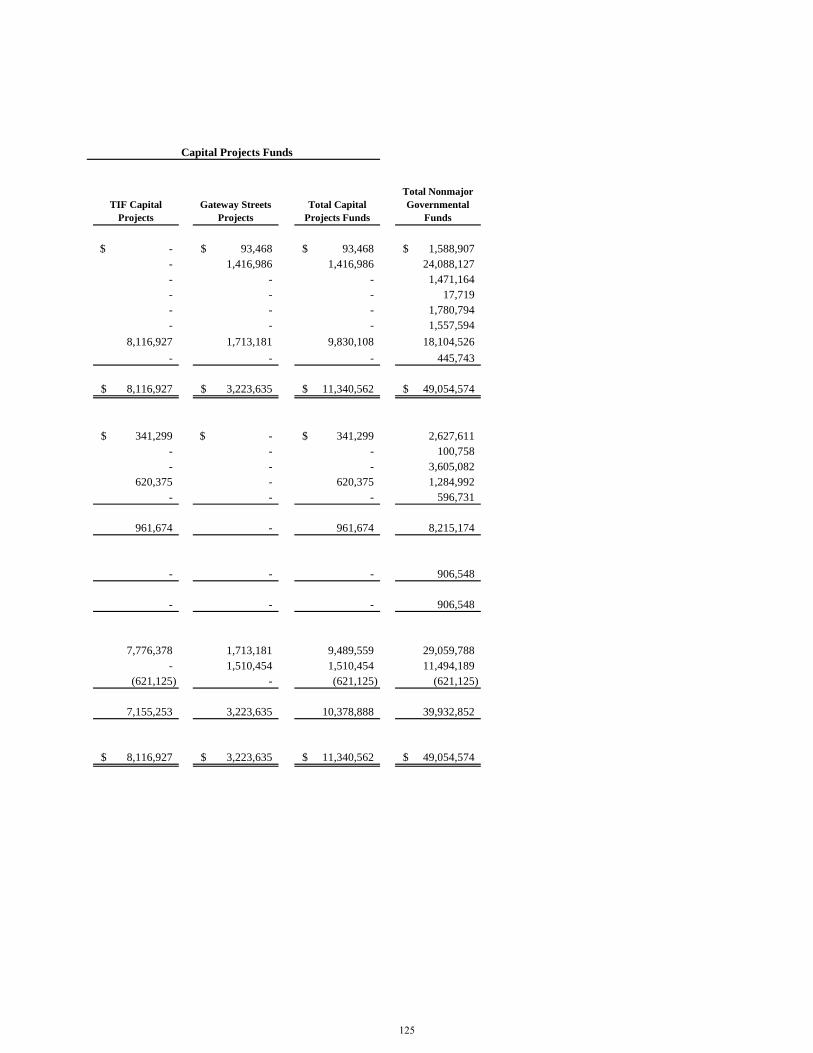
TIF Capital
Projects
Gateway Streets
Projects
Total Capital
Projects Funds
Total Nonmajor
Governmental
Funds
-$ 93,468$ 93,468$ 1,588,907$
- 1,416,986 1,416,986 24,088,127
- - - 1,471,164
- - - 17,719
- - - 1,780,794
- - - 1,557,594
8,116,927 1,713,181 9,830,108 18,104,526
- - - 445,743
8,116,927$ 3,223,635$ 11,340,562$ 49,054,574$
341,299$ -$ 341,299$ 2,627,611
- - - 100,758
- - - 3,605,082
620,375 - 620,375 1,284,992
- - - 596,731
961,674 - 961,674 8,215,174
- - - 906,548
- - - 906,548
7,776,378 1,713,181 9,489,559 29,059,788
- 1,510,454 1,510,454 11,494,189
(621,125) - (621,125) (621,125)
7,155,253 3,223,635 10,378,888 39,932,852
8,116,927$ 3,223,635$ 11,340,562$ 49,054,574$
Capital Projects Funds
125
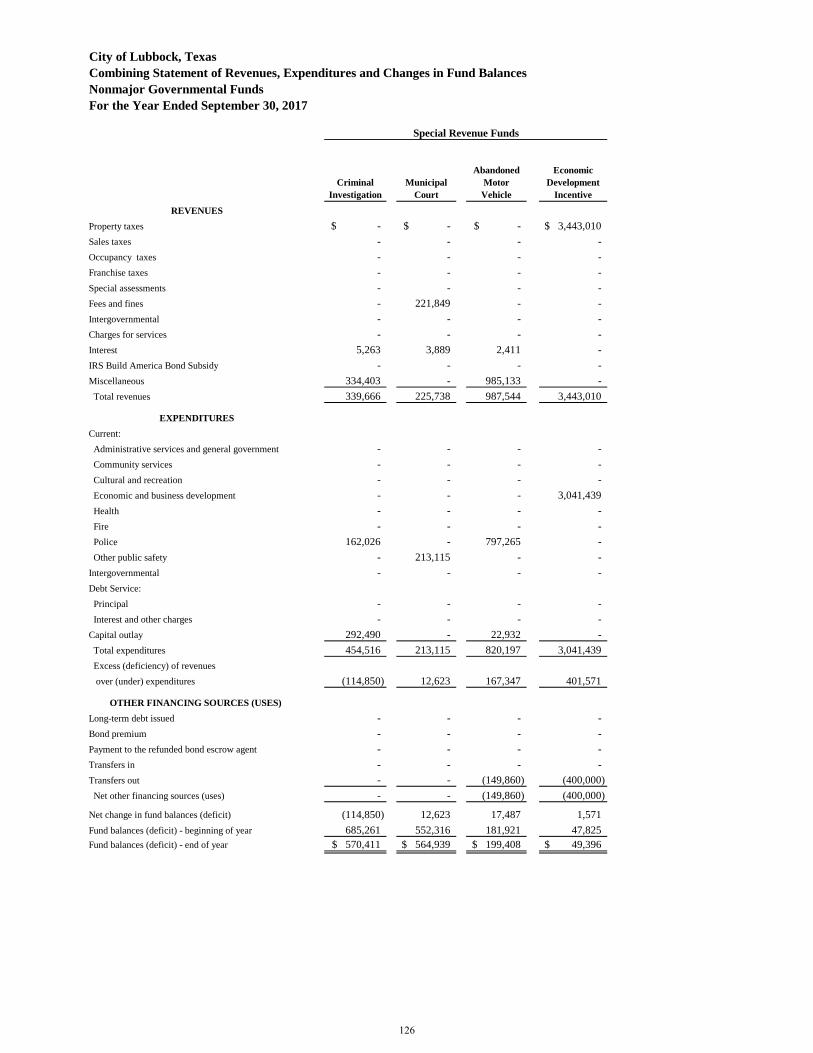
City of Lubbock, Texas
Combining Statement of Revenues, Expenditures and Changes in Fund Balances
Nonmajor Governmental Funds
For the Year Ended September 30, 2017
Criminal
Investigation
Municipal
Court
Abandoned
Motor
Vehicle
Economic
Development
Incentive
REVENUES
Property taxes -$ -$ -$ 3,443,010$
Sales taxes - - - -
Occupancy taxes - - - -
Franchise taxes - - - -
Special assessments - - - -
Fees and fines - 221,849 - -
Intergovernmental - - - -
Charges for services - - - -
Interest 5,263 3,889 2,411 -
IRS Build America Bond Subsidy - - - -
Miscellaneous 334,403 - 985,133 -
Total revenues 339,666 225,738 987,544 3,443,010
EXPENDITURES
Current:
Administrative services and general government - - - -
Community services - - - -
Cultural and recreation - - - -
Economic and business development - - - 3,041,439
Health - - - -
Fire - - - -
Police 162,026 - 797,265 -
Other public safety - 213,115 - -
Intergovernmental - - - -
Debt Service:
Principal - - - -
Interest and other charges - - - -
Capital outlay 292,490 - 22,932 -
Total expenditures 454,516 213,115 820,197 3,041,439
Excess (deficiency) of revenues
over (under) expenditures (114,850) 12,623 167,347 401,571
OTHER FINANCING SOURCES (USES)
Long-term debt issued - - - -
Bond premium - - - -
Payment to the refunded bond escrow agent - - - -
Transfers in - - - -
Transfers out - - (149,860) (400,000)
Net other financing sources (uses) - - (149,860) (400,000)
Net change in fund balances (deficit) (114,850) 12,623 17,487 1,571
Fund balances (deficit) - beginning of year 685,261 552,316 181,921 47,825
Fund balances (deficit) - end of year 570,411$ 564,939$ 199,408$ 49,396$
Special Revenue Funds
126
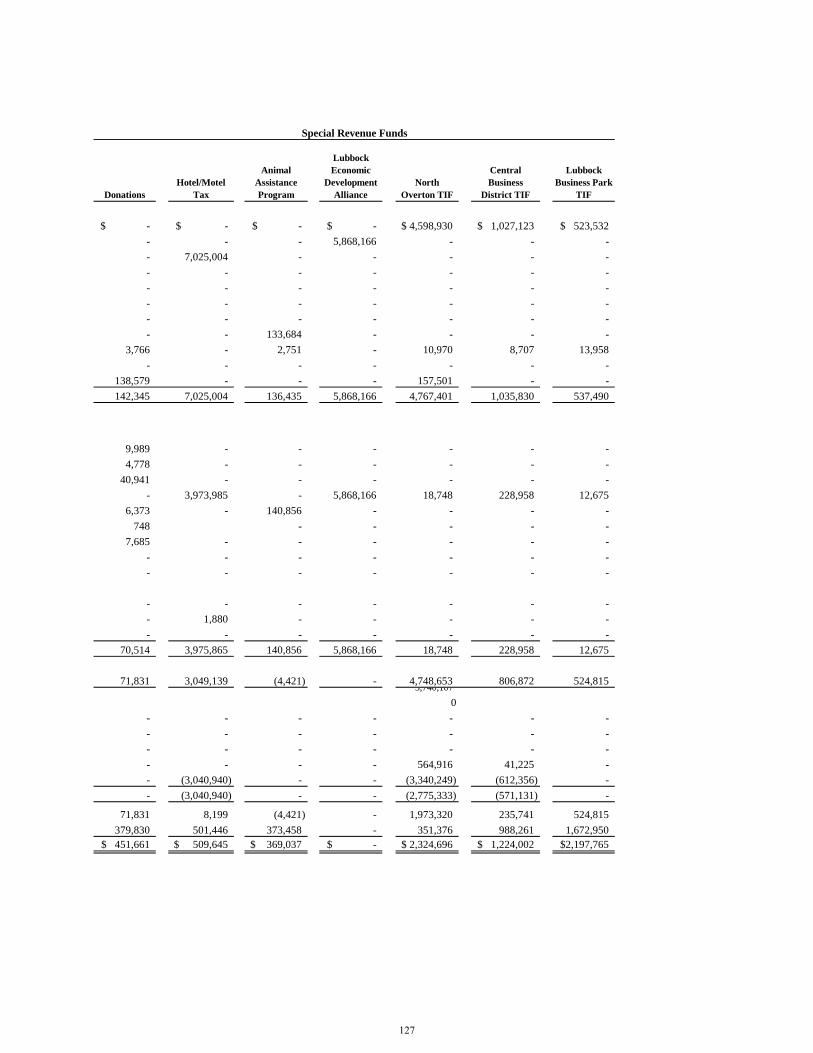
Donations
Hotel/Motel
Tax
Animal
Assistance
Program
Lubbock
Economic
Development
Alliance
North
Overton TIF
Central
Business
District TIF
Lubbock
Business Park
TIF
-$ -$ -$ -$ 4,598,930$ 1,027,123$ 523,532$
- - - 5,868,166 - - -
- 7,025,004 - - - - -
- - - - - - -
- - - - - - -
- - - - - - -
- - - - - - -
- - 133,684 - - - -
3,766 - 2,751 - 10,970 8,707 13,958
- - - - - - -
138,579 - - - 157,501 - -
142,345 7,025,004 136,435 5,868,166 4,767,401 1,035,830 537,490
9,989 - - - - - -
4,778 - - - - - -
40,941 - - - - - -
- 3,973,985 - 5,868,166 18,748 228,958 12,675
6,373 - 140,856 - - - -
748 - - - - -
7,685 - - - - - -
- - - - - - -
- - - - - - -
- - - - - - -
- 1,880 - - - - -
- - - - - - -
70,514 3,975,865 140,856 5,868,166 18,748 228,958 12,675
71,831 3,049,139 (4,421) - 4,748,653 806,872 524,8155,740,107
0
- - - - - - -
- - - - - - -
- - - - - - -
- - - - 564,916 41,225 -
- (3,040,940) - - (3,340,249) (612,356) -
- (3,040,940) - - (2,775,333) (571,131) -
71,831 8,199 (4,421) - 1,973,320 235,741 524,815
379,830 501,446 373,458 - 351,376 988,261 1,672,950
451,661$ 509,645$ 369,037$ -$ 2,324,696$ 1,224,002$ 2,197,765$
Special Revenue Funds
127
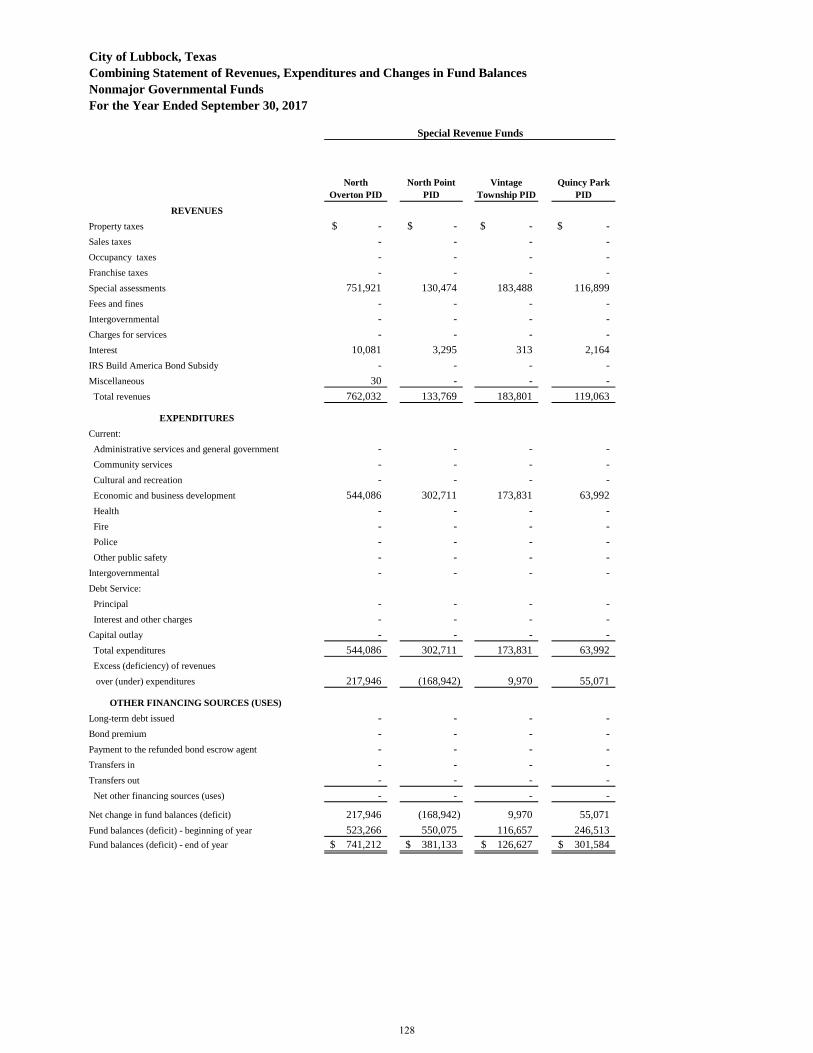
City of Lubbock, Texas
Combining Statement of Revenues, Expenditures and Changes in Fund Balances
Nonmajor Governmental Funds
For the Year Ended September 30, 2017
North
Overton PID
North Point
PID
Vintage
Township PID
Quincy Park
PID
REVENUES
Property taxes -$ -$ -$ -$
Sales taxes - - - -
Occupancy taxes - - - -
Franchise taxes - - - -
Special assessments 751,921 130,474 183,488 116,899
Fees and fines - - - -
Intergovernmental - - - -
Charges for services - - - -
Interest 10,081 3,295 313 2,164
IRS Build America Bond Subsidy - - - -
Miscellaneous 30 - - -
Total revenues 762,032 133,769 183,801 119,063
EXPENDITURES
Current:
Administrative services and general government - - - -
Community services - - - -
Cultural and recreation - - - -
Economic and business development 544,086 302,711 173,831 63,992
Health - - - -
Fire - - - -
Police - - - -
Other public safety - - - -
Intergovernmental - - - -
Debt Service:
Principal - - - -
Interest and other charges - - - -
Capital outlay - - - -
Total expenditures 544,086 302,711 173,831 63,992
Excess (deficiency) of revenues
over (under) expenditures 217,946 (168,942) 9,970 55,071
OTHER FINANCING SOURCES (USES)
Long-term debt issued - - - -
Bond premium - - - -
Payment to the refunded bond escrow agent - - - -
Transfers in - - - -
Transfers out - - - -
Net other financing sources (uses) - - - -
Net change in fund balances (deficit) 217,946 (168,942) 9,970 55,071
Fund balances (deficit) - beginning of year 523,266 550,075 116,657 246,513
Fund balances (deficit) - end of year 741,212$ 381,133$ 126,627$ 301,584$
Special Revenue Funds
128
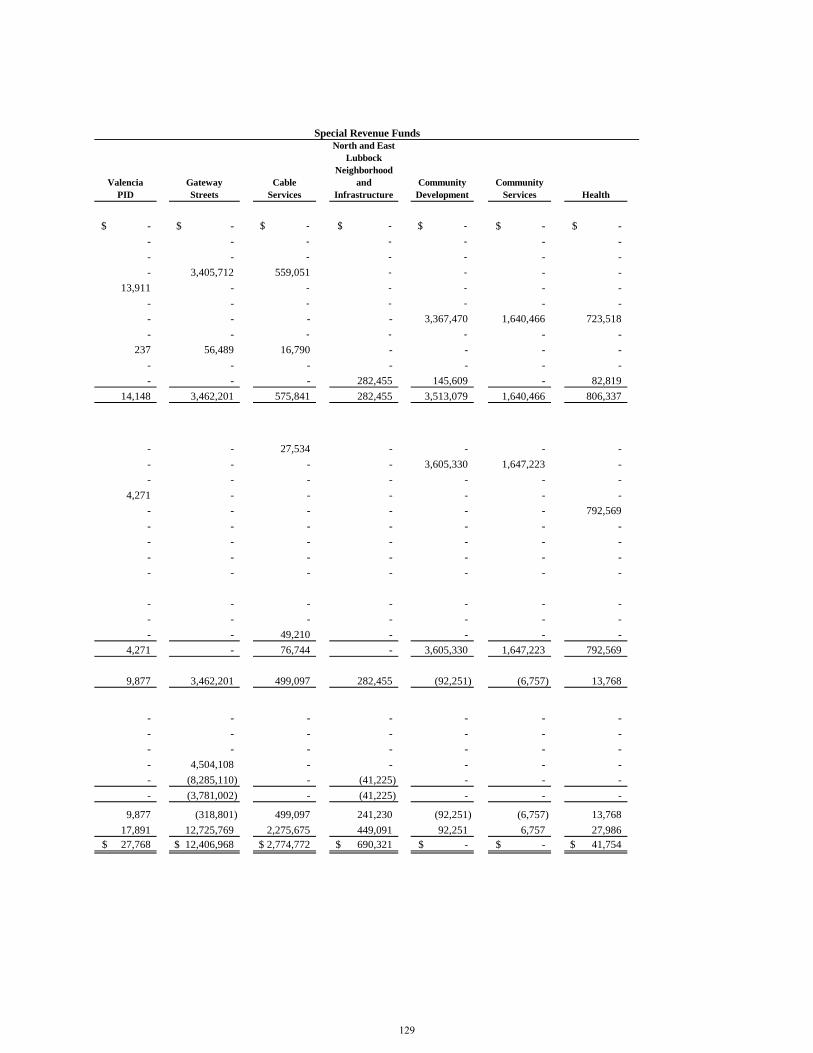
Valencia
PID
Gateway
Streets
Cable
Services
North and East
Lubbock
Neighborhood
and
Infrastructure
Community
Development
Community
Services Health
-$ -$ -$ -$ -$ -$ -$
- - - - - - -
- - - - - - -
- 3,405,712 559,051 - - - -
13,911 - - - - - -
- - - - - - -
- - - - 3,367,470 1,640,466 723,518
- - - - - - -
237 56,489 16,790 - - - -
- - - - - - -
- - - 282,455 145,609 - 82,819
14,148 3,462,201 575,841 282,455 3,513,079 1,640,466 806,337
- - 27,534 - - - -
- - - - 3,605,330 1,647,223 -
- - - - - - -
4,271 - - - - - -
- - - - - - 792,569
- - - - - - -
- - - - - - -
- - - - - - -
- - - - - - -
- - - - - - -
- - - - - - -
- - 49,210 - - - -
4,271 - 76,744 - 3,605,330 1,647,223 792,569
9,877 3,462,201 499,097 282,455 (92,251) (6,757) 13,768
- - - - - - -
- - - - - - -
- - - - - - -
- 4,504,108 - - - - -
- (8,285,110) - (41,225) - - -
- (3,781,002) - (41,225) - - -
9,877 (318,801) 499,097 241,230 (92,251) (6,757) 13,768
17,891 12,725,769 2,275,675 449,091 92,251 6,757 27,986
27,768$ 12,406,968$ 2,774,772$ 690,321$ -$ -$ 41,754$
Special Revenue Funds
129
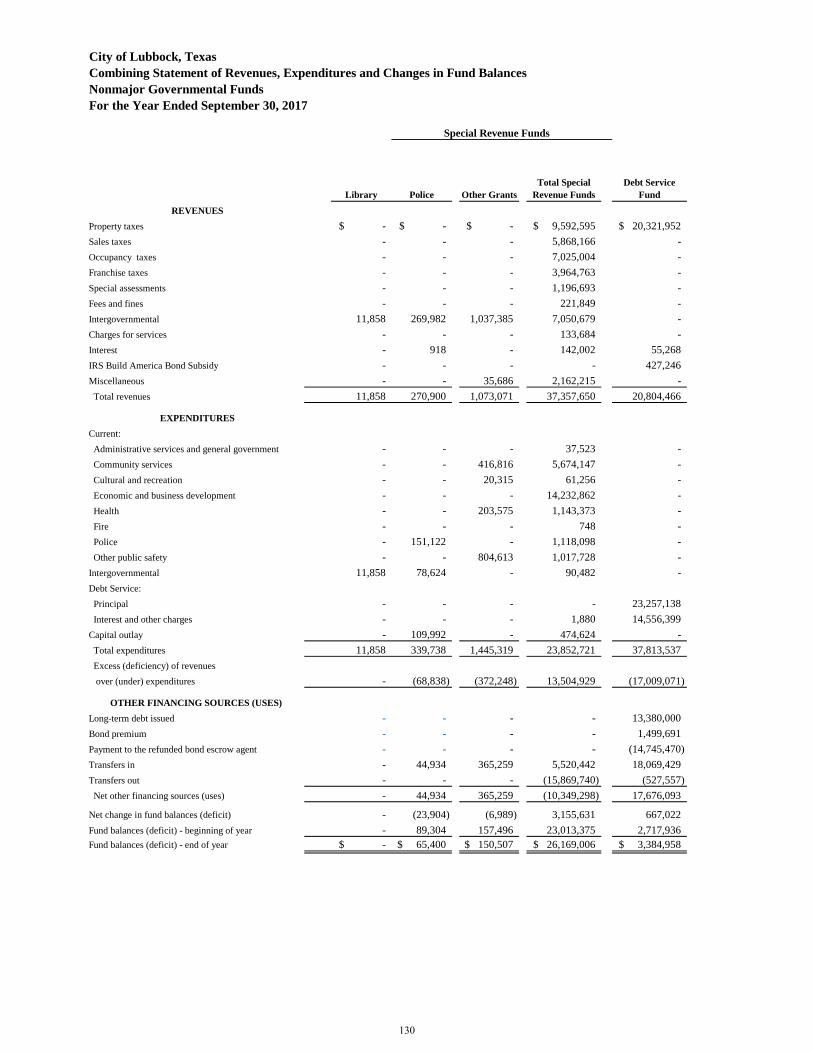
City of Lubbock, Texas
Combining Statement of Revenues, Expenditures and Changes in Fund Balances
Nonmajor Governmental Funds
For the Year Ended September 30, 2017
Library Police Other Grants
Total Special
Revenue Funds
Debt Service
Fund
REVENUES
Property taxes -$ -$ -$ 9,592,595$ 20,321,952$
Sales taxes - - - 5,868,166 -
Occupancy taxes - - - 7,025,004 -
Franchise taxes - - - 3,964,763 -
Special assessments - - - 1,196,693 -
Fees and fines - - - 221,849 -
Intergovernmental 11,858 269,982 1,037,385 7,050,679 -
Charges for services - - - 133,684 -
Interest - 918 - 142,002 55,268
IRS Build America Bond Subsidy - - - - 427,246
Miscellaneous - - 35,686 2,162,215 -
Total revenues 11,858 270,900 1,073,071 37,357,650 20,804,466
EXPENDITURES
Current:
Administrative services and general government - - - 37,523 -
Community services - - 416,816 5,674,147 -
Cultural and recreation - - 20,315 61,256 -
Economic and business development - - - 14,232,862 -
Health - - 203,575 1,143,373 -
Fire - - - 748 -
Police - 151,122 - 1,118,098 -
Other public safety - - 804,613 1,017,728 -
Intergovernmental 11,858 78,624 - 90,482 -
Debt Service:
Principal - - - - 23,257,138
Interest and other charges - - - 1,880 14,556,399
Capital outlay - 109,992 - 474,624 -
Total expenditures 11,858 339,738 1,445,319 23,852,721 37,813,537
Excess (deficiency) of revenues
over (under) expenditures - (68,838) (372,248) 13,504,929 (17,009,071)
OTHER FINANCING SOURCES (USES)
Long-term debt issued - - - - 13,380,000
Bond premium - - - - 1,499,691
Payment to the refunded bond escrow agent - - - - (14,745,470)
Transfers in - 44,934 365,259 5,520,442 18,069,429
Transfers out - - - (15,869,740) (527,557)
Net other financing sources (uses) - 44,934 365,259 (10,349,298) 17,676,093
Net change in fund balances (deficit) - (23,904) (6,989) 3,155,631 667,022
Fund balances (deficit) - beginning of year - 89,304 157,496 23,013,375 2,717,936
Fund balances (deficit) - end of year -$ 65,400$ 150,507$ 26,169,006$ 3,384,958$
Special Revenue Funds
130
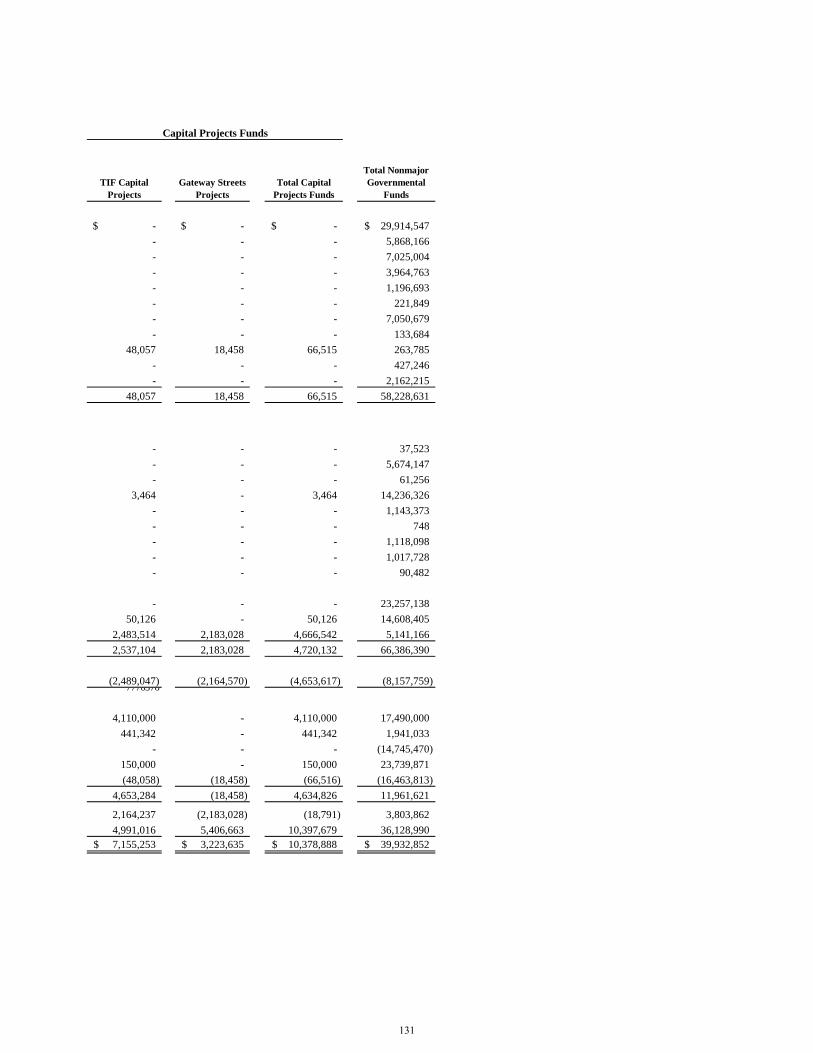
TIF Capital
Projects
Gateway Streets
Projects
Total Capital
Projects Funds
Total Nonmajor
Governmental
Funds
-$ -$ -$ 29,914,547$
- - - 5,868,166
- - - 7,025,004
- - - 3,964,763
- - - 1,196,693
- - - 221,849
- - - 7,050,679
- - - 133,684
48,057 18,458 66,515 263,785
- - - 427,246
- - - 2,162,215
48,057 18,458 66,515 58,228,631
- - - 37,523
- - - 5,674,147
- - - 61,256
3,464 - 3,464 14,236,326
- - - 1,143,373
- - - 748
- - - 1,118,098
- - - 1,017,728
- - - 90,482
- - - 23,257,138
50,126 - 50,126 14,608,405
2,483,514 2,183,028 4,666,542 5,141,166
2,537,104 2,183,028 4,720,132 66,386,390
(2,489,047) (2,164,570) (4,653,617) (8,157,759)7776378
4,110,000 - 4,110,000 17,490,000
441,342 - 441,342 1,941,033
- - - (14,745,470)
150,000 - 150,000 23,739,871
(48,058) (18,458) (66,516) (16,463,813)
4,653,284 (18,458) 4,634,826 11,961,621
2,164,237 (2,183,028) (18,791) 3,803,862
4,991,016 5,406,663 10,397,679 36,128,990
7,155,253$ 3,223,635$ 10,378,888$ 39,932,852$
Capital Projects Funds
131
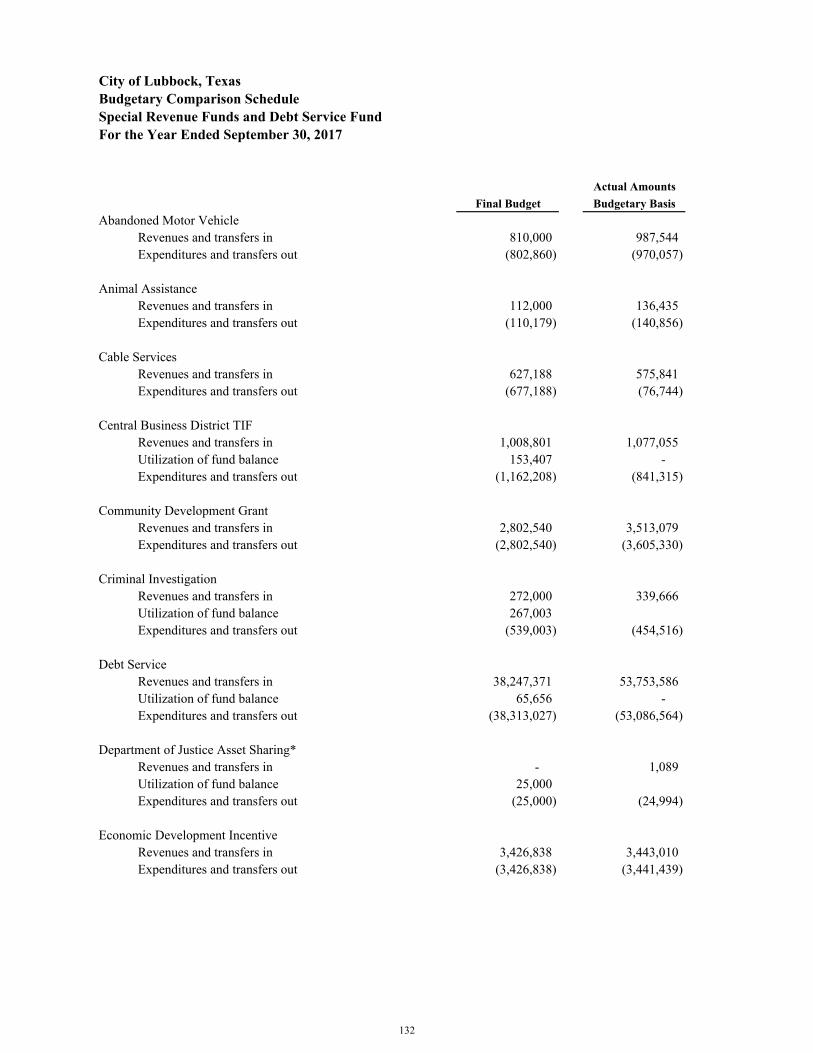
City of Lubbock, TexasBudgetary Comparison ScheduleSpecial Revenue Funds and Debt Service FundFor the Year Ended September 30, 2017
Actual Amounts
Final Budget Budgetary Basis
Abandoned Motor Vehicle Revenues and transfers in 810,000 987,544 Expenditures and transfers out (802,860) (970,057)
Animal Assistance Revenues and transfers in 112,000 136,435 Expenditures and transfers out (110,179) (140,856)
Cable Services Revenues and transfers in 627,188 575,841 Expenditures and transfers out (677,188) (76,744)
Central Business District TIF Revenues and transfers in 1,008,801 1,077,055 Utilization of fund balance 153,407 - Expenditures and transfers out (1,162,208) (841,315)
Community Development Grant Revenues and transfers in 2,802,540 3,513,079 Expenditures and transfers out (2,802,540) (3,605,330)
Criminal Investigation Revenues and transfers in 272,000 339,666 Utilization of fund balance 267,003 Expenditures and transfers out (539,003) (454,516)
Debt Service Revenues and transfers in 38,247,371 53,753,586 Utilization of fund balance 65,656 - Expenditures and transfers out (38,313,027) (53,086,564)
Department of Justice Asset Sharing* Revenues and transfers in - 1,089 Utilization of fund balance 25,000 Expenditures and transfers out (25,000) (24,994)
Economic Development Incentive Revenues and transfers in 3,426,838 3,443,010 Expenditures and transfers out (3,426,838) (3,441,439)
132
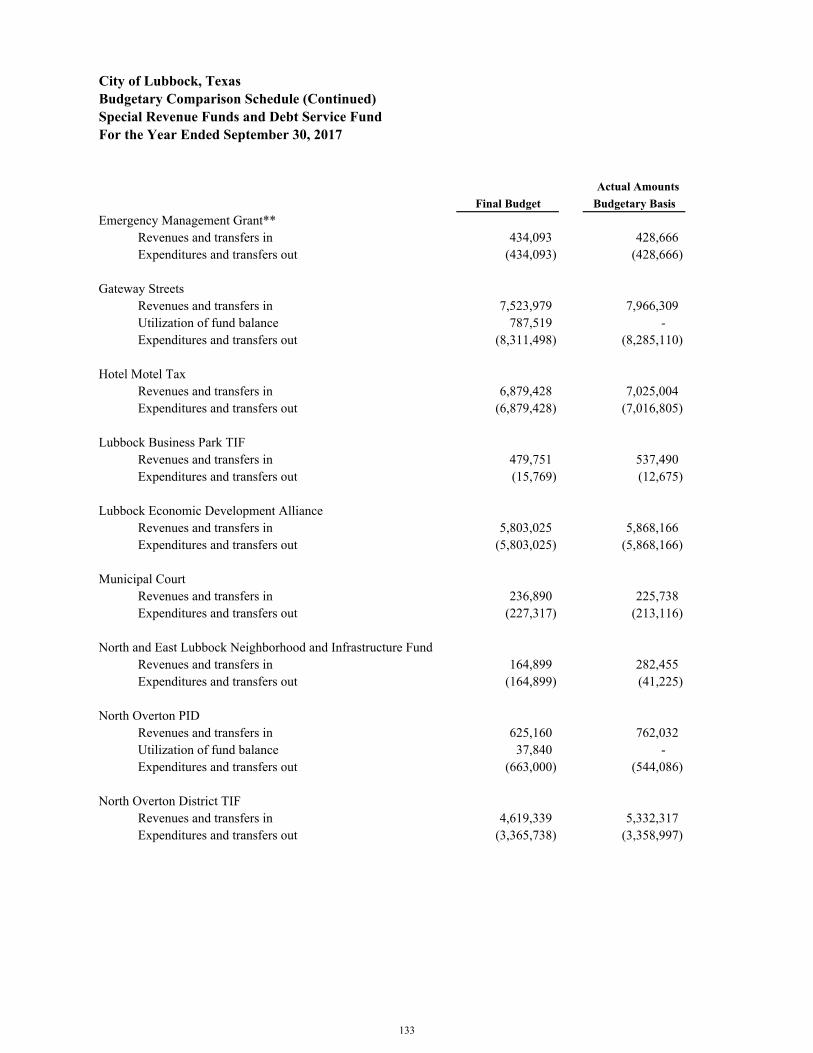
City of Lubbock, TexasBudgetary Comparison Schedule (Continued)Special Revenue Funds and Debt Service FundFor the Year Ended September 30, 2017
Actual Amounts
Final Budget Budgetary Basis
Emergency Management Grant** Revenues and transfers in 434,093 428,666 Expenditures and transfers out (434,093) (428,666)
Gateway Streets Revenues and transfers in 7,523,979 7,966,309 Utilization of fund balance 787,519 - Expenditures and transfers out (8,311,498) (8,285,110)
Hotel Motel Tax Revenues and transfers in 6,879,428 7,025,004 Expenditures and transfers out (6,879,428) (7,016,805)
Lubbock Business Park TIF Revenues and transfers in 479,751 537,490 Expenditures and transfers out (15,769) (12,675)
Lubbock Economic Development Alliance Revenues and transfers in 5,803,025 5,868,166 Expenditures and transfers out (5,803,025) (5,868,166)
Municipal Court Revenues and transfers in 236,890 225,738 Expenditures and transfers out (227,317) (213,116)
North and East Lubbock Neighborhood and Infrastructure Fund Revenues and transfers in 164,899 282,455 Expenditures and transfers out (164,899) (41,225)
North Overton PID Revenues and transfers in 625,160 762,032 Utilization of fund balance 37,840 - Expenditures and transfers out (663,000) (544,086)
North Overton District TIF Revenues and transfers in 4,619,339 5,332,317 Expenditures and transfers out (3,365,738) (3,358,997)
133
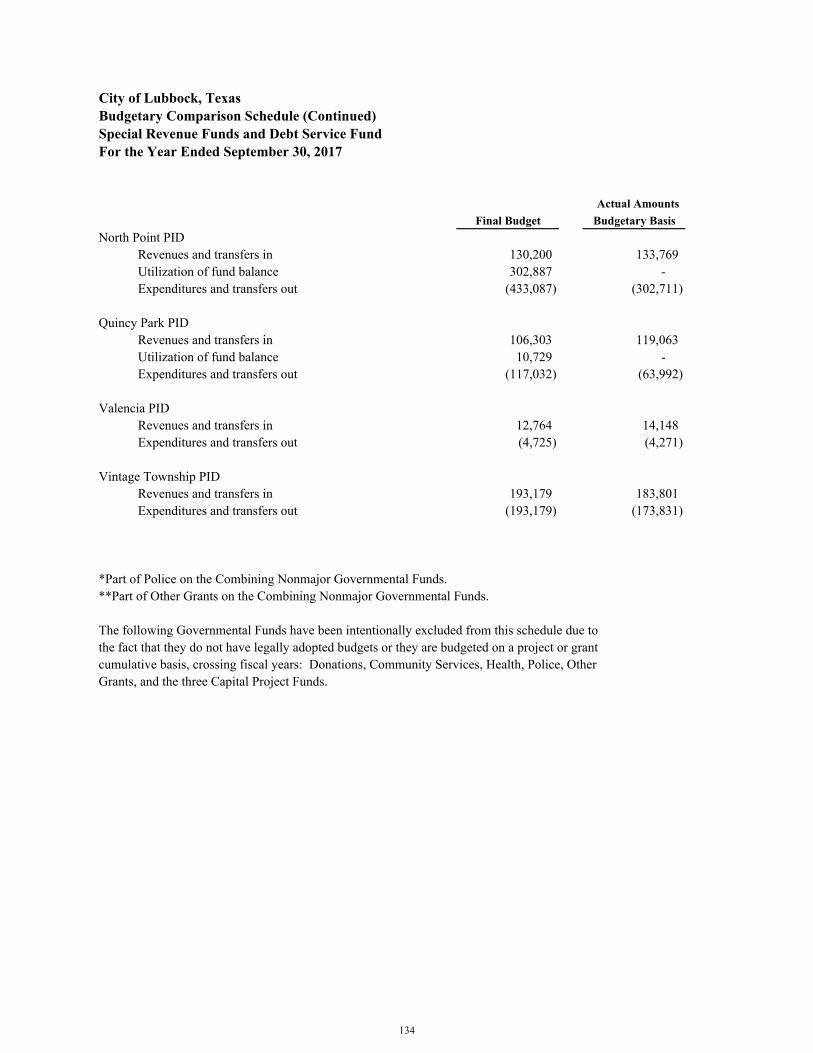
City of Lubbock, TexasBudgetary Comparison Schedule (Continued)Special Revenue Funds and Debt Service FundFor the Year Ended September 30, 2017
Actual Amounts
Final Budget Budgetary Basis
North Point PID Revenues and transfers in 130,200 133,769 Utilization of fund balance 302,887 - Expenditures and transfers out (433,087) (302,711)
Quincy Park PID Revenues and transfers in 106,303 119,063 Utilization of fund balance 10,729 - Expenditures and transfers out (117,032) (63,992)
Valencia PID Revenues and transfers in 12,764 14,148 Expenditures and transfers out (4,725) (4,271)
Vintage Township PID Revenues and transfers in 193,179 183,801 Expenditures and transfers out (193,179) (173,831)
*Part of Police on the Combining Nonmajor Governmental Funds.**Part of Other Grants on the Combining Nonmajor Governmental Funds.
The following Governmental Funds have been intentionally excluded from this schedule due tothe fact that they do not have legally adopted budgets or they are budgeted on a project or grantcumulative basis, crossing fiscal years: Donations, Community Services, Health, Police, OtherGrants, and the three Capital Project Funds.
134
CITY OF LUBBOCK, TEXAS
Nonmajor Enterprise Funds The Proprietary Funds are used to account for the operations of the City financed and operated in
a manner similar to private business enterprises, where the intent is that the cost of providing
goods or services to the general public on a continuing basis be financed or recovered in whole
or part through user charges.
Airport Fund – Accounts for the operations of Lubbock Preston Smith International Airport. Solid Waste Fund – Accounts for the operations of the City’s landfills and its solid waste collection system. Transit Fund – Accounts for the City-owned transportation system. Cemetery Fund – Accounts for the operations of the City’s cemetery. Civic Centers Fund – Accounts for the utilization of the Civic Center, Coliseum, Municipal Auditorium and Amphitheater. Lake Alan Henry Fund – Accounts for fees and charges collected at the Lake site and the costs of operations of that facility.
135
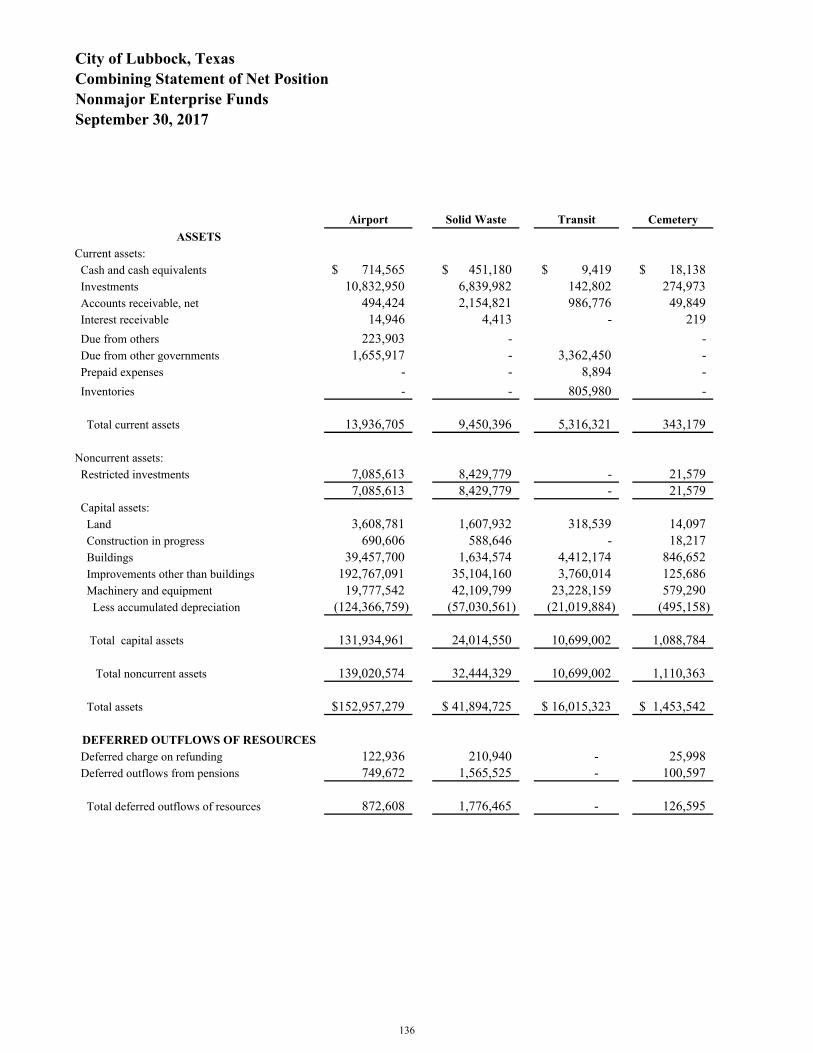
Airport Solid Waste Transit Cemetery
ASSETS
Current assets: Cash and cash equivalents 714,565$ 451,180$ 9,419$ 18,138$ Investments 10,832,950 6,839,982 142,802 274,973 Accounts receivable, net 494,424 2,154,821 986,776 49,849 Interest receivable 14,946 4,413 - 219 Due from others 223,903 - - Due from other governments 1,655,917 - 3,362,450 - Prepaid expenses - - 8,894 - Inventories - - 805,980 -
Total current assets 13,936,705 9,450,396 5,316,321 343,179
Noncurrent assets: Restricted investments 7,085,613 8,429,779 - 21,579 7,085,613 8,429,779 - 21,579 Capital assets: Land 3,608,781 1,607,932 318,539 14,097 Construction in progress 690,606 588,646 - 18,217 Buildings 39,457,700 1,634,574 4,412,174 846,652 Improvements other than buildings 192,767,091 35,104,160 3,760,014 125,686 Machinery and equipment 19,777,542 42,109,799 23,228,159 579,290 Less accumulated depreciation (124,366,759) (57,030,561) (21,019,884) (495,158)
Total capital assets 131,934,961 24,014,550 10,699,002 1,088,784
Total noncurrent assets 139,020,574 32,444,329 10,699,002 1,110,363
Total assets 152,957,279$ 41,894,725$ 16,015,323$ 1,453,542$
DEFERRED OUTFLOWS OF RESOURCES
Deferred charge on refunding 122,936 210,940 - 25,998 Deferred outflows from pensions 749,672 1,565,525 - 100,597
Total deferred outflows of resources 872,608 1,776,465 - 126,595
City of Lubbock, TexasCombining Statement of Net PositionNonmajor Enterprise FundsSeptember 30, 2017
136
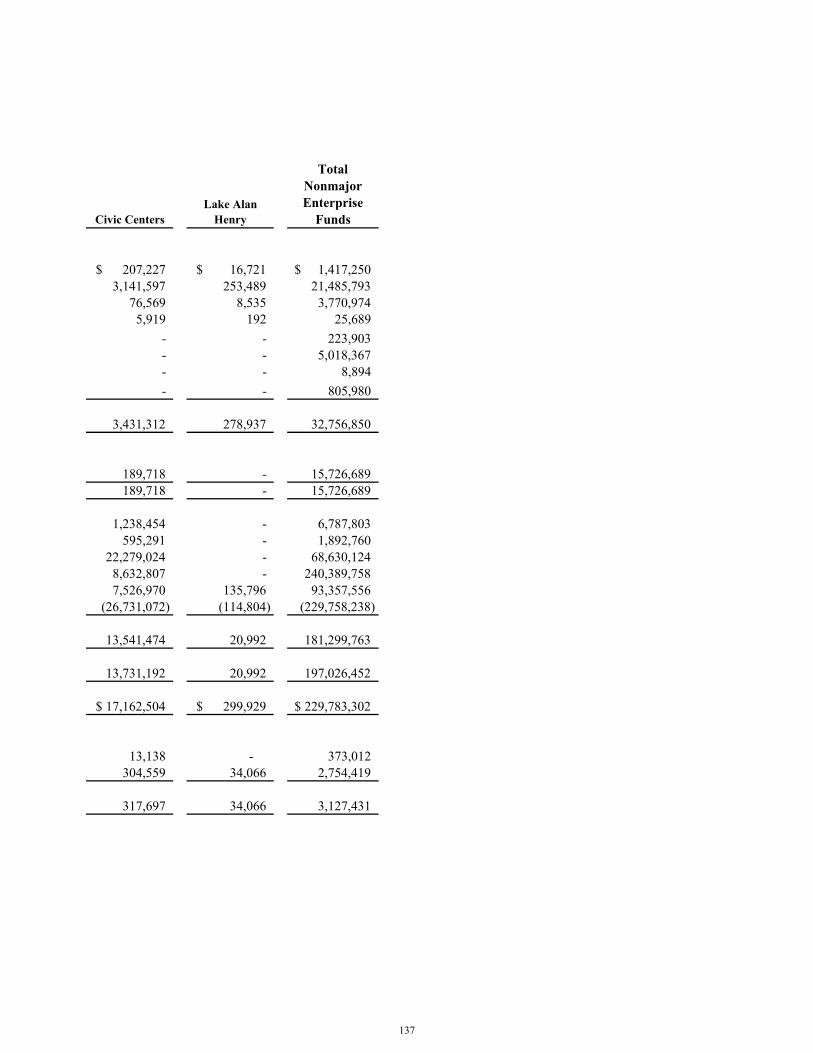
Civic CentersLake Alan
Henry
Total Nonmajor Enterprise
Funds
207,227$ 16,721$ 1,417,250$ 3,141,597 253,489 21,485,793
76,569 8,535 3,770,9745,919 192 25,689
- - 223,903- - 5,018,367- - 8,894- - 805,980
3,431,312 278,937 32,756,850
189,718 - 15,726,689189,718 - 15,726,689
1,238,454 - 6,787,803595,291 - 1,892,760
22,279,024 - 68,630,1248,632,807 - 240,389,7587,526,970 135,796 93,357,556
(26,731,072) (114,804) (229,758,238)
13,541,474 20,992 181,299,763
13,731,192 20,992 197,026,452
17,162,504$ 299,929$ 229,783,302$
13,138 - 373,012 304,559 34,066 2,754,419
317,697 34,066 3,127,431
137
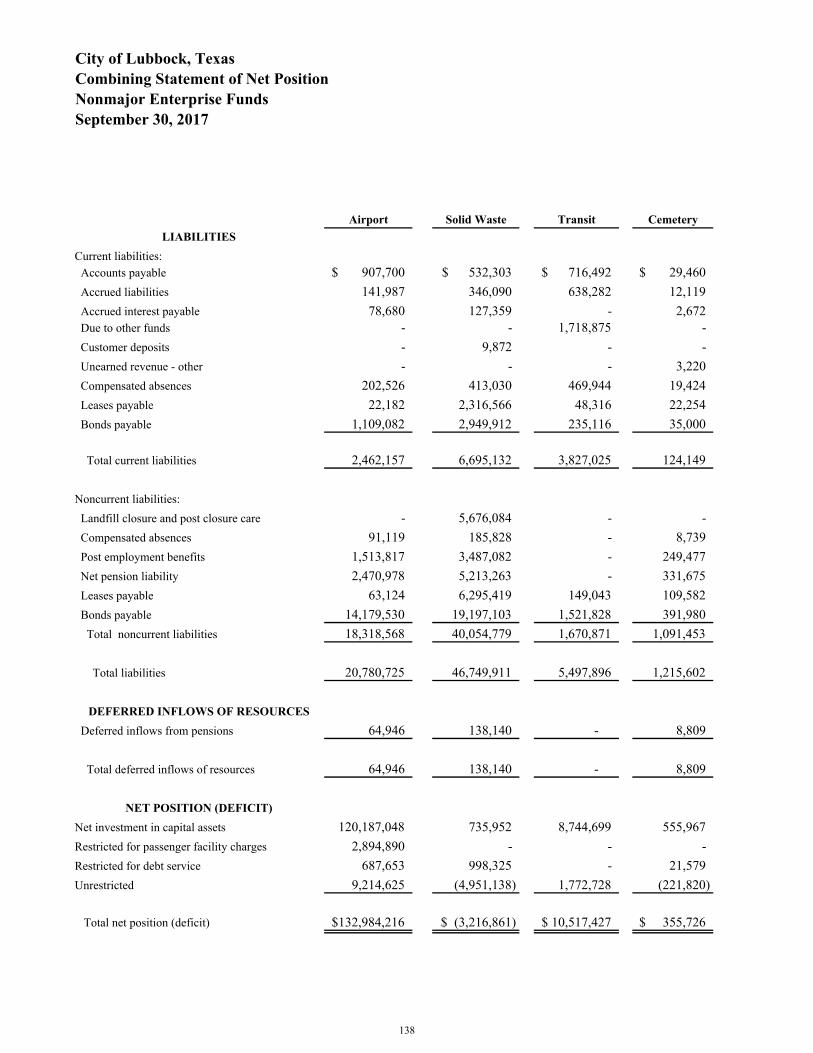
Airport Solid Waste Transit Cemetery
City of Lubbock, TexasCombining Statement of Net PositionNonmajor Enterprise FundsSeptember 30, 2017
LIABILITIES
Current liabilities: Accounts payable 907,700$ 532,303$ 716,492$ 29,460$ Accrued liabilities 141,987 346,090 638,282 12,119 Accrued interest payable 78,680 127,359 - 2,672 Due to other funds - - 1,718,875 - Customer deposits - 9,872 - - Unearned revenue - other - - - 3,220 Compensated absences 202,526 413,030 469,944 19,424 Leases payable 22,182 2,316,566 48,316 22,254 Bonds payable 1,109,082 2,949,912 235,116 35,000
Total current liabilities 2,462,157 6,695,132 3,827,025 124,149
Noncurrent liabilities: Landfill closure and post closure care - 5,676,084 - - Compensated absences 91,119 185,828 - 8,739 Post employment benefits 1,513,817 3,487,082 - 249,477 Net pension liability 2,470,978 5,213,263 - 331,675 Leases payable 63,124 6,295,419 149,043 109,582 Bonds payable 14,179,530 19,197,103 1,521,828 391,980 Total noncurrent liabilities 18,318,568 40,054,779 1,670,871 1,091,453
Total liabilities 20,780,725 46,749,911 5,497,896 1,215,602
DEFERRED INFLOWS OF RESOURCES
Deferred inflows from pensions 64,946 138,140 - 8,809
Total deferred inflows of resources 64,946 138,140 - 8,809
NET POSITION (DEFICIT)
Net investment in capital assets 120,187,048 735,952 8,744,699 555,967Restricted for passenger facility charges 2,894,890 - - -Restricted for debt service 687,653 998,325 - 21,579Unrestricted 9,214,625 (4,951,138) 1,772,728 (221,820)
Total net position (deficit) 132,984,216$ (3,216,861)$ 10,517,427$ 355,726$
138
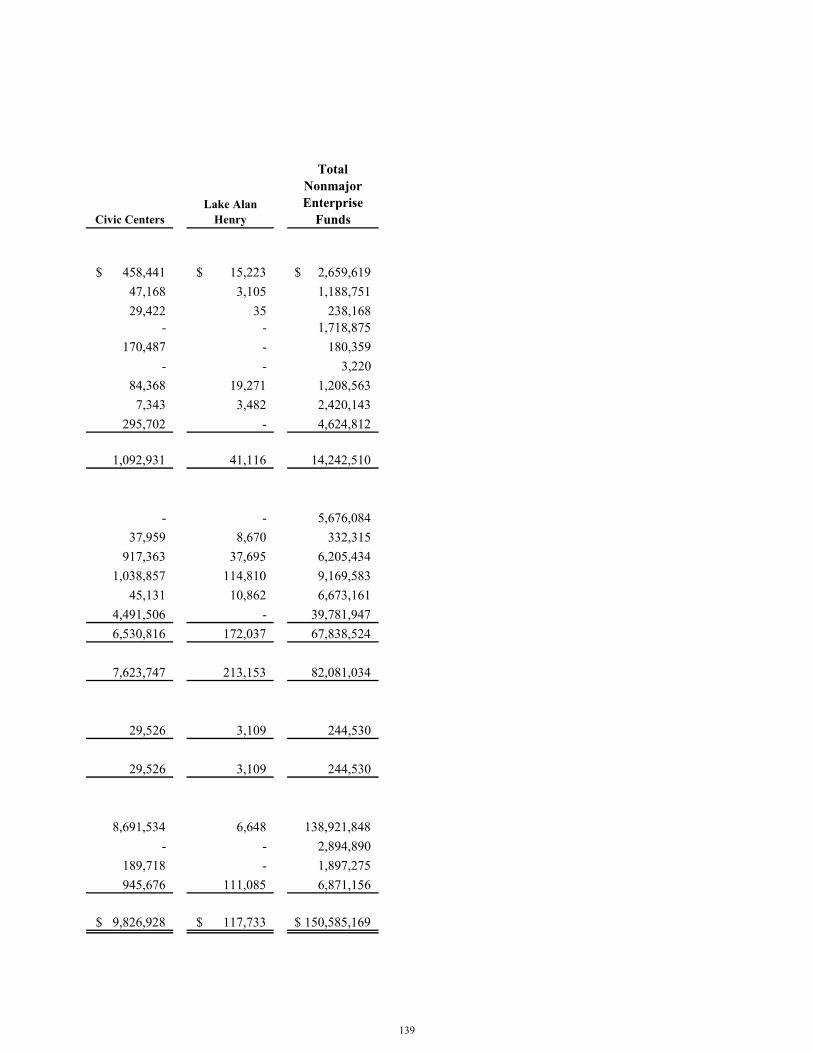
Civic CentersLake Alan
Henry
Total Nonmajor Enterprise
Funds
458,441$ 15,223$ 2,659,619$ 47,168 3,105 1,188,75129,422 35 238,168
- - 1,718,875170,487 - 180,359
- - 3,22084,368 19,271 1,208,563
7,343 3,482 2,420,143295,702 - 4,624,812
1,092,931 41,116 14,242,510
- - 5,676,08437,959 8,670 332,315
917,363 37,695 6,205,4341,038,857 114,810 9,169,583
45,131 10,862 6,673,1614,491,506 - 39,781,9476,530,816 172,037 67,838,524
7,623,747 213,153 82,081,034
29,526 3,109 244,530
29,526 3,109 244,530
8,691,534 6,648 138,921,848- - 2,894,890
189,718 - 1,897,275945,676 111,085 6,871,156
9,826,928$ 117,733$ 150,585,169$
139
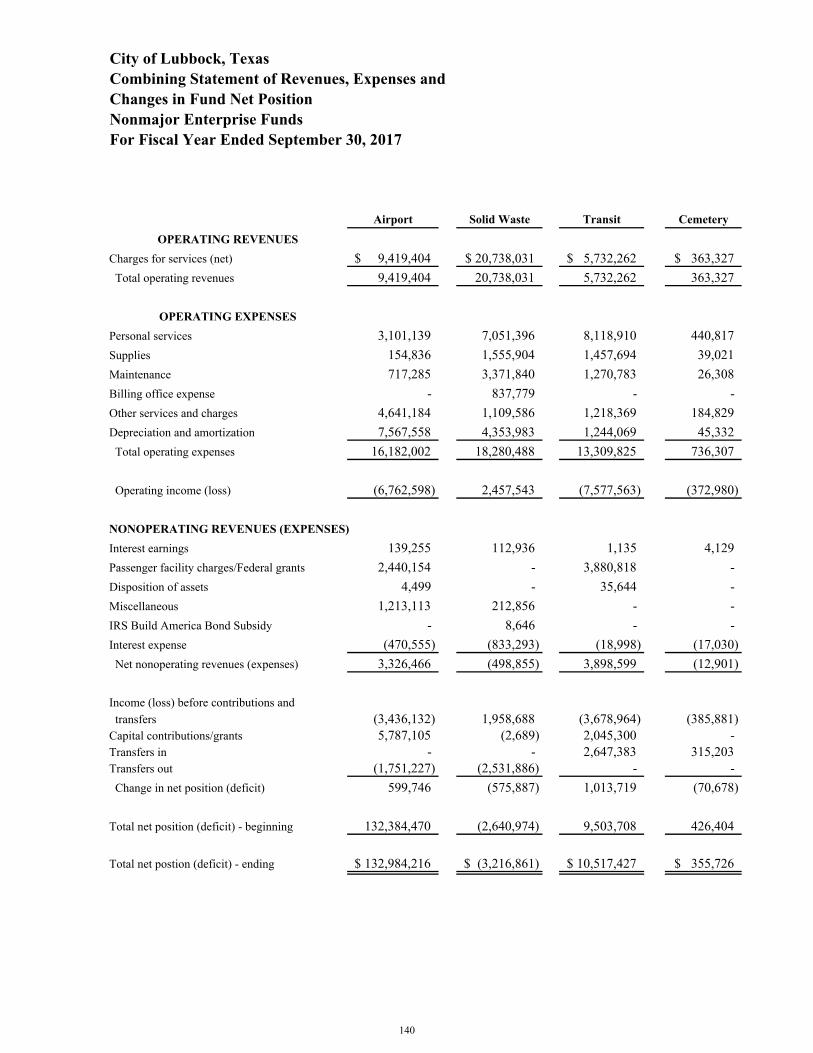
Changes in Fund Net Position
Airport Solid Waste Transit Cemetery
OPERATING REVENUES
Charges for services (net) 9,419,404$ 20,738,031$ 5,732,262$ 363,327$ Total operating revenues 9,419,404 20,738,031 5,732,262 363,327
OPERATING EXPENSES
Personal services 3,101,139 7,051,396 8,118,910 440,817Supplies 154,836 1,555,904 1,457,694 39,021Maintenance 717,285 3,371,840 1,270,783 26,308Billing office expense - 837,779 - -Other services and charges 4,641,184 1,109,586 1,218,369 184,829Depreciation and amortization 7,567,558 4,353,983 1,244,069 45,332 Total operating expenses 16,182,002 18,280,488 13,309,825 736,307
Operating income (loss) (6,762,598) 2,457,543 (7,577,563) (372,980)
NONOPERATING REVENUES (EXPENSES)
Interest earnings 139,255 112,936 1,135 4,129Passenger facility charges/Federal grants 2,440,154 - 3,880,818 -Disposition of assets 4,499 - 35,644 -Miscellaneous 1,213,113 212,856 - -IRS Build America Bond Subsidy - 8,646 - -Interest expense (470,555) (833,293) (18,998) (17,030) Net nonoperating revenues (expenses) 3,326,466 (498,855) 3,898,599 (12,901)
Income (loss) before contributions and transfers (3,436,132) 1,958,688 (3,678,964) (385,881)Capital contributions/grants 5,787,105 (2,689) 2,045,300 -Transfers in - - 2,647,383 315,203Transfers out (1,751,227) (2,531,886) - - Change in net position (deficit) 599,746 (575,887) 1,013,719 (70,678)
Total net position (deficit) - beginning 132,384,470 (2,640,974) 9,503,708 426,404
Total net postion (deficit) - ending 132,984,216$ (3,216,861)$ 10,517,427$ 355,726$
City of Lubbock, TexasCombining Statement of Revenues, Expenses and
Nonmajor Enterprise FundsFor Fiscal Year Ended September 30, 2017
140
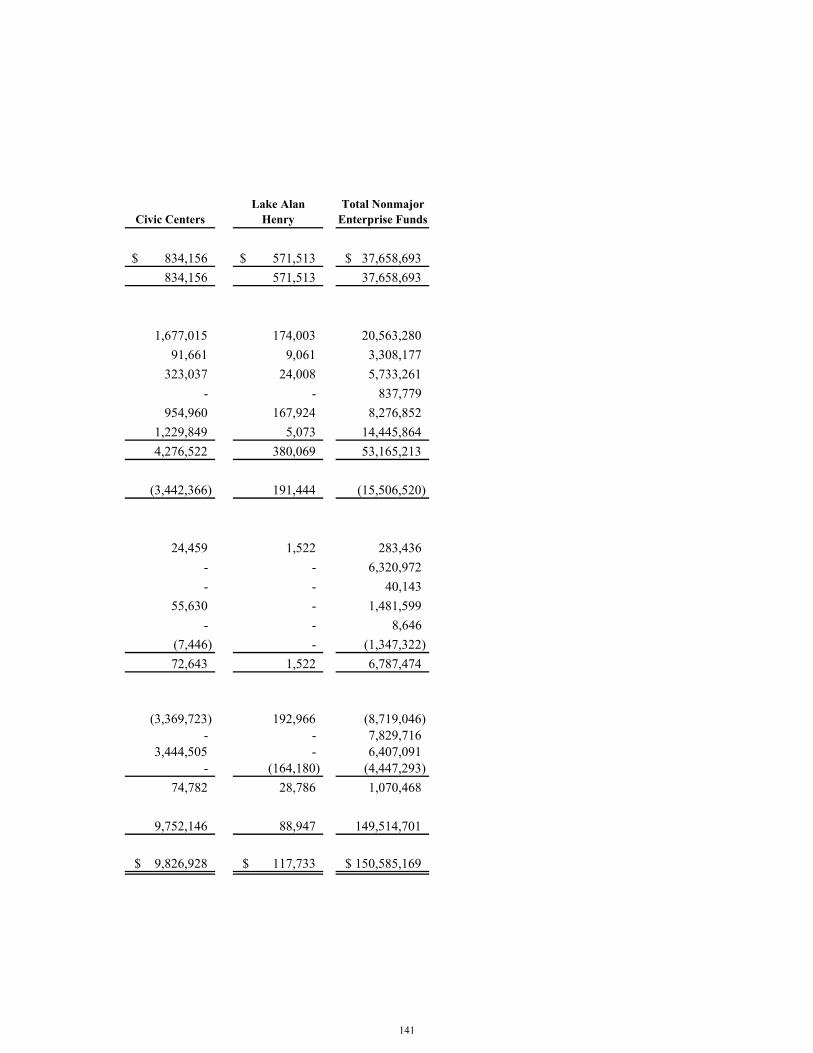
Civic CentersLake Alan
HenryTotal Nonmajor
Enterprise Funds
834,156$ 571,513$ 37,658,693$ 834,156 571,513 37,658,693
1,677,015 174,003 20,563,28091,661 9,061 3,308,177
323,037 24,008 5,733,261- - 837,779
954,960 167,924 8,276,8521,229,849 5,073 14,445,8644,276,522 380,069 53,165,213
(3,442,366) 191,444 (15,506,520)
24,459 1,522 283,436- - 6,320,972- - 40,143
55,630 - 1,481,599- - 8,646
(7,446) - (1,347,322)72,643 1,522 6,787,474
(3,369,723) 192,966 (8,719,046)- - 7,829,716
3,444,505 - 6,407,091- (164,180) (4,447,293)
74,782 28,786 1,070,468
9,752,146 88,947 149,514,701
9,826,928$ 117,733$ 150,585,169$
141
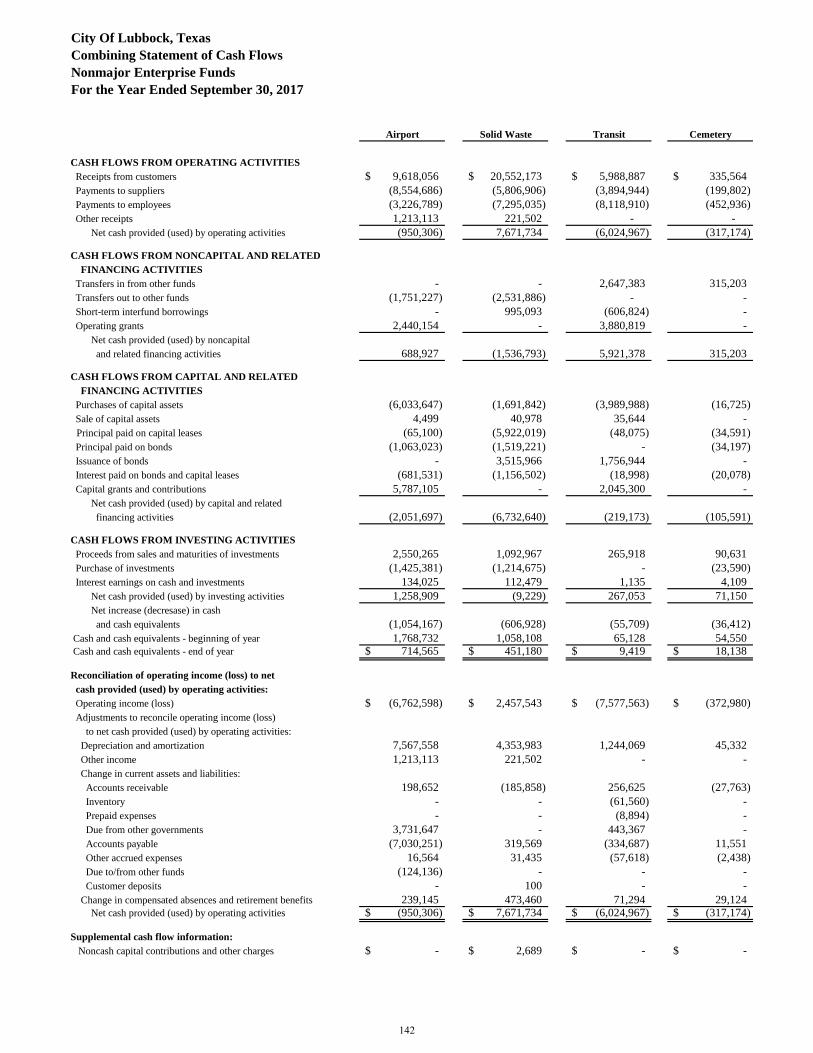
City Of Lubbock, Texas
Combining Statement of Cash Flows
Nonmajor Enterprise Funds
For the Year Ended September 30, 2017
Airport Solid Waste Transit Cemetery
CASH FLOWS FROM OPERATING ACTIVITIES
Receipts from customers 9,618,056$ 20,552,173$ 5,988,887$ 335,564$
Payments to suppliers (8,554,686) (5,806,906) (3,894,944) (199,802)
Payments to employees (3,226,789) (7,295,035) (8,118,910) (452,936)
Other receipts 1,213,113 221,502 - -
Net cash provided (used) by operating activities (950,306) 7,671,734 (6,024,967) (317,174)
CASH FLOWS FROM NONCAPITAL AND RELATED
FINANCING ACTIVITIES
Transfers in from other funds - - 2,647,383 315,203
Transfers out to other funds (1,751,227) (2,531,886) - -
Short-term interfund borrowings - 995,093 (606,824) -
Operating grants 2,440,154 - 3,880,819 -
Net cash provided (used) by noncapital
and related financing activities 688,927 (1,536,793) 5,921,378 315,203
CASH FLOWS FROM CAPITAL AND RELATED
FINANCING ACTIVITIES
Purchases of capital assets (6,033,647) (1,691,842) (3,989,988) (16,725)
Sale of capital assets 4,499 40,978 35,644 -
Principal paid on capital leases (65,100) (5,922,019) (48,075) (34,591)
Principal paid on bonds (1,063,023) (1,519,221) - (34,197)
Issuance of bonds - 3,515,966 1,756,944 -
Interest paid on bonds and capital leases (681,531) (1,156,502) (18,998) (20,078)
Capital grants and contributions 5,787,105 - 2,045,300 -
Net cash provided (used) by capital and related
financing activities (2,051,697) (6,732,640) (219,173) (105,591)
CASH FLOWS FROM INVESTING ACTIVITIES
Proceeds from sales and maturities of investments 2,550,265 1,092,967 265,918 90,631
Purchase of investments (1,425,381) (1,214,675) - (23,590)
Interest earnings on cash and investments 134,025 112,479 1,135 4,109
Net cash provided (used) by investing activities 1,258,909 (9,229) 267,053 71,150
Net increase (decresase) in cash
and cash equivalents (1,054,167) (606,928) (55,709) (36,412)
Cash and cash equivalents - beginning of year 1,768,732 1,058,108 65,128 54,550
Cash and cash equivalents - end of year 714,565$ 451,180$ 9,419$ 18,138$
Reconciliation of operating income (loss) to net
cash provided (used) by operating activities:
Operating income (loss) (6,762,598)$ 2,457,543$ (7,577,563)$ (372,980)$
Adjustments to reconcile operating income (loss)
to net cash provided (used) by operating activities:
Depreciation and amortization 7,567,558 4,353,983 1,244,069 45,332
Other income 1,213,113 221,502 - -
Change in current assets and liabilities:
Accounts receivable 198,652 (185,858) 256,625 (27,763)
Inventory - - (61,560) -
Prepaid expenses - - (8,894) -
Due from other governments 3,731,647 - 443,367 -
Accounts payable (7,030,251) 319,569 (334,687) 11,551
Other accrued expenses 16,564 31,435 (57,618) (2,438)
Due to/from other funds (124,136) - - -
Customer deposits - 100 - -
Change in compensated absences and retirement benefits 239,145 473,460 71,294 29,124
Net cash provided (used) by operating activities (950,306)$ 7,671,734$ (6,024,967)$ (317,174)$
Supplemental cash flow information:
Noncash capital contributions and other charges -$ 2,689$ -$ -$
142
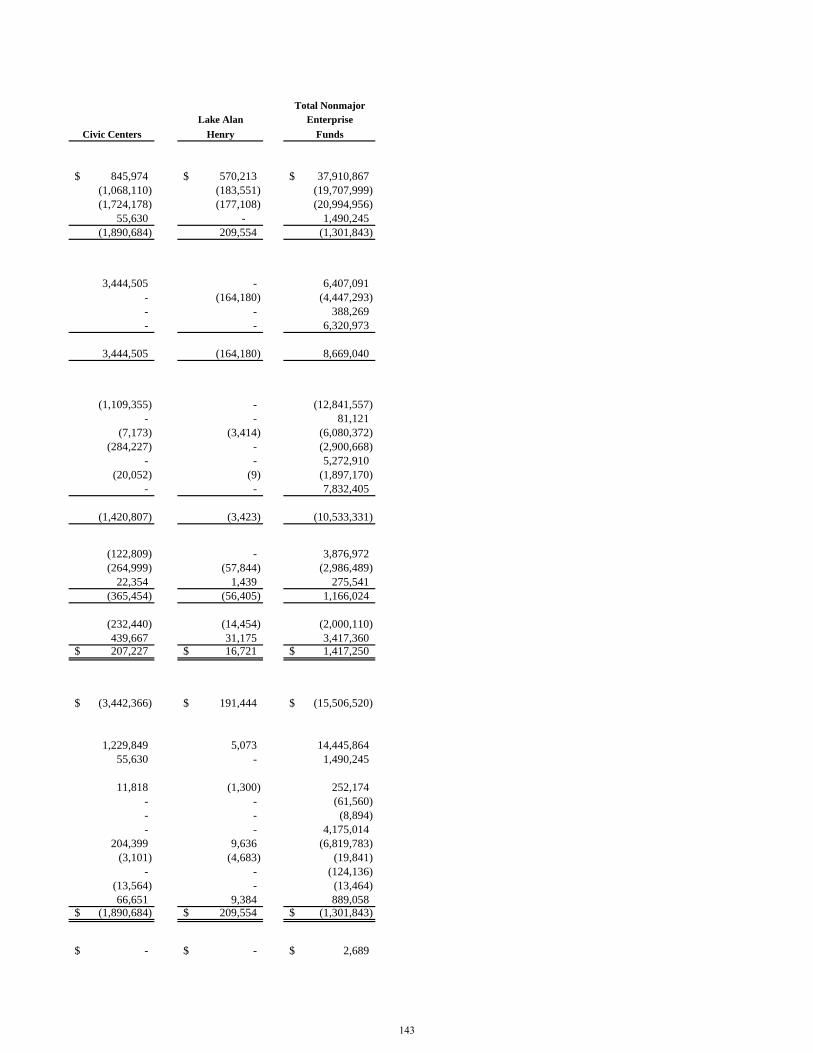
Total Nonmajor
Lake Alan Enterprise
Civic Centers Henry Funds
845,974$ 570,213$ 37,910,867$
(1,068,110) (183,551) (19,707,999)
(1,724,178) (177,108) (20,994,956)
55,630 - 1,490,245
(1,890,684) 209,554 (1,301,843)
3,444,505 - 6,407,091
- (164,180) (4,447,293)
- - 388,269
- - 6,320,973
3,444,505 (164,180) 8,669,040
(1,109,355) - (12,841,557)
- - 81,121
(7,173) (3,414) (6,080,372)
(284,227) - (2,900,668)
- - 5,272,910
(20,052) (9) (1,897,170)
- - 7,832,405
(1,420,807) (3,423) (10,533,331)
(122,809) - 3,876,972
(264,999) (57,844) (2,986,489)
22,354 1,439 275,541
(365,454) (56,405) 1,166,024
(232,440) (14,454) (2,000,110)
439,667 31,175 3,417,360
207,227$ 16,721$ 1,417,250$
(3,442,366)$ 191,444$ (15,506,520)$
1,229,849 5,073 14,445,864
55,630 - 1,490,245
11,818 (1,300) 252,174
- - (61,560)
- - (8,894)
- - 4,175,014
204,399 9,636 (6,819,783)
(3,101) (4,683) (19,841)
- - (124,136)
(13,564) - (13,464)
66,651 9,384 889,058
(1,890,684)$ 209,554$ (1,301,843)$
-$ -$ 2,689$
143
CITY OF LUBBOCK, TEXAS
Internal Service Funds The Internal Service Funds are used to account for the financing of goods and services provided by one department or agency to other departments or agencies of the City, or to other governments, on a user charge basis. Fleet Maintenance Fund – Accounts for vehicle service operations. Print Shop and Warehouse Fund – Accounts for central warehouse operations, printing services and central office supplies provided to City departments. Risk Management Fund – Accounts for activities related to general liability, auto liability, public officials liability, and workers’ compensation liability. Information Technology Fund – Accounts for the information processing services provided to City departments and other governmental agencies and for the telephone and radio shop operations. Health Benefits Fund – Accounts for the health, dental, and other employee benefits activities. Investment Pool Fund – Accounts for the operations of centralizing the activities relative to the City's investment portfolio.
145
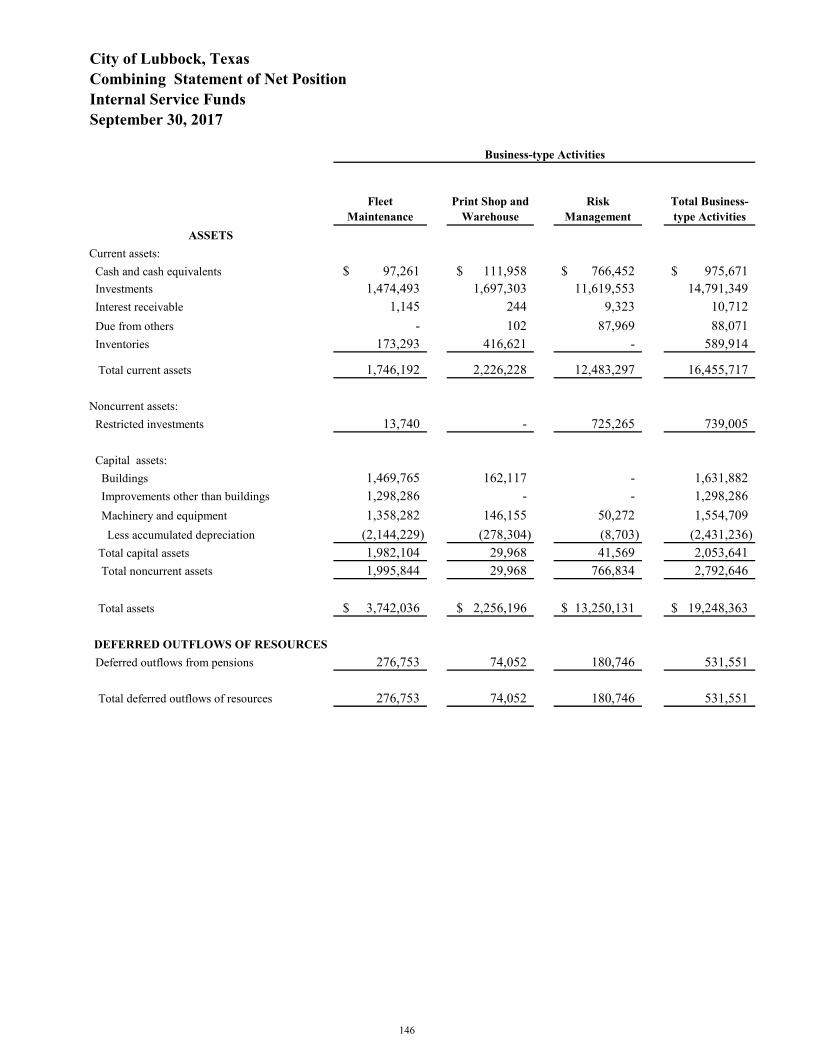
Fleet Maintenance
Print Shop and Warehouse
Risk Management
Total Business-type Activities
ASSETS
Current assets: Cash and cash equivalents 97,261$ 111,958$ 766,452$ 975,671$ Investments 1,474,493 1,697,303 11,619,553 14,791,349 Interest receivable 1,145 244 9,323 10,712 Due from others - 102 87,969 88,071 Inventories 173,293 416,621 - 589,914
Total current assets 1,746,192 2,226,228 12,483,297 16,455,717
Noncurrent assets: Restricted investments 13,740 - 725,265 739,005
Capital assets: Buildings 1,469,765 162,117 - 1,631,882 Improvements other than buildings 1,298,286 - - 1,298,286 Machinery and equipment 1,358,282 146,155 50,272 1,554,709 Less accumulated depreciation (2,144,229) (278,304) (8,703) (2,431,236) Total capital assets 1,982,104 29,968 41,569 2,053,641 Total noncurrent assets 1,995,844 29,968 766,834 2,792,646
Total assets 3,742,036$ 2,256,196$ 13,250,131$ 19,248,363$
DEFERRED OUTFLOWS OF RESOURCES
Deferred outflows from pensions 276,753 74,052 180,746 531,551
Total deferred outflows of resources 276,753 74,052 180,746 531,551
Business-type Activities
City of Lubbock, TexasCombining Statement of Net PositionInternal Service FundsSeptember 30, 2017
146
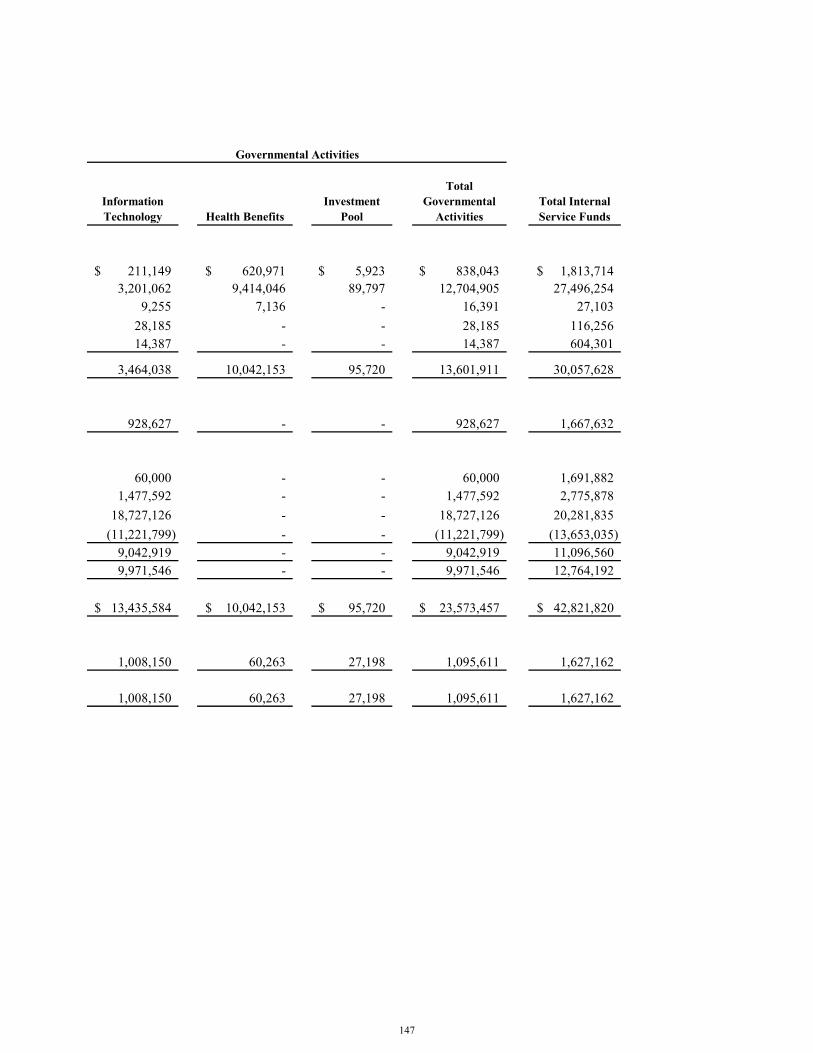
Information Technology Health Benefits
Investment Pool
Total Governmental
ActivitiesTotal Internal Service Funds
211,149$ 620,971$ 5,923$ 838,043$ 1,813,714$ 3,201,062 9,414,046 89,797 12,704,905 27,496,254
9,255 7,136 - 16,391 27,10328,185 - - 28,185 116,25614,387 - - 14,387 604,301
3,464,038 10,042,153 95,720 13,601,911 30,057,628
928,627 - - 928,627 1,667,632
60,000 - - 60,000 1,691,8821,477,592 - - 1,477,592 2,775,878
18,727,126 - - 18,727,126 20,281,835(11,221,799) - - (11,221,799) (13,653,035)
9,042,919 - - 9,042,919 11,096,5609,971,546 - - 9,971,546 12,764,192
13,435,584$ 10,042,153$ 95,720$ 23,573,457$ 42,821,820$
1,008,150 60,263 27,198 1,095,611 1,627,162
1,008,150 60,263 27,198 1,095,611 1,627,162
Governmental Activities
147
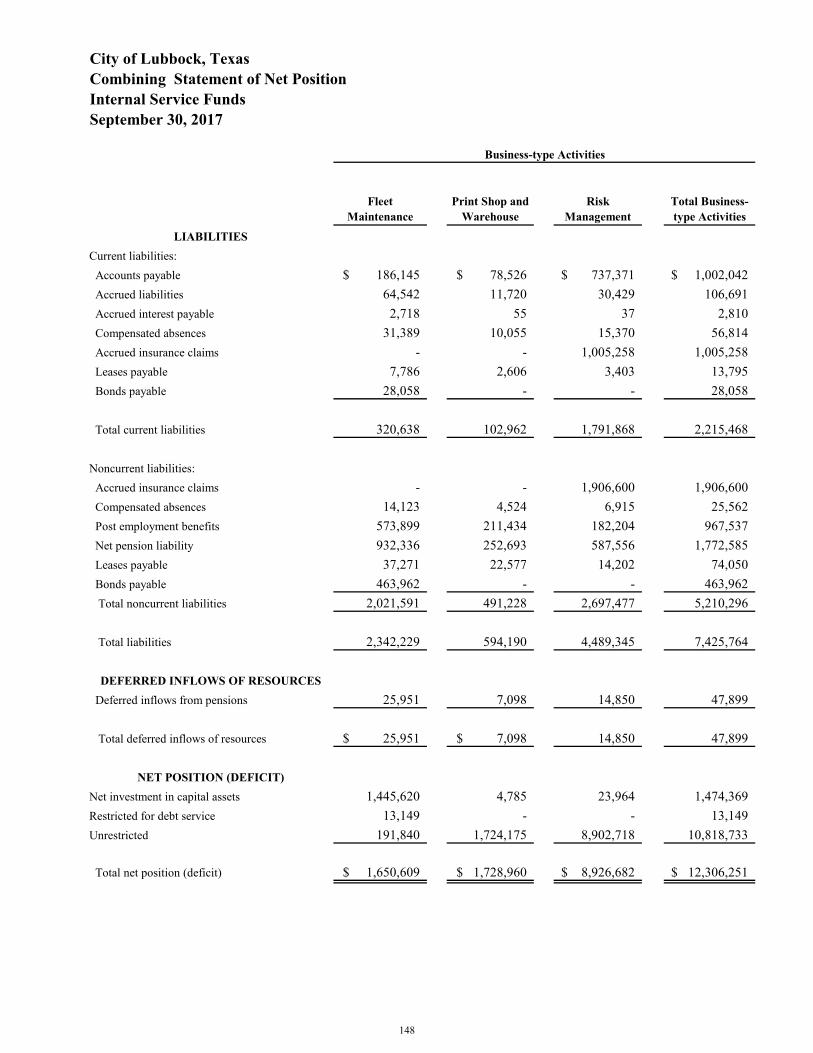
Fleet Maintenance
Print Shop and Warehouse
Risk Management
Total Business-type Activities
Business-type Activities
City of Lubbock, TexasCombining Statement of Net PositionInternal Service FundsSeptember 30, 2017
LIABILITIES
Current liabilities: Accounts payable 186,145$ 78,526$ 737,371$ 1,002,042$ Accrued liabilities 64,542 11,720 30,429 106,691 Accrued interest payable 2,718 55 37 2,810 Compensated absences 31,389 10,055 15,370 56,814 Accrued insurance claims - - 1,005,258 1,005,258 Leases payable 7,786 2,606 3,403 13,795 Bonds payable 28,058 - - 28,058
Total current liabilities 320,638 102,962 1,791,868 2,215,468
Noncurrent liabilities: Accrued insurance claims - - 1,906,600 1,906,600 Compensated absences 14,123 4,524 6,915 25,562 Post employment benefits 573,899 211,434 182,204 967,537 Net pension liability 932,336 252,693 587,556 1,772,585 Leases payable 37,271 22,577 14,202 74,050 Bonds payable 463,962 - - 463,962 Total noncurrent liabilities 2,021,591 491,228 2,697,477 5,210,296
Total liabilities 2,342,229 594,190 4,489,345 7,425,764
DEFERRED INFLOWS OF RESOURCES
Deferred inflows from pensions 25,951 7,098 14,850 47,899
Total deferred inflows of resources 25,951$ 7,098$ 14,850 47,899
NET POSITION (DEFICIT)
Net investment in capital assets 1,445,620 4,785 23,964 1,474,369Restricted for debt service 13,149 - - 13,149Unrestricted 191,840 1,724,175 8,902,718 10,818,733
Total net position (deficit) 1,650,609$ 1,728,960$ 8,926,682$ 12,306,251$
148
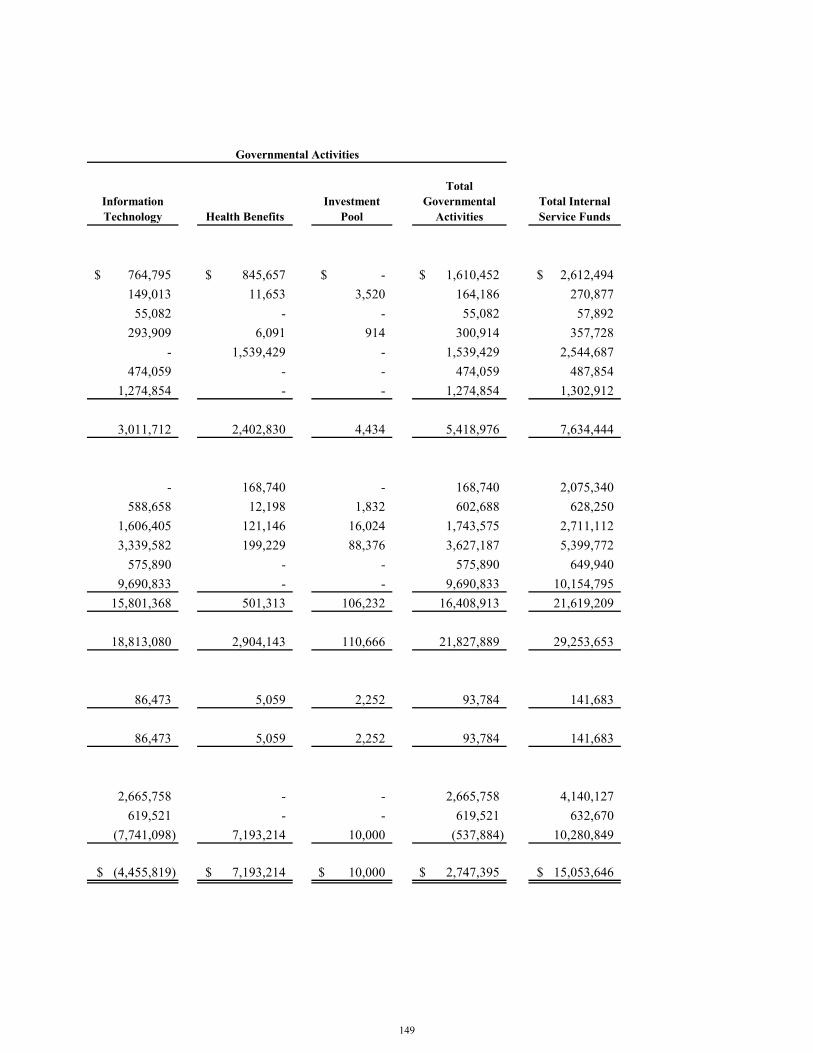
Information Technology Health Benefits
Investment Pool
Total Governmental
ActivitiesTotal Internal Service Funds
Governmental Activities
764,795$ 845,657$ -$ 1,610,452$ 2,612,494$ 149,013 11,653 3,520 164,186 270,877
55,082 - - 55,082 57,892293,909 6,091 914 300,914 357,728
- 1,539,429 - 1,539,429 2,544,687474,059 - - 474,059 487,854
1,274,854 - - 1,274,854 1,302,912
3,011,712 2,402,830 4,434 5,418,976 7,634,444
- 168,740 - 168,740 2,075,340588,658 12,198 1,832 602,688 628,250
1,606,405 121,146 16,024 1,743,575 2,711,1123,339,582 199,229 88,376 3,627,187 5,399,772
575,890 - - 575,890 649,9409,690,833 - - 9,690,833 10,154,795
15,801,368 501,313 106,232 16,408,913 21,619,209
18,813,080 2,904,143 110,666 21,827,889 29,253,653
86,473 5,059 2,252 93,784 141,683
86,473 5,059 2,252 93,784 141,683
2,665,758 - - 2,665,758 4,140,127619,521 - - 619,521 632,670
(7,741,098) 7,193,214 10,000 (537,884) 10,280,849
(4,455,819)$ 7,193,214$ 10,000$ 2,747,395$ 15,053,646$
149
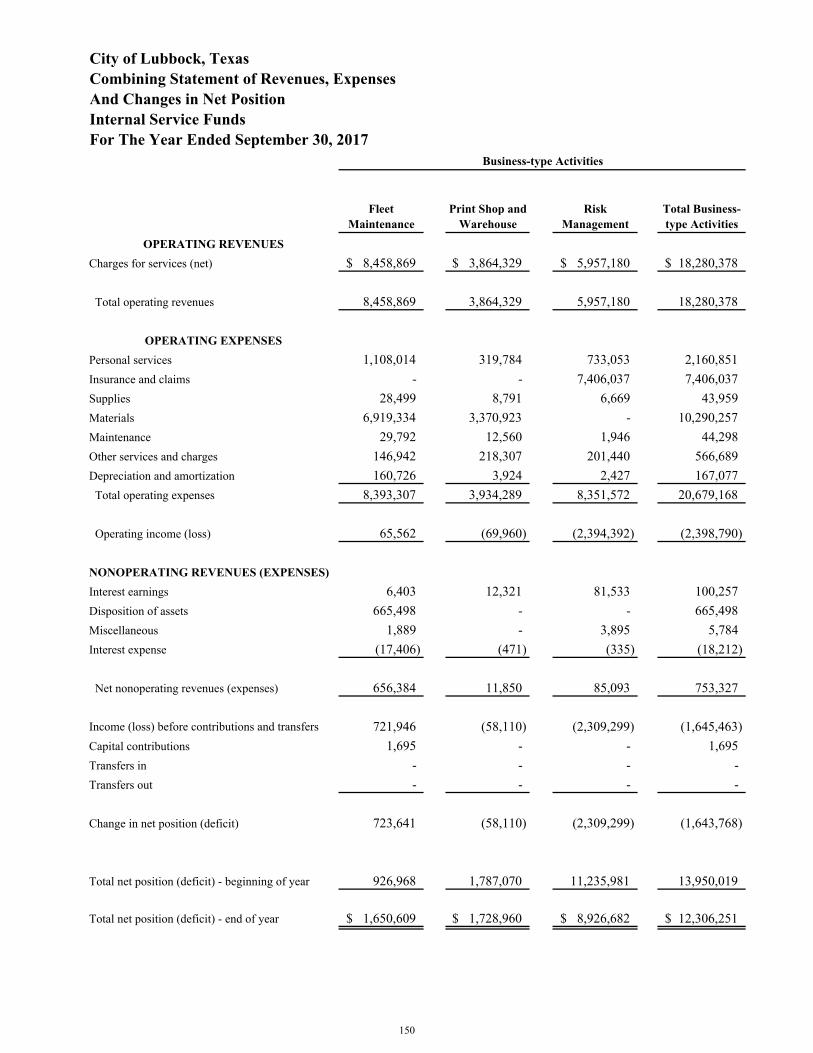
Fleet Maintenance
Print Shop and Warehouse
Risk Management
Total Business-type Activities
OPERATING REVENUES
Charges for services (net) 8,458,869$ 3,864,329$ 5,957,180$ 18,280,378$
Total operating revenues 8,458,869 3,864,329 5,957,180 18,280,378
OPERATING EXPENSES
Personal services 1,108,014 319,784 733,053 2,160,851Insurance and claims - - 7,406,037 7,406,037Supplies 28,499 8,791 6,669 43,959Materials 6,919,334 3,370,923 - 10,290,257Maintenance 29,792 12,560 1,946 44,298Other services and charges 146,942 218,307 201,440 566,689Depreciation and amortization 160,726 3,924 2,427 167,077 Total operating expenses 8,393,307 3,934,289 8,351,572 20,679,168
Operating income (loss) 65,562 (69,960) (2,394,392) (2,398,790)
NONOPERATING REVENUES (EXPENSES)
Interest earnings 6,403 12,321 81,533 100,257Disposition of assets 665,498 - - 665,498Miscellaneous 1,889 - 3,895 5,784Interest expense (17,406) (471) (335) (18,212)
Net nonoperating revenues (expenses) 656,384 11,850 85,093 753,327
Income (loss) before contributions and transfers 721,946 (58,110) (2,309,299) (1,645,463)Capital contributions 1,695 - - 1,695Transfers in - - - -Transfers out - - - -
Change in net position (deficit) 723,641 (58,110) (2,309,299) (1,643,768)
Total net position (deficit) - beginning of year 926,968 1,787,070 11,235,981 13,950,019
Total net position (deficit) - end of year 1,650,609$ 1,728,960$ 8,926,682$ 12,306,251$
For The Year Ended September 30, 2017Business-type Activities
City of Lubbock, TexasCombining Statement of Revenues, ExpensesAnd Changes in Net PositionInternal Service Funds
150
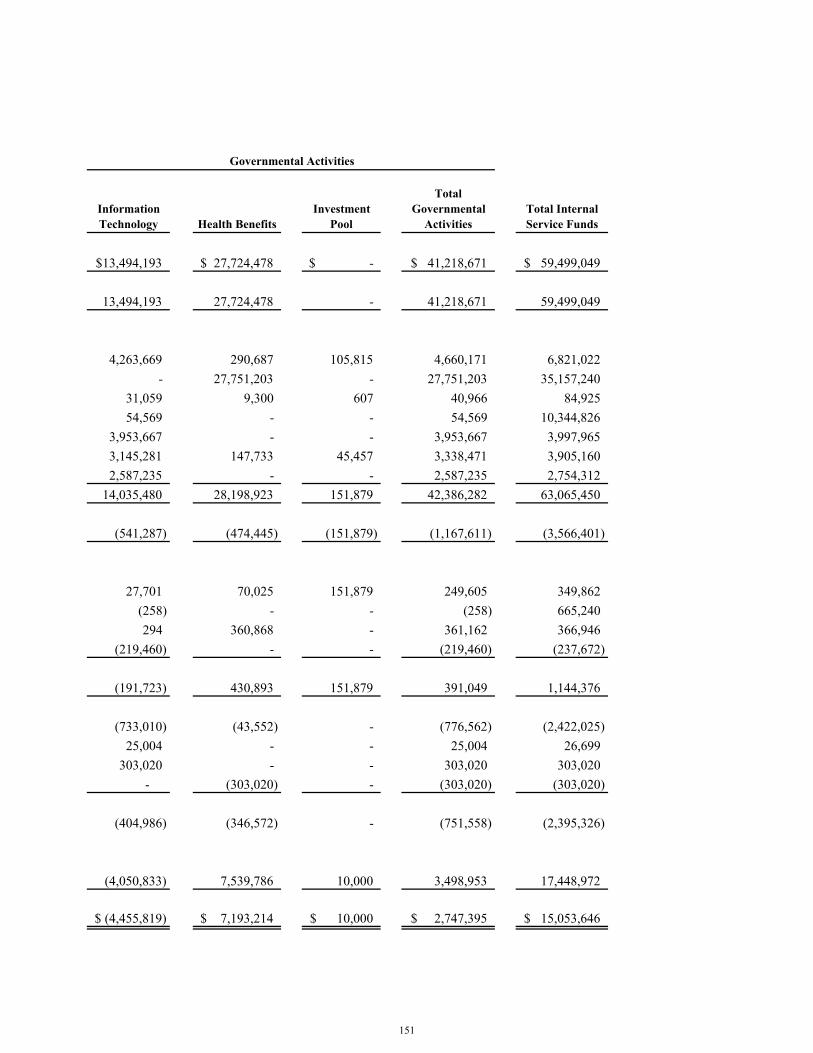
Information Technology Health Benefits
Investment Pool
Total Governmental
ActivitiesTotal Internal Service Funds
13,494,193$ 27,724,478$ -$ 41,218,671$ 59,499,049$
13,494,193 27,724,478 - 41,218,671 59,499,049
4,263,669 290,687 105,815 4,660,171 6,821,022 - 27,751,203 - 27,751,203 35,157,240
31,059 9,300 607 40,966 84,925 54,569 - - 54,569 10,344,826
3,953,667 - - 3,953,667 3,997,965 3,145,281 147,733 45,457 3,338,471 3,905,160 2,587,235 - - 2,587,235 2,754,312
14,035,480 28,198,923 151,879 42,386,282 63,065,450
(541,287) (474,445) (151,879) (1,167,611) (3,566,401)
27,701 70,025 151,879 249,605 349,862 (258) - - (258) 665,240 294 360,868 - 361,162 366,946
(219,460) - - (219,460) (237,672)
(191,723) 430,893 151,879 391,049 1,144,376
(733,010) (43,552) - (776,562) (2,422,025) 25,004 - - 25,004 26,699
303,020 - - 303,020 303,020 - (303,020) - (303,020) (303,020)
(404,986) (346,572) - (751,558) (2,395,326)
(4,050,833) 7,539,786 10,000 3,498,953 17,448,972
(4,455,819)$ 7,193,214$ 10,000$ 2,747,395$ 15,053,646$
Governmental Activities
151
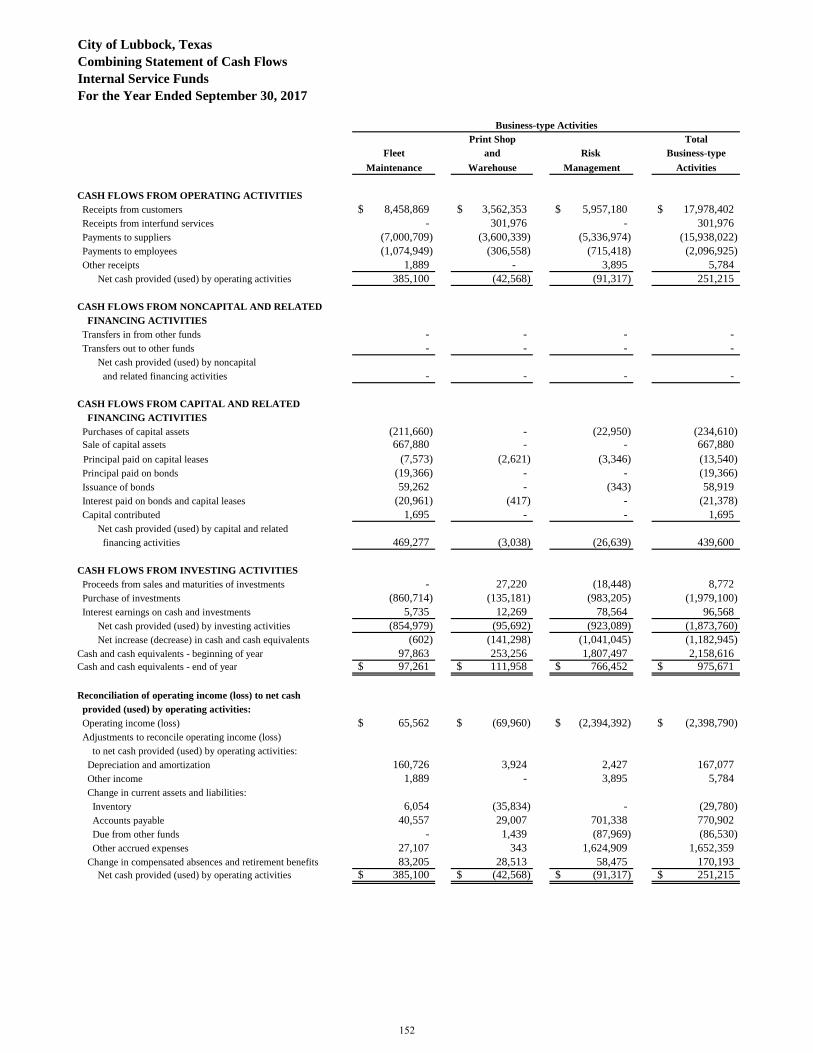
City of Lubbock, Texas
Combining Statement of Cash Flows
Internal Service Funds
For the Year Ended September 30, 2017
Print Shop Total
Fleet and Risk Business-type
Maintenance Warehouse Management Activities
CASH FLOWS FROM OPERATING ACTIVITIES
Receipts from customers 8,458,869$ 3,562,353$ 5,957,180$ 17,978,402$
Receipts from interfund services - 301,976 - 301,976
Payments to suppliers (7,000,709) (3,600,339) (5,336,974) (15,938,022)
Payments to employees (1,074,949) (306,558) (715,418) (2,096,925)
Other receipts 1,889 - 3,895 5,784
Net cash provided (used) by operating activities 385,100 (42,568) (91,317) 251,215
CASH FLOWS FROM NONCAPITAL AND RELATED
FINANCING ACTIVITIES
Transfers in from other funds - - - -
Transfers out to other funds - - - -
Net cash provided (used) by noncapital
and related financing activities - - - -
CASH FLOWS FROM CAPITAL AND RELATED
FINANCING ACTIVITIES
Purchases of capital assets (211,660) - (22,950) (234,610)
Sale of capital assets 667,880 - - 667,880
Principal paid on capital leases (7,573) (2,621) (3,346) (13,540)
Principal paid on bonds (19,366) - - (19,366)
Issuance of bonds 59,262 - (343) 58,919
Interest paid on bonds and capital leases (20,961) (417) - (21,378)
Capital contributed 1,695 - - 1,695
Net cash provided (used) by capital and related
financing activities 469,277 (3,038) (26,639) 439,600
CASH FLOWS FROM INVESTING ACTIVITIES
Proceeds from sales and maturities of investments - 27,220 (18,448) 8,772
Purchase of investments (860,714) (135,181) (983,205) (1,979,100)
Interest earnings on cash and investments 5,735 12,269 78,564 96,568
Net cash provided (used) by investing activities (854,979) (95,692) (923,089) (1,873,760)
Net increase (decrease) in cash and cash equivalents (602) (141,298) (1,041,045) (1,182,945)
Cash and cash equivalents - beginning of year 97,863 253,256 1,807,497 2,158,616
Cash and cash equivalents - end of year 97,261$ 111,958$ 766,452$ 975,671$
Reconciliation of operating income (loss) to net cash
provided (used) by operating activities:
Operating income (loss) 65,562$ (69,960)$ (2,394,392)$ (2,398,790)$
Adjustments to reconcile operating income (loss)
to net cash provided (used) by operating activities:
Depreciation and amortization 160,726 3,924 2,427 167,077
Other income 1,889 - 3,895 5,784
Change in current assets and liabilities:
Inventory 6,054 (35,834) - (29,780)
Accounts payable 40,557 29,007 701,338 770,902
Due from other funds - 1,439 (87,969) (86,530)
Other accrued expenses 27,107 343 1,624,909 1,652,359
Change in compensated absences and retirement benefits 83,205 28,513 58,475 170,193
Net cash provided (used) by operating activities 385,100$ (42,568)$ (91,317)$ 251,215$
Business-type Activities
152
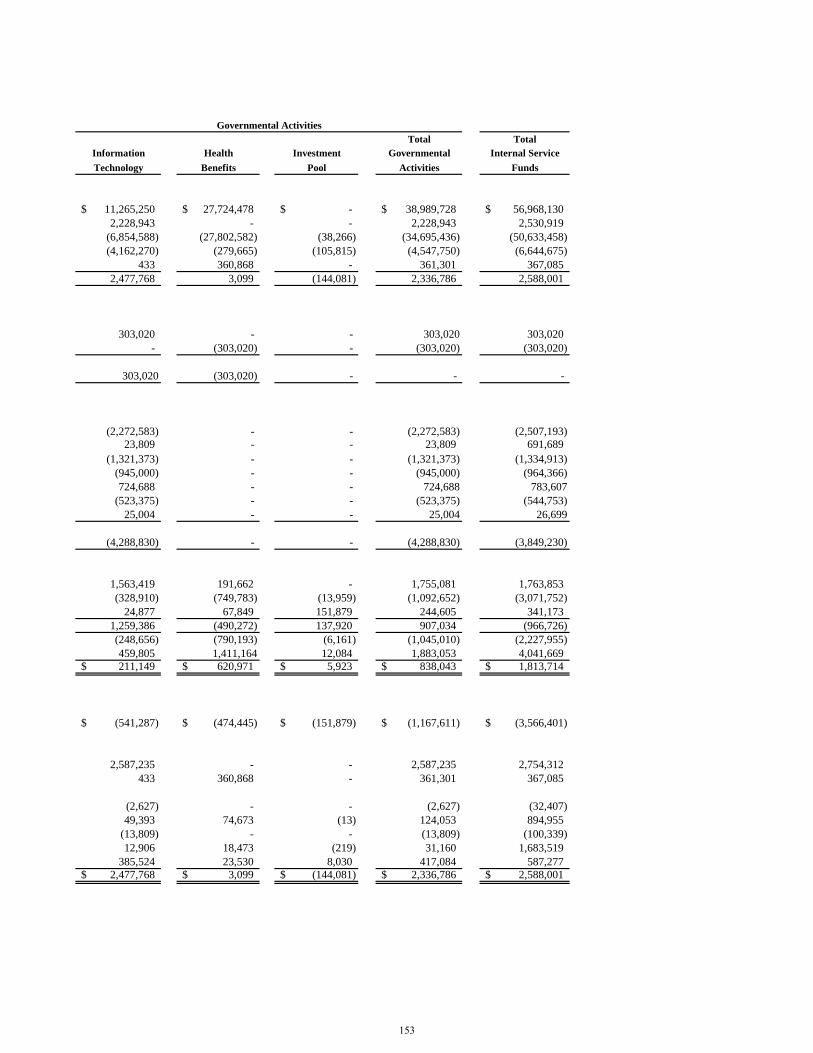
Total Total
Information Health Investment Governmental Internal Service
Technology Benefits Pool Activities Funds
11,265,250$ 27,724,478$ -$ 38,989,728$ 56,968,130$
2,228,943 - - 2,228,943 2,530,919
(6,854,588) (27,802,582) (38,266) (34,695,436) (50,633,458)
(4,162,270) (279,665) (105,815) (4,547,750) (6,644,675)
433 360,868 - 361,301 367,085
2,477,768 3,099 (144,081) 2,336,786 2,588,001
303,020 - - 303,020 303,020
- (303,020) - (303,020) (303,020)
303,020 (303,020) - - -
(2,272,583) - - (2,272,583) (2,507,193)
23,809 - - 23,809 691,689
(1,321,373) - - (1,321,373) (1,334,913)
(945,000) - - (945,000) (964,366)
724,688 - - 724,688 783,607
(523,375) - - (523,375) (544,753)
25,004 - - 25,004 26,699
(4,288,830) - - (4,288,830) (3,849,230)
1,563,419 191,662 - 1,755,081 1,763,853
(328,910) (749,783) (13,959) (1,092,652) (3,071,752)
24,877 67,849 151,879 244,605 341,173
1,259,386 (490,272) 137,920 907,034 (966,726)
(248,656) (790,193) (6,161) (1,045,010) (2,227,955)
459,805 1,411,164 12,084 1,883,053 4,041,669
211,149$ 620,971$ 5,923$ 838,043$ 1,813,714$
(541,287)$ (474,445)$ (151,879)$ (1,167,611)$ (3,566,401)$
2,587,235 - - 2,587,235 2,754,312
433 360,868 - 361,301 367,085
(2,627) - - (2,627) (32,407)
49,393 74,673 (13) 124,053 894,955
(13,809) - - (13,809) (100,339)
12,906 18,473 (219) 31,160 1,683,519
385,524 23,530 8,030 417,084 587,277
2,477,768$ 3,099$ (144,081)$ 2,336,786$ 2,588,001$
Governmental Activities
153
CITY OF LUBBOCK, TEXAS
Nonmajor Component Units The following Component Units, which are legally separate entities, are included in the reporting entity because the City is financially accountable and is able to impose its will. Urban Renewal Agency (URA) – Accounts for housing rehabilitation, housing acquisition, and land disposition. The URA is governed by a board appointed by the City Council. Civic Lubbock, Inc. was organized to foster and promote the presentation of wholesome educational and cultural programs, attractions and entertainment for the general moral, intellectual, physical improvement, and welfare of the people of the City of Lubbock and surrounding area. Market Lubbock Economic Development Corporation, dba Market Lubbock, Inc. was formed to create, manage, operate, and supervise programs and activities that assist and enhance economic development within and around the City. Lubbock Economic Development Alliance was formed to create, manage and supervise programs and activities to promote, assist, and enhance economic development within and around the City. Vintage Township Public Facilities Corporation was formed to assist the City in financing, refinancing, providing or otherwise assisting in the acquisition, construction and maintenance of certain public facilities benefiting the Vintage Township.
155
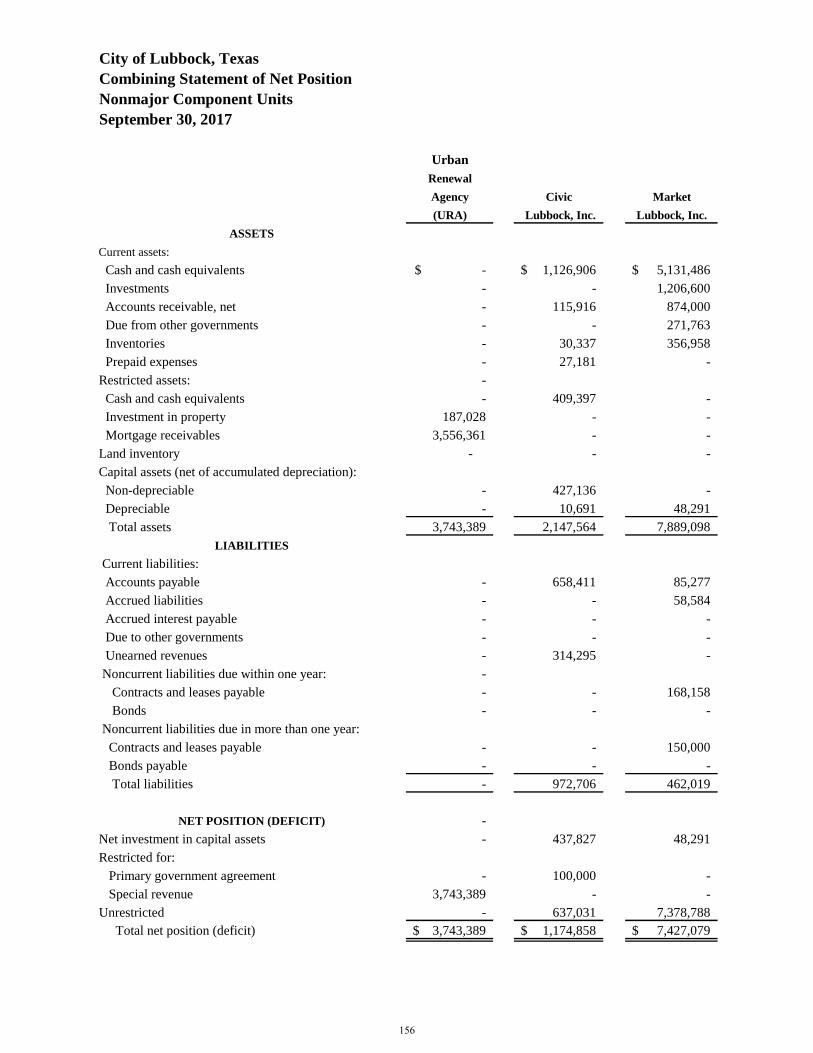
City of Lubbock, Texas
Combining Statement of Net Position
Nonmajor Component Units
September 30, 2017
Urban
Renewal
Agency Civic Market
(URA) Lubbock, Inc. Lubbock, Inc.
ASSETS
Current assets:
Cash and cash equivalents -$ 1,126,906$ 5,131,486$
Investments - - 1,206,600
Accounts receivable, net - 115,916 874,000
Due from other governments - - 271,763
Inventories - 30,337 356,958
Prepaid expenses - 27,181 -
Restricted assets: -
Cash and cash equivalents - 409,397 -
Investment in property 187,028 - -
Mortgage receivables 3,556,361 - -
Land inventory - - -
Capital assets (net of accumulated depreciation):
Non-depreciable - 427,136 -
Depreciable - 10,691 48,291
Total assets 3,743,389 2,147,564 7,889,098
LIABILITIES
Current liabilities:
Accounts payable - 658,411 85,277
Accrued liabilities - - 58,584
Accrued interest payable - - -
Due to other governments - - -
Unearned revenues - 314,295 -
Noncurrent liabilities due within one year: -
Contracts and leases payable - - 168,158
Bonds - - -
Noncurrent liabilities due in more than one year:
Contracts and leases payable - - 150,000
Bonds payable - - -
Total liabilities - 972,706 462,019
NET POSITION (DEFICIT) -
Net investment in capital assets - 437,827 48,291
Restricted for:
Primary government agreement - 100,000 -
Special revenue 3,743,389 - -
Unrestricted - 637,031 7,378,788
Total net position (deficit) 3,743,389$ 1,174,858$ 7,427,079$
156
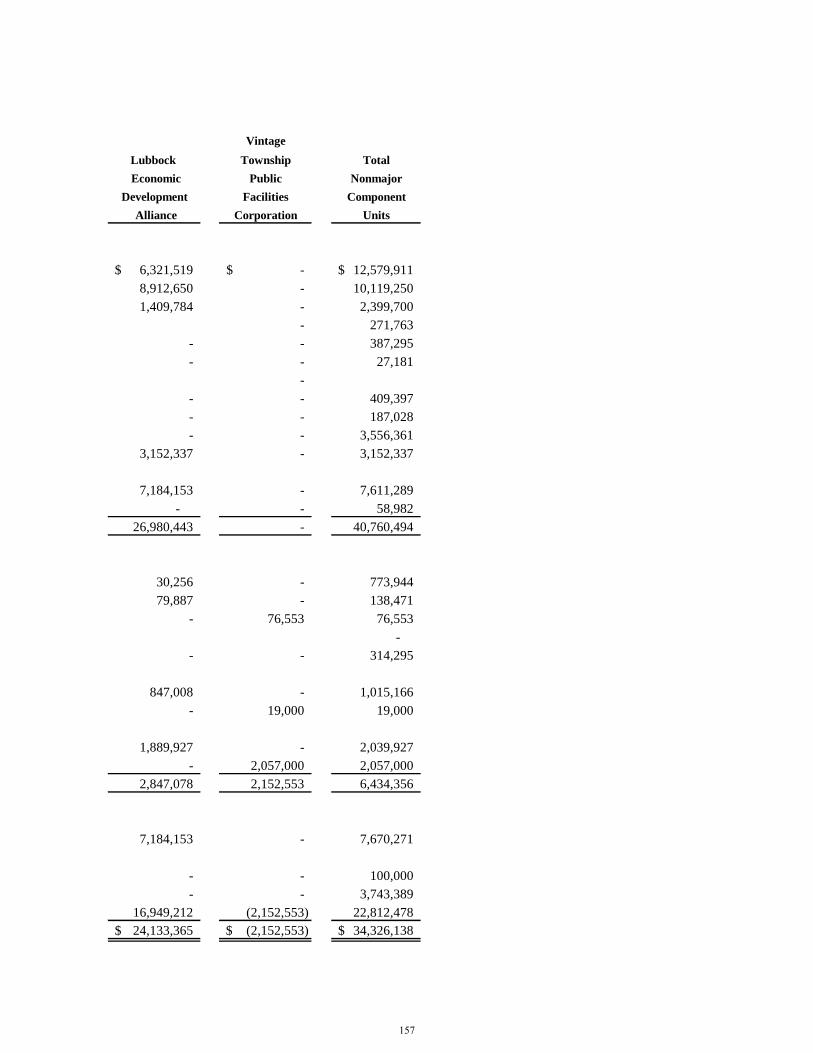
Vintage
Lubbock Township Total
Economic Public Nonmajor
Development Facilities Component
Alliance Corporation Units
6,321,519$ -$ 12,579,911$
8,912,650 - 10,119,250
1,409,784 - 2,399,700
- 271,763
- - 387,295
- - 27,181
-
- - 409,397
- - 187,028
- - 3,556,361
3,152,337 - 3,152,337
7,184,153 - 7,611,289
- - 58,982
26,980,443 - 40,760,494
30,256 - 773,944
79,887 - 138,471
- 76,553 76,553
-
- - 314,295
847,008 - 1,015,166
- 19,000 19,000
1,889,927 - 2,039,927
- 2,057,000 2,057,000
2,847,078 2,152,553 6,434,356
7,184,153 - 7,670,271
- - 100,000
- - 3,743,389
16,949,212 (2,152,553) 22,812,478
24,133,365$ (2,152,553)$ 34,326,138$
157
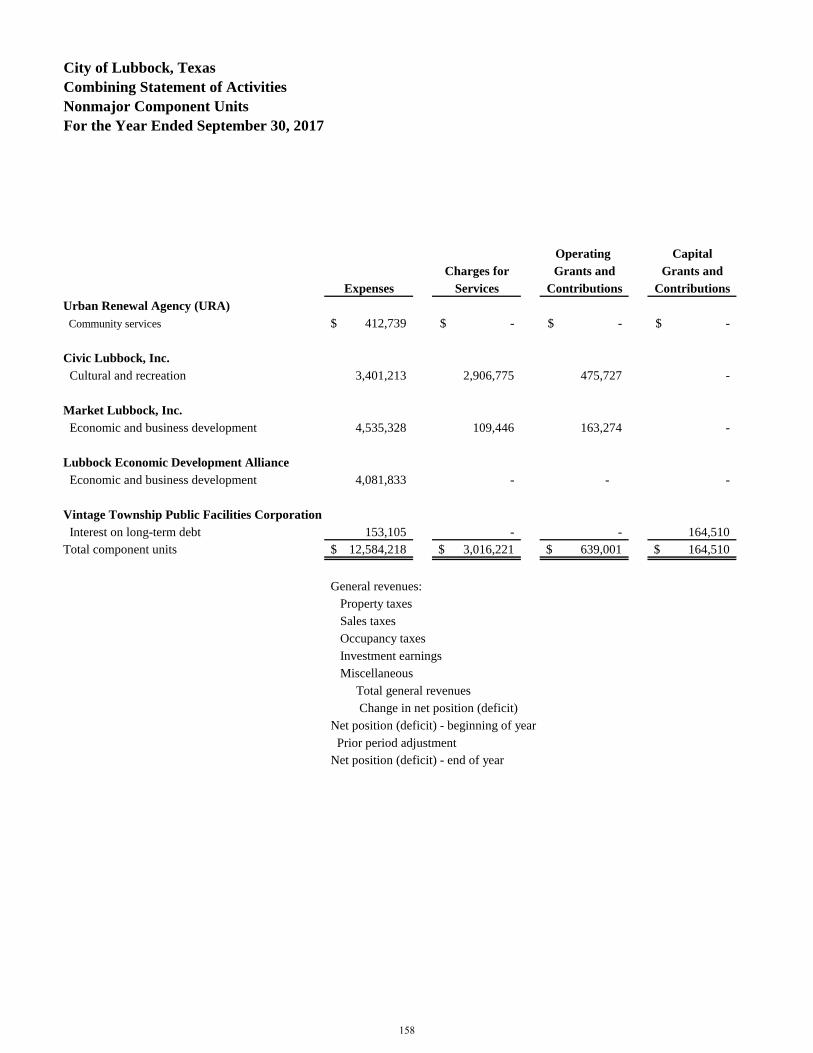
City of Lubbock, Texas
Combining Statement of Activities
Nonmajor Component Units
For the Year Ended September 30, 2017
Net (Expense) Revenue and
Changes in Net Position
Operating Capital
Charges for Grants and Grants and
Expenses Services Contributions Contributions
Urban Renewal Agency (URA)
Community services 412,739$ -$ -$ -$
Civic Lubbock, Inc.
Cultural and recreation 3,401,213 2,906,775 475,727 -
Market Lubbock, Inc.
Economic and business development 4,535,328 109,446 163,274 -
Lubbock Economic Development Alliance
Economic and business development 4,081,833 - - -
Vintage Township Public Facilities Corporation
Interest on long-term debt 153,105 - - 164,510
Total component units 12,584,218$ 3,016,221$ 639,001$ 164,510$
General revenues:
Property taxes
Sales taxes
Occupancy taxes
Investment earnings
Miscellaneous
Total general revenues
Change in net position (deficit)
Net position (deficit) - beginning of year
Prior period adjustment
Net position (deficit) - end of year
158
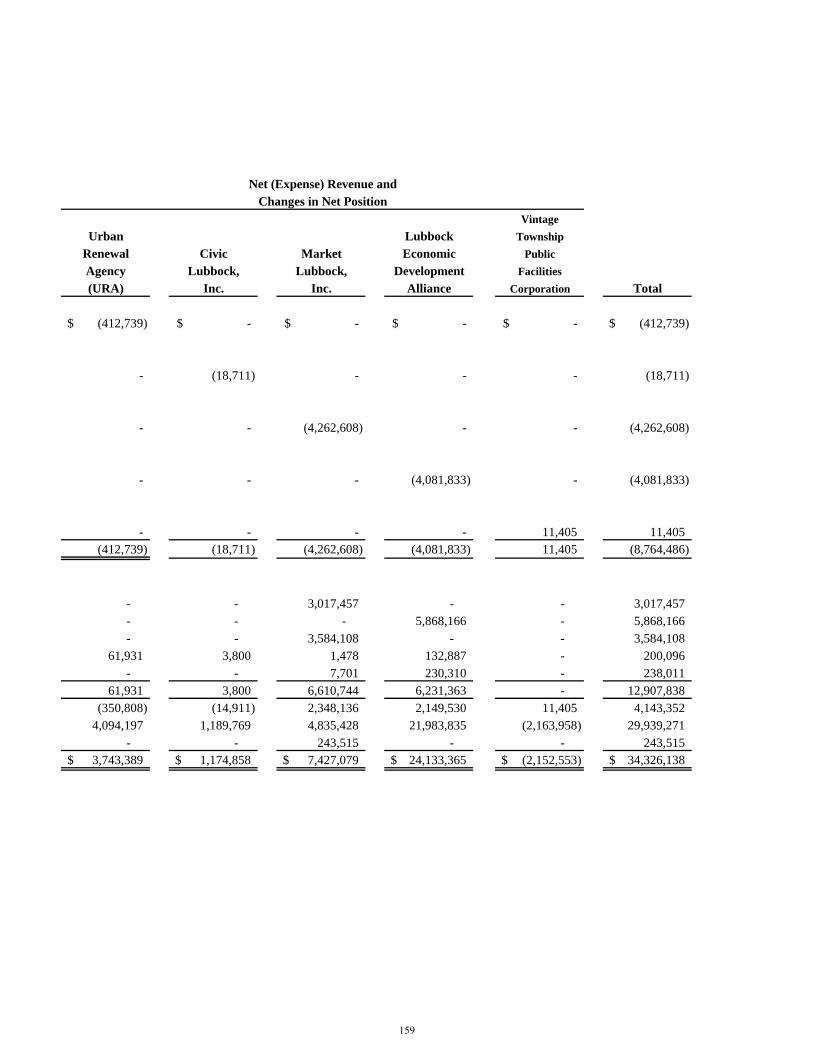
Net (Expense) Revenue and
Changes in Net Position
Vintage
Urban Lubbock Township
Renewal Civic Market Economic Public
Agency Lubbock, Lubbock, Development Facilities
(URA) Inc. Inc. Alliance Corporation Total
(412,739)$ -$ -$ -$ -$ (412,739)$
- (18,711) - - - (18,711)
- - (4,262,608) - - (4,262,608)
- - - (4,081,833) - (4,081,833)
- - - - 11,405 11,405
(412,739) (18,711) (4,262,608) (4,081,833) 11,405 (8,764,486)
- - 3,017,457 - - 3,017,457
- - - 5,868,166 - 5,868,166
- - 3,584,108 - - 3,584,108
61,931 3,800 1,478 132,887 - 200,096
- - 7,701 230,310 - 238,011
61,931 3,800 6,610,744 6,231,363 - 12,907,838
(350,808) (14,911) 2,348,136 2,149,530 11,405 4,143,352
4,094,197 1,189,769 4,835,428 21,983,835 (2,163,958) 29,939,271
- - 243,515 - - 243,515
3,743,389$ 1,174,858$ 7,427,079$ 24,133,365$ (2,152,553)$ 34,326,138$
159
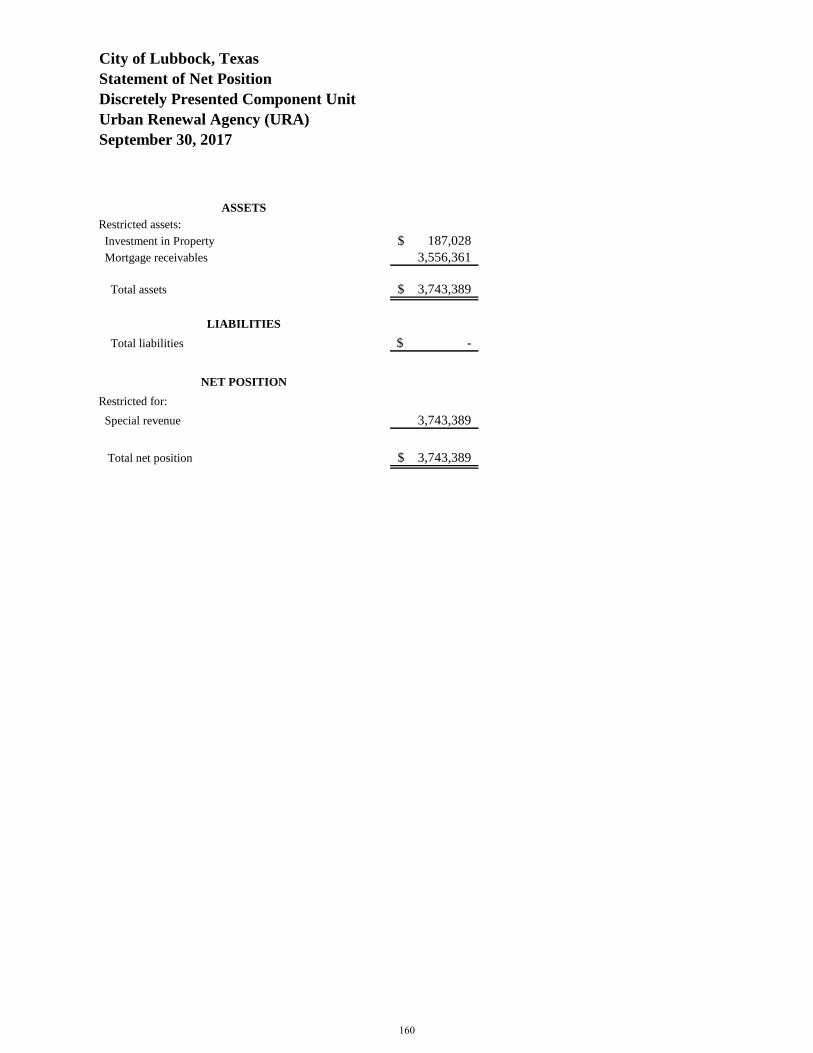
Urban Renewal Agency (URA)
ASSETS
Restricted assets:
Investment in Property 187,028$
Mortgage receivables 3,556,361
Total assets 3,743,389$
LIABILITIES
Total liabilities -$
NET POSITION
Restricted for:
Special revenue 3,743,389
Total net position 3,743,389$
City of Lubbock, Texas
Statement of Net Position
Discretely Presented Component Unit
September 30, 2017
160
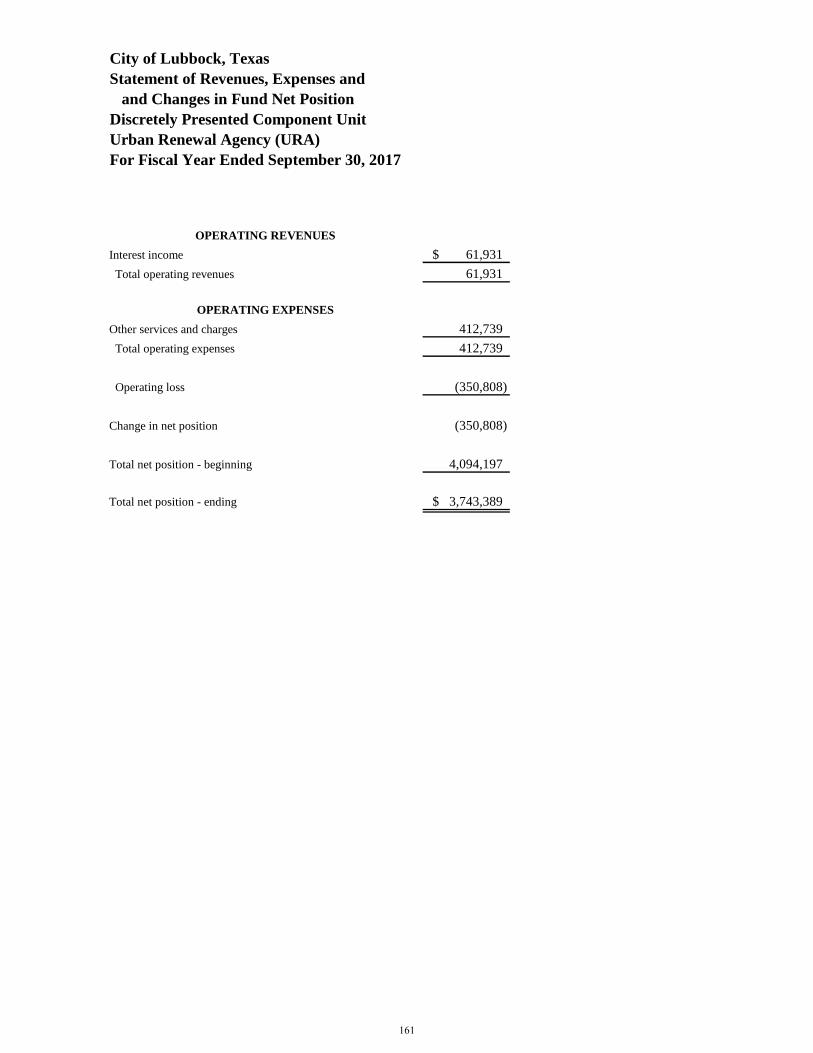
and Changes in Fund Net Position
Urban Renewal Agency (URA)
OPERATING REVENUES
Interest income 61,931$
Total operating revenues 61,931
OPERATING EXPENSES
Other services and charges 412,739
Total operating expenses 412,739
Operating loss (350,808)
Change in net position (350,808)
Total net position - beginning 4,094,197
Total net position - ending 3,743,389$
City of Lubbock, Texas
Statement of Revenues, Expenses and
Discretely Presented Component Unit
For Fiscal Year Ended September 30, 2017
161
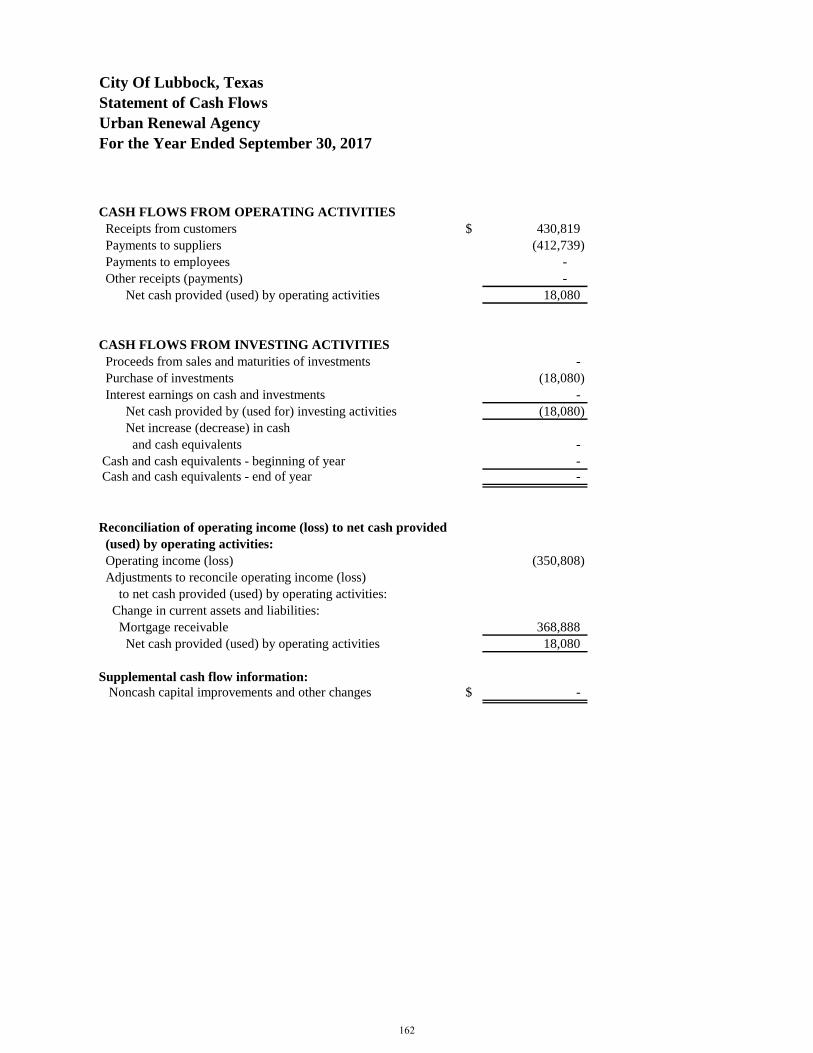
City Of Lubbock, Texas
Statement of Cash Flows
Urban Renewal Agency
For the Year Ended September 30, 2017
CASH FLOWS FROM OPERATING ACTIVITIES
Receipts from customers $ 430,819
Payments to suppliers (412,739)
Payments to employees -
Other receipts (payments) -
Net cash provided (used) by operating activities 18,080
CASH FLOWS FROM INVESTING ACTIVITIES
Proceeds from sales and maturities of investments -
Purchase of investments (18,080)
Interest earnings on cash and investments -
Net cash provided by (used for) investing activities (18,080)
Net increase (decrease) in cash
and cash equivalents -
Cash and cash equivalents - beginning of year -
Cash and cash equivalents - end of year -
Reconciliation of operating income (loss) to net cash provided
(used) by operating activities:
Operating income (loss) (350,808)
Adjustments to reconcile operating income (loss)
to net cash provided (used) by operating activities:
Change in current assets and liabilities:
Mortgage receivable 368,888
Net cash provided (used) by operating activities 18,080
Supplemental cash flow information:
Noncash capital improvements and other changes $ -
162
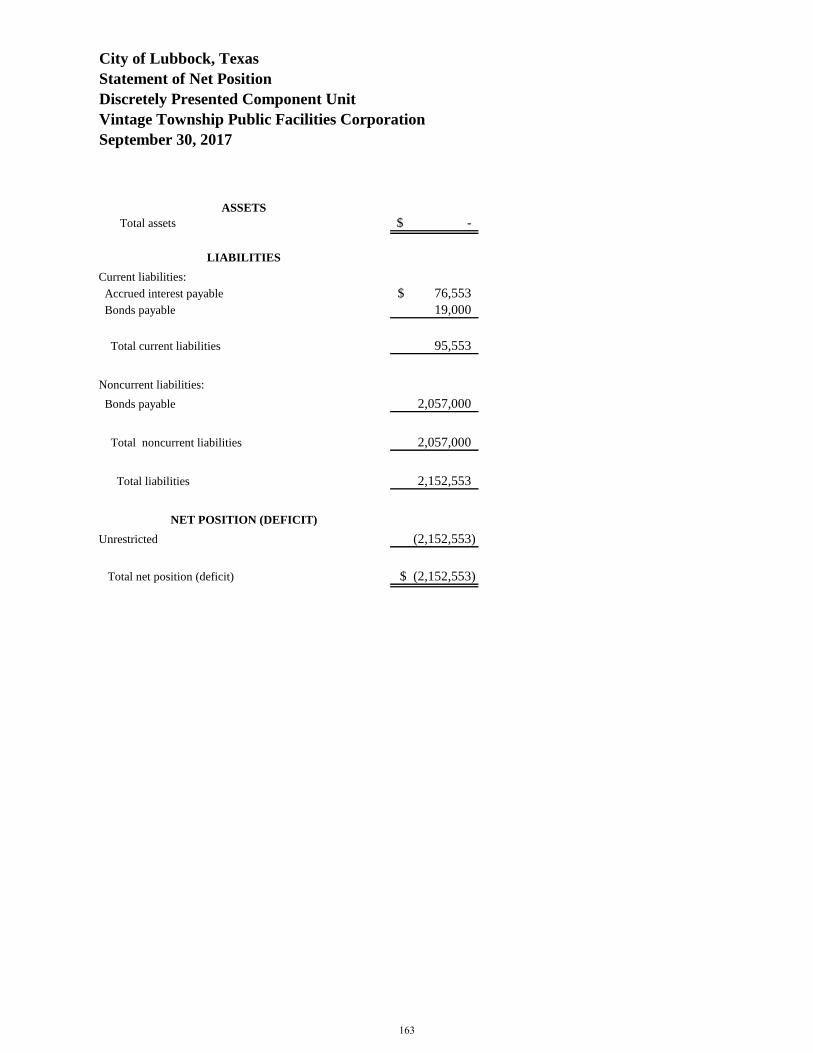
Vintage Township Public Facilities Corporation
ASSETS
Total assets -$
LIABILITIES
Current liabilities:
Accrued interest payable 76,553$
Bonds payable 19,000
Total current liabilities 95,553
Noncurrent liabilities:
Bonds payable 2,057,000
Total noncurrent liabilities 2,057,000
Total liabilities 2,152,553
NET POSITION (DEFICIT)
Unrestricted (2,152,553)
Total net position (deficit) (2,152,553)$
City of Lubbock, Texas
Statement of Net Position
Discretely Presented Component Unit
September 30, 2017
163
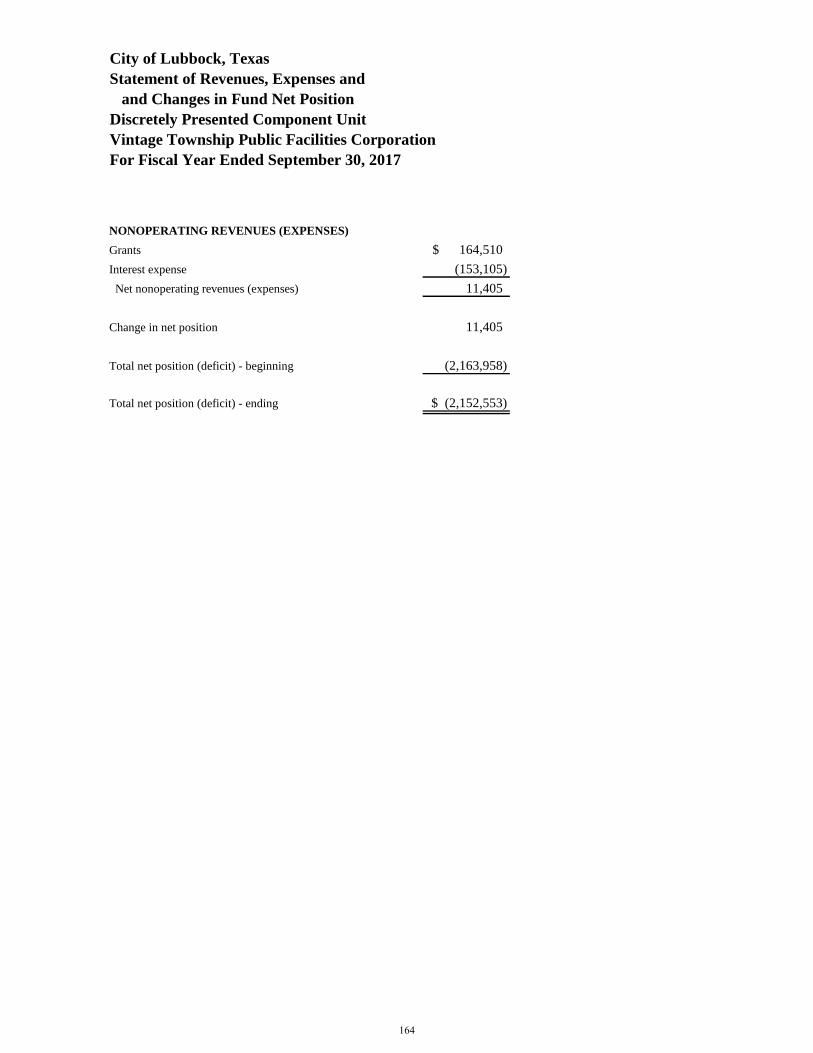
and Changes in Fund Net Position
Vintage Township Public Facilities Corporation
NONOPERATING REVENUES (EXPENSES)
Grants 164,510$
Interest expense (153,105)
Net nonoperating revenues (expenses) 11,405
Change in net position 11,405
Total net position (deficit) - beginning (2,163,958)
Total net position (deficit) - ending (2,152,553)$
City of Lubbock, Texas
Statement of Revenues, Expenses and
Discretely Presented Component Unit
For Fiscal Year Ended September 30, 2017
164
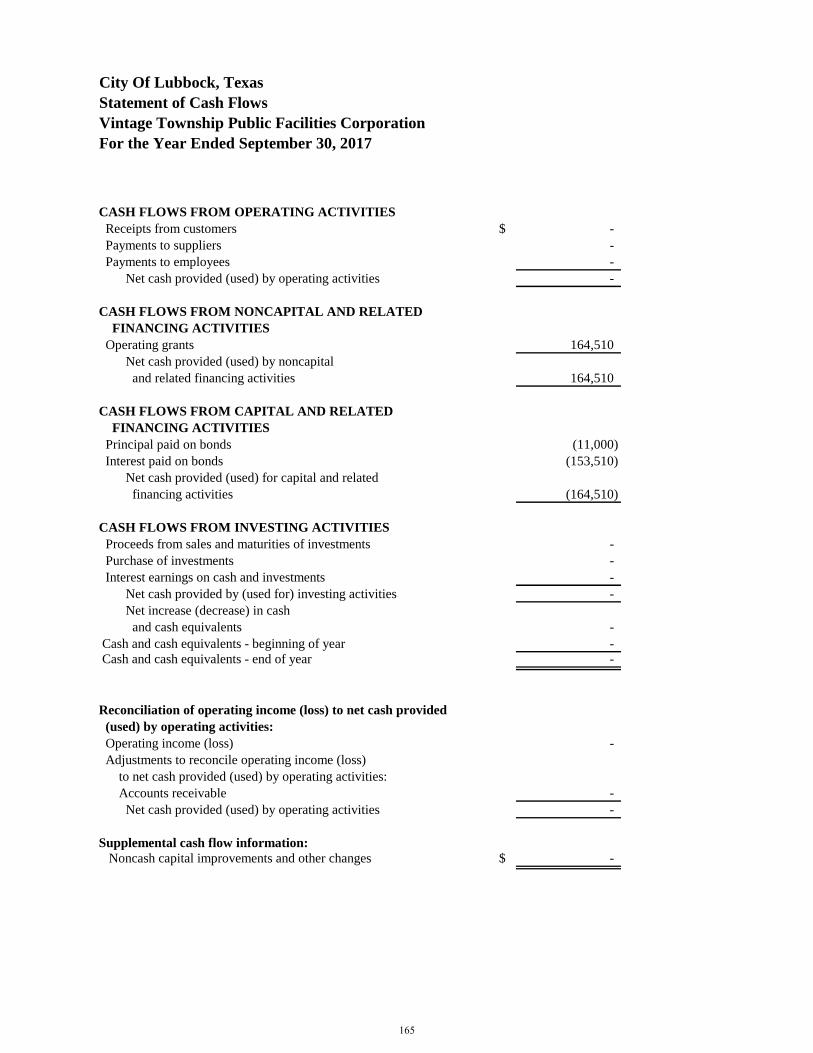
City Of Lubbock, Texas
Statement of Cash Flows
Vintage Township Public Facilities Corporation
For the Year Ended September 30, 2017
CASH FLOWS FROM OPERATING ACTIVITIES
Receipts from customers $ -
Payments to suppliers -
Payments to employees -
Net cash provided (used) by operating activities -
CASH FLOWS FROM NONCAPITAL AND RELATED
FINANCING ACTIVITIES
Operating grants 164,510
Net cash provided (used) by noncapital
and related financing activities 164,510
CASH FLOWS FROM CAPITAL AND RELATED
FINANCING ACTIVITIES
Principal paid on bonds (11,000)
Interest paid on bonds (153,510)
Net cash provided (used) for capital and related
financing activities (164,510)
CASH FLOWS FROM INVESTING ACTIVITIES
Proceeds from sales and maturities of investments -
Purchase of investments -
Interest earnings on cash and investments -
Net cash provided by (used for) investing activities -
Net increase (decrease) in cash
and cash equivalents -
Cash and cash equivalents - beginning of year -
Cash and cash equivalents - end of year -
Reconciliation of operating income (loss) to net cash provided
(used) by operating activities:
Operating income (loss) -
Adjustments to reconcile operating income (loss)
to net cash provided (used) by operating activities:
Accounts receivable -
Net cash provided (used) by operating activities -
Supplemental cash flow information:
Noncash capital improvements and other changes $ -
165

Statistical Section
City of Lubbock, Texas
Statistical Section
(Unaudited – for Analytical Purposes Only)
September 30, 2017
The following portion of the City of Lubbock Comprehensive Annual Financial Report presents detailed information
as a context for understanding the information in the financial statements, note disclosures, and required
supplementary information regarding the City’s overall financial health.
TABLE CONTENTS
Financial Trends - These tables contain trend information to help the reader understand how the City’s financial
performance and well-being have changed over time.
Entity-wide information:
A Net position by component, last ten fiscal years
B Changes in net position, last ten fiscal years
Governmental funds information:
C Fund balance, last ten fiscal years
D Changes in fund balances, last ten fiscal years
Revenue Capacity - These tables contain information to help the reader assess one of the City’s most significant
revenue sources, the property tax.
E Tax revenues by source, last ten fiscal years
F Assessed and estimated actual value of taxable property, last ten fiscal years
G Principal taxpayers, current year and nine years ago
H Property tax levies and collections, last ten fiscal years
I Property tax rates - direct and overlapping governments, last ten fiscal years
Debt Capacity - These tables present information to help the reader assess the affordability of the City’s current
levels of outstanding debt and the City’s ability to issue additional debt in the future.
J Ratio of outstanding debt by type, last ten fiscal years
K Ratio of net general bonded debt to assessed value and net bonded debt per capita, last ten fiscal years
L Computation of legal debt margin, last ten fiscal years
M Revenue bond coverage – LP&L and Water Bonds, last ten fiscal years
N Ratio of annual debt service expenditures for general obligation bonded debt to total general
governmental expenditures
O Computation of direct and overlapping bonded debt - general obligation bonds in governmental activities
Demographic and Economic Information - These tables offer demographic and economic indicators to help
understand the environment within which the City’s financial activities take place and to help make comparisons over
time and with other governments.
P Demographic statistics, last ten years
Q Principal employers, current year and nine years ago
Operating Information - These tables contain information about the City’s operations and resources to help the
reader understand how the City’s financial information relates to the services the City provides and activities it
performs.
R Full-time equivalents city government employees by function, last ten fiscal years
S Operating indicators by function/program, last ten fiscal years
T Capital assets statistics by function/program, last ten fiscal years
Sources: Unless otherwise noted, the information in these tables is derived from the Comprehensive Annual Financial
Reports for the relevant years.
167
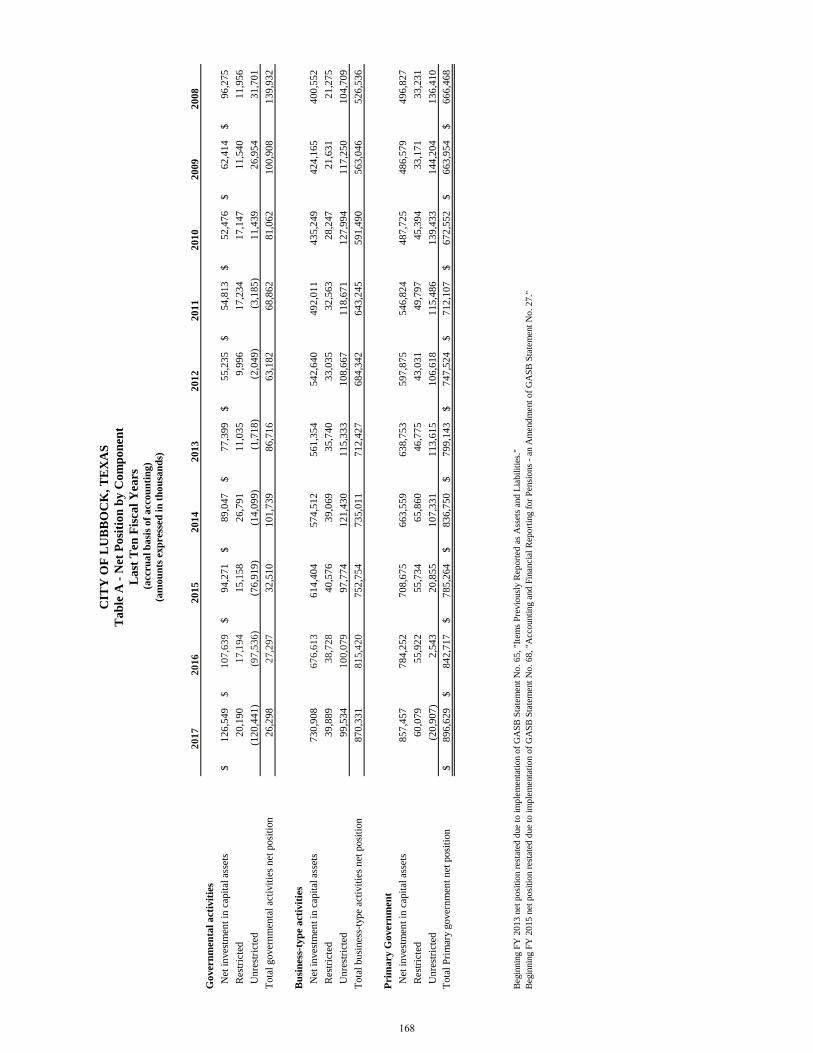
20
17
20
16
20
15
20
14
20
13
20
12
20
11
20
10
20
09
20
08
Go
ver
nm
enta
l a
ctiv
itie
s
N
et i
nves
tmen
t in
cap
ital
ass
ets
12
6,5
49
$
10
7,6
39
$
94
,27
1$
89
,04
7$
77
,39
9$
55
,23
5$
54
,81
3$
52
,47
6$
62
,41
4$
96
,27
5$
R
estr
icte
d2
0,1
90
17
,19
4
15
,15
8
26
,79
1
11
,03
5
9,9
96
17
,23
4
17
,14
7
11
,54
0
11
,95
6
U
nre
stri
cted
(12
0,4
41
)
(97
,53
6)
(76
,91
9)
(14
,09
9)
(1,7
18
)
(2,0
49
)
(3,1
85
)
11
,43
9
26
,95
4
31
,70
1
Tota
l gover
nm
enta
l ac
tivit
ies
net
posi
tion
26
,29
82
7,2
97
32
,51
01
01
,73
98
6,7
16
63
,18
26
8,8
62
81
,06
21
00
,90
81
39
,93
2
Bu
sin
ess-
typ
e a
ctiv
itie
s
N
et i
nves
tmen
t in
cap
ital
ass
ets
73
0,9
08
67
6,6
13
61
4,4
04
57
4,5
12
56
1,3
54
54
2,6
40
49
2,0
11
43
5,2
49
42
4,1
65
40
0,5
52
R
estr
icte
d3
9,8
89
38
,72
8
40
,57
6
39
,06
9
35
,74
0
33
,03
5
32
,56
3
28
,24
7
21
,63
1
21
,27
5
U
nre
stri
cted
99
,53
4
10
0,0
79
97
,77
4
12
1,4
30
11
5,3
33
10
8,6
67
11
8,6
71
12
7,9
94
11
7,2
50
10
4,7
09
Tota
l bu
sin
ess-
type
acti
vit
ies
net
posi
tion
87
0,3
31
81
5,4
20
75
2,7
54
73
5,0
11
71
2,4
27
68
4,3
42
64
3,2
45
59
1,4
90
56
3,0
46
52
6,5
36
Pri
ma
ry G
over
nm
ent
N
et i
nves
tmen
t in
cap
ital
ass
ets
85
7,4
57
78
4,2
52
70
8,6
75
66
3,5
59
63
8,7
53
59
7,8
75
54
6,8
24
48
7,7
25
48
6,5
79
49
6,8
27
R
estr
icte
d6
0,0
79
55
,92
2
55
,73
4
65
,86
0
46
,77
5
43
,03
1
49
,79
7
45
,39
4
33
,17
1
33
,23
1
U
nre
stri
cted
(20
,90
7)
2,5
43
20
,85
5
10
7,3
31
11
3,6
15
10
6,6
18
11
5,4
86
13
9,4
33
14
4,2
04
13
6,4
10
Tota
l P
rim
ary g
over
nm
ent
net
posi
tion
89
6,6
29
$
84
2,7
17
$
78
5,2
64
$
83
6,7
50
$
79
9,1
43
$
74
7,5
24
$
71
2,1
07
$
67
2,5
52
$
66
3,9
54
$
66
6,4
68
$
Beg
innin
g F
Y 2
01
3 n
et p
osi
tion r
esta
ted d
ue
to i
mple
men
tati
on o
f G
AS
B S
tate
men
t N
o.
65
, "I
tem
s P
revio
usl
y R
epo
rted
as
Ass
ets
and
Lia
bil
itie
s."
Beg
innin
g F
Y 2
01
5 n
et p
osi
tion r
esta
ted d
ue
to i
mple
men
tati
on o
f G
AS
B S
tate
men
t N
o.
68
, "A
cco
unti
ng a
nd
Fin
anci
al R
epo
rtin
g f
or
Pen
sio
ns
- an
Am
end
men
t o
f G
AS
B S
tate
men
t N
o.
27."
(am
ou
nts
exp
ress
ed i
n t
ho
usa
nd
s)
CIT
Y O
F L
UB
BO
CK
, T
EX
AS
Tab
le A
- N
et
Posi
tion
by
Com
pon
en
t
Last
Ten
Fis
cal
Years
(a
ccru
al
ba
sis
of
acc
ou
nti
ng
)
168
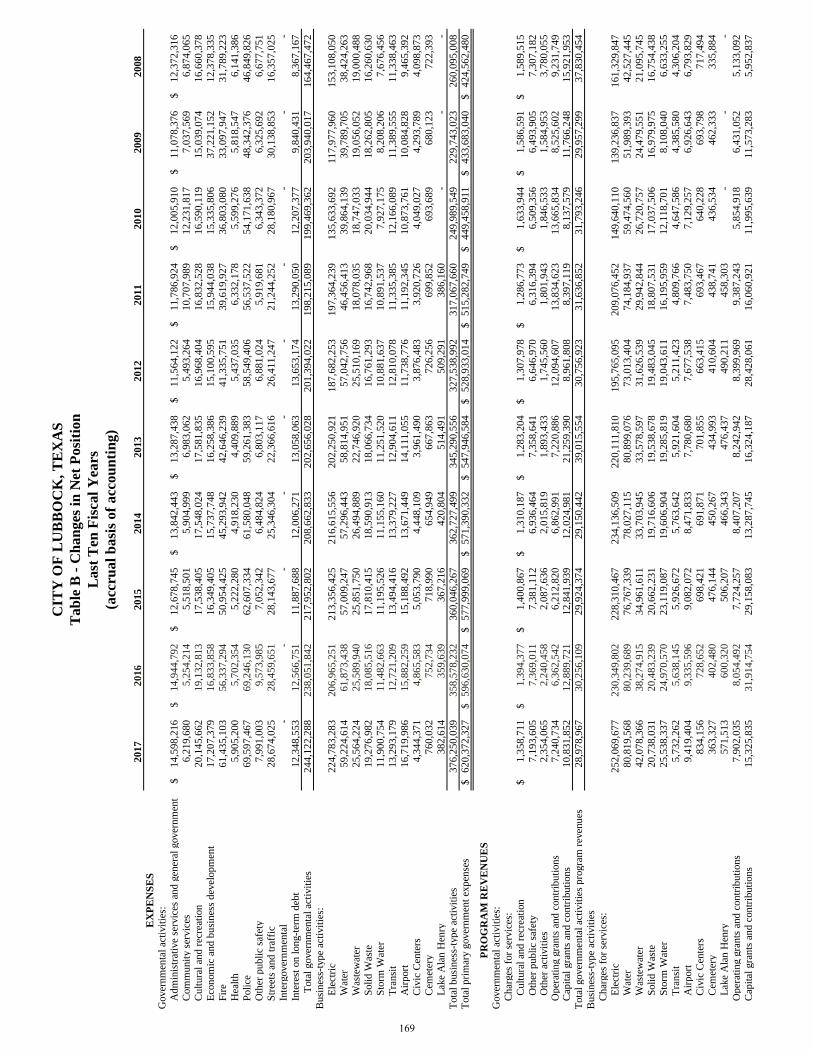
20
17
2016
2015
2014
2013
2012
20
11
20
10
20
09
20
08
EX
PE
NS
ES
Gover
nm
enta
l ac
tivit
ies:
A
dm
inis
trat
ive
serv
ices
and g
ener
al g
over
nm
ent
14
,59
8,2
16
$
14,9
44,7
92
$
12,6
78,7
45
$
13,8
42,4
43
$
13,2
87,4
38
$
11,5
64
,12
2$
11
,78
6,9
24
$
12
,00
5,9
10
$
11
,07
8,3
76
$
12
,37
2,3
16
$
C
om
mun
ity s
ervic
es6
,21
9,6
80
5,2
54,2
14
5,5
18,5
01
5,9
04,9
99
6,9
83,0
62
5,4
93
,26
41
0,7
07
,98
91
2,2
31
,81
77
,03
7,5
69
6,8
74
,06
5
C
ult
ura
l an
d r
ecre
atio
n2
0,1
45
,66
219,1
32,8
13
17,5
38,4
05
17,5
48,0
24
17,5
81,8
35
16,9
68
,40
41
6,8
32
,52
81
6,5
90
,11
91
5,0
39
,07
41
6,6
60
,37
8
E
conom
ic a
nd b
usi
nes
s dev
elop
men
t1
7,2
07
,37
916,8
33,8
58
16,3
49,4
05
15,7
37,7
48
16,2
58,3
86
15,1
00
,59
51
5,9
44
,03
81
5,3
35
,80
63
7,2
21
,15
21
2,3
78
,33
5
F
ire
61
,43
5,1
03
56,3
37,2
94
50,9
54,4
25
45,2
93,9
42
42,6
46,2
39
41,3
35
,75
13
9,6
19
,92
73
6,8
03
,08
03
3,0
97
,94
73
1,7
89
,22
3
H
ealt
h5
,90
5,2
00
5,7
02,3
54
5,2
22,2
80
4,9
18,2
30
4,4
09,8
89
5,4
37
,03
56
,33
2,1
78
5,5
99
,27
65
,81
8,5
47
6,1
41
,38
6
P
oli
ce6
9,5
97
,46
769,2
46,1
30
62,6
07,3
34
61,5
80,0
48
59,2
61,3
83
58,5
49
,40
65
6,5
37
,52
25
4,1
71
,63
84
8,3
42
,37
64
6,8
49
,82
6
O
ther
pu
bli
c sa
fety
7,9
91
,00
39,5
73,9
85
7,0
52,3
42
6,4
84,8
24
6,8
03,1
17
6,8
81
,02
45
,91
9,6
81
6,3
43
,37
26
,32
5,6
92
6,6
77
,75
1
S
tree
ts a
nd t
raff
ic2
8,6
74
,02
528,4
59,6
51
28,1
43,6
77
25,3
46,3
04
22,3
66,6
16
26,4
11
,24
72
1,2
44
,25
22
8,1
80
,96
73
0,1
38
,85
31
6,3
57
,02
5
I
nte
rgover
nm
enta
l-
--
--
--
--
-
I
nte
rest
on l
ong-t
erm
deb
t1
2,3
48
,55
312,5
66,7
51
11,8
87,6
88
12,0
06,2
71
13,0
58,0
63
13,6
53
,17
41
3,2
90
,05
01
2,2
07
,37
79
,84
0,4
31
8,3
67
,16
7
T
ota
l gover
nm
enta
l ac
tivit
ies
24
4,1
22
,28
8
238,0
51,8
42
217,9
52,8
02
208,6
62,8
33
202,6
56,0
28
201,3
94
,02
2
19
8,2
15
,08
9
19
9,4
69
,36
2
20
3,9
40
,01
7
16
4,4
67
,47
2
Busi
nes
s-ty
pe
acti
vit
ies:
Ele
ctri
c2
24
,78
3,2
83
206,9
65,2
51
213,3
56,4
25
216,6
15,5
56
202,2
50,9
21
187,6
82
,25
31
97
,36
4,2
39
13
5,6
33
,69
21
17
,97
7,9
60
15
3,1
08
,05
0
Wat
er5
9,2
24
,61
461,8
73,4
38
57,0
09,2
47
57,2
96,4
43
58,8
14,9
51
57,0
42
,75
64
6,4
56
,41
33
9,8
64
,13
93
9,7
89
,70
53
8,4
24
,26
3
Was
tew
ater
25
,56
4,2
24
25,5
89,9
40
25,8
51,7
50
26,4
94,8
89
22,7
46,9
20
25,5
10
,16
91
8,0
78
,03
51
8,7
47
,03
31
9,0
56
,05
21
9,0
00
,48
8
Soli
d W
aste
19
,27
6,9
82
18,0
85,5
16
17,8
10,4
15
18,5
90,9
13
18,0
66,7
34
16,7
61
,29
31
6,7
42
,96
82
0,0
34
,94
41
8,2
62
,80
51
6,2
60
,63
0
Sto
rm W
ater
11
,90
0,7
54
11,4
82,6
63
11,1
95,5
26
11,1
55,1
60
11,2
51,5
20
10,8
81
,63
71
0,8
91
,53
77
,92
7,1
75
8,2
08
,20
67
,67
6,4
56
Tra
nsi
t1
3,2
93
,17
912,7
21,2
09
13,4
94,4
16
13,3
79,2
27
12,9
04,6
11
12,8
10
,07
81
1,3
35
,38
51
2,1
66
,08
91
1,3
89
,55
51
1,3
38
,46
3
Air
port
16
,71
9,9
86
15,8
82,2
59
15,1
88,4
92
13,6
71,4
49
14,1
11,0
55
11,7
38
,77
61
1,1
92
,34
51
0,8
73
,76
11
0,0
84
,82
89
,46
5,3
92
Civ
ic C
ente
rs4
,34
4,3
71
4,8
65,5
83
5,0
53,7
90
4,4
48,1
09
3,9
61,4
90
3,8
76
,48
33
,92
0,7
26
4,0
49
,02
74
,29
3,7
89
4,0
98
,87
3
Cem
eter
y7
60
,03
2752,7
34
718,9
90
654,9
49
667,8
63
72
6,2
56
69
9,8
52
69
3,6
89
68
0,1
23
72
2,3
93
Lak
e A
lan H
enry
38
2,6
14
359,6
39
367,2
16
420,8
04
514,4
91
50
9,2
91
38
6,1
60
--
-
Tota
l busi
nes
s-ty
pe
acti
vit
ies
37
6,2
50
,03
9
358,5
78,2
32
360,0
46,2
67
362,7
27,4
99
345,2
90,5
56
327,5
38
,99
2
31
7,0
67
,66
0
24
9,9
89
,54
9
22
9,7
43
,02
3
26
0,0
95
,00
8
Tota
l pri
mar
y g
over
nm
ent
expen
ses
62
0,3
72
,32
7$
596,6
30,0
74
$
577,9
99,0
69
$
571,3
90,3
32
$
547,9
46,5
84
$
528,9
33
,01
4$
5
15
,28
2,7
49
$
4
49
,45
8,9
11
$
4
33
,68
3,0
40
$
4
24
,56
2,4
80
$
PR
OG
RA
M R
EV
EN
UE
S
Gover
nm
enta
l ac
tivit
ies:
C
har
ges
for
serv
ices
:
Cult
ura
l an
d r
ecre
atio
n1
,35
8,7
11
$
1,3
94,3
77
$
1,4
00,8
67
$
1,3
10,1
87
$
1,2
83,2
04
$
1,3
07
,97
8$
1
,28
6,7
73
$
1
,63
3,9
44
$
1
,58
6,5
91
$
1
,58
9,5
15
$
Oth
er p
ubli
c sa
fety
7,1
93
,60
5
7,3
69,0
11
7,3
81,1
12
6,9
36,4
64
7,3
58,6
41
6,6
46
,97
0
6,3
16
,39
4
6,5
09
,35
6
6,4
93
,90
5
7,3
07
,18
2
Oth
er a
ctiv
itie
s2
,35
4,0
65
2,2
40,4
58
2,0
87,6
36
2,0
15,8
19
1,8
93,4
33
1,7
45
,56
0
1,8
01
,94
3
1,8
46
,53
3
1,5
84
,95
3
3,7
80
,05
5
O
per
atin
g g
rants
and c
ontr
ibu
tion
s7
,24
0,7
34
6,3
62,5
42
6,2
12,8
20
6,8
62,9
91
7,2
20,8
86
12,0
94
,60
7
1
3,8
34
,62
3
1
3,6
65
,83
4
8
,52
5,6
02
9
,23
1,7
49
Cap
ital
gra
nts
and c
ontr
ibuti
on
s1
0,8
31
,85
2
12,8
89,7
21
12,8
41,9
39
12,0
24,9
81
21,2
59,3
90
8,9
61
,80
8
8,3
97
,11
9
8,1
37
,57
9
11
,76
6,2
48
15
,92
1,9
53
Tota
l gover
nm
enta
l ac
tivit
ies
pro
gra
m r
even
ues
28
,97
8,9
67
30,2
56,1
09
29,9
24,3
74
29,1
50,4
42
39,0
15,5
54
30,7
56
,92
3
3
1,6
36
,85
2
3
1,7
93
,24
6
2
9,9
57
,29
9
3
7,8
30
,45
4
Busi
nes
s-ty
pe
acti
vit
ies
C
har
ges
for
serv
ices
:
Ele
ctri
c2
52
,06
9,6
77
230,3
49,8
02
228,3
10,4
67
234,1
36,5
09
220,1
11,8
10
195,7
65
,09
52
09
,07
6,4
52
14
9,6
40
,11
01
39
,23
6,8
37
16
1,3
29
,84
7
Wat
er8
0,8
19
,56
880,2
39,6
89
76,7
67,3
39
78,0
27,1
15
80,8
99,0
76
73,0
13
,40
47
4,1
84
,93
75
9,4
74
,56
05
1,9
89
,39
34
2,5
27
,44
5
Was
tew
ater
42
,07
8,3
66
38,2
74,9
15
34,9
61,6
11
33,7
03,9
45
33,5
78,5
97
31,6
26
,53
92
9,9
42
,84
42
6,7
20
,75
72
4,4
79
,55
12
1,0
95
,74
5
Soli
d W
aste
20
,73
8,0
31
20,4
83,2
39
20,6
62,2
31
19,7
16,6
06
19,5
38,6
78
19,4
83
,04
51
8,8
07
,53
11
7,0
37
,50
61
6,9
79
,97
51
6,7
54
,43
8
Sto
rm W
ater
25
,53
8,3
37
24,9
70,5
70
23,1
19,0
87
19,6
06,9
04
19,2
85,8
19
19,0
43
,61
11
6,1
95
,95
91
2,1
18
,70
18
,10
8,0
40
6,6
33
,25
5
Tra
nsi
t5
,73
2,2
62
5,6
38,1
45
5,9
26,6
72
5,7
63,6
42
5,9
21,6
04
5,2
11
,42
34
,80
9,7
66
4,6
47
,58
64
,38
5,5
80
4,3
06
,20
4
Air
port
9,4
19
,40
49,3
35,5
96
9,0
82,0
72
8,4
71,8
33
7,7
80,6
80
7,6
77
,53
87
,48
3,7
50
7,1
29
,25
76
,92
6,6
43
6,7
93
,82
9
Civ
ic C
ente
rs8
34
,15
6728,6
52
698,4
21
691,8
71
701,8
55
66
3,4
15
69
3,4
67
64
0,2
28
69
3,7
98
71
7,4
94
Cem
eter
y3
63
,32
7402,4
80
476,1
44
450,2
67
434,9
93
41
0,6
04
43
8,7
41
43
6,5
34
46
2,3
33
33
5,8
84
Lak
e A
lan H
enry
57
1,5
13
600,3
20
506,2
07
466,3
43
476,4
37
49
0,2
11
45
8,3
03
--
-
O
per
atin
g g
rants
and c
ontr
ibu
tion
s7
,90
2,0
35
8,0
54,4
92
7,7
24,2
57
8,4
07,2
07
8,2
42,9
42
8,3
99
,96
9
9,3
87
,24
3
5,8
54
,91
8
6,4
31
,05
2
5,1
33
,09
2
C
apit
al g
rants
and c
ontr
ibuti
on
s1
5,3
25
,83
5
31,9
14,7
54
29,1
58,0
83
13,2
87,7
45
16,3
24,1
87
28,4
28
,06
1
1
6,0
60
,92
1
1
1,9
95
,63
9
1
1,5
73
,28
3
5
,95
2,8
37
CIT
Y O
F L
UB
BO
CK
, T
EX
AS
Tab
le B
- C
han
ges
in
Net
Posi
tion
Last
Ten
Fis
cal
Yea
rs
(acc
rual
basi
s of
acc
ou
nti
ng)
169
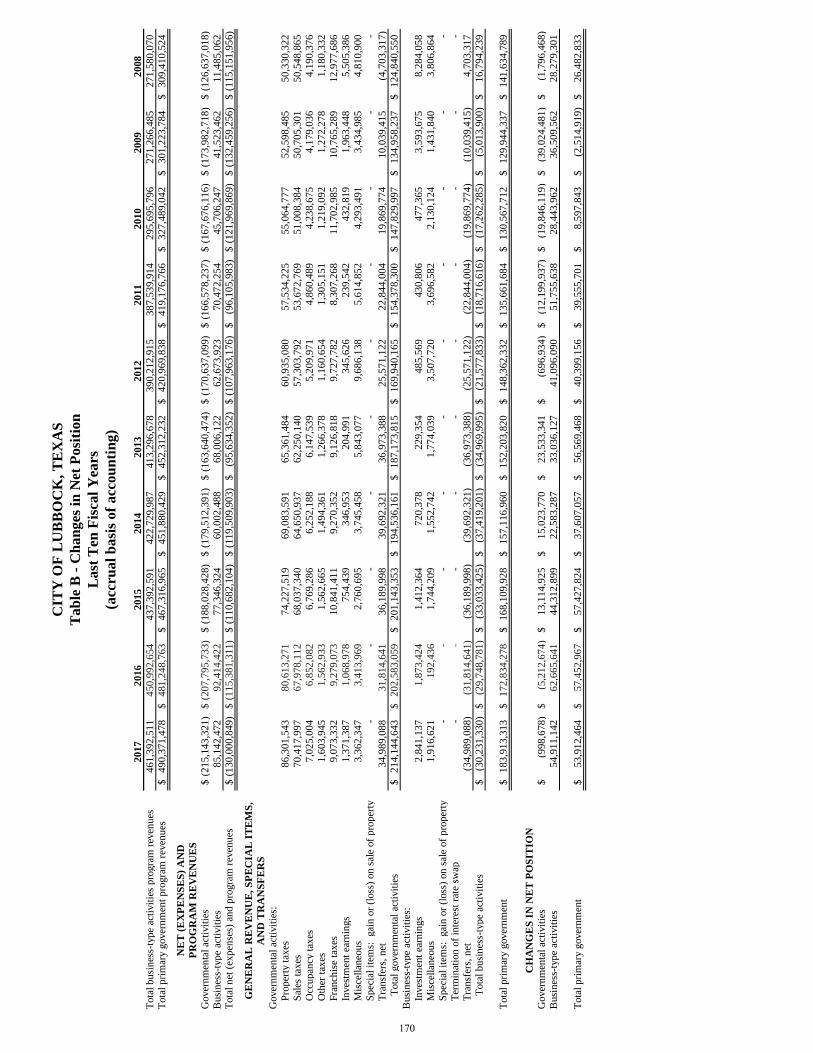
20
17
2016
2015
2014
2013
2012
20
11
20
10
20
09
20
08
CIT
Y O
F L
UB
BO
CK
, T
EX
AS
Tab
le B
- C
han
ges
in
Net
Posi
tion
Last
Ten
Fis
cal
Yea
rs
(acc
rual
basi
s of
acc
ou
nti
ng)
Tota
l busi
nes
s-ty
pe
acti
vit
ies
pro
gra
m r
even
ues
46
1,3
92
,51
1
450,9
92,6
54
437,3
92,5
91
422,7
29,9
87
413,2
96,6
78
390,2
12
,91
5
38
7,5
39
,91
4
29
5,6
95
,79
6
27
1,2
66
,48
5
27
1,5
80
,07
0
Tota
l pri
mar
y g
over
nm
ent
pro
gra
m r
even
ues
49
0,3
71
,47
8$
481,2
48,7
63
$
467,3
16,9
65
$
451,8
80,4
29
$
452,3
12,2
32
$
420,9
69
,83
8$
4
19
,17
6,7
66
$
3
27
,48
9,0
42
$
3
01
,22
3,7
84
$
3
09
,41
0,5
24
$
NE
T (
EX
PE
NS
ES
) A
ND
PR
OG
RA
M R
EV
EN
UE
S
Gover
nm
enta
l ac
tivit
ies
(21
5,1
43
,32
1)
$
(207,7
95,7
33)
$
(188,0
28,4
28)
$
(179,5
12,3
91)
$
(163,6
40,4
74)
$
(170,6
37
,09
9)
$
(16
6,5
78
,23
7)
$
(16
7,6
76
,11
6)
$
(17
3,9
82
,71
8)
$
(12
6,6
37
,01
8)
$
Busi
nes
s-ty
pe
acti
vit
ies
85
,14
2,4
72
92,4
14,4
22
77,3
46,3
24
60,0
02,4
88
68,0
06,1
22
62,6
73
,92
3
7
0,4
72
,25
4
4
5,7
06
,24
7
4
1,5
23
,46
2
1
1,4
85
,06
2
Tota
l net
(ex
pen
ses)
and p
rogra
m r
even
ues
(13
0,0
00
,84
9)
$
(115,3
81,3
11)
$
(110,6
82,1
04)
$
(119,5
09,9
03)
$
(95,6
34,3
52)
$
(1
07,9
63
,17
6)
$
(96
,10
5,9
83
)$
(12
1,9
69
,86
9)
$
(13
2,4
59
,25
6)
$
(11
5,1
51
,95
6)
$
GE
NE
RA
L R
EV
EN
UE
, S
PE
CIA
L I
TE
MS
,
AN
D T
RA
NS
FE
RS
Gover
nm
enta
l ac
tivit
ies:
P
roper
ty t
axes
86
,30
1,5
43
80,6
13,2
71
74,2
27,5
19
69,0
83,5
91
65,3
61,4
84
60,9
35
,08
05
7,5
34
,22
55
5,0
64
,77
75
2,5
98
,48
55
0,3
30
,32
2
S
ales
tax
es7
0,4
17
,99
767,9
78,1
12
68,0
37,3
40
64,6
50,9
37
62,2
50,1
40
57,3
03
,79
25
3,6
72
,76
95
1,0
08
,38
45
0,7
05
,30
15
0,5
48
,86
5
O
ccupan
cy t
axes
7,0
25
,00
46,8
52,0
82
6,7
69,2
86
6,2
52,1
88
6,1
47,5
39
5,2
09
,97
14
,86
0,4
89
4,2
38
,67
54
,17
9,0
36
4,1
90
,37
6
O
ther
tax
es1
,60
3,9
45
1,5
62,9
33
1,5
62,6
65
1,4
94,3
61
1,2
66,3
78
1,1
60
,65
41
,30
5,1
51
1,2
19
,09
21
,27
2,2
78
1,1
80
,33
2
F
ranch
ise
taxes
9,0
73
,33
29,2
79,0
73
10,8
41,4
11
9,2
70,3
52
9,1
26,8
18
9,7
27
,78
28
,30
7,2
68
11
,70
2,9
85
10
,76
5,2
89
12
,97
7,6
86
I
nves
tmen
t ea
rnin
gs
1,3
71
,38
71,0
68,9
78
754,4
39
346,9
53
204,9
91
34
5,6
26
23
9,5
42
43
2,8
19
1,9
63
,44
85
,50
5,3
86
M
isce
llan
eous
3,3
62
,34
73,4
13,9
69
2,7
60,6
95
3,7
45,4
58
5,8
43,0
77
9,6
86
,13
85
,61
4,8
52
4,2
93
,49
13
,43
4,9
85
4,8
10
,90
0
S
pec
ial
item
s:
gai
n o
r (l
oss
) on
sal
e of
pro
per
ty-
-
-
-
-
-
-
-
-
-
T
ransf
ers,
net
34
,98
9,0
88
31,8
14,6
41
36,1
89,9
98
39,6
92,3
21
36,9
73,3
88
25,5
71
,12
22
2,8
44
,00
41
9,8
69
,77
41
0,0
39
,41
5(4
,70
3,3
17
)
Tota
l gover
nm
enta
l ac
tivit
ies
21
4,1
44
,64
3$
202,5
83,0
59
$
201,1
43,3
53
$
194,5
36,1
61
$
187,1
73,8
15
$
169,9
40
,16
5$
1
54
,37
8,3
00
$
1
47
,82
9,9
97
$
1
34
,95
8,2
37
$
1
24
,84
0,5
50
$
Busi
nes
s-ty
pe
acti
vit
ies:
I
nves
tmen
t ea
rnin
gs
2,8
41
,13
71,8
73,4
24
1,4
12,3
64
720,3
78
229,3
54
48
5,5
69
43
0,8
06
47
7,3
65
3,5
93
,67
58
,28
4,0
58
M
isce
llan
eous
1,9
16
,62
1192,4
36
1,7
44,2
09
1,5
52,7
42
1,7
74,0
39
3,5
07
,72
03
,69
6,5
82
2,1
30
,12
41
,43
1,8
40
3,8
06
,86
4
S
pec
ial
item
s:
gai
n o
r (l
oss
) on
sal
e of
pro
per
ty-
-
-
-
-
-
-
-
-
-
T
erm
inat
ion o
f in
tere
st r
ate
swap
-
-
-
-
-
-
-
-
-
-
T
ransf
ers,
net
(34
,98
9,0
88
)
(31,8
14,6
41)
(3
6,1
89,9
98)
(3
9,6
92,3
21)
(3
6,9
73,3
88)
(2
5,5
71
,12
2)
(2
2,8
44
,00
4)
(1
9,8
69
,77
4)
(1
0,0
39
,41
5)
4
,70
3,3
17
Tota
l busi
nes
s-ty
pe
acti
vit
ies
(30
,23
1,3
30
)$
(29,7
48,7
81)
$
(3
3,0
33,4
25)
$
(3
7,4
19,2
01)
$
(3
4,9
69,9
95)
$
(2
1,5
77
,83
3)
$
(1
8,7
16
,61
6)
$
(1
7,2
62
,28
5)
$
(5
,01
3,9
00
)$
1
6,7
94
,23
9$
Tota
l pri
mar
y g
over
nm
ent
18
3,9
13
,31
3$
172,8
34,2
78
$
168,1
09,9
28
$
157,1
16,9
60
$
152,2
03,8
20
$
148,3
62
,33
2$
1
35
,66
1,6
84
$
1
30
,56
7,7
12
$
1
29
,94
4,3
37
$
1
41
,63
4,7
89
$
CH
AN
GE
S I
N N
ET
PO
SIT
ION
Gover
nm
enta
l ac
tivit
ies
(99
8,6
78
)$
(5
,212,6
74)
$
13,1
14,9
25
$
15,0
23,7
70
$
23,5
33,3
41
$
(69
6,9
34
)$
(12
,19
9,9
37
)$
(19
,84
6,1
19
)$
(39
,02
4,4
81
)$
(1,7
96
,46
8)
$
Busi
nes
s-ty
pe
acti
vit
ies
54
,91
1,1
42
62,6
65,6
41
44,3
12,8
99
22,5
83,2
87
33,0
36,1
27
41,0
96
,09
0
5
1,7
55
,63
8
2
8,4
43
,96
2
3
6,5
09
,56
2
2
8,2
79
,30
1
Tota
l pri
mar
y g
over
nm
ent
53
,91
2,4
64
$
57,4
52,9
67
$
57,4
27,8
24
$
37,6
07,0
57
$
56,5
69,4
68
$
40,3
99
,15
6$
39
,55
5,7
01
$
8,5
97
,84
3$
(2,5
14
,91
9)
$
26
,48
2,8
33
$
170
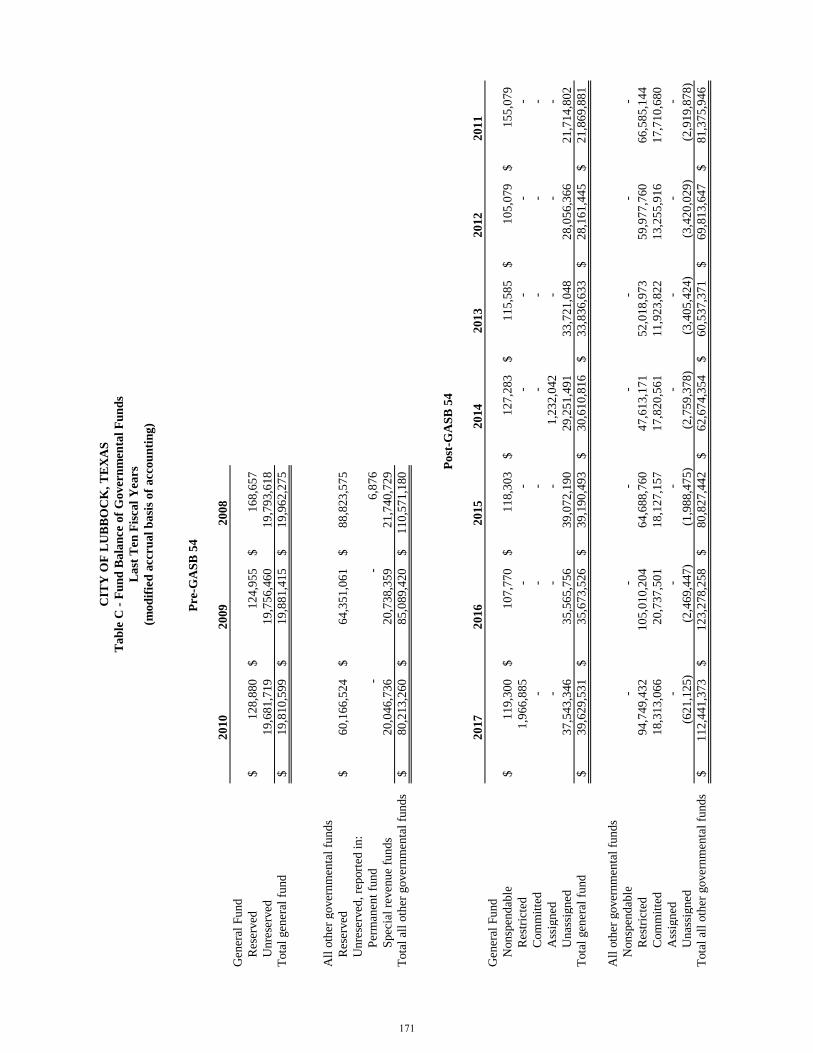
Pre-G
AS
B 5
4
2010
2009
2008
Gen
eral
Fu
nd
R
eser
ved
12
8,8
80
$
124,9
55
$
168,6
57
$
U
nre
serv
ed19,6
81,7
19
19,7
56,4
60
19,7
93,6
18
Tota
l gen
eral
fu
nd
19,8
10,5
99
$
19,8
81,4
15
$
19,9
62,2
75
$
All
oth
er g
over
nm
enta
l fu
nds
R
eser
ved
60,1
66,5
24
$
64,3
51,0
61
$
88,8
23,5
75
$
U
nre
serv
ed,
rep
ort
ed i
n:
P
erm
anen
t fu
nd
-
-
6,8
76
S
pec
ial
reven
ue
funds
20,0
46,7
36
20,7
38,3
59
21,7
40,7
29
Tota
l al
l oth
er g
over
nm
enta
l fu
nds
80,2
13,2
60
$
85,0
89,4
20
$
110,5
71,1
80
$
Post
-GA
SB
54
2017
2016
2015
2014
2013
2012
2011
Gen
eral
Fu
nd
N
on
spen
dab
le11
9,3
00
$
107,7
70
$
118,3
03
$
127,2
83
$
115,5
85
$
105,0
79
$
155,0
79
$
R
estr
icte
d1,9
66,8
85
-
-
-
-
-
-
C
om
mit
ted
-
-
-
-
-
-
-
A
ssig
ned
-
-
-
1,2
32,0
42
-
-
-
U
nas
sign
ed37,5
43,3
46
35,5
65,7
56
39,0
72,1
90
29,2
51,4
91
33,7
21,0
48
28,0
56,3
66
21,7
14,8
02
Tota
l gen
eral
fu
nd
39,6
29,5
31
$
35,6
73,5
26
$
39,1
90,4
93
$
30,6
10,8
16
$
33,8
36,6
33
$
28,1
61,4
45
$
21,8
69,8
81
$
All
oth
er g
over
nm
enta
l fu
nds
N
on
spen
dab
le-
-
-
-
-
-
-
R
estr
icte
d94,7
49,4
32
105,0
10,2
04
64,6
88,7
60
47,6
13,1
71
52,0
18,9
73
59,9
77,7
60
66,5
85,1
44
C
om
mit
ted
18,3
13,0
66
20,7
37,5
01
18,1
27,1
57
17,8
20,5
61
11,9
23,8
22
13,2
55,9
16
17,7
10,6
80
A
ssig
ned
-
-
-
-
-
-
-
U
nas
sign
ed(6
21,1
25)
(2
,469,4
47)
(1
,988,4
75)
(2
,759,3
78)
(3
,405,4
24)
(3
,420,0
29)
(2
,919,8
78)
Tota
l al
l oth
er g
over
nm
enta
l fu
nds
112,4
41,3
73
$
123,2
78,2
58
$
80,8
27,4
42
$
62,6
74,3
54
$
60,5
37,3
71
$
69,8
13,6
47
$
81,3
75,9
46
$
CIT
Y O
F L
UB
BO
CK
, T
EX
AS
Tab
le C
- F
un
d B
ala
nce o
f G
overn
men
tal
Fu
nd
s
Last
Ten
Fis
cal
Years
(mod
ifie
d a
ccru
al
basi
s of
accou
nti
ng)
171
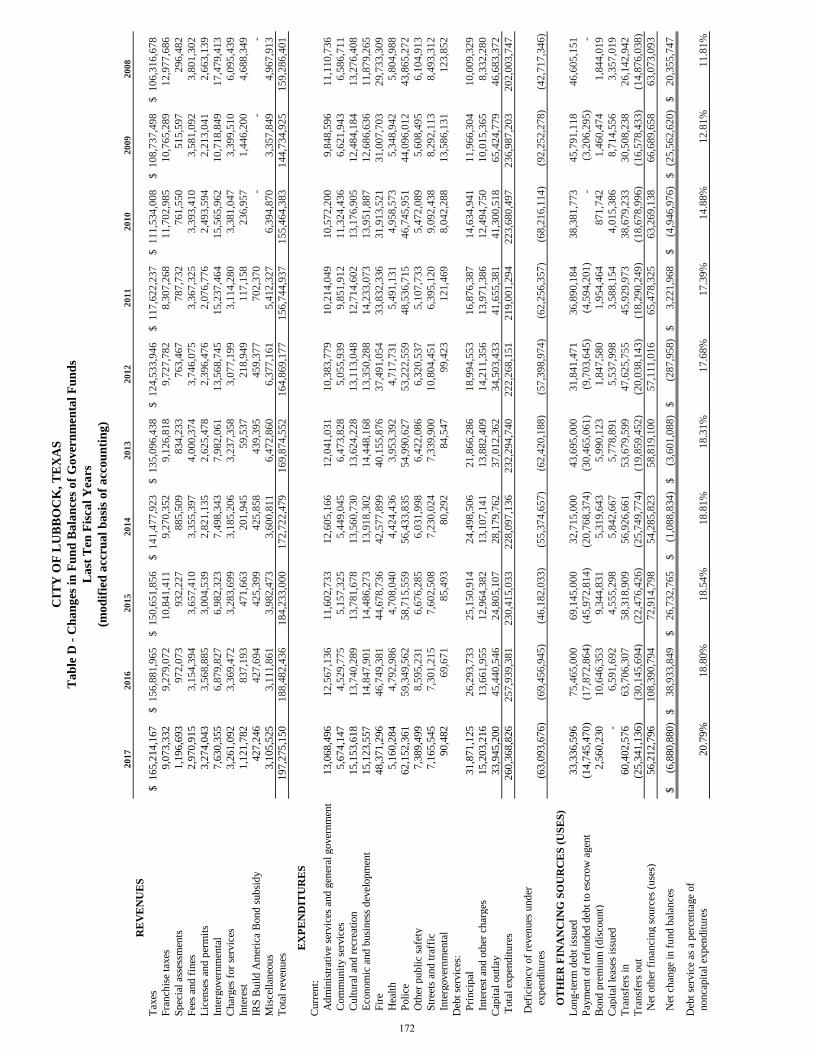
20
17
20
16
20
15
20
14
20
13
20
12
20
11
20
10
20
09
20
08
RE
VE
NU
ES
Tax
es1
65
,21
4,1
67
$
156,8
81,9
65
$
150,6
51,8
56
$
141,4
77,9
23
$
135,0
96,4
38
$
124,5
33
,94
6$
1
17
,62
2,2
37
$
11
1,5
34
,00
8$
10
8,7
37
,49
8$
10
6,3
16
,67
8$
Fra
nch
ise
taxes
9,0
73
,33
29,2
79,0
72
10,8
41,4
11
9,2
70,3
52
9,1
26,8
18
9,7
27
,78
28
,30
7,2
68
11
,70
2,9
85
10
,76
5,2
89
12
,97
7,6
86
Sp
ecia
l as
sess
men
ts1
,19
6,6
93
972,0
73
932,2
27
885,5
09
834,2
33
76
3,4
67
78
7,7
32
76
1,5
50
51
5,5
97
29
6,4
82
Fee
s an
d f
ines
2,9
70
,91
53,1
54,3
94
3,6
57,4
10
3,3
55,3
97
4,0
00,3
74
3,7
46
,07
53
,36
7,3
25
3,3
93
,41
03
,58
1,0
92
3,8
01
,30
2
Lic
ense
s an
d p
erm
its
3,2
74
,04
33,5
68,8
85
3,0
04,5
39
2,8
21,1
35
2,6
25,4
78
2,3
96
,47
62
,07
6,7
76
2,4
93
,59
42
,21
3,0
41
2,6
63
,13
9
Inte
rgover
nm
enta
l7
,63
0,3
55
6,8
79,8
27
6,9
82,3
23
7,4
98,3
43
7,9
82,0
61
13,5
68
,74
51
5,2
37
,46
41
5,5
65
,96
21
0,7
18
,84
91
7,4
79
,41
3
Ch
arges
for
serv
ices
3,2
61
,09
23,3
69,4
72
3,2
83,6
99
3,1
85,2
06
3,2
37,3
58
3,0
77
,19
93
,11
4,2
80
3,3
81
,04
73
,39
9,5
10
6,0
95
,43
9
Inte
rest
1,1
21
,78
2837,1
93
471,6
63
201,9
45
59,5
37
21
8,9
49
11
7,1
58
23
6,9
57
1,4
46
,20
04
,68
8,3
49
IRS
Bu
ild A
mer
ica
Bon
d s
ub
sidy
42
7,2
46
427,6
94
425,3
99
425,8
58
439,3
95
45
9,3
77
70
2,3
70
--
-
Mis
cell
aneo
us
3,1
05
,52
53,1
11,8
61
3,9
82,4
73
3,6
00,8
11
6,4
72,8
60
6,3
77
,16
15
,41
2,3
27
6,3
94
,87
03
,35
7,8
49
4,9
67
,91
3
Tota
l re
ven
ues
19
7,2
75
,15
0188,4
82,4
36
184,2
33,0
00
172,7
22,4
79
169,8
74,5
52
164,8
69
,17
71
56
,74
4,9
37
15
5,4
64
,38
31
44
,73
4,9
25
15
9,2
86
,40
1
EX
PE
ND
ITU
RE
S
Cu
rren
t:
A
dm
inis
trat
ive
serv
ices
an
d g
ener
al g
over
nm
ent
13
,06
8,4
96
12,5
67,1
36
11,6
02,7
33
12,6
05,1
66
12,0
41,0
31
10,3
83
,77
91
0,2
14
,04
91
0,5
72
,20
09
,84
8,5
96
11
,11
0,7
36
C
om
mu
nit
y s
ervic
es5
,67
4,1
47
4,5
29,7
75
5,1
57,3
25
5,4
49,0
45
6,4
73,8
28
5,0
55
,93
99
,85
1,9
12
11
,32
4,4
36
6,6
21
,94
36
,58
6,7
11
C
ult
ura
l an
d r
ecre
atio
n1
5,1
53
,61
813,7
40,2
89
13,7
81,6
78
13,5
60,7
30
13,6
24,2
28
13,1
13
,04
81
2,7
14
,60
21
3,1
76
,90
51
2,4
84
,18
41
3,2
76
,40
8
E
con
om
ic a
nd
bu
sin
ess
dev
elop
men
t1
5,1
23
,55
714,8
47,9
01
14,4
86,2
73
13,9
18,3
02
14,4
48,1
68
13,3
50
,28
81
4,2
33
,07
31
3,9
51
,88
71
2,6
86
,63
61
1,8
79
,26
5
F
ire
48
,37
1,2
96
46,7
49,3
81
44,6
78,7
36
42,5
77,8
99
40,1
55,8
76
37,4
91
,05
43
3,8
32
,33
63
1,9
13
,52
13
1,0
07
,70
32
9,7
33
,30
9
H
ealt
h5
,16
0,2
84
4,7
92,9
86
4,7
08,0
40
4,4
24,4
36
3,9
53,3
92
4,7
17
,73
15
,49
1,1
31
4,9
58
,57
35
,34
8,9
42
5,8
04
,98
8
P
oli
ce6
2,1
52
,36
159,3
49,5
62
58,7
15,5
59
56,4
33,8
35
54,9
90,6
27
53,2
22
,55
94
8,5
36
,71
54
6,7
45
,95
14
4,0
96
,01
24
3,8
65
,27
2
O
ther
pu
bli
c sa
fety
7,3
89
,49
98,5
95,2
31
6,6
76,2
85
6,0
31,9
98
6,4
22,0
86
6,3
20
,53
75
,10
7,7
33
5,4
72
,08
95
,60
8,4
95
6,1
04
,91
3
S
tree
ts a
nd
tra
ffic
7,1
65
,54
57,3
01,2
15
7,6
02,5
08
7,2
30,0
24
7,3
39,9
00
10,8
04
,45
16
,39
5,1
20
9,0
92
,43
88
,29
2,1
13
8,4
93
,31
2
In
terg
over
nm
enta
l9
0,4
82
69,6
71
85,4
93
80,2
92
84,5
47
99
,42
31
21
,46
98
,04
2,2
88
13
,58
6,1
31
12
3,8
52
Deb
t se
rvic
es:
P
rin
cip
al3
1,8
71
,12
526,2
93,7
33
25,1
50,9
14
24,4
98,5
06
21,8
66,2
86
18,9
94
,55
31
6,8
76
,38
71
4,6
34
,94
11
1,9
66
,30
41
0,0
09
,32
9
In
tere
st a
nd
oth
er c
har
ges
15
,20
3,2
16
13,6
61,9
55
12,9
64,3
82
13,1
07,1
41
13,8
82,4
09
14,2
11
,35
61
3,9
71
,38
61
2,4
94
,75
01
0,0
15
,36
58
,33
2,2
80
Cap
ital
ou
tlay
33
,94
5,2
00
45,4
40,5
46
24,8
05,1
07
28,1
79,7
62
37,0
12,3
62
34,5
03
,43
34
1,6
55
,38
14
1,3
00
,51
86
5,4
24
,77
94
6,6
83
,37
2
Tota
l ex
pen
dit
ure
s2
60
,36
8,8
26
257,9
39,3
81
230,4
15,0
33
228,0
97,1
36
232,2
94,7
40
222,2
68
,15
1
21
9,0
01
,29
4
2
23
,68
0,4
97
2
36
,98
7,2
03
2
02
,00
3,7
47
Def
icie
ncy
of
reven
ues
un
der
exp
end
itu
res
(63
,09
3,6
76
)
(69,4
56,9
45)
(4
6,1
82,0
33)
(55,3
74,6
57)
(62,4
20,1
88)
(57,3
98
,97
4)
(62
,25
6,3
57
)
(6
8,2
16
,11
4)
(9
2,2
52
,27
8)
(4
2,7
17
,34
6)
OT
HE
R F
INA
NC
ING
SO
UR
CE
S (
US
ES
)
Lon
g-t
erm
deb
t is
sued
33
,33
6,5
96
75,4
65,0
00
69,1
45,0
00
32,7
15,0
00
43,6
95,0
00
31,8
41
,47
13
6,8
90
,18
43
8,3
81
,77
34
5,7
91
,11
84
6,6
05
,15
1
Pay
men
t of
refu
nd
ed d
ebt
to e
scro
w a
gen
t(1
4,7
45
,47
0)
(17,8
72,8
64)
(45,9
72,8
14)
(20,7
68,3
74)
(30,4
65,0
61)
(9,7
03
,64
5)
(4,5
94
,20
1)
-(3
,20
6,2
95
)-
Bon
d p
rem
ium
(d
isco
un
t)2
,56
0,2
30
10,6
46,3
53
9,3
44,8
31
5,3
19,6
43
5,9
90,1
23
1,8
47
,58
01
,95
4,4
64
87
1,7
42
1,4
60
,47
41
,84
4,0
19
Cap
ital
lea
ses
issu
ed-
6,5
91,6
92
4,5
55,2
98
5,8
42,6
67
5,7
78,8
91
5,5
37
,99
83
,58
8,1
54
4,0
15
,38
68
,71
4,5
56
3,3
57
,01
9
Tra
nsf
ers
in
60
,40
2,5
76
63,7
06,3
07
58,3
18,9
09
56,9
26,6
61
53,6
79,5
99
47,6
25
,75
54
5,9
29
,97
33
8,6
79
,23
33
0,5
08
,23
82
6,1
42
,94
2
Tra
nsf
ers
ou
t(2
5,3
41
,13
6)
(30,1
45,6
94)
(2
2,4
76,4
26)
(25,7
49,7
74)
(19,8
59,4
52)
(20,0
38
,14
3)
(18
,29
0,2
49
)
(1
8,6
78
,99
6)
(1
6,5
78
,43
3)
(1
4,8
76
,03
8)
N
et o
ther
fin
anci
ng s
ou
rces
(u
ses)
56
,21
2,7
96
108,3
90,7
94
72,9
14,7
98
54,2
85,8
23
58,8
19,1
00
57,1
11
,01
6
65
,47
8,3
25
6
3,2
69
,13
8
6
6,6
89
,65
8
6
3,0
73
,09
3
N
et c
han
ge
in f
un
d b
alan
ces
(6,8
80
,88
0)
$
38,9
33,8
49
$
26,7
32,7
65
$
(1,0
88,8
34)
$
(3,6
01,0
88)
$
(28
7,9
58
)$
3
,22
1,9
68
$
(4
,94
6,9
76
)$
(2
5,5
62
,62
0)
$
20
,35
5,7
47
$
Deb
t se
rvic
e as
a p
erce
nta
ge
of
non
capit
al e
xp
end
itu
res
20
.79
%18.8
0%
18.5
4%
18.8
1%
18.3
1%
17
.68
%1
7.3
9%
14
.88
%1
2.8
1%
11
.81
%
CIT
Y O
F L
UB
BO
CK
, T
EX
AS
La
st T
en F
isca
l Y
ears
Ta
ble
D -
Ch
an
ges
in
Fu
nd
Ba
lan
ces
of
Go
ver
nm
enta
l F
un
ds
(mo
dif
ied
acc
rua
l b
asi
s o
f a
cco
un
tin
g)
172
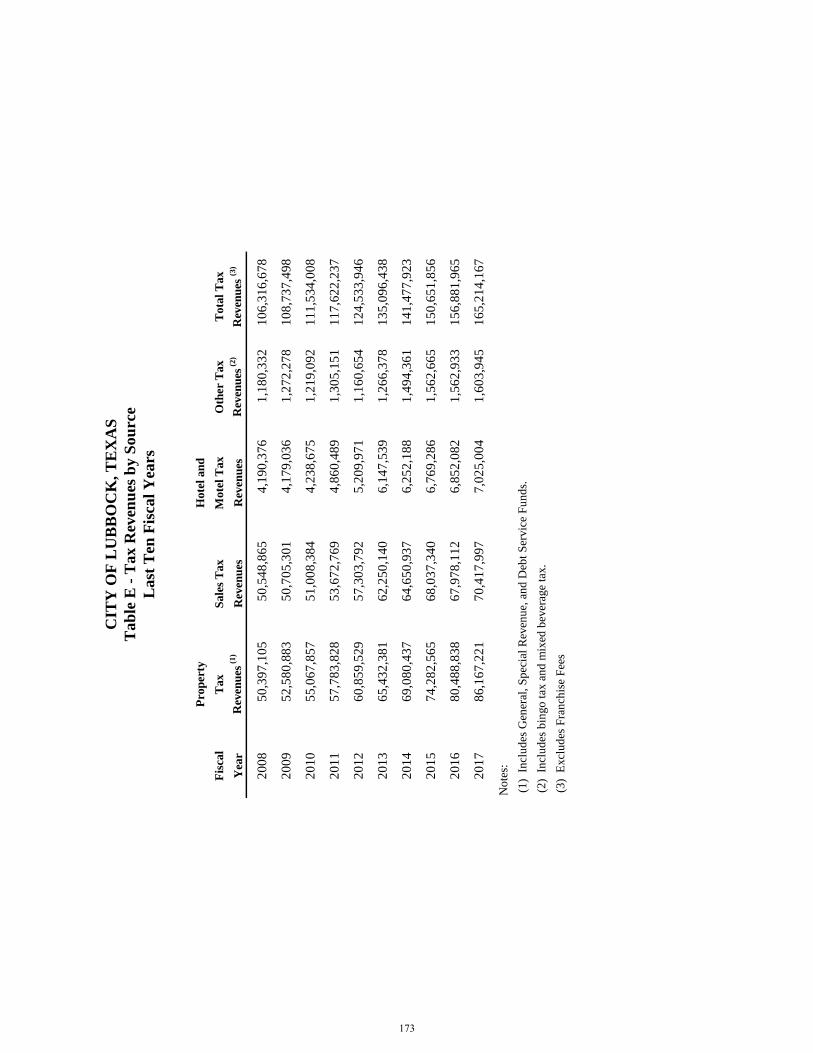
Pro
per
tyH
ote
l an
d
Fis
cal
Tax
Sale
s T
ax
Mote
l T
ax
Oth
er T
ax
Tota
l T
ax
Yea
rR
even
ues
(1)
Rev
enu
esR
even
ues
Rev
enu
es (
2)
Rev
enu
es (3
)
20
08
50
,39
7,1
05
50
,54
8,8
65
4,1
90
,37
6
1
,18
0,3
32
10
6,3
16
,67
8
20
09
52
,58
0,8
83
50
,70
5,3
01
4,1
79
,03
6
1
,27
2,2
78
10
8,7
37
,49
8
20
10
55
,06
7,8
57
51
,00
8,3
84
4,2
38
,67
5
1
,21
9,0
92
11
1,5
34
,00
8
20
11
57
,78
3,8
28
53
,67
2,7
69
4,8
60
,48
9
1
,30
5,1
51
11
7,6
22
,23
7
20
12
60
,85
9,5
29
57
,30
3,7
92
5,2
09
,97
1
1
,16
0,6
54
12
4,5
33
,94
6
20
13
65
,43
2,3
81
62
,25
0,1
40
6,1
47
,53
9
1
,26
6,3
78
13
5,0
96
,43
8
20
14
69
,08
0,4
37
64
,65
0,9
37
6,2
52
,18
8
1
,49
4,3
61
14
1,4
77
,92
3
20
15
74
,28
2,5
65
68
,03
7,3
40
6,7
69
,28
6
1
,56
2,6
65
15
0,6
51
,85
6
20
16
80
,48
8,8
38
67
,97
8,1
12
6,8
52
,08
2
1
,56
2,9
33
15
6,8
81
,96
5
20
17
86
,16
7,2
21
70
,41
7,9
97
7,0
25
,00
4
1
,60
3,9
45
16
5,2
14
,16
7
No
tes:
(1
) I
ncl
ud
es G
ener
al,
Sp
ecia
l R
even
ue,
an
d D
ebt
Ser
vic
e F
un
ds.
(2
) I
ncl
ud
es b
ingo
tax
an
d m
ixed
bev
erag
e ta
x.
(3
) E
xcl
ud
es F
ran
chis
e F
ees
CIT
Y O
F L
UB
BO
CK
, T
EX
AS
Tab
le E
- T
ax R
even
ues
by S
ou
rce
Last
Ten
Fis
cal
Yea
rs
173
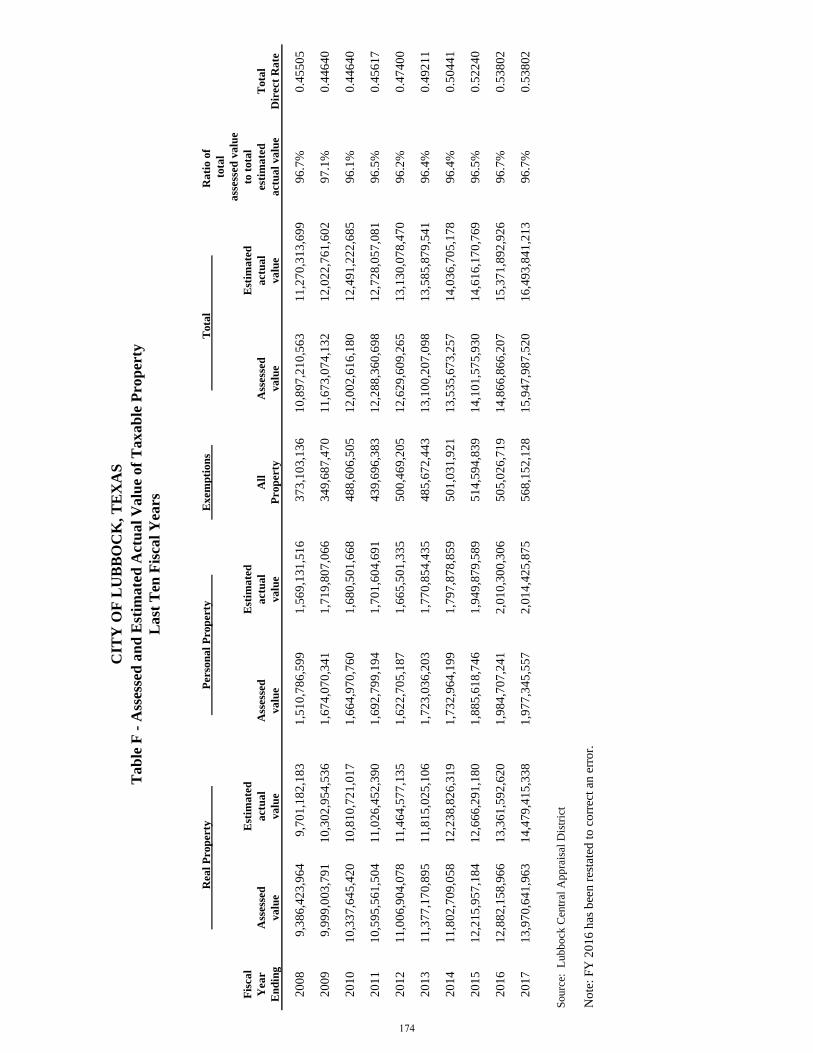
E
xem
pti
on
s
Ra
tio o
f
tota
l
ass
ess
ed
va
lue
Fis
ca
lE
stim
ate
dE
stim
ate
dE
stim
ate
dto
tota
l
Yea
rA
ssess
ed
actu
al
Ass
ess
ed
actu
al
All
Ass
ess
ed
actu
al
est
ima
ted
Tota
l
En
din
gva
lue
va
lue
va
lue
va
lue
Prop
erty
va
lue
va
lue
actu
al
va
lue
Dir
ect
Ra
te
20
08
9,3
86
,42
3,9
64
9
,70
1,1
82
,18
31
,51
0,7
86
,59
91
,56
9,1
31
,51
63
73
,10
3,1
36
1
0,8
97
,21
0,5
63
11
,27
0,3
13
,69
99
6.7
%0
.45
50
5
20
09
9,9
99
,00
3,7
91
1
0,3
02
,95
4,5
36
1,6
74
,07
0,3
41
1,7
19
,80
7,0
66
34
9,6
87
,47
0
11
,67
3,0
74
,13
21
2,0
22
,76
1,6
02
97
.1%
0.4
46
40
20
10
10
,33
7,6
45
,42
0
1
0,8
10
,72
1,0
17
1,6
64
,97
0,7
60
1,6
80
,50
1,6
68
48
8,6
06
,50
5
12
,00
2,6
16
,18
01
2,4
91
,22
2,6
85
96
.1%
0.4
46
40
20
11
10
,59
5,5
61
,50
4
1
1,0
26
,45
2,3
90
1,6
92
,79
9,1
94
1,7
01
,60
4,6
91
43
9,6
96
,38
3
12
,28
8,3
60
,69
81
2,7
28
,05
7,0
81
96
.5%
0.4
56
17
20
12
11
,00
6,9
04
,07
8
1
1,4
64
,57
7,1
35
1,6
22
,70
5,1
87
1,6
65
,50
1,3
35
50
0,4
69
,20
5
12
,62
9,6
09
,26
51
3,1
30
,07
8,4
70
96
.2%
0.4
74
00
20
13
11
,37
7,1
70
,89
5
1
1,8
15
,02
5,1
06
1,7
23
,03
6,2
03
1,7
70
,85
4,4
35
48
5,6
72
,44
3
13
,10
0,2
07
,09
81
3,5
85
,87
9,5
41
96
.4%
0.4
92
11
20
14
11
,80
2,7
09
,05
8
1
2,2
38
,82
6,3
19
1,7
32
,96
4,1
99
1,7
97
,87
8,8
59
50
1,0
31
,92
1
13
,53
5,6
73
,25
71
4,0
36
,70
5,1
78
96
.4%
0.5
04
41
20
15
12
,21
5,9
57
,18
4
1
2,6
66
,29
1,1
80
1,8
85
,61
8,7
46
1,9
49
,87
9,5
89
51
4,5
94
,83
9
14
,10
1,5
75
,93
01
4,6
16
,17
0,7
69
96
.5%
0.5
22
40
20
16
12
,88
2,1
58
,96
6
1
3,3
61
,59
2,6
20
1,9
84
,70
7,2
41
2,0
10
,30
0,3
06
50
5,0
26
,71
9
14
,86
6,8
66
,20
71
5,3
71
,89
2,9
26
96
.7%
0.5
38
02
20
17
13
,97
0,6
41
,96
3
1
4,4
79
,41
5,3
38
1,9
77
,34
5,5
57
2,0
14
,42
5,8
75
56
8,1
52
,12
8
15
,94
7,9
87
,52
01
6,4
93
,84
1,2
13
96
.7%
0.5
38
02
Sourc
e:
Lub
bock
Cen
tral
Ap
pra
isal
Dis
tric
t
No
te:
FY
20
16
has
bee
n r
esta
ted
to
co
rrec
t an
err
or.
CIT
Y O
F L
UB
BO
CK
, T
EX
AS
Ta
ble
F -
Ass
esse
d a
nd
Est
ima
ted
Act
ua
l V
alu
e o
f T
ax
ab
le P
rop
erty
La
st T
en F
isca
l Y
ears
R
ea
l P
rop
erty
Perso
na
l P
rop
erty
Tota
l
174
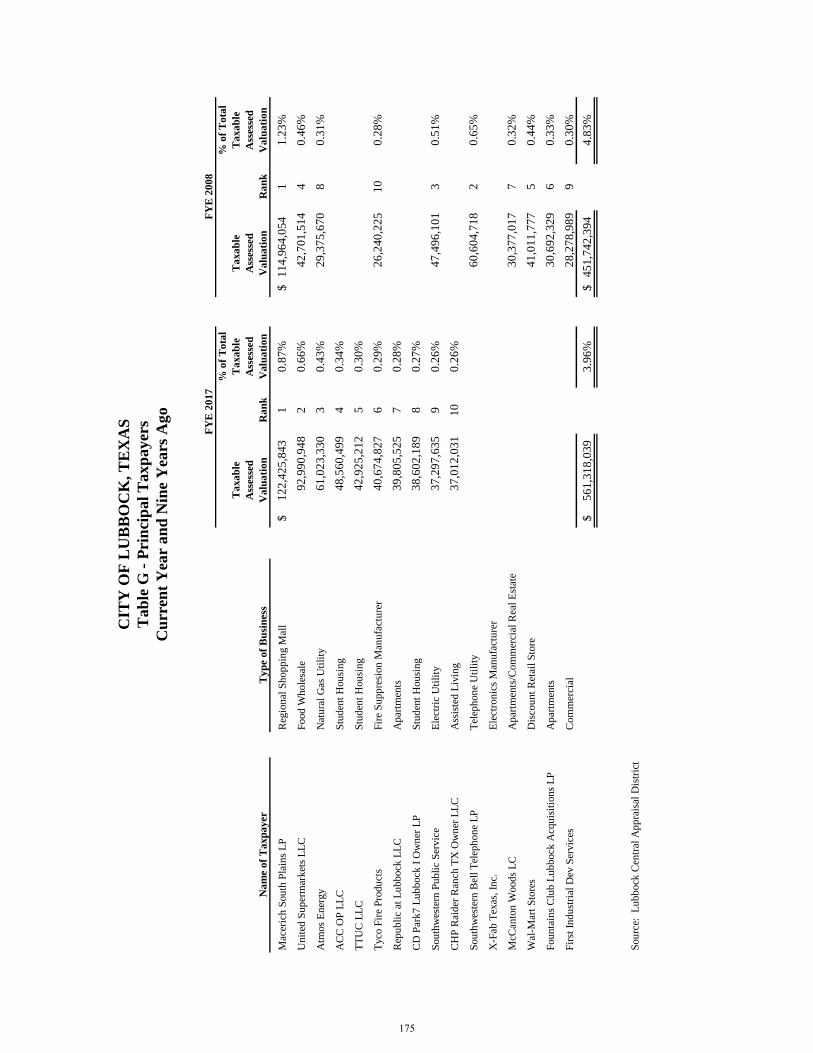
FY
E 2
01
7F
YE
20
08
% o
f T
ota
l%
of
To
tal
Ta
xa
ble
Ta
xa
ble
Ta
xa
ble
Ta
xa
ble
Ass
esse
dA
sses
sed
Ass
esse
dA
sses
sed
Na
me o
f T
axp
ay
er
Ty
pe o
f B
usi
ness
Va
lua
tio
nR
an
kV
alu
ati
on
Va
lua
tio
nR
an
kV
alu
ati
on
Mac
eric
h S
ou
th P
lain
s L
PR
egio
nal
Sh
op
pin
g M
all
12
2,4
25
,84
3$
1
0.8
7%
11
4,9
64
,05
4$
11
.23
%
Un
ited
Su
per
mar
ket
s L
LC
Food
Wh
ole
sale
92
,99
0,9
48
20
.66
%4
2,7
01
,51
44
0.4
6%
Atm
os
En
ergy
Nat
ura
l G
as U
tili
ty6
1,0
23
,33
03
0.4
3%
29
,37
5,6
70
80
.31
%
AC
C O
P L
LC
Stu
den
t H
ou
sin
g4
8,5
60
,49
94
0.3
4%
TT
UC
LL
CS
tud
ent
Hou
sin
g4
2,9
25
,21
25
0.3
0%
Tyco
Fir
e P
rod
uct
sF
ire
Su
pp
resi
on
Man
ufa
ctu
rer
40
,67
4,8
27
60
.29
%2
6,2
40
,22
51
00
.28
%
Rep
ub
lic
at L
ub
bock
LL
CA
par
tmen
ts3
9,8
05
,52
57
0.2
8%
CD
Par
k7
Lu
bb
ock
I O
wn
er L
PS
tud
ent
Hou
sin
g3
8,6
02
,18
98
0.2
7%
Sou
thw
este
rn P
ub
lic
Ser
vic
eE
lect
ric
Uti
lity
37
,29
7,6
35
90
.26
%4
7,4
96
,10
13
0.5
1%
CH
P R
aid
er R
anch
TX
Ow
ner
LL
CA
ssis
ted
Liv
ing
37
,01
2,0
31
10
0.2
6%
Sou
thw
este
rn B
ell
Tel
eph
on
e L
PT
elep
hon
e U
tili
ty6
0,6
04
,71
82
0.6
5%
X-F
ab T
exas
, In
c.E
lect
ron
ics
Man
ufa
ctu
rer
McC
anto
n W
ood
s L
CA
par
tmen
ts/C
om
mer
cial
Rea
l E
stat
e3
0,3
77
,01
77
0.3
2%
Wal
-Mar
t S
tore
sD
isco
un
t R
etai
l S
tore
41
,01
1,7
77
50
.44
%
Fou
nta
ins
Clu
b L
ub
bock
Acq
uis
itio
ns
LP
Ap
artm
ents
30
,69
2,3
29
60
.33
%
Fir
st I
nd
ust
rial
Dev
Ser
vic
esC
om
mer
cial
28
,27
8,9
89
90
.30
%
56
1,3
18
,03
9$
3
.96
%4
51
,74
2,3
94
$
4
.83
%
Sou
rce:
L
ub
bock
Cen
tral
Ap
pra
isal
Dis
tric
t
CIT
Y O
F L
UB
BO
CK
, T
EX
AS
Tab
le G
- P
rin
cip
al
Taxp
ayer
s
Cu
rren
t Y
ear
an
d N
ine
Yea
rs A
go
175
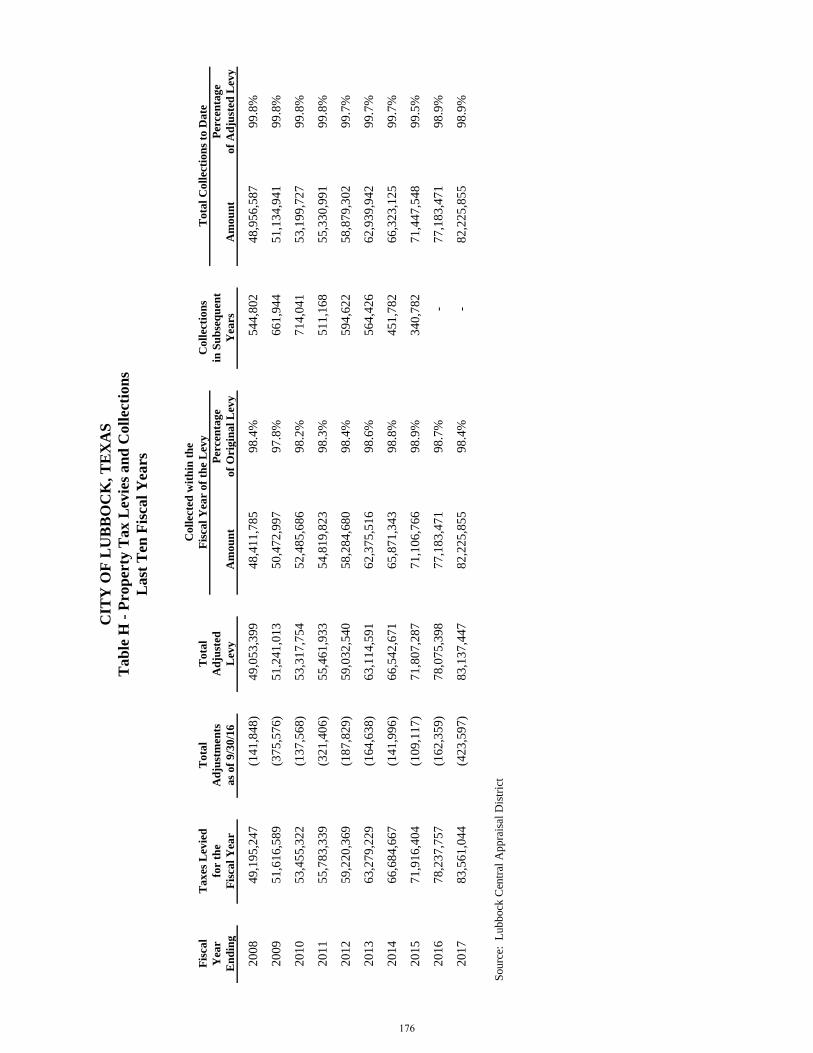
Co
llec
ted
wit
hin
th
e
Fis
cal
Ta
xes
Lev
ied
Tota
lT
ota
lF
isca
l Y
ear
of
the
Lev
yC
oll
ecti
on
sT
ota
l C
oll
ect
ion
s to
Date
Yea
rfo
r th
eA
dju
stm
ents
Ad
just
edP
erce
nta
ge
in S
ub
seq
uen
tP
erce
nta
ge
En
din
gF
isca
l Y
ear
as
of
9/3
0/1
6L
evy
Am
ou
nt
of
Ori
gin
al
Lev
yY
ears
Am
ou
nt
of
Ad
just
ed L
evy
20
08
49
,19
5,2
47
(1
41
,84
8)
49,0
53,3
99
48,4
11,7
85
98.4
%544,8
02
48,9
56,5
87
99.8
%
20
09
51
,61
6,5
89
(3
75
,57
6)
51,2
41,0
13
50,4
72,9
97
97.8
%661,9
44
51,1
34,9
41
99.8
%
20
10
53
,45
5,3
22
(1
37
,56
8)
53,3
17,7
54
52,4
85,6
86
98.2
%714,0
41
53,1
99,7
27
99.8
%
20
11
55
,78
3,3
39
(3
21
,40
6)
55,4
61,9
33
54,8
19,8
23
98.3
%511,1
68
55,3
30,9
91
99.8
%
20
12
59
,22
0,3
69
(1
87
,82
9)
59,0
32,5
40
58,2
84,6
80
98.4
%594,6
22
58,8
79,3
02
99.7
%
20
13
63
,27
9,2
29
(1
64
,63
8)
63,1
14,5
91
62,3
75,5
16
98.6
%564,4
26
62,9
39,9
42
99.7
%
20
14
66
,68
4,6
67
(1
41
,99
6)
66,5
42,6
71
65,8
71,3
43
98.8
%451,7
82
66,3
23,1
25
99.7
%
20
15
71
,91
6,4
04
(1
09
,11
7)
71,8
07,2
87
71,1
06,7
66
98.9
%340,7
82
71,4
47,5
48
99.5
%
20
16
78
,23
7,7
57
(1
62
,35
9)
78,0
75,3
98
77,1
83,4
71
98.7
%-
77,1
83,4
71
98.9
%
20
17
83
,56
1,0
44
(4
23
,59
7)
83,1
37,4
47
82,2
25,8
55
98.4
%-
82,2
25,8
55
98.9
%
Sou
rce:
L
ubbock
Cen
tral
Ap
pra
isal
Dis
tric
t
La
st T
en
Fis
ca
l Y
ea
rs
Ta
ble
H -
Pro
perty
Ta
x L
ev
ies
an
d C
oll
ecti
on
s
CIT
Y O
F L
UB
BO
CK
, T
EX
AS
176
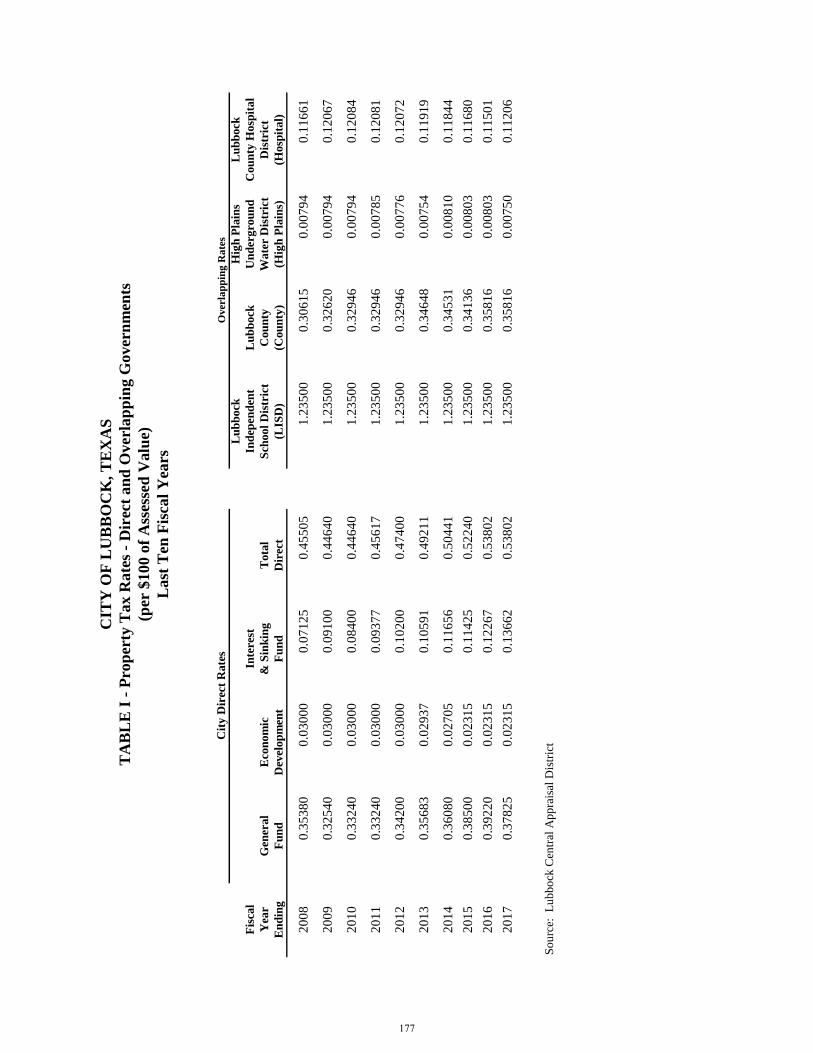
Last
Ten
Fis
cal
Yea
rs
Overla
pp
ing
Ra
tes
Lu
bb
ock
Hig
h P
lain
sL
ub
bock
Fis
cal
In
tere
stIn
dep
end
ent
Lu
bb
ock
Un
der
gro
un
dC
ou
nty
Hosp
ital
Yea
rG
ener
al
Eco
nom
ic&
Sin
kin
gT
ota
lS
chool
Dis
tric
tC
ou
nty
Wate
r D
istr
ict
Dis
tric
t
En
din
gF
un
dD
evel
op
men
tF
un
dD
irec
t(L
ISD
)(C
ou
nty
)(H
igh
Pla
ins)
(Hosp
ital)
20
08
0.3
53
80
0.0
30
00
0.0
71
25
0.4
55
05
1.2
35
00
0.3
06
15
0.0
07
94
0.1
16
61
20
09
0.3
25
40
0.0
30
00
0.0
91
00
0.4
46
40
1.2
35
00
0.3
26
20
0.0
07
94
0.1
20
67
20
10
0.3
32
40
0.0
30
00
0.0
84
00
0.4
46
40
1.2
35
00
0.3
29
46
0.0
07
94
0.1
20
84
20
11
0.3
32
40
0.0
30
00
0.0
93
77
0.4
56
17
1.2
35
00
0.3
29
46
0.0
07
85
0.1
20
81
20
12
0.3
42
00
0.0
30
00
0.1
02
00
0.4
74
00
1.2
35
00
0.3
29
46
0.0
07
76
0.1
20
72
20
13
0.3
56
83
0.0
29
37
0.1
05
91
0.4
92
11
1.2
35
00
0.3
46
48
0.0
07
54
0.1
19
19
20
14
0.3
60
80
0.0
27
05
0.1
16
56
0.5
04
41
1.2
35
00
0.3
45
31
0.0
08
10
0.1
18
44
20
15
0.3
85
00
0.0
23
15
0.1
14
25
0.5
22
40
1.2
35
00
0.3
41
36
0.0
08
03
0.1
16
80
20
16
0.3
92
20
0.0
23
15
0.1
22
67
0.5
38
02
1.2
35
00
0.3
58
16
0.0
08
03
0.1
15
01
20
17
0.3
78
25
0.0
23
15
0.1
36
62
0.5
38
02
1.2
35
00
0.3
58
16
0.0
07
50
0.1
12
06
So
urc
e:
Lu
bb
ock
Cen
tral
Ap
pra
isal
Dis
tric
t
Cit
y D
irec
t R
ate
s
CIT
Y O
F L
UB
BO
CK
, T
EX
AS
TA
BL
E I
- P
rop
erty
Tax R
ate
s -
Dir
ect
an
d O
ver
lap
pin
g G
over
nm
ents
(per
$100 o
f A
sses
sed
Valu
e)
177
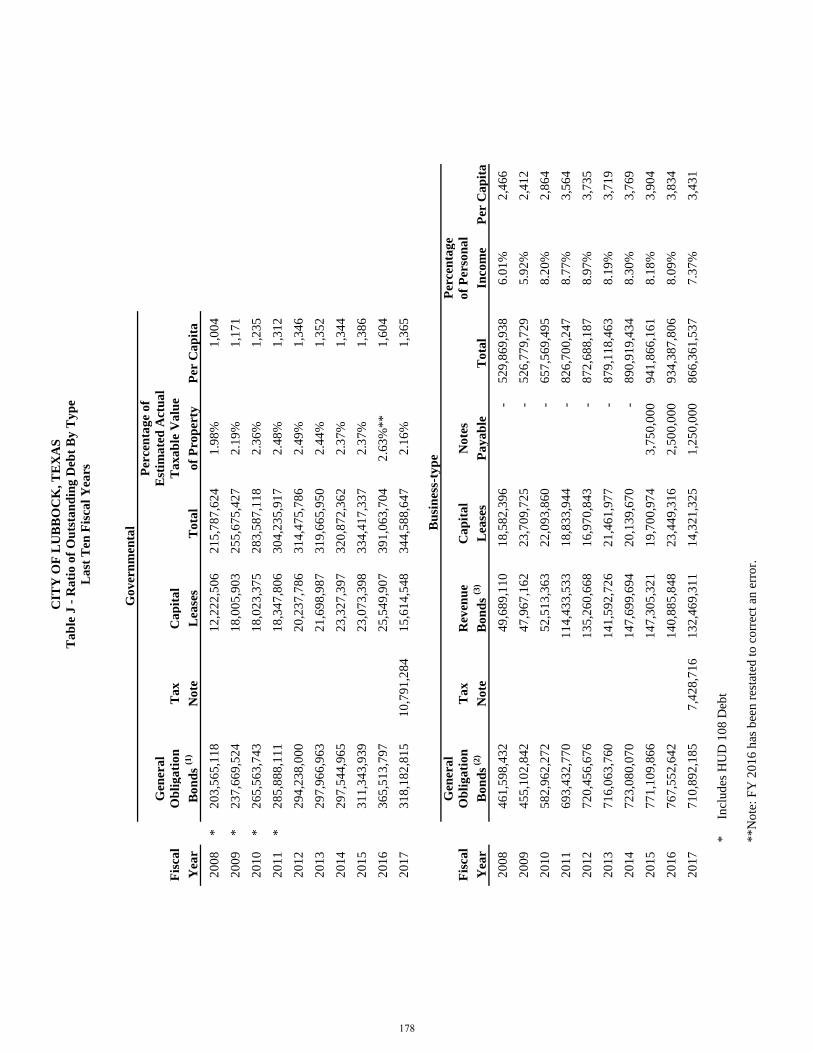
Per
cen
tag
e o
f
Gen
era
lE
stim
ate
d A
ctu
al
Fis
cal
Ob
lig
ati
on
Ta
xC
ap
ita
lT
axa
ble
Va
lue
Yea
rB
on
ds
(1)
No
teL
ease
sT
ota
lo
f P
rop
erty
Per
Ca
pit
a
20
08
*2
03
,56
5,1
18
12
,22
2,5
06
21
5,7
87
,62
4
1.9
8%
1,0
04
20
09
*2
37
,66
9,5
24
18
,00
5,9
03
25
5,6
75
,42
7
2.1
9%
1,1
71
20
10
*2
65
,56
3,7
43
18
,02
3,3
75
28
3,5
87
,11
8
2.3
6%
1,2
35
20
11
*2
85
,88
8,1
11
18
,34
7,8
06
30
4,2
35
,91
7
2.4
8%
1,3
12
20
12
29
4,2
38
,00
0
20
,23
7,7
86
31
4,4
75
,78
6
2.4
9%
1,3
46
20
13
29
7,9
66
,96
3
21
,69
8,9
87
31
9,6
65
,95
0
2.4
4%
1,3
52
20
14
29
7,5
44
,96
5
23
,32
7,3
97
32
0,8
72
,36
2
2.3
7%
1,3
44
20
15
31
1,3
43
,93
9
23
,07
3,3
98
33
4,4
17
,33
7
2.3
7%
1,3
86
20
16
36
5,5
13
,79
7
25
,54
9,9
07
39
1,0
63
,70
4
2.6
3%
**
1,6
04
20
17
31
8,1
82
,81
5
10
,79
1,2
84
15
,61
4,5
48
34
4,5
88
,64
7
2.1
6%
1,3
65
Gen
era
lP
erce
nta
ge
Fis
cal
Ob
lig
ati
on
Ta
xR
even
ue
Ca
pit
al
No
tes
of
Per
son
al
Yea
rB
on
ds (
2)
No
teB
on
ds
(3)
Lea
ses
Pa
ya
ble
To
tal
Inco
me
Per
Ca
pit
a
20
08
46
1,5
98
,43
2
49
,68
9,1
10
18
,58
2,3
96
-
52
9,8
69
,93
8
6.0
1%
2,4
66
20
09
45
5,1
02
,84
2
47
,96
7,1
62
23
,70
9,7
25
-
52
6,7
79
,72
9
5.9
2%
2,4
12
20
10
58
2,9
62
,27
2
52
,51
3,3
63
22
,09
3,8
60
-
65
7,5
69
,49
5
8.2
0%
2,8
64
20
11
69
3,4
32
,77
0
11
4,4
33
,53
3
18
,83
3,9
44
-
82
6,7
00
,24
7
8.7
7%
3,5
64
20
12
72
0,4
56
,67
6
13
5,2
60
,66
8
16
,97
0,8
43
-
87
2,6
88
,18
7
8.9
7%
3,7
35
20
13
71
6,0
63
,76
0
14
1,5
92
,72
6
21
,46
1,9
77
-
87
9,1
18
,46
3
8.1
9%
3,7
19
20
14
72
3,0
80
,07
0
14
7,6
99
,69
4
20
,13
9,6
70
-
89
0,9
19
,43
4
8.3
0%
3,7
69
20
15
77
1,1
09
,86
6
14
7,3
05
,32
1
19
,70
0,9
74
3,7
50
,00
0
94
1,8
66
,16
1
8.1
8%
3,9
04
20
16
76
7,5
52
,64
2
14
0,8
85
,84
8
23
,44
9,3
16
2,5
00
,00
0
93
4,3
87
,80
6
8.0
9%
3,8
34
20
17
71
0,8
92
,18
5
7,4
28
,71
6
13
2,4
69
,31
1
14
,32
1,3
25
1,2
50
,00
0
86
6,3
61
,53
7
7.3
7%
3,4
31
*
Incl
ud
es H
UD
10
8 D
ebt
**N
ote
: F
Y 2
01
6 h
as b
een
res
tate
d t
o c
orr
ect
an e
rro
r.
CIT
Y O
F L
UB
BO
CK
, T
EX
AS
Ta
ble
J -
Ra
tio
of
Ou
tsta
nd
ing
Deb
t B
y T
yp
e
La
st T
en F
isca
l Y
ears
Go
ver
nm
enta
l Bu
sin
ess-
typ
e
178
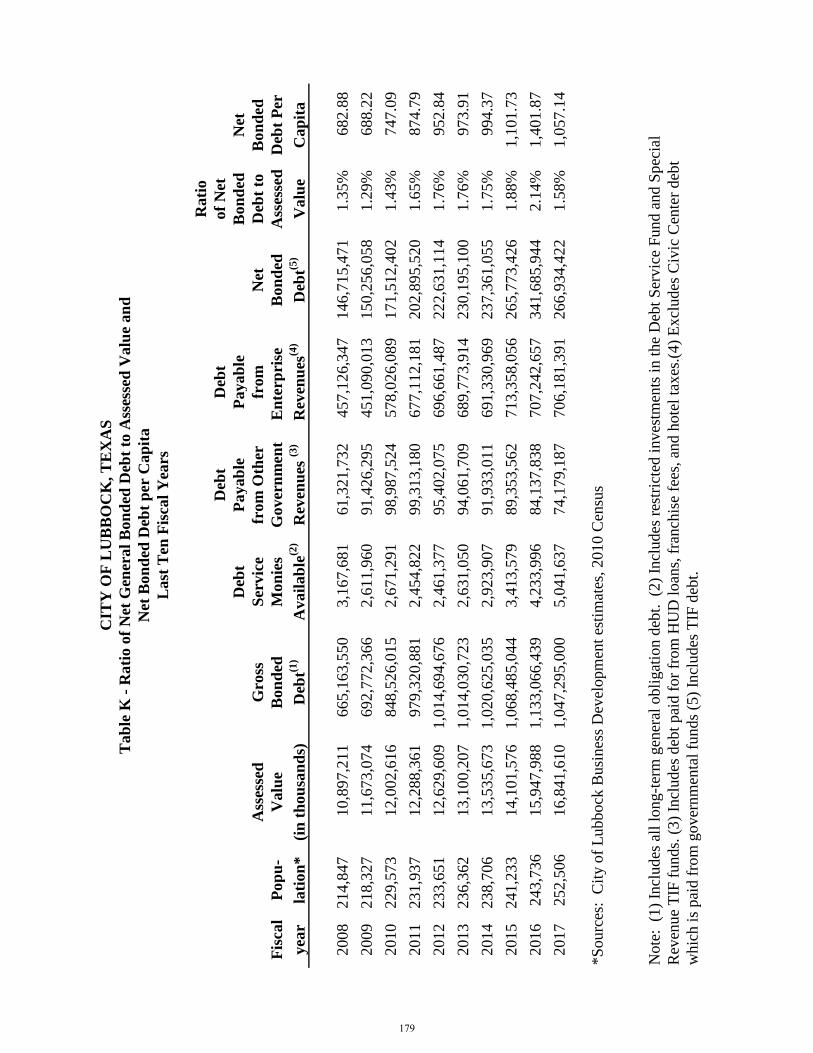
Rati
o
Deb
tD
ebt
of
Net
Deb
tP
ayab
leP
ayab
leB
on
ded
Net
Ass
esse
dG
ross
Ser
vic
efr
om
Oth
erfr
om
Net
Deb
t to
Bon
ded
Fis
cal
Pop
u-
Valu
eB
on
ded
Mon
ies
Gover
nm
ent
En
terp
rise
B
on
ded
Ass
esse
dD
ebt
Per
yea
rla
tio
n*
(in
th
ou
san
ds)
Deb
t(1)
Avail
ab
le(2
)R
even
ues
(3)
Rev
enu
es(4
)D
ebt(5
)V
alu
eC
ap
ita
2008
214,8
47
10,8
97,2
11
665,1
63,5
50
3,1
67,6
81
61,3
21,7
32
457,1
26,3
47
146,7
15,4
71
1.3
5%
682.8
8
2009
218,3
27
11,6
73,0
74
692,7
72,3
66
2,6
11,9
60
91,4
26,2
95
451,0
90,0
13
150,2
56,0
58
1.2
9%
688.2
2
2010
229,5
73
12,0
02,6
16
848,5
26,0
15
2,6
71,2
91
98,9
87,5
24
578,0
26,0
89
171,5
12,4
02
1.4
3%
747.0
9
2011
231,9
37
12,2
88,3
61
979,3
20,8
81
2,4
54,8
22
99,3
13,1
80
677,1
12,1
81
202,8
95,5
20
1.6
5%
874.7
9
2012
233,6
51
12,6
29,6
09
1,0
14,6
94,6
76
2,4
61,3
77
95,4
02,0
75
696,6
61,4
87
222,6
31,1
14
1.7
6%
952.8
4
2013
236,3
62
13,1
00,2
07
1,0
14,0
30,7
23
2,6
31,0
50
94,0
61,7
09
689,7
73,9
14
230,1
95,1
00
1.7
6%
973.9
1
2014
238,7
06
13,5
35,6
73
1,0
20,6
25,0
35
2,9
23,9
07
91,9
33,0
11
691,3
30,9
69
237,3
61,0
55
1.7
5%
994.3
7
2015
241,2
33
14,1
01,5
76
1,0
68,4
85,0
44
3,4
13,5
79
89,3
53,5
62
713,3
58,0
56
265,7
73,4
26
1.8
8%
1,1
01.7
3
2016
243,7
36
15,9
47,9
88
1,1
33,0
66,4
39
4,2
33,9
96
84,1
37,8
38
707,2
42,6
57
341,6
85,9
44
2.1
4%
1,4
01.8
7
2017
252,5
06
16,8
41,6
10
1,0
47,2
95,0
00
5,0
41,6
37
74,1
79,1
87
706,1
81,3
91
266,9
34,4
22
1.5
8%
1,0
57.1
4
*S
ourc
es:
Cit
y o
f L
ubbock
Busi
nes
s D
evel
opm
ent
esti
mat
es, 2010 C
ensu
s
Note
: (
1)
Incl
udes
all
long-t
erm
gen
eral
obli
gat
ion d
ebt.
(2
) In
cludes
res
tric
ted i
nves
tmen
ts i
n t
he
Deb
t S
ervic
e F
und a
nd S
pec
ial
Rev
enue
TIF
funds.
(3)
Incl
udes
deb
t pai
d f
or
from
HU
D l
oan
s, f
ranch
ise
fees
, an
d h
ote
l ta
xes
.(4)
Ex
cludes
Civ
ic C
ente
r deb
t
whic
h i
s p
aid f
rom
gover
nm
enta
l fu
nds
(5)
Incl
udes
TIF
deb
t.
Tab
le K
- R
ati
o o
f N
et G
ener
al
Bon
ded
Deb
t to
Ass
esse
d V
alu
e an
d
Net
Bon
ded
Deb
t p
er C
ap
ita
Last
Ten
Fis
cal
Yea
rs
CIT
Y O
F L
UB
BO
CK
, T
EX
AS
179
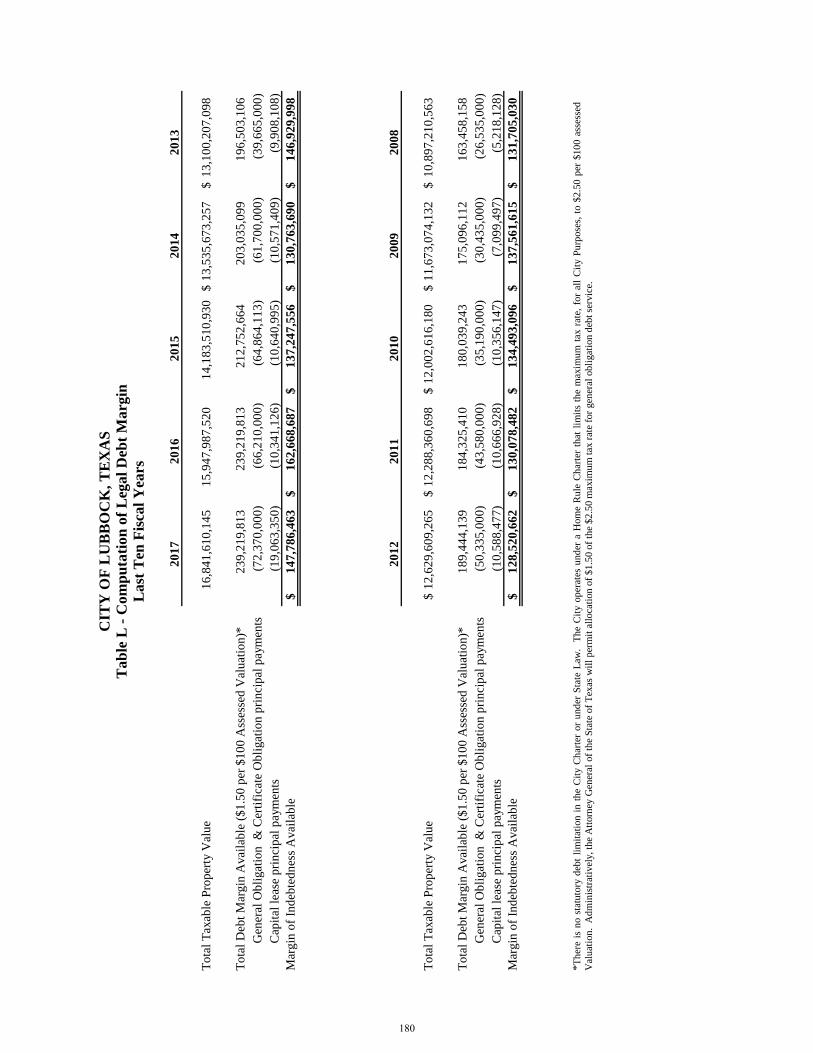
20
17
20
16
20
15
20
14
20
13
To
tal
Tax
able
Pro
per
ty V
alu
e 1
6,8
41
,61
0,1
45
15
,94
7,9
87
,52
01
4,1
83
,51
0,9
30
13
,53
5,6
73
,25
7$
1
3,1
00
,20
7,0
98
$
To
tal
Deb
t M
argin
Avai
lab
le (
$1
.50
per
$1
00
Ass
esse
d V
alu
atio
n)*
23
9,2
19
,81
3
23
9,2
19
,81
3
21
2,7
52
,66
4
20
3,0
35
,09
9
19
6,5
03
,10
6
Gen
eral
Ob
ligat
ion
&
Cer
tifi
cate
Ob
ligat
ion
pri
nci
pal
pay
men
ts(7
2,3
70
,00
0)
(6
6,2
10
,00
0)
(6
4,8
64
,11
3)
(6
1,7
00
,00
0)
(3
9,6
65
,00
0)
Cap
ital
lea
se p
rin
cip
al p
aym
ents
(19
,06
3,3
50
)
(10
,34
1,1
26
)
(10
,64
0,9
95
)
(10
,57
1,4
09
)
(9,9
08
,10
8)
Mar
gin
of
Ind
ebte
dn
ess
Avai
lab
le1
47
,78
6,4
63
$
1
62
,66
8,6
87
$
1
37
,24
7,5
56
$
1
30
,76
3,6
90
$
1
46
,92
9,9
98
$
20
12
20
11
20
10
20
09
20
08
To
tal
Tax
able
Pro
per
ty V
alu
e 1
2,6
29
,60
9,2
65
$
12
,28
8,3
60
,69
8$
1
2,0
02
,61
6,1
80
$
11
,67
3,0
74
,13
2$
1
0,8
97
,21
0,5
63
$
To
tal
Deb
t M
argin
Avai
lab
le (
$1
.50
per
$1
00
Ass
esse
d V
alu
atio
n)*
18
9,4
44
,13
9
18
4,3
25
,41
0
18
0,0
39
,24
3
17
5,0
96
,11
2
16
3,4
58
,15
8
Gen
eral
Ob
ligat
ion
&
Cer
tifi
cate
Ob
ligat
ion
pri
nci
pal
pay
men
ts(5
0,3
35
,00
0)
(4
3,5
80
,00
0)
(3
5,1
90
,00
0)
(3
0,4
35
,00
0)
(2
6,5
35
,00
0)
Cap
ital
lea
se p
rin
cip
al p
aym
ents
(10
,58
8,4
77
)
(10
,66
6,9
28
)
(10
,35
6,1
47
)
(7,0
99
,49
7)
(5,2
18
,12
8)
Mar
gin
of
Ind
ebte
dn
ess
Avai
lab
le1
28
,52
0,6
62
$
1
30
,07
8,4
82
$
1
34
,49
3,0
96
$
1
37
,56
1,6
15
$
1
31
,70
5,0
30
$
CIT
Y O
F L
UB
BO
CK
, T
EX
AS
Ta
ble
L -
Co
mp
uta
tio
n o
f L
ega
l D
ebt
Ma
rgin
La
st T
en F
isca
l Y
ears
*T
her
eis
no
stat
uto
ryd
ebt
lim
itat
ion
inth
eC
ity
Ch
arte
ror
und
erS
tate
Law
.T
he
Cit
yop
erat
esu
nd
era
Hom
eR
ule
Ch
arte
rth
atli
mit
sth
em
axim
um
tax
rate
,fo
ral
lC
ity
Pu
rpose
s,to
$2.5
0p
er$10
0as
sess
ed
Val
uat
ion
.A
dm
inis
trat
ivel
y,th
eA
ttorn
eyG
ener
alof
the
Sta
teof
Tex
asw
ill
per
mit
allo
cati
on
of
$1
.50
of
the
$2
.50
max
imu
mta
xra
tefo
rgen
eral
ob
ligat
ion
deb
tse
rvic
e.
180
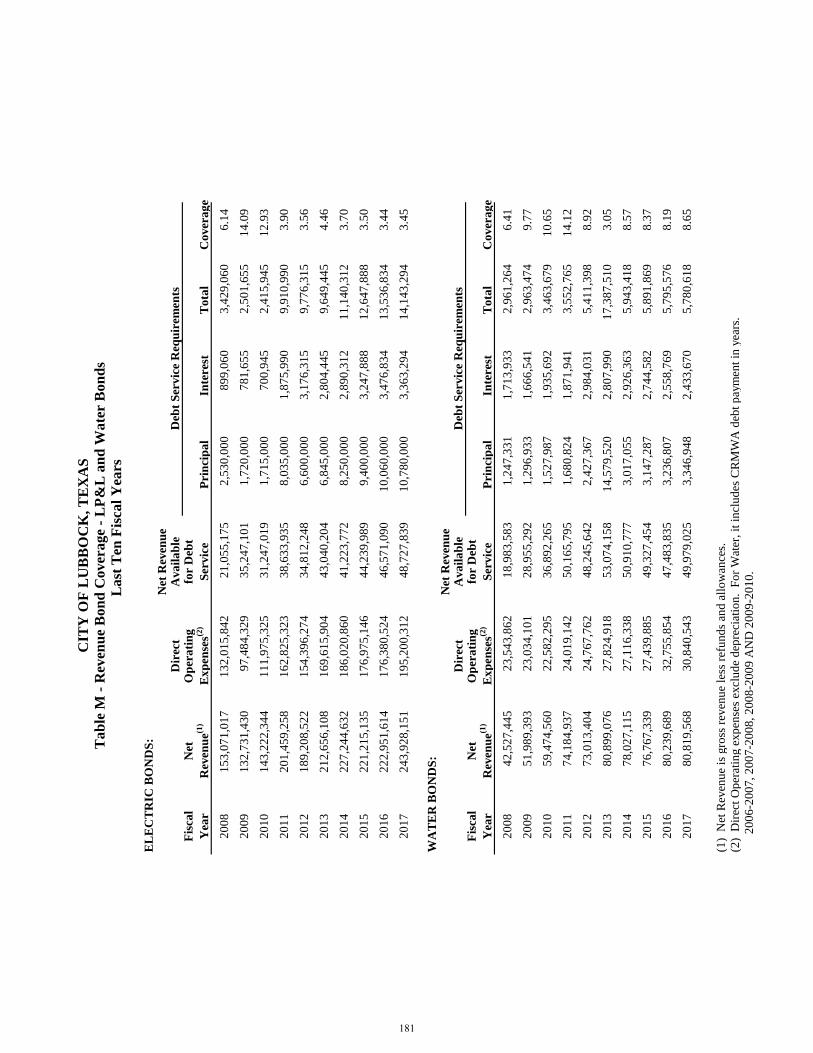
EL
EC
TR
IC B
ON
DS
:N
et R
even
ue
Dir
ect
Ava
ila
ble
Fis
cal
Net
Op
era
tin
gfo
r D
ebt
Yea
rR
even
ue(1
)E
xp
ense
s(2)
Ser
vic
e P
rin
cip
al
I
nte
rest
To
tal
C
over
ag
e
20
08
15
3,0
71
,01
7
13
2,0
15
,84
2
21
,05
5,1
75
2,5
30
,00
0
89
9,0
60
3,4
29
,06
0
6.1
4
20
09
13
2,7
31
,43
0
97
,48
4,3
29
35
,24
7,1
01
1,7
20
,00
0
78
1,6
55
2,5
01
,65
5
14
.09
20
10
14
3,2
22
,34
4
11
1,9
75
,32
5
31
,24
7,0
19
1,7
15
,00
0
70
0,9
45
2,4
15
,94
5
12
.93
20
11
20
1,4
59
,25
8
16
2,8
25
,32
3
38
,63
3,9
35
8,0
35
,00
0
1,8
75
,99
0
9,9
10
,99
0
3.9
0
20
12
18
9,2
08
,52
2
15
4,3
96
,27
4
34
,81
2,2
48
6,6
00
,00
0
3,1
76
,31
5
9,7
76
,31
5
3.5
6
20
13
21
2,6
56
,10
8
16
9,6
15
,90
4
43
,04
0,2
04
6,8
45
,00
0
2,8
04
,44
5
9,6
49
,44
5
4.4
6
20
14
22
7,2
44
,63
2
18
6,0
20
,86
0
41
,22
3,7
72
8,2
50
,00
0
2,8
90
,31
2
11
,14
0,3
12
3.7
0
20
15
22
1,2
15
,13
5
17
6,9
75
,14
6
44
,23
9,9
89
9,4
00
,00
0
3,2
47
,88
8
12
,64
7,8
88
3.5
0
20
16
22
2,9
51
,61
4
17
6,3
80
,52
4
46
,57
1,0
90
10
,06
0,0
00
3,4
76
,83
4
13
,53
6,8
34
3.4
4
20
17
24
3,9
28
,15
1
19
5,2
00
,31
2
48
,72
7,8
39
10
,78
0,0
00
3,3
63
,29
4
14
,14
3,2
94
3.4
5
WA
TE
R B
ON
DS
:N
et R
even
ue
Dir
ect
Ava
ila
ble
Fis
cal
Net
Op
era
tin
gfo
r D
ebt
Yea
rR
even
ue(1
)E
xp
ense
s(2)
Ser
vic
e P
rin
cip
al
I
nte
rest
To
tal
C
over
ag
e
20
08
42
,52
7,4
45
23
,54
3,8
62
18
,98
3,5
83
1,2
47
,33
1
1,7
13
,93
3
2,9
61
,26
4
6.4
1
20
09
51
,98
9,3
93
23
,03
4,1
01
28
,95
5,2
92
1,2
96
,93
3
1,6
66
,54
1
2,9
63
,47
4
9.7
7
20
10
59
,47
4,5
60
22
,58
2,2
95
36
,89
2,2
65
1,5
27
,98
7
1,9
35
,69
2
3,4
63
,67
9
10
.65
20
11
74
,18
4,9
37
24
,01
9,1
42
50
,16
5,7
95
1,6
80
,82
4
1,8
71
,94
1
3,5
52
,76
5
14
.12
20
12
73
,01
3,4
04
24
,76
7,7
62
48
,24
5,6
42
2,4
27
,36
7
2,9
84
,03
1
5,4
11
,39
8
8.9
2
20
13
80
,89
9,0
76
27
,82
4,9
18
53
,07
4,1
58
14
,57
9,5
20
2,8
07
,99
0
17
,38
7,5
10
3.0
5
20
14
78
,02
7,1
15
27
,11
6,3
38
50
,91
0,7
77
3,0
17
,05
5
2,9
26
,36
3
5,9
43
,41
8
8.5
7
20
15
76
,76
7,3
39
27
,43
9,8
85
49
,32
7,4
54
3,1
47
,28
7
2,7
44
,58
2
5,8
91
,86
9
8.3
7
20
16
80
,23
9,6
89
32
,75
5,8
54
47
,48
3,8
35
3,2
36
,80
7
2,5
58
,76
9
5,7
95
,57
6
8.1
9
20
17
80
,81
9,5
68
30
,84
0,5
43
49
,97
9,0
25
3,3
46
,94
8
2,4
33
,67
0
5,7
80
,61
8
8.6
5
(1)
Net
Rev
enu
e is
gro
ss r
even
ue
less
ref
un
ds
and
all
ow
ance
s.
(2)
Dir
ect
Op
erat
ing e
xp
ense
s ex
clu
de
dep
reci
atio
n. F
or
Wat
er, it
in
clu
des
CR
MW
A d
ebt
pay
men
t in
yea
rs.
2
00
6-2
00
7, 2
00
7-2
00
8, 2
00
8-2
00
9 A
ND
20
09
-20
10
.
Deb
t S
ervic
e R
equ
irem
ents
Deb
t S
ervic
e R
equ
irem
ents
CIT
Y O
F L
UB
BO
CK
, T
EX
AS
Ta
ble
M -
Rev
enu
e B
on
d C
over
age
- L
P&
L a
nd
Wate
r B
on
ds
Last
Ten
Fis
cal
Yea
rs
181
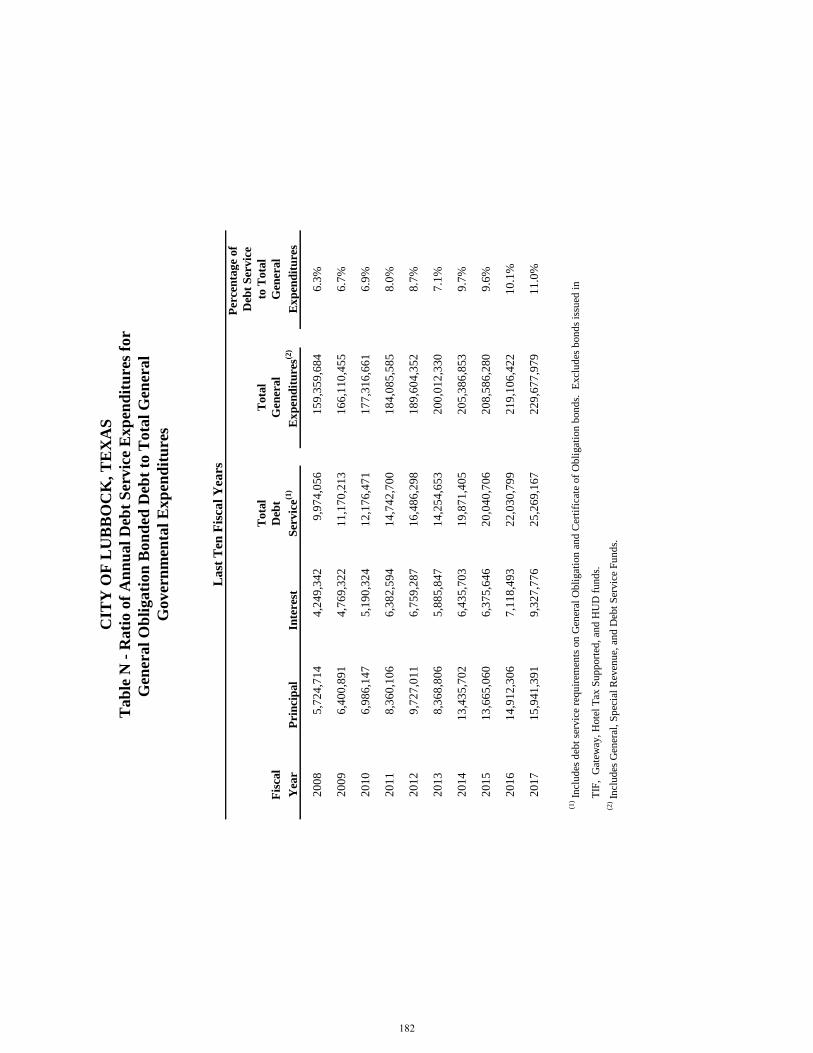
Per
cen
tag
e of
Deb
t S
ervic
e
Tota
lT
ota
lto
Tota
l
Fis
cal
Deb
tG
ener
al
Gen
eral
Yea
rP
rin
cip
al
Inte
rest
Ser
vic
e(1)
Ex
pen
dit
ure
s(2)
Ex
pen
dit
ure
s
20
08
5,7
24
,71
4
4
,24
9,3
42
9
,97
4,0
56
15
9,3
59
,68
4
6.3
%
20
09
6,4
00
,89
1
4
,76
9,3
22
1
1,1
70
,21
3
16
6,1
10
,45
5
6.7
%
20
10
6,9
86
,14
7
5
,19
0,3
24
1
2,1
76
,47
1
17
7,3
16
,66
1
6.9
%
20
11
8,3
60
,10
6
6
,38
2,5
94
1
4,7
42
,70
0
18
4,0
85
,58
5
8.0
%
20
12
9,7
27
,01
1
6
,75
9,2
87
1
6,4
86
,29
8
18
9,6
04
,35
2
8.7
%
20
13
8,3
68
,80
6
5
,88
5,8
47
1
4,2
54
,65
3
20
0,0
12
,33
0
7.1
%
20
14
13
,43
5,7
02
6
,43
5,7
03
1
9,8
71
,40
5
20
5,3
86
,85
3
9.7
%
20
15
13
,66
5,0
60
6
,37
5,6
46
2
0,0
40
,70
6
20
8,5
86
,28
0
9.6
%
20
16
14
,91
2,3
06
7
,11
8,4
93
2
2,0
30
,79
9
21
9,1
06
,42
2
10
.1%
20
17
15
,94
1,3
91
9
,32
7,7
76
2
5,2
69
,16
7
22
9,6
77
,97
9
11
.0%
(1
) In
clu
des
deb
t se
rvic
e re
qu
irem
ents
on
Gen
eral
Ob
ligat
ion
an
d C
erti
fica
te o
f O
bli
gat
ion
bon
ds.
E
xcl
ud
es b
on
ds
issu
ed i
n
T
IF,
Gat
eway
, H
ote
l T
ax S
up
port
ed,
and
HU
D f
un
ds.
(
2) I
ncl
ud
es G
ener
al,
Sp
ecia
l R
even
ue,
an
d D
ebt
Ser
vic
e F
un
ds.
La
st T
en F
isca
l Y
ears
CIT
Y O
F L
UB
BO
CK
, T
EX
AS
Tab
le N
- R
ati
o o
f A
nn
ual
Deb
t S
ervic
e E
xp
end
itu
res
for
Gen
eral
Ob
ligati
on
Bon
ded
Deb
t to
Tota
l G
ener
al
Gover
nm
enta
l E
xp
end
itu
res
182
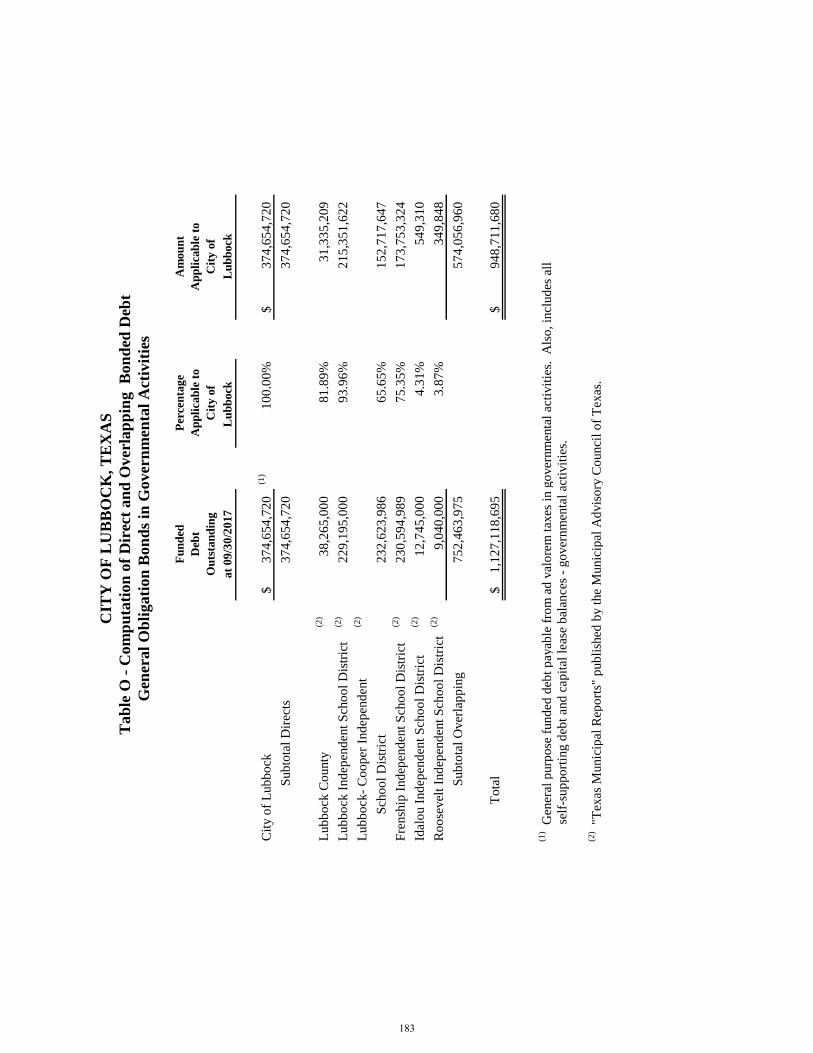
Fu
nd
edP
erce
nta
ge
Am
ou
nt
Deb
tA
pp
lica
ble
to
Ap
pli
cab
le t
o
Ou
tsta
nd
ing
Cit
y o
fC
ity
of
at
09
/30
/20
17
L
ub
bock
Lu
bb
ock
Cit
y o
f L
ub
bo
ck3
74
,65
4,7
20
$
(1
)1
00
.00
%3
74
,65
4,7
20
$
Sub
tota
l D
irec
ts3
74
,65
4,7
20
3
74
,65
4,7
20
Lub
bo
ck C
ounty
(2)
38
,26
5,0
00
81
.89
%3
1,3
35
,20
9
Lub
bo
ck I
nd
epen
den
t S
cho
ol
Dis
tric
t(2
)2
29
,19
5,0
00
9
3.9
6%
21
5,3
51
,62
2
Lub
bo
ck-
Co
op
er I
nd
epen
den
t (2
)
Sch
oo
l D
istr
ict
2
32
,62
3,9
86
6
5.6
5%
15
2,7
17
,64
7
Fre
nsh
ip I
nd
epen
den
t S
cho
ol
Dis
tric
t(2
)2
30
,59
4,9
89
7
5.3
5%
17
3,7
53
,32
4
Idal
ou I
nd
epen
den
t S
cho
ol
Dis
tric
t(2
)1
2,7
45
,00
0
4
.31
%5
49
,31
0
Ro
ose
vel
t In
dep
end
ent
Sch
oo
l D
istr
ict
(2)
9,0
40
,00
0
3.8
7%
34
9,8
48
Sub
tota
l O
ver
lap
pin
g7
52
,46
3,9
75
57
4,0
56
,96
0
T
ota
l1
,12
7,1
18
,69
5$
9
48
,71
1,6
80
$
(1)
Gen
eral
purp
ose
fund
ed d
ebt
pay
able
fro
m a
d v
alo
rem
tax
es i
n g
over
nm
enta
l ac
tivit
ies.
A
lso
, in
clud
es a
ll
sel
f-su
pp
ort
ing d
ebt
and
cap
ital
lea
se b
alan
ces
- go
ver
nm
enta
l ac
tivit
ies.
(2)
"Tex
as M
unic
ipal
Rep
ort
s" p
ub
lish
ed b
y t
he
Munic
ipal
Ad
vis
ory
Co
unci
l o
f T
exas
.
T
ab
le O
- C
om
pu
tati
on
of
Dir
ect
an
d O
ver
lap
pin
g B
on
ded
Deb
t
Gen
eral
Ob
ligati
on
Bon
ds
in G
over
nm
enta
l A
ctiv
itie
s
CIT
Y O
F L
UB
BO
CK
, T
EX
AS
183
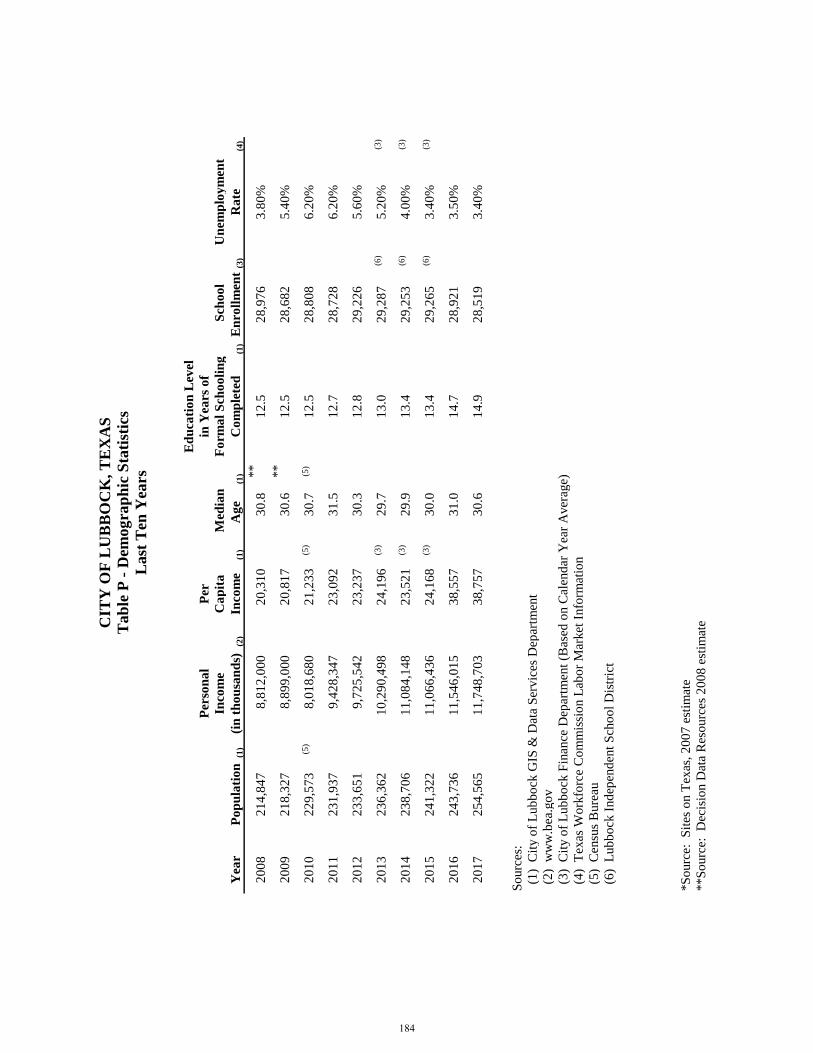
Ed
uca
tio
n L
evel
Per
son
al
Per
in Y
ears
of
Inco
me
Ca
pit
a M
edia
nF
orm
al
Sch
oo
lin
g S
cho
ol
Un
emp
loy
men
t
Yea
rP
op
ula
tio
n(1
)(i
n t
ho
usa
nd
s)(2
)In
com
e(1
)A
ge
(1)
Co
mp
lete
d(1
)E
nro
llm
ent
(3)
Ra
te(4
)
20
08
21
4,8
47
8,8
12
,00
0
2
0,3
10
3
0.8
**
12
.52
8,9
76
3.8
0%
20
09
21
8,3
27
8,8
99
,00
0
2
0,8
17
3
0.6
**
12
.52
8,6
82
5.4
0%
20
10
22
9,5
73
(5)
8,0
18
,68
0
2
1,2
33
(5
)3
0.7
(5
)1
2.5
28
,80
86
.20
%
20
11
23
1,9
37
9,4
28
,34
7
2
3,0
92
3
1.5
1
2.7
28
,72
86
.20
%
20
12
23
3,6
51
9,7
25
,54
2
2
3,2
37
3
0.3
1
2.8
29
,22
65
.60
%
20
13
23
6,3
62
10
,29
0,4
98
2
4,1
96
(3
)2
9.7
1
3.0
29
,28
7(6
)5
.20
%(3
)
20
14
23
8,7
06
11
,08
4,1
48
2
3,5
21
(3
)2
9.9
1
3.4
29
,25
3(6
)4
.00
%(3
)
20
15
24
1,3
22
11
,06
6,4
36
2
4,1
68
(3
)3
0.0
1
3.4
29
,26
5(6
)3
.40
%(3
)
20
16
24
3,7
36
11
,54
6,0
15
3
8,5
57
3
1.0
1
4.7
28
,92
13
.50
%
20
17
25
4,5
65
11
,74
8,7
03
3
8,7
57
3
0.6
1
4.9
28
,51
93
.40
%
So
urc
es:
(1
) C
ity o
f L
ub
bo
ck G
IS &
Dat
a S
ervic
es D
epar
tmen
t
(2
) w
ww
.bea
.go
v
(3
) C
ity o
f L
ub
bo
ck F
inan
ce D
epar
tmen
t (B
ased
on C
alen
dar
Yea
r A
ver
age)
(4
) T
exas
Wo
rkfo
rce
Co
mm
issi
on L
abo
r M
arket
Info
rmat
ion
(5
) C
ensu
s B
ure
au
(6
) L
ub
bo
ck I
nd
epen
den
t S
cho
ol
Dis
tric
t
*S
ourc
e:
Sit
es o
n T
exas
, 2
00
7 e
stim
ate
**S
ourc
e:
Dec
isio
n D
ata
Res
ourc
es 2
00
8 e
stim
ate
Last
Ten
Yea
rs
CIT
Y O
F L
UB
BO
CK
, T
EX
AS
Tab
le P
- D
emogra
ph
ic S
tati
stic
s
184
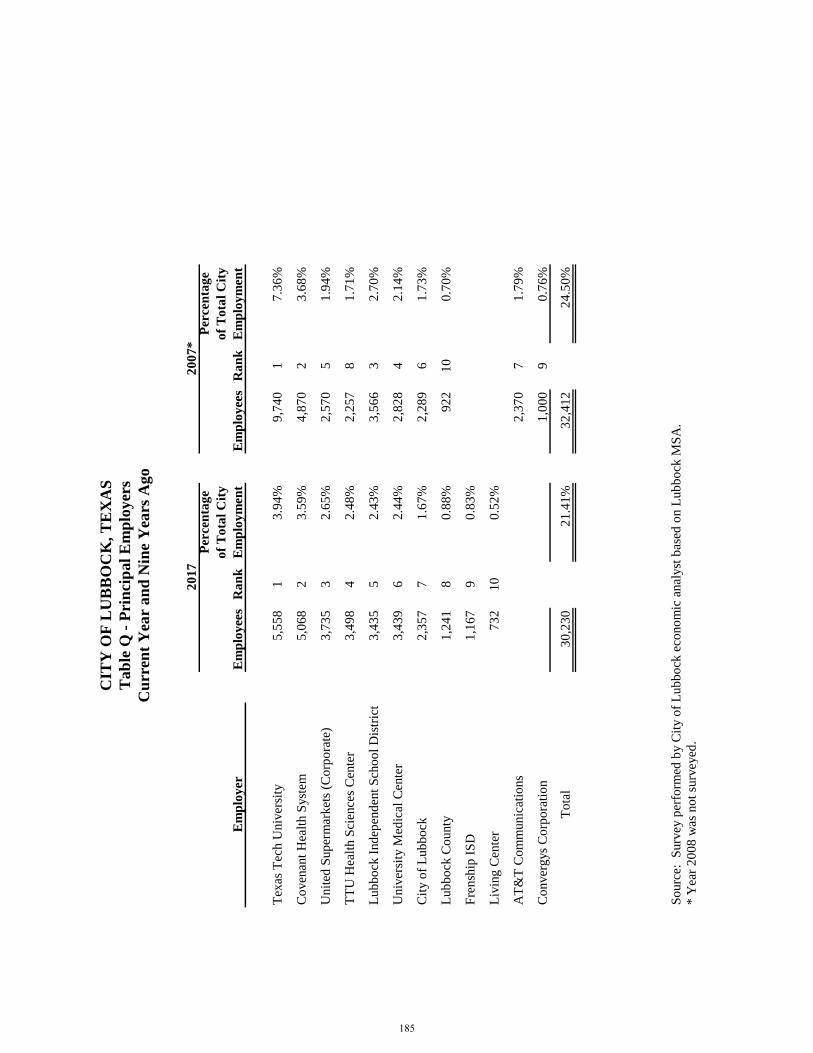
Em
plo
yer
Em
plo
yee
sR
an
k
Per
cen
tag
e
of
To
tal
Cit
y
Em
plo
ym
ent
Em
plo
yee
sR
an
k
Per
cen
tag
e
of
To
tal
Cit
y
Em
plo
ym
ent
Tex
as T
ech U
niv
ersi
ty5
,55
81
3.9
4%
9,7
40
17
.36
%
Co
ven
ant
Hea
lth S
yst
em5
,06
82
3.5
9%
4,8
70
23
.68
%
Unit
ed S
up
erm
arket
s (C
orp
ora
te)
3,7
35
32
.65
%2
,57
05
1.9
4%
TT
U H
ealt
h S
cien
ces
Cen
ter
3,4
98
42
.48
%2
,25
78
1.7
1%
Lub
bo
ck I
nd
epen
den
t S
cho
ol
Dis
tric
t3
,43
55
2.4
3%
3,5
66
32
.70
%
Univ
ersi
ty M
edic
al C
ente
r3
,43
96
2.4
4%
2,8
28
42
.14
%
Cit
y o
f L
ub
bo
ck2
,35
77
1.6
7%
2,2
89
61
.73
%
Lub
bo
ck C
ounty
1,2
41
80
.88
%9
22
10
0.7
0%
Fre
nsh
ip I
SD
1,1
67
90
.83
%
Liv
ing C
ente
r7
32
10
0.5
2%
AT
&T
Co
mm
unic
atio
ns
2,3
70
71
.79
%
Co
nver
gys
Co
rpo
rati
on
1,0
00
90
.76
%
To
tal
30
,23
02
1.4
1%
32
,41
22
4.5
0%
So
urc
e:
Surv
ey p
erfo
rmed
by C
ity o
f L
ub
bo
ck e
cono
mic
anal
yst
bas
ed o
n L
ub
bo
ck M
SA
.
* Y
ear
20
08
was
no
t su
rvey
ed.
20
17
20
07
*
CIT
Y O
F L
UB
BO
CK
, T
EX
AS
Cu
rren
t Y
ear
an
d N
ine
Yea
rs A
go
Tab
le Q
- P
rin
cip
al
Em
plo
yer
s
185
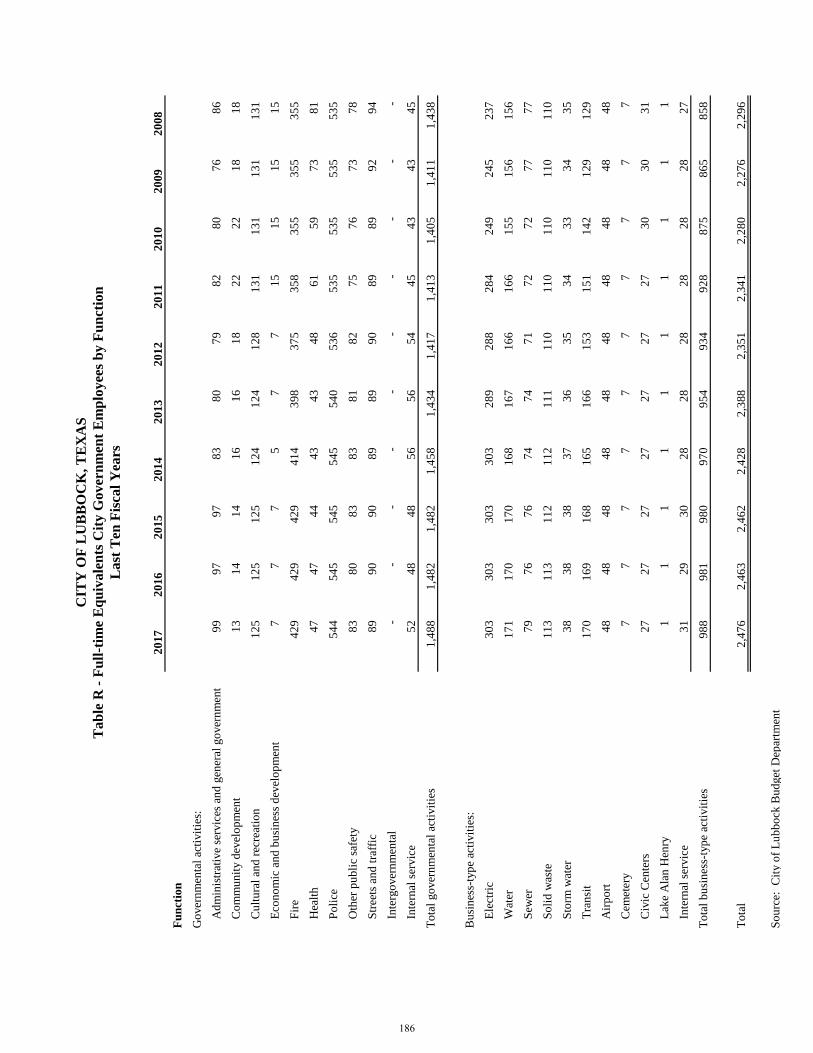
20
17
20
16
20
15
20
14
20
13
20
12
20
11
20
10
20
09
20
08
Fu
nct
ion
Go
ver
nm
enta
l ac
tivit
ies:
A
dm
inis
trat
ive
serv
ices
an
d g
ener
al g
over
nm
ent
99
97
97
83
80
79
82
80
76
86
C
om
mu
nit
y d
evel
op
men
t1
3
1
4
1
4
1
6
1
6
1
8
2
2
2
2
1
8
1
8
C
ult
ura
l an
d r
ecre
atio
n1
25
1
25
1
25
1
24
1
24
1
28
1
31
1
31
1
31
1
31
E
con
om
ic a
nd
bu
sin
ess
dev
elo
pm
ent
7
7
7
5
7
7
15
15
15
15
F
ire
42
9
42
9
42
9
41
4
39
8
37
5
35
8
35
5
35
5
35
5
H
ealt
h4
7
4
7
4
4
4
3
4
3
4
8
6
1
5
9
7
3
8
1
P
oli
ce5
44
5
45
5
45
5
45
5
40
5
36
5
35
5
35
5
35
5
35
O
ther
pu
bli
c sa
fety
83
80
83
83
81
82
75
76
73
78
S
tree
ts a
nd
tra
ffic
89
90
90
89
89
90
89
89
92
94
I
nte
rgo
ver
nm
enta
l-
-
-
-
-
-
-
-
-
-
I
nte
rnal
ser
vic
e5
2
4
8
4
8
5
6
5
6
5
4
4
5
4
3
4
3
4
5
To
tal
go
ver
nm
enta
l ac
tivit
ies
1,4
88
1,4
82
1,4
82
1,4
58
1,4
34
1,4
17
1,4
13
1,4
05
1,4
11
1,4
38
Bu
sin
ess-
typ
e ac
tivit
ies:
E
lect
ric
30
3
30
3
30
3
30
3
28
9
28
8
28
4
24
9
24
5
23
7
W
ater
17
1
17
0
17
0
16
8
16
7
16
6
16
6
15
5
15
6
15
6
S
ewer
79
76
76
74
74
71
72
72
77
77
S
oli
d w
aste
11
3
11
3
11
2
11
2
11
1
11
0
11
0
11
0
11
0
11
0
S
torm
wat
er3
8
3
8
3
8
3
7
3
6
3
5
3
4
3
3
3
4
3
5
T
ran
sit
17
0
16
9
16
8
16
5
16
6
15
3
15
1
14
2
12
9
12
9
A
irp
ort
48
48
48
48
48
48
48
48
48
48
C
emet
ery
7
7
7
7
7
7
7
7
7
7
C
ivic
Cen
ters
27
27
27
27
27
27
27
30
30
31
Lak
e A
lan
Hen
ry1
1
1
1
1
1
1
1
1
1
I
nte
rnal
ser
vic
e3
1
2
9
3
0
2
8
2
8
2
8
2
8
2
8
2
8
2
7
To
tal
bu
sin
ess-
typ
e ac
tivit
ies
98
8
98
1
98
0
97
0
95
4
93
4
92
8
87
5
86
5
85
8
To
tal
2,4
76
2,4
63
2,4
62
2,4
28
2,3
88
2,3
51
2,3
41
2,2
80
2,2
76
2,2
96
So
urc
e:
Cit
y o
f L
ub
bo
ck B
ud
get
Dep
artm
ent
CIT
Y O
F L
UB
BO
CK
, T
EX
AS
Tab
le R
- F
ull
-tim
e E
qu
ivale
nts
Cit
y G
over
nm
ent
Em
plo
yee
s b
y F
un
ctio
n
Last
Ten
Fis
cal
Yea
rs
186
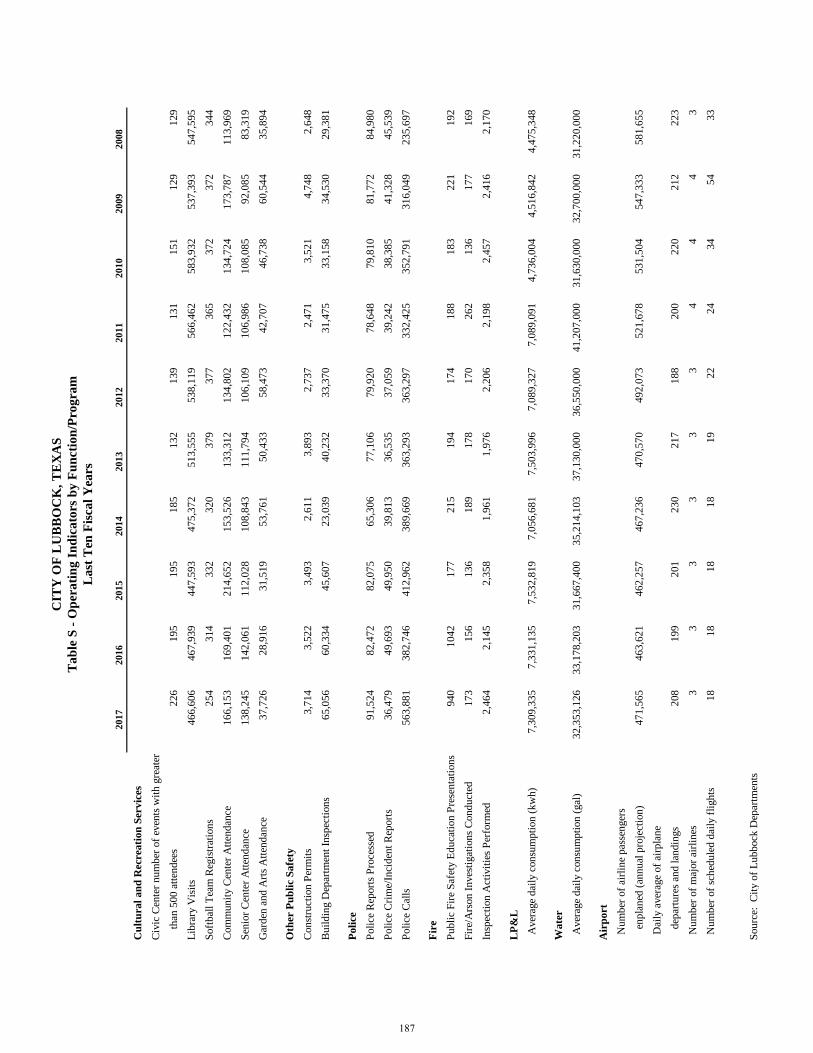
20
17
20
16
20
15
20
14
20
13
20
12
2011
2010
2009
2008
Cu
ltu
ral
an
d R
ecre
ati
on
Ser
vic
es
Civ
ic C
ente
r nu
mb
er o
f ev
ents
wit
h g
reat
er
than
50
0 a
tten
dee
s226
195
195
185
132
139
13
11
51
12
91
29
Lib
rary
Vis
its
46
6,6
06
467,9
39
447,5
93
475,3
72
513,5
55
538,1
19
56
6,4
62
58
3,9
32
53
7,3
93
54
7,5
95
Soft
bal
l T
eam
Reg
istr
atio
ns
254
314
332
320
379
377
36
53
72
37
23
44
Com
mu
nit
y C
ente
r A
tten
dan
ce1
66,1
53
169,4
01
214,6
52
153,5
26
133,3
12
134,8
02
12
2,4
32
13
4,7
24
17
3,7
87
11
3,9
69
Sen
ior
Cen
ter
Att
end
ance
13
8,2
45
142,0
61
112,0
28
108,8
43
111,7
94
106,1
09
10
6,9
86
10
8,0
85
92
,08
58
3,3
19
Gar
den
an
d A
rts
Att
end
ance
37
,726
28,9
16
31,5
19
53,7
61
50,4
33
58,4
73
42
,70
74
6,7
38
60
,54
43
5,8
94
Oth
er P
ub
lic
Sa
fety
Con
stru
ctio
n P
erm
its
3,7
14
3,5
22
3,4
93
2,6
11
3,8
93
2,7
37
2,4
71
3,5
21
4,7
48
2,6
48
Bu
ild
ing D
epar
tmen
t In
spec
tion
s6
5,0
56
60,3
34
45,6
07
23,0
39
40,2
32
33,3
70
31
,47
53
3,1
58
34
,53
02
9,3
81
Po
lice
Poli
ce R
eport
s P
roce
ssed
91
,524
82,4
72
82,0
75
65,3
06
77,1
06
79,9
20
78
,64
87
9,8
10
81
,77
28
4,9
80
Poli
ce C
rim
e/In
cid
ent
Rep
ort
s3
6,4
79
49,6
93
49,9
50
39,8
13
36,5
35
37,0
59
39
,24
23
8,3
85
41
,32
84
5,5
39
Poli
ce C
alls
56
3,8
81
382,7
46
412,9
62
389,6
69
363,2
93
363,2
97
33
2,4
25
35
2,7
91
31
6,0
49
23
5,6
97
Fir
e
Pu
bli
c F
ire
Saf
ety E
du
cati
on
Pre
sen
tati
on
s940
1042
177
215
194
174
18
81
83
22
11
92
Fir
e/A
rson
In
ves
tigat
ion
s C
on
du
cted
173
156
136
189
178
170
26
21
36
17
71
69
Insp
ecti
on
Act
ivit
ies
Per
form
ed2
,464
2,1
45
2,3
58
1,9
61
1,9
76
2,2
06
2,1
98
2,4
57
2,4
16
2,1
70
LP
&L
A
ver
age
dai
ly c
on
sum
pti
on
(k
wh
)7
,30
9,3
35
7,3
31,1
35
7,5
32,8
19
7,0
56,6
81
7,5
03,9
96
7,0
89,3
27
7,0
89
,09
14
,73
6,0
04
4,5
16
,84
24
,47
5,3
48
Wa
ter
A
ver
age
dai
ly c
on
sum
pti
on
(gal
)3
2,3
53
,126
33,1
78,2
03
31,6
67,4
00
35,2
14,1
03
37,1
30,0
00
36,5
50,0
00
41
,20
7,0
00
31
,63
0,0
00
32
,70
0,0
00
31
,22
0,0
00
Air
po
rt
N
um
ber
of
airl
ine
pas
sen
ger
s
enp
lan
ed (
ann
ual
pro
ject
ion
)4
71,5
65
463,6
21
462,2
57
467,2
36
470,5
70
492,0
73
52
1,6
78
53
1,5
04
54
7,3
33
58
1,6
55
D
aily
aver
age
of
airp
lan
e
dep
artu
res
and
lan
din
gs
208
199
201
230
217
188
20
02
20
21
22
23
N
um
ber
of
maj
or
airl
ines
33
33
33
44
43
N
um
ber
of
sch
edu
led
dai
ly f
ligh
ts18
18
18
18
19
22
24
34
54
33
Sou
rce:
C
ity o
f L
ub
bock
Dep
artm
ents
CIT
Y O
F L
UB
BO
CK
, T
EX
AS
Ta
ble
S -
Op
era
tin
g I
nd
ica
tors
by
Fu
nct
ion
/Pro
gra
m
La
st T
en F
isca
l Y
ears
187
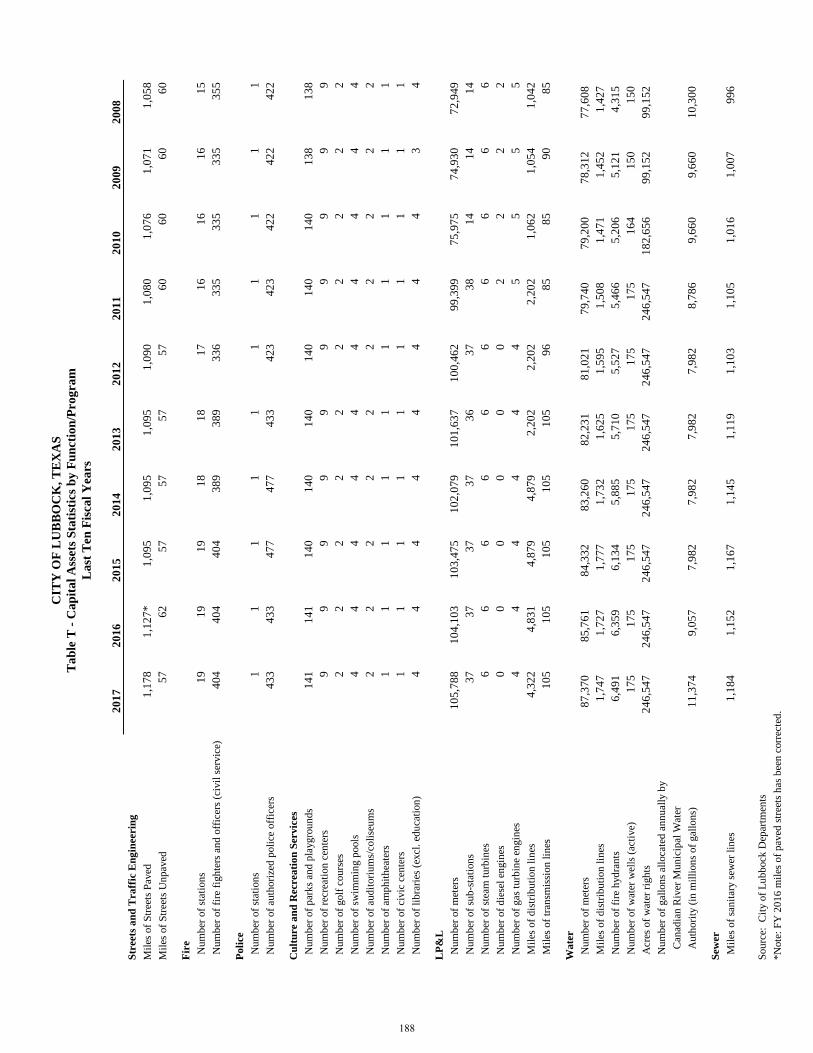
20
17
20
16
20
15
20
14
20
13
20
12
20
11
20
10
20
09
20
08
Str
eets
an
d T
ra
ffic
En
gin
eerin
g
Mil
es o
f S
tree
ts P
aved
1,1
78
1,1
27
*1
,09
51
,09
51
,09
51
,09
01
,08
01
,07
61
,07
11
,05
8
Mil
es o
f S
tree
ts U
np
aved
57
62
57
57
57
57
60
60
60
60
Fir
e
N
um
ber
of
stat
ion
s1
91
91
91
81
81
71
61
61
61
5
N
um
ber
of
fire
fig
hte
rs a
nd
off
icer
s (c
ivil
ser
vic
e)4
04
40
44
04
38
93
89
33
63
35
33
53
35
35
5
Po
lice
N
um
ber
of
stat
ion
s1
11
11
11
11
1
N
um
ber
of
auth
ori
zed
poli
ce o
ffic
ers
43
34
33
47
74
77
43
34
23
42
34
22
42
24
22
Cu
ltu
re a
nd
Recrea
tio
n S
ervic
es
N
um
ber
of
par
ks
and
pla
ygro
un
ds
14
11
41
14
01
40
14
01
40
14
01
40
13
81
38
N
um
ber
of
recr
eati
on
cen
ters
99
99
99
99
99
N
um
ber
of
golf
cou
rses
22
22
22
22
22
N
um
ber
of
swim
min
g p
ools
44
44
44
44
44
N
um
ber
of
aud
itori
um
s/co
lise
um
s2
22
22
22
22
2
N
um
ber
of
amp
hit
hea
ters
11
11
11
11
11
N
um
ber
of
civic
cen
ters
11
11
11
11
11
N
um
ber
of
lib
rari
es (
excl
. ed
uca
tion
)4
44
44
44
43
4
LP
&L
N
um
ber
of
met
ers
10
5,7
88
10
4,1
03
10
3,4
75
10
2,0
79
10
1,6
37
10
0,4
62
99
,39
97
5,9
75
74
,93
07
2,9
49
N
um
ber
of
sub
-sta
tion
s3
73
73
73
73
63
73
81
41
41
4
N
um
ber
of
stea
m t
urb
ines
66
66
66
66
66
N
um
ber
of
die
sel
engin
es0
00
00
02
22
2
N
um
ber
of
gas
tu
rbin
e en
gin
es4
44
44
45
55
5
M
iles
of
dis
trib
uti
on
lin
es4
,32
24
,83
14
,87
94
,87
92
,20
22
,20
22
,20
21
,06
21
,05
41
,04
2
M
iles
of
tran
smis
sion
lin
es1
05
10
51
05
10
51
05
96
85
85
90
85
Wa
ter
N
um
ber
of
met
ers
87
,37
08
5,7
61
84
,33
28
3,2
60
82
,23
18
1,0
21
79
,74
07
9,2
00
78
,31
27
7,6
08
M
iles
of
dis
trib
uti
on
lin
es1
,74
71
,72
71
,77
71
,73
21
,62
51
,59
51
,50
81
,47
11
,45
21
,42
7
N
um
ber
of
fire
hyd
ran
ts6
,49
16
,35
96
,13
45
,88
55
,71
05
,52
75
,46
65
,20
65
,12
14
,31
5
N
um
ber
of
wat
er w
ells
(ac
tive)
17
51
75
17
51
75
17
51
75
17
51
64
15
01
50
A
cres
of
wat
er r
igh
ts2
46
,54
72
46
,54
72
46
,54
72
46
,54
72
46
,54
72
46
,54
72
46
,54
71
82
,65
69
9,1
52
99
,15
2
N
um
ber
of
gal
lon
s al
loca
ted
an
nu
ally
by
Can
adia
n R
iver
Mu
nic
ipal
Wat
er
Au
thori
ty (
in m
illi
on
s of
gal
lon
s)1
1,3
74
9,0
57
7,9
82
7,9
82
7,9
82
7,9
82
8,7
86
9,6
60
9,6
60
10
,30
0
Sew
er
M
iles
of
san
itar
y s
ewer
lin
es1
,18
41
,15
21
,16
71
,14
51
,11
91
,10
31
,10
51
,01
61
,00
79
96
Sou
rce:
C
ity o
f L
ub
bock
Dep
artm
ents
*N
ote
: F
Y 2
01
6 m
iles
of
pav
ed s
tree
ts h
as b
een
corr
ecte
d.
CIT
Y O
F L
UB
BO
CK
, T
EX
AS
Tab
le T
- C
ap
ital
Ass
ets
Sta
tist
ics
by
Fu
ncti
on
/Program
Last
Ten
Fis
cal
Years
188

Com
pliance Section
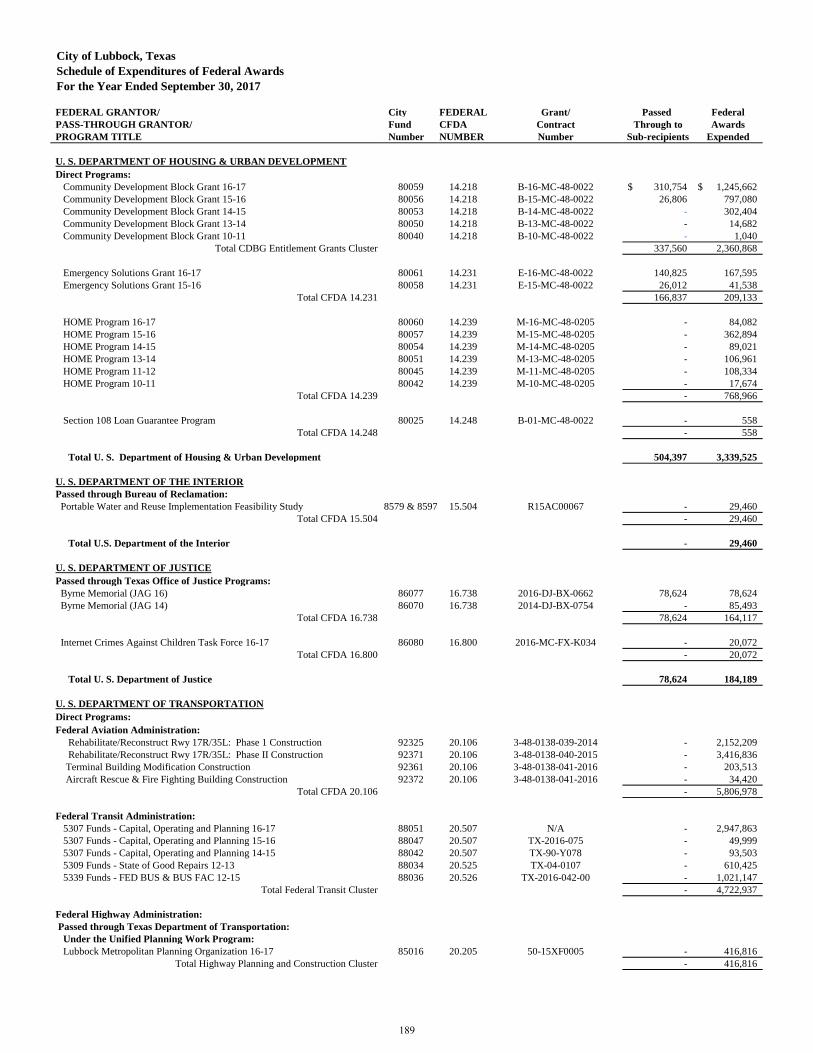
City of Lubbock, Texas
Schedule of Expenditures of Federal Awards
For the Year Ended September 30, 2017
FEDERAL GRANTOR/ City FEDERAL Grant/ Passed Federal
PASS-THROUGH GRANTOR/ Fund CFDA Contract Through to Awards
PROGRAM TITLE Number NUMBER Number Sub-recipients Expended
U. S. DEPARTMENT OF HOUSING & URBAN DEVELOPMENT
Direct Programs:
Community Development Block Grant 16-17 80059 14.218 B-16-MC-48-0022 310,754$ 1,245,662$
Community Development Block Grant 15-16 80056 14.218 B-15-MC-48-0022 26,806 797,080
Community Development Block Grant 14-15 80053 14.218 B-14-MC-48-0022 - 302,404
Community Development Block Grant 13-14 80050 14.218 B-13-MC-48-0022 - 14,682
Community Development Block Grant 10-11 80040 14.218 B-10-MC-48-0022 - 1,040
Total CDBG Entitlement Grants Cluster 337,560 2,360,868
Emergency Solutions Grant 16-17 80061 14.231 E-16-MC-48-0022 140,825 167,595
Emergency Solutions Grant 15-16 80058 14.231 E-15-MC-48-0022 26,012 41,538
Total CFDA 14.231 166,837 209,133
HOME Program 16-17 80060 14.239 M-16-MC-48-0205 - 84,082
HOME Program 15-16 80057 14.239 M-15-MC-48-0205 - 362,894
HOME Program 14-15 80054 14.239 M-14-MC-48-0205 - 89,021
HOME Program 13-14 80051 14.239 M-13-MC-48-0205 - 106,961
HOME Program 11-12 80045 14.239 M-11-MC-48-0205 - 108,334
HOME Program 10-11 80042 14.239 M-10-MC-48-0205 - 17,674
Total CFDA 14.239 - 768,966
Section 108 Loan Guarantee Program 80025 14.248 B-01-MC-48-0022 - 558
Total CFDA 14.248 - 558
Total U. S. Department of Housing & Urban Development 504,397 3,339,525
U. S. DEPARTMENT OF THE INTERIOR
Passed through Bureau of Reclamation:
Portable Water and Reuse Implementation Feasibility Study 8579 & 8597 15.504 R15AC00067 - 29,460
Total CFDA 15.504 - 29,460
Total U.S. Department of the Interior - 29,460
U. S. DEPARTMENT OF JUSTICE
Passed through Texas Office of Justice Programs:
Byrne Memorial (JAG 16) 86077 16.738 2016-DJ-BX-0662 78,624 78,624
Byrne Memorial (JAG 14) 86070 16.738 2014-DJ-BX-0754 - 85,493
Total CFDA 16.738 78,624 164,117
Internet Crimes Against Children Task Force 16-17 86080 16.800 2016-MC-FX-K034 - 20,072
Total CFDA 16.800 - 20,072
Total U. S. Department of Justice 78,624 184,189
U. S. DEPARTMENT OF TRANSPORTATION
Direct Programs:
Federal Aviation Administration:
Rehabilitate/Reconstruct Rwy 17R/35L: Phase 1 Construction 92325 20.106 3-48-0138-039-2014 - 2,152,209
Rehabilitate/Reconstruct Rwy 17R/35L: Phase II Construction 92371 20.106 3-48-0138-040-2015 - 3,416,836
Terminal Building Modification Construction 92361 20.106 3-48-0138-041-2016 - 203,513
Aircraft Rescue & Fire Fighting Building Construction 92372 20.106 3-48-0138-041-2016 - 34,420
Total CFDA 20.106 - 5,806,978
Federal Transit Administration:
5307 Funds - Capital, Operating and Planning 16-17 88051 20.507 N/A - 2,947,863
5307 Funds - Capital, Operating and Planning 15-16 88047 20.507 TX-2016-075 - 49,999
5307 Funds - Capital, Operating and Planning 14-15 88042 20.507 TX-90-Y078 - 93,503
5309 Funds - State of Good Repairs 12-13 88034 20.525 TX-04-0107 - 610,425
5339 Funds - FED BUS & BUS FAC 12-15 88036 20.526 TX-2016-042-00 - 1,021,147
Total Federal Transit Cluster - 4,722,937
Federal Highway Administration:
Passed through Texas Department of Transportation:
Under the Unified Planning Work Program:
Lubbock Metropolitan Planning Organization 16-17 85016 20.205 50-15XF0005 - 416,816
Total Highway Planning and Construction Cluster - 416,816
189
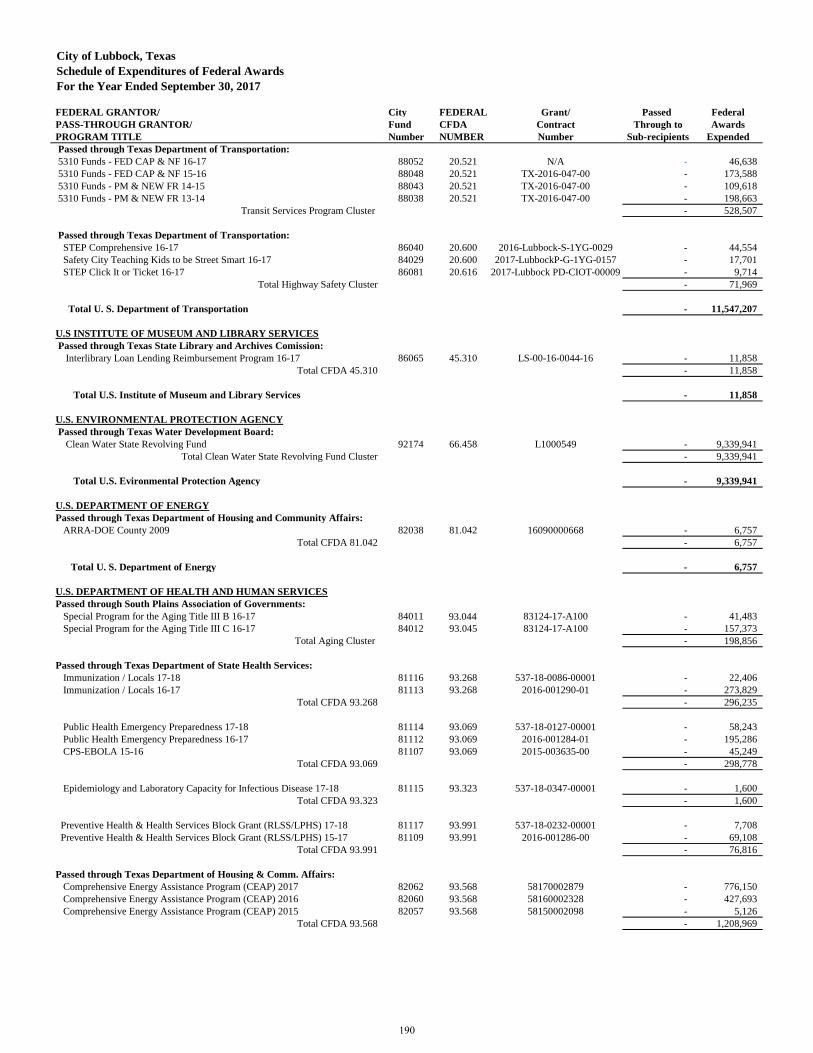
City of Lubbock, Texas
Schedule of Expenditures of Federal Awards
For the Year Ended September 30, 2017
FEDERAL GRANTOR/ City FEDERAL Grant/ Passed Federal
PASS-THROUGH GRANTOR/ Fund CFDA Contract Through to Awards
PROGRAM TITLE Number NUMBER Number Sub-recipients Expended
Passed through Texas Department of Transportation:
5310 Funds - FED CAP & NF 16-17 88052 20.521 N/A - 46,638
5310 Funds - FED CAP & NF 15-16 88048 20.521 TX-2016-047-00 - 173,588
5310 Funds - PM & NEW FR 14-15 88043 20.521 TX-2016-047-00 - 109,618
5310 Funds - PM & NEW FR 13-14 88038 20.521 TX-2016-047-00 - 198,663
Transit Services Program Cluster - 528,507
Passed through Texas Department of Transportation:
STEP Comprehensive 16-17 86040 20.600 2016-Lubbock-S-1YG-0029 - 44,554
Safety City Teaching Kids to be Street Smart 16-17 84029 20.600 2017-LubbockP-G-1YG-0157 - 17,701
STEP Click It or Ticket 16-17 86081 20.616 2017-Lubbock PD-CIOT-00009 - 9,714
Total Highway Safety Cluster - 71,969
Total U. S. Department of Transportation - 11,547,207
U.S INSTITUTE OF MUSEUM AND LIBRARY SERVICES
Passed through Texas State Library and Archives Comission:
Interlibrary Loan Lending Reimbursement Program 16-17 86065 45.310 LS-00-16-0044-16 - 11,858
Total CFDA 45.310 - 11,858
Total U.S. Institute of Museum and Library Services - 11,858
U.S. ENVIRONMENTAL PROTECTION AGENCY
Passed through Texas Water Development Board:
Clean Water State Revolving Fund 92174 66.458 L1000549 - 9,339,941
Total Clean Water State Revolving Fund Cluster - 9,339,941
Total U.S. Evironmental Protection Agency - 9,339,941
U.S. DEPARTMENT OF ENERGY
Passed through Texas Department of Housing and Community Affairs:
ARRA-DOE County 2009 82038 81.042 16090000668 - 6,757
Total CFDA 81.042 - 6,757
Total U. S. Department of Energy - 6,757
U.S. DEPARTMENT OF HEALTH AND HUMAN SERVICES
Passed through South Plains Association of Governments:
Special Program for the Aging Title III B 16-17 84011 93.044 83124-17-A100 - 41,483
Special Program for the Aging Title III C 16-17 84012 93.045 83124-17-A100 - 157,373
Total Aging Cluster - 198,856
Passed through Texas Department of State Health Services:
Immunization / Locals 17-18 81116 93.268 537-18-0086-00001 - 22,406
Immunization / Locals 16-17 81113 93.268 2016-001290-01 - 273,829
Total CFDA 93.268 - 296,235
Public Health Emergency Preparedness 17-18 81114 93.069 537-18-0127-00001 - 58,243
Public Health Emergency Preparedness 16-17 81112 93.069 2016-001284-01 - 195,286
CPS-EBOLA 15-16 81107 93.069 2015-003635-00 - 45,249
Total CFDA 93.069 - 298,778
Epidemiology and Laboratory Capacity for Infectious Disease 17-18 81115 93.323 537-18-0347-00001 - 1,600
Total CFDA 93.323 - 1,600
Preventive Health & Health Services Block Grant (RLSS/LPHS) 17-18 81117 93.991 537-18-0232-00001 - 7,708
Preventive Health & Health Services Block Grant (RLSS/LPHS) 15-17 81109 93.991 2016-001286-00 - 69,108
Total CFDA 93.991 - 76,816
Passed through Texas Department of Housing & Comm. Affairs:
Comprehensive Energy Assistance Program (CEAP) 2017 82062 93.568 58170002879 - 776,150
Comprehensive Energy Assistance Program (CEAP) 2016 82060 93.568 58160002328 - 427,693
Comprehensive Energy Assistance Program (CEAP) 2015 82057 93.568 58150002098 - 5,126
Total CFDA 93.568 - 1,208,969
190
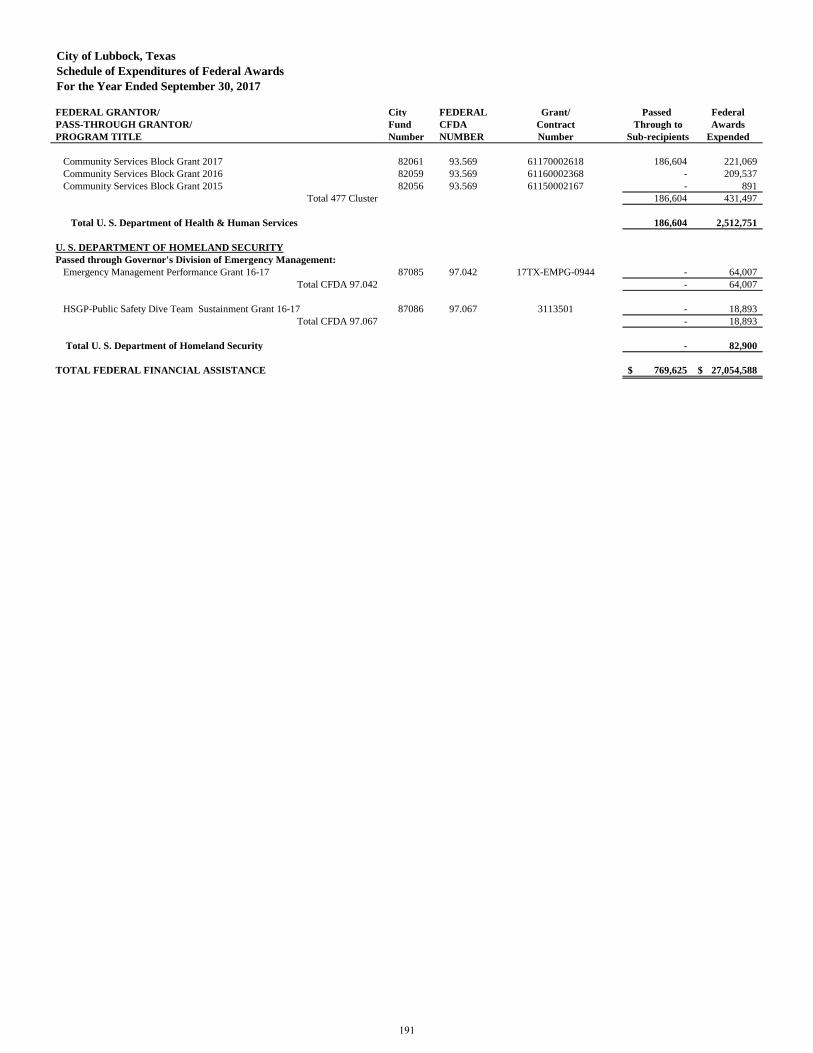
City of Lubbock, Texas
Schedule of Expenditures of Federal Awards
For the Year Ended September 30, 2017
FEDERAL GRANTOR/ City FEDERAL Grant/ Passed Federal
PASS-THROUGH GRANTOR/ Fund CFDA Contract Through to Awards
PROGRAM TITLE Number NUMBER Number Sub-recipients Expended
Community Services Block Grant 2017 82061 93.569 61170002618 186,604 221,069
Community Services Block Grant 2016 82059 93.569 61160002368 - 209,537
Community Services Block Grant 2015 82056 93.569 61150002167 - 891
Total 477 Cluster 186,604 431,497
Total U. S. Department of Health & Human Services 186,604 2,512,751
U. S. DEPARTMENT OF HOMELAND SECURITY
Passed through Governor's Division of Emergency Management:
Emergency Management Performance Grant 16-17 87085 97.042 17TX-EMPG-0944 - 64,007
Total CFDA 97.042 - 64,007
HSGP-Public Safety Dive Team Sustainment Grant 16-17 87086 97.067 3113501 - 18,893
Total CFDA 97.067 - 18,893
Total U. S. Department of Homeland Security - 82,900
TOTAL FEDERAL FINANCIAL ASSISTANCE 769,625$ 27,054,588$
191
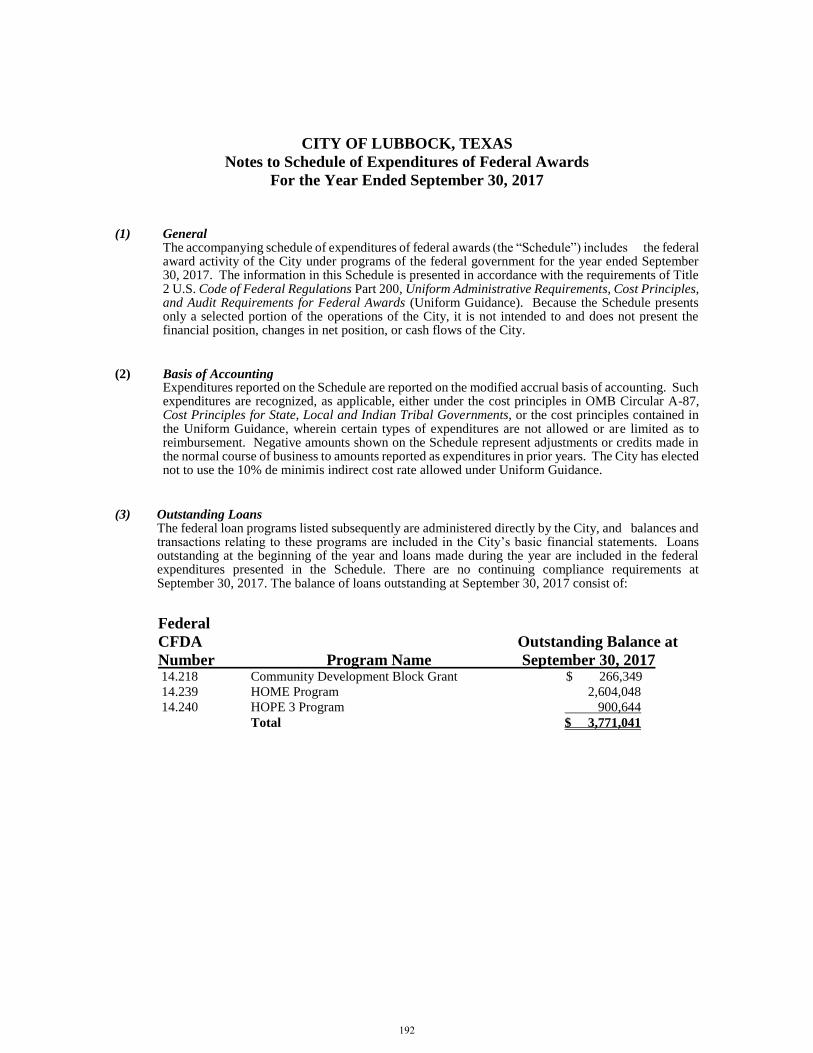
CITY OF LUBBOCK, TEXAS
Notes to Schedule of Expenditures of Federal Awards
For the Year Ended September 30, 2017
(1) General
The accompanying schedule of expenditures of federal awards (the “Schedule”) includes the federal award activity of the City under programs of the federal government for the year ended September 30, 2017. The information in this Schedule is presented in accordance with the requirements of Title 2 U.S. Code of Federal Regulations Part 200, Uniform Administrative Requirements, Cost Principles, and Audit Requirements for Federal Awards (Uniform Guidance). Because the Schedule presents only a selected portion of the operations of the City, it is not intended to and does not present the financial position, changes in net position, or cash flows of the City.
(2) Basis of Accounting Expenditures reported on the Schedule are reported on the modified accrual basis of accounting. Such expenditures are recognized, as applicable, either under the cost principles in OMB Circular A-87, Cost Principles for State, Local and Indian Tribal Governments, or the cost principles contained in the Uniform Guidance, wherein certain types of expenditures are not allowed or are limited as to reimbursement. Negative amounts shown on the Schedule represent adjustments or credits made in the normal course of business to amounts reported as expenditures in prior years. The City has elected not to use the 10% de minimis indirect cost rate allowed under Uniform Guidance.
(3) Outstanding Loans The federal loan programs listed subsequently are administered directly by the City, and balances and transactions relating to these programs are included in the City’s basic financial statements. Loans outstanding at the beginning of the year and loans made during the year are included in the federal expenditures presented in the Schedule. There are no continuing compliance requirements at September 30, 2017. The balance of loans outstanding at September 30, 2017 consist of:
Federal
CFDA Outstanding Balance at
Number Program Name September 30, 2017 14.218 Community Development Block Grant $ 266,349
14.239 HOME Program 2,604,048
14.240 HOPE 3 Program 900,644
Total $ 3,771,041
192
Independent Auditor’s Report on Internal Control Over Financial Reporting and on Compliance and Other Matters Based on an
Audit of the Financial Statements Performed in Accordance with Government Auditing Standards
The Honorable Mayor and Members of the City Council City of Lubbock, Texas We have audited, in accordance with auditing standards generally accepted in the United States of America and the standards applicable to financial audits contained in Government Auditing Standards, issued by the Comptroller General of the United States, the financial statements of the governmental activities, the business-type activities, the aggregate discretely presented component units, each major fund and the aggregate remaining fund information of the City of Lubbock, Texas (City) as of and for the year ended September 30, 2017, which collectively comprise its basic financial statements and have issued our report thereon dated February 7, 2018. Our report includes a reference to other auditors who audited the financial statements of Civic Lubbock, Inc., Market Lubbock Economic Development Corporation d/b/a Market Lubbock, Inc. and Lubbock Economic Development Alliance, as described in our report on the City’s financial statements. This report does not include the results of the other auditors’ testing of internal control over financial reporting or compliance and other matters that are reported on separately by those auditors. The financial statements of Civic Lubbock, Inc., a component unit included in the financial statements of the aggregate discretely presented component units, and West Texas Municipal Power Agency, a blended component unit reported as a major fund, which are included in the City’s financial statements, were not audited in accordance with Government Auditing Standards.
Internal Control over Financial Reporting
Management of the City is responsible for establishing and maintaining effective internal control over financial reporting (internal control). In planning and performing our audit of the financial statements, we considered the City’s internal control to determine the audit procedures that are appropriate in the circumstances for the purpose of expressing our opinions on the financial statements, but not for the purpose of expressing an opinion on the effectiveness of the City’s internal control. Accordingly, we do not express an opinion on the effectiveness of the City’s internal control.
A deficiency in internal control exists when the design or operation of a control does not allow management or employees, in the normal course of performing their assigned functions, to prevent or detect and correct misstatements on a timely basis. A material weakness is a deficiency, or a combination of deficiencies, in internal control such that there is a reasonable possibility that a material misstatement of the City’s financial statements will not be prevented or detected and corrected on a timely basis. A significant deficiency is a deficiency, or a combination of deficiencies, in internal control that is less severe than a material weakness, yet important enough to merit attention by those charged with governance.
193
The Honorable Mayor and Members of the City Council City of Lubbock, Texas
Our consideration of internal control was for the limited purpose described in the first paragraph of this section and was not designed to identify all deficiencies in internal control that might be material weaknesses or significant deficiencies. Given these limitations, during our audit we did not identify any deficiencies in internal control that we consider to be material weaknesses. However, material weaknesses may exist that have not been identified.
Compliance
As part of obtaining reasonable assurance about whether the City’s financial statements are free of material misstatement, we performed tests of its compliance with certain provisions of laws, regulations, contracts and grant agreements, noncompliance with which could have a direct and material effect on the determination of financial statement amounts. However, providing an opinion on compliance with those provisions was not an objective of our audit and, accordingly, we do not express such an opinion. The results of our tests disclosed no instances of noncompliance or other matters that are required to be reported under Government Auditing Standards.
Purpose of this Report
The purpose of this report is solely to describe the scope of our testing of internal control and compliance and the results of that testing, and not to provide an opinion on the effectiveness of the City’s internal control or on compliance. This report is an integral part of an audit performed in accordance with Government Auditing Standards in considering the City’s internal control and compliance. Accordingly, this communication is not suitable for any other purpose.
Dallas, Texas February 7, 2018
194
Report on Compliance for Each Major Federal Program and Report on Internal Control Over Compliance
Independent Auditor’s Report
The Honorable Mayor and Members of the City Council City of Lubbock, Texas Report on Compliance for Each Major Federal Program
We have audited the City of Lubbock, Texas’ (City) compliance with the types of compliance requirements described in the OMB Compliance Supplement that could have a direct and material effect on each of the City’s major federal programs for the year ended September 30, 2017. The City’s major federal programs are identified in the summary of auditor’s results section of the accompanying schedule of findings and questioned costs.
Management’s Responsibility
Management is responsible for compliance with federal statutes, regulations, contracts and the terms and conditions of its federal awards applicable to its federal programs.
Auditor’s Responsibility
Our responsibility is to express an opinion on compliance for each of the City’s major federal programs based on our audits of the types of compliance requirements referred to above. We conducted our audit of compliance in accordance with auditing standards generally accepted in the United States of America; the standards applicable to financial audits contained in Government Auditing Standards, issued by the Comptroller General of the United States; and the audit requirements of Title 2 U.S. Code of Federal Regulations Part 200, Uniform Administrative Requirements, Cost Principles, and Audit Requirements for Federal Awards (Uniform Guidance). Those standards and the Uniform Guidance require that we plan and perform the audit to obtain reasonable assurance about whether noncompliance with the types of compliance requirements referred to above that could have a direct and material effect on a major federal program occurred. An audit includes examining, on a test basis, evidence about the City’s compliance with those requirements and performing such other procedures as we considered necessary in the circumstances.
We believe that our audit provides a reasonable basis for our opinion on compliance for each major federal program. However, our audit does not provide a legal determination of the City’s compliance.
195
The Honorable Mayor and Members of the City Council City of Lubbock, Texas
Opinion on Each Major Federal Program
In our opinion, the City of Lubbock, Texas complied, in all material respects, with the types of compliance requirements referred to above that could have a direct and material effect on each of its major federal programs for the year ended September 30, 2017.
Report on Internal Control Over Compliance
Management of the City of Lubbock, Texas is responsible for establishing and maintaining effective internal control over compliance with the types of compliance requirements referred to above. In planning and performing our audit of compliance, we considered the City’s internal control over compliance with the types of requirements that could have a direct and material effect on each major federal program to determine the auditing procedures that are appropriate in the circumstances for the purpose of expressing our opinion on compliance for each major federal program and to test and report on internal control over compliance in accordance with the Uniform Guidance, but not for the purpose of expressing an opinion on the effectiveness of internal control over compliance. Accordingly, we do not express an opinion on the effectiveness of the City’s internal control over compliance.
A deficiency in internal control over compliance exists when the design or operation of a control over compliance does not allow management or employees, in the normal course of performing their assigned functions, to prevent, or detect and correct, noncompliance with a type of compliance requirement of a federal program on a timely basis. A material weakness in internal control over compliance is a deficiency, or combination of deficiencies, in internal control over compliance such that there is a reasonable possibility that material noncompliance with a type of compliance requirement of a federal program will not be prevented, or detected and corrected, on a timely basis. A significant deficiency in internal control over compliance is a deficiency, or combination of deficiencies, in internal control over compliance with a type of compliance requirement of a federal program that is less severe than a material weakness in internal control over compliance, yet important enough to merit attention by those charged with governance.
Our consideration of internal control over compliance was for the limited purpose described in the first paragraph of this section and was not designed to identify all deficiencies in internal control over compliance that might be material weaknesses of significant deficiencies. We did not identify any deficiencies in internal control over compliance that we consider to be material weaknesses. However, material weaknesses may exist that have not been identified.
The purpose of this report on internal control over compliance is solely to describe the scope of our testing of internal control over compliance and the results of that testing based on the requirements of Uniform Guidance. Accordingly, this report is not suitable for any other purpose.
Dallas, Texas February 7, 2018
196
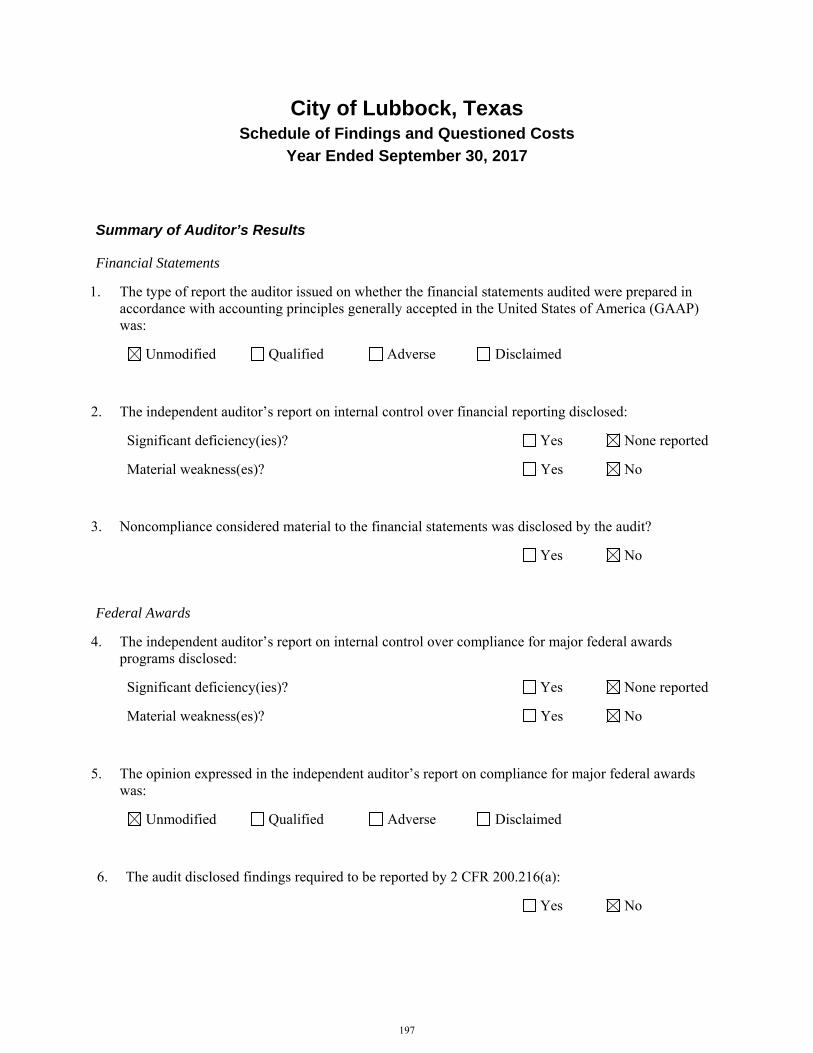
City of Lubbock, Texas Schedule of Findings and Questioned Costs
Year Ended September 30, 2017
Summary of Auditor’s Results
Financial Statements
1. The type of report the auditor issued on whether the financial statements audited were prepared in accordance with accounting principles generally accepted in the United States of America (GAAP) was:
Unmodified Qualified Adverse Disclaimed
2. The independent auditor’s report on internal control over financial reporting disclosed:
Significant deficiency(ies)? Yes None reported
Material weakness(es)? Yes No
3. Noncompliance considered material to the financial statements was disclosed by the audit?
Yes No
Federal Awards
4. The independent auditor’s report on internal control over compliance for major federal awards programs disclosed:
Significant deficiency(ies)? Yes None reported
Material weakness(es)? Yes No
5. The opinion expressed in the independent auditor’s report on compliance for major federal awards was:
Unmodified Qualified Adverse Disclaimed
6. The audit disclosed findings required to be reported by 2 CFR 200.216(a):
Yes No
197
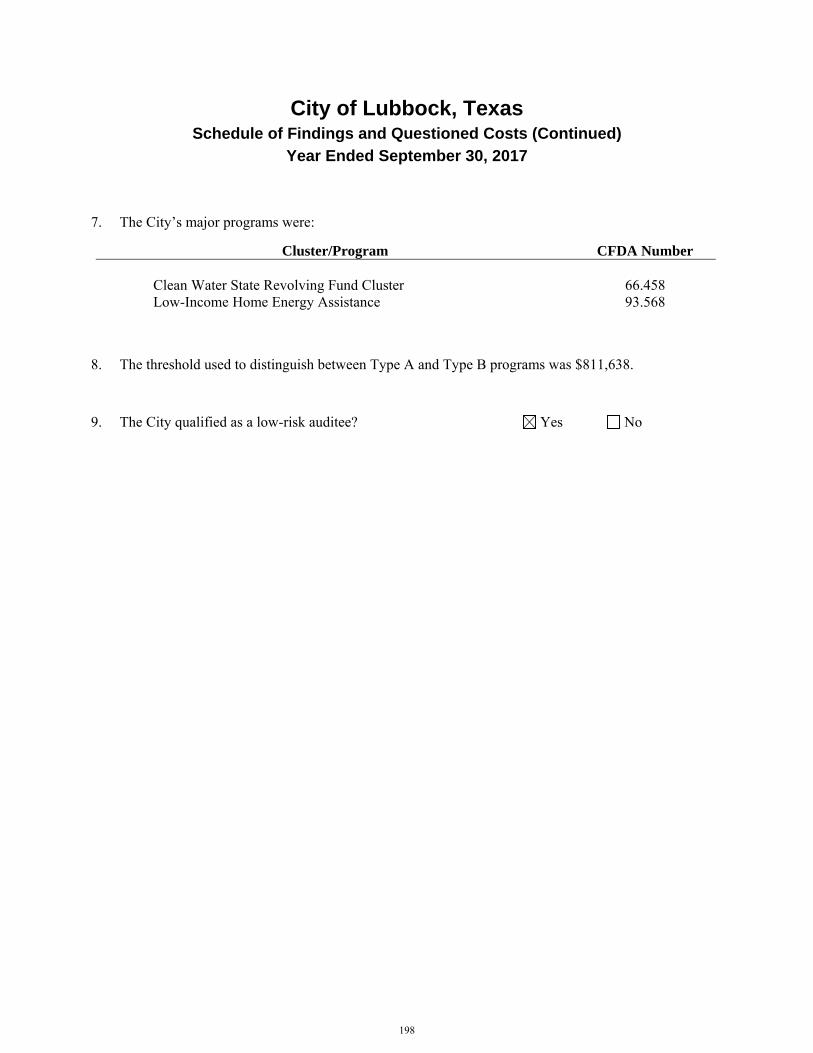
City of Lubbock, Texas Schedule of Findings and Questioned Costs (Continued)
Year Ended September 30, 2017
7. The City’s major programs were:
Cluster/Program CFDA Number Clean Water State Revolving Fund Cluster Low-Income Home Energy Assistance
66.458 93.568
8. The threshold used to distinguish between Type A and Type B programs was $811,638.
9. The City qualified as a low-risk auditee?
Yes No
198
City of Lubbock, Texas Schedule of Findings and Questioned Costs (Continued)
Year Ended September 30, 2017
Findings Required to be Reported by Government Auditing Standards
Reference Number Summary of Finding
No matters are reportable.
Findings Required to be Reported by the Uniform Guidance
Reference Number Summary of Finding
No matters are reportable.
199
City of Lubbock, Texas Summary Schedule of Prior Audit Findings
Year Ended September 30, 2017
Reference Number Summary of Finding Status
No matters are reportable.
200

P. O. Box 2000 1625 13th Street Lubbock, TX 79457 (806) 775-2000 www.mylubbock.us Citizen Call Center: 3-1-1
� � �
�
LubbockCity of