Embed Size (px)
Citation preview

1
Lubricant Market Report 2015
Lubricant Market
Report 2015
Public Utilities Commission of Sri Lanka
Shadow Regulator - of the Lubricant Market

2 Lubricant Market Report 2015
As the shadow regulator of the lubricant market,
Public Utilities Commission of Sri Lanka,
Collects and records operational information of the lubricant
market.
This report provides an
Overview of lubricant market
and
Summarizes the operational information.

3 Lubricant Market Report 2015
Contents
1. Role of PUCSL as the Shadow Regulator ...............................................................................................4
2. Authorized Parties/Brands ....................................................................................................................5
3. Sales and Market Share .........................................................................................................................6
5. Imports ............................................................................................................................................... 14
6. Exports ................................................................................................................................................ 15
7. Production .......................................................................................................................................... 15
8. Lubricant Sales Trend ......................................................................................................................... 16
9. Lubricant Standards ............................................................................................................................ 17
10. Government Revenue .................................................................................................................... 17
List of Figures
Figure 1: Lubricant Sales (kL) by Company ....................................................................................................8
Figure 2 : Lubricant Sales Revenue (LKR Million) by Company .....................................................................9
Figure 3 : Lubricant Sales Share (Quantity-kL) - 2015 ................................................................................ 10
Figure 4 : Yearly lubricant Sales (Quantity-kL) of each type ...................................................................... 10
Figure 5 : Lubricant Sales (Revenue) share - 2015 ..................................................................................... 11
Figure 6 : Automotive Lubricant Sales (Quantity) Breakdown ................................................................... 12
Figure 7 : Automotive Lubricant Sales (Revenue) Breakdown ................................................................... 12
Figure 8 ; Synthetic Sales - Quantities (KL) ................................................................................................. 13
Figure 9 : Synthetic Sales - Revenue (LKR Million) ..................................................................................... 13
Figure 10 : Lubricant Imports (FP)-2015 ..................................................................................................... 14
Figure 11 : Lubricant Imports (FP) - Year 2015 ........................................................................................... 14
Figure 12 : Lubricant (Finished Products) Imports ..................................................................................... 15
Figure 13 : Sale Quantity Trend .................................................................................................................. 16
List of Tables
Table 1 : List of authorized parties/brands and activities in Sri Lankan Lubricant Market ...........................5
Table 2 : Total Sales History ..........................................................................................................................6
Table 3 : Sales and the Market Share ............................................................................................................6
Table 4: Total base oil and additives .......................................................................................................... 15
Table 5 : Lubricant Standards ..................................................................................................................... 17
4 Lubricant Market Report 2015
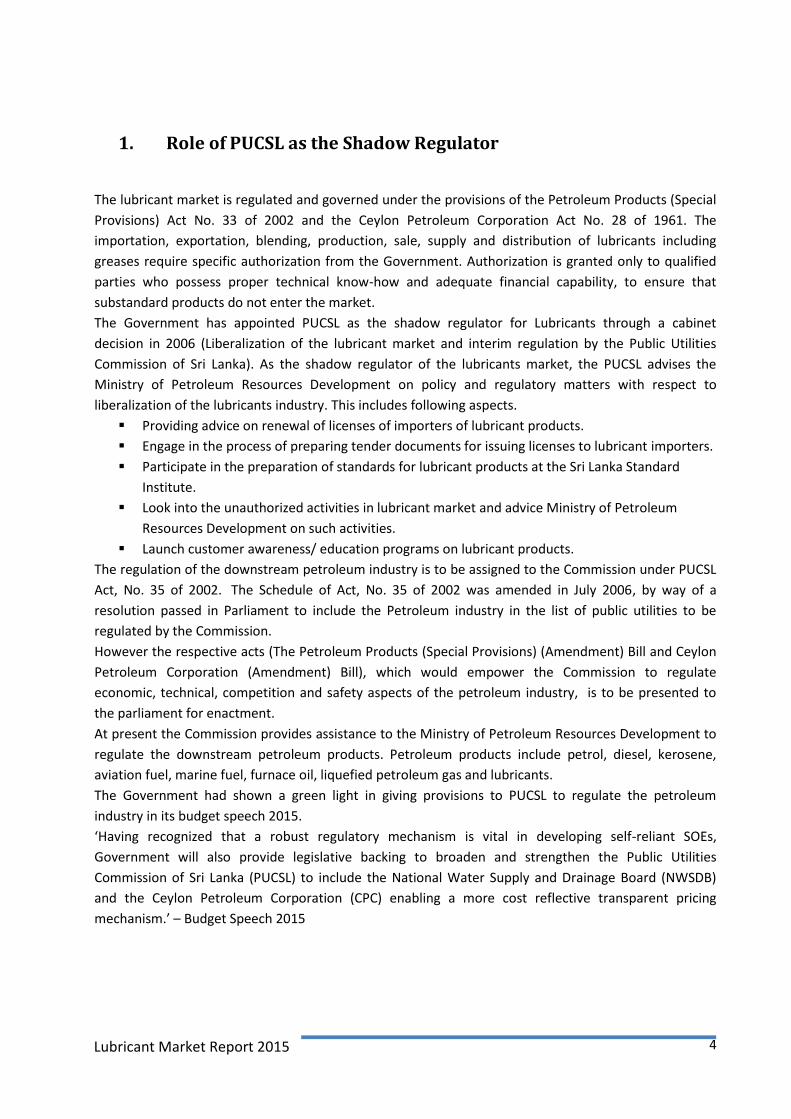
1. Role of PUCSL as the Shadow Regulator
The lubricant market is regulated and governed under the provisions of the Petroleum Products (Special
Provisions) Act No. 33 of 2002 and the Ceylon Petroleum Corporation Act No. 28 of 1961. The
importation, exportation, blending, production, sale, supply and distribution of lubricants including
greases require specific authorization from the Government. Authorization is granted only to qualified
parties who possess proper technical know-how and adequate financial capability, to ensure that
substandard products do not enter the market.
The Government has appointed PUCSL as the shadow regulator for Lubricants through a cabinet
decision in 2006 (Liberalization of the lubricant market and interim regulation by the Public Utilities
Commission of Sri Lanka). As the shadow regulator of the lubricants market, the PUCSL advises the
Ministry of Petroleum Resources Development on policy and regulatory matters with respect to
liberalization of the lubricants industry. This includes following aspects.
Providing advice on renewal of licenses of importers of lubricant products.
Engage in the process of preparing tender documents for issuing licenses to lubricant importers.
Participate in the preparation of standards for lubricant products at the Sri Lanka Standard
Institute.
Look into the unauthorized activities in lubricant market and advice Ministry of Petroleum
Resources Development on such activities.
Launch customer awareness/ education programs on lubricant products.
The regulation of the downstream petroleum industry is to be assigned to the Commission under PUCSL
Act, No. 35 of 2002. The Schedule of Act, No. 35 of 2002 was amended in July 2006, by way of a
resolution passed in Parliament to include the Petroleum industry in the list of public utilities to be
regulated by the Commission.
However the respective acts (The Petroleum Products (Special Provisions) (Amendment) Bill and Ceylon
Petroleum Corporation (Amendment) Bill), which would empower the Commission to regulate
economic, technical, competition and safety aspects of the petroleum industry, is to be presented to
the parliament for enactment.
At present the Commission provides assistance to the Ministry of Petroleum Resources Development to
regulate the downstream petroleum products. Petroleum products include petrol, diesel, kerosene,
aviation fuel, marine fuel, furnace oil, liquefied petroleum gas and lubricants.
The Government had shown a green light in giving provisions to PUCSL to regulate the petroleum
industry in its budget speech 2015.
‘Having recognized that a robust regulatory mechanism is vital in developing self-reliant SOEs,
Government will also provide legislative backing to broaden and strengthen the Public Utilities
Commission of Sri Lanka (PUCSL) to include the National Water Supply and Drainage Board (NWSDB)
and the Ceylon Petroleum Corporation (CPC) enabling a more cost reflective transparent pricing
mechanism.’ – Budget Speech 2015

5 Lubricant Market Report 2015
2. Authorized Parties/Brands
As at end of year 2015, there were thirteen (13) parties authorized to import, export, sell, supply and
distribute lubricants (Activity 2) and three(3) parties were authorized to import, export, sell, supply,
distribute and blend lubricants (Activity 1) under following authorized brands in Sri Lanka.
Table 1 : List of authorized parties/brands and activities in Sri Lankan Lubricant Market
Brand(s) Company Nominee Activity
(Caltex, Chevron, Texaco,
Lanka)
Chevron Ceylon Limited Chevron Lubricants Lanka PLC
Activity 1
(Servo)
Indian Oil Corporation Limited Lanka IOC PLC Activity 1
(ExxonMobil, Esso, Mobil,
Cat)
ExxonMobil Asia Pacific Pte. Ltd.
McLarens Lubricants Limited
Activity 2
(Valvoline)
Ashland Inc. United Motors Lanka Limited Activity 2
(Shell)
Shell Markets (Middle East) Limited
N. M. Distributors (Pvt) Limited Activity 2
(BP, Castrol)
BP France S.A. Associated Motorways Limited Activity 2
(Laugfs)
Laugfs Holdings Limited Laugfs Lubricants Limited Activity 1
(MAK)
Bharat Petroleum Corporation Limited
TVS Lanka (Pvt) Limited Activity 2
(Motul)
Motul Transmec International Activity 2
(Greatwall, Sinopec)
Lubricant Company Sinopec Corporation
Interocean Lubricants Limited Activity 2
(Toyota)
Toyota Tsusho Corporation Toyota Lanka (Pvt) Limited Activity 2
(Total, Elf)
Total Oil India Private Ltd Navaloka Petroleum (Pvt) Limited
Activity 2
(Hyrax)
Ceylon Petroleum Corporation Activity 2

6 Lubricant Market Report 2015
3. Sales and Market Share
A total of 57,978 kL of lubricants worth of LKR 23.4 billion were sold during the year 2015, up 6.8%
compared to the total sales (quantity) of year 2014.
Table 2 : Total Sales History
Year Lubricants - Total Sales Annual Increase (%)
Quantity (kL) LKR (Mil.) Quantity (KL) LKR (Mil.)
2015 57,978 23,463 6.8 3.6
2014 54,265 22,640 1.0 11.0
2013 53,708 20,397 (4.7) (2.2)
2012 56,334 20,854 (3.8) 11.1
2011 58,554 18,775 7.7 33.8
2010 54,369 14,035 21.0 27.1
2009 44,945 11,039
According to the table 3, market leader held a share of 47.58 % in 2015 (49.30% in 2014) with nearest
competitor seized 14.86% of market share in the same year up from 12.59% in 2014.
Table 3 : Sales and the Market Share
Company
2015 2014
SALES QUANTITIES
- kL
SALES QUANTITIES
- %
SALES QUANTITIES
- kL
SALES QUANTITIES
- %
Chevron Ceylon Limited 27,585.20 47.58 26,752.97 49.30
Indian Oil Corporation Limited 8,618.00 14.86 6,832.69 12.59
Ceylon Petroleum Corporation 5,325.85 9.19 5,718.70 10.54
Bharat Petroleum Corporation Limited 2,951.40 5.09 2,241.17 4.13
Laugfs Holdings Limited 2,858.29 4.93 2,896.76 5.34
ExxonMobil Asia Pacific Pte. Ltd. 2,857.62 4.93 3,680.42 6.78
Lubricant Company Sinopec Corporation
1,527.20 2.63 1,207.70 2.23
BP France S.A. 1,519.11 2.62 1,314.44 2.42
Toyota Tsusho Corporation 1,483.16 2.56 1,027.39 1.89
Shell Markets (Middle East) Limited 1,412.93 2.44 1,183.12 2.18
Ashland Inc. 1,300.16 2.24 1,076.61 1.98
Total Oil India Private Ltd 479.26 0.83 286.90 0.53
Motul* 59.93 0.10 46.08 0.08
Total 57,978.13 100.00 54,264.95 100
Figure 1 and figure 2 illustrate the Lubricant Sales (kL) by Company since year 2009 and Lubricant Sales
Revenue (LKR Million) by Company since year 2009 respectively.

7 Lubricant Market Report 2015
Market analysis
Compared to 2014, the overall lubricant market has increased by 6.8% in 2015. Automotive and
Industrial lubricant market has grown by 10.1% and 7.7% while the Marine lubricant market has shown
a reduction of 37.7% compared to 2014. Greases market has shown a moderate growth of 4.7%.
In the automotive lubricants market segment the highest growth is shown in Four Stroke Motorcycle oil
with an increase of 29%. Petrol vehicle lubricants have increased by 14.8%. This is undoubtedly due to
large increase in imports of motorcycles and gasoline driven cars during 2015. The Diesel vehicle
lubricant has shown an increase of only 2.3%. Gear oil consumption has increased by 12.5%. Automatic
Transmission Fluid consumption has increased by only 2.8%, which appears to be relatively low
compared to the increase in gasoline engine lubricants. Virtually all the increase in gasoline engine oil is
in multi-grade oils, amounting to 90% of the increase. Surprisingly the multi-grade oil consumption in
the diesel engine oil segment show a decline of 11% compared to the previous year. Appears as the
diesel lubricant consumers are switching from multi-grade to mono-grade.
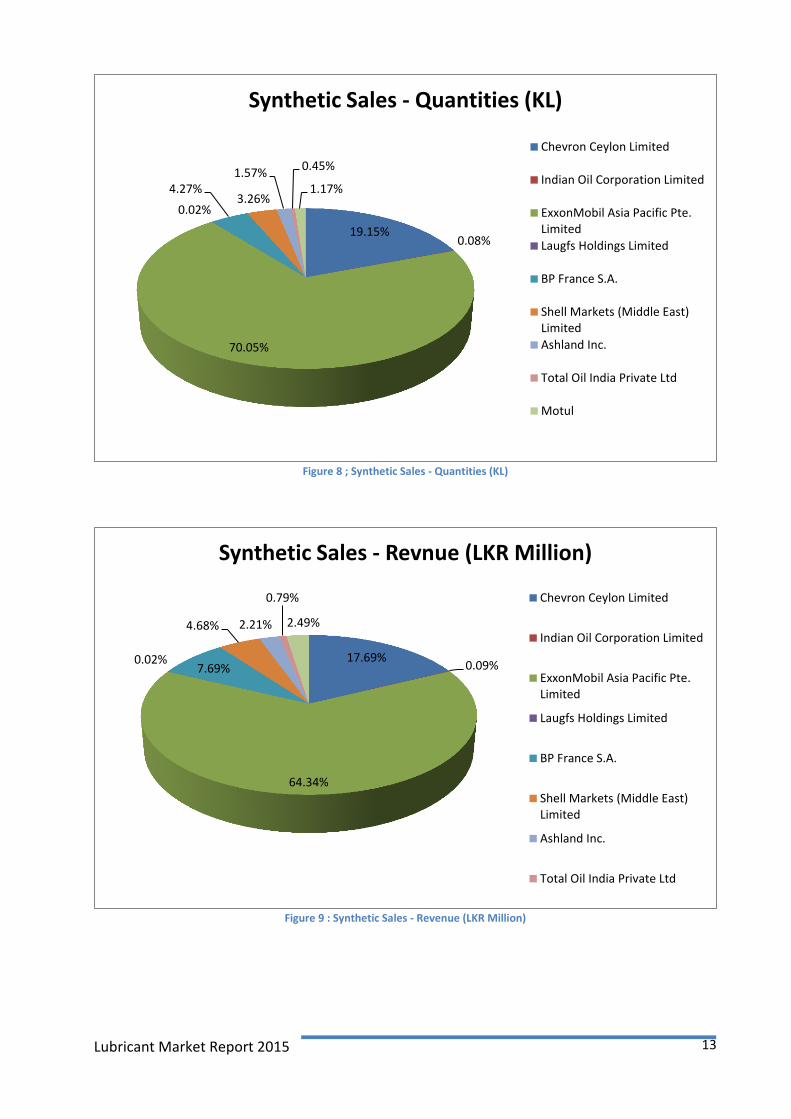
The penetration of synthetic oils in the market is very low at 1.12% of the total market.

8
Lubricant Market Report 2015
Figure 1: Lubricant Sales (kL) by Company
0 5,000 10,000 15,000 20,000 25,000 30,000 35,000 40,000
Chevorn Lubricants Lanka PLC
Indian Oil Corporation Limited
Ceylon Petroleum Corporation
ExxonMobil Asia Pacific Pte. Limited
Laugfs Holdings Limited
Bharat Petroleum Corporation Limited
BP France S.A.
Lubricant Company Sinopec Corporation
Shell Markets (Middle East) Limited
Toyota Tsusho Corporation
Ashland Inc.
Total Oil India Private Ltd
Motul*
Lubricant Sales (kL) by Company
2009
2010
2011
2012
2013
2014
2015

9 Lubricant Market Report 2015
Figure 2 : Lubricant Sales Revenue (LKR Million) by Company
- 2,000.00 4,000.00 6,000.00 8,000.00 10,000.00 12,000.00
Chevorn Lubricants Lanka PLC
Indian Oil Corporation Limited
Ceylon Petroleum Corporation
ExxonMobil Asia Pacific Pte. Limited
Laugfs Holdings Limited
Bharat Petroleum Corporation Limited
BP France S.A.
Lubricant Company Sinopec Corporation
Shell Markets (Middle East) Limited
Toyota Tsusho Corporation
Ashland Inc.
Total Oil India Private Ltd
Motul*
Lubricant Sales Revenue (LKR Million) by Company
2009
2010
2011
2012
2013
2014
2015

10
Lubricant Market Report 2015
Figure 3 : Lubricant Sales Share (Quantity-kL) - 2015
Figure 4 : Yearly lubricant Sales (Quantity-kL) of each type
Automotive 73.92%
Industrial 18.50%
Marine 3.08%
Greases 4.50%
Other 0.00%
Lubricant Sales (Quantity-kL) - 2015
0
5,000
10,000
15,000
20,000
25,000
30,000
35,000
40,000
45,000
Automotive Industrial Marine Greases
Qu
anti
ty-k
L
Yearly lubricant Sales (Quantity-kL)
2015
2014
2013
2012
2011
2010
2009

11 Lubricant Market Report 2015
Figure 5 : Lubricant Sales (Revenue) share - 2015
Automotive 76%
Industrial 15%
Marine 3%
Greases 6%
Lubricant Sales (Revenue) - 2015

12 Lubricant Market Report 2015
Figure 6 : Automotive Lubricant Sales (Quantity) Breakdown
Figure 7 : Automotive Lubricant Sales (Revenue) Breakdown
Gasoline - Multi 7% Gasoline - Mono
3%
Diesel - Multi 16%
Diesel - Mono 36%
4ST Motor Cycle 20%
2T 10%
Gear Oils 5%
ATF 2%
Other 1%
Automotive Lubricant Sales (Quantity) Breakdown
Gasoline - Multi 13%
Gasoline - Mono 2%
Diesel - Multi 17%
Diesel - Mono 30%
4ST Motor Cycle 20%
2T 8%
Gear Oils 6%
ATF 3%
Other 1%
Automotive Lubricant Sales (Revenue) Breakdown
13 Lubricant Market Report 2015
Figure 8 ; Synthetic Sales - Quantities (KL)
Figure 9 : Synthetic Sales - Revenue (LKR Million)
19.15% 0.08%
70.05%
0.02%
4.27% 3.26%
1.57% 0.45%
1.17%
Synthetic Sales - Quantities (KL)
Chevron Ceylon Limited
Indian Oil Corporation Limited
ExxonMobil Asia Pacific Pte.Limited
Laugfs Holdings Limited
BP France S.A.
Shell Markets (Middle East)Limited
Ashland Inc.
Total Oil India Private Ltd
Motul
17.69% 0.09%
64.34%
0.02% 7.69%
4.68% 2.21%
0.79%
2.49%
Synthetic Sales - Revnue (LKR Million)
Chevron Ceylon Limited
Indian Oil Corporation Limited
ExxonMobil Asia Pacific Pte.Limited
Laugfs Holdings Limited
BP France S.A.
Shell Markets (Middle East)Limited
Ashland Inc.
Total Oil India Private Ltd

14 Lubricant Market Report 2015
5. Imports
Figure 10 : Lubricant Imports (FP)-2015
Figure 11 : Lubricant Imports (FP) - Year 2015
-
2,000.00
4,000.00
6,000.00
8,000.00
10,000.00
12,000.00
14,000.00
16,000.00
Automotive Industrial Marine Greases Other
Qu
anti
ty-k
L
Type
Lubricant Imports (FP)-2015
Automotive 63.38%
Industrial 23.95%
Marine 1.48%
Greases 11.03%
Other 0.15%
Lubricant Imports (FP) - Year 2015

15 Lubricant Market Report 2015
Total imported base oil and additives are tabulated as below
Table 4: Total base oil and additives
Company Base Oils/kL Additives/kL Total/kL
Chevron Ceylon Limited 21,880.00 2,822.00 24,702.00
Indian Oil Corporation Limited 10,440.44 611.21 11,051.65
Laugfs Holdings Limited 3,312.94 145.15 3,458.09
Total 35,633.38 3,578.36 39,211.74
Figure 12 : Lubricant (Finished Products) Imports
6. Exports
During the year 2015, a total of 3,167 Kilo Liters of Lubricants were exported to regional markets. This is
an 8% increase with respect to year 2014.
7. Production During the year 2015, 37,797.00 kL of lubricants were produced (blended) locally. Around 75% of the
blending was carried out at the lube blending plant of Chevron, 20% was produced at lube blending
plant belonging to IOC and remaining 5% was produced by Laugfs Holdings Limited.
-
2,000.00
4,000.00
6,000.00
8,000.00
10,000.00
12,000.00
14,000.00
16,000.00
Automotive Industrial Marine Greases Other
Qu
anti
ty (
KL)
Type
Lubricant (Finished Products) Imports
2009
2010
2011
2012
2013
2014
2015

16
Lubricant Market Report 2015
8. Lubricant Sales Trend
Figure 13 : Sale Quantity Trend
R² = 0.6631
R² = 0.7434
R² = 0.8702
0
5000
10000
15000
20000
25000
30000
35000
40000
45000
50000
2009 2010 2011 2012 2013 2014 2015 2016 2017
Qu
anti
ty (
kL)
Year
Sale Quantity Trend
Automotive
Industrial
Marine
Greases
Poly. (Automotive)
Poly. (Industrial)
Poly. (Marine)

17
Lubricant Market Report 2015
9. Lubricant Standards
The mandatory minimum quality standards for imported and blended lubricants and greases stipulated
by the GOSL, have been based on standards published by international organizations such as American
Petroleum Institute (API), Japanese Automobile Standards Organization (JASO) etc. Recently, Sri Lanka
Standards Institute (SLSI) has published Sri Lanka standards for Gasoline Engine Lubricating Oil, Diesel
Engine Lubricating Oil, Automotive Gear Oil, Four Stroke Motorcycle and general purpose Greases and
these are used as the currently applicable minimum standards. Sri Lankan Standards may be obtained
from SLSI. Currently applicable minimum standards are given below.
Table 5 : Lubricant Standards
Type of Lubricant Minimum Standard
Equivalent International Standard
Other Standards Above Minimum Standard
Gasoline Engine Oil SLS 1374/2009 API SJ API SL, API SM
Diesel Engine Oil SLS 1373/2009 API CF API CF-2, API CG-4, API CH-4, API CL-4, API CJ-4
Two Stroke Engine Oil SLS 1446/2012 JASO FC JASO FD
Four Stroke Motorcycle Engine Oil
SLS 1409/2011 API SG and JASO MA API SL and JASO MA , API SM and JASO MA, API SL and JASO MA
Automotive Gear Oil SLS 1396/2010 API GL 4 API GL 5, API GL 6
Automatic Transmission Oil
DEXRON IID, DEXRON III MERCON, ALLISON C4, JASO M315 Type Group A
DEXRON IID, DEXRON III MERCON, ALLISON C4, JASO M315 Type Group A
OEM Recommended Oils
Grease SLS 1424/2011 NLGI LA NLGI LB, NLGI GA, NLGI GB NLGI GC
10. Government Revenue
The GOSL receives income from the authorized parties by way of a bi-annual fixed and in some cases a
variable registration fee, which is equivalent to 1 million Rupees or 0.5% of total invoiced sales for that
period, whichever is higher, subject to a maximum of five million Rupees. In 2015 the total recognized
registration fee to the Government is approximately LKR 74 million and which is a 7.00 % increment
compared to the previous year.