Embed Size (px)
Citation preview
7/30/2019 Lucky Cement Ratio Report
http://slidepdf.com/reader/full/lucky-cement-ratio-report 1/7
Disclaimer: This report has been prepared by Standard Capital Securities (Pvt) Ltd and is provided for information purposes only. The information and data on which this
report is
based
are
obtained
from
sources
which
we
believe
to
be
reliable
but
we
do
not
guarantee
that
it
is
accurate
or
complete.
Standard
Capital
Securities
(Pvt)
Ltd
accepts no responsibility whatsoever for any direct or indirect consequential loss arising from any use of this report or its contents. Investors are advised to take
professional advice before making investments and Standard Capital Securities (Pvt) Ltd does not take any responsibility and shall not be held liable for undue reliance on
this report. This report may not be reproduced, distributed or published by any recipient for any purpose.
Standard Capital Securities (Pvt) Ltd
p
THE CEMENT
INDUSTRY
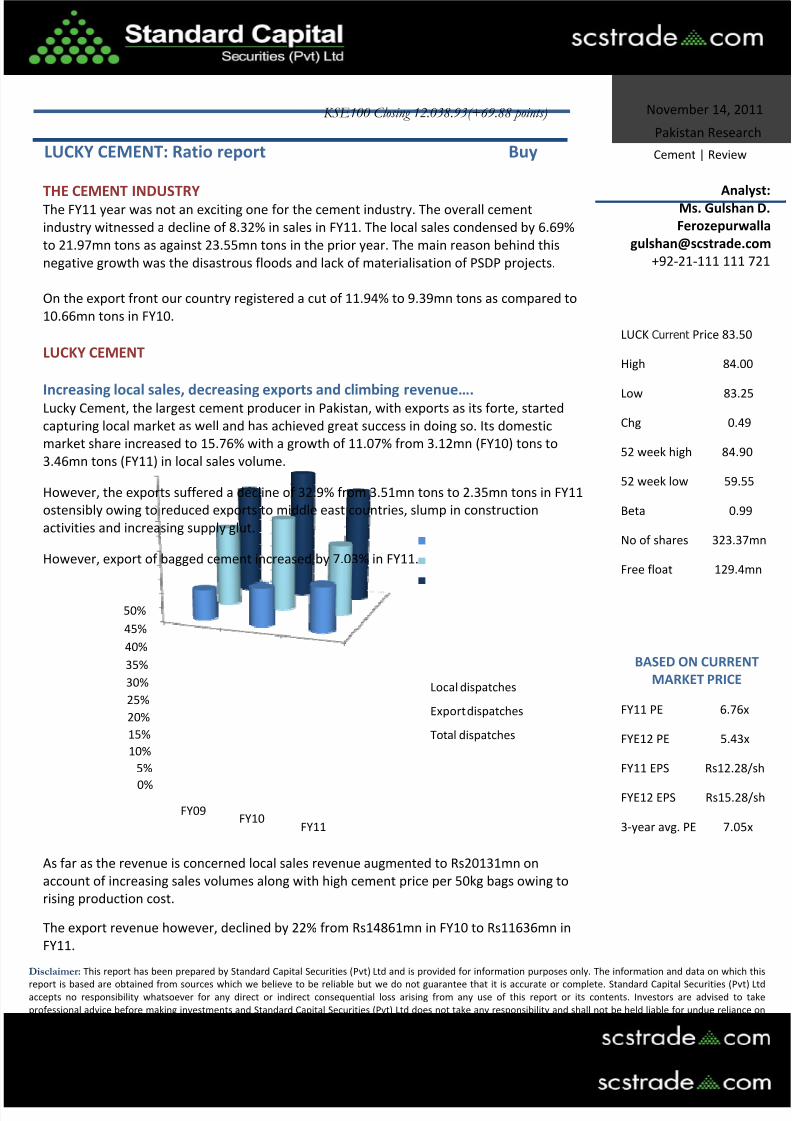
The FY11 year was not an exciting one for the cement industry. The overall cement industry witnessed a decline of 8.32% in sales in FY11. The local sales condensed by 6.69%
to 21.97mn tons as against 23.55mn tons in the prior year. The main reason behind this
negative growth was the disastrous floods and lack of materialisation of PSDP projects.
On the export front our country registered a cut of 11.94% to 9.39mn tons as compared to
10.66mn tons in FY10.
LUCKY CEMENT Increasing local sales, decreasing exports and climbing revenue…. Lucky Cement, the largest cement producer in Pakistan, with exports as its forte, started
capturing local market as well and has achieved great success in doing so. Its domestic
market share increased to 15.76% with a growth of 11.07% from 3.12mn (FY10) tons to
3.46mn tons (FY11) in local sales volume.
However, the exports suffered a decline of 32.9% from 3.51mn tons to 2.35mn tons in FY11
ostensibly owing to reduced exports to middle east countries, slump in construction
activities and increasing supply glut.
However, export of bagged cement increased by 7.03% in FY11.
0%
5%
10%
15%
20%
25%
30%
35%
40%
45%
50%
FY09FY10
FY11
Local dispatches
Export dispatches
Total dispatches
As far as the revenue is concerned local sales revenue augmented to Rs20131mn on
account of increasing sales volumes along with high cement price per 50kg bags owing to
rising production cost.
The export revenue however, declined by 22% from Rs14861mn in FY10 to Rs11636mn in
FY11.
Analyst:
Ms. Gulshan D. Ferozepurwalla
[email protected] +92‐21‐111 111 721
KSE100 Closing 12.038.93(+69.88 points)
LUCKY CEMENT: Ratio report Buy
November 14, 2011
Pakistan Research
Cement | Review
LUCK Current Price 83.50
High 84.00
Low
83.25
Chg 0.49
52 week high 84.90
52 week low 59.55
Beta 0.99
No of shares 323.37mn
Free float 129.4mn
BASED ON CURRENT MARKET PRICE
FY11 PE 6.76x
FYE12 PE 5.43x
FY11 EPS Rs12.28/sh
FYE12 EPS Rs15.28/sh
3‐year avg. PE 7.05x
7/30/2019 Lucky Cement Ratio Report
http://slidepdf.com/reader/full/lucky-cement-ratio-report 2/7
Disclaimer: This report has been prepared by Standard Capital Securities (Pvt) Ltd and is provided for information purposes only. The information and data on which this
report is
based
are
obtained
from
sources
which
we
believe
to
be
reliable
but
we
do
not
guarantee
that
it
is
accurate
or
complete.
Standard
Capital
Securities
(Pvt)
Ltd
accepts no responsibility whatsoever for any direct or indirect consequential loss arising from any use of this report or its contents. Investors are advised to take
professional advice before making investments and Standard Capital Securities (Pvt) Ltd does not take any responsibility and shall not be held liable for undue reliance on
this report. This report may not be reproduced, distributed or published by any recipient for any purpose.
Standard Capital Securities (Pvt) Ltd
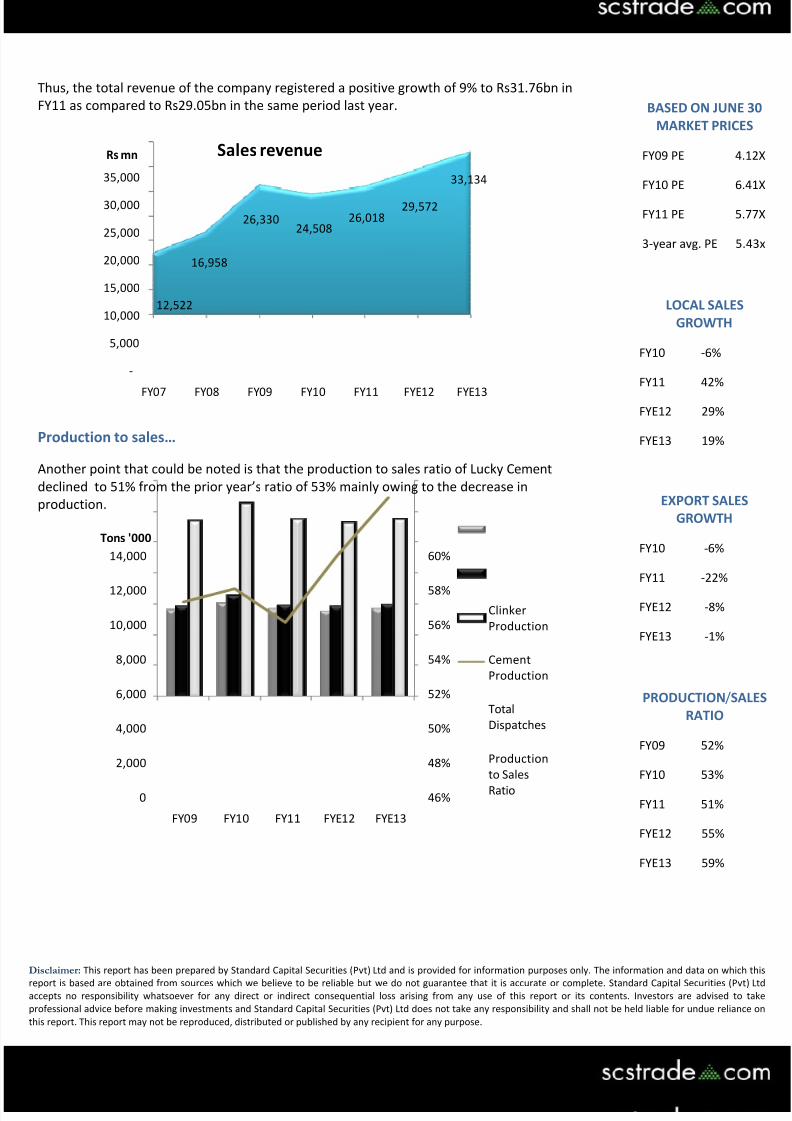
Thus, the total revenue of the company registered a positive growth of 9% to Rs31.76bn in
FY11 as compared to Rs29.05bn in the same period last year.
12,522
16,958
26,330
24,508
26,018
29,572
33,134
‐
5,000
10,000
15,000
20,000
25,000
30,000
35,000
FY07 FY08 FY09 FY10 FY11 FYE12 FYE13
Rs mn Sales revenue
Production to sales… Another point that could be noted is that the production to sales ratio of Lucky Cement
declined to 51% from the prior year’s ratio of 53% mainly owing to the decrease in
production.
46%
48%
50%
52%
54%
56%
58%
60%
0
2,000
4,000
6,000
8,000
10,000
12,000
14,000
FY09 FY10 FY11 FYE12 FYE13
Tons '000
Clinker
Production
Cement
Production
Total
Dispatches
Production
to Sales
Ratio
BASED ON JUNE 30 MARKET PRICES
FY09 PE 4.12X
FY10 PE 6.41X
FY11 PE 5.77X
3‐year avg. PE 5.43x
LOCAL SALES GROWTH
FY10 ‐6%
FY11 42%
FYE12 29%
FYE13 19%
EXPORT SALES GROWTH
FY10 ‐6%
FY11 ‐22%
FYE12 ‐8%
FYE13 ‐1%
PRODUCTION/SALES
RATIO
FY09 52%
FY10 53%
FY11 51%
FYE12 55%
FYE13 59%
7/30/2019 Lucky Cement Ratio Report
http://slidepdf.com/reader/full/lucky-cement-ratio-report 3/7
Disclaimer: This report has been prepared by Standard Capital Securities (Pvt) Ltd and is provided for information purposes only. The information and data on which this
report is
based
are
obtained
from
sources
which
we
believe
to
be
reliable
but
we
do
not
guarantee
that
it
is
accurate
or
complete.
Standard
Capital
Securities
(Pvt)
Ltd
accepts no responsibility whatsoever for any direct or indirect consequential loss arising from any use of this report or its contents. Investors are advised to take
professional advice before making investments and Standard Capital Securities (Pvt) Ltd does not take any responsibility and shall not be held liable for undue reliance on
this report. This report may not be reproduced, distributed or published by any recipient for any purpose.
Standard Capital Securities (Pvt) Ltd
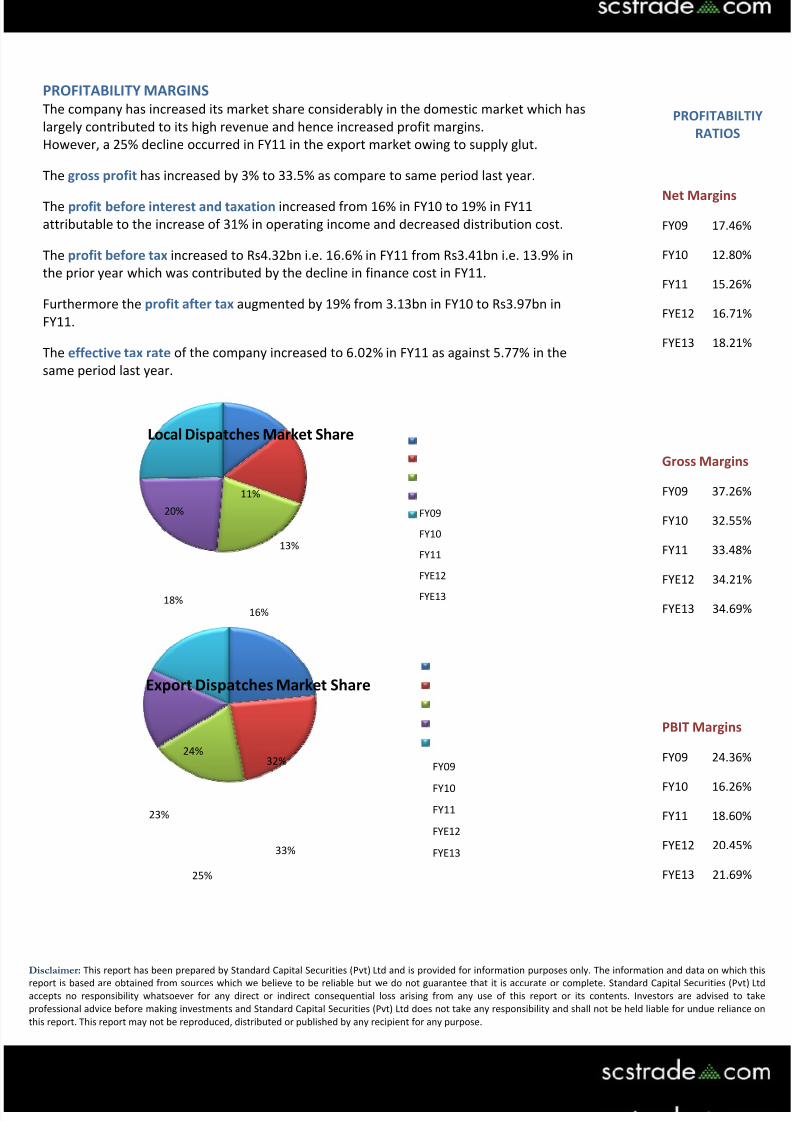
PROFITABILITY MARGINS The company has increased its market share considerably in the domestic market which has
largely contributed to its high revenue and hence increased profit margins.
However, a 25% decline occurred in FY11 in the export market owing to supply glut.
The gross profit has increased by 3% to 33.5% as compare to same period last year.
The profit before interest and taxation increased from 16% in FY10 to 19% in FY11
attributable to the increase of 31% in operating income and decreased distribution cost.
The profit before tax increased to Rs4.32bn i.e. 16.6% in FY11 from Rs3.41bn i.e. 13.9% in
the prior year which was contributed by the decline in finance cost in FY11.
Furthermore the profit after tax augmented by 19% from 3.13bn in FY10 to Rs3.97bn in
FY11.
The effective tax rate of the company increased to 6.02% in FY11 as against 5.77% in the
same period last year.
11%
13%
16%18%
20%
Local Dispatches Market Share
FY09
FY10
FY11
FYE12
FYE13
32%
33%
25%
23%
24%
Export Dispatches Market Share
FY09
FY10
FY11
FYE12
FYE13
PROFITABILTIY RATIOS
Net Margins FY09 17.46%
FY10 12.80%
FY11 15.26%
FYE12 16.71%
FYE13 18.21%
Gross Margins FY09 37.26%
FY10 32.55%
FY11 33.48%
FYE12 34.21%
FYE13 34.69%
PBIT Margins FY09 24.36%
FY10
16.26%
FY11 18.60%
FYE12 20.45%
FYE13 21.69%
7/30/2019 Lucky Cement Ratio Report
http://slidepdf.com/reader/full/lucky-cement-ratio-report 4/7
Disclaimer: This report has been prepared by Standard Capital Securities (Pvt) Ltd and is provided for information purposes only. The information and data on which this
report is
based
are
obtained
from
sources
which
we
believe
to
be
reliable
but
we
do
not
guarantee
that
it
is
accurate
or
complete.
Standard
Capital
Securities
(Pvt)
Ltd
accepts no responsibility whatsoever for any direct or indirect consequential loss arising from any use of this report or its contents. Investors are advised to take
professional advice before making investments and Standard Capital Securities (Pvt) Ltd does not take any responsibility and shall not be held liable for undue reliance on
this report. This report may not be reproduced, distributed or published by any recipient for any purpose.
Standard Capital Securities (Pvt) Ltd
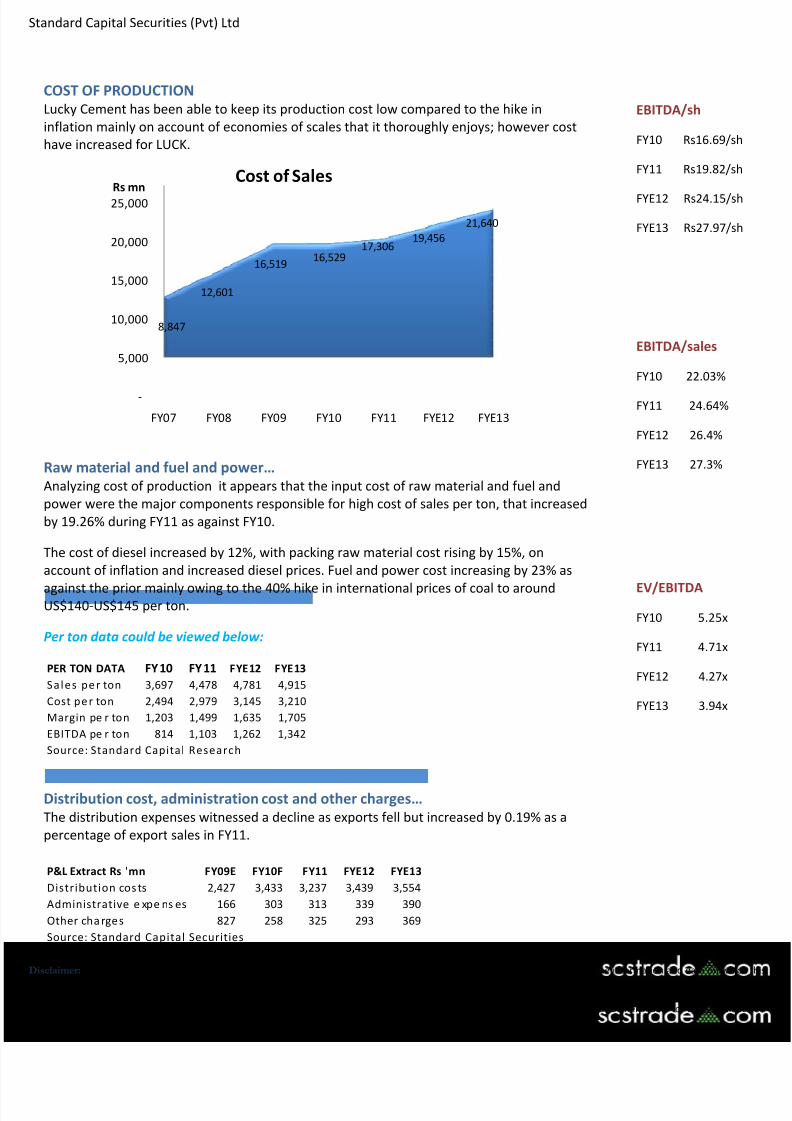
COST OF PRODUCTION Lucky Cement has been able to keep its production cost low compared to the hike in
inflation mainly on account of economies of scales that it thoroughly enjoys; however cost
have increased for LUCK.
8,847
12,601
16,519
16,529
17,306
19,456
21,640
‐
5,000
10,000
15,000
20,000
25,000
FY07 FY08 FY09 FY10 FY11 FYE12 FYE13
Rs mnCost of Sales
Raw material and fuel and power… Analyzing cost of production it appears that the input cost of raw material and fuel and
power were the major components responsible for high cost of sales per ton, that increased
by 19.26% during FY11 as against FY10.
The cost of diesel increased by 12%, with packing raw material cost rising by 15%, on
account of inflation and increased diesel prices. Fuel and power cost increasing by 23% as
against the
prior
mainly
owing
to
the
40%
hike
in
international
prices
of
coal
to
around
US$140‐US$145 per ton.
Per ton data could be viewed below: PER TON DATA FY 10 FY 11 FYE12 FYE13
S a l e s pe r ton 3,697 4,478 4,781 4,915
Cost pe r ton 2,494 2,979 3,145 3,210
Margin pe r ton 1,203 1,499 1,635 1,705
EBITDA pe r ton 814 1,103 1,262 1,342
Source: Standard Capital R esearch
Distribution cost, administration cost and other charges… The distribution expenses witnessed a decline as exports fell but increased by 0.19% as a
percentage of export sales in FY11.
P&L Extract Rs 'mn FY09E FY10F FY11 FYE12 FYE13
Distribution cos ts 2,427 3,433 3,237 3,439 3,554
Administrative e xpe ns es 166 303 313 339 390
Other cha rge s 827 258 325 293 369
Source: Standard Capital Securities
EBITDA/sh FY10 Rs16.69/sh
FY11 Rs19.82/sh
FYE12 Rs24.15/sh
FYE13 Rs27.97/sh
EBITDA/sales FY10 22.03%
FY11 24.64%
FYE12 26.4%
FYE13 27.3%
EV/EBITDA FY10 5.25x
FY11 4.71x
FYE12 4.27x
FYE13 3.94x
7/30/2019 Lucky Cement Ratio Report
http://slidepdf.com/reader/full/lucky-cement-ratio-report 5/7
7/30/2019 Lucky Cement Ratio Report
http://slidepdf.com/reader/full/lucky-cement-ratio-report 6/7
Disclaimer: This report has been prepared by Standard Capital Securities (Pvt) Ltd and is provided for information purposes only. The information and data on which this
report is
based
are
obtained
from
sources
which
we
believe
to
be
reliable
but
we
do
not
guarantee
that
it
is
accurate
or
complete.
Standard
Capital
Securities
(Pvt)
Ltd
accepts no responsibility whatsoever for any direct or indirect consequential loss arising from any use of this report or its contents. Investors are advised to take
professional advice before making investments and Standard Capital Securities (Pvt) Ltd does not take any responsibility and shall not be held liable for undue reliance on
this report. This report may not be reproduced, distributed or published by any recipient for any purpose.
Standard Capital Securities (Pvt) Ltd
RATIO ANALYSIS Dividend cover and Interest Coverage ratios… The company’s dividend cover ratio improved by 27% from 2.43 to 3.07 in FY11 along with
an improved interest coverage ratio by 31% from 7.50 in FY10 to 9.81 in FY11, thus making
Lucky
attractive
in
the
eyes
of
creditors.
Current ratio… The liquidity of the company also appears to have improved with the current ratio increasing
from 0.71 to 0.88 in FY11 owing to high inventory values.
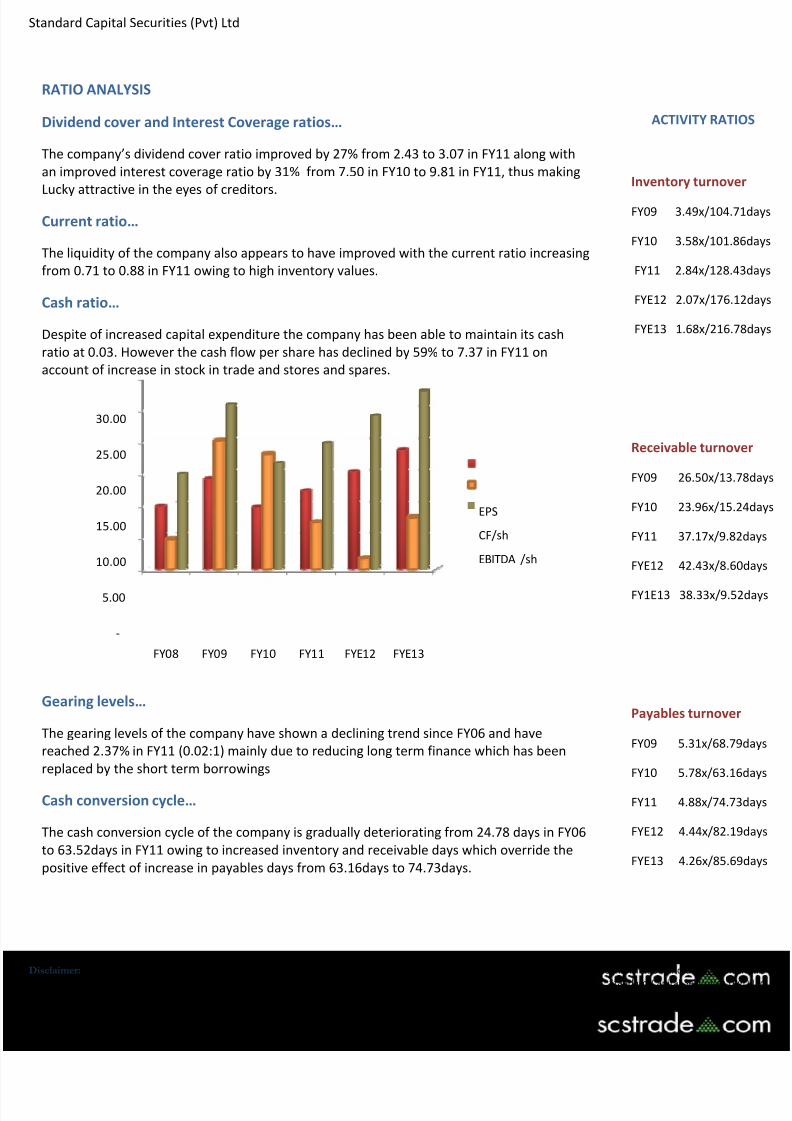
Cash ratio… Despite of increased capital expenditure the company has been able to maintain its cash
ratio at 0.03. However the cash flow per share has declined by 59% to 7.37 in FY11 on
account of increase in stock in trade and stores and spares.
‐
5.00
10.00
15.00
20.00
25.00
30.00
FY08 FY09 FY10 FY11 FYE12 FYE13
EPS
CF/sh
EBITDA /sh
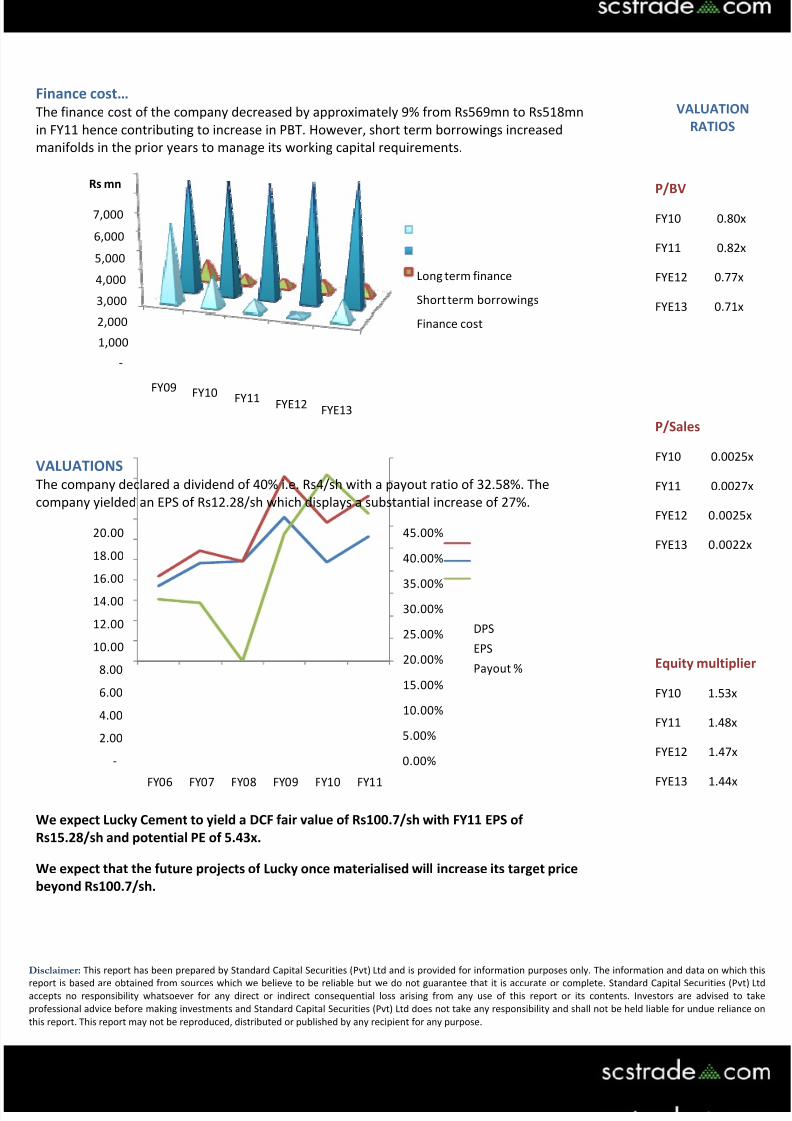
Gearing levels… The gearing levels of the company have shown a declining trend since FY06 and have
reached 2.37% in FY11 (0.02:1) mainly due to reducing long term finance which has been
replaced by the short term borrowings
Cash conversion cycle… The cash conversion cycle of the company is gradually deteriorating from 24.78 days in FY06
to 63.52days in FY11 owing to increased inventory and receivable days which override the
positive effect of increase in payables days from 63.16days to 74.73days.
ACTIVITY RATIOS
Inventory turnover FY09 3.49x/104.71days
FY10 3.58x/101.86days
FY11 2.84x/128.43days
FYE12 2.07x/176.12days
FYE13 1.68x/216.78days
Receivable turnover FY09 26.50x/13.78days
FY10 23.96x/15.24days
FY11 37.17x/9.82days
FYE12 42.43x/8.60days
FY1E13 38.33x/9.52days
Payables turnover FY09 5.31x/68.79days
FY10 5.78x/63.16days
FY11 4.88x/74.73days
FYE12 4.44x/82.19days
FYE13 4.26x/85.69days
7/30/2019 Lucky Cement Ratio Report
http://slidepdf.com/reader/full/lucky-cement-ratio-report 7/7
Disclaimer: This report has been prepared by Standard Capital Securities (Pvt) Ltd and is provided for information purposes only. The information and data on which this
report is
based
are
obtained
from
sources
which
we
believe
to
be
reliable
but
we
do
not
guarantee
that
it
is
accurate
or
complete.
Standard
Capital
Securities
(Pvt)
Ltd
accepts no responsibility whatsoever for any direct or indirect consequential loss arising from any use of this report or its contents. Investors are advised to take
professional advice before making investments and Standard Capital Securities (Pvt) Ltd does not take any responsibility and shall not be held liable for undue reliance on
this report. This report may not be reproduced, distributed or published by any recipient for any purpose.
Standard Capital Securities (Pvt) Ltd
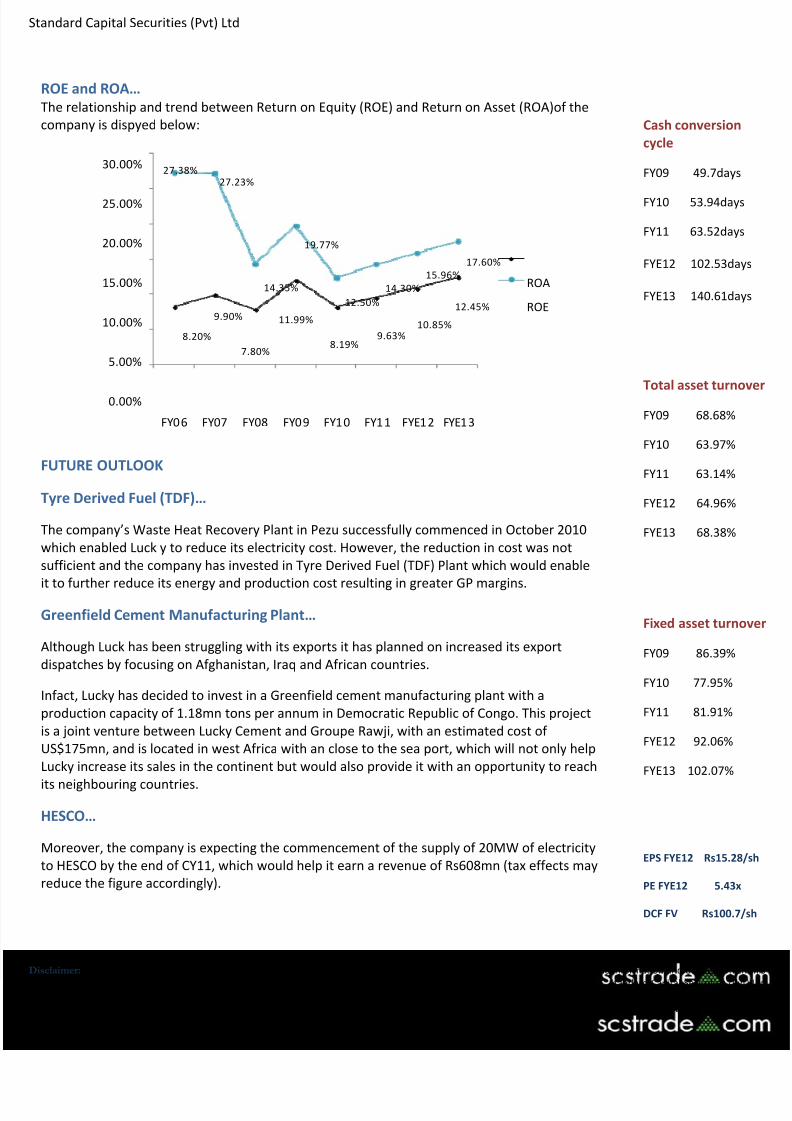
ROE and ROA… The relationship and trend between Return on Equity (ROE) and Return on Asset (ROA)of the company is dispyed below:
8.20%
9.90%
7.80%
11.99%
8.19%9.63%
10.85%
12.45%
27.38%27.23%
14.35%
19.77%
12.50%
14.30%
15.96%
17.60%
0.00%
5.00%
10.00%
15.00%
20.00%
25.00%
30.00%
FY0 6 FY07 FY08 FY0 9 FY1 0 FY1 1 FYE1 2 FYE1 3
ROA
ROE
FUTURE OUTLOOK Tyre Derived Fuel (TDF)…
The company’s Waste Heat Recovery Plant in Pezu successfully commenced in October 2010
which enabled Luck y to reduce its electricity cost. However, the reduction in cost was not
sufficient and the company has invested in Tyre Derived Fuel (TDF) Plant which would enable
it
to
further
reduce
its
energy
and
production
cost
resulting
in
greater
GP
margins.
Greenfield Cement Manufacturing Plant… Although Luck has been struggling with its exports it has planned on increased its export
dispatches by focusing on Afghanistan, Iraq and African countries.
Infact, Lucky has decided to invest in a Greenfield cement manufacturing plant with a
production capacity of 1.18mn tons per annum in Democratic Republic of Congo. This project
is a joint venture between Lucky Cement and Groupe Rawji, with an estimated cost of
US$175mn, and is located in west Africa with an close to the sea port, which will not only help
Lucky increase its sales in the continent but would also provide it with an opportunity to reach
its neighbouring
countries.
HESCO… Moreover, the company is expecting the commencement of the supply of 20MW of electricity
to HESCO by the end of CY11, which would help it earn a revenue of Rs608mn (tax effects may
reduce the figure accordingly).
Cash conversion cycle FY09 49.7days
FY10 53.94days
FY11 63.52days
FYE12 102.53days
FYE13 140.61days
Total asset turnover FY09 68.68%
FY10 63.97%
FY11 63.14%
FYE12 64.96%
FYE13 68.38%
Fixed asset turnover FY09 86.39%
FY10 77.95%
FY11 81.91%
FYE12 92.06%
FYE13 102.07%
EPS FYE12 Rs15.28/sh PE FYE12 5.43x DCF FV Rs100.7/sh