Embed Size (px)
Citation preview

Lucky or clever? From changed expectations to
responsibility judgments
Tobias Gerstenberg*
Massachusetts Institute of Technology
Tomer D. UllmanMassachusetts Institute of Technology
Jonas NagelGöttingen University
Max H. Kleiman-WeinerMassachusetts Institute of Technology
David LagnadoUniversity College London
Joshua B. TenenbaumMassachusetts Institute of Technology
AbstractHow do people hold others responsible for the consequences of their actions?While many accounts predict that outcomes which resulted from unexpectedactions attract more responsibility, recent work has shown that others aresometimes held more responsible when taking expected actions (Johnson &Rips, 2015). We show in four experiments that the relationship between ac-tion expectations and responsibility judgments is mediated by a dispositionalinference. Whether an unexpected action yields more or less credit dependson whether the action was diagnostic for good or bad future performance.We develop a computational model that attributes responsibility as a func-tion of what the observed action revealed about the person, and the causalrole that the person’s action played in bringing about the outcome. Themodel first infers what type of person someone is from having observed theiraction. It then compares the prior expectation about the person’s futurebehavior with the posterior expectation after having observed their action.The model predicts that others will be blamed for negative outcomes to theextent that our expectations about their future performance have decreased,and credited for positive outcomes if our expectations have increased. Wemodel the causal role of a person’s action by using a counterfactual modelthat considers how close the action was to having been pivotal for the out-come. The model captures participants’ responsibility judgments to a highdegree of quantitative accuracy across a range of di�erent situations.
Keywords: responsibility; causality; expectations; counterfactuals; pivotal-ity.
*Corresponding author: Tobias Gerstenberg ([email protected]), MIT Building 46-4053, 77 MassachusettsAvenue, Cambridge, MA 02139.
EXPECTATIONS & RESPONSIBILITY 2
1 Introduction
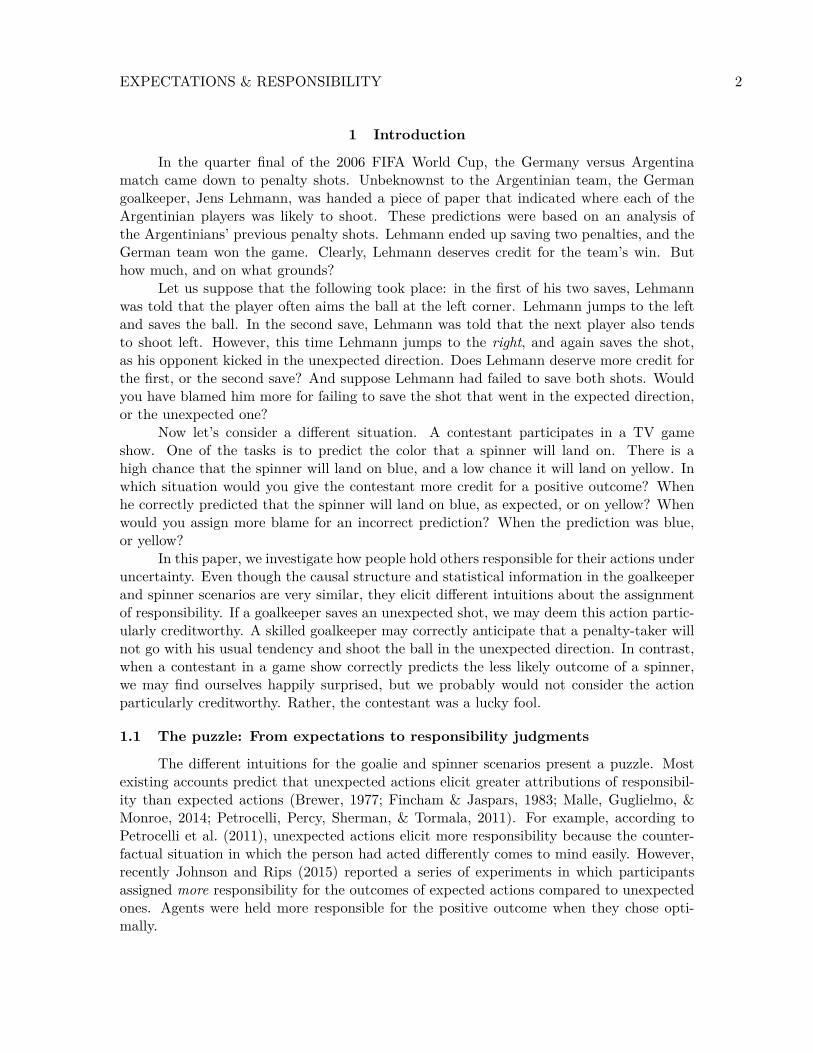
In the quarter final of the 2006 FIFA World Cup, the Germany versus Argentinamatch came down to penalty shots. Unbeknownst to the Argentinian team, the Germangoalkeeper, Jens Lehmann, was handed a piece of paper that indicated where each of theArgentinian players was likely to shoot. These predictions were based on an analysis ofthe Argentinians’ previous penalty shots. Lehmann ended up saving two penalties, and theGerman team won the game. Clearly, Lehmann deserves credit for the team’s win. Buthow much, and on what grounds?
Let us suppose that the following took place: in the first of his two saves, Lehmannwas told that the player often aims the ball at the left corner. Lehmann jumps to the leftand saves the ball. In the second save, Lehmann was told that the next player also tendsto shoot left. However, this time Lehmann jumps to the right, and again saves the shot,as his opponent kicked in the unexpected direction. Does Lehmann deserve more credit forthe first, or the second save? And suppose Lehmann had failed to save both shots. Wouldyou have blamed him more for failing to save the shot that went in the expected direction,or the unexpected one?
Now let’s consider a di�erent situation. A contestant participates in a TV gameshow. One of the tasks is to predict the color that a spinner will land on. There is ahigh chance that the spinner will land on blue, and a low chance it will land on yellow. Inwhich situation would you give the contestant more credit for a positive outcome? Whenhe correctly predicted that the spinner will land on blue, as expected, or on yellow? Whenwould you assign more blame for an incorrect prediction? When the prediction was blue,or yellow?
In this paper, we investigate how people hold others responsible for their actions underuncertainty. Even though the causal structure and statistical information in the goalkeeperand spinner scenarios are very similar, they elicit di�erent intuitions about the assignmentof responsibility. If a goalkeeper saves an unexpected shot, we may deem this action partic-ularly creditworthy. A skilled goalkeeper may correctly anticipate that a penalty-taker willnot go with his usual tendency and shoot the ball in the unexpected direction. In contrast,when a contestant in a game show correctly predicts the less likely outcome of a spinner,we may find ourselves happily surprised, but we probably would not consider the actionparticularly creditworthy. Rather, the contestant was a lucky fool.
1.1 The puzzle: From expectations to responsibility judgments
The di�erent intuitions for the goalie and spinner scenarios present a puzzle. Mostexisting accounts predict that unexpected actions elicit greater attributions of responsibil-ity than expected actions (Brewer, 1977; Fincham & Jaspars, 1983; Malle, Guglielmo, &Monroe, 2014; Petrocelli, Percy, Sherman, & Tormala, 2011). For example, according toPetrocelli et al. (2011), unexpected actions elicit more responsibility because the counter-factual situation in which the person had acted di�erently comes to mind easily. However,recently Johnson and Rips (2015) reported a series of experiments in which participantsassigned more responsibility for the outcomes of expected actions compared to unexpectedones. Agents were held more responsible for the positive outcome when they chose opti-mally.
EXPECTATIONS & RESPONSIBILITY 3
How can we make sense of the puzzling relationship between action expectationsand responsibility judgments? When do we give more credit for unexpected actions (asmost theories predict), and when do we give less credit? In this paper, we develop acomputational model that solves this puzzle. The model relies on two processes: the firstprocess is a dispositional inference that captures what an action reveals about a person,and how our expectations about the person’s future behavior have changed after havingobserved their action. Such inferences require reasoning over a theory of mind that dictateshow people choose actions given their mental states and abilities. The second process is acausal attribution of the role that a person’s action played in bringing about the outcome.Such attributions require a causal model of the situation.
Our formal framework for explaining responsibility judgments draws on a rich litera-ture in attribution theory, as well as recent work on modeling causal judgments. We brieflyreview each of these strands of research, focusing on the aspects that are most relevant forour framework. We then consider previous accounts of responsibility attribution, beforepresenting our computational model in detail. We subsequently test the predictions of ourmodel in four experiments that vary action expectations, and the extent to which a person’saction made a di�erence to the outcome. We conclude by discussing di�erent ways in whichexpectations may a�ect judgments of responsibility, and how the model we propose herecan be extended to capture people’s judgments of moral responsibility.
1.2 Dispositional inference: From actions to persons
Attribution theory studies how we make sense of other people (Alicke, Mandel, Hilton,Gerstenberg, & Lagnado, 2015; Gilbert, 1998; Heider, 1944, 1958; Jones & Davis, 1965;Jones, Davis, & Gergen, 1961; Kelley, 1973; Malle, 2011; Weiner, 1991). Without directaccess to other people’s minds, we have to infer another person’s hidden mental states fromobserving their behavior. Most of us are experts in the use of this intuitive psychology.Even young infants understand that agents act e�ciently to achieve their goals (Csibra& Gergely, 2007; Gergely & Csibra, 2003; Gergely, Nádasdy, Csibra, & Bíró, 1995; Scott& Baillargeon, 2013), and over the years our understanding of other agents turns into afull-blown theory of mind (Buss, 1978; Gopnik & Wellman, 1992; Malle, 1999; Wellman,2010).
Early attribution theorists postulated that Bayesian inference provides a normativeframework for making diagnostic inferences about mental states from actions (Ajzen, 1971;Ajzen & Fishbein, 1975, 1978; Fischho� & Beyth-Marom, 1983; Fischho� & Lichtenstein,1978; Morris & Larrick, 1995; Trope, 1974; Trope & Burnstein, 1975). These researcherswere particularly interested in analyzing what an agent’s behavior reveals about their at-titudes. Bayesian inference predicts that the extent to which a particular behavior is di-agnostic of a person’s attitude, depends on how likely the observed behavior was, givendi�erent attitudes that the person might hold. For example, when there are strong exter-nal pressures to act in a certain way, acting in conformity with these pressures does notreveal much about the person’s true attitudes (Jones et al., 1961), as the same action wasto be expected no matter what the person’s true attitude actually is. More generally, tothe extent that a person acts in line with our expectations, we do not learn much beyondwhat we already know. However, when a person’s action violates our expectation, we need
EXPECTATIONS & RESPONSIBILITY 4
to update our beliefs about the person to make sense of their behavior (cf. Koster-Hale &Saxe, 2013).
Research has shown that people’s dispositional inferences are broadly consistent withthe predictions of the Bayesian framework (e.g. Ajzen & Fishbein, 1975; Trope & Burnstein,1975), although there is an ongoing debate about whether people are su�ciently sensitive tohow behaviors are shaped by situational constraints (Ajzen, 1971; Gilbert & Malone, 1995;Morris & Larrick, 1995; Reeder & Spores, 1983; Reeder, Vonk, Ronk, Ham, & Lawrence,2004; Slovic & Lichtenstein, 1971; Walker, Smith, & Vul, 2015). While the Bayesian frame-work allows us to make inferences from observed variables (behavior) to latent variables(mental states), it requires a model that captures how the latent and observed variablesrelate. Essentially, we need a model of decision-making that expresses how people makechoices based on their mental states. A key assumption for making sense of other people’sbehavior in this way is the principle of rational action. It states that a person chooses anaction that is expected to achieve a desired goal in the most e�cient way, subject to theperson’s beliefs and abilities (Gilbert, 1998; Goodman et al., 2006; Heider, 1958; Malle &Knobe, 1997; Wellman & Bartsch, 1988). Assuming that others generally act rationally al-lows us to infer an agent’s goals from how they move in a maze (Baker, Saxe, & Tenenbaum,2009; Baker & Tenenbaum, 2014; Pantelis et al., 2014), learn about the environment fromobserving another agent’s choices (Jara-Ettinger, Baker, & Tenenbaum, 2012), or figure outan agent’s social disposition from observing its interactions with another agent (Hamlin,Ullman, Tenenbaum, Goodman, & Baker, 2013; Ullman et al., 2009, see also Gershman,Gerstenberg, Baker, & Cushman, submitted).
Agents with di�erent abilities may have di�erent ways of e�ciently achieving thesame goal. What is optimal for one agent, might not be the right thing for a less capableagent. Jara-Ettinger, Gweon, Tenenbaum, and Schulz (2015) have shown that young chil-dren already take costs and rewards of actions into account when making inferences aboutan agent’s choices, and that these inferences a�ect their moral evaluations (Jara-Ettinger,Tenenbaum, & Schulz, 2015). As illustrated by the goalkeeper scenario above, this agent-specific optimal course of action will play a key part in our responsibility model (cf. Morse,2003; Rachlinski, 2002–2003; Sinnott-Armstrong & Levy, 2011; van Inwagen, 1978). Whenwe see someone perform an unexpected action that leads to a positive outcome, the extentto which we credit them for the outcome depends on what the action reveals about theperson (Du�, 1993; Frieze & Weiner, 1971; Uhlmann, Pizarro, & Diermeier, 2015; Weiner,1985; Weiner, Heckhausen, Meyer, & Cook, 1972). Did the agent have some special skilland behave optimally in light of having this ability, or did the agent lack the relevant skill,and the positive outcome was the lucky result of poor decision-making?
1.3 Causal attribution: From actions to outcomes
The previous section described how Bayesian inference provides a general frameworkfor reasoning about a person’s mental states and abilities from having observed their actions.This process forms the first key component of the responsibility model we propose below.In this section we focus on the second component of our model, the causal role that aperson’s action played in bringing about the outcome. We show that one way of capturinga person’s causal contribution to the outcome is to consider how close the person’s actionwas to having made a di�erence to the outcome.

EXPECTATIONS & RESPONSIBILITY 5
Research on causal attribution has identified a host of factors that influence people’scausal judgments (Einhorn & Hogarth, 1986; Gerstenberg, Goodman, Lagnado, & Tenen-baum, 2012, 2014, 2015; Lagnado, Waldmann, Hagmayer, & Sloman, 2007; Sloman, 2005;Sloman & Lagnado, 2015; White, 2013; Wol�, 2007). In order to be held responsible foran outcome, a person’s action must have been causally connected to the outcome. Todetermine what role an action played for bringing about the outcome, we need a causalmodel of the situation that captures how the action of interest and other candidate causesa�ected the outcome. Here, we take inspiration from work in philosophy (Woodward, 2003;Yablo, 2002) and computer science (Halpern & Pearl, 2005; Pearl, 2000) that models causalrelationships in terms of counterfactual contrasts over a causal model of the situation. Inthese models, events of interest are represented as values of variables in a causal network,and the links between the variables illustrate the causal dependencies between them. Morespecifically, the causal situation is represented by a set of structural equations that specifyfor each variable in the network, how it depends on its parent variables.
Within this framework, a simple test for determining whether a candidate variablecaused the outcome is the following: compare the outcome that actually occurred with theoutcome that would have occurred, in a counterfactual situation in which the candidatevariable had a di�erent value. If the outcome is di�erent in this counterfactual situationcompared to the actual situation, the candidate variable qualifies as a cause (Lewis, 1973).While the simplicity of this counterfactual test for causation is appealing, it sometimes runsinto problems, such as when outcomes are overdetermined by multiple individually su�cientcauses. For example, in elections, the outcome would often not have been any di�erent if asingle voter had changed her mind. However, we still want to say that each voter has somedegree of (causal) responsibility for the outcome. The structural-model approach (Halpern& Pearl, 2005) handles this and other problems by replacing the simple counterfactual testof causation with a test of counterfactual dependence under contingency.1 A candidateevent can qualify as a cause even when it did not make a di�erence in the actual situation,as long as there was a possible situation that could have arisen, in which the event wouldhave made a di�erence. Even though the chances of casting the pivotal vote are low, it canhappen.
Based on this modified counterfactual test for causation, Chockler and Halpern (2004)proposed a model of responsibility that looks at the distance between the actual situationand a situation in which the person’s action would have been pivotal for the outcome. Thecloser a person’s action was to having been pivotal (i.e. the fewer aspects of the situationswould have needed to be di�erent), the greater its causal responsibility for the outcome. Inprevious work, we have shown that people’s judgments of responsibility are sensitive to howclose a person’s contribution was to being pivotal for the outcome (Allen, Jara-Ettinger,Gerstenberg, Kleiman-Weiner, & Tenenbaum, 2015; Gerstenberg & Lagnado, 2010; Zultan,Gerstenberg, & Lagnado, 2012), as well as to additional factors, such as how critical aperson’s action was expected to be for a positive group outcome (Gerstenberg, Halpern, &Tenenbaum, 2015; Gerstenberg & Lagnado, 2014; Lagnado & Gerstenberg, 2015, submitted;Lagnado, Gerstenberg, & Zultan, 2013).
1Much of the work goes into specifying which contingencies are allowed when checking for whether acounterfactual dependence holds between the candidate cause and e�ect (cf. Livengood, 2011). In thispaper, we will focus on relatively simple settings in which these di�culties do not arise.
EXPECTATIONS & RESPONSIBILITY 6
In line with this work, we predict that the extent to which a person is blamed orcredited for an outcome depends on the perceived causal influence that their action hadon the outcome. Here, we focus on how close the person’s action was to being pivotal asa measure for causal contribution. We will look at relatively simple settings in which adecision-maker chooses between two options. In some of the situations, their actions turnout to be pivotal – the outcome would have been di�erent if they had acted di�erently –whereas in other situations, their actions aren’t pivotal – the outcome would have been thesame even if they had chosen the other option. We predict that a person is viewed as moreresponsible for an outcome when her action was pivotal.
1.4 Previous accounts of responsibility attribution
Responsibility is a rich and multi-faceted concept (Fishbein & Ajzen, 1973; Gailey& Falk, 2008; Hart, 2008; Heider, 1958; Shaver & Drown, 1986; Vincent, 2011). There aremany factors that influence the way in which people assign responsibility to an agent for anoutcome, such as what the agent’s role or obligation was in the situation (Hamilton, 1978,1980; Malle, 2004), how much control the agent had over her action and the outcome (Ajzen,1971; Alicke, 2000; Wells & Gavanski, 1989; Young & Phillips, 2011), whether the agentwas able to foresee the consequences of her actions (Lagnado & Channon, 2008; Markman& Tetlock, 2000), whether the consequences were intended (Kleiman-Weiner, Gerstenberg,Levine, & Tenenbaum, 2015; Shultz & Wright, 1985), whether the consequences were real-ized in the intended way (Alicke & Rose, 2012; Guglielmo & Malle, 2010; Pizarro, Uhlmann,& Bloom, 2003), and how bad (or good) the consequences turned out to be (Robbennolt,2000; Schroeder & Linder, 1976).
There have been several attempts to integrate these di�erent factors into coherenttheoretical frameworks (Alicke, 2000; Malle et al., 2014; Schlenker, Britt, Pennington, Mur-phy, & Doherty, 1994; Shaver, 1985; Weiner, 1995). For example, Malle et al.’s (2014) pathmodel of blame postulates a sequence of tests that an observer goes through when assigningblame for a negative outcome, such as whether the agent was causally responsible for theoutcome, whether the action violated a norm, whether the agent intended the outcome,and so on. However, as with most previous theories of responsibility attribution, the modeldoes not make any quantitative predictions. As Malle et al. (2014, p. 177) state, “a majorlimitation of this and all extant models of moral judgment is that they do not generate anyquantitative predictions”. The model we propose in this paper only considers a subset ofthe factors identified in the literature, but expresses these factors in formally precise terms.This allows our model to generate quantitative predictions that we can test against people’sjudgments in a series of experiments.
As illustrated above, counterfactual thinking plays a key part in our model (cf. Byrne,2016; Kahneman & Miller, 1986; Lipe, 1991). Part of what it means to be responsible foran outcome is that one’s actions made a di�erence to the outcome. Our ability to mentallysimulate what would have happened in other possible situations allows us to compare whatactually happened with situations in which relevant aspects of the situation had been dif-ferent (Gerstenberg, Goodman, et al., 2015; Goodman, Tenenbaum, & Gerstenberg, 2015;Kahneman & Tversky, 1982). There are several counterfactual questions we may ask thattap into di�erent ways of how someone made a di�erence to the outcome (cf. Scha�er, 2005,2010). For example, in the law, we find two di�erent counterfactual criteria when assessing
EXPECTATIONS & RESPONSIBILITY 7
liability (Lagnado & Gerstenberg, submitted). First, there is the but-for test which aimsto establish whether the agent’s action was a cause of the outcome by asking if a di�erentoutcome would have come about but for the agent’s action (this is the simple counter-factual test discussed above Hart & Honoré, 1959/1985; Stapleton, 2008). Second, thereis the “reasonable man test” which is often employed when assessing negligence (Green,1967; Lloyd-Bostock, 1979). Here, we compare the agent’s action with how we would haveexpected a reasonable person to behave in the same situation.
Earlier formal attempts of capturing responsibility attributions have focused on theextent to which a person’s action made a di�erence to the outcome by comparing whatthe chances of the outcome would have been in the absence versus the presence of theaction (Brewer, 1977; Gerstenberg & Lagnado, 2012; Spellman, 1997). According to theseaccounts, responsibility increases the more a person’s action increased the probability ofthe outcome occurring compared to the counterfactual baseline in which the person hadnot acted. We can think of these accounts as probabilistic versions of the but-for test.Fincham and Jaspars (1983) showed that responsibility judgments are also sensitive tothe second aspect – the probability that another person would have acted similarly in thesame situation. They call this measure validation. A person’s action is validated if “other‘reasonable men’ would have acted similarly in the situation” (Fincham & Jaspars, 1983, p.146). Across a series of experiments, Fincham and Jaspars (1983) show that the validationmeasure is a good predictor for how participants assign responsibility and blame.
More recently, Petrocelli et al. (2011) proposed a new measure, counterfactual po-tency, that captures the extent to which counterfactuals influence judgments of responsibil-ity. Counterfactuals can be expressed as conditional statements such as “If John had notshot then Bill would not have died”. According to Petrocelli et al., the potency of a coun-terfactual thought is a multiplicative function of its “if-likelihood” and “then-likelihood”. Ifwe can readily imagine that John had done something other than shooting Bill (high “if-likelihood”), and that, in that case, Bill would not have died (high “then-likelihood”), thenthe counterfactual is potent. Since both aspects are predicted to combine multiplicatively,counterfactual thoughts are not potent when either the if-likelihood or then-likelihood (orboth) are low. The results of a series of experiments support their measure.
What all accounts discussed so far have in common is how they construe the rela-tionship between expectations and attributions of responsibility. As Mackie (1955, p. 144)states, the answer to the question of who is responsible “will depend on what we take to bethe normal, proper, or expected course of events; the person that we hold responsible is theone who steps outside this expected pattern.” Malle’s (2004) path model starts with detect-ing norm-violating events. Brewer (1977) and Spellman (1997) predict that responsibilityjudgments increase when our prior expectations of the outcome happening before the ac-tion were low. Fincham and Jaspars’s (1983) measure of validation, and the “if-likelihood”in Petrocelli et al.’s (2011) account predict that responsibility judgments go up when wewould have expected the person to act di�erently. There are also several accounts thatpredict that we favor unexpected over expected events as causes for an outcome (Halpern &Hitchcock, 2015; Hart & Honoré, 1959/1985; Hilton & Slugoski, 1986; Hitchcock & Knobe,2009; Kominsky, Phillips, Gerstenberg, Lagnado, & Knobe, 2015).
However, in a recent series of experiments Johnson and Rips (2015) showed that agentsare held more responsible for positive outcomes that resulted from expected compared to
EXPECTATIONS & RESPONSIBILITY 8
unexpected actions. In their experiments, an agent faced a choice between multiple optionsthat di�ered in their probability of bringing about a positive outcome. They found thatparticipants held the agent more responsible for a positive outcome when the agent chosean option that was better than any of the alternatives, and less responsible when the agentchose an inferior option. In line with the principle of rationality discussed above, Johnsonand Rips (2015) argue that optimality plays a key part in how people evaluate other people’sdecisions.
We concur with Johnson and Rips (2015) that when assigning responsibility, peopleevaluate whether a person did the right thing. But what counts as the right thing to dois not necessarily the action that was expected from the observer’s point of view, as wasthe case in Johnson and Rips’s (2015) experiments. Coming back to the goalie scenario,a skilled goalkeeper who can anticipate the penalty-taker’s shot, might make use of subtlecues that are not available to the observer. For an agent with access to such privilegedinformation, going for the unexpected corner may be the right thing to do. However, fora goalkeeper who lacks that skill, the right thing to do is to jump in the direction that ismore likely given what information he has about the striker’s tendency.
In line with previous accounts which predict that agents receive more responsibility forunexpected actions, we believe that agents are held more responsible for positive outcomes tothe extent that their action went beyond expectations. In baseball, there is a statistic called“Wins Above Replacement” (Jensen, 2013). This statistic tries to capture the di�erencethat a person makes to the number of games that a team wins over the course of the season.It compares the games the team actually won with the estimated number of games theteam would have won if the player under consideration had been replaced with anotherplayer. Our model incorporates a version of this idea. However, rather than comparingthe expected future success of one player with that of another, we compare the expectedfuture success of the same person before and after we observed their action. We predictthat agents receive credit for positive outcomes to the extent that our expectations aboutthem have increased after having observed their action, and blame for negative outcomesto the extent that our expectations about them got worse. We will now discuss in detailhow this process of updating one’s expectations about a person works in our model.
2 Computational Model
Our model assigns a degree of responsibility to people making decisions under uncer-tainty that result in positive or negative outcomes (cf. Botti & McGill, 2006; Leonhardt,Keller, & Pechmann, 2011; Nordbye & Teigen, 2014). Our model has two components: i) adispositional inference from the person’s action to their character, which leads to a changein expectation about the person’s future behavior, and ii) a causal inference about the re-lationship between the person’s action and the outcome. We will discuss each componentin turn.
2.1 Dispositional inference and expectation change
The first component of our model formalizes how we update our expectations abouta person’s future performance after having observed the person’s action, and the outcomethat resulted. This inference involves two steps. The first step is to update our belief about

EXPECTATIONS & RESPONSIBILITY 9
the type of person the decision maker is. The second step is to transform this updatedbelief into an updated expectation about how well the person will do in the future. We willdiscuss each step in turn.
2.1.1 Dispositional inference. The dispositional inference in the first step isnaturally expressed as Bayesian inference (cf. Ajzen & Fishbein, 1975). We want to inferthe type of person t œ T someone is, from having observed them take an action a œ A:
P (T = t|A = a) Ã P (A = a|T = t) · P (T = t). (1)
The prior P (T = t) expresses the model’s initial belief about the person’s type, beforeseeing them take an action. The likelihood function P (A = a|T = t) expresses how aperson decides to take an action, given their type. These two pieces determine the posteriorbelief about the person P (T = t|A = a). In principle, the space of agent types T can bemade very rich by incorporating the many factors that are known to influence attributionsof responsibility. Here, we focus on a small space of agents that is su�ciently rich tocapture those aspects of a person’s personality that are most relevant for how people assignresponsibility in the situations considered in this paper.
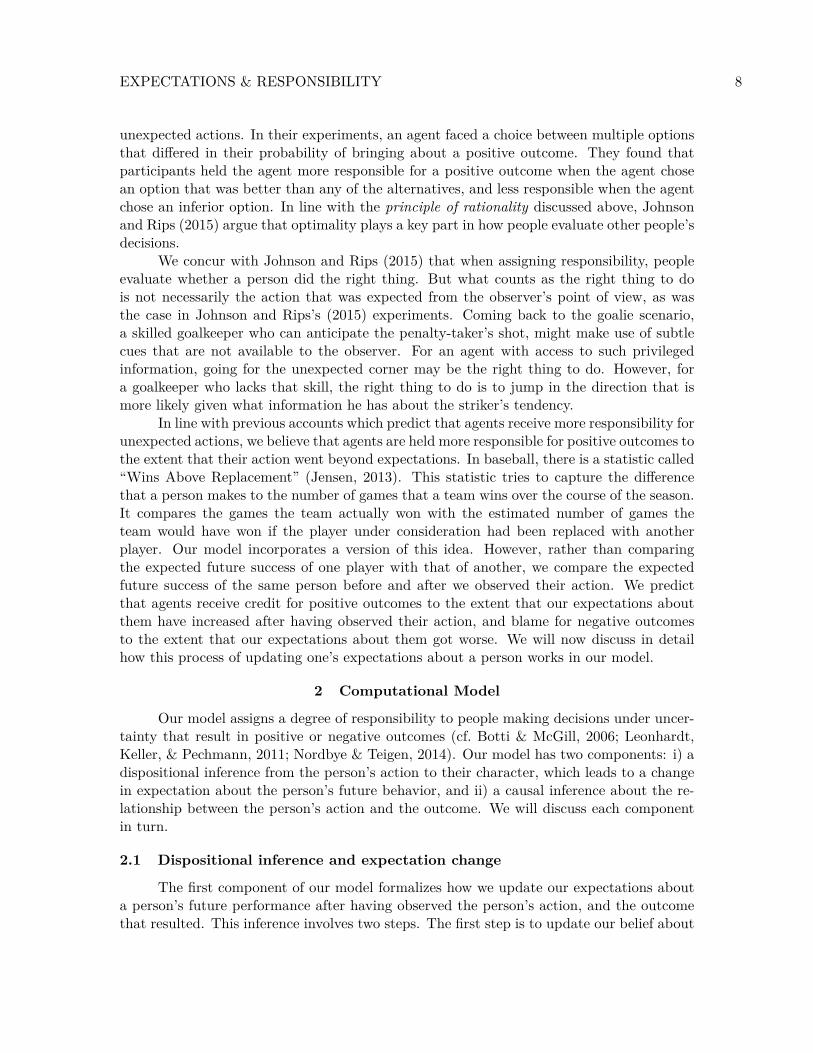
Figure 1 illustrates the inference problem that participants face in our experiments.The world W refers to the scenario where the action takes place. Each condition in ourexperiments is a di�erent world in this sense. The world determines what kinds of situationsS are possible, and what types of agents T are likely to be present in the world. Agents takeactions A depending on the situation they find themselves in, and depending on what typeof agent they are. In our experiments, we focus on simple situations that are characterizedby two action alternatives. What action an agent takes in a particular situation determineswhether the outcome O is positive or negative.
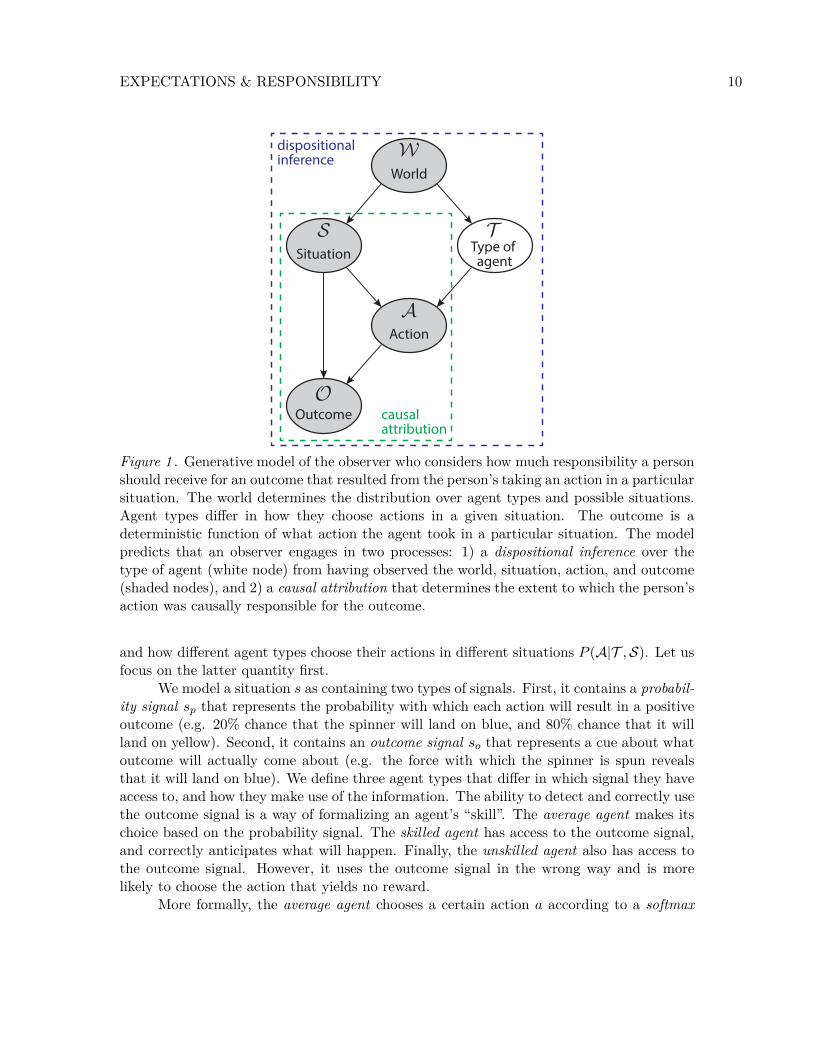
Let us illustrate how this works more concretely, via the examples shown in Figure 2.Figure 2a shows the “goalie world”. The possible outcomes for the goalie are saving the ball(O = positive), or failing to save the ball (O = negative). For positive outcomes, the agentreceives a reward of r = 1. Negative outcomes yield no reward (r = 0). In this particularsituation, the goalie knows that the striker has a 20% chance of shooting the ball towardsthe left corner, and a 80% chance of shooting the ball towards the right corner. The strikerdoes not know that the goalie knows about his tendency to shoot towards the right. Thegoalie chose the action of jumping towards the left (the unlikely 20% direction) and savedthe ball, as the striker decided to kick left. Figure 2b shows the “spinner world”. Here,the possible outcomes are correctly predicting what color the spinner will land on (r = 1),or making a wrong prediction (r = 0). In this situation, the spinner had a 20% chance oflanding on blue, and an 80% chance of landing on yellow. The player correctly predictedthat the spinner will land on blue (the unlikely outcome).
In both examples, the observed variables are the world, the situation, the action theagent took, and the outcome that resulted. The specific agent type is unobserved but canbe inferred through Bayes’ theorem:
P (T = t|W = w, S = s, A = a) = P (A = a|S = s, T = t) · P (T = t|W = w)q
tœTP (A = a|S = s, T = t) · P (T = t|W = w) , (2)
where t ranges over the di�erent agent types T . This equation shows that in order to inferthe agent type, we need to know the distribution over agent types in a given world P (T |W),
EXPECTATIONS & RESPONSIBILITY 10
Type of agentSituation
World
Action
dispositionalinference
causalattribution
Outcome
Figure 1 . Generative model of the observer who considers how much responsibility a personshould receive for an outcome that resulted from the person’s taking an action in a particularsituation. The world determines the distribution over agent types and possible situations.Agent types di�er in how they choose actions in a given situation. The outcome is adeterministic function of what action the agent took in a particular situation. The modelpredicts that an observer engages in two processes: 1) a dispositional inference over thetype of agent (white node) from having observed the world, situation, action, and outcome(shaded nodes), and 2) a causal attribution that determines the extent to which the person’saction was causally responsible for the outcome.
and how di�erent agent types choose their actions in di�erent situations P (A|T , S). Let usfocus on the latter quantity first.
We model a situation s as containing two types of signals. First, it contains a probabil-ity signal s
p
that represents the probability with which each action will result in a positiveoutcome (e.g. 20% chance that the spinner will land on blue, and 80% chance that it willland on yellow). Second, it contains an outcome signal s
o
that represents a cue about whatoutcome will actually come about (e.g. the force with which the spinner is spun revealsthat it will land on blue). We define three agent types that di�er in which signal they haveaccess to, and how they make use of the information. The ability to detect and correctly usethe outcome signal is a way of formalizing an agent’s “skill”. The average agent makes itschoice based on the probability signal. The skilled agent has access to the outcome signal,and correctly anticipates what will happen. Finally, the unskilled agent also has access tothe outcome signal. However, it uses the outcome signal in the wrong way and is morelikely to choose the action that yields no reward.
More formally, the average agent chooses a certain action a according to a softmax
EXPECTATIONS & RESPONSIBILITY 11
20% 80%
(a) Goalie world
80%
20%
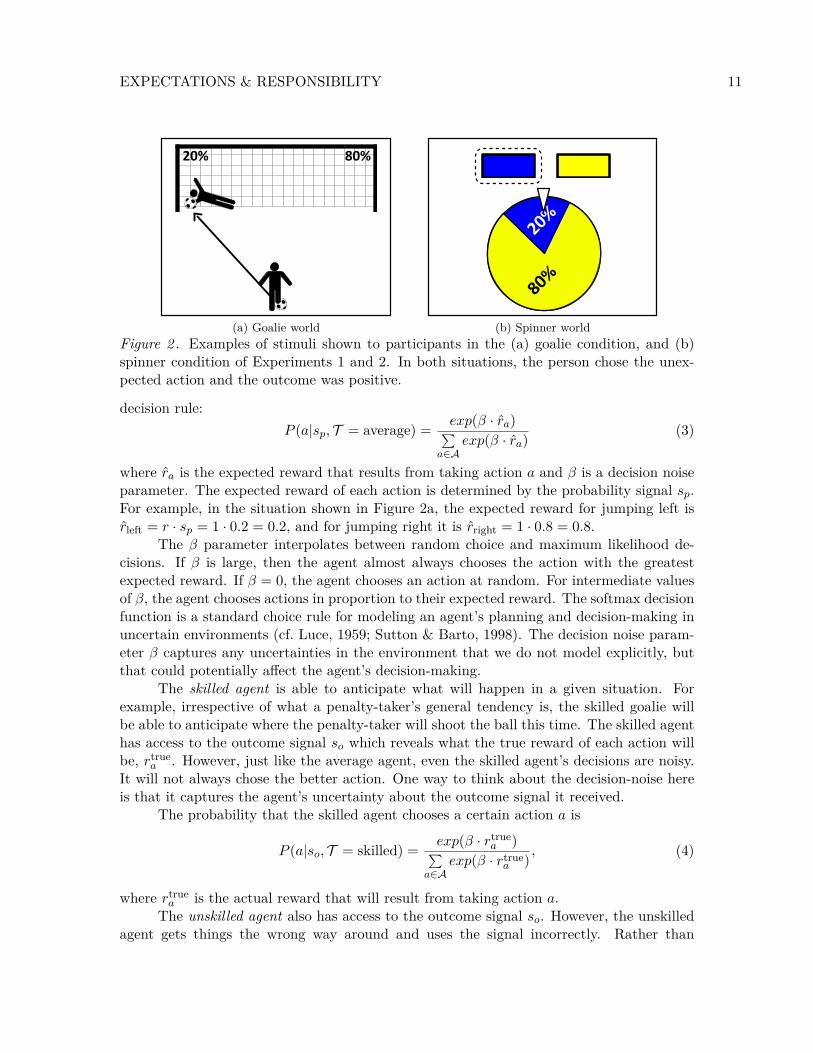
(b) Spinner worldFigure 2 . Examples of stimuli shown to participants in the (a) goalie condition, and (b)spinner condition of Experiments 1 and 2. In both situations, the person chose the unex-pected action and the outcome was positive.
decision rule:P (a|s
p
, T = average) = exp(— · r̂
a
)q
aœAexp(— · r̂
a
) (3)
where r̂
a
is the expected reward that results from taking action a and — is a decision noiseparameter. The expected reward of each action is determined by the probability signal s
p
.For example, in the situation shown in Figure 2a, the expected reward for jumping left isr̂
left
= r · s
p
= 1 · 0.2 = 0.2, and for jumping right it is r̂
right
= 1 · 0.8 = 0.8.The — parameter interpolates between random choice and maximum likelihood de-
cisions. If — is large, then the agent almost always chooses the action with the greatestexpected reward. If — = 0, the agent chooses an action at random. For intermediate valuesof —, the agent chooses actions in proportion to their expected reward. The softmax decisionfunction is a standard choice rule for modeling an agent’s planning and decision-making inuncertain environments (cf. Luce, 1959; Sutton & Barto, 1998). The decision noise param-eter — captures any uncertainties in the environment that we do not model explicitly, butthat could potentially a�ect the agent’s decision-making.
The skilled agent is able to anticipate what will happen in a given situation. Forexample, irrespective of what a penalty-taker’s general tendency is, the skilled goalie willbe able to anticipate where the penalty-taker will shoot the ball this time. The skilled agenthas access to the outcome signal s
o
which reveals what the true reward of each action willbe, r
true
a
. However, just like the average agent, even the skilled agent’s decisions are noisy.It will not always chose the better action. One way to think about the decision-noise hereis that it captures the agent’s uncertainty about the outcome signal it received.
The probability that the skilled agent chooses a certain action a is
P (a|so
, T = skilled) = exp(— · r
true
a
)q
aœAexp(— · r
true
a
) , (4)
where r
true
a
is the actual reward that will result from taking action a.The unskilled agent also has access to the outcome signal s
o
. However, the unskilledagent gets things the wrong way around and uses the signal incorrectly. Rather than
EXPECTATIONS & RESPONSIBILITY 12
choosing randomly, an unskilled agent is actually more likely to choose the action that willresult in a lower reward. We will thus sometimes refer to the ‘unskilled agent’ as the ‘badagent’. The probability that the unskilled agent chooses a certain action a is
P (a|so
, T = unskilled) = exp(— · (≠r
true
a
))q
aœAexp(— · (≠r
true
a
)) . (5)
Since positive outcomes yield a reward of r = 1 and negative outcomes yield no reward(r = 0), the unskilled agent’s decision function implies that it is more likely to choose anaction that will result in a negative outcome, than an action that yields a positive reward.
The considered space of agents is rich enough to capture important aspects, suchas skill and rational decision-making, that are relevant for how people evaluate anotherperson’s actions in an achievement context. The space of agents is small enough so thatwe can explicitly ask participants about what agent they believe a person was after havingobserved the person’s action in our experiments.
Having specified the decision-making functions that are necessary to determineP (A|S, T ), we now turn to the distribution over agent types for each world P (T |W). Thereare many factors that can influence what sort of agents people consider plausible in a givenworld. For example, people may think it a-priori more likely that some people possess theskill to correctly anticipate the outcome in a game like soccer, compared to a game likethe spinner prediction task. In Experiments 2–4, we introduce participants to the threedi�erent agent types. Instead of explicitly probing participants’ beliefs about how likelythey consider each agent type to be a-priori, we infer participants’ priors based on theirjudgments of what type of agent they think a person is, after having observed the person’saction.
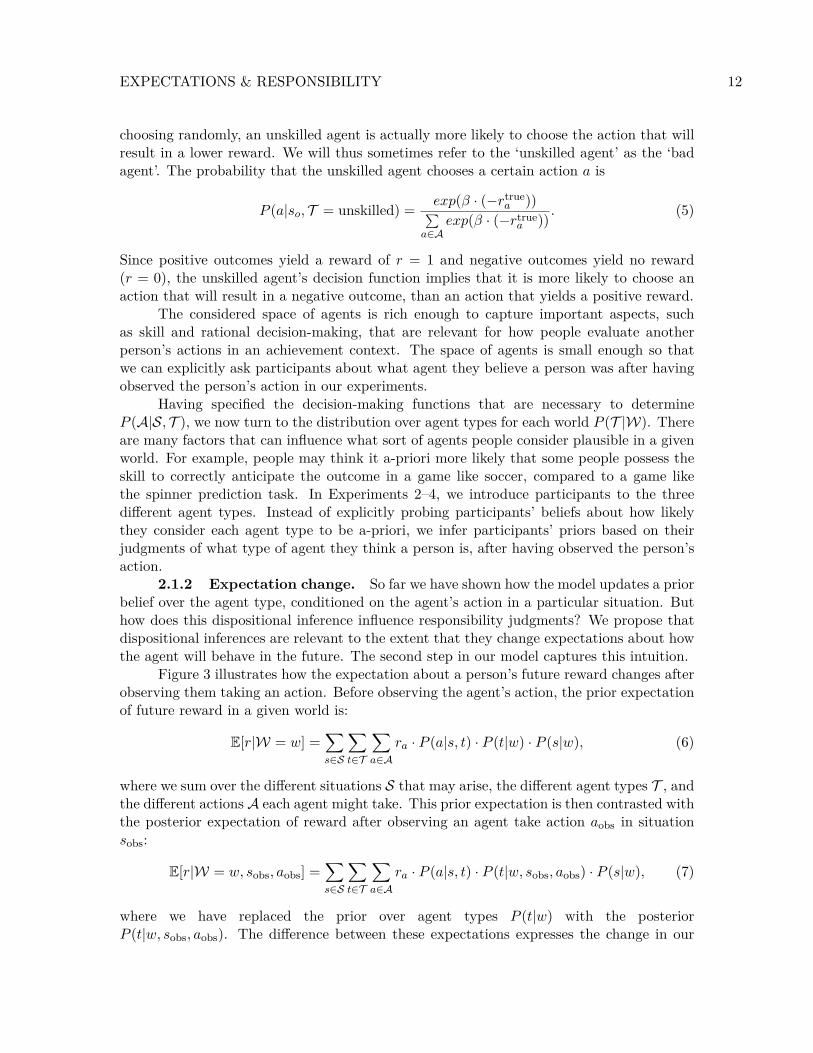
2.1.2 Expectation change. So far we have shown how the model updates a priorbelief over the agent type, conditioned on the agent’s action in a particular situation. Buthow does this dispositional inference influence responsibility judgments? We propose thatdispositional inferences are relevant to the extent that they change expectations about howthe agent will behave in the future. The second step in our model captures this intuition.
Figure 3 illustrates how the expectation about a person’s future reward changes afterobserving them taking an action. Before observing the agent’s action, the prior expectationof future reward in a given world is:
E[r|W = w] =ÿ
sœS
ÿ
tœT
ÿ
aœAr
a
· P (a|s, t) · P (t|w) · P (s|w), (6)
where we sum over the di�erent situations S that may arise, the di�erent agent types T , andthe di�erent actions A each agent might take. This prior expectation is then contrasted withthe posterior expectation of reward after observing an agent take action a
obs
in situations
obs
:
E[r|W = w, s
obs
, a
obs
] =ÿ
sœS
ÿ
tœT
ÿ
aœAr
a
· P (a|s, t) · P (t|w, s
obs
, a
obs
) · P (s|w), (7)
where we have replaced the prior over agent types P (t|w) with the posteriorP (t|w, s
obs
, a
obs
). The di�erence between these expectations expresses the change in our

EXPECTATIONS & RESPONSIBILITY 13
Evidence PosteriorPrior
bad average skilled
B A S
bad average skilled
B A S
Figure 3 . Diagrammatic illustration how the model goes from a prior belief about an agent’sexpected future reward in a given world, to a posterior belief after having observed the agenttake action a
obs
in situation s
obs
. The greater the di�erence between posterior and priorexpected reward, the more responsibility the model assigns to the agent.
expectation about how well the person will do in the future:
Di�erence in expected reward = E[r|W = w, s
obs
, a
obs
] ≠ E[r|W = w] (8)
Our model predicts that an observer credits an actor for a positive outcome to the extentthat the observer’s expectations about the actor’s future reward have increased after havingobserved their action. Observers are predicted to blame actors for negative outcomes to theextent that the observer’s expectations about the actor’s future reward have decreased. Inshort, exceeding expectations for positive outcomes means more credit, whereas not meetingexpectations for negative outcomes means more blame.
2.2 Causal attribution
The di�erence in expected reward is the first component in our responsibility model.It relies on a dispositional inference about the person based on having observed their action.The second component captures the causal role that the person’s action played for bringingabout the outcome in a particular situation (see causal attribution in Figure 1). Above, wehave shown that one way of capturing how much a person’s action a�ected the outcome, isby considering how close the action was to having made a di�erence to the outcome.
Consider a situation in which the outcome of an election was 5 to 2 in favor ofcandidate C
1
over candidate C2
. According to a simple counterfactual but-for test, none ofthe 5 C
1
votes qualifies as a cause of C1
’s victory. Candidate C1
would still have won evenif any of the voters had voted for candidate C
2
instead. However, we still want to say thateach of the voters was a cause of the outcome, and bears some responsibility for C
1
’s win.Halpern and Pearl’s (2005) structural-model of causation relaxes the simple counterfactualtest, by considering counterfactual dependence under di�erent possible situations that couldhave arisen. For example, if the outcome of the vote above were 4 to 3 (instead of 5 to
EXPECTATIONS & RESPONSIBILITY 14
2), then candidate C1
’s win would have been dependent on each of the 4 voters. If, in thissituation, any of her supporters were to vote for candidate C
2
instead, then the outcomewould have been di�erent.
Based on this modified counterfactual definition of causation, Chockler and Halpern(2004) proposed a structural model of responsibility that links the degree to which a cause isheld responsible for an outcome to the minimal distance between the actual situation and thecounterfactual situation in which the candidate cause would have been pivotal. Accordingly,the responsibility (or pivotality)2 of a person taking action a œ A, for a particular outcomeo œ O in a situation s œ S is defined as
Pivotality for outcome(A = a, O = o, S = s) = 1N + 1 , (9)
where N is the minimal number of changes that is needed to establish a counterfactualdependence between the person’s action a and the outcome o in situation s. Applying thismodel to the voting example above yields a responsibility of 1
2
for each of the five voters whovoted in favor of candidate C
1
. While none of the voters made a di�erence to the outcomein the actual situation, each of them would have made a di�erence in a situation in whichone of the other four voters had voted for candidate C
2
instead. A single change (N = 1) isrequired to make any supporting voter pivotal for C
1
’s win.In some of the worlds we consider below (the goalie and the spinner worlds) the
agent’s action is always pivotal. If a goalkeeper did not save the ball, that means she wouldhave saved the ball if she had jumped in the other direction. However, in other worlds, weconsider situations in which the outcome would have been positive (or negative) no matterwhat the agent did. For example, in one experiment a gardener faces the choice of whichfertilizer to use in order to make a flower grow. In some situations, in turns out that theflower would have grown no matter which of the fertilizers the gardener chose. In thesesituations, the agent’s pivotality is reduced. We predict that a person will be judged moreresponsible for an outcome when her action was pivotal in the actual situation.
2.3 Putting it together: Responsibility judgments
When we put the di�erent pieces together, we get the following overall model for howpeople assign responsibility (cf. Figure 1):
Responsibility = – + w
1
· (Di�erence in expected reward) + w
2
· (Pivotality for outcome),(10)
where w
1
and w
2
determine how strongly each component of the model influences par-ticipants’ responsibility judgments, and – is a parameter that allows us to map from themodel’s scale to participants’ response scale in the experiments.
The first component – ‘Di�erence in expected reward’ – captures how observing theperson’s action changed the observer’s expectation about how well this person will do in thefuture. The second component – ‘Pivotality for outcome’ – captures the causal role thatthe person’s action played in bringing about the outcome. We assume here for simplicitythat ‘Di�erence in expected reward’ and ‘Pivotality for outcome’ combine additively to
2We use the term pivotality here instead of responsibility because in our model, pivotality features as oneof the factors that is predicted to influence how people assign responsibility.
EXPECTATIONS & RESPONSIBILITY 15
a�ect judgments of responsibility. However, we believe that in order for a person to be heldresponsible for the outcome, their action must have made a di�erence to the outcome inone way or another. If there was no possible situation in which a person’s action could havebeen pivotal, then we would not expect the person to be held responsible for the outcome.Such boundary cases do not arise for the experiments we discuss below.
Our model has four free parameters in total. — captures the decision noise in the actionselection functions for the di�erent agents (cf. Equations 3–5). As explained in more detailbelow, we fit — = 1.46 by minimizing the sum of squared di�erences between the model’spredicted posterior over the di�erent agent types, and participants’ empirical judgments.We allowed participants’ priors over the three di�erent agents to vary between experiments.These priors were inferred from participants’ posterior judgments and constrained by thedecision noise parameter —. The remaining three parameters (– = 5.94, w
1
= 175.86, andw
2
= 30.84) capture how ‘Di�erence in expected reward’ and the ‘Pivotality for outcome’are weighted and mapped onto participants’ response scale (cf. Equation 10). We usedthe same set of parameters to derive predictions for each individual experiment. Finally,we used cross-validation methods to compare our model with lesioned models that consideronly one of the two aspects, as well as an alternative model that makes predictions basedon action expectations directly.
In the remainder of this paper, we report the results of several experiments that testthis model of responsibility attribution for judgments under uncertainty. Experiment 1shows that the mapping between action expectations and responsibility judgments di�ersdepending on the context of the scenario. Experiment 2 replicates the results from Exper-iment 1 and tests the predictions of our model by explicitly informing participants aboutthe di�erent agent types. In Experiments 3 and 4, we look more closely at the influence ofpivotality on participants’ responsibility judgments.
3 Experiment 1: Goalies & Spinners
Participants in this experiment judged to what extent an agent who made a decisionunder uncertainty was to credit for a positive outcome, or to blame for a negative one. Wemanipulated (i) the expectation that the chosen action will lead to success, (ii) whether theoutcome was positive or negative, and (iii) the framing of the task.3
The agent always faced a choice between two actions. In the goalie world (see Fig-ure 2a), participants evaluated the actions of soccer goalkeepers who could either jump tothe left or to the right side, to block a shot by a striker. The outcome was positive (from theperspective of the goalkeeper) if the goalkeeper decided to jump in the direction in which thestriker shot, and negative otherwise. The strikers had a tendency to shoot in one directionor another. For example, a particular striker tends to shoot to the right 80% of the timeand to the left 20% of the time. The goalkeeper was said to know the striker’s tendency,and also that the striker is unaware of the fact that the goalkeeper has this information.
In the spinner world (see Figure 2b), participants evaluated the actions of contestantsin a game show whose task it was to predict the outcome of a two-colored spinner. Forexample, a particular contestant might face a spinner with an 80% chance of landing on
3Data from this experiment have appeared previously in Gerstenberg, Ullman, Kleiman-Weiner, Lagnado,and Tenenbaum (2014).
EXPECTATIONS & RESPONSIBILITY 16
yellow and 20% chance of landing on blue.We predict that the task framing a�ects people’s assumptions about the plausibility
that an agent could exhibit skill, and that this will in turn a�ect participants’ responsibilityjudgments. We predict that in the goalie world, where skill is plausible, participants willgive more credit when positive outcomes resulted from unexpected actions, compared toexpected actions. In contrast, in the spinner world, where skill is less plausible, we pre-dict that participants will give more credit when positive outcomes resulted from expectedcompared to unexpected actions. For negative outcomes, we predict that attributions ofblame increase the more unexpected the action was for both the spinner and goalie worlds.Unexpected actions that lead to negative outcomes are particularly indicative of the agentbeing unskilled.
3.1 Methods
3.1.1 Participants. Participants for all experiments reported in this paper wererecruited via Amazon Mechanical Turk (Crump, McDonnell, & Gureckis, 2013; Mason &Suri, 2012; Paolacci, Chandler, & Ipeirotis, 2010). Only participants who live in the US,have a Human Intelligence Task (HIT) approval rate of at least 95%, and have a minimumnumber of 50 approved HITs were allowed to participate (see Mason & Suri, 2012, fordetails). Participants were reimbursed at a rate of $6 per hour. 83 participants (39 female,M
age
= 33.7, SDage
= 11.14) participated in this experiment. No participants were excludedfrom the analyses in any of our experiments. We made sure that no participant took partin more than one of our experiments.
3.1.2 Design. The framing of the task varied between participants (N = 41 inthe goalie world, and N = 42 in the spinner world). We varied the probability that a person’saction will be successful (20%, 40%, 60% and 80%), as well as whether the outcome wasnegative or positive within participants. Thus, we have a 2 (world; between) ◊ 4 (probabilityof success; within) ◊ 2 (outcome; within) design.
3.1.3 Procedure. The experiment was programmed in Flash CS5.4 After beingintroduced to the basic features of the task, participants first played the game themselvesfor ten rounds. As goalkeepers, they decided whether to jump towards the right or leftcorner, and as game show contestants, they predicted which out of two colors a spinner willland on.
In each round of the main phase of the experiment, participants saw two di�erentsituations shown on the same screen (see Table 1). For example, in Round 2, Player 1’schosen action had an 80% chance of being successful whereas Player 2’s action had only a20% chance of being successful (assuming that neither player was able to anticipate what willhappen). The outcome in both situations was positive, that is, both goalkeepers saved theball in the goalie world, or both contestants predicted the correct outcome in the spinnerworld. Our motivation for presenting the stimuli in pairs was to highlight the contrastbetween situations (cf. Nagel & Waldmann, 2013). We told participants that each situationfeatured a di�erent person.
We will refer to players’ actions as ‘expected’ when the observer’s expectation thatthe action will be successful based on the probability information is greater than 50%, and
4Materials for this paper including the raw data, analysis file, and links to the experiments can be accessedhere: https://github.com/tobiasgerstenberg/expectation_responsibility
EXPECTATIONS & RESPONSIBILITY 17
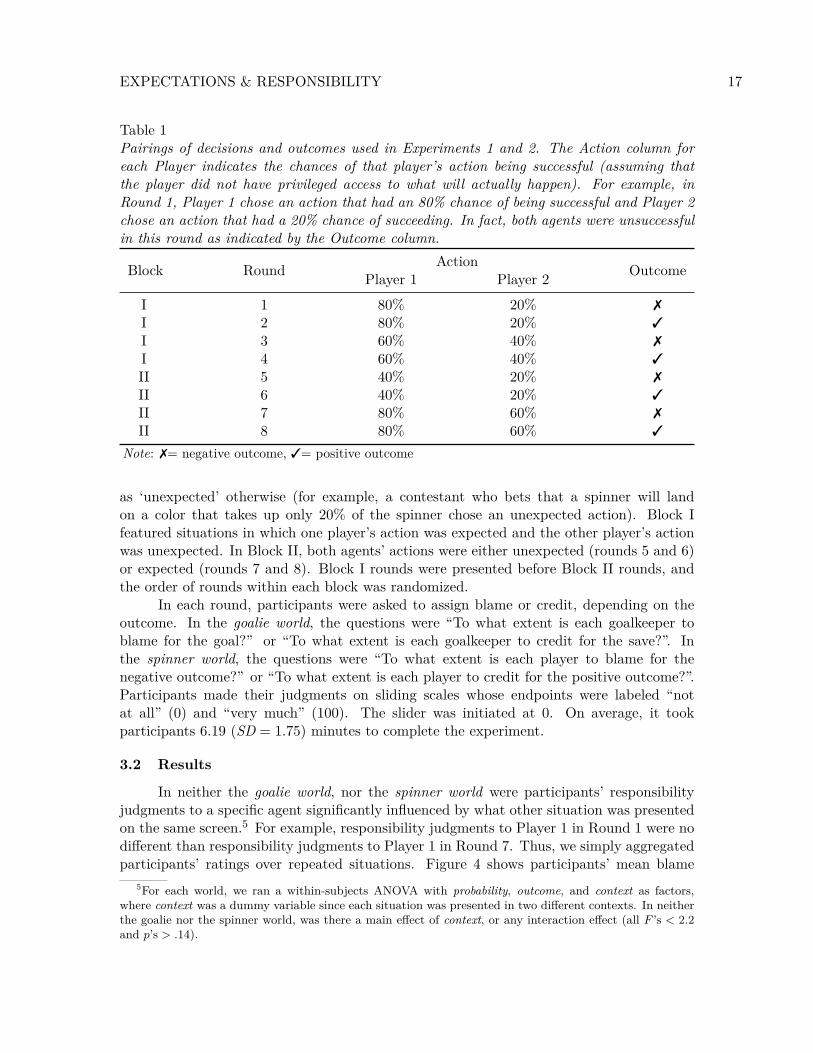
Table 1Pairings of decisions and outcomes used in Experiments 1 and 2. The Action column foreach Player indicates the chances of that player’s action being successful (assuming thatthe player did not have privileged access to what will actually happen). For example, inRound 1, Player 1 chose an action that had an 80% chance of being successful and Player 2chose an action that had a 20% chance of succeeding. In fact, both agents were unsuccessfulin this round as indicated by the Outcome column.
Block Round Action OutcomePlayer 1 Player 2I 1 80% 20% 7I 2 80% 20% 3I 3 60% 40% 7I 4 60% 40% 3II 5 40% 20% 7II 6 40% 20% 3II 7 80% 60% 7II 8 80% 60% 3
Note: 7= negative outcome, 3= positive outcome
as ‘unexpected’ otherwise (for example, a contestant who bets that a spinner will landon a color that takes up only 20% of the spinner chose an unexpected action). Block Ifeatured situations in which one player’s action was expected and the other player’s actionwas unexpected. In Block II, both agents’ actions were either unexpected (rounds 5 and 6)or expected (rounds 7 and 8). Block I rounds were presented before Block II rounds, andthe order of rounds within each block was randomized.
In each round, participants were asked to assign blame or credit, depending on theoutcome. In the goalie world, the questions were “To what extent is each goalkeeper toblame for the goal?” or “To what extent is each goalkeeper to credit for the save?”. Inthe spinner world, the questions were “To what extent is each player to blame for thenegative outcome?” or “To what extent is each player to credit for the positive outcome?”.Participants made their judgments on sliding scales whose endpoints were labeled “notat all” (0) and “very much” (100). The slider was initiated at 0. On average, it tookparticipants 6.19 (SD = 1.75) minutes to complete the experiment.
3.2 Results
In neither the goalie world, nor the spinner world were participants’ responsibilityjudgments to a specific agent significantly influenced by what other situation was presentedon the same screen.5 For example, responsibility judgments to Player 1 in Round 1 were nodi�erent than responsibility judgments to Player 1 in Round 7. Thus, we simply aggregatedparticipants’ ratings over repeated situations. Figure 4 shows participants’ mean blame
5For each world, we ran a within-subjects ANOVA with probability, outcome, and context as factors,where context was a dummy variable since each situation was presented in two di�erent contexts. In neitherthe goalie nor the spinner world, was there a main e�ect of context, or any interaction e�ect (all F ’s < 2.2and p’s > .14).
EXPECTATIONS & RESPONSIBILITY 18
negative outcome positive outcome
0
25
50
75
100
20% 40% 60% 80% 20% 40% 60% 80%
resp
onsi
bilit
y ra
ting
(a) Goalie world
negative outcome positive outcome
0
25
50
75
100
20% 40% 60% 80% 20% 40% 60% 80%
resp
onsi
bilit
y ra
ting
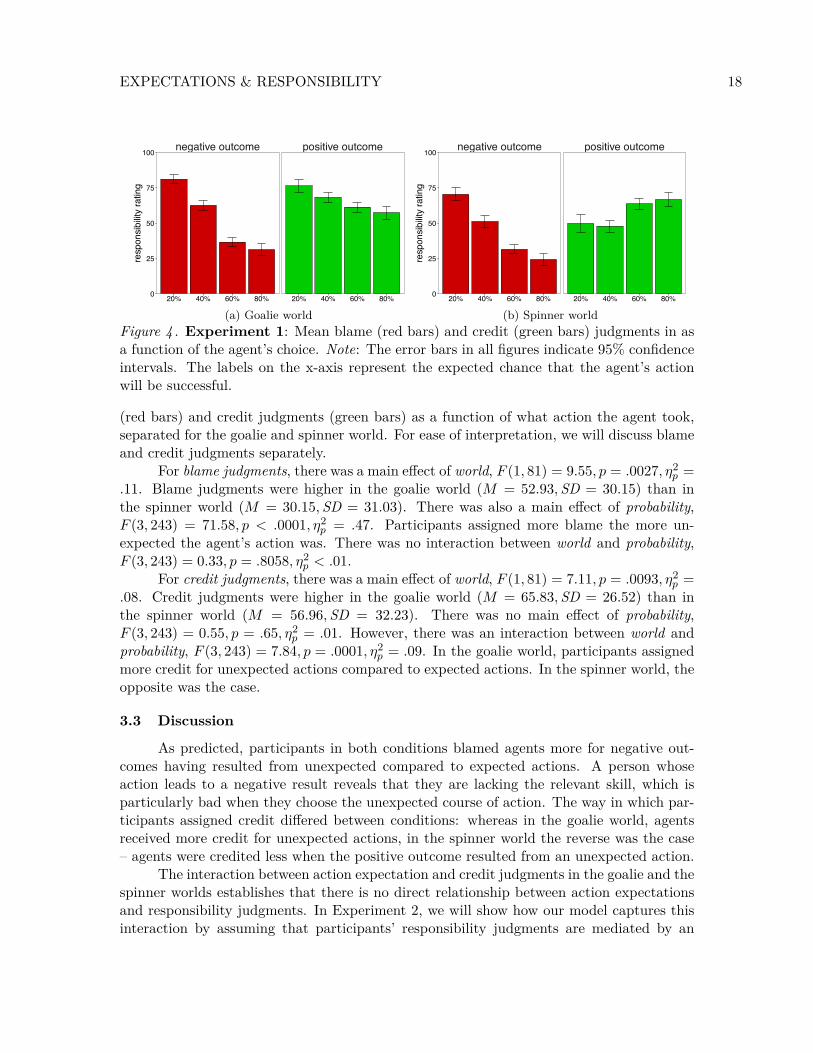
(b) Spinner worldFigure 4 . Experiment 1: Mean blame (red bars) and credit (green bars) judgments in asa function of the agent’s choice. Note: The error bars in all figures indicate 95% confidenceintervals. The labels on the x-axis represent the expected chance that the agent’s actionwill be successful.
(red bars) and credit judgments (green bars) as a function of what action the agent took,separated for the goalie and spinner world. For ease of interpretation, we will discuss blameand credit judgments separately.
For blame judgments, there was a main e�ect of world, F (1, 81) = 9.55, p = .0027, ÷
2
p
=.11. Blame judgments were higher in the goalie world (M = 52.93, SD = 30.15) than inthe spinner world (M = 30.15, SD = 31.03). There was also a main e�ect of probability,F (3, 243) = 71.58, p < .0001, ÷
2
p
= .47. Participants assigned more blame the more un-expected the agent’s action was. There was no interaction between world and probability,F (3, 243) = 0.33, p = .8058, ÷
2
p
< .01.For credit judgments, there was a main e�ect of world, F (1, 81) = 7.11, p = .0093, ÷
2
p
=.08. Credit judgments were higher in the goalie world (M = 65.83, SD = 26.52) than inthe spinner world (M = 56.96, SD = 32.23). There was no main e�ect of probability,F (3, 243) = 0.55, p = .65, ÷
2
p
= .01. However, there was an interaction between world andprobability, F (3, 243) = 7.84, p = .0001, ÷
2
p
= .09. In the goalie world, participants assignedmore credit for unexpected actions compared to expected actions. In the spinner world, theopposite was the case.
3.3 Discussion
As predicted, participants in both conditions blamed agents more for negative out-comes having resulted from unexpected compared to expected actions. A person whoseaction leads to a negative result reveals that they are lacking the relevant skill, which isparticularly bad when they choose the unexpected course of action. The way in which par-ticipants assigned credit di�ered between conditions: whereas in the goalie world, agentsreceived more credit for unexpected actions, in the spinner world the reverse was the case– agents were credited less when the positive outcome resulted from an unexpected action.
The interaction between action expectation and credit judgments in the goalie and thespinner worlds establishes that there is no direct relationship between action expectationsand responsibility judgments. In Experiment 2, we will show how our model captures thisinteraction by assuming that participants’ responsibility judgments are mediated by an

EXPECTATIONS & RESPONSIBILITY 19
inference from the observed action to a person’s disposition.
4 Experiment 2: Goalies & Spinners revisited
Experiment 2 serves as both a replication of Experiment 1, and an investigation ofthe proposed model. To directly test our model, we explicitly informed participants at thebeginning of the experiment that there are three di�erent types of agents. We added asecond stage to the experiment, in which participants were asked to indicate what type ofagent they thought the person was after having observed their action.
In the goalie condition, we told participants that average goalkeepers base their deci-sion to jump in one direction or another merely on the prior tendency of the striker. Skilledgoalkeepers could correctly anticipate the striker’s shot. They could save balls that wereshot in the opposite direction to that of a striker’s normal tendency. Unskilled goalkeepersdid not have the ability to anticipate the striker’s shot, but nevertheless thought that theydid. For example, they would falsely anticipate that a striker would decide to go againsttheir usual tendency, when in fact the striker did go with their tendency.
In the spinner condition, we told participants that average players base their decisionon the probabilities of the spinner. Skilled players could correctly anticipate on what colorthe spinner would land. They could even correctly predict the outcome if the spinner hadlanded on the less likely color. Unskilled players did not have the ability to anticipate onwhat color the spinner would land but nevertheless thought that they did. For example,they would falsely predict that a spinner would land on the less likely color, when in fact itlanded on the more likely color.
Based on the results from Experiment 1, we expected to replicate the asymmetricalway in which action expectations a�ect attributions of blame and credit for the goalie andspinner worlds. However, we anticipated that introducing the explicit space of agents mayinfluence people’s priors to some degree. For example, most participants might a-priori thinkit highly unlikely that game show contestants could anticipate the outcome of a randomspinner, but when told explicitly that some contestants can do this, they will update theirpriors accordingly. Still, we expected that participants bring their general world knowledgeto bear on the task, and be more skeptical about the possibility of skill in the spinner worldcompared to the goalie world. Thus, we expected the di�erences between worlds to persist,but be smaller in Experiment 2 compared to Experiment 1.
4.1 Methods
4.1.1 Participants. 82 participants (Mage
= 34.8, SDage
= 11.26, N
female
= 27)completed this experiment.
4.1.2 Design. The design was equivalent to Experiment 1. There were N = 41participants in the goalie condition, and N = 41 participants in the spinner condition.In addition to the responsibility judgment phase, the experiment also featured an agentinference phase in which participants judged what type of agent they thought someone wasfor each of the eight di�erent situations.
4.1.3 Procedure. The initial instructions were identical to Experiment 1. Again,participants played the game themselves for ten rounds. Before completing the responsi-bility judgment phase, participants were instructed about the three di�erent agent types.

EXPECTATIONS & RESPONSIBILITY 20
Blocks and trials were assigned in the same way as in Experiment 1. After completing theresponsibility judgment phase, participants were told that in the second part of the exper-iment their task will be to judge how likely they thought that a given player was average,skilled, or unskilled. Participants were reminded how each agent type chose their actions.Participants were also told that they would be shown eight situations they had alreadyseen in the first part of the experiment. For each situation, participants were instructed todistribute their belief over the three possible agent types so that the overall judgment sumsup to 100%, and were given an example.
Participants indicated their judgments by typing numbers into three text boxes, onefor each agent type. The order of the vertical positions in which the response options forthe three agent types were presented on the screen was randomized between participants.Participants could only proceed to the next trial if their judgments added up to 100%. Onaverage, it took participants 11.4 (SD = 4.5) minutes to complete the experiment.
4.2 Results
We will first report the results from the agent inference phase, and then look at theresults from the responsibility judgment phase. For each phase, we first describe the modelpredictions, and then show how participants’ empirical judgments compare.
4.3 Agent inferences
Model predictions. We model participants’ judgments via Bayesian inference.Participants are predicted to update their prior beliefs about what agent type a personis, to a posterior belief after having observed the person’s action (cf. Equation 1). Thedecision-making functions describe the likelihood with which each of the di�erent agenttype takes the observed action (cf. Equations 3–5). Because we did not ask participantsfor their prior beliefs, we inferred their priors from their posterior judgments.6 Comparingmodel predictions to participants’ agent inferences thus allows us to gage the extent towhich our formal agent functions correspond to participants’ beliefs about how the agentsmake decisions based on the informal descriptions we had given them.
Figure 5 (left side) shows the model predictions for the goalie and spinner worlds. Thepredictions between the conditions di�er slightly because the inferred prior di�ered betweenconditions. Compared to participants in the spinner condition, participants in the goaliecondition were more likely to believe a-priori that an agent could be skilled, and somewhatless likely to believe that an agent could be unskilled (cf. Table 2).
The model predicts that participants will be more likely to believe that an agentwas unskilled when the outcome was negative, and skilled when the outcome was positive.Irrespective of whether the outcome was positive or negative, participants are predicted tobe more likely to believe that an agent was average for expected rather than unexpectedactions. The model also predicts an interaction e�ect between outcome and the expectedprobability that an action would be successful. Whereas for negative outcomes, unexpectedactions are more indicative of lacking skill, for positive outcomes, unexpected actions aremore indicative of being skilled.
6To infer the prior, we calculated P (T |W) Ã P (T |W,S,A)P (A|S,T ) for each situation and then fit P (T |W) using
least squares.

EXPECTATIONS & RESPONSIBILITY 21
a) Goalie world
negative outcome
positive outcome0%
25%50%75%
100%
0%25%50%75%
100%
20% 40% 60% 80%
agen
t inf
eren
ce
type of agent: unskilled average skilled
Model predictionsnegative outcome
positive outcome0%
25%50%75%
100%
0%25%50%75%
100%
20% 40% 60% 80%
agen
t inf
eren
ce
type of agent: unskilled average skilled
Empirical data
b) Spinner world
negative outcome
positive outcome0%
25%50%75%
100%
0%25%50%75%
100%
20% 40% 60% 80%
agen
t inf
eren
ce
type of agent: unskilled average skilled
Model predictionsnegative outcome
positive outcome0%
25%50%75%
100%
0%25%50%75%
100%
20% 40% 60% 80%
agen
t inf
eren
ce
type of agent: unskilled average skilled
Empirical data
Figure 5 . Experiment 2: Model predictions (left side) and mean agent inferences (rightside) in the (a) goalie world, and (b) spinner world, as a function of what action the agentchose (x-axis), and whether the outcome was negative or positive. For example, when thegoalkeeper chose to jump in the 20% direction and didn’t save the ball (top left bar), themodel predicts that participants will be most likely to believe that the agent was unskilled,less likely to believe that he was average, and even less likely to believe that the agent wasskilled.
Empirical data. Figure 5 (right side) shows participants’ agent inferences sepa-rately for the goalie world and the spinner world. We ran ordinal logistic regressions toanalyze how participants’ agent inferences were a�ected by world (goalie vs. spinner),outcome (negative vs. positive), and the expected probability that an action would be suc-cessful. In order to run this analysis, we recorded for each participant which agent theyconsidered to be the most likely for each of the di�erent situations.
There was neither a main e�ect of world (‰2(1) = 0.17, p = .681), nor any interactione�ect involving world (‰2(3) = 5.65, p = .130). Hence, we combined the data from bothworlds for further analyses. There was a main e�ect of outcome (‰2(1) = 144.78, p < .0001).
EXPECTATIONS & RESPONSIBILITY 22
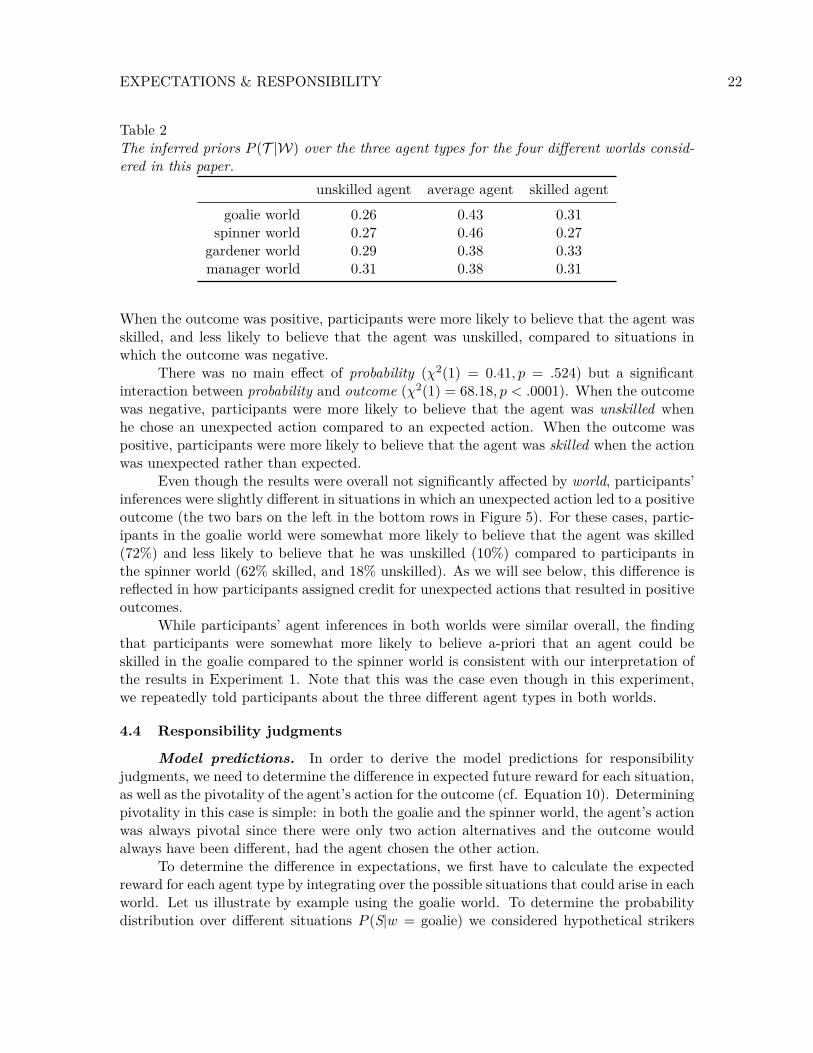
Table 2The inferred priors P (T |W) over the three agent types for the four di�erent worlds consid-ered in this paper.
unskilled agent average agent skilled agentgoalie world 0.26 0.43 0.31
spinner world 0.27 0.46 0.27gardener world 0.29 0.38 0.33manager world 0.31 0.38 0.31
When the outcome was positive, participants were more likely to believe that the agent wasskilled, and less likely to believe that the agent was unskilled, compared to situations inwhich the outcome was negative.
There was no main e�ect of probability (‰2(1) = 0.41, p = .524) but a significantinteraction between probability and outcome (‰2(1) = 68.18, p < .0001). When the outcomewas negative, participants were more likely to believe that the agent was unskilled whenhe chose an unexpected action compared to an expected action. When the outcome waspositive, participants were more likely to believe that the agent was skilled when the actionwas unexpected rather than expected.
Even though the results were overall not significantly a�ected by world, participants’inferences were slightly di�erent in situations in which an unexpected action led to a positiveoutcome (the two bars on the left in the bottom rows in Figure 5). For these cases, partic-ipants in the goalie world were somewhat more likely to believe that the agent was skilled(72%) and less likely to believe that he was unskilled (10%) compared to participants inthe spinner world (62% skilled, and 18% unskilled). As we will see below, this di�erence isreflected in how participants assigned credit for unexpected actions that resulted in positiveoutcomes.
While participants’ agent inferences in both worlds were similar overall, the findingthat participants were somewhat more likely to believe a-priori that an agent could beskilled in the goalie compared to the spinner world is consistent with our interpretation ofthe results in Experiment 1. Note that this was the case even though in this experiment,we repeatedly told participants about the three di�erent agent types in both worlds.
4.4 Responsibility judgments
Model predictions. In order to derive the model predictions for responsibilityjudgments, we need to determine the di�erence in expected future reward for each situation,as well as the pivotality of the agent’s action for the outcome (cf. Equation 10). Determiningpivotality in this case is simple: in both the goalie and the spinner world, the agent’s actionwas always pivotal since there were only two action alternatives and the outcome wouldalways have been di�erent, had the agent chosen the other action.
To determine the di�erence in expectations, we first have to calculate the expectedreward for each agent type by integrating over the possible situations that could arise in eachworld. Let us illustrate by example using the goalie world. To determine the probabilitydistribution over di�erent situations P (S|w = goalie) we considered hypothetical strikers
EXPECTATIONS & RESPONSIBILITY 23
with priors ranging from 0.1 to 0.9 to shoot towards the left corner, and crossed this withwhether they actually shot towards the left or the right corner. Each prior for the striker wasconsidered equally likely, whereby the strikers’ actual shots adhered to their prior tendency(i.e. a striker who had an 80% tendency to shoot the ball towards the left direction also didso with p = 0.8). This means that a situation in which a striker shot towards the 80% wasmore likely to happen than a situation in which the striker shot towards the 20% direction.7
The expected reward for the average goalie, for example, can then be calculated as
E[r|W = goalie, T = average] =ÿ
aœA
ÿ
sœSr
a
· P (a|s, T = average) · P (s|W = goalie), (11)
where we use the fitted decision noise parameter — that is part of the agent’s decision-making function P (a|s, T = average) (cf. Equation 3). Repeating the same procedurefor unskilled, average, and skilled goalies results in expected rewards of 0.19, 0.58, and0.81, respectively. This means that an unskilled goalie would be expected to save 19% ofthe shots if it faced the whole range of strikers that are part of the possible situations weconsidered. A skilled agent would be expected to save 81% of the shots. Note that theexpected future rewards for each agent type are identical in the spinner world since the twoworlds are structurally isomorphic. To facilitate comparison between di�erent experiments,we rescaled the expected rewards such that the unskilled agent has an expected reward of0, and the skilled agent has an expected reward of 1, which resulted in an expected rewardfor the average agent of 0.63.
Now that we know the expected reward of each agent type E[r|W = w, T = t], andthe priors over the di�erent agent types P (t|W = w) (cf. Table 2), we can determine theprior expected reward for each world by integrating over the di�erent agent types as shownin Equation 6. For example, in the goalie world, we get
E[r|W = goalie] = P (t = unskilled|w) · E[r|w, t = unskilled]+P (t = average|w) · E[r|w, t = average]+P (t = skilled|w) · E[r|w, t = skilled]
= 0.26 · 0 + 0.43 · 0.63 + 0.31 · 1= 0.58,
(12)
where we used the rescaled expected future rewards for each agent type. We perform thesame calculations for the spinner world.
We determine the posterior expected reward for each situation according to Equa-tion 7. For P (T = t|W = w, A = a
obs
, S = s
obs
), we took participants’ mean agentinferences as shown in Figure 5. For example, consider the situation in the goalie worldin which the goalkeeper decided to jump in the 20% direction and did not save the ball(i.e. the top left bar of the empirical data in Figure 5a). In this case, participants’ meanjudgments indicate that they thought there was a 61% chance that the agent was unskilled,a 24% chance the agent was average, and a 15% chance the agent was skilled. Accordingly,
7Note that this was not the case in our experiment, due to the balanced design we had chosen. Forexample, across the 8 trials that participants saw, a striker with a 20% to shoot in the left direction wasjust as likely to shoot in the left direction as a striker with an 80% tendency to shoot left.

EXPECTATIONS & RESPONSIBILITY 24
negative outcome positive outcome
0
25
50
75
100
20% 40% 60% 80% 20% 40% 60% 80%
resp
onsi
bilit
y ra
ting
(a) Goalie world
negative outcome positive outcome
0
25
50
75
100
20% 40% 60% 80% 20% 40% 60% 80%
resp
onsi
bilit
y ra
ting
(b) Spinner worldFigure 6 . Experiment 2: Mean responsibility ratings (colored bars) and model predictions(black bars) in the (a) goalie world, and (b) spinner world.
the posterior expected reward we get based on having observed the agent jumping in the20% direction and failing to save the ball is
E[r|W = goalie, a
obs
, s
obs
] = P (t = unskilled|w, a
obs
, s
obs
) · E[r|w, t = unskilled]+P (t = average|w, a
obs
, s
obs
) · E[r|w, t = average]+P (t = skilled|w, a
obs
, s
obs
) · E[r|w, t = skilled]= 0.61 · 0 + 0.24 · 0.63 + 0.15 · 1= 0.30.
(13)
We can then calculate the di�erence in expected reward by subtracting the prior expectedreward E[r|W = goalie] from the posterior expected reward E[r|W = goalie, a
obs
, s
obs
] asshown in Equation 8. For this particular example, the model’s expectation about the agent’sfuture reward has decreased from 0.58 to 0.30. We perform the same calculations for theremaining situations that arose in the experiment. In order to predict participants’ respon-sibility judgments, we then take the di�erence in expectation for each of the situations,as well as the agent’s pivotality, and fit the weighting of both components as shown inEquation 10.8
The black bars in Figure 6 show the model predictions. For both the goalie andspinner world, the model predicts that agents will be blamed more for negative outcomeswhen they took unexpected actions. In the goalie world, the model predicts that agentswill receive more credit for positive outcomes that resulted from unexpected actions. Inthe spinner world, the model predicts no strong di�erences in credit as a function of howexpected the agent’s action was. The model’s di�erent predictions for how credit will beassigned in the goalie and spinner world are a result of using participants’ agent inferencesto calculate the di�erence in expected future reward. Compared to participants in thegoalie condition, participants in the spinner condition were more likely to believe that theagent may be unskilled for positive outcomes that resulted from unexpected actions, andsomewhat less likely to believe that the agent was skilled when the positive outcome resultedfrom an expected action.
8Note that while in the spinner and goalie experiment, the pivotality term is equal to a dummy variablefor outcome (since the agent’s action is always pivotal), we will show in Experiments 3 and 4 that participantsare indeed sensitive to the pivotality of a person’s action rather than just the outcome.
EXPECTATIONS & RESPONSIBILITY 25
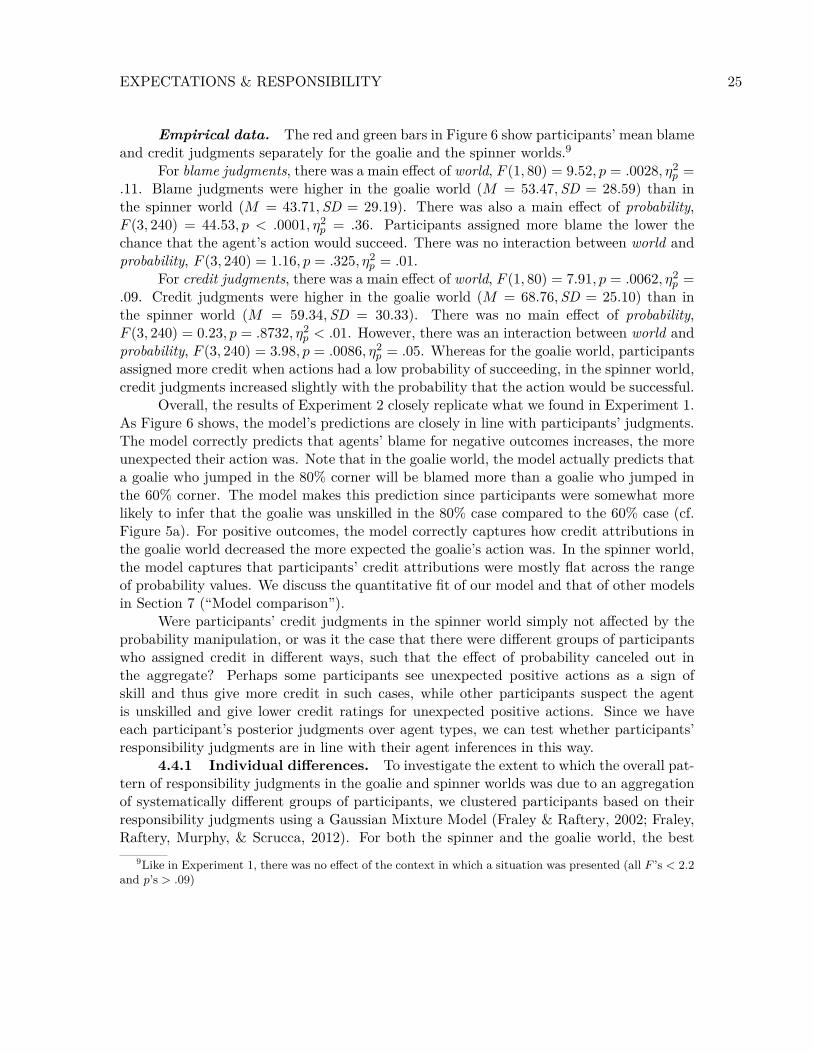
Empirical data. The red and green bars in Figure 6 show participants’ mean blameand credit judgments separately for the goalie and the spinner worlds.9
For blame judgments, there was a main e�ect of world, F (1, 80) = 9.52, p = .0028, ÷
2
p
=.11. Blame judgments were higher in the goalie world (M = 53.47, SD = 28.59) than inthe spinner world (M = 43.71, SD = 29.19). There was also a main e�ect of probability,F (3, 240) = 44.53, p < .0001, ÷
2
p
= .36. Participants assigned more blame the lower thechance that the agent’s action would succeed. There was no interaction between world andprobability, F (3, 240) = 1.16, p = .325, ÷
2
p
= .01.For credit judgments, there was a main e�ect of world, F (1, 80) = 7.91, p = .0062, ÷
2
p
=.09. Credit judgments were higher in the goalie world (M = 68.76, SD = 25.10) than inthe spinner world (M = 59.34, SD = 30.33). There was no main e�ect of probability,F (3, 240) = 0.23, p = .8732, ÷
2
p
< .01. However, there was an interaction between world andprobability, F (3, 240) = 3.98, p = .0086, ÷
2
p
= .05. Whereas for the goalie world, participantsassigned more credit when actions had a low probability of succeeding, in the spinner world,credit judgments increased slightly with the probability that the action would be successful.
Overall, the results of Experiment 2 closely replicate what we found in Experiment 1.As Figure 6 shows, the model’s predictions are closely in line with participants’ judgments.The model correctly predicts that agents’ blame for negative outcomes increases, the moreunexpected their action was. Note that in the goalie world, the model actually predicts thata goalie who jumped in the 80% corner will be blamed more than a goalie who jumped inthe 60% corner. The model makes this prediction since participants were somewhat morelikely to infer that the goalie was unskilled in the 80% case compared to the 60% case (cf.Figure 5a). For positive outcomes, the model correctly captures how credit attributions inthe goalie world decreased the more expected the goalie’s action was. In the spinner world,the model captures that participants’ credit attributions were mostly flat across the rangeof probability values. We discuss the quantitative fit of our model and that of other modelsin Section 7 (“Model comparison”).
Were participants’ credit judgments in the spinner world simply not a�ected by theprobability manipulation, or was it the case that there were di�erent groups of participantswho assigned credit in di�erent ways, such that the e�ect of probability canceled out inthe aggregate? Perhaps some participants see unexpected positive actions as a sign ofskill and thus give more credit in such cases, while other participants suspect the agentis unskilled and give lower credit ratings for unexpected positive actions. Since we haveeach participant’s posterior judgments over agent types, we can test whether participants’responsibility judgments are in line with their agent inferences in this way.
4.4.1 Individual di�erences. To investigate the extent to which the overall pat-tern of responsibility judgments in the goalie and spinner worlds was due to an aggregationof systematically di�erent groups of participants, we clustered participants based on theirresponsibility judgments using a Gaussian Mixture Model (Fraley & Raftery, 2002; Fraley,Raftery, Murphy, & Scrucca, 2012). For both the spinner and the goalie world, the best
9Like in Experiment 1, there was no e�ect of the context in which a situation was presented (all F ’s < 2.2and p’s > .09)
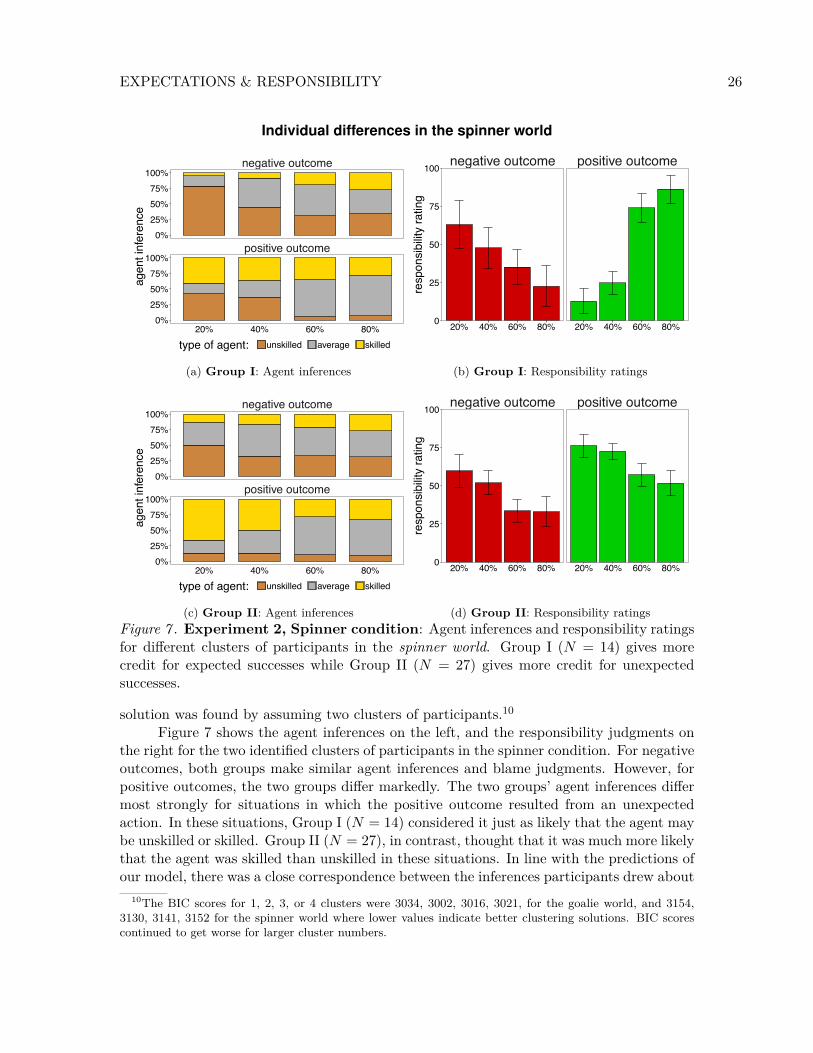
EXPECTATIONS & RESPONSIBILITY 26
Individual differences in the spinner world
negative outcome
positive outcome0%
25%50%75%
100%
0%25%50%75%
100%
20% 40% 60% 80%
agen
t inf
eren
ce
type of agent: unskilled average skilled
(a) Group I: Agent inferences
negative outcome positive outcome
0
25
50
75
100
20% 40% 60% 80% 20% 40% 60% 80%
resp
onsi
bilit
y ra
ting
(b) Group I: Responsibility ratings
negative outcome
positive outcome0%
25%50%75%
100%
0%25%50%75%
100%
20% 40% 60% 80%
agen
t inf
eren
ce
type of agent: unskilled average skilled
(c) Group II: Agent inferences
negative outcome positive outcome
0
25
50
75
100
20% 40% 60% 80% 20% 40% 60% 80%
resp
onsi
bilit
y ra
ting
(d) Group II: Responsibility ratingsFigure 7 . Experiment 2, Spinner condition: Agent inferences and responsibility ratingsfor di�erent clusters of participants in the spinner world. Group I (N = 14) gives morecredit for expected successes while Group II (N = 27) gives more credit for unexpectedsuccesses.
solution was found by assuming two clusters of participants.10
Figure 7 shows the agent inferences on the left, and the responsibility judgments onthe right for the two identified clusters of participants in the spinner condition. For negativeoutcomes, both groups make similar agent inferences and blame judgments. However, forpositive outcomes, the two groups di�er markedly. The two groups’ agent inferences di�ermost strongly for situations in which the positive outcome resulted from an unexpectedaction. In these situations, Group I (N = 14) considered it just as likely that the agent maybe unskilled or skilled. Group II (N = 27), in contrast, thought that it was much more likelythat the agent was skilled than unskilled in these situations. In line with the predictions ofour model, there was a close correspondence between the inferences participants drew about
10The BIC scores for 1, 2, 3, or 4 clusters were 3034, 3002, 3016, 3021, for the goalie world, and 3154,3130, 3141, 3152 for the spinner world where lower values indicate better clustering solutions. BIC scorescontinued to get worse for larger cluster numbers.
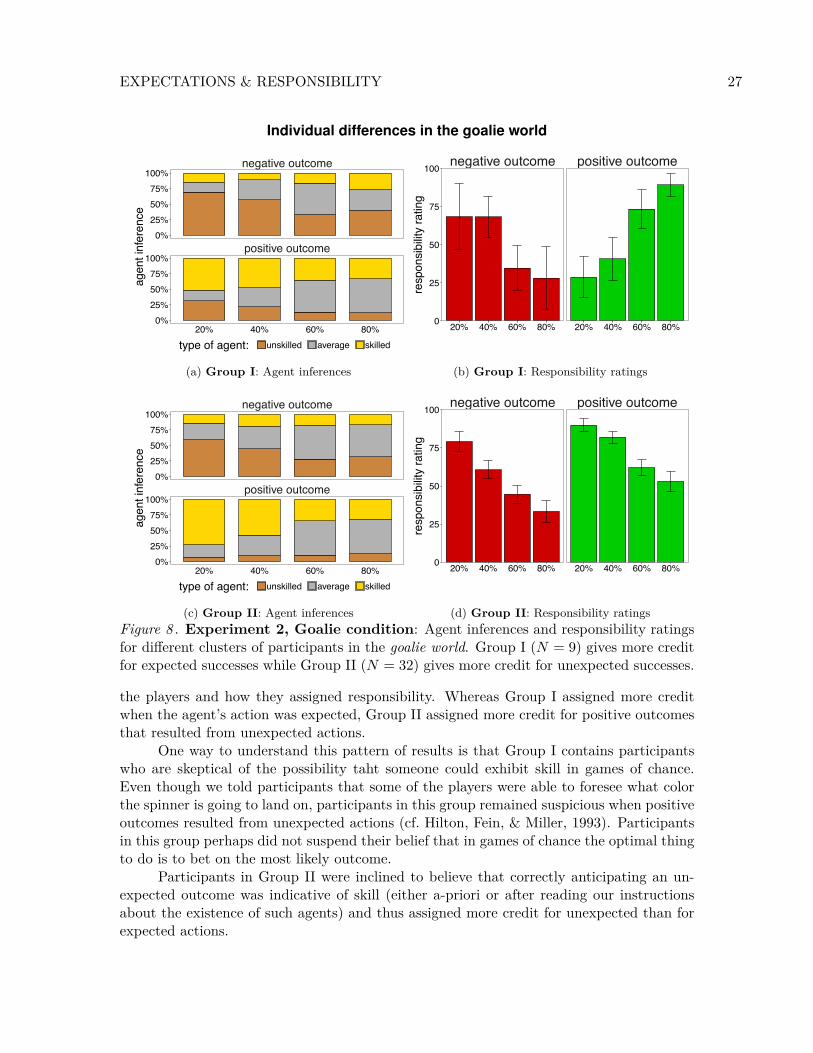
EXPECTATIONS & RESPONSIBILITY 27
Individual differences in the goalie world
negative outcome
positive outcome0%
25%50%75%
100%
0%25%50%75%
100%
20% 40% 60% 80%
agen
t inf
eren
ce
type of agent: unskilled average skilled
(a) Group I: Agent inferences
negative outcome positive outcome
0
25
50
75
100
20% 40% 60% 80% 20% 40% 60% 80%
resp
onsi
bilit
y ra
ting
(b) Group I: Responsibility ratings
negative outcome
positive outcome0%
25%50%75%
100%
0%25%50%75%
100%
20% 40% 60% 80%
agen
t inf
eren
ce
type of agent: unskilled average skilled
(c) Group II: Agent inferences
negative outcome positive outcome
0
25
50
75
100
20% 40% 60% 80% 20% 40% 60% 80%
resp
onsi
bilit
y ra
ting
(d) Group II: Responsibility ratingsFigure 8 . Experiment 2, Goalie condition: Agent inferences and responsibility ratingsfor di�erent clusters of participants in the goalie world. Group I (N = 9) gives more creditfor expected successes while Group II (N = 32) gives more credit for unexpected successes.
the players and how they assigned responsibility. Whereas Group I assigned more creditwhen the agent’s action was expected, Group II assigned more credit for positive outcomesthat resulted from unexpected actions.
One way to understand this pattern of results is that Group I contains participantswho are skeptical of the possibility taht someone could exhibit skill in games of chance.Even though we told participants that some of the players were able to foresee what colorthe spinner is going to land on, participants in this group remained suspicious when positiveoutcomes resulted from unexpected actions (cf. Hilton, Fein, & Miller, 1993). Participantsin this group perhaps did not suspend their belief that in games of chance the optimal thingto do is to bet on the most likely outcome.
Participants in Group II were inclined to believe that correctly anticipating an un-expected outcome was indicative of skill (either a-priori or after reading our instructionsabout the existence of such agents) and thus assigned more credit for unexpected than forexpected actions.
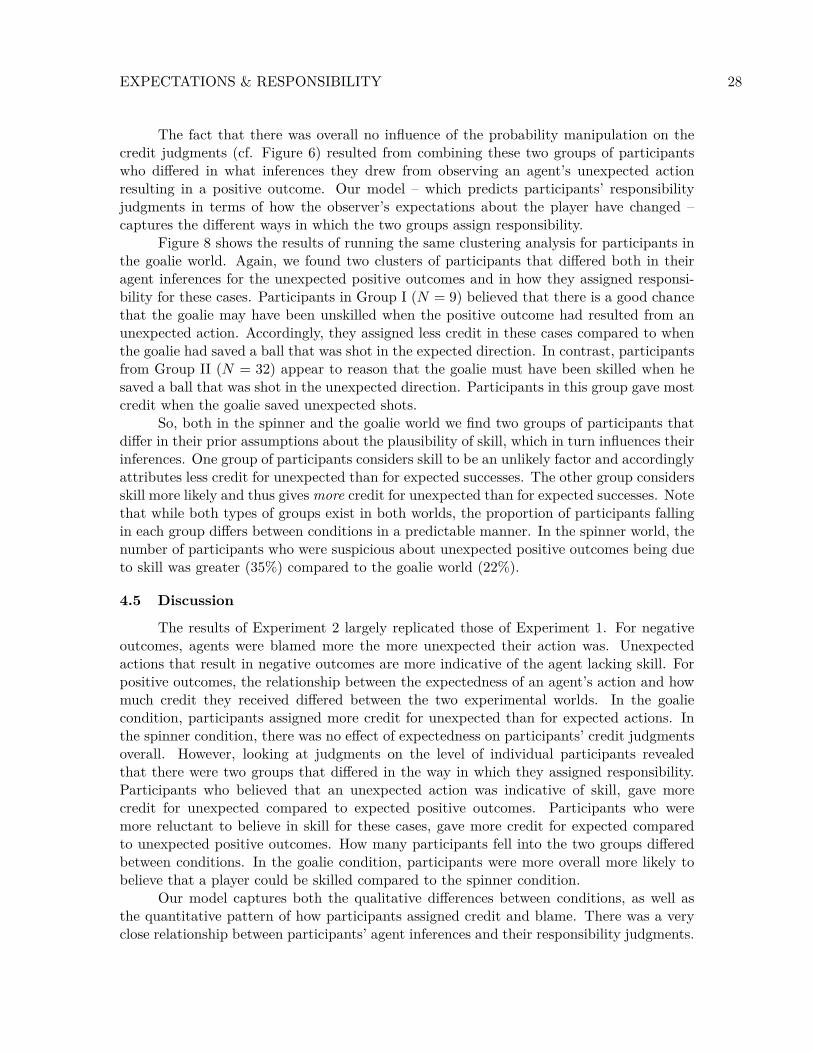
EXPECTATIONS & RESPONSIBILITY 28
The fact that there was overall no influence of the probability manipulation on thecredit judgments (cf. Figure 6) resulted from combining these two groups of participantswho di�ered in what inferences they drew from observing an agent’s unexpected actionresulting in a positive outcome. Our model – which predicts participants’ responsibilityjudgments in terms of how the observer’s expectations about the player have changed –captures the di�erent ways in which the two groups assign responsibility.
Figure 8 shows the results of running the same clustering analysis for participants inthe goalie world. Again, we found two clusters of participants that di�ered both in theiragent inferences for the unexpected positive outcomes and in how they assigned responsi-bility for these cases. Participants in Group I (N = 9) believed that there is a good chancethat the goalie may have been unskilled when the positive outcome had resulted from anunexpected action. Accordingly, they assigned less credit in these cases compared to whenthe goalie had saved a ball that was shot in the expected direction. In contrast, participantsfrom Group II (N = 32) appear to reason that the goalie must have been skilled when hesaved a ball that was shot in the unexpected direction. Participants in this group gave mostcredit when the goalie saved unexpected shots.
So, both in the spinner and the goalie world we find two groups of participants thatdi�er in their prior assumptions about the plausibility of skill, which in turn influences theirinferences. One group of participants considers skill to be an unlikely factor and accordinglyattributes less credit for unexpected than for expected successes. The other group considersskill more likely and thus gives more credit for unexpected than for expected successes. Notethat while both types of groups exist in both worlds, the proportion of participants fallingin each group di�ers between conditions in a predictable manner. In the spinner world, thenumber of participants who were suspicious about unexpected positive outcomes being dueto skill was greater (35%) compared to the goalie world (22%).
4.5 Discussion
The results of Experiment 2 largely replicated those of Experiment 1. For negativeoutcomes, agents were blamed more the more unexpected their action was. Unexpectedactions that result in negative outcomes are more indicative of the agent lacking skill. Forpositive outcomes, the relationship between the expectedness of an agent’s action and howmuch credit they received di�ered between the two experimental worlds. In the goaliecondition, participants assigned more credit for unexpected than for expected actions. Inthe spinner condition, there was no e�ect of expectedness on participants’ credit judgmentsoverall. However, looking at judgments on the level of individual participants revealedthat there were two groups that di�ered in the way in which they assigned responsibility.Participants who believed that an unexpected action was indicative of skill, gave morecredit for unexpected compared to expected positive outcomes. Participants who weremore reluctant to believe in skill for these cases, gave more credit for expected comparedto unexpected positive outcomes. How many participants fell into the two groups di�eredbetween conditions. In the goalie condition, participants were more overall more likely tobelieve that a player could be skilled compared to the spinner condition.
Our model captures both the qualitative di�erences between conditions, as well asthe quantitative pattern of how participants assigned credit and blame. There was a veryclose relationship between participants’ agent inferences and their responsibility judgments.

EXPECTATIONS & RESPONSIBILITY 29
By expressing these agent inferences in terms of a di�erence in expected future reward,the model not only explains the general pattern of results between conditions, but alsohow subgroups within each condition arrived at di�erent responsibility judgments based ondi�erent prior assumptions about the plausibility of skill.
The results of Experiments 1 and 2 support the idea that participants’ responsibilityjudgments are influenced by what an action reveals about a person, and how participants’expectations about the person’s future behavior change accordingly. So far, however, wehave not manipulated the causal role that the person’s action played in bringing about theoutcome. In general, we believe that a person’s responsibility for the outcome increasesthe more prominently their action featured in bringing it about. There are a variety ofaspects that influence the perceived causal role of a person’s action. We will focus on thepivotality of a person’s action since this manipulation is particularly natural in the contextof attributing responsibility to decision-makers (cf. Allen et al., 2015). In Experiments 1and 2, the action was always pivotal for the outcome – if the person had acted di�erently,a failure would have been a success and vice versa. In the following experiments, we willmanipulate the pivotality of a person’s action.
5 Experiment 3: Pivotal Gardeners
The scenario in Experiment 3 was inspired by Johnson and Rips (2013). A gardenermust choose between two fertilizers to make a flower grow. One fertilizer generally has abetter chance of making the flower grow. The gardener decides to use one of the two fertil-izers, and the flower either grows or does not grow. In addition to what actually happened,we informed participants about what would have happened if the gardener had chosen dif-ferently. Figure 9 shows the eight di�erent situations that we presented to participants inthe experiment. For example, in Figure 9a, the gardener chose the fertilizer that generallyhad a lower chance of making the flower grow. In this situation, the fertilizer failed to makethe flower grow. The flower would have failed to grow even if the gardener had chosenthe alternative fertilizer that had a higher chance of making the flower grow. Because theoutcome would have been the same no matter what the gardener did, his action was notpivotal in this situation. In Figure 9b, the gardener’s action is the same – he chooses thelow-probability fertilizer. However, this time, the alternative fertilizer would have madethe flower grow. If participants’ responsibility judgments are a�ected by pivotality, thenwe would expect participants to blame the gardener in Figure 9b more for the negativeoutcome than the gardener in Figure 9a.
More generally, we predict that in addition to participants’ changed expectationsabout how well a gardener is likely to do in the future, responsibility judgments will bea�ected by whether the gardener’s action was pivotal. Gardeners whose action was pivotalare predicted to be held more responsible than gardeners whose action was not pivotal.
5.1 Methods
5.1.1 Participants. 41 participants (Mage
= 33.54, SDage
= 10.61, N
female
= 17)completed this experiment.
5.1.2 Design. We manipulated the gardener’s decision (expected vs. unex-pected), the pivotality (pivotal vs. not pivotal) of the gardener’s decision, and the resulting
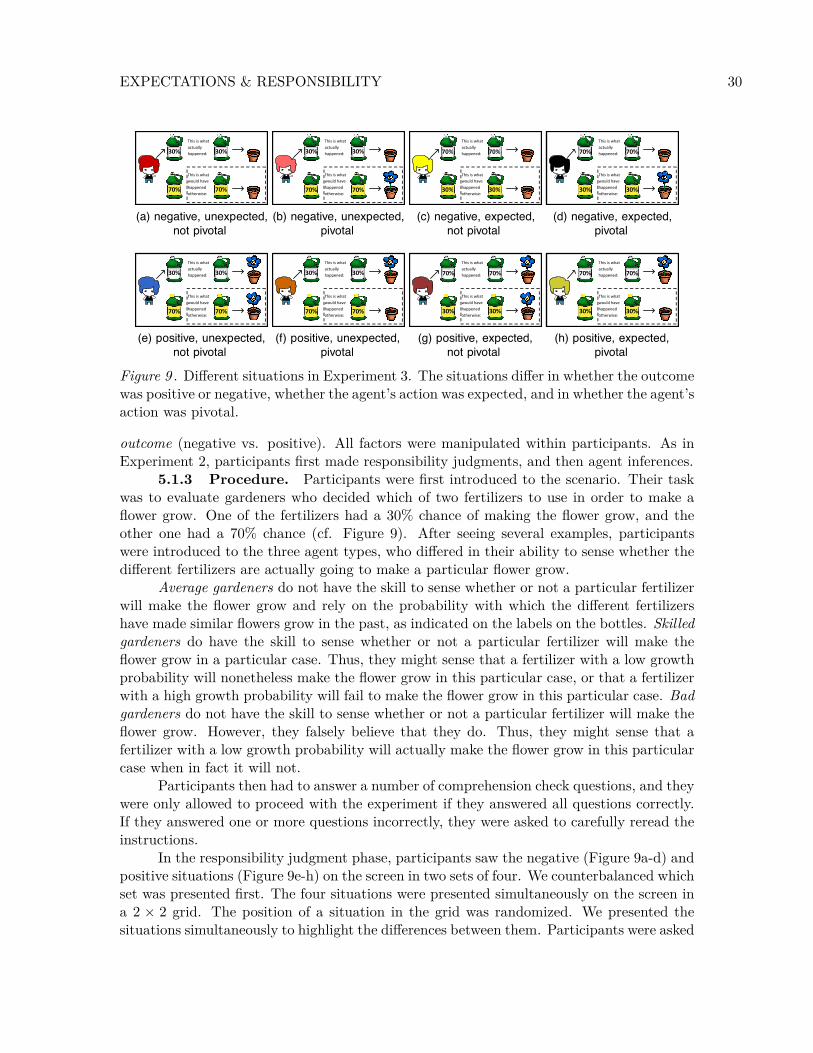
EXPECTATIONS & RESPONSIBILITY 30
This is whatactually happened:30%
This is whatwould have happenedotherwise:
30%
70% 70%
(a) negative, unexpected,not pivotal
This is whatactually happened:30%
This is whatwould have happenedotherwise:
30%
70% 70%
(b) negative, unexpected,pivotal
70%
This is whatactually happened:
30%
This is whatwould have happenedotherwise:
70%
30%
(c) negative, expected,not pivotal
70%
This is whatactually happened:
30%
This is whatwould have happenedotherwise:
70%
30%
(d) negative, expected,pivotal
This is whatactually happened:30%
This is whatwould have happenedotherwise:
30%
70% 70%
(e) positive, unexpected,not pivotal
This is whatactually happened:30%
This is whatwould have happenedotherwise:
30%
70% 70%
(f) positive, unexpected,pivotal
70%
This is whatactually happened:
30%
This is whatwould have happenedotherwise:
70%
30%
(g) positive, expected,not pivotal
70%
This is whatactually happened:
30%
This is whatwould have happenedotherwise:
70%
30%
(h) positive, expected,pivotal
Figure 9 . Di�erent situations in Experiment 3. The situations di�er in whether the outcomewas positive or negative, whether the agent’s action was expected, and in whether the agent’saction was pivotal.
outcome (negative vs. positive). All factors were manipulated within participants. As inExperiment 2, participants first made responsibility judgments, and then agent inferences.
5.1.3 Procedure. Participants were first introduced to the scenario. Their taskwas to evaluate gardeners who decided which of two fertilizers to use in order to make aflower grow. One of the fertilizers had a 30% chance of making the flower grow, and theother one had a 70% chance (cf. Figure 9). After seeing several examples, participantswere introduced to the three agent types, who di�ered in their ability to sense whether thedi�erent fertilizers are actually going to make a particular flower grow.
Average gardeners do not have the skill to sense whether or not a particular fertilizerwill make the flower grow and rely on the probability with which the di�erent fertilizershave made similar flowers grow in the past, as indicated on the labels on the bottles. Skilledgardeners do have the skill to sense whether or not a particular fertilizer will make theflower grow in a particular case. Thus, they might sense that a fertilizer with a low growthprobability will nonetheless make the flower grow in this particular case, or that a fertilizerwith a high growth probability will fail to make the flower grow in this particular case. Badgardeners do not have the skill to sense whether or not a particular fertilizer will make theflower grow. However, they falsely believe that they do. Thus, they might sense that afertilizer with a low growth probability will actually make the flower grow in this particularcase when in fact it will not.
Participants then had to answer a number of comprehension check questions, and theywere only allowed to proceed with the experiment if they answered all questions correctly.If they answered one or more questions incorrectly, they were asked to carefully reread theinstructions.
In the responsibility judgment phase, participants saw the negative (Figure 9a-d) andpositive situations (Figure 9e-h) on the screen in two sets of four. We counterbalanced whichset was presented first. The four situations were presented simultaneously on the screen ina 2 ◊ 2 grid. The position of a situation in the grid was randomized. We presented thesituations simultaneously to highlight the di�erences between them. Participants were asked
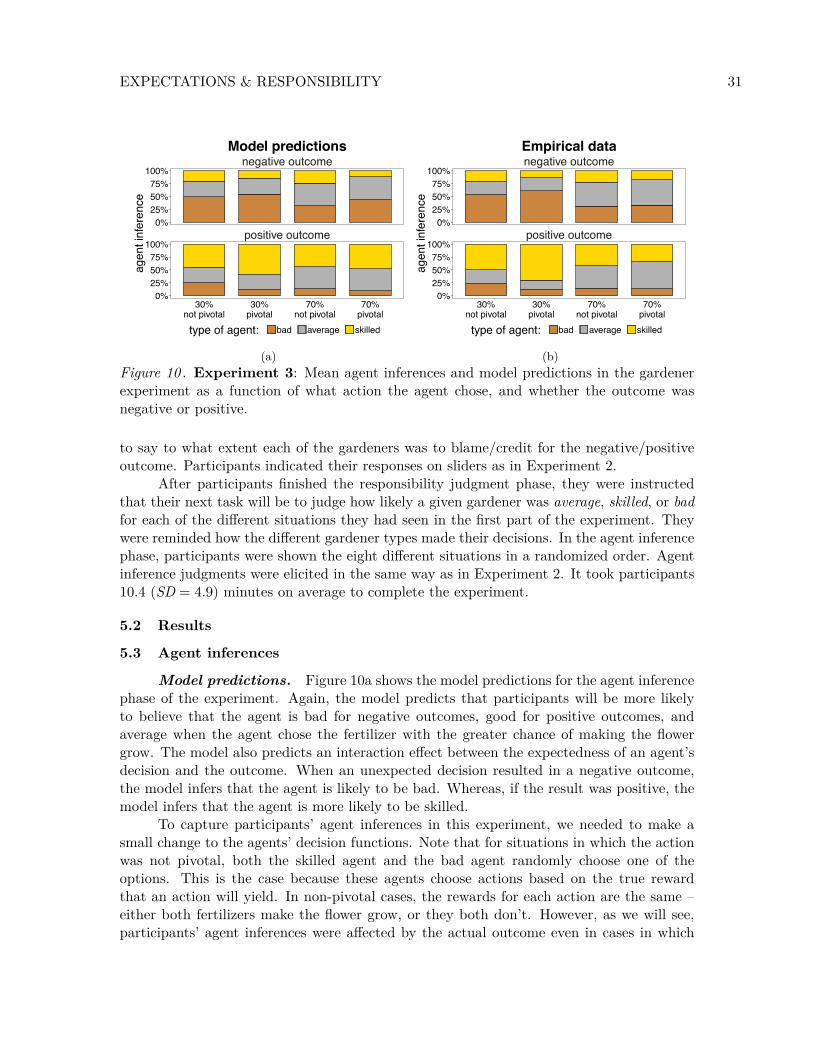
EXPECTATIONS & RESPONSIBILITY 31
negative outcome
positive outcome0%
25%50%75%
100%
0%25%50%75%
100%
30%not pivotal
30%pivotal
70%not pivotal
70%pivotal
agen
t inf
eren
ce
type of agent: bad average skilled
Model predictions
(a)
negative outcome
positive outcome0%
25%50%75%
100%
0%25%50%75%
100%
30%not pivotal
30%pivotal
70%not pivotal
70%pivotal
agen
t inf
eren
ce
type of agent: bad average skilled
Empirical data
(b)Figure 10 . Experiment 3: Mean agent inferences and model predictions in the gardenerexperiment as a function of what action the agent chose, and whether the outcome wasnegative or positive.
to say to what extent each of the gardeners was to blame/credit for the negative/positiveoutcome. Participants indicated their responses on sliders as in Experiment 2.
After participants finished the responsibility judgment phase, they were instructedthat their next task will be to judge how likely a given gardener was average, skilled, or badfor each of the di�erent situations they had seen in the first part of the experiment. Theywere reminded how the di�erent gardener types made their decisions. In the agent inferencephase, participants were shown the eight di�erent situations in a randomized order. Agentinference judgments were elicited in the same way as in Experiment 2. It took participants10.4 (SD = 4.9) minutes on average to complete the experiment.
5.2 Results
5.3 Agent inferences
Model predictions. Figure 10a shows the model predictions for the agent inferencephase of the experiment. Again, the model predicts that participants will be more likelyto believe that the agent is bad for negative outcomes, good for positive outcomes, andaverage when the agent chose the fertilizer with the greater chance of making the flowergrow. The model also predicts an interaction e�ect between the expectedness of an agent’sdecision and the outcome. When an unexpected decision resulted in a negative outcome,the model infers that the agent is likely to be bad. Whereas, if the result was positive, themodel infers that the agent is more likely to be skilled.
To capture participants’ agent inferences in this experiment, we needed to make asmall change to the agents’ decision functions. Note that for situations in which the actionwas not pivotal, both the skilled agent and the bad agent randomly choose one of theoptions. This is the case because these agents choose actions based on the true rewardthat an action will yield. In non-pivotal cases, the rewards for each action are the same –either both fertilizers make the flower grow, or they both don’t. However, as we will see,participants’ agent inferences were a�ected by the actual outcome even in cases in which
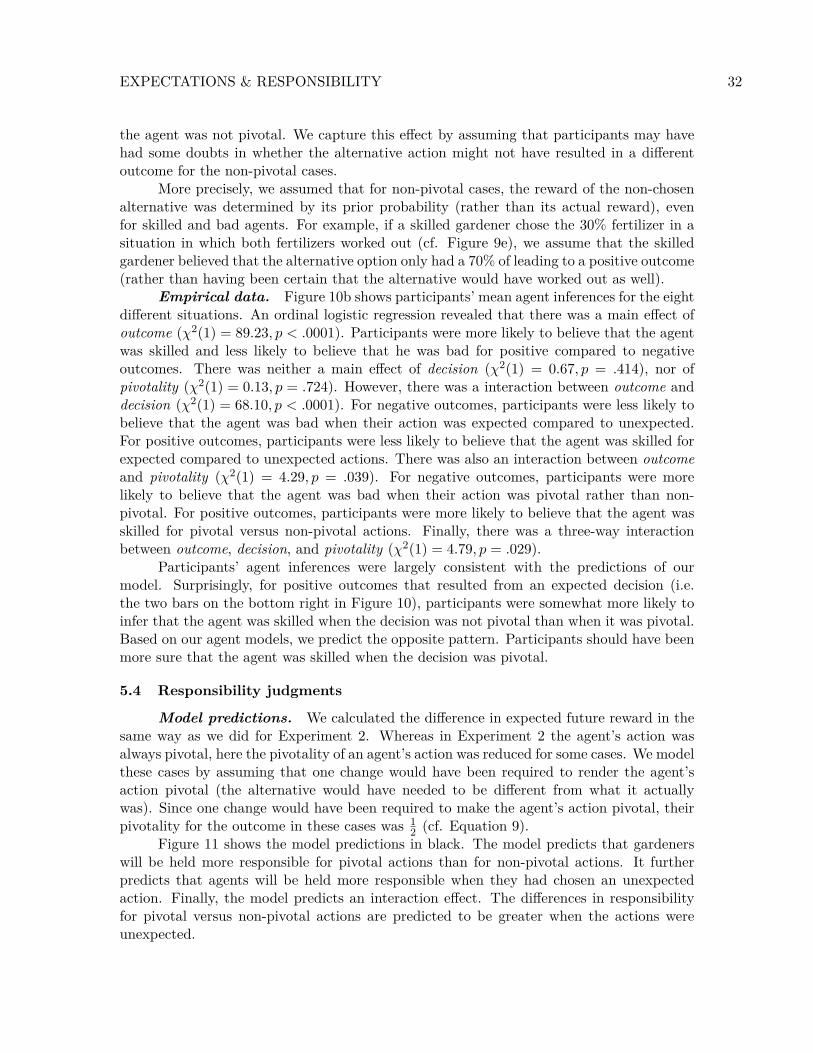
EXPECTATIONS & RESPONSIBILITY 32
the agent was not pivotal. We capture this e�ect by assuming that participants may havehad some doubts in whether the alternative action might not have resulted in a di�erentoutcome for the non-pivotal cases.
More precisely, we assumed that for non-pivotal cases, the reward of the non-chosenalternative was determined by its prior probability (rather than its actual reward), evenfor skilled and bad agents. For example, if a skilled gardener chose the 30% fertilizer in asituation in which both fertilizers worked out (cf. Figure 9e), we assume that the skilledgardener believed that the alternative option only had a 70% of leading to a positive outcome(rather than having been certain that the alternative would have worked out as well).
Empirical data. Figure 10b shows participants’ mean agent inferences for the eightdi�erent situations. An ordinal logistic regression revealed that there was a main e�ect ofoutcome (‰2(1) = 89.23, p < .0001). Participants were more likely to believe that the agentwas skilled and less likely to believe that he was bad for positive compared to negativeoutcomes. There was neither a main e�ect of decision (‰2(1) = 0.67, p = .414), nor ofpivotality (‰2(1) = 0.13, p = .724). However, there was a interaction between outcome anddecision (‰2(1) = 68.10, p < .0001). For negative outcomes, participants were less likely tobelieve that the agent was bad when their action was expected compared to unexpected.For positive outcomes, participants were less likely to believe that the agent was skilled forexpected compared to unexpected actions. There was also an interaction between outcomeand pivotality (‰2(1) = 4.29, p = .039). For negative outcomes, participants were morelikely to believe that the agent was bad when their action was pivotal rather than non-pivotal. For positive outcomes, participants were more likely to believe that the agent wasskilled for pivotal versus non-pivotal actions. Finally, there was a three-way interactionbetween outcome, decision, and pivotality (‰2(1) = 4.79, p = .029).
Participants’ agent inferences were largely consistent with the predictions of ourmodel. Surprisingly, for positive outcomes that resulted from an expected decision (i.e.the two bars on the bottom right in Figure 10), participants were somewhat more likely toinfer that the agent was skilled when the decision was not pivotal than when it was pivotal.Based on our agent models, we predict the opposite pattern. Participants should have beenmore sure that the agent was skilled when the decision was pivotal.
5.4 Responsibility judgments
Model predictions. We calculated the di�erence in expected future reward in thesame way as we did for Experiment 2. Whereas in Experiment 2 the agent’s action wasalways pivotal, here the pivotality of an agent’s action was reduced for some cases. We modelthese cases by assuming that one change would have been required to render the agent’saction pivotal (the alternative would have needed to be di�erent from what it actuallywas). Since one change would have been required to make the agent’s action pivotal, theirpivotality for the outcome in these cases was 1
2
(cf. Equation 9).Figure 11 shows the model predictions in black. The model predicts that gardeners
will be held more responsible for pivotal actions than for non-pivotal actions. It furtherpredicts that agents will be held more responsible when they had chosen an unexpectedaction. Finally, the model predicts an interaction e�ect. The di�erences in responsibilityfor pivotal versus non-pivotal actions are predicted to be greater when the actions wereunexpected.
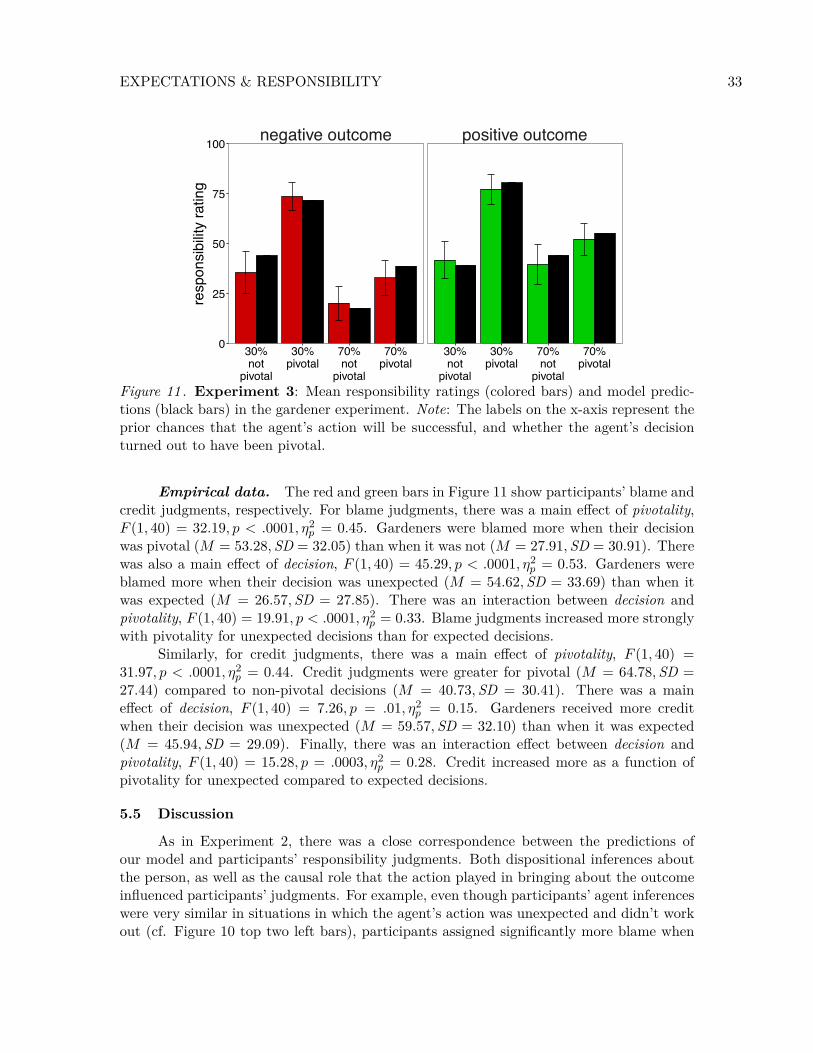
EXPECTATIONS & RESPONSIBILITY 33
negative outcome positive outcome
0
25
50
75
100
30%not
pivotal
30%pivotal
70%not
pivotal
70%pivotal
30%not
pivotal
30%pivotal
70%not
pivotal
70%pivotal
resp
onsi
bilit
y ra
ting
Figure 11 . Experiment 3: Mean responsibility ratings (colored bars) and model predic-tions (black bars) in the gardener experiment. Note: The labels on the x-axis represent theprior chances that the agent’s action will be successful, and whether the agent’s decisionturned out to have been pivotal.
Empirical data. The red and green bars in Figure 11 show participants’ blame andcredit judgments, respectively. For blame judgments, there was a main e�ect of pivotality,F (1, 40) = 32.19, p < .0001, ÷
2
p
= 0.45. Gardeners were blamed more when their decisionwas pivotal (M = 53.28, SD = 32.05) than when it was not (M = 27.91, SD = 30.91). Therewas also a main e�ect of decision, F (1, 40) = 45.29, p < .0001, ÷
2
p
= 0.53. Gardeners wereblamed more when their decision was unexpected (M = 54.62, SD = 33.69) than when itwas expected (M = 26.57, SD = 27.85). There was an interaction between decision andpivotality, F (1, 40) = 19.91, p < .0001, ÷
2
p
= 0.33. Blame judgments increased more stronglywith pivotality for unexpected decisions than for expected decisions.
Similarly, for credit judgments, there was a main e�ect of pivotality, F (1, 40) =31.97, p < .0001, ÷
2
p
= 0.44. Credit judgments were greater for pivotal (M = 64.78, SD =27.44) compared to non-pivotal decisions (M = 40.73, SD = 30.41). There was a maine�ect of decision, F (1, 40) = 7.26, p = .01, ÷
2
p
= 0.15. Gardeners received more creditwhen their decision was unexpected (M = 59.57, SD = 32.10) than when it was expected(M = 45.94, SD = 29.09). Finally, there was an interaction e�ect between decision andpivotality, F (1, 40) = 15.28, p = .0003, ÷
2
p
= 0.28. Credit increased more as a function ofpivotality for unexpected compared to expected decisions.
5.5 Discussion
As in Experiment 2, there was a close correspondence between the predictions ofour model and participants’ responsibility judgments. Both dispositional inferences aboutthe person, as well as the causal role that the action played in bringing about the outcomeinfluenced participants’ judgments. For example, even though participants’ agent inferenceswere very similar in situations in which the agent’s action was unexpected and didn’t workout (cf. Figure 10 top two left bars), participants assigned significantly more blame when
EXPECTATIONS & RESPONSIBILITY 34
negative outcome positive outcome
0
25
50
75
100
30%not
pivotal
30%pivotal
70%not
pivotal
70%pivotal
30%not
pivotal
30%pivotal
70%not
pivotal
70%pivotal
resp
onsi
bilit
y ra
ting
Figure 12 . Mean responsibility ratings (colored bars) in the version of the gardener ex-periment in which participants were not given any information that gardeners may have aspecial skill. Note: The labels on the x-axis represent the prior chances that the agent’saction will be successful, and whether the agent’s decision turned out to have been pivotal.
the agent’s action was pivotal. More generally, agents received the most blame when theiraction was indicative of poor judgment, and when what they did mattered in the actualsituation. Conversely, agents received the most credit when their action was indicative ofskill, and their action mattered.
To further support the idea that dispositional inferences are key for how people assignresponsibility, we ran another condition of the gardener experiment in which no informationregarding di�erent gardener types was mentioned.11 The results of this experiment areshown in Figure 12.
While the pattern of blame judgments was virtually identical, the pattern of creditjudgments di�ered from Experiment 3 where participants had been informed about thedi�erent agent types. This time, participants assigned more credit when the agent’s actionwas expected (M = 57.38, SD = 32.44) compared to when the action was unexpected(M = 51.34, SD = 35.25). Similar to the spinner world in Experiments 1 and 2, whenthe agent acts in a way that seems suboptimal, they received less credit for the positiveoutcome compared to a situation in which their action made sense (cf. Johnson & Rips,2015). Without having been informed that some of the gardeners may have a special skill ofpredicting what will happen in this particular situation, most participants seemed to believethat the gardener should have used the fertilizer that is more likely to work. The possibilityof skill playing a role seems to require the existence of a plausible but di�cult-to-access cue.A gardener who chose the fertilizer that was less likely to work looks similar to a playerwho correctly predicted the unexpected outcome of a spinner: lucky but foolish.
1132 participants (Mage = 33.32, SDage = 9.08, Nfemale = 11) completed this experiment. The experimentalso included two sets of trials in which the agent had a choice between two fertilizers that had an equalchance of leading to the positive outcome. These two sets were always shown at the end of the responsibilityjudgment phase, and we haven’t included the results in Figure 12 for ease of comparison.
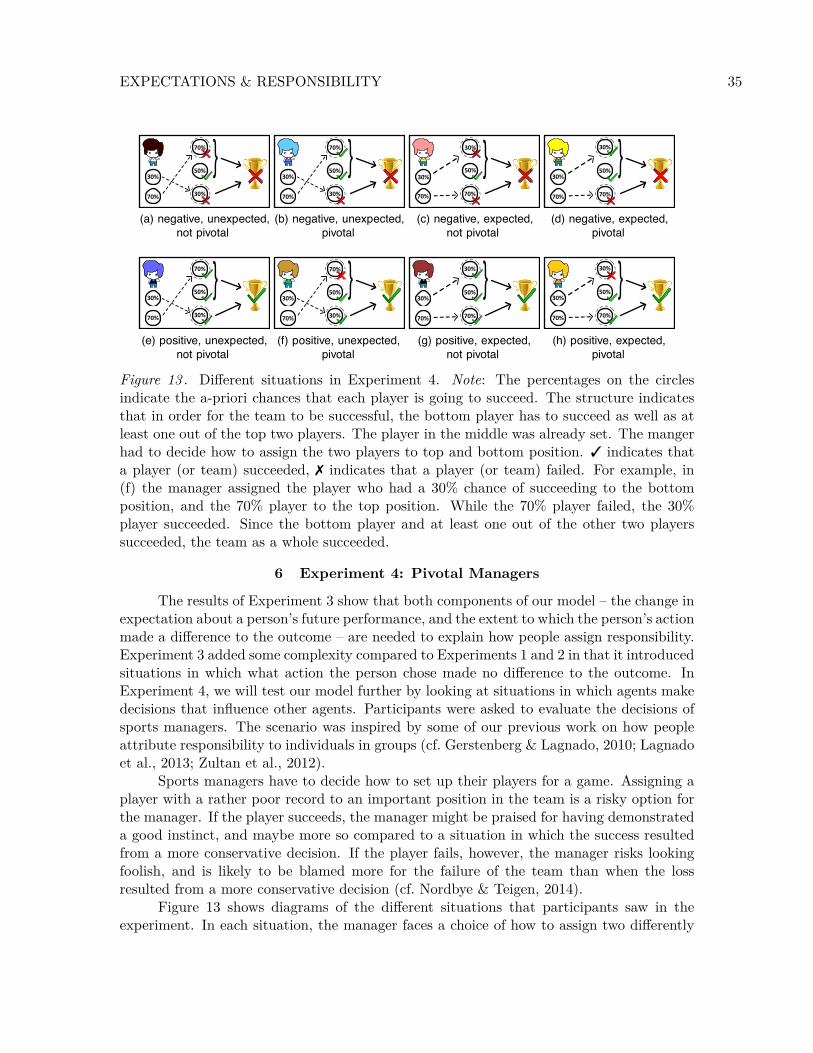
EXPECTATIONS & RESPONSIBILITY 35
70%
50%
30%
30%
70%
}(a) negative, unexpected,
not pivotal
70%
50%
30%
30%
70%
}(b) negative, unexpected,
pivotal
30%
50%
70%
30%
70%
}(c) negative, expected,
not pivotal
30%
50%
70%
30%
70%
}(d) negative, expected,
pivotal
70%
50%
30%
30%
70%
}(e) positive, unexpected,
not pivotal
70%
50%
30%
30%
70%
}(f) positive, unexpected,
pivotal
30%
50%
70%
30%
70%
}(g) positive, expected,
not pivotal
30%
50%
70%
30%
70%
}(h) positive, expected,
pivotal
Figure 13 . Di�erent situations in Experiment 4. Note: The percentages on the circlesindicate the a-priori chances that each player is going to succeed. The structure indicatesthat in order for the team to be successful, the bottom player has to succeed as well as atleast one out of the top two players. The player in the middle was already set. The mangerhad to decide how to assign the two players to top and bottom position. 3 indicates thata player (or team) succeeded, 7 indicates that a player (or team) failed. For example, in(f) the manager assigned the player who had a 30% chance of succeeding to the bottomposition, and the 70% player to the top position. While the 70% player failed, the 30%player succeeded. Since the bottom player and at least one out of the other two playerssucceeded, the team as a whole succeeded.
6 Experiment 4: Pivotal Managers
The results of Experiment 3 show that both components of our model – the change inexpectation about a person’s future performance, and the extent to which the person’s actionmade a di�erence to the outcome – are needed to explain how people assign responsibility.Experiment 3 added some complexity compared to Experiments 1 and 2 in that it introducedsituations in which what action the person chose made no di�erence to the outcome. InExperiment 4, we will test our model further by looking at situations in which agents makedecisions that influence other agents. Participants were asked to evaluate the decisions ofsports managers. The scenario was inspired by some of our previous work on how peopleattribute responsibility to individuals in groups (cf. Gerstenberg & Lagnado, 2010; Lagnadoet al., 2013; Zultan et al., 2012).
Sports managers have to decide how to set up their players for a game. Assigning aplayer with a rather poor record to an important position in the team is a risky option forthe manager. If the player succeeds, the manager might be praised for having demonstrateda good instinct, and maybe more so compared to a situation in which the success resultedfrom a more conservative decision. If the player fails, however, the manager risks lookingfoolish, and is likely to be blamed more for the failure of the team than when the lossresulted from a more conservative decision (cf. Nordbye & Teigen, 2014).
Figure 13 shows diagrams of the di�erent situations that participants saw in theexperiment. In each situation, the manager faces a choice of how to assign two di�erently

EXPECTATIONS & RESPONSIBILITY 36
skilled players to two roles in a team. Each player is indicated by a circle, and the probabilityvalues on the circles represent the chances that the player is going to succeed. The teamis comprised of three players. The middle position is already set and taken by the 50%player. The manager has to decide which one of the two remaining players to put in the topposition, and which one to assign to the bottom position. Importantly, the top and bottomposition di�er in how critical they are for the team’s outcome. For the team to win thegame, the bottom player has to succeed as well as at least one out of the top and middleplayers. The bottom player definitely has to succeed for the team to win, but if the top ormiddle player fails in their task, the team still has a chance to succeed. The bottom playeris thus more critical for the team’s success than the top and middle player (cf. De Cremer& van Dijk, 2002; Kerr, 1996; Lagnado et al., 2013; Rapoport, 1987).
Given how the game works, we would generally expect a manager to put the strongerplayer in the bottom position, and the weaker player in the top position. In the experiment,we manipulated whether the manager’s assignment was expected or unexpected, whetherthe team won or lost, and whether the manager’s assignment was pivotal. For example,in Figure 13a, the manager’s assignment was unexpected, and the team lost the game.However, his action was not pivotal: since both the top and the bottom player failed intheir task, the team would have lost even if the manager had chosen the other assignment.12
As in Experiments 2 and 3, we told participants at the beginning of the experimentabout three di�erent agent types. Managers di�ered in their ability to sense the underlyingground truth of a situation – whether a player will succeed or fail in a specific situation,regardless of their baseline success rate. Average managers cannot sense whether theirplayers have a good day or a bad day. Skilled managers do have the skill to sense whetheror not their players have a good day. They can use this ability to decide what positionsthe di�erent players should be assigned to. Bad managers falsely believe that they havethe ability to tell whether or not their players have a good day, but in fact do not have theability.
Again, we predicted that participants’ responsibility judgments would be influencedboth by the change in expectation about a manager’s future performance, and whether ornot the manager’s decision was pivotal.
6.1 Methods
6.1.1 Participants. 41 participants (Mage
= 34.12, SDage
= 11.23, N
female
= 20)completed this experiment.
6.1.2 Design. The experiment follows a decision (expected versus unexpected)◊ pivotality (pivotal vs. not pivotal) ◊ outcome (positive vs. negative) design. All factorswere manipulated within participants. Responsibility judgments and agent inferences wereassessed in the same way as in Experiments 2 and 3.
6.1.3 Procedure. The procedure was analogous to that of Experiment 3. Onaverage, it took participants 12.10 (SD = 4.55) minutes to complete the experiment.
12We assume here that individual performance is not a�ected by the manager’s assignment. For example,we stipulate that it is not the case that the 70% player would have tried harder if she had been put into thebottom position.
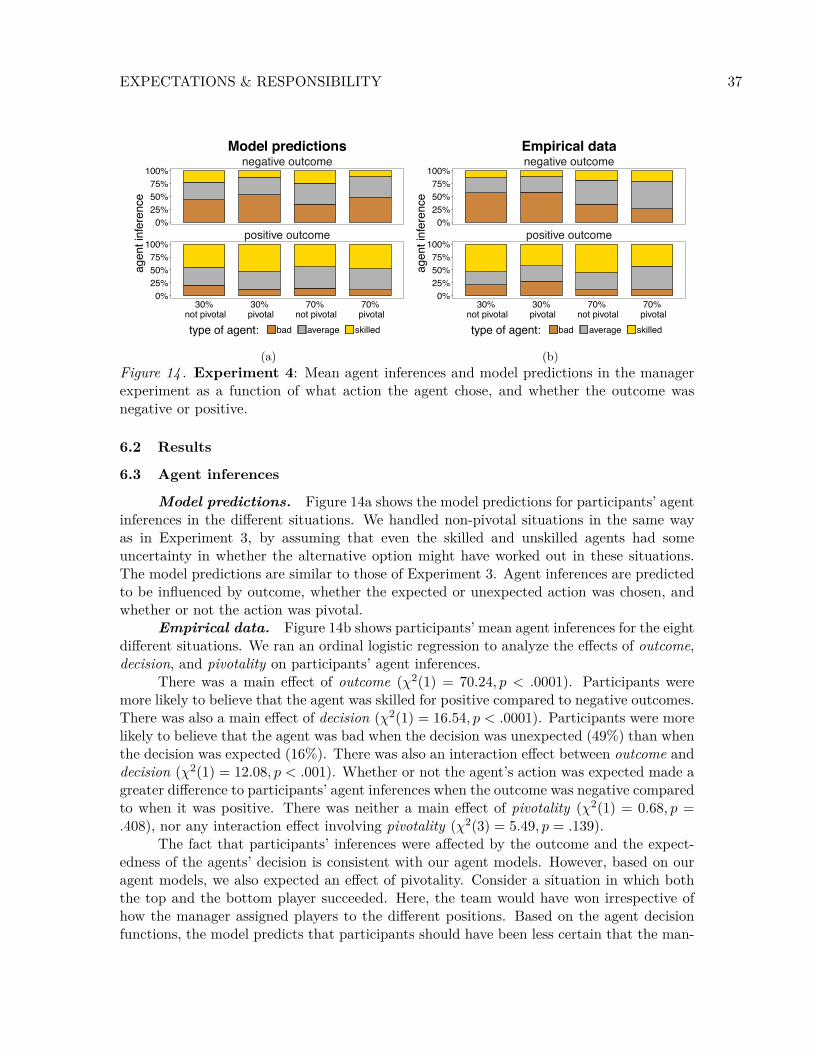
EXPECTATIONS & RESPONSIBILITY 37
negative outcome
positive outcome0%
25%50%75%
100%
0%25%50%75%
100%
30% not pivotal
30% pivotal
70% not pivotal
70% pivotal
agen
t inf
eren
ce
type of agent: bad average skilled
Model predictions
(a)
negative outcome
positive outcome0%
25%50%75%
100%
0%25%50%75%
100%
30% not pivotal
30% pivotal
70% not pivotal
70% pivotal
agen
t inf
eren
ce
type of agent: bad average skilled
Empirical data
(b)Figure 14 . Experiment 4: Mean agent inferences and model predictions in the managerexperiment as a function of what action the agent chose, and whether the outcome wasnegative or positive.
6.2 Results
6.3 Agent inferences
Model predictions. Figure 14a shows the model predictions for participants’ agentinferences in the di�erent situations. We handled non-pivotal situations in the same wayas in Experiment 3, by assuming that even the skilled and unskilled agents had someuncertainty in whether the alternative option might have worked out in these situations.The model predictions are similar to those of Experiment 3. Agent inferences are predictedto be influenced by outcome, whether the expected or unexpected action was chosen, andwhether or not the action was pivotal.
Empirical data. Figure 14b shows participants’ mean agent inferences for the eightdi�erent situations. We ran an ordinal logistic regression to analyze the e�ects of outcome,decision, and pivotality on participants’ agent inferences.
There was a main e�ect of outcome (‰2(1) = 70.24, p < .0001). Participants weremore likely to believe that the agent was skilled for positive compared to negative outcomes.There was also a main e�ect of decision (‰2(1) = 16.54, p < .0001). Participants were morelikely to believe that the agent was bad when the decision was unexpected (49%) than whenthe decision was expected (16%). There was also an interaction e�ect between outcome anddecision (‰2(1) = 12.08, p < .001). Whether or not the agent’s action was expected made agreater di�erence to participants’ agent inferences when the outcome was negative comparedto when it was positive. There was neither a main e�ect of pivotality (‰2(1) = 0.68, p =.408), nor any interaction e�ect involving pivotality (‰2(3) = 5.49, p = .139).
The fact that participants’ inferences were a�ected by the outcome and the expect-edness of the agents’ decision is consistent with our agent models. However, based on ouragent models, we also expected an e�ect of pivotality. Consider a situation in which boththe top and the bottom player succeeded. Here, the team would have won irrespective ofhow the manager assigned players to the di�erent positions. Based on the agent decisionfunctions, the model predicts that participants should have been less certain that the man-
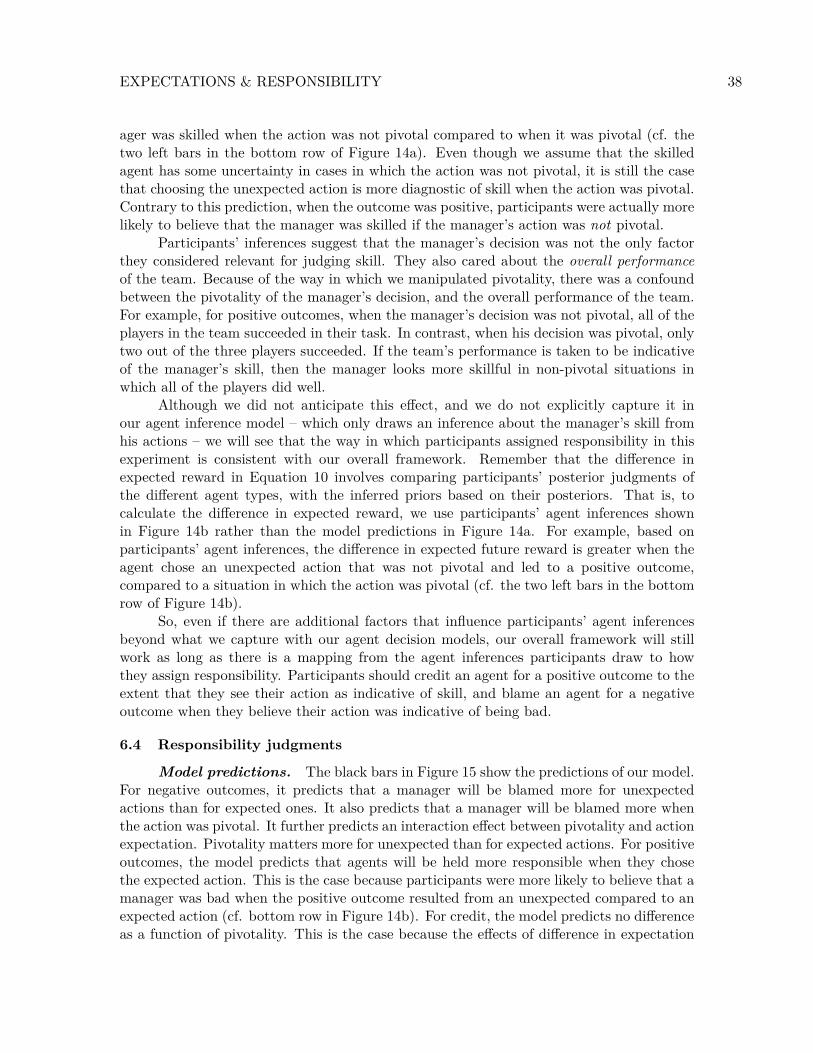
EXPECTATIONS & RESPONSIBILITY 38
ager was skilled when the action was not pivotal compared to when it was pivotal (cf. thetwo left bars in the bottom row of Figure 14a). Even though we assume that the skilledagent has some uncertainty in cases in which the action was not pivotal, it is still the casethat choosing the unexpected action is more diagnostic of skill when the action was pivotal.Contrary to this prediction, when the outcome was positive, participants were actually morelikely to believe that the manager was skilled if the manager’s action was not pivotal.
Participants’ inferences suggest that the manager’s decision was not the only factorthey considered relevant for judging skill. They also cared about the overall performanceof the team. Because of the way in which we manipulated pivotality, there was a confoundbetween the pivotality of the manager’s decision, and the overall performance of the team.For example, for positive outcomes, when the manager’s decision was not pivotal, all of theplayers in the team succeeded in their task. In contrast, when his decision was pivotal, onlytwo out of the three players succeeded. If the team’s performance is taken to be indicativeof the manager’s skill, then the manager looks more skillful in non-pivotal situations inwhich all of the players did well.
Although we did not anticipate this e�ect, and we do not explicitly capture it inour agent inference model – which only draws an inference about the manager’s skill fromhis actions – we will see that the way in which participants assigned responsibility in thisexperiment is consistent with our overall framework. Remember that the di�erence inexpected reward in Equation 10 involves comparing participants’ posterior judgments ofthe di�erent agent types, with the inferred priors based on their posteriors. That is, tocalculate the di�erence in expected reward, we use participants’ agent inferences shownin Figure 14b rather than the model predictions in Figure 14a. For example, based onparticipants’ agent inferences, the di�erence in expected future reward is greater when theagent chose an unexpected action that was not pivotal and led to a positive outcome,compared to a situation in which the action was pivotal (cf. the two left bars in the bottomrow of Figure 14b).
So, even if there are additional factors that influence participants’ agent inferencesbeyond what we capture with our agent decision models, our overall framework will stillwork as long as there is a mapping from the agent inferences participants draw to howthey assign responsibility. Participants should credit an agent for a positive outcome to theextent that they see their action as indicative of skill, and blame an agent for a negativeoutcome when they believe their action was indicative of being bad.
6.4 Responsibility judgments
Model predictions. The black bars in Figure 15 show the predictions of our model.For negative outcomes, it predicts that a manager will be blamed more for unexpectedactions than for expected ones. It also predicts that a manager will be blamed more whenthe action was pivotal. It further predicts an interaction e�ect between pivotality and actionexpectation. Pivotality matters more for unexpected than for expected actions. For positiveoutcomes, the model predicts that agents will be held more responsible when they chosethe expected action. This is the case because participants were more likely to believe that amanager was bad when the positive outcome resulted from an unexpected compared to anexpected action (cf. bottom row in Figure 14b). For credit, the model predicts no di�erenceas a function of pivotality. This is the case because the e�ects of di�erence in expectation
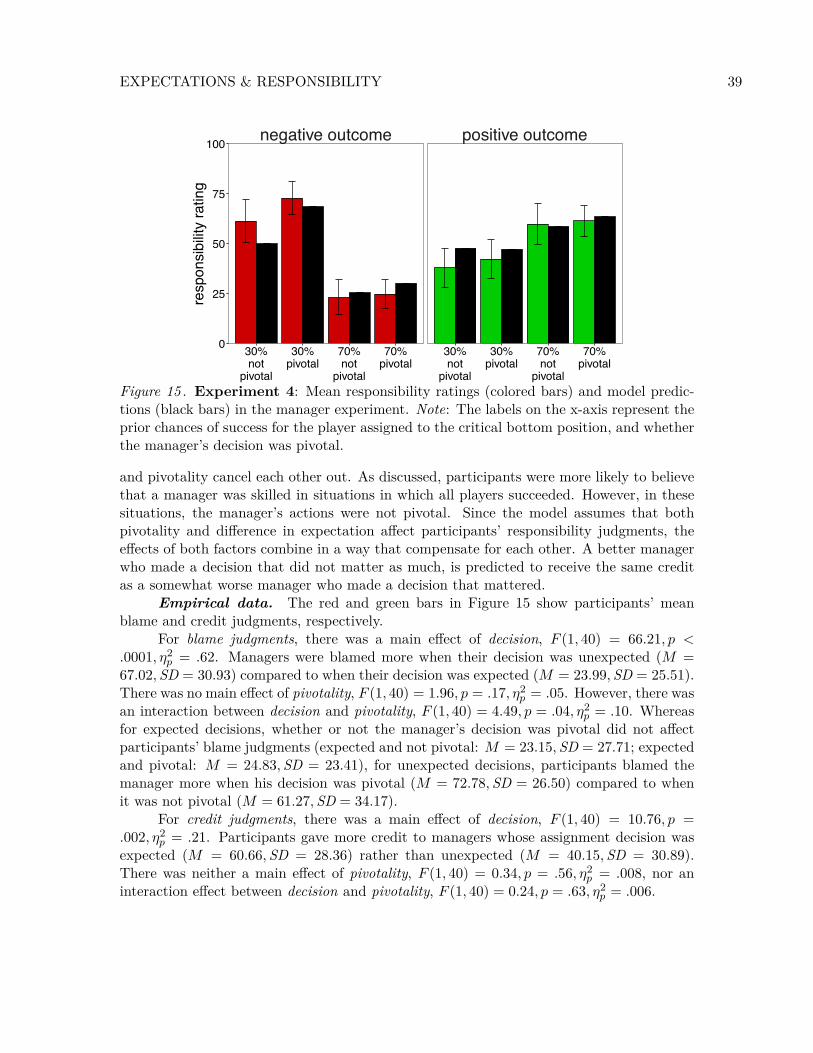
EXPECTATIONS & RESPONSIBILITY 39
negative outcome positive outcome
0
25
50
75
100
30%not
pivotal
30%pivotal
70%not
pivotal
70%pivotal
30%not
pivotal
30%pivotal
70%not
pivotal
70%pivotal
resp
onsi
bilit
y ra
ting
Figure 15 . Experiment 4: Mean responsibility ratings (colored bars) and model predic-tions (black bars) in the manager experiment. Note: The labels on the x-axis represent theprior chances of success for the player assigned to the critical bottom position, and whetherthe manager’s decision was pivotal.
and pivotality cancel each other out. As discussed, participants were more likely to believethat a manager was skilled in situations in which all players succeeded. However, in thesesituations, the manager’s actions were not pivotal. Since the model assumes that bothpivotality and di�erence in expectation a�ect participants’ responsibility judgments, thee�ects of both factors combine in a way that compensate for each other. A better managerwho made a decision that did not matter as much, is predicted to receive the same creditas a somewhat worse manager who made a decision that mattered.
Empirical data. The red and green bars in Figure 15 show participants’ meanblame and credit judgments, respectively.
For blame judgments, there was a main e�ect of decision, F (1, 40) = 66.21, p <
.0001, ÷
2
p
= .62. Managers were blamed more when their decision was unexpected (M =67.02, SD = 30.93) compared to when their decision was expected (M = 23.99, SD = 25.51).There was no main e�ect of pivotality, F (1, 40) = 1.96, p = .17, ÷
2
p
= .05. However, there wasan interaction between decision and pivotality, F (1, 40) = 4.49, p = .04, ÷
2
p
= .10. Whereasfor expected decisions, whether or not the manager’s decision was pivotal did not a�ectparticipants’ blame judgments (expected and not pivotal: M = 23.15, SD = 27.71; expectedand pivotal: M = 24.83, SD = 23.41), for unexpected decisions, participants blamed themanager more when his decision was pivotal (M = 72.78, SD = 26.50) compared to whenit was not pivotal (M = 61.27, SD = 34.17).
For credit judgments, there was a main e�ect of decision, F (1, 40) = 10.76, p =.002, ÷
2
p
= .21. Participants gave more credit to managers whose assignment decision wasexpected (M = 60.66, SD = 28.36) rather than unexpected (M = 40.15, SD = 30.89).There was neither a main e�ect of pivotality, F (1, 40) = 0.34, p = .56, ÷
2
p
= .008, nor aninteraction e�ect between decision and pivotality, F (1, 40) = 0.24, p = .63, ÷
2
p
= .006.
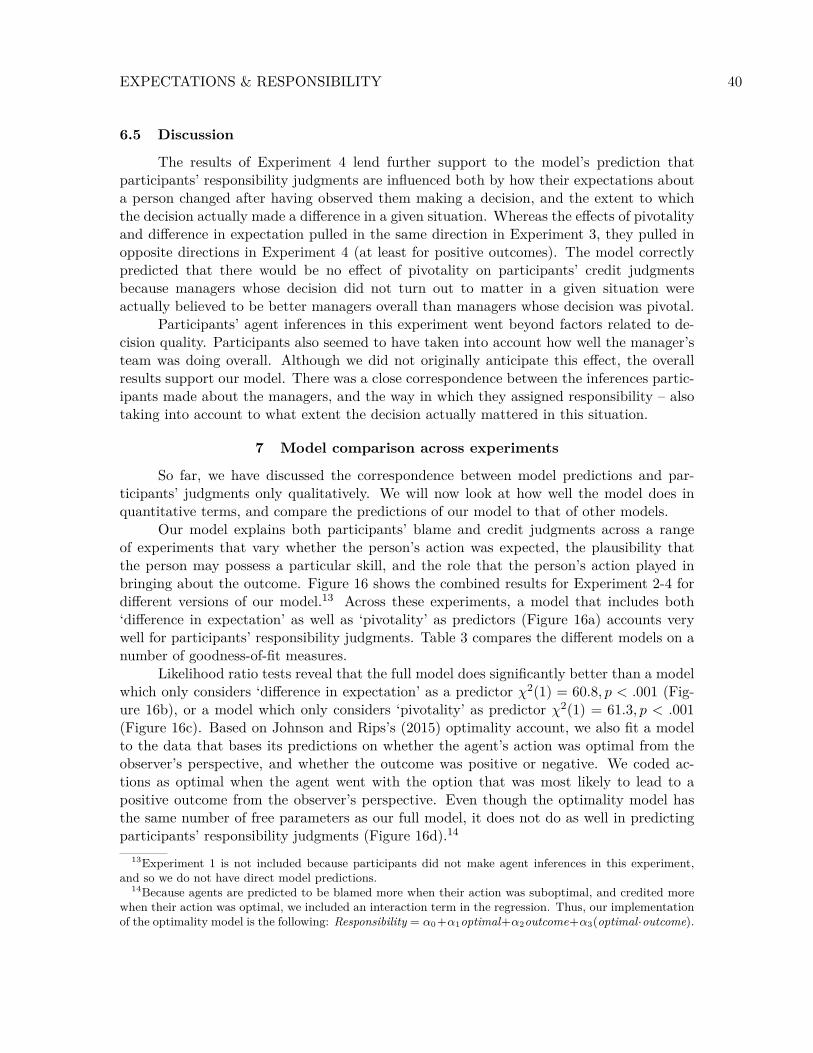
EXPECTATIONS & RESPONSIBILITY 40
6.5 Discussion
The results of Experiment 4 lend further support to the model’s prediction thatparticipants’ responsibility judgments are influenced both by how their expectations abouta person changed after having observed them making a decision, and the extent to whichthe decision actually made a di�erence in a given situation. Whereas the e�ects of pivotalityand di�erence in expectation pulled in the same direction in Experiment 3, they pulled inopposite directions in Experiment 4 (at least for positive outcomes). The model correctlypredicted that there would be no e�ect of pivotality on participants’ credit judgmentsbecause managers whose decision did not turn out to matter in a given situation wereactually believed to be better managers overall than managers whose decision was pivotal.
Participants’ agent inferences in this experiment went beyond factors related to de-cision quality. Participants also seemed to have taken into account how well the manager’steam was doing overall. Although we did not originally anticipate this e�ect, the overallresults support our model. There was a close correspondence between the inferences partic-ipants made about the managers, and the way in which they assigned responsibility – alsotaking into account to what extent the decision actually mattered in this situation.
7 Model comparison across experiments
So far, we have discussed the correspondence between model predictions and par-ticipants’ judgments only qualitatively. We will now look at how well the model does inquantitative terms, and compare the predictions of our model to that of other models.
Our model explains both participants’ blame and credit judgments across a rangeof experiments that vary whether the person’s action was expected, the plausibility thatthe person may possess a particular skill, and the role that the person’s action played inbringing about the outcome. Figure 16 shows the combined results for Experiment 2-4 fordi�erent versions of our model.13 Across these experiments, a model that includes both‘di�erence in expectation’ as well as ‘pivotality’ as predictors (Figure 16a) accounts verywell for participants’ responsibility judgments. Table 3 compares the di�erent models on anumber of goodness-of-fit measures.
Likelihood ratio tests reveal that the full model does significantly better than a modelwhich only considers ‘di�erence in expectation’ as a predictor ‰
2(1) = 60.8, p < .001 (Fig-ure 16b), or a model which only considers ‘pivotality’ as predictor ‰
2(1) = 61.3, p < .001(Figure 16c). Based on Johnson and Rips’s (2015) optimality account, we also fit a modelto the data that bases its predictions on whether the agent’s action was optimal from theobserver’s perspective, and whether the outcome was positive or negative. We coded ac-tions as optimal when the agent went with the option that was most likely to lead to apositive outcome from the observer’s perspective. Even though the optimality model hasthe same number of free parameters as our full model, it does not do as well in predictingparticipants’ responsibility judgments (Figure 16d).14
13Experiment 1 is not included because participants did not make agent inferences in this experiment,and so we do not have direct model predictions.
14Because agents are predicted to be blamed more when their action was suboptimal, and credited morewhen their action was optimal, we included an interaction term in the regression. Thus, our implementationof the optimality model is the following: Responsibility = –0+–1optimal+–2outcome+–3(optimal·outcome).

EXPECTATIONS & RESPONSIBILITY 41
●
●
●
●
●
●
●
●
●
●
● ●
●
●
●
●
0
10
20
30
40
50
60
70
80
90
100
0 10 20 30 40 50 60 70 80 90 100model prediction
resp
onsi
bilit
y ra
ting
experiment●
●
●
●
goaliespinnermanagergardener
outcome● negative outcome
positive outcome
(a) Di�erence in expectation & Pivotality
●
●
●
●
●
●
●
●
●
●
●●
●
●
●
●
0
10
20
30
40
50
60
70
80
90
100
0 10 20 30 40 50 60 70 80 90 100model prediction
resp
onsi
bilit
y ra
ting
experiment●
●
●
●
goaliespinnermanagergardener
outcome● negative outcome
positive outcome
(b) Di�erence in expectation
●
●
●
●
●
●
●
●
●
●
● ●
●
●
●
●
0
10
20
30
40
50
60
70
80
90
100
0 10 20 30 40 50 60 70 80 90 100model prediction
resp
onsi
bilit
y ra
ting
experiment●
●
●
●
goaliespinnermanagergardener
outcome● negative outcome
positive outcome
(c) Pivotality
●
●
●
●
●
●
●
●
●
●
●●
●
●
●
●
0
10
20
30
40
50
60
70
80
90
100
0 10 20 30 40 50 60 70 80 90 100model prediction
resp
onsi
bilit
y ra
ting
experiment●
●
●
●
goaliespinnermanagergardener
outcome● negative outcome
positive outcome
(d) OptimalityFigure 16 . Scatterplots of model predictions (x-axis) and mean responsibility ratings (y-axis) across all four experiments.Table 3Summary of the model results. Values for r and RMSE indicate means (with 5% and 95%quantiles in parentheses) based on 100 split-half cross-validation runs. BIC scores are basedon running the models on the full data set.
Model r RMSE BICDi�erence & pivotality .846 (.674, .922) 9.896 (6.816, 13.512) 218.75
Di�erence .704 (.47, .865) 21.092 (15.941, 27.527) 275.92Pivotality .496 (.258, .687) 16.702 (12.941, 19.49) 276.38
Optimality .684 (.467, .816) 13.731 (11.23, 17.575) 262.76Note: BIC = Bayesian Information Criterion (lower values indicate better model performance).
The model comparisons show that both components of our model are required toadequately capture participants’ responsibility judgments across the range of experimentswe considered in this paper. The fact that the optimality model cannot account as well forthe data, shows that there is no direct link between action expectations and responsibilityjudgments. How much credit or blame a person receives depends on how strongly our beliefsabout a person’s disposition changed, based on having observed their action.15
15See Tables A1 and A2 for an overview of the model’s predictions across all experiments and situations.
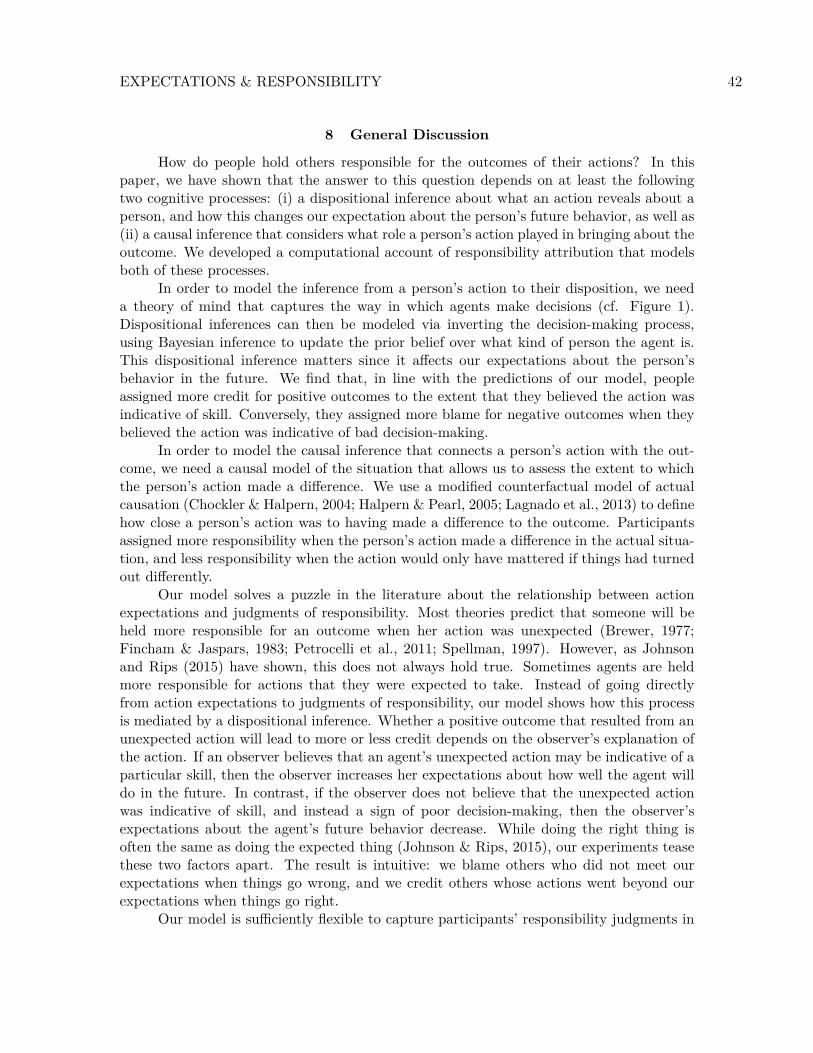
EXPECTATIONS & RESPONSIBILITY 42
8 General Discussion
How do people hold others responsible for the outcomes of their actions? In thispaper, we have shown that the answer to this question depends on at least the followingtwo cognitive processes: (i) a dispositional inference about what an action reveals about aperson, and how this changes our expectation about the person’s future behavior, as well as(ii) a causal inference that considers what role a person’s action played in bringing about theoutcome. We developed a computational account of responsibility attribution that modelsboth of these processes.
In order to model the inference from a person’s action to their disposition, we needa theory of mind that captures the way in which agents make decisions (cf. Figure 1).Dispositional inferences can then be modeled via inverting the decision-making process,using Bayesian inference to update the prior belief over what kind of person the agent is.This dispositional inference matters since it a�ects our expectations about the person’sbehavior in the future. We find that, in line with the predictions of our model, peopleassigned more credit for positive outcomes to the extent that they believed the action wasindicative of skill. Conversely, they assigned more blame for negative outcomes when theybelieved the action was indicative of bad decision-making.
In order to model the causal inference that connects a person’s action with the out-come, we need a causal model of the situation that allows us to assess the extent to whichthe person’s action made a di�erence. We use a modified counterfactual model of actualcausation (Chockler & Halpern, 2004; Halpern & Pearl, 2005; Lagnado et al., 2013) to definehow close a person’s action was to having made a di�erence to the outcome. Participantsassigned more responsibility when the person’s action made a di�erence in the actual situa-tion, and less responsibility when the action would only have mattered if things had turnedout di�erently.
Our model solves a puzzle in the literature about the relationship between actionexpectations and judgments of responsibility. Most theories predict that someone will beheld more responsible for an outcome when her action was unexpected (Brewer, 1977;Fincham & Jaspars, 1983; Petrocelli et al., 2011; Spellman, 1997). However, as Johnsonand Rips (2015) have shown, this does not always hold true. Sometimes agents are heldmore responsible for actions that they were expected to take. Instead of going directlyfrom action expectations to judgments of responsibility, our model shows how this processis mediated by a dispositional inference. Whether a positive outcome that resulted from anunexpected action will lead to more or less credit depends on the observer’s explanation ofthe action. If an observer believes that an agent’s unexpected action may be indicative of aparticular skill, then the observer increases her expectations about how well the agent willdo in the future. In contrast, if the observer does not believe that the unexpected actionwas indicative of skill, and instead a sign of poor decision-making, then the observer’sexpectations about the agent’s future behavior decrease. While doing the right thing isoften the same as doing the expected thing (Johnson & Rips, 2015), our experiments teasethese two factors apart. The result is intuitive: we blame others who did not meet ourexpectations when things go wrong, and we credit others whose actions went beyond ourexpectations when things go right.
Our model is su�ciently flexible to capture participants’ responsibility judgments in

EXPECTATIONS & RESPONSIBILITY 43
Resp
onsib
ility
repeated success
t
(a) Hierarchical inference
Resp
onsib
ility
repeated success
model: person population hybrid
(b) Norms of comparisonFigure 17 . Model predictions for repeated observations. (a) Hierarchical inference modelthat learns not only about the distribution of agents, but the characteristics of di�erentworlds. At time t the observer realizes that the world is di�erent from what she thought itwas. (b) Models that di�er in how they calculate the di�erence in expected future reward.
a variety of di�erent situations, and it does so to a high degree of quantitative accuracy.In the following, we highlight two aspects where we think the model raises interestingquestions for future research. The first question concerns the role that expectations play inour model. The second question is concerned with possible ways in which our frameworkcould be extended to capture people’s judgments of moral responsibility.
8.1 The role of expectations
Expectations play a key part in our model. A person’s behavior is evaluated withrespect to how our expectations about them have changed in light of their behavior, andour model provides a mechanism for how to formalize this change of expectations and re-late it to responsibility. Our experiments did not directly address the question of whereparticipants’ initial expectations come from, although we were able to assess people’s priorexpectations based on their posterior judgments about the di�erent agent types. For exam-ple, participants believed that it was more likely that goalkeepers could be skilled comparedto game show contestants trying to predict the outcome of a spinner (cf. Table 2). Sinceparticipants in our experiments only saw each agent act once, they had to rely on theirexpectation about what a generally reasonable person in this situation would do. Thingswould look quite di�erent if participants had repeated observations about the same person.Our model predicts that if the observer’s expectations are high, there is little room for creditbut much space for blame. If our expectations are low, then there is much room for creditand little space for blame. The way in which our uncertainty about a person’s dispositionresolves as we observe them acting repeatedly, can lead to interesting e�ects.
For example, imagine that we see a person correctly predicting an unexpected out-come in a situation where we initially doubt the possibility that a person could reliablyanticipate such an outcome. At first, we may not consider the person’s decision particularlycreditworthy (cf. Figure 17a). However, if the person repeatedly gets things right, therewill be a point in time where we come to realize that the person does have a special skillthat we did not consider plausible at the beginning, and subsequently credit them more
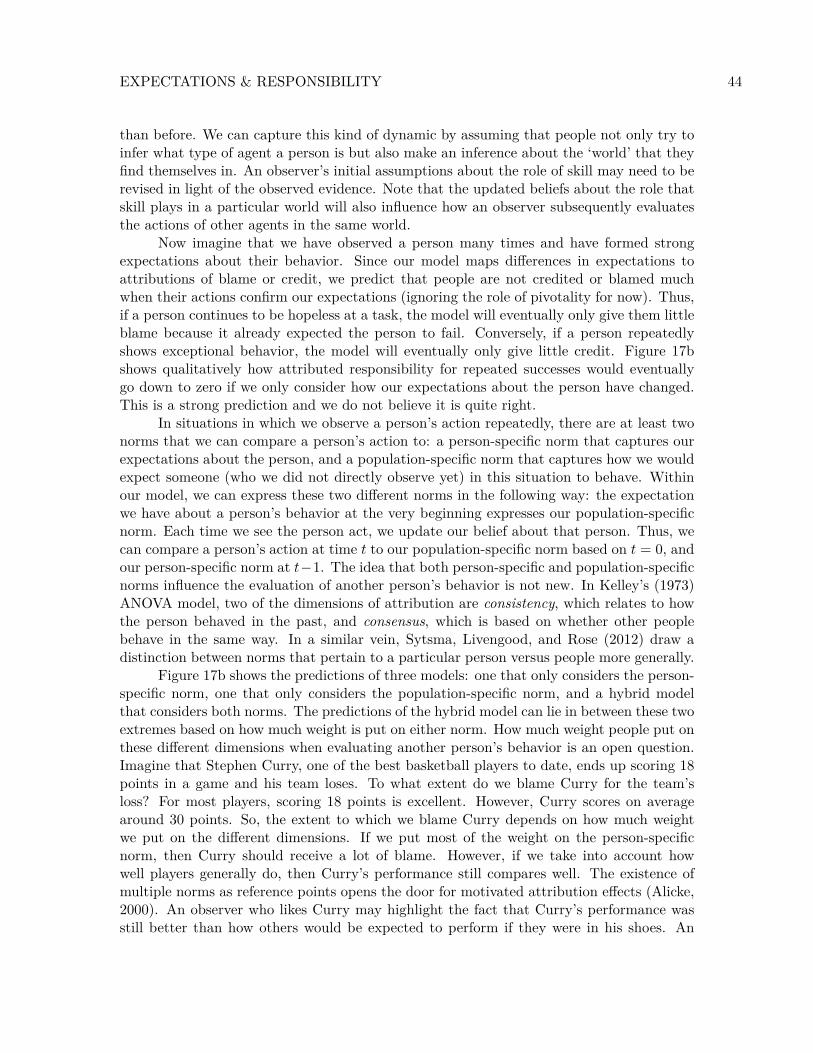
EXPECTATIONS & RESPONSIBILITY 44
than before. We can capture this kind of dynamic by assuming that people not only try toinfer what type of agent a person is but also make an inference about the ‘world’ that theyfind themselves in. An observer’s initial assumptions about the role of skill may need to berevised in light of the observed evidence. Note that the updated beliefs about the role thatskill plays in a particular world will also influence how an observer subsequently evaluatesthe actions of other agents in the same world.
Now imagine that we have observed a person many times and have formed strongexpectations about their behavior. Since our model maps di�erences in expectations toattributions of blame or credit, we predict that people are not credited or blamed muchwhen their actions confirm our expectations (ignoring the role of pivotality for now). Thus,if a person continues to be hopeless at a task, the model will eventually only give them littleblame because it already expected the person to fail. Conversely, if a person repeatedlyshows exceptional behavior, the model will eventually only give little credit. Figure 17bshows qualitatively how attributed responsibility for repeated successes would eventuallygo down to zero if we only consider how our expectations about the person have changed.This is a strong prediction and we do not believe it is quite right.
In situations in which we observe a person’s action repeatedly, there are at least twonorms that we can compare a person’s action to: a person-specific norm that captures ourexpectations about the person, and a population-specific norm that captures how we wouldexpect someone (who we did not directly observe yet) in this situation to behave. Withinour model, we can express these two di�erent norms in the following way: the expectationwe have about a person’s behavior at the very beginning expresses our population-specificnorm. Each time we see the person act, we update our belief about that person. Thus, wecan compare a person’s action at time t to our population-specific norm based on t = 0, andour person-specific norm at t≠1. The idea that both person-specific and population-specificnorms influence the evaluation of another person’s behavior is not new. In Kelley’s (1973)ANOVA model, two of the dimensions of attribution are consistency, which relates to howthe person behaved in the past, and consensus, which is based on whether other peoplebehave in the same way. In a similar vein, Sytsma, Livengood, and Rose (2012) draw adistinction between norms that pertain to a particular person versus people more generally.
Figure 17b shows the predictions of three models: one that only considers the person-specific norm, one that only considers the population-specific norm, and a hybrid modelthat considers both norms. The predictions of the hybrid model can lie in between these twoextremes based on how much weight is put on either norm. How much weight people put onthese di�erent dimensions when evaluating another person’s behavior is an open question.Imagine that Stephen Curry, one of the best basketball players to date, ends up scoring 18points in a game and his team loses. To what extent do we blame Curry for the team’sloss? For most players, scoring 18 points is excellent. However, Curry scores on averagearound 30 points. So, the extent to which we blame Curry depends on how much weightwe put on the di�erent dimensions. If we put most of the weight on the person-specificnorm, then Curry should receive a lot of blame. However, if we take into account howwell players generally do, then Curry’s performance still compares well. The existence ofmultiple norms as reference points opens the door for motivated attribution e�ects (Alicke,2000). An observer who likes Curry may highlight the fact that Curry’s performance wasstill better than how others would be expected to perform if they were in his shoes. An
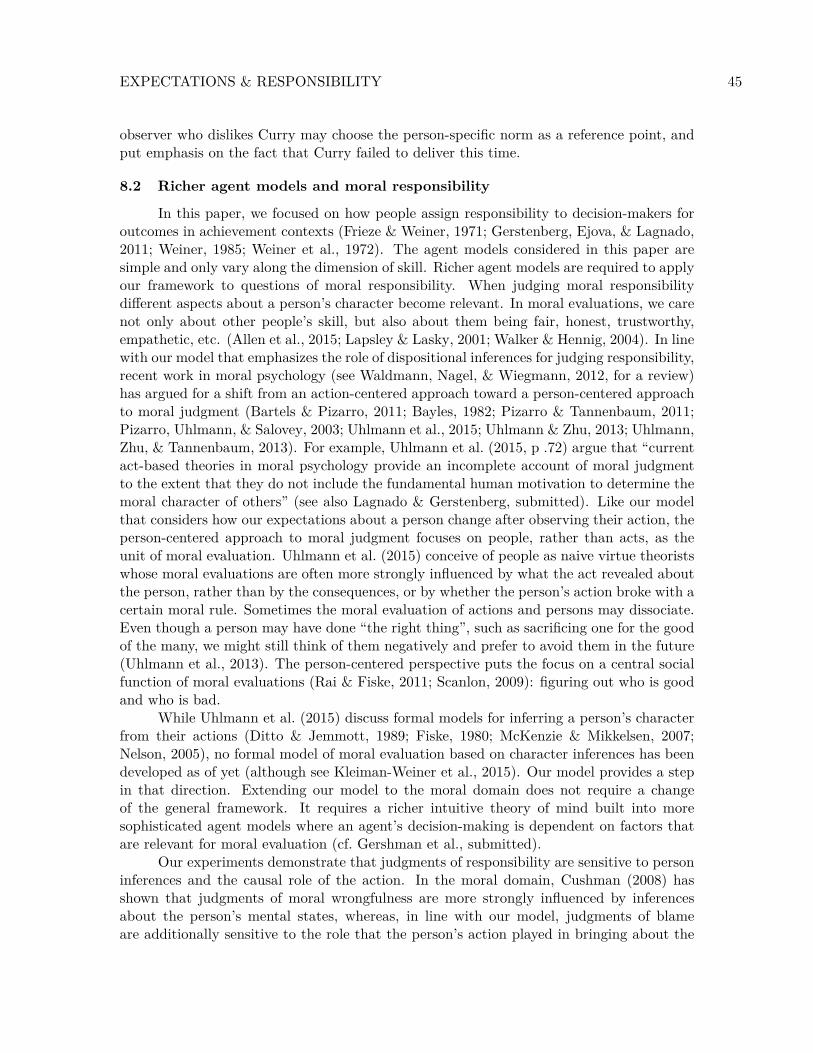
EXPECTATIONS & RESPONSIBILITY 45
observer who dislikes Curry may choose the person-specific norm as a reference point, andput emphasis on the fact that Curry failed to deliver this time.
8.2 Richer agent models and moral responsibility
In this paper, we focused on how people assign responsibility to decision-makers foroutcomes in achievement contexts (Frieze & Weiner, 1971; Gerstenberg, Ejova, & Lagnado,2011; Weiner, 1985; Weiner et al., 1972). The agent models considered in this paper aresimple and only vary along the dimension of skill. Richer agent models are required to applyour framework to questions of moral responsibility. When judging moral responsibilitydi�erent aspects about a person’s character become relevant. In moral evaluations, we carenot only about other people’s skill, but also about them being fair, honest, trustworthy,empathetic, etc. (Allen et al., 2015; Lapsley & Lasky, 2001; Walker & Hennig, 2004). In linewith our model that emphasizes the role of dispositional inferences for judging responsibility,recent work in moral psychology (see Waldmann, Nagel, & Wiegmann, 2012, for a review)has argued for a shift from an action-centered approach toward a person-centered approachto moral judgment (Bartels & Pizarro, 2011; Bayles, 1982; Pizarro & Tannenbaum, 2011;Pizarro, Uhlmann, & Salovey, 2003; Uhlmann et al., 2015; Uhlmann & Zhu, 2013; Uhlmann,Zhu, & Tannenbaum, 2013). For example, Uhlmann et al. (2015, p .72) argue that “currentact-based theories in moral psychology provide an incomplete account of moral judgmentto the extent that they do not include the fundamental human motivation to determine themoral character of others” (see also Lagnado & Gerstenberg, submitted). Like our modelthat considers how our expectations about a person change after observing their action, theperson-centered approach to moral judgment focuses on people, rather than acts, as theunit of moral evaluation. Uhlmann et al. (2015) conceive of people as naive virtue theoristswhose moral evaluations are often more strongly influenced by what the act revealed aboutthe person, rather than by the consequences, or by whether the person’s action broke with acertain moral rule. Sometimes the moral evaluation of actions and persons may dissociate.Even though a person may have done “the right thing”, such as sacrificing one for the goodof the many, we might still think of them negatively and prefer to avoid them in the future(Uhlmann et al., 2013). The person-centered perspective puts the focus on a central socialfunction of moral evaluations (Rai & Fiske, 2011; Scanlon, 2009): figuring out who is goodand who is bad.
While Uhlmann et al. (2015) discuss formal models for inferring a person’s characterfrom their actions (Ditto & Jemmott, 1989; Fiske, 1980; McKenzie & Mikkelsen, 2007;Nelson, 2005), no formal model of moral evaluation based on character inferences has beendeveloped as of yet (although see Kleiman-Weiner et al., 2015). Our model provides a stepin that direction. Extending our model to the moral domain does not require a changeof the general framework. It requires a richer intuitive theory of mind built into moresophisticated agent models where an agent’s decision-making is dependent on factors thatare relevant for moral evaluation (cf. Gershman et al., submitted).
Our experiments demonstrate that judgments of responsibility are sensitive to personinferences and the causal role of the action. In the moral domain, Cushman (2008) hasshown that judgments of moral wrongfulness are more strongly influenced by inferencesabout the person’s mental states, whereas, in line with our model, judgments of blameare additionally sensitive to the role that the person’s action played in bringing about the
EXPECTATIONS & RESPONSIBILITY 46
outcome (cf. Sloman, Fernbach, & Ewing, 2009). More research is needed to find out towhat extent person inferences and action evaluations a�ect people’s moral judgments, andour model outlines a general framework to guide that future research e�ort.
9 Conclusion
People have a rich understanding of how the world works, and of how other peoplework (Gerstenberg & Tenenbaum, submitted; Wellman & Gelman, 1992). With this under-standing come expectations of how events will unfold. Expectations are a key construct inthe cognitive sciences ranging from the predictive coding theory about the brain (Kilner,Friston, & Frith, 2007) to what determines our moment-to-moment happiness (Rutledge,Skandali, Dayan, & Dolan, 2014). In this paper, we argue that expectations also play akey role for how we hold others responsible. We credit others when our expectations abouthow they will act in the future have improved, and blame them if our expectations havedecreased. It is important to maintain accurate models of other people through updatingour expectations, as we constantly have to decide who to interact with, and who to avoid(Baumard, André, & Sperber, 2013; Rai & Fiske, 2011). By combining a person-centeredviewpoint on how a person’s action changed our expectations about their future behavior,with an action-centered viewpoint on the causal role that the person’s action played inbringing about the outcome, we arrive at a more comprehensive understanding of how wehold others responsible.
10 Acknowledgments
We thank Kelsey Allen for extensive comments on the manuscript, and Kevin Smithfor valuable feedback and discussion. This work was supported by the Center for Brains,Minds & Machines (CBMM), funded by NSF STC award CCF-1231216 and by an ONRgrant N00014-13-1-0333. Part of this paper is based on Gerstenberg, Ullman, et al. (2014).
EXPECTATIONS & RESPONSIBILITY 47
11 References
Ajzen, I. (1971). Attribution of dispositions to an actor: E�ects of perceived decisionfreedom and behavioral utilities. Journal of Personality and Social Psychology, 18 (2),144–156.
Ajzen, I., & Fishbein, M. (1975). A Bayesian analysis of attribution processes. PsychologicalBulletin, 82 (2), 261–277.
Ajzen, I., & Fishbein, M. (1978). Use and misuse of Baye’s theorem in causal attribution:Don’t attribute it to Ajzen and Fishbein either. Psychological Bulletin, 85 (2), 244-246.
Alicke, M. D. (2000). Culpable control and the psychology of blame. Psychological Bulletin,126 (4), 556–574.
Alicke, M. D., Mandel, D. R., Hilton, D., Gerstenberg, T., & Lagnado, D. A. (2015). Causalconceptions in social explanation and moral evaluation: A historical tour. Perspectiveson Psychological Science, 10 (6), 790–812.
Alicke, M. D., & Rose, D. (2012). Culpable control and causal deviance. Journal ofPersonality and Social Psychology Compass, 6 , 723–725.
Allen, K., Jara-Ettinger, J., Gerstenberg, T., Kleiman-Weiner, M., & Tenenbaum, J. B.(2015). Go fishing! responsibility judgments when cooperation breaks down. InD. C. Noelle et al. (Eds.), Proceedings of the 37th Annual Conference of the CognitiveScience Society (pp. 84–89). Austin, TX: Cognitive Science Society.
Baker, C. L., Saxe, R., & Tenenbaum, J. B. (2009). Action understanding as inverseplanning. Cognition, 113 (3), 329–349.
Baker, C. L., & Tenenbaum, J. B. (2014). Modeling human plan recognition using bayesiantheory of mind. In Plan, activity, and intent recognition (pp. 177–204). Elsevier BV.Retrieved from http://dx.doi.org/10.1016/b978-0-12-398532-3.00007-5 doi:10.1016/b978-0-12-398532-3.00007-5
Bartels, D. M., & Pizarro, D. A. (2011, oct). The mismeasure of morals: Antisocialpersonality traits predict utilitarian responses to moral dilemmas. Cognition, 121 (1),154–161. Retrieved from http://dx.doi.org/10.1016/j.cognition.2011.05.010
doi: 10.1016/j.cognition.2011.05.010Baumard, N., André, J.-B., & Sperber, D. (2013, feb). A mutualistic approach to morality:
The evolution of fairness by partner choice. Behavioral and Brain Sciences, 36 (01),59–78. Retrieved from http://dx.doi.org/10.1017/s0140525x11002202 doi: 10.1017/s0140525x11002202
Bayles, M. D. (1982). Character, purpose, and criminal responsibility. Law and Philosophy,1 (1), 5–20.
Botti, S., & McGill, A. L. (2006, sep). When choosing is not deciding: The e�ect ofperceived responsibility on satisfaction. J Consum Res, 33 (2), 211–219. Retrievedfrom http://dx.doi.org/10.1086/506302 doi: 10.1086/506302
Brewer, M. B. (1977). An information-processing approach to attribution of responsibility.Journal of Experimental Social Psychology, 13 (1), 58–69.
Buss, A. R. (1978). Causes and reasons in attribution theory: A conceptual critique.Journal of Personality and Social Psychology, 36 (11), 1311–1321.
Byrne, R. M. (2016). Counterfactual thought. Annual Review of Psychology, 67 , 135–157.
EXPECTATIONS & RESPONSIBILITY 48
Chockler, H., & Halpern, J. Y. (2004). Responsibility and blame: A structural-modelapproach. Journal of Artificial Intelligence Research, 22 (1), 93–115.
Crump, M. J. C., McDonnell, J. V., & Gureckis, T. M. (2013, Mar). Evaluating amazon’smechanical turk as a tool for experimental behavioral research. PLoS ONE , 8 (3),e57410. Retrieved from http://dx.doi.org/10.1371/journal.pone.0057410 doi:10.1371/journal.pone.0057410
Csibra, G., & Gergely, G. (2007, jan). ‘obsessed with goals’: Functions and mechanismsof teleological interpretation of actions in humans. Acta Psychologica, 124 (1), 60–78.Retrieved from http://dx.doi.org/10.1016/j.actpsy.2006.09.007 doi: 10.1016/j.actpsy.2006.09.007
Cushman, F. (2008). Crime and punishment: Distinguishing the roles of causal and inten-tional analyses in moral judgment. Cognition, 108 (2), 353–380.
De Cremer, D., & van Dijk, E. (2002). Perceived criticality and contributions in publicgood dilemmas: A matter of feeling responsible to all? Group Processes & IntergroupRelations, 5 (4), 319–332.
Ditto, P. H., & Jemmott, J. B. (1989). From rarity to evaluative extremity: E�ects ofprevalence information on evaluations of positive and negative characteristics. Journalof Personality and Social Psychology, 57 (1), 16–26. Retrieved from http://dx.doi
.org/10.1037/0022-3514.57.1.16 doi: 10.1037/0022-3514.57.1.16Du�, R. A. (1993, nov). Choice, character, and criminal liability. Law and Philosophy,
12 (4), 345–383. Retrieved from http://dx.doi.org/10.1007/bf01000637 doi:10.1007/bf01000637
Einhorn, H. J., & Hogarth, R. M. (1986). Judging probable cause. Psychological Bulletin,99 (1), 3–19.
Fincham, F. D., & Jaspars, J. M. (1983). A subjective probability approach to responsibilityattribution. British Journal of Social Psychology, 22 (2), 145–161.
Fischho�, B., & Beyth-Marom, R. (1983). Hypothesis evaluation from a bayesian perspec-tive. Psychological Review, 90 (3), 239–260.
Fischho�, B., & Lichtenstein, S. (1978). Don’t attribute this to reverend bayes. PsychologicalBulletin, 85 (2), 239–243.
Fishbein, M., & Ajzen, I. (1973). Attribution of responsibility: A theoretical note. Journalof Experimental Social Psychology, 9 (2), 148–153.
Fiske, S. T. (1980). Attention and weight in person perception: The impact of negativeand extreme behavior. Journal of Personality and Social Psychology, 38 (6), 889–906.Retrieved from http://dx.doi.org/10.1037/0022-3514.38.6.889 doi: 10.1037/0022-3514.38.6.889
Fraley, C., & Raftery, A. E. (2002). Model-based clustering, discriminant analysis anddensity estimation. Journal of the American Statistical Association, 97 , 611-631.
Fraley, C., Raftery, A. E., Murphy, T. B., & Scrucca, L. (2012). mclust version 4 forR: Normal mixture modeling for model-based clustering, classification, and densityestimation (Technical Report No. 597).
Frieze, I., & Weiner, B. (1971). Cue utilization and attributional judgments for success andfailure. Journal of Personality, 39 (4), 591–605.
Gailey, J. A., & Falk, R. F. (2008). Attribution of responsibility as a multidimensionalconcept. Sociological Spectrum, 28 (6), 659–680.
EXPECTATIONS & RESPONSIBILITY 49
Gergely, G., & Csibra, G. (2003). Teleological reasoning in infancy: The naıve theory ofrational action. Trends in Cognitive Sciences, 7 (7), 287–292.
Gergely, G., Nádasdy, Z., Csibra, G., & Bíró, S. (1995). Taking the intentional stance at12 months of age. Cognition, 56 (2), 165–193.
Gershman, S. J., Gerstenberg, T., Baker, C. L., & Cushman, F. (submitted). Goals, habits,and theory of mind.
Gerstenberg, T., Ejova, A., & Lagnado, D. A. (2011). Blame the skilled. In C. Carlson,C. Hölscher, & T. Shipley (Eds.), Proceedings of the 33rd Annual Conference of theCognitive Science Society (pp. 720–725). Austin, TX: Cognitive Science Society.
Gerstenberg, T., Goodman, N. D., Lagnado, D. A., & Tenenbaum, J. B. (2012). Noisy New-tons: Unifying process and dependency accounts of causal attribution. In N. Miyake,D. Peebles, & R. P. Cooper (Eds.), Proceedings of the 34th Annual Conference of theCognitive Science Society (pp. 378–383). Austin, TX: Cognitive Science Society.
Gerstenberg, T., Goodman, N. D., Lagnado, D. A., & Tenenbaum, J. B. (2014). Fromcounterfactual simulation to causal judgment. In P. Bello, M. Guarini, M. McShane,& B. Scassellati (Eds.), Proceedings of the 36th Annual Conference of the CognitiveScience Society (pp. 523–528). Austin, TX: Cognitive Science Society.
Gerstenberg, T., Goodman, N. D., Lagnado, D. A., & Tenenbaum, J. B. (2015). How,whether, why: Causal judgments as counterfactual contrasts. In D. C. Noelle et al.(Eds.), Proceedings of the 37th Annual Conference of the Cognitive Science Society(pp. 782–787). Austin, TX: Cognitive Science Society.
Gerstenberg, T., Halpern, J. Y., & Tenenbaum, J. B. (2015). Responsibility judgmentsin voting scenarios. In D. C. Noelle et al. (Eds.), Proceedings of the 37th AnnualConference of the Cognitive Science Society (pp. 788–793). Austin, TX: CognitiveScience Society.
Gerstenberg, T., & Lagnado, D. A. (2010). Spreading the blame: The allocation of respon-sibility amongst multiple agents. Cognition, 115 (1), 166–171.
Gerstenberg, T., & Lagnado, D. A. (2012). When contributions make a di�erence: Ex-plaining order e�ects in responsibility attributions. Psychonomic Bulletin & Review,19 (4), 729–736.
Gerstenberg, T., & Lagnado, D. A. (2014). Attributing responsibility: Actual and coun-terfactual worlds. In J. Knobe, T. Lombrozo, & S. Nichols (Eds.), Oxford studies inexperimental philosophy (Vol. 1, pp. 91–130). Oxford University Press.
Gerstenberg, T., & Tenenbaum, J. B. (submitted). Intuitive theories.Gerstenberg, T., Ullman, T. D., Kleiman-Weiner, M., Lagnado, D. A., & Tenenbaum,
J. B. (2014). Wins above replacement: Responsibility attributions as counterfactualreplacements. In P. Bello, M. Guarini, M. McShane, & B. Scassellati (Eds.), Proceed-ings of the 36th Annual Conference of the Cognitive Science Society (pp. 2263–2268).Austin, TX: Cognitive Science Society.
Gilbert, D. T. (1998). Ordinary personology. In D. Gilbert, S. Fiske, & G. Lindzey (Eds.),Handbook of social psychology (4th ed., pp. 89–150). New York: McGraw-Hill.
Gilbert, D. T., & Malone, P. S. (1995). The correspondence bias. Psychological Bulletin,117 (1), 21–38.
Goodman, N. D., Baker, C. L., Bonawitz, E. B., Mansinghka, V. K., Gopnik, A., Wellman,H., . . . Tenenbaum, J. B. (2006). Intuitive theories of mind: A rational approach to
EXPECTATIONS & RESPONSIBILITY 50
false belief. In Proceedings of the 28th Annual Conference of the Cognitive ScienceSociety (pp. 1382–1387).
Goodman, N. D., Tenenbaum, J. B., & Gerstenberg, T. (2015). Concepts in a probabilisticlanguage of thought. In E. Margolis & S. Lawrence (Eds.), The conceptual mind: Newdirections in the study of concepts (pp. 623–653). MIT Press.
Gopnik, A., & Wellman, H. M. (1992). Why the child’s theory of mind really is a theory.Mind & Language, 7 (1-2), 145–171.
Green, E. (1967). The reasonable man: Legal fiction or psychosocial reality? Law & SocietyReview, 2 , 241–258.
Guglielmo, S., & Malle, B. F. (2010). Enough skill to kill: Intentionality judgments andthe moral valence of action. Cognition, 117 (2), 139–150.
Halpern, J. Y., & Hitchcock, C. (2015). Graded causation and defaults. British Journalfor the Philosophy of Science, 66 , 413–457.
Halpern, J. Y., & Pearl, J. (2005). Causes and explanations: A structural-model approach.Part I: Causes. The British Journal for the Philosophy of Science, 56 (4), 843–887.
Hamilton, V. L. (1978). Who is responsible? Toward a social psychology of responsibilityattribution. Social Psychology, 41 (4), 316–328.
Hamilton, V. L. (1980). Intuitive psychologist or intuitive lawyer? Alternative models of theattribution process. Journal of Personality and Social Psychology, 39 (5), 767–772.
Hamlin, J. K., Ullman, T., Tenenbaum, J., Goodman, N., & Baker, C. (2013). Thementalistic basis of core social cognition: experiments in preverbal infants and acomputational model. Developmental Science, 16 (2), 209–226. doi: 10.1111/desc.12017
Hart, H. L. A. (2008). Punishment and responsibility. Oxford: Oxford University Press.Hart, H. L. A., & Honoré, T. (1959/1985). Causation in the law. New York: Oxford
University Press.Heider, F. (1944). Social perception and phenomenal causality. Psychological Review,
51 (6), 358–374.Heider, F. (1958). The psychology of interpersonal relations. John Wiley & Sons Inc.Hilton, D. J., & Slugoski, B. R. (1986). Knowledge-based causal attribution: The abnormal
conditions focus model. Psychological Review, 93 (1), 75–88.Hilton, J. L., Fein, S., & Miller, D. T. (1993, oct). Suspicion and dispositional inference.
Personality and Social Psychology Bulletin, 19 (5), 501–512. Retrieved from http://
dx.doi.org/10.1177/0146167293195003 doi: 10.1177/0146167293195003Hitchcock, C., & Knobe, J. (2009). Cause and norm. Journal of Philosophy, 11 , 587–612.Jara-Ettinger, J., Baker, C. L., & Tenenbaum, J. B. (2012). Learning what is where from
social observations. In N. Miyake, D. Peebles, & R. P. Cooper (Eds.), Proceedings ofthe 34th Annual Conference of the Cognitive Science Society. Austin, TX: CognitiveScience Society.
Jara-Ettinger, J., Gweon, H., Tenenbaum, J. B., & Schulz, L. E. (2015, jul). Children’sunderstanding of the costs and rewards underlying rational action. Cognition, 140 , 14–23. Retrieved from http://dx.doi.org/10.1016/j.cognition.2015.03.006 doi:10.1016/j.cognition.2015.03.006
Jara-Ettinger, J., Tenenbaum, J. B., & Schulz, L. E. (2015). Not so innocent: Tod-dlers’ iinferences about costs and culpability. Psychological Science, 26 (5), 633–

EXPECTATIONS & RESPONSIBILITY 51
640. Retrieved from http://dx.doi.org/10.1177/0956797615572806 doi: 10.1177/0956797615572806
Jensen, S. (2013). A statistician reads the sports pages: Salaries and wins in baseball.CHANCE , 26 (1), 47–52.
Johnson, S. G., & Rips, L. J. (2015, mar). Do the right thing: The assumption of op-timality in lay decision theory and causal judgment. Cognitive Psychology, 77 , 42–76. Retrieved from http://dx.doi.org/10.1016/j.cogpsych.2015.01.003 doi:10.1016/j.cogpsych.2015.01.003
Johnson, S. G. B., & Rips, L. J. (2013). Good decisions, good causes: Optimality as aconstraint on attribution of causal responsibility. In M. Knau�, M. Pauen, N. Sebanz,& I. Wachsmuth (Eds.), Proceedings of the 35th Annual Conference of the CognitiveScience Society (pp. 2662–2667). Austin, TX: Cognitive Science Society.
Jones, E. E., & Davis, K. E. (1965). From acts to dispositions the attribution process inperson perception. In L. Berkowitz (Ed.), Advances in experimental social psychology(Vol. 2, pp. 219–266). New York: Academic Press.
Jones, E. E., Davis, K. E., & Gergen, K. J. (1961). Role playing variations and their infor-mational value for person perception. The Journal of Abnormal and Social Psychology,63 (2), 302–310.
Kahneman, D., & Miller, D. T. (1986). Norm theory: Comparing reality to its alternatives.Psychological Review, 93 (2), 136–153.
Kahneman, D., & Tversky, A. (1982). The simulation heuristic. In D. Kahneman &A. Tversky (Eds.), Judgment under uncertainty: Heuristics and biases (pp. 201–208).New York: Cambridge University Press.
Kelley, H. H. (1973). The processes of causal attribution. American Psychologist, 28 (2),107–128.
Kerr, N. L. (1996). “Does my contribution really matter?”: E�cacy in social dilemmas.European Review of Social Psychology, 7 (1), 209–240.
Kilner, J. M., Friston, K. J., & Frith, C. D. (2007). Predictive coding: an account of themirror neuron system. Cognitive processing, 8 (3), 159–166.
Kleiman-Weiner, M., Gerstenberg, T., Levine, S., & Tenenbaum, J. B. (2015). Inference ofintention and permissibility in moral decision making. In D. C. Noelle et al. (Eds.),Proceedings of the 37th Annual Conference of the Cognitive Science Society (pp. 1123–1128). Austin, TX: Cognitive Science Society.
Kominsky, J. F., Phillips, J., Gerstenberg, T., Lagnado, D. A., & Knobe, J. (2015). Causalsuperseding. Cognition, 137 , 196–209.
Koster-Hale, J., & Saxe, R. (2013, sep). Theory of mind: A neural prediction problem. Neu-ron, 79 (5), 836–848. Retrieved from http://dx.doi.org/10.1016/j.neuron.2013
.08.020 doi: 10.1016/j.neuron.2013.08.020Lagnado, D. A., & Channon, S. (2008). Judgments of cause and blame: The e�ects of
intentionality and foreseeability. Cognition, 108 (3), 754–770.Lagnado, D. A., & Gerstenberg, T. (2015). A di�erence-making framework for intuitive
judgments of responsibility. In D. Shoemaker (Ed.), Oxford studies in agency andresponsibility (Vol. 3, pp. 213–241). Oxford University Press.
Lagnado, D. A., & Gerstenberg, T. (submitted). Causation in legal and moral reasoning.Lagnado, D. A., Gerstenberg, T., & Zultan, R. (2013). Causal responsibility and counter-
EXPECTATIONS & RESPONSIBILITY 52
factuals. Cognitive Science, 47 , 1036–1073.Lagnado, D. A., Waldmann, M. R., Hagmayer, Y., & Sloman, S. A. (2007). Beyond
covariation. In A. Gopnik & L. Schulz (Eds.), Causal learning: Psychology, philosophy,and computation (pp. 154–172). Oxford University Press.
Lapsley, D. K., & Lasky, B. (2001, oct). Prototypic moral character. Identity, 1 (4),345–363. Retrieved from http://dx.doi.org/10.1207/s1532706xid0104_03 doi:10.1207/s1532706xid0104_03
Leonhardt, J. M., Keller, L. R., & Pechmann, C. (2011, oct). Avoiding the risk of re-sponsibility by seeking uncertainty: Responsibility aversion and preference for in-direct agency when choosing for others. Journal of Consumer Psychology, 21 (4),405–413. Retrieved from http://dx.doi.org/10.1016/j.jcps.2011.01.001 doi:10.1016/j.jcps.2011.01.001
Lewis, D. (1973). Causation. The Journal of Philosophy, 70 (17), 556–567.Lipe, M. G. (1991). Counterfactual reasoning as a framework for attribution theories.
Psychological Bulletin, 109 (3), 456–471.Livengood, J. (2011). Actual causation and simple voting scenarios. Noûs, 1–33.Lloyd-Bostock, S. (1979, mar). The ordinary man, and the psychology of attributing
causes and responsibility. The Modern Law Review, 42 (2), 143–168. Retrieved fromhttp://dx.doi.org/10.1111/j.1468-2230.1979.tb01522.x doi: 10.1111/j.1468-2230.1979.tb01522.x
Luce, R. (1959). Individual choice behavior: A theoretical analysis. John Wiley.Mackie, J. L. (1955). Responsibility and language. Australasian Journal of Philosophy,
33 (3), 143–159.Malle, B. F. (1999). How people explain behavior: A new theoretical framework. Personality
and Social Psychology Review, 3 (1), 23–48.Malle, B. F. (2004). How the mind explains behavior: Folk explanations, meaning, and
social interaction. Cambridge, MA: MIT Press.Malle, B. F. (2011). Attribution theories: How people make sense of behavior. In Theories
in social psychology (pp. 72–95). Wiley-Blackwell Malden, MA.Malle, B. F., Guglielmo, S., & Monroe, A. E. (2014, Apr). A theory of blame. Psy-
chological Inquiry, 25 (2), 147-186. Retrieved from http://dx.doi.org/10.1080/
1047840x.2014.877340 doi: 10.1080/1047840x.2014.877340Malle, B. F., & Knobe, J. (1997). The folk concept of intentionality. Journal of Experimental
Social Psychology, 33 , 101–121.Markman, K. D., & Tetlock, P. E. (2000, sep). ‘i couldn’t have known’: Accountabil-
ity, foreseeability and counterfactual denials of responsibility. British Journal ofSocial Psychology, 39 (3), 313–325. Retrieved from http://dx.doi.org/10.1348/
014466600164499 doi: 10.1348/014466600164499Mason, W., & Suri, S. (2012). Conducting behavioral research on Amazon’s Mechanical
Turk. Behavior Research Methods, 44 (1), 1–23.McKenzie, C. R., & Mikkelsen, L. A. (2007). A Bayesian view of covariation assessment.
Cognitive Psychology, 54 (1), 33–61.Morris, M. W., & Larrick, R. P. (1995). When one cause casts doubt on another: A
normative analysis of discounting in causal attribution. Psychological Review, 102 (2),331–355.
EXPECTATIONS & RESPONSIBILITY 53
Morse, S. J. (2003). Diminished rationality, diminished responsibility. Ohio State Journalof Criminal Law, 1 , 289–308.
Nagel, J., & Waldmann, M. R. (2013). Deconfounding distance e�ects in judgments of moralobligation. Journal of Experimental Psychology: Learning, Memory, and Cognition.
Nelson, J. D. (2005). Finding useful questions: On bayesian diagnosticity, probability,impact, and information gain. Psychological Review, 112 (4), 979–999. Retrieved fromhttp://dx.doi.org/10.1037/0033-295x.112.4.979 doi: 10.1037/0033-295x.112.4.979
Nordbye, G. H. H., & Teigen, K. H. (2014). Being responsible versus acting responsibly:E�ects of agency and risk taking on responsibility judgments. Scandinavian journalof psychology, 55 (2), 102–114.
Pantelis, P. C., Baker, C. L., Cholewiak, S. A., Sanik, K., Weinstein, A., Wu, C.-C., . . .Feldman, J. (2014, mar). Inferring the intentional states of autonomous virtualagents. Cognition, 130 (3), 360–379. Retrieved from http://dx.doi.org/10.1016/
j.cognition.2013.11.011 doi: 10.1016/j.cognition.2013.11.011Paolacci, G., Chandler, J., & Ipeirotis, P. G. (2010). Running experiments on amazon
mechanical turk. Judgment and Decision making, 5 (5), 411–419.Pearl, J. (2000). Causality: Models, reasoning and inference. Cambridge, England: Cam-
bridge University Press.Petrocelli, J. V., Percy, E. J., Sherman, S. J., & Tormala, Z. L. (2011). Counterfactual
potency. Journal of Personality and Social Psychology, 100 (1), 30–46.Pizarro, D. A., & Tannenbaum, D. (2011). Bringing character back: How the motiva-
tion to evaluate character influences judgments of moral blame. In M. Mikulincer &P. R. Shaver (Eds.), The social psychology of morality: Exploring the causes of goodand evil (pp. 91–108). Washington, DC: APA Press.
Pizarro, D. A., Uhlmann, E., & Bloom, P. (2003). Causal deviance and the attribution ofmoral responsibility. Journal of Experimental Social Psychology, 39 (6), 653–660.
Pizarro, D. A., Uhlmann, E., & Salovey, P. (2003). Asymmetry in judgments of moralblame and praise: the role of perceived metadesires. Psychological Science, 14 (3),267–72. Retrieved from http://www.ncbi.nlm.nih.gov/pubmed/12741752
Rachlinski, J. (2002–2003). Misunderstanding ability, misallocating responsibility. BrooklynLaw Review, 68 , 1055–1091.
Rai, T. S., & Fiske, A. P. (2011). Moral psychology is relationship regulation: Moral motivesfor unity, hierarchy, equality, and proportionality. Psychological Review, 118 (1), 57–75. Retrieved from http://dx.doi.org/10.1037/a0021867 doi: 10.1037/a0021867
Rapoport, A. (1987). Research paradigms and expected utility models for the provision ofstep-level public goods. Psychological Review, 94 (1), 74–83.
Reeder, G. D., & Spores, J. M. (1983). The attribution of morality. Journal of Personalityand Social Psychology, 44 (4), 736–745.
Reeder, G. D., Vonk, R., Ronk, M. J., Ham, J., & Lawrence, M. (2004). Dispositionalattribution: multiple inferences about motive-related traits. Journal of Personalityand Social Psychology, 86 (4), 530–544.
Robbennolt, J. K. (2000). Outcome severity and judgments of “responsibility”: A meta-analytic review. Journal of Applied Social Psychology, 30 (12), 2575–2609.
Rutledge, R. B., Skandali, N., Dayan, P., & Dolan, R. J. (2014, aug). A computational
EXPECTATIONS & RESPONSIBILITY 54
and neural model of momentary subjective well-being. Proceedings of the NationalAcademy of Sciences, 111 (33), 12252–12257. Retrieved from http://dx.doi.org/
10.1073/pnas.1407535111 doi: 10.1073/pnas.1407535111Scanlon, T. M. (2009). Moral dimensions. Harvard University Press.Scha�er, J. (2005). Contrastive causation. The Philosophical Review, 114 (3), 327–358.Scha�er, J. (2010). Contrastive causation in the law. Legal Theory, 16 (04), 259–297.Schlenker, B. R., Britt, T. W., Pennington, J., Murphy, R., & Doherty, K. (1994). The
triangle model of responsibility. Psychological Review, 101 (4), 632–652.Schroeder, D. A., & Linder, D. E. (1976). E�ects of actor’s causal role, outcome sever-
ity, and knowledge of prior accidents upon attributions of responsibility. Journal ofExperimental Social Psychology, 12 (4), 340–356.
Scott, R. M., & Baillargeon, R. (2013). Do infants really expect agents to act e�ciently? acritical test of the rationality principle. Psychological Science, in press.
Shaver, K. G. (1985). The attribution of blame: Causality, responsibility, and blameworthi-ness. Springer-Verlag, New York.
Shaver, K. G., & Drown, D. (1986, April). On causality, responsibility, and self-blame: atheoretical note. Journal of Personality and Social Psychology, 50 (4), 697–702.
Shultz, T. R., & Wright, K. (1985). Concepts of negligence and intention in the assignmentof moral responsibility. Canadian Journal of Behavioural Science, 17 (2), 97–108.
Sinnott-Armstrong, W., & Levy, K. (2011). Insanity defenses. In J. D. . D. Dolinko (Ed.),Oxford handbook on the philosophy of the criminal law. Oxford University Press.
Sloman, S. A. (2005). Causal models: How people think about the world and its alternatives.Oxford University Press, USA.
Sloman, S. A., Fernbach, P. M., & Ewing, S. (2009). Causal models: The representationalinfrastructure for moral judgment. In D. M. Bartels, C. Bauman, L. J. Skitka, &D. L. Medin (Eds.), Moral judgment and decision making. the psychology of learningand motivation: Advances in research and theory (pp. 1–26). Elsevier.
Sloman, S. A., & Lagnado, D. (2015). Causality in thought. Annual Review of Psychol-ogy, 66 (1), 223–247. Retrieved from http://dx.doi.org/10.1146/annurev-psych
-010814-015135 doi: 10.1146/annurev-psych-010814-015135Slovic, P., & Lichtenstein, S. (1971). Comparison of bayesian and regression approaches to
the study of information processing in judgment. Organizational behavior and humanperformance, 6 (6), 649–744.
Spellman, B. A. (1997). Crediting causality. Journal of Experimental Psychology: General,126 (4), 323–348.
Stapleton, J. (2008). Choosing what we mean by ‘causation’ in the law. Missouri LawReview, 73 (2), 433–480.
Sutton, R., & Barto, A. (1998). Reinforcement learning: An introduction. CambridgeUniversity Press.
Sytsma, J., Livengood, J., & Rose, D. (2012). Two types of typicality: Rethinking therole of statistical typicality in ordinary causal attributions. Studies in History andPhilosophy of Biological and Biomedical Sciences, 43 (4), 814–820.
Trope, Y. (1974). Inferential processes in the forced compliance situation: A bayesiananalysis. Journal of Experimental Social Psychology, 10 (1), 1–16.
Trope, Y., & Burnstein, E. (1975). Processing the information contained in another’s
EXPECTATIONS & RESPONSIBILITY 55
behavior. Journal of Experimental Social Psychology, 11 (5), 439–458.Uhlmann, E. L., Pizarro, D. A., & Diermeier, D. (2015). A person-centered approach to
moral judgment. Perspectives on Psychological Science, 10 (1), 72–81.Uhlmann, E. L., & Zhu, L. L. (2013, jul). Acts, persons, and intuitions: Person-
centered cues and gut reactions to harmless transgressions. Social Psychological andPersonality Science, 5 (3), 279–285. Retrieved from http://dx.doi.org/10.1177/
1948550613497238 doi: 10.1177/1948550613497238Uhlmann, E. L., Zhu, L. L., & Tannenbaum, D. (2013, feb). When it takes a bad person to
do the right thing. Cognition, 126 (2), 326–334. Retrieved from http://dx.doi.org/
10.1016/j.cognition.2012.10.005 doi: 10.1016/j.cognition.2012.10.005Ullman, T. D., Tenenbaum, J. B., Baker, C. L., Macindoe, O., Evans, O. R., & Goodman,
N. D. (2009). Help or hinder: Bayesian models of social goal inference. In Advancesin Neural Information Processing Systems (Vol. 22).
van Inwagen, P. (1978). Ability and responsibility. The Philosophical Review, 87 (2), 201–224. Retrieved from http://dx.doi.org/10.2307/2184752 doi: 10.2307/2184752
Vincent, N. A. (2011). A structured taxonomy of responsibility concepts. In N. a Vincent,I. van de Poel, & J. van den Hoven (Eds.), Moral responsibility: Beyond free will anddeterminism. Dordrecht: Springer.
Waldmann, M. R., Nagel, J., & Wiegmann, A. (2012). Moral judgment. In The oxfordhandbook of thinking and reasoning (pp. 364–389). New York: Oxford UniversityPress.
Walker, D. E., Smith, K. A., & Vul, E. (2015). The “fundamental attribution error” isrational in an uncertain world. In Proceedings of the 37th Annual Conference of theCognitive Science Society (pp. 2547–2552). Austin, TX: Cognitive Science.
Walker, L. J., & Hennig, K. H. (2004). Di�ering conceptions of moral exemplarity: Just,brave, and caring. Journal of Personality and Social Psychology, 86 (4), 629–647.Retrieved from http://dx.doi.org/10.1037/0022-3514.86.4.629 doi: 10.1037/0022-3514.86.4.629
Weiner, B. (1985). An attributional theory of achievement motivation and emotion. Psy-chological Review, 92 (4), 548.
Weiner, B. (1991). Metaphors in motivation and attribution. American Psychologist, 46 (9),921–930.
Weiner, B. (1995). Judgments of responsibility: A foundation for a theory of social conduct.New York: The Guilford Press.
Weiner, B., Heckhausen, H., Meyer, W. U., & Cook, R. E. (1972). Causal ascriptionsand achievement behavior: A conceptual analysis of e�ort and reanalysis of locus ofcontrol. Journal of Personality and Social Psychology, 21 (2), 239–148.
Wellman, H. M. (2010, jul). Developing a theory of mind. In The wiley-blackwell handbookof childhood cognitive development (pp. 258–284). Wiley-Blackwell. Retrieved fromhttp://dx.doi.org/10.1002/9781444325485.ch10 doi: 10.1002/9781444325485.ch10
Wellman, H. M., & Bartsch, K. (1988). Young children’s reasoning about beliefs. Cognition,30 (3), 239–277.
Wellman, H. M., & Gelman, S. A. (1992). Cognitive development: Foundational theoriesof core domains. Annual Review of Psychology, 43 (1), 337–375.
EXPECTATIONS & RESPONSIBILITY 56
Wells, G. L., & Gavanski, I. (1989). Mental simulation of causality. Journal of Personalityand Social Psychology, 56 (2), 161–169.
White, P. A. (2013, aug). Singular clues to causality and their use in human causaljudgment. Cognitive Science, 38 (1), 38–75. Retrieved from http://dx.doi.org/
10.1111/cogs.12075 doi: 10.1111/cogs.12075Wol�, P. (2007). Representing causation. Journal of Experimental Psychology: General,
136 (1), 82–111.Woodward, J. (2003). Making things happen: A theory of causal explanation. Oxford,
England: Oxford University Press.Yablo, S. (2002). De facto dependence. The Journal of Philosophy, 99 (3), 130–148.Young, L., & Phillips, J. (2011, may). The paradox of moral focus. Cognition, 119 (2),
166–178. Retrieved from http://dx.doi.org/10.1016/j.cognition.2011.01.004
doi: 10.1016/j.cognition.2011.01.004Zultan, R., Gerstenberg, T., & Lagnado, D. A. (2012). Finding fault: Counterfactuals and
causality in group attributions. Cognition, 125 (3), 429–440.
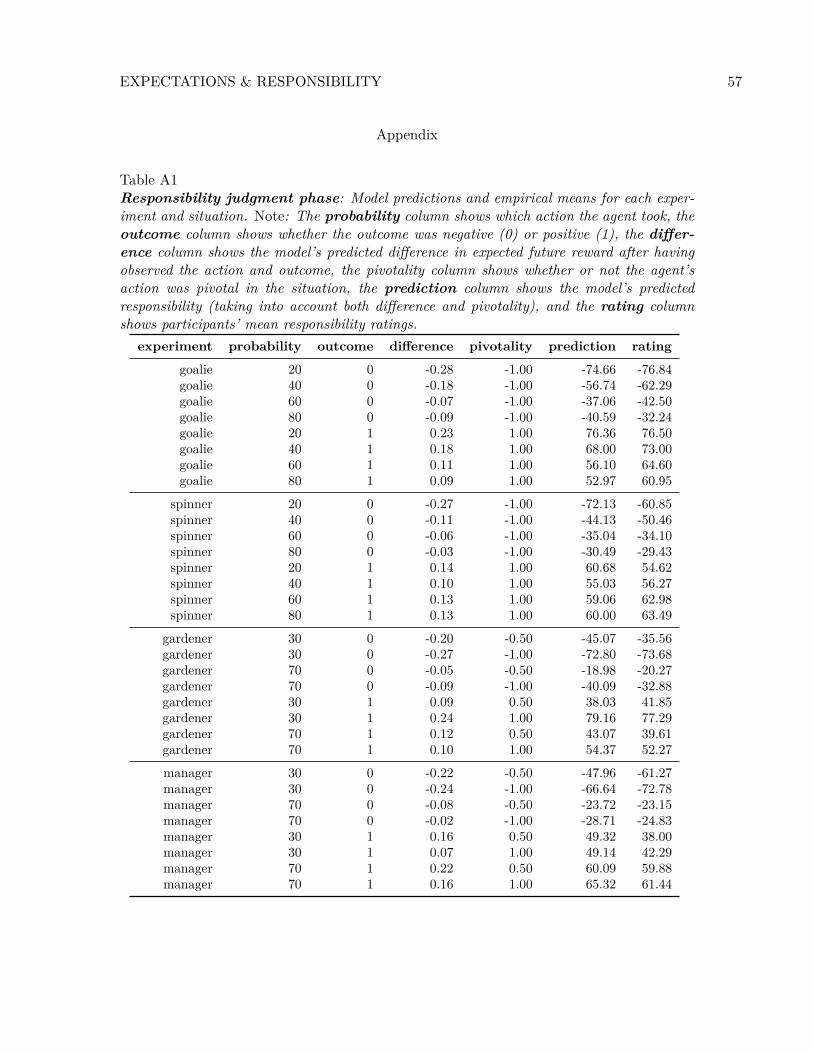
EXPECTATIONS & RESPONSIBILITY 57
Appendix
Table A1Responsibility judgment phase: Model predictions and empirical means for each exper-iment and situation. Note: The probability column shows which action the agent took, theoutcome column shows whether the outcome was negative (0) or positive (1), the di�er-
ence column shows the model’s predicted di�erence in expected future reward after havingobserved the action and outcome, the pivotality column shows whether or not the agent’saction was pivotal in the situation, the prediction column shows the model’s predictedresponsibility (taking into account both di�erence and pivotality), and the rating columnshows participants’ mean responsibility ratings.
experiment probability outcome di�erence pivotality prediction rating
goalie 20 0 -0.28 -1.00 -74.66 -76.84goalie 40 0 -0.18 -1.00 -56.74 -62.29goalie 60 0 -0.07 -1.00 -37.06 -42.50goalie 80 0 -0.09 -1.00 -40.59 -32.24goalie 20 1 0.23 1.00 76.36 76.50goalie 40 1 0.18 1.00 68.00 73.00goalie 60 1 0.11 1.00 56.10 64.60goalie 80 1 0.09 1.00 52.97 60.95
spinner 20 0 -0.27 -1.00 -72.13 -60.85spinner 40 0 -0.11 -1.00 -44.13 -50.46spinner 60 0 -0.06 -1.00 -35.04 -34.10spinner 80 0 -0.03 -1.00 -30.49 -29.43spinner 20 1 0.14 1.00 60.68 54.62spinner 40 1 0.10 1.00 55.03 56.27spinner 60 1 0.13 1.00 59.06 62.98spinner 80 1 0.13 1.00 60.00 63.49
gardener 30 0 -0.20 -0.50 -45.07 -35.56gardener 30 0 -0.27 -1.00 -72.80 -73.68gardener 70 0 -0.05 -0.50 -18.98 -20.27gardener 70 0 -0.09 -1.00 -40.09 -32.88gardener 30 1 0.09 0.50 38.03 41.85gardener 30 1 0.24 1.00 79.16 77.29gardener 70 1 0.12 0.50 43.07 39.61gardener 70 1 0.10 1.00 54.37 52.27manager 30 0 -0.22 -0.50 -47.96 -61.27manager 30 0 -0.24 -1.00 -66.64 -72.78manager 70 0 -0.08 -0.50 -23.72 -23.15manager 70 0 -0.02 -1.00 -28.71 -24.83manager 30 1 0.16 0.50 49.32 38.00manager 30 1 0.07 1.00 49.14 42.29manager 70 1 0.22 0.50 60.09 59.88manager 70 1 0.16 1.00 65.32 61.44
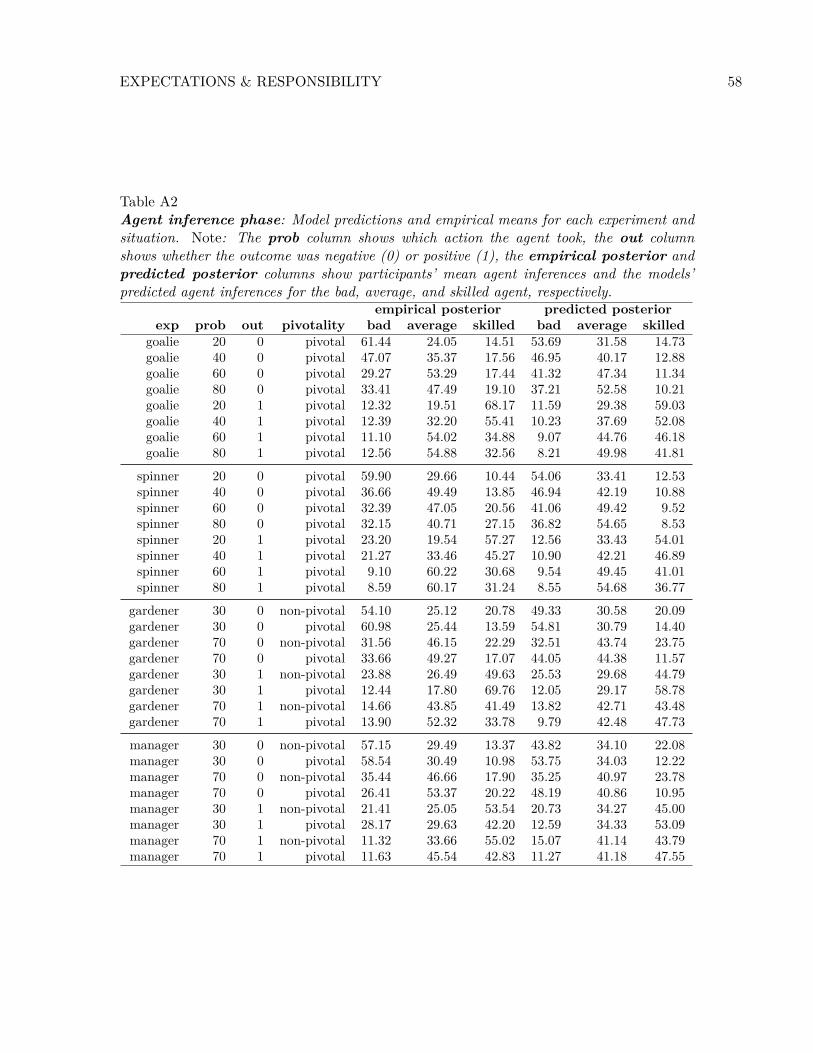
EXPECTATIONS & RESPONSIBILITY 58
Table A2Agent inference phase: Model predictions and empirical means for each experiment andsituation. Note: The prob column shows which action the agent took, the out columnshows whether the outcome was negative (0) or positive (1), the empirical posterior andpredicted posterior columns show participants’ mean agent inferences and the models’predicted agent inferences for the bad, average, and skilled agent, respectively.
empirical posterior predicted posterior
exp prob out pivotality bad average skilled bad average skilled
goalie 20 0 pivotal 61.44 24.05 14.51 53.69 31.58 14.73goalie 40 0 pivotal 47.07 35.37 17.56 46.95 40.17 12.88goalie 60 0 pivotal 29.27 53.29 17.44 41.32 47.34 11.34goalie 80 0 pivotal 33.41 47.49 19.10 37.21 52.58 10.21goalie 20 1 pivotal 12.32 19.51 68.17 11.59 29.38 59.03goalie 40 1 pivotal 12.39 32.20 55.41 10.23 37.69 52.08goalie 60 1 pivotal 11.10 54.02 34.88 9.07 44.76 46.18goalie 80 1 pivotal 12.56 54.88 32.56 8.21 49.98 41.81
spinner 20 0 pivotal 59.90 29.66 10.44 54.06 33.41 12.53spinner 40 0 pivotal 36.66 49.49 13.85 46.94 42.19 10.88spinner 60 0 pivotal 32.39 47.05 20.56 41.06 49.42 9.52spinner 80 0 pivotal 32.15 40.71 27.15 36.82 54.65 8.53spinner 20 1 pivotal 23.20 19.54 57.27 12.56 33.43 54.01spinner 40 1 pivotal 21.27 33.46 45.27 10.90 42.21 46.89spinner 60 1 pivotal 9.10 60.22 30.68 9.54 49.45 41.01spinner 80 1 pivotal 8.59 60.17 31.24 8.55 54.68 36.77
gardener 30 0 non-pivotal 54.10 25.12 20.78 49.33 30.58 20.09gardener 30 0 pivotal 60.98 25.44 13.59 54.81 30.79 14.40gardener 70 0 non-pivotal 31.56 46.15 22.29 32.51 43.74 23.75gardener 70 0 pivotal 33.66 49.27 17.07 44.05 44.38 11.57gardener 30 1 non-pivotal 23.88 26.49 49.63 25.53 29.68 44.79gardener 30 1 pivotal 12.44 17.80 69.76 12.05 29.17 58.78gardener 70 1 non-pivotal 14.66 43.85 41.49 13.82 42.71 43.48gardener 70 1 pivotal 13.90 52.32 33.78 9.79 42.48 47.73manager 30 0 non-pivotal 57.15 29.49 13.37 43.82 34.10 22.08manager 30 0 pivotal 58.54 30.49 10.98 53.75 34.03 12.22manager 70 0 non-pivotal 35.44 46.66 17.90 35.25 40.97 23.78manager 70 0 pivotal 26.41 53.37 20.22 48.19 40.86 10.95manager 30 1 non-pivotal 21.41 25.05 53.54 20.73 34.27 45.00manager 30 1 pivotal 28.17 29.63 42.20 12.59 34.33 53.09manager 70 1 non-pivotal 11.32 33.66 55.02 15.07 41.14 43.79manager 70 1 pivotal 11.63 45.54 42.83 11.27 41.18 47.55