Embed Size (px)
Citation preview
Structural Design of an Office Building with Large Spans in
a Seismic Zone
Projecto de um Edifício de Escritórios com Grandes vãos em Zona
Sísmica
Luís Filipe Dias de Almeida
Extended Abstract
Outubro de 2014

1
Structural Design of an Office Building
with Large Spans in a Seismic Zone
Luís Filipe Dias de Almeida
IST, Technical University of Lisbon,
Portugal
Keywords: Structural Design; Large Spans;
Pre-design; Prestressed Slabs; Seismic
Analysis; Eurocodes
1. Introduction
This thesis main goal is to examine the effect
of adopting a superior modeling in an office
building structural design, and verify its
economic efficiency facing inferior structural
modeling. To do so it is presented a quality
structural design, applying the knowledge
acquired throughout the MSc in Civil
Engineering.
The design started with the analysis of the
architectural design, in which the structural
design was based. Then, after the definition of
all the materials, it was possible to pre-design,
with basic calculations, all the structural
elements to ensure that a good solution was
achieved, without major changes in the
design.
The entire analysis of the structure was
performed taking into account the current
Eurocodes to ensure the demands of
functionality and durability (Serviceability
Limit States - SLS) and the stability and safety
of the structure (Ultimate Limit States - ULS).
2. Actions, Materials and Constraints
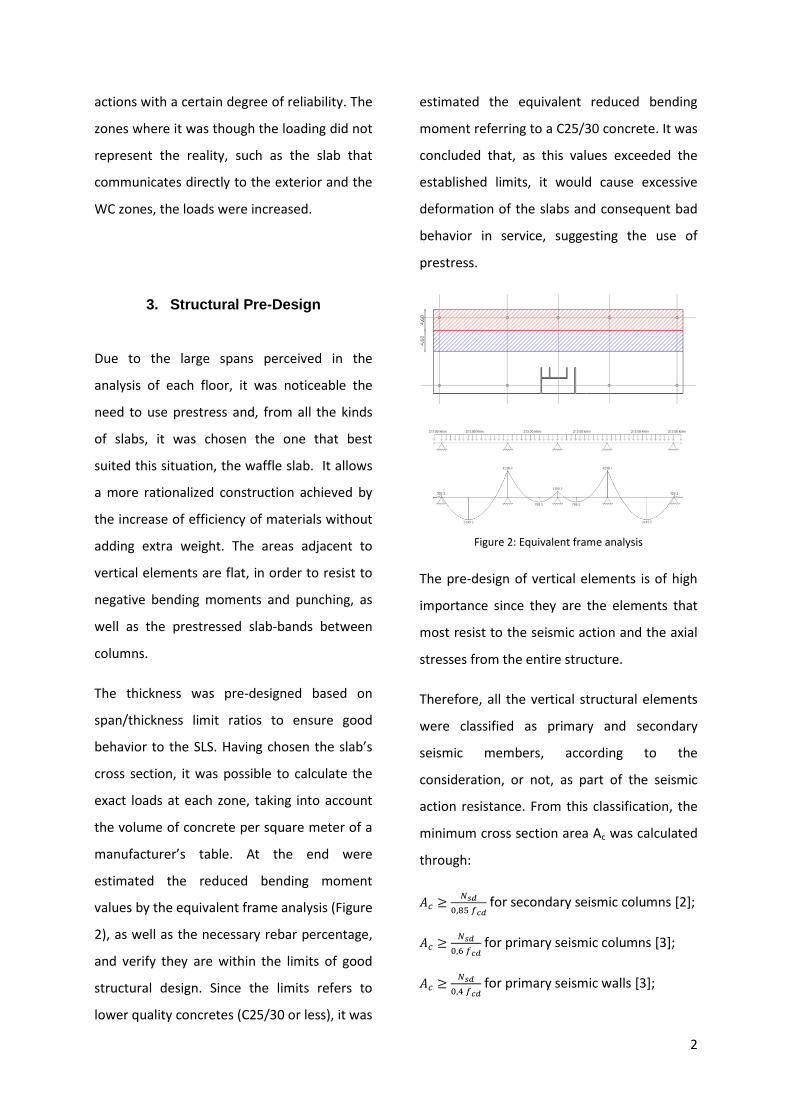
The architectural design, with the type office
and parking floors plans, presented the
precise location of the columns, spanned to a
maximum of 15 meters, ensuring the necessity
to use prestress despite of its use.
Figure 1: Architectural type floors design
The structural materials were chosen taking
into account the strong seismic action, the
massive axial loads on vertical elements and
the necessity to prestress the slabs.
Concrete C35/45
C25/30
Reinforcement steel bars A500NR
Prestress Strands Y1860 S7
Table 1: Structural Materials
All the actions were quantified according to
the guidelines from the Eurocodes [1] and the
Portuguese Legislation, as well as the
combinations of actions that were relevant to
ensure that the structure can bear out all the
2
actions with a certain degree of reliability. The
zones where it was though the loading did not
represent the reality, such as the slab that
communicates directly to the exterior and the
WC zones, the loads were increased.
3. Structural Pre-Design
Due to the large spans perceived in the
analysis of each floor, it was noticeable the
need to use prestress and, from all the kinds
of slabs, it was chosen the one that best
suited this situation, the waffle slab. It allows
a more rationalized construction achieved by
the increase of efficiency of materials without
adding extra weight. The areas adjacent to
vertical elements are flat, in order to resist to
negative bending moments and punching, as
well as the prestressed slab-bands between
columns.
The thickness was pre-designed based on
span/thickness limit ratios to ensure good
behavior to the SLS. Having chosen the slab’s
cross section, it was possible to calculate the
exact loads at each zone, taking into account
the volume of concrete per square meter of a
manufacturer’s table. At the end were
estimated the reduced bending moment
values by the equivalent frame analysis (Figure
2), as well as the necessary rebar percentage,
and verify they are within the limits of good
structural design. Since the limits refers to
lower quality concretes (C25/30 or less), it was
estimated the equivalent reduced bending
moment referring to a C25/30 concrete. It was
concluded that, as this values exceeded the
established limits, it would cause excessive
deformation of the slabs and consequent bad
behavior in service, suggesting the use of
prestress.
Figure 2: Equivalent frame analysis
The pre-design of vertical elements is of high
importance since they are the elements that
most resist to the seismic action and the axial
stresses from the entire structure.
Therefore, all the vertical structural elements
were classified as primary and secondary
seismic members, according to the
consideration, or not, as part of the seismic
action resistance. From this classification, the
minimum cross section area Ac was calculated
through:
for secondary seismic columns [2];
for primary seismic columns [3];
for primary seismic walls [3];
3
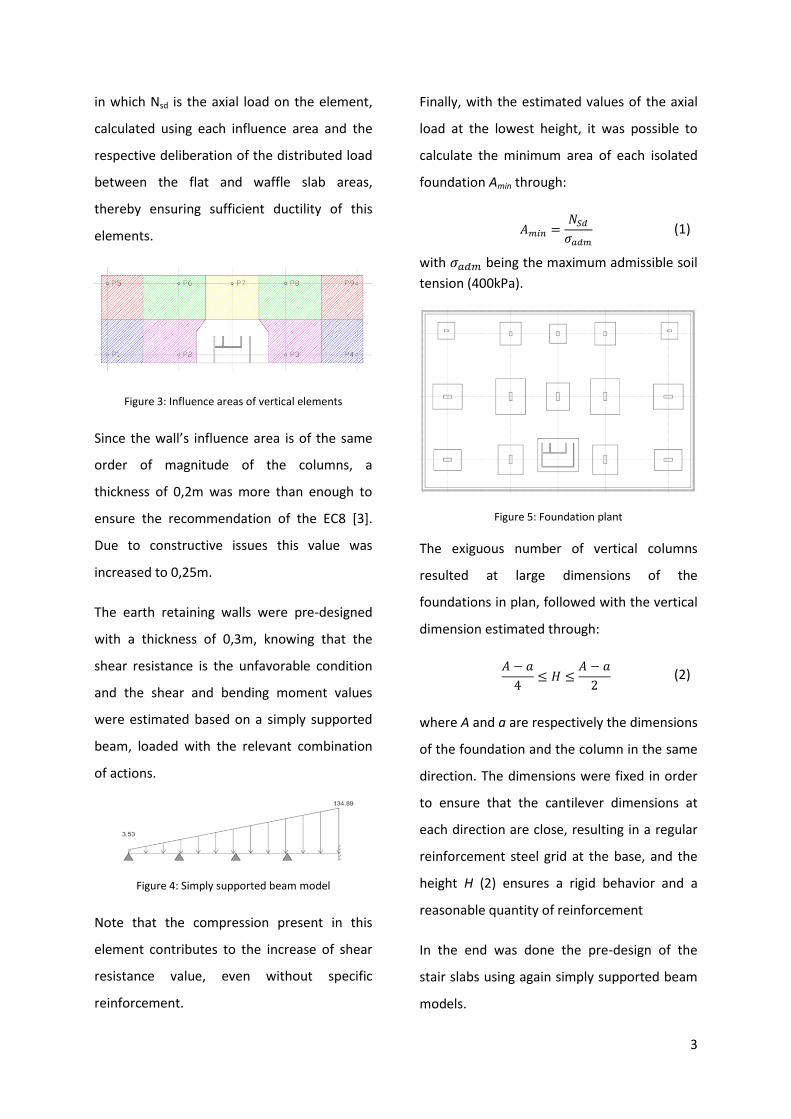
in which Nsd is the axial load on the element,
calculated using each influence area and the
respective deliberation of the distributed load
between the flat and waffle slab areas,
thereby ensuring sufficient ductility of this
elements.
Figure 3: Influence areas of vertical elements
Since the wall’s influence area is of the same
order of magnitude of the columns, a
thickness of 0,2m was more than enough to
ensure the recommendation of the EC8 [3].
Due to constructive issues this value was
increased to 0,25m.
The earth retaining walls were pre-designed
with a thickness of 0,3m, knowing that the
shear resistance is the unfavorable condition
and the shear and bending moment values
were estimated based on a simply supported
beam, loaded with the relevant combination
of actions.
Figure 4: Simply supported beam model
Note that the compression present in this
element contributes to the increase of shear
resistance value, even without specific
reinforcement.
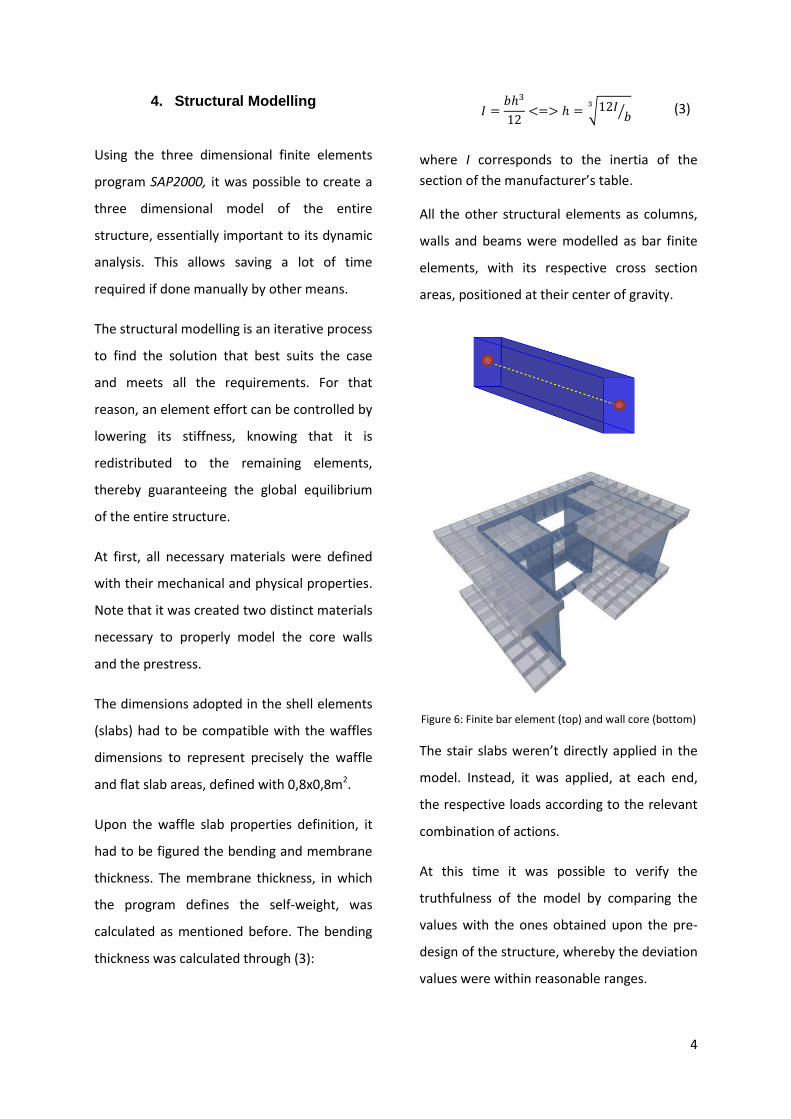
Finally, with the estimated values of the axial
load at the lowest height, it was possible to
calculate the minimum area of each isolated
foundation Amin through:
(1)
with being the maximum admissible soil
tension (400kPa).
Figure 5: Foundation plant
The exiguous number of vertical columns
resulted at large dimensions of the
foundations in plan, followed with the vertical
dimension estimated through:
(2)
where A and a are respectively the dimensions
of the foundation and the column in the same
direction. The dimensions were fixed in order
to ensure that the cantilever dimensions at
each direction are close, resulting in a regular
reinforcement steel grid at the base, and the
height H (2) ensures a rigid behavior and a
reasonable quantity of reinforcement
In the end was done the pre-design of the
stair slabs using again simply supported beam
models.
4
4. Structural Modelling
Using the three dimensional finite elements
program SAP2000, it was possible to create a
three dimensional model of the entire
structure, essentially important to its dynamic
analysis. This allows saving a lot of time
required if done manually by other means.
The structural modelling is an iterative process
to find the solution that best suits the case
and meets all the requirements. For that
reason, an element effort can be controlled by
lowering its stiffness, knowing that it is
redistributed to the remaining elements,
thereby guaranteeing the global equilibrium
of the entire structure.
At first, all necessary materials were defined
with their mechanical and physical properties.
Note that it was created two distinct materials
necessary to properly model the core walls
and the prestress.
The dimensions adopted in the shell elements
(slabs) had to be compatible with the waffles
dimensions to represent precisely the waffle
and flat slab areas, defined with 0,8x0,8m2.
Upon the waffle slab properties definition, it
had to be figured the bending and membrane
thickness. The membrane thickness, in which
the program defines the self-weight, was
calculated as mentioned before. The bending
thickness was calculated through (3):
√
⁄
(3)
where I corresponds to the inertia of the
section of the manufacturer’s table.
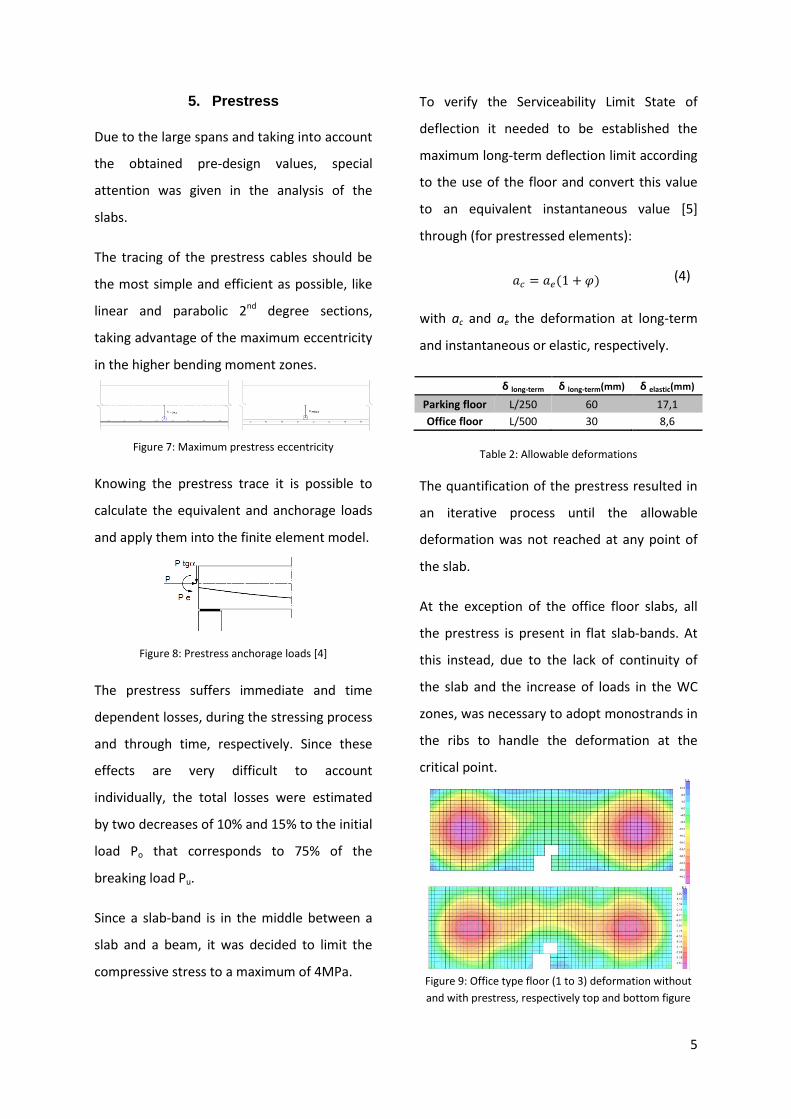
All the other structural elements as columns,
walls and beams were modelled as bar finite
elements, with its respective cross section
areas, positioned at their center of gravity.
Figure 6: Finite bar element (top) and wall core (bottom)
The stair slabs weren’t directly applied in the
model. Instead, it was applied, at each end,
the respective loads according to the relevant
combination of actions.
At this time it was possible to verify the
truthfulness of the model by comparing the
values with the ones obtained upon the pre-
design of the structure, whereby the deviation
values were within reasonable ranges.
5
5. Prestress
Due to the large spans and taking into account
the obtained pre-design values, special
attention was given in the analysis of the
slabs.
The tracing of the prestress cables should be
the most simple and efficient as possible, like
linear and parabolic 2nd degree sections,
taking advantage of the maximum eccentricity
in the higher bending moment zones.
Figure 7: Maximum prestress eccentricity
Knowing the prestress trace it is possible to
calculate the equivalent and anchorage loads
and apply them into the finite element model.
Figure 8: Prestress anchorage loads [4]
The prestress suffers immediate and time
dependent losses, during the stressing process
and through time, respectively. Since these
effects are very difficult to account
individually, the total losses were estimated
by two decreases of 10% and 15% to the initial
load Po that corresponds to 75% of the
breaking load Pu.
Since a slab-band is in the middle between a
slab and a beam, it was decided to limit the
compressive stress to a maximum of 4MPa.
To verify the Serviceability Limit State of
deflection it needed to be established the
maximum long-term deflection limit according
to the use of the floor and convert this value
to an equivalent instantaneous value [5]
through (for prestressed elements):
(4)
with ac and ae the deformation at long-term
and instantaneous or elastic, respectively.
δ long-term δ long-term(mm) δ elastic(mm)
Parking floor L/250 60 17,1
Office floor L/500 30 8,6
Table 2: Allowable deformations
The quantification of the prestress resulted in
an iterative process until the allowable
deformation was not reached at any point of
the slab.
At the exception of the office floor slabs, all
the prestress is present in flat slab-bands. At
this instead, due to the lack of continuity of
the slab and the increase of loads in the WC
zones, was necessary to adopt monostrands in
the ribs to handle the deformation at the
critical point.
Figure 9: Office type floor (1 to 3) deformation without
and with prestress, respectively top and bottom figure

6
Figure 10: Parking type floor(-3to-1)deformation without and with prestress, respectively top and bottom figure
Floor δe,max without prestress
(mm) δe,max with prestress
(mm)
-3 to -1 23,9 12,6 -0 47,0 17,0 0 41,7 8,5
1 to 3 43,3 8,6 4 43,3 8,6
Table 3: Maximum elastic deformation obtained, at each
floor, without and with prestress
At first it was calculated the required prestress
amount using 4 strand flat cables, but the
great density of cables in the slab-bands as
well as the large number of anchorages
prevented the use of them. So the final
design incorporated 7 strand cables which,
despite the decrease of eccentricity, involved
a smaller number of cables and anchorages,
decreasing the cost of this process.
In some cases the width of the slab-bands had
to be increased to verify the limit compressive
stress as well as the minimum width to keep
the necessary prestressed cables and, at the 0
floor, it had to be increased its thickness.
6. Seismic Analysis
The seismic analysis in Portugal is unavoidable
due to the great seismic action that it faces
and designing an economic and safe structure
is a civil engineer’s main goal. This analysis
was performed according to all EC8
recommendations in which no-collapse and
damage limitation requirements were
satisfied.
The seismic action was represented by an
elastic response spectrum, equal in both plan
directions, in which the vibration period
corresponds to a single degree of freedom
system.
Figure 11: Elastic response spectrum [3]
To avoid a non-linear analysis of the structure,
the energy-dissipation capacity was taken into
account by performing an elastic analysis
based in the reduced elastic response
spectrum decreased by a behavior factor q
depending on the ductility classification of the
structure, i.e., its energy-dissipation capacity.
The cracking and consequent loss of stiffness
of the primary vertical elements was also
7
taking into account by the decrease of its
bending and shear stiffness to a half of its
original.
In order to estimate a reasonable behavior
factor value and perform the analysis of the
structure it had to be characterized the
structural regularity in elevation and in plan.
Due to the existence of one only rigid wall
core near the center of the structure, it
suspected the structure to be torsionally
flexible, which was confirmed upon the
necessary calculations. Knowing that this
classification matched a low behavior factor
value, it was sought an alternate solution to
avoid this classification, creating a model
without stiff vertical elements (structural wall)
to resemble to the original model in terms of
cost/security. Note that to satisfy the damage
limitation requirements in the model, it had to
be increased iteratively the cross section of
the primary vertical elements.
Model "with shear walls"
Model "without shear walls"
q0 kw q u/ q0 kw q
2,0 1,0 2,0 1,3 3,9 1,0 3,9
Table 4: Behavior factor for both structural models
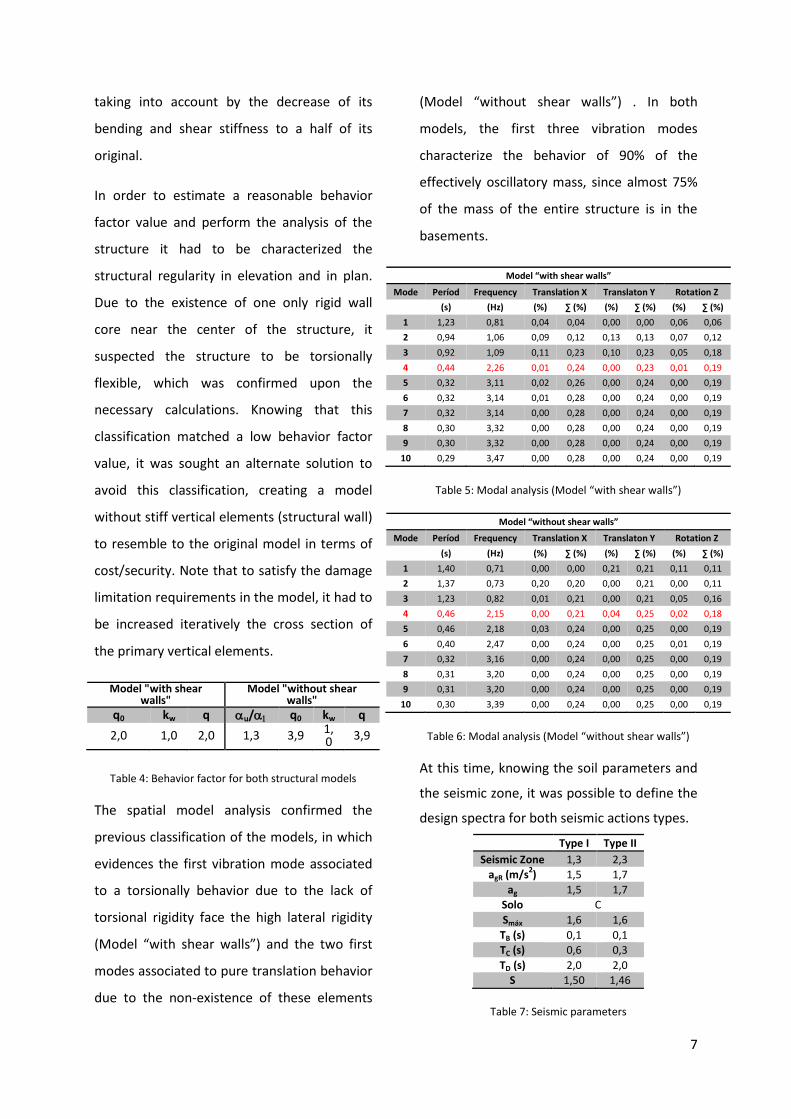
The spatial model analysis confirmed the
previous classification of the models, in which
evidences the first vibration mode associated
to a torsionally behavior due to the lack of
torsional rigidity face the high lateral rigidity
(Model “with shear walls”) and the two first
modes associated to pure translation behavior
due to the non-existence of these elements
(Model “without shear walls”) . In both
models, the first three vibration modes
characterize the behavior of 90% of the
effectively oscillatory mass, since almost 75%
of the mass of the entire structure is in the
basements.
Model “with shear walls”
Mode Períod Frequency Translation X Translaton Y Rotation Z
(s) (Hz) (%) ∑ (%) (%) ∑ (%) (%) ∑ (%)
1 1,23 0,81 0,04 0,04 0,00 0,00 0,06 0,06
2 0,94 1,06 0,09 0,12 0,13 0,13 0,07 0,12
3 0,92 1,09 0,11 0,23 0,10 0,23 0,05 0,18
4 0,44 2,26 0,01 0,24 0,00 0,23 0,01 0,19
5 0,32 3,11 0,02 0,26 0,00 0,24 0,00 0,19
6 0,32 3,14 0,01 0,28 0,00 0,24 0,00 0,19
7 0,32 3,14 0,00 0,28 0,00 0,24 0,00 0,19
8 0,30 3,32 0,00 0,28 0,00 0,24 0,00 0,19
9 0,30 3,32 0,00 0,28 0,00 0,24 0,00 0,19
10 0,29 3,47 0,00 0,28 0,00 0,24 0,00 0,19
Table 5: Modal analysis (Model “with shear walls”)
Model “without shear walls”
Mode Períod Frequency Translation X Translaton Y Rotation Z
(s) (Hz) (%) ∑ (%) (%) ∑ (%) (%) ∑ (%)
1 1,40 0,71 0,00 0,00 0,21 0,21 0,11 0,11
2 1,37 0,73 0,20 0,20 0,00 0,21 0,00 0,11
3 1,23 0,82 0,01 0,21 0,00 0,21 0,05 0,16
4 0,46 2,15 0,00 0,21 0,04 0,25 0,02 0,18
5 0,46 2,18 0,03 0,24 0,00 0,25 0,00 0,19
6 0,40 2,47 0,00 0,24 0,00 0,25 0,01 0,19
7 0,32 3,16 0,00 0,24 0,00 0,25 0,00 0,19
8 0,31 3,20 0,00 0,24 0,00 0,25 0,00 0,19
9 0,31 3,20 0,00 0,24 0,00 0,25 0,00 0,19
10 0,30 3,39 0,00 0,24 0,00 0,25 0,00 0,19
Table 6: Modal analysis (Model “without shear walls”)
At this time, knowing the soil parameters and
the seismic zone, it was possible to define the
design spectra for both seismic actions types.
Type I Type II
Seismic Zone 1,3 2,3
agR (m/s2) 1,5 1,7
ag 1,5 1,7
Solo C
Smáx 1,6 1,6
TB (s) 0,1 0,1
TC (s) 0,6 0,3
TD (s) 2,0 2,0
S 1,50 1,46
Table 7: Seismic parameters
8
0
4,4
8,8
13,2
17,6
22
0 0,05 0,1 0,15 0,2
H (m)
ds (m)
Total Drift
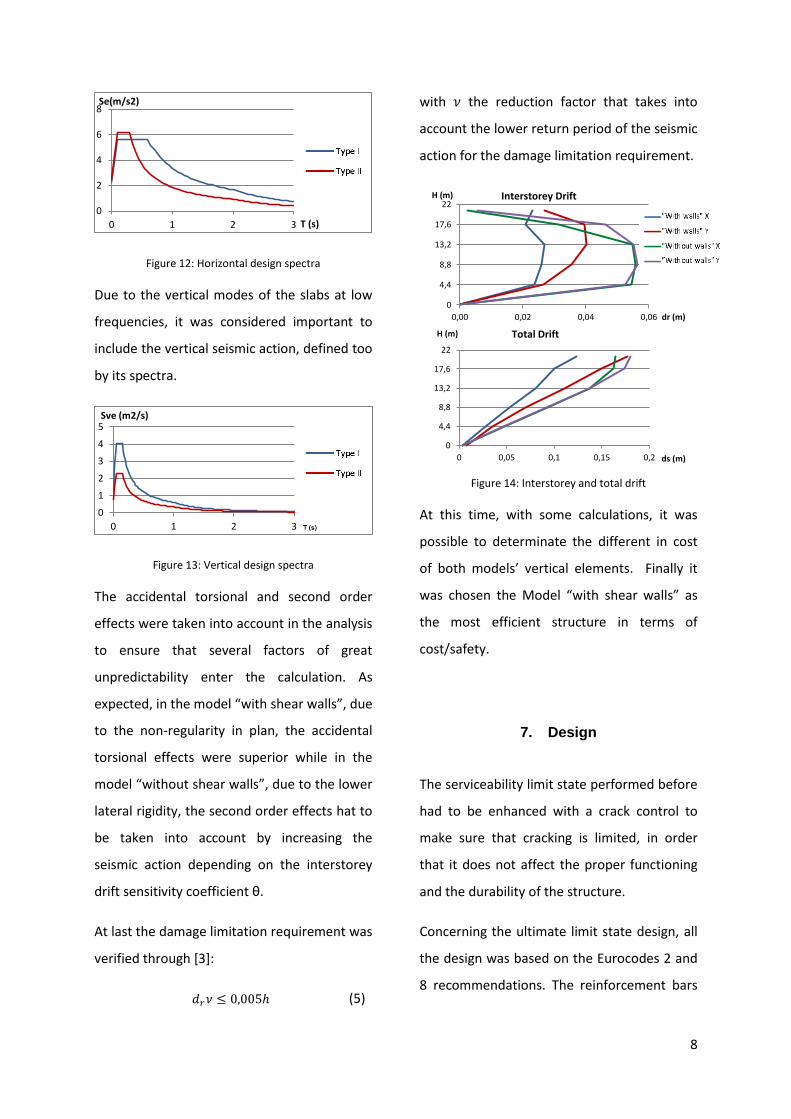
Figure 12: Horizontal design spectra
Due to the vertical modes of the slabs at low
frequencies, it was considered important to
include the vertical seismic action, defined too
by its spectra.
Figure 13: Vertical design spectra
The accidental torsional and second order
effects were taken into account in the analysis
to ensure that several factors of great
unpredictability enter the calculation. As
expected, in the model “with shear walls”, due
to the non-regularity in plan, the accidental
torsional effects were superior while in the
model “without shear walls”, due to the lower
lateral rigidity, the second order effects hat to
be taken into account by increasing the
seismic action depending on the interstorey
drift sensitivity coefficient θ.
At last the damage limitation requirement was
verified through [3]:
(5)
with the reduction factor that takes into
account the lower return period of the seismic
action for the damage limitation requirement.
Figure 14: Interstorey and total drift
At this time, with some calculations, it was
possible to determinate the different in cost
of both models’ vertical elements. Finally it
was chosen the Model “with shear walls” as
the most efficient structure in terms of
cost/safety.
7. Design
The serviceability limit state performed before
had to be enhanced with a crack control to
make sure that cracking is limited, in order
that it does not affect the proper functioning
and the durability of the structure.
Concerning the ultimate limit state design, all
the design was based on the Eurocodes 2 and
8 recommendations. The reinforcement bars
0
2
4
6
8
0 1 2 3
Se(m/s2)
T (s)
0
1
2
3
4
5
0 1 2 3
Sve (m2/s)
0
4,4
8,8
13,2
17,6
22
0,00 0,02 0,04 0,06
H (m)
dr (m)
Interstorey Drift
9
detailing ensured sufficient resistance and
ductility to all structural elements.
The beams were calculated by the capacity
design ensuring shear overstrenght to ensure
ductile instead of brittle rupture.
The slabs design was based on the nodal
stresses from SAP2000 which were
homogenized to avoid spike stresses. Since all
the slabs were prestressed the effective
reinforcement tension was calculated
removing the compression portion and, if the
case, exploited the variation of tension in the
prestress cables (just for adherent cables). To
avoid punching and progressive collapse of
the structure, shear and post-punching
reinforcement were conceived.
Figure 15: Punching failure mechanism and post-
punching reinforcement [6]
The primary columns were also calculated by
the capacity design and it was ensured the
necessary confinement according to EC8 and
the secondary columns according to EC2.
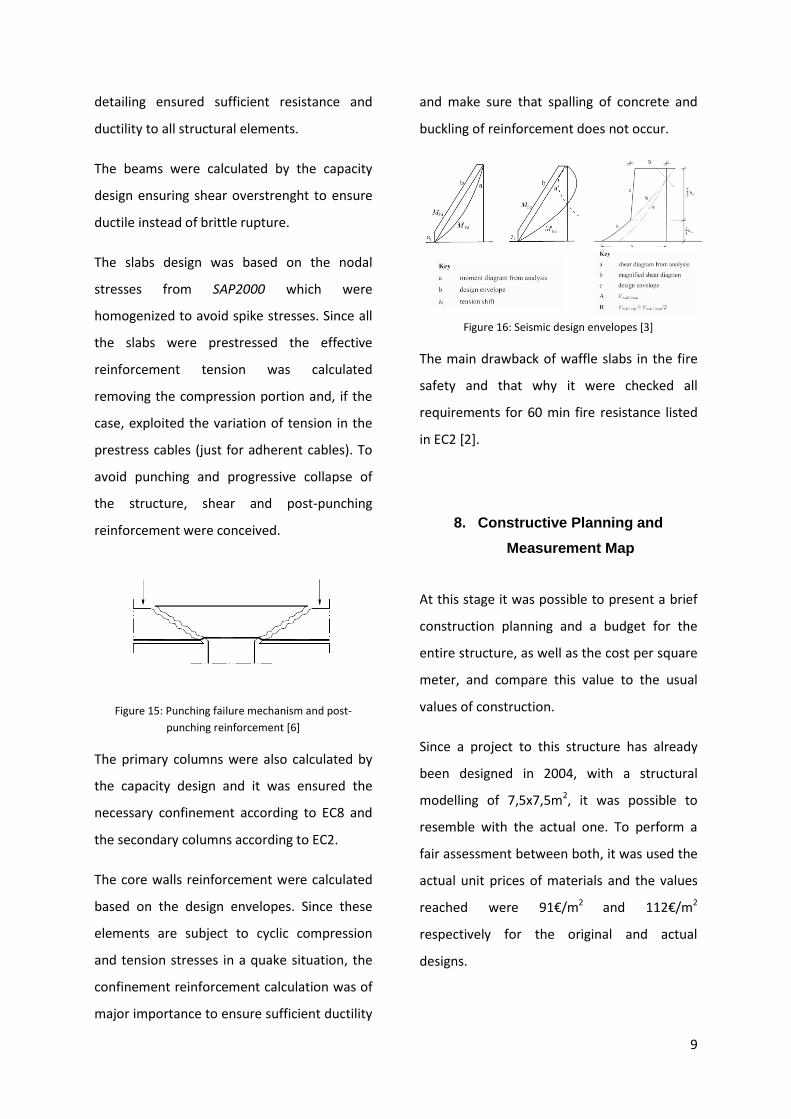
The core walls reinforcement were calculated
based on the design envelopes. Since these
elements are subject to cyclic compression
and tension stresses in a quake situation, the
confinement reinforcement calculation was of
major importance to ensure sufficient ductility
and make sure that spalling of concrete and
buckling of reinforcement does not occur.
Figure 16: Seismic design envelopes [3]
The main drawback of waffle slabs in the fire
safety and that why it were checked all
requirements for 60 min fire resistance listed
in EC2 [2].
8. Constructive Planning and
Measurement Map
At this stage it was possible to present a brief
construction planning and a budget for the
entire structure, as well as the cost per square
meter, and compare this value to the usual
values of construction.
Since a project to this structure has already
been designed in 2004, with a structural
modelling of 7,5x7,5m2, it was possible to
resemble with the actual one. To perform a
fair assessment between both, it was used the
actual unit prices of materials and the values
reached were 91€/m2 and 112€/m2
respectively for the original and actual
designs.

10
0
500000
1000000
1500000
2000000
Modelling 15x15m2 Modelling 7,5x7,5m2
€ Material costs
Total
Concrete
Steel
Prestress
Shuttering
Earthmoving
Figure 17: Material cost for both modellings
This corresponds to an overall cost difference
of approximately 20% and, though reinforcing
the idea that the increase of structural
modelling involves the increase of its cost, it is
a very encouraging result since it was possible
to obtain a good solution that verifies all the
requirements, even with a large structural
modification.
9. Conclusions
This thesis main goal was achieved and it is
presented a structural design for a challenging
structure. Several alternate solutions were
studied with different materials and structural
solutions, and it was chosen the one the best
suited the situation besides the cost which, in
these days, is an important factor. It must be
taken into account that in a “real case project”
the architectural solution would probably be
modified in order to obtain a less expensive
structure, as it can be compared with the
solution with smaller spans.
Nowadays we have in our reach powerful
tools to analyze even the most complex
structures, but it’s of good practice to
corroborate with some simple pre-design
calculations. This allows reaching a good
solution without major structural changes.
These three dimensional finite element
programs proved to be of great help in the
dynamic analysis of the structure and allowed
to save great amounts of time.
A civil engineers’ goal is not to present the
solution, but a good solution that verifies all
the requirements of stability, durability e
functionality during its lifetime at the lowest
cost.
10. References
[1] CEN. N 1991. Eurocode 1 – Actions on
structures, 2008.
[2] CEN. EN 1992. Eurocode 2 – Design of
concrete structures, 2008.
[3] CEN. EN 1998. Eurocode 8 – Design of
structures for earthquake resistance, 2008.
[4] Marchão, Carla e Appleton, Júlio.
Estruturas de Betão II – Folhas de Apoio às
Aulas. Módulo 1 - Pré-Esforço. IST, 2011.
[5] Appleton, Júlio. Estruturas de Betão I -
Folhas de Apoio às Aulas. Módulo 3 –
Verificação do Comportamento em Serviço
(Estados Limites de Utilização - SLS), 2010.
[6] Marchão, Carla e Appleton, Júlio.
Estruturas de Betão II - Folhas de Apoio às
Aulas. Módulo 2 - Lajes de Betão Armado.
Lisboa : Instituto Superior Técnico, 2011.