Embed Size (px)
Citation preview
United States Department of Agriculture
Forest Service
Pacific Northwest Research Station
Research Paper PNW-RP-437 November 1991
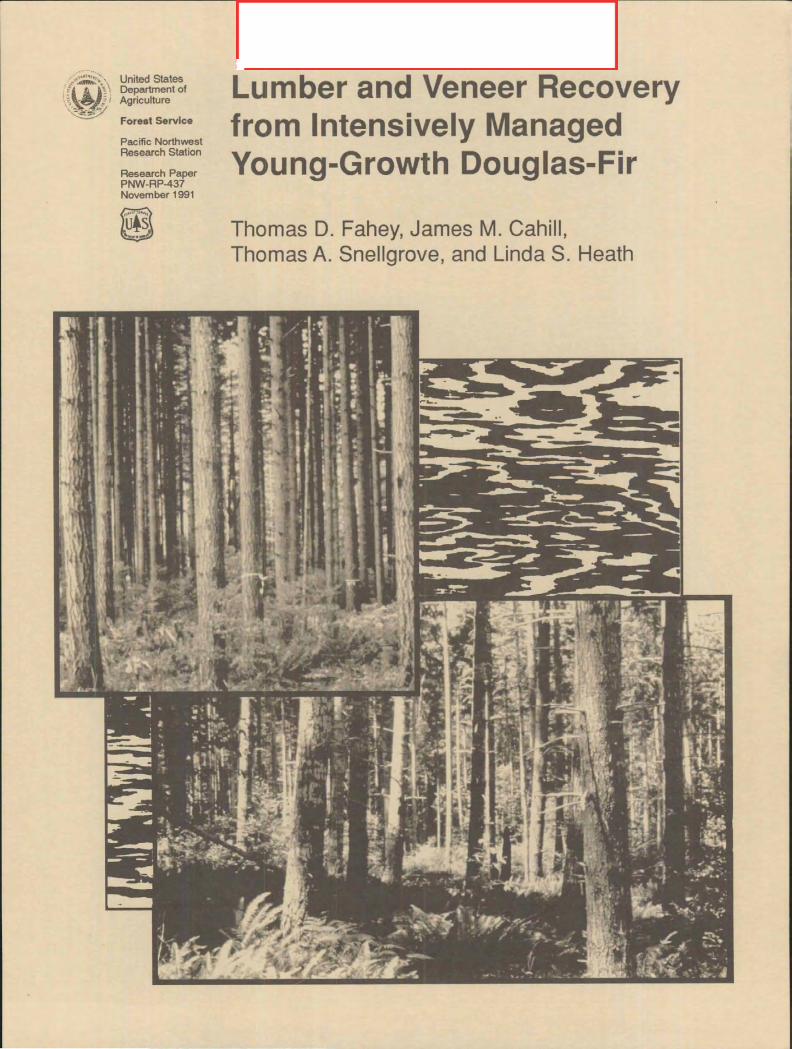
Lumber and Veneer Recovery from Intensively Managed Young-c irowth Douglas-Fir
Thomas D. Fahey, James M. Cahill, Thomas A. Snellgrove, and Linda S. Heath

Authors THOMAS D. FAHEY and JAMES M. CAHILL are research foresters, Forestry Sciences Laboratory, P.O. Box 3890, Portland, Oregon 97208-3890; THOMAS A. SNELLGROVE is a biological scientist, Resources Program and Assessment Staff, P.O. Box 96090, Wash- ington, DC 20090-6090; and LINDA S. HEATH is a forester, Monongahela National Forest, USDA Bldg., 200 Sycamore St., Elkins, West Virginia 26241.
Abstract Fahey, Thomas D.; Cahill, James M.; Snellgrove, Thomas A.; Heath, Linda S. 1991. Lumber and veneer recovery from intensively managed young-growth Douglas-fir. Res. Pap. PNW-RP-437. Portland, OR: U.S. Department of Agriculture, Forest Serv- ice, Pacific Northwest Research Station. 25 p.
The objective of the study was to develop models that predict lumber and veneer recov- ery as a function of young-growth log characteristics. Empirical lumber and veneer recovery data for logs cut from more than 300 young-growth Douglas-fir trees were used in model development. Trees were sampled from 15 stands in western Oregon and Washington and represent a wide range of growing conditions, sites, ages, and stocking history. Models were developed that predict (1) the volume recovery of primary (lumber and veneer) and secondary (chips, sawdust, and peeler cores) products, (2) lumber grade recovery based on machine stress-rated rules, (3) lumber grade recovery based on visual grading rules, and (4) veneer grade recovery. Log characteristics investigated were log diameter, the proportion of juvenile wood present in the log, log taper, and limb size. Lumber degrade caused by warping of juvenile wood was evaluated for low tem- perature, low humidity, kiln schedule.
Keywords: Douglas-fir, young-growth, juvenile wood, lumber volume recovery, lumber grade yields, wood strength, machine grading, veneer volume recovery, veneer grade yields, Washington, Oregon.
Summary Empirical recovery data were used to develop models predicting lumber and veneer volume and grade recovery for young-growth Douglas-fir logs. The effect of juvenile wood on lumber degrade due to warp also was evaluated. More than 300 trees were sampled from 15 stands in western Oregon and Washington. These stands reflected a wide range of growing conditions, sites, ages, and stocking history. Saw logs were sawn into" nominal 2- by 4-inch and 2- by 6-inch lumber; lumber was kiln dried, surfaced, and graded by using visual and machine stress rated (MSR) lumber grades. Veneer logs were peeled into nominal 1/8-inch full sheets, half sheets, and random width veneer. The proportion of log volume recovered as rough green lumber differed with log diameter and log taper. Lumber recovery increased with log diameter and decreased as taper increased: log diameter had the most impact. The proportion of log volume recovered in green veneer differed with log diameter and the average diameter of the largest limb in each log quadrant (LLAD). Recovery increased with diameter and decreased as LLAD increased. Lumber grade recovery, based on the visual grading rules, varied by LLAD; recovery in the higher grades dropped off dramatically as LLAD increased. Recovery of MSR lumber differed with LLAD and the amount of juvenile wood in the log; recovery in the higher MSR grades decreased as LLAD and the percentage of juvenile wood increased. Juvenile wood was defined as the proportion of log volume between the pith and the 20th annual ring. Veneer grade recovery dropped off as LLAD increased. Lumber degrade caused by warp during kiln drying was almost nonexistent in this sample of lumber. Only 70 boards out of over 7,000 were degraded because of warp.

Contents 1 Introduction
1 Methods
1 Sample Selection
3 Felling and Bucking
3 Log Measurements
4 Sample Distribution
4 Lumber Processing
7 Veneer Processing
8 Data Compilation
8 Analysis
10 Results and Discussion
10 Lumber, Sawdust, and Chip Volume Recovery
11 Veneer, Core, and Chip Volume Recovery
13 Visual Lumber Grade Recovery
14 MSR Lumber Grade Recovery
16 Degrade Due to Warp and Wane
17 Veneer Grade Recovery
18 Conclusions
-19 Applications
20 Acknowledgments
21 Literature Cited
23 Appendix
23 Stand Histories

Introduction Old-growth Douglas-fir (Pseudotsuga menziesii (Mirb.) Franco) has been one of the most important raw material resources in the United States during the 20th century. The species was the predominant source of structural lumber and nearly the sole source of structural plywood panels in the first half of the century. Old-growth Douglas-fir also has been an important source of appearance and finish grades of lumber and plywood. The unique attributes (appearance, strength, and machinability) of old-growth Douglas-fir wood have established and maintained the Pacific Northwest as a major factor in domestic and inter- national markets for forest products.
As we approach the 21 st century, Pacific Northwest timber resources are shifting from unmanaged old growth to intensively managed young growth. As younger stands are har- vested, the amount of juvenile wood will increase, and juvenile wood is known to be inferior to mature wood in strength and in dimensional stability.
The change to managed stands raises questions about what management regimes will be used and how these types of management will affect wood quality. Some tree and log char- acteristics considered indicative of quality are tree size, limb size and retention, taper, growth rate, and relative proportions of juvenile and mature wood. It is difficult to study the effect of management regimes on wood quality, because regimes are infinitely variable. It is possible, however, to sample the range of log characteristics that can result from man- agement regimes and to relate those characteristics to the quality of products. The objec- tive of this study was to estimate the effect of log quality characteristics on wood quality by using a sample representing the range of log quality that could be produced from managed stands in the future.
This report is the result of a study of the product potential of Douglas-fir from managed young-growth stands. The study documents yields of lumber and veneer from over 300 trees selected from 15 stands in western Oregon and Washington. One goal of the study is to provide resource managers and analysts with a preview of what future stands of inten- sively managed Douglas-fir might yield in sawn and peeled products. Models predicting lumber and veneer product recovery as a function of young-growth log characteristics are presented. The Stand Management Cooperative, a consortium of State, Provincial, Federal, private industrial, and university land management organizations located at the University of Washington, sponsored the study.
Methods Sample Selection
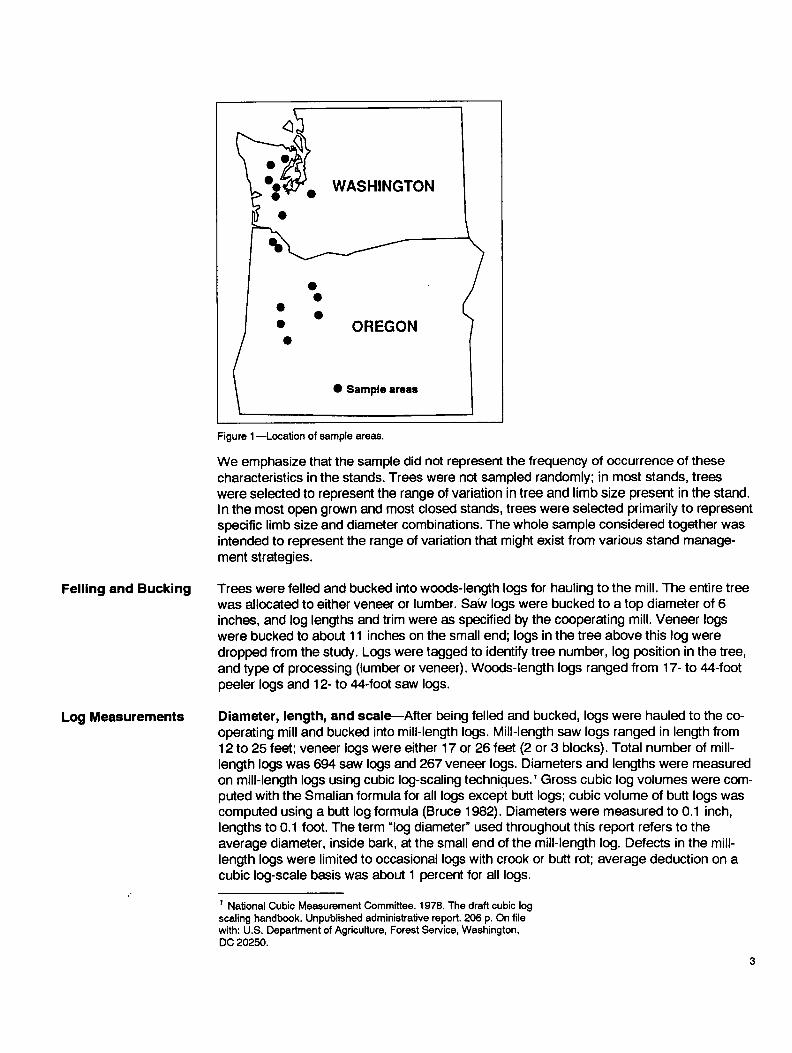
Sample trees were selected from 15 stands in western Oregon and Washington (table 1, fig. 1, appendix 1). Tree d.b.h. (diameter at breast height), limb size in the butt 16-foot log, and the anticipated percentage of juvenile wood in the tree were used as stratification variables. Over 200 stands were considered before settling on these 15; they represented a wide range of sites, stand age, and stocking histories. The basic sampling unit was mill- length logs; however, the sample was initially stratified by tree rather than log characteris- tics because individual log characteristics cannot be identified until final felling and bucking decisions have been made. Trees with this range of characteristics were deliberately selected to provide a sample of logs with a wide range of log and limb sizes and amount of juvenile wood. Trees larger than 30 inches d.b.h, were excluded from the study. Sample trees were randomly assigned to either the lumber or veneer subsamples. The debarker at the sawmill could not process logs larger than 28 inches on the large end, thus trees with logs exceeding this limit were allocated to veneer. We excluded from consideration as veneer trees those that would not produce a log containing at least two veneer bolts with a small-end diameter of 11 inches. Veneer trees were used to a 10- or 11 -inch top bolt diameter, and logs above that point were dropped from the study. The average log diam- eter was larger at the veneer mill because of these factors.
1
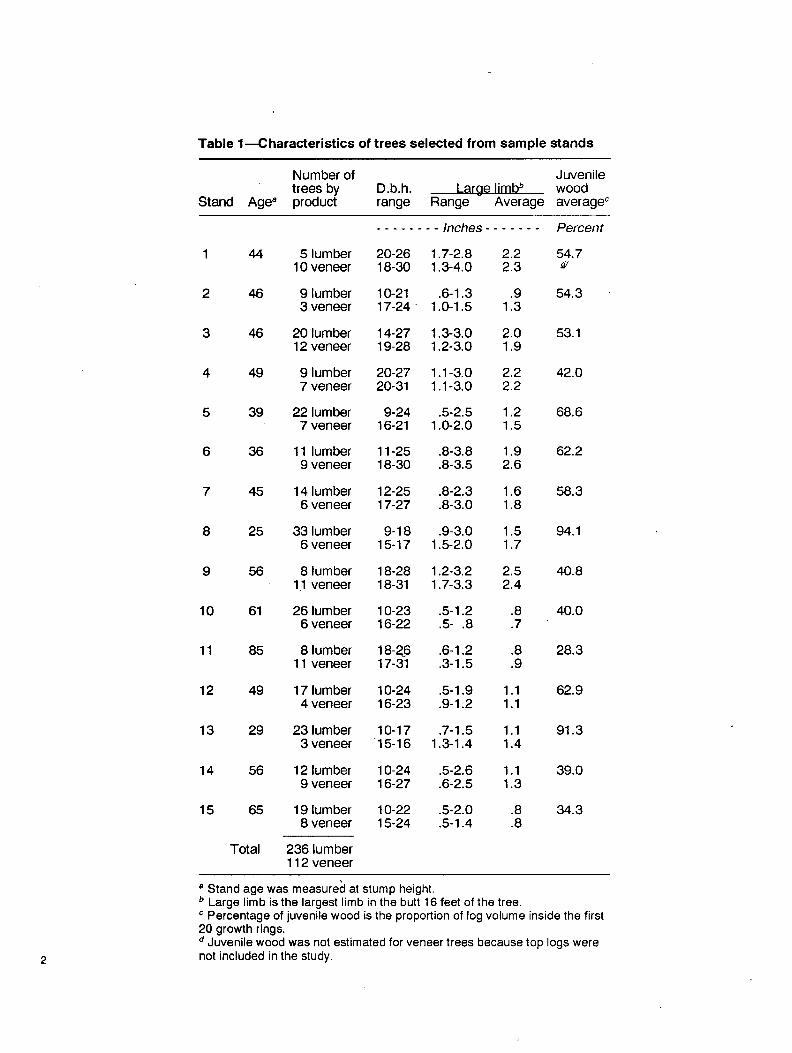
Table l~Character ist ics of trees selected from sample stands
Number of Juvenile trees by D.b.h. Large limb b wood
Stand Age a product range Range Average average c
. . . . . . . . I n c h e s . . . . . . . P e r c e n t
1 44 5 lumber 20-26 1.7-2.8 2.2 54.7 10 veneer 18-30 1.3-4.0 2.3 ~/
2 46 9 lumber 10-21 .6-1.3 .9 54.3 3 veneer 17-24 1.0-1.5 1.3
3 46 20 lumber 14-27 1.3-3.0 2.0 53.1 12 veneer 19-28 1.2-3.0 1.9
4 49 9 lumber 20-27 1.1-3.0 2.2 42.0 7 veneer 20-31 1.1-3.0 2.2
5 39 22 lumber 9-24 .5-2.5 1.2 68.6 7 veneer 16-21 1.0-2.0 1.5
6 36 11 lumber 11-25 .8-3.8 1.9 62.2 9 veneer 18-30 .8-3.5 2.6
7 45 14 lumber 12-25 .8-2.3 1.6 58.3 6 veneer 17-27 .8-3.0 1.8
8 25 33 lumber 9-18 .9-3.0 1.5 94.1 6 veneer 15-17 1.5-2.0 1.7
9 56 8 lumber 18-28 1.2-3.2 2.5 40.8 11 veneer 18-31 1.7-3.3 2.4
10 61 26 lumber 10-23 .5-1.2 .8 40.0 6 veneer 16-22 .5- .8 .7
11 85 8 lumber 18-~6 .6-1.2 .8 28.3 11 veneer 17-31 .3-1.5 .9
12 49 17 lumber 10-24 .5-1.9 1.1 62.9 4 veneer 16-23 .9-1.2 1.1
13 29 23 lumber 10-17 .7-1.5 1.1 91.3 3 veneer 15-16 1.3-1.4 1.4
14 56 12 lumber 10-24 .5-2.6 1.1 39.0 9 veneer 16-27 .6-2.5 1.3
15 65 19 lumber 10-22 .5-2.0 .8 34.3 8 veneer 15-24 .5-1.4 .8
Total 236 lumber 112 veneer
a Stand age was measured at stump height. b Large limb is the largest limb in the butt 16 feet of the tree. c Percentage of juvenile wood is the proportion of log volume inside the first 20 growth rings. d Juvenile wood was not estimated for veneer trees because top logs were not included in the study.
WASHINGTON
/ OREGON
• Sample areas
/ /
Figure 1 ~ o c a t i o n of sample areas.
We emphasize that the sample did not represent the frequency of occurrence of these characteristics in the stands. Trees were not sampled randomly; in most stands, trees were selected to represent the range of variation in tree and limb size present in the stand. In the most open grown and most closed stands, trees were selected primarily to represent specific limb size and diameter combinations. The whole sample considered together was intended to represent the range of variation that might exist from various stand manage- ment strategies.
Felling and Bucking Trees were felled and bucked into woods-length logs for hauling to the mill. The entire tree was allocated to either veneer or lumber. Saw logs were bucked to a top diameter of 6 inches, and log lengths and trim were as specified by the cooperating mill. Veneer logs were bucked to about 11 inches on the small end; logs in the tree above this log were dropped from the study. Logs were tagged to identify tree number, log position in the tree, and type of processing (lumber or veneer). Woods-length logs ranged from 17- to 44-foot peeler logs and 12- to 44-foot saw logs.
Log Measurements Diameter, length, and scale--After being felled and bucked, logs were hauled to the co- operating mill and bucked into mill-length logs. Mill-length saw logs ranged in length from 12 to 25 feet; veneer logs were either 17 or 26 feet (2 or 3 blocks). Total number of mill- length logs was 694 saw logs and 267 veneer logs. Diameters and lengths were measured on mill-length logs using cubic log-scaling techniques. I Gross cubic log volumes were com- puted with the Smalian formula for all logs except butt logs; cubic volume of butt logs was computed using a butt log formula (Bruce 1982). Diameters were measured to 0.1 inch, lengths to 0.1 foot. The term "log diameter" used throughout this report refers to the average diameter, inside bark, at the small end of the mill-length log. Defects in the mill- length logs were limited to occasional logs with crook or butt rot; average deduction on a cubic log-scale basis was about 1 percent for all logs.
1 National Cubic Measurement Committee. 1978. The draft cubic log scaling handbook. Unpublished administrative report. 206 p. On file with: U.S. Department of Agriculture, Forest Service, Washington, DC 20250.
Sample Distribution
Lumber Processing
Snowbreaks--Snowbreaks were noted at the time of scaling by the presence of crook or kink in the log at the location of the break. It was anticipated that the large sucker limb and distorted grain associated with this type of injury would adversely impact volume and grade recovery. Preliminary screening of the data supported this hypothesis; logs with snow- breaks consistently yielded poorer grades of lumber and veneer as compared to similar logs without snowbreaks. Because of a limited sample size (61 saw logs and 18 veneer logs), logs with snowbreaks were dropped from the analysis.
Limbs---The mill-length logs were divided into four log quadrants; the largest limb in each quadrant was identified and its diameter measured inside the bark to the nearest one-tenth of an inch. Two measurements taken at right angles to each other were averaged for each limb. Large limb average diameter (LLAD) for each log was obtained by averaging the largest limb in each quadrant. We use the terms "limb" and "knot" interchangeably in this report. The term "limb" generally is used when tree and log characteristics are being discussed; the term "knot" is used when products are being discussed.
Juvenile wood--Juvenile wood is that cylindrical column of xylem surrounding the pith where cells were formed by cambium that had not fully matured. Juvenile wood is thought to result from the prolonged influence on wood formation of the apical meristem near the active crown (Panshin and de Zeeuw 1980). In general, juvenile wood has different ana- tomical characteristics than mature wood; it has shorter fiber lengths and higher microfibril angles which result in lower strength properties and greater longitudinal shrinkage (Larson 1969, Megraw 1985). Rings closest to the pith typically contain high proportions of early wood, which contribute to lower specific gravity (Megraw 1985). Specific gravity is one measure often used to estimate when the transition from juvenile to mature wood occurs in Douglas-fir. Recent research (Di Lucca 1989) estimated this transition occurred at age 23. For this study, we were concerned with estimating the effect on product quality, not in determining the exact time of transition to mature wood. To provide this estimate, the 10- and 20-year annual rings from the pith were identified on both ends of each mill-length log. The diameters of these circles and log length were used to compute the cubic volume of wood within the first 10- and 20-year growth rings. The same formulas were used to calculate "juvenile wood" volumes were used to calculate log volume. Percentage of juvenile wood as used in this report, is cubic feet of juvenile wooddivided by cubic feet of log volume.
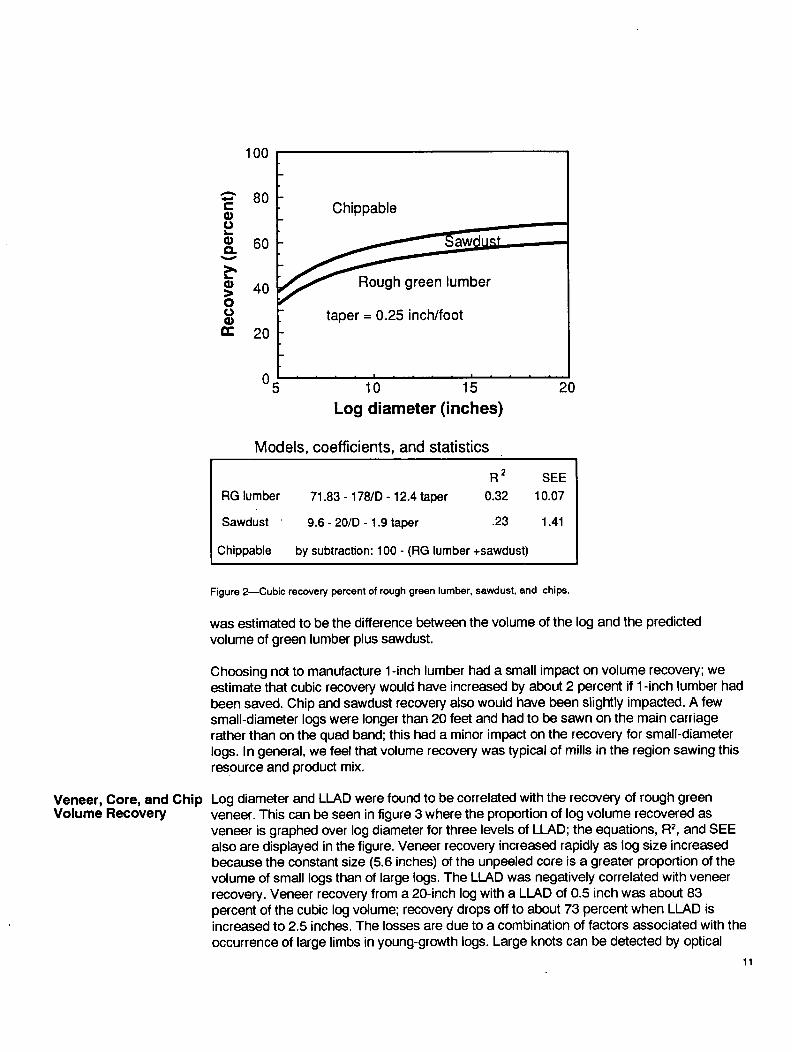
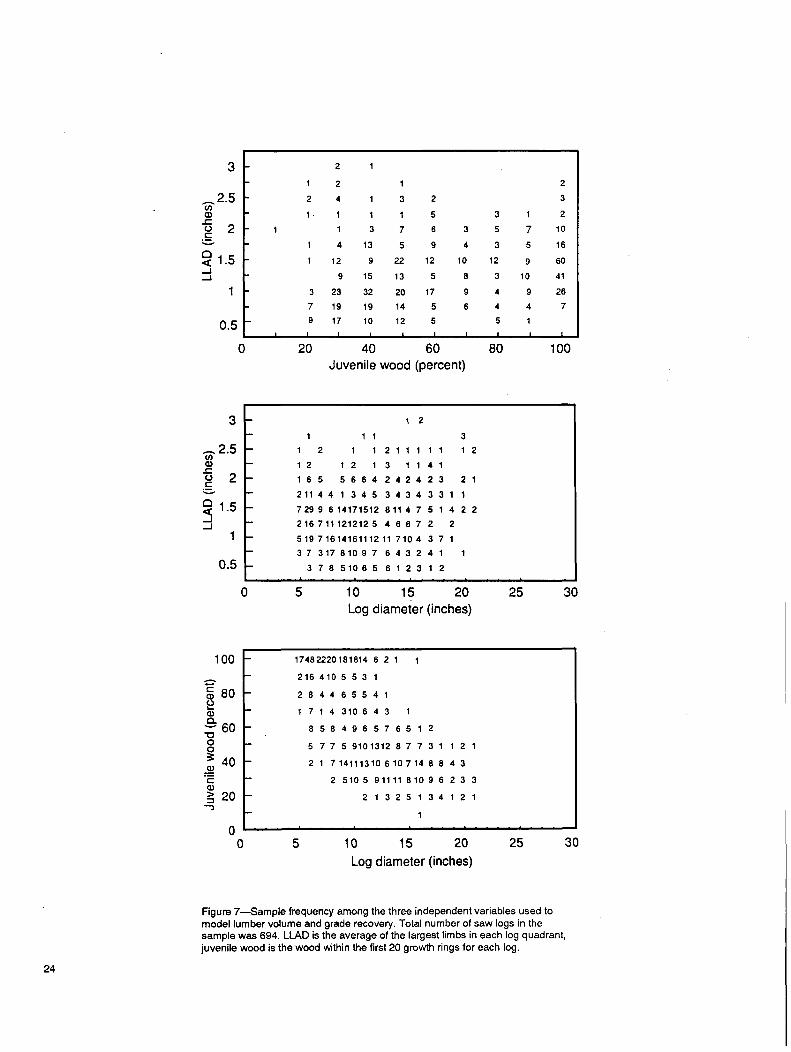
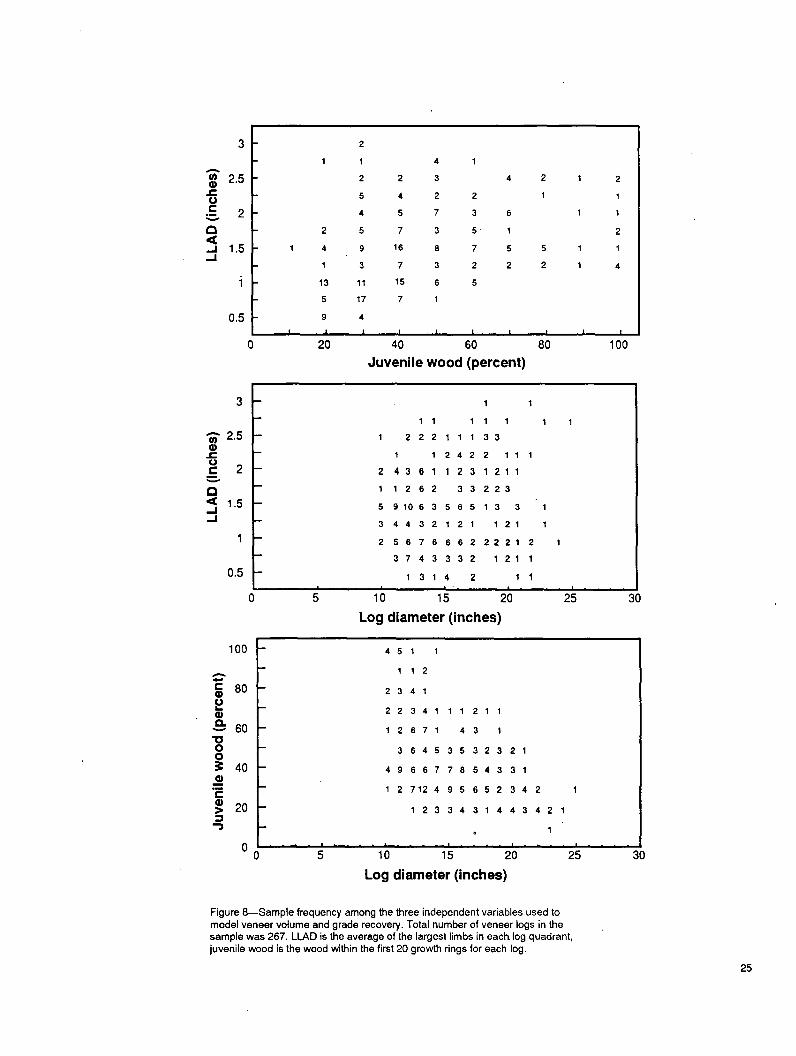
Use of the information in this report requires an understanding of the range of data in- cluded in the sample. Figures 7 and 8 (in the appendix) display the log frequency distribu- tions across the three variables used to model grade recovery for mill-length logs: log diameter, percentage of juvenile wood (20-year estimate), and LLAD: These figures also show the regions of joint observations among the variables and can be used to determine if predictions fall within the range of our population of inference.
Before processing, decisions were made about sawing patterns and products. Lumber sizes were limited to 2 by 4 and 2 by 6; no 1 -inch lumber was sawn. Widths were limited to 4 and 6 inches because we wanted the recovery to reflect the inherent quality of the wood, not the skill of the sawyer in offsetting the effect of log quality by sawing wider boards from logs with large knots. Also, lumber that would meet minimum specifications was machine stress rated (MSR); 4- and 6-inch widths represent the majority of lumber marketed in this product line.
The study mill has two log breakdown lines: a computer assisted quadsaw with an optimiz- ing edger, and a conventional carriage and bandsaw. Both lines share a double arbor edger for cant breakdown, a linebar resaw, and two trim saws. All logs were sawn on the quadsaw side of the mill except those logs longer than 20 feet, those too large to break down to a 6-inch center cant in one pass, and those that could not be run through the quadsaw because of mechanical or biological defects. Table 2 shows the number of logs, by diameter and length, sawn at each headrig (one 24-foot log broke to 18 feet in the barker and was sawn at the quadsaw). All lumber was marked so that the identity of each board could be traced to the individual log and tree. Lumber production was 42 percent 2 by 4 and 58 percent 2 by 6 by volume; lengths ranged from 12 to 24 feet. Average rough green thickness sawn during the study was 1.734 inches; average widths were 3.812 inches for 4-inch and 5.900 for 6-inch lumber.
Lumber was kiln-dried to a moisture content of 12 percent by use of a moderate dry bulb and low wet bulb temperature: the target kiln schedule is shown below:
Temperature
Time Dry bulb Wet bulb
H o u r s . . . . . d e g r e e s F . . . . .
0-6 190 14O 6-11 190 135 11-16 190 130 16-22 19O 125 21-26 19O 115 31-32.5 190 110
Total time in the kiln was 32.5 hours. The width, length, and grade of the lumber were tallied after drying and surfacing. Lumber was graded surfaced dry under the supervision of a Western Wood Products Association (WWPA) inspector. Lumber was graded up to three times. Pieces that met specifications for MSR were machine graded; specific details follow.
Visual lumber grades--The 2 by 4s were graded under the structural light framing rules (WWPA 1981); 2 by 6s were graded under the rules for structural joists and planks (WWPA 1981). Each board was assigned the highest grade it qualified for; grade designa- tions were Select Structural, No. 1, No. 2, No. 3, and Economy.
Visual lumber grades ignoring warp and wane---Study lumber also was graded with warp and wane ignored. Warp and wane were defined per current lumber grading rules (WWPA 1981). Warp is any deviation from a true or plane surface, including bow, crook, cup, and twist (WWPA 1981). In general, warp is a concern in the young-growth resource because of reported dimensional instability of juvenile wood (MacKay 1989, Senft and others 1985). Wane is the absence of wood or the presence of bark in lumber caused by the curvature of the log surface; it was monitored to ensure that excessive degrade due to wane was not a factor in grade recovery.
MSR testing--Each board was assigned an Fb (extreme fiber stress in bending) class by

Table 2--Number of logs by log length, head rig, and log diameter
Diameter of Logs (inches)
Length Feet Headrig 5-6 7-8 9-10 11-12 13-14 15-16 17-18 19-20 21-22
. . . . . . . . . . . . . . . . . . . . . N u m b e r o f logs . . . . . . . . . . . . . . . . . . . .
12 Quadsaw 6 2 2 3 2 0 0 0 0 Bandsaw 0 0 0 0 0 0 0 0 0
14 Quadsaw 6 3 1 2 2 0 0 0 0 Bandsaw 0 0 0 0 0 0 0 0 0
16 Quadsaw 39 35 52 32 13 11 1 0 0 Bandsaw 0 0 0 0 1 2 5 2 1
18 Quadsaw 11 5 4 8 2 2 0 0 0 Bandsaw 0 0 1 0 0 0 0 0 0
20 Quadsaw 34 45 66 63 58 32 12 0 0 Bandsaw 1 1 0 3 1 17 25 15 4
22 Quadsaw 0 0 0 0 0 0 0 0 0 Bandsaw 2 4 0 0 0 0 1 0 0
24 Quadsaw 0 0 0 0 1 0 0 0 0 Bandsaw 17 11 11 6 3 4 0 1 0
Total by quadsaw 555 Total by bandsaw 139
All logs 694
a lumber grader using the MSR visual grading requirements (WWPA 1981). The Fb class is determined by the proportion of the net cross section occupied partially or who!ly by knots, knotholes, burls, distorted grain, or decay at the edges of the wide faces:
Edge defect Fb class
I nch Lb/ i rF
<1/6 2100 and over <1/4 1500-2050 <1/3 950-1450 <1/2 0-900
Those boards meeting the minimum visual criteria for MSR were machine tested with a Metrigard continuous lumber testing machine. 2 Both average and low point modulus of elasticity (E) were recorded. The machine was calibrated to a long-span E (American Institute of Timber Construction 1983) AITC 200-83 test 116, a flatwise midspan loading-
2 Mention of companies or products does not constitute endorse- ment by the U. S. Department of Agriculture.
Veneer Processing
deflection test. Grading rules from WWPA specify calibration to an edgewise E and proof testing, but these were not done because we were not grading to a predetermined product mix. Each lumber size was calibrated independently throughout the study, and machine readings were corrected to the calibrated values.
MSR grades assigned--Lumber can be assigned to MSR grades at many levels with predicted average breaking stresses of 900 to 2850 pounds per square inch. Evaluating lumber from this sample of young-growth trees began with each board being assigned an MSR grade as follows:
Edge defect Average E Low point E Grade
1/6 1.80 million+ 1.48 million+ 2100f 1/4 or 1/6 1.50 million+ 1.23 million+ 1650f 1/3, 1/4 and 1/6 1.30 million+ 1.07 million+ 1450f
These are the threshold value average E and low point E for each individual board used to classify boards into grades. Lumber that failed to meet the above requirements for MSR grades reverted to the assigned visual grade, except visually graded No. 2 lumber that failed to meet the E requirements of 1450f was assigned to No. 3 grade. The mean value of the average E for the above grades was 2.21, 1.92, and 1.68 million for the 2100f, 1650f, and 145Of grades, respectively. The flatwise E the lumber was calibrated to usually esti- mates a higher value than the edgewise E that is the industry standard for MSR grading.
The mill-length logs were bucked into 103-inch blocks. Peeler blocks were heated in steam vats to a target temperature at the peeler core of 125 °F. Veneer was peeled on an 8-foot lathe to a nominal 1/8-inch (0.126 green) thickness. Veneer was color coded with sprayed dye (Lane 1971 ) so that identity of blocks and trees were maintained.
Blocks were peeled to an approximate core size of 5.6 inches, veneer was scanned and clipped with the following priorities: NB full sheet, A/B half sheet and strip, C full sheet, C half sheet, D full sheet. Grades C and D random 8- and 4-foot strip also was saved when possible. After clipping, the veneer was sorted by relative moisture content (heartwood or sapwood) and by size (full sheet, half sheet, and 8- and 4-foot random strip). The veneer was dried then graded under the supervision of an American Plywood Association (APA) quality supervisor using Product Standard 1-83 (APA 1983). Four grades were identified: A and B, C, D, and Utility. Dry veneer was tallied by counting the number of full and half sheets and by measuring the width of each strip of veneer. The proportions of veneer sizes manufactured during the study were 39 percent--full sheet, 38 percent--half sheet, and 23 percent--8- and 4-foot random strip.
A sample of veneer sheets was measured before and after drying to compute average green and average dry thickness and average length. Full and half sheets were measured green to determine the average width of each; full sheets were measured dry to determine shrinkage in width. This shrinkage was used to calculate the width of dry half sheets and to convert strip width from dry to green widths. Table 3 shows the nominal and actual sizes of green and dry veneer produced during the study. The recovery of veneer before drying (green veneer volume) was estimated by applying the green measurements to the dry tally. Green volume of strip veneer was estimated by dividing the dry volume by the ratio of dry to green width. Dry strip volume was converted to finished panel equivalent by using strip • loss factors (Fahey 1987) for Douglas-fir veneer.
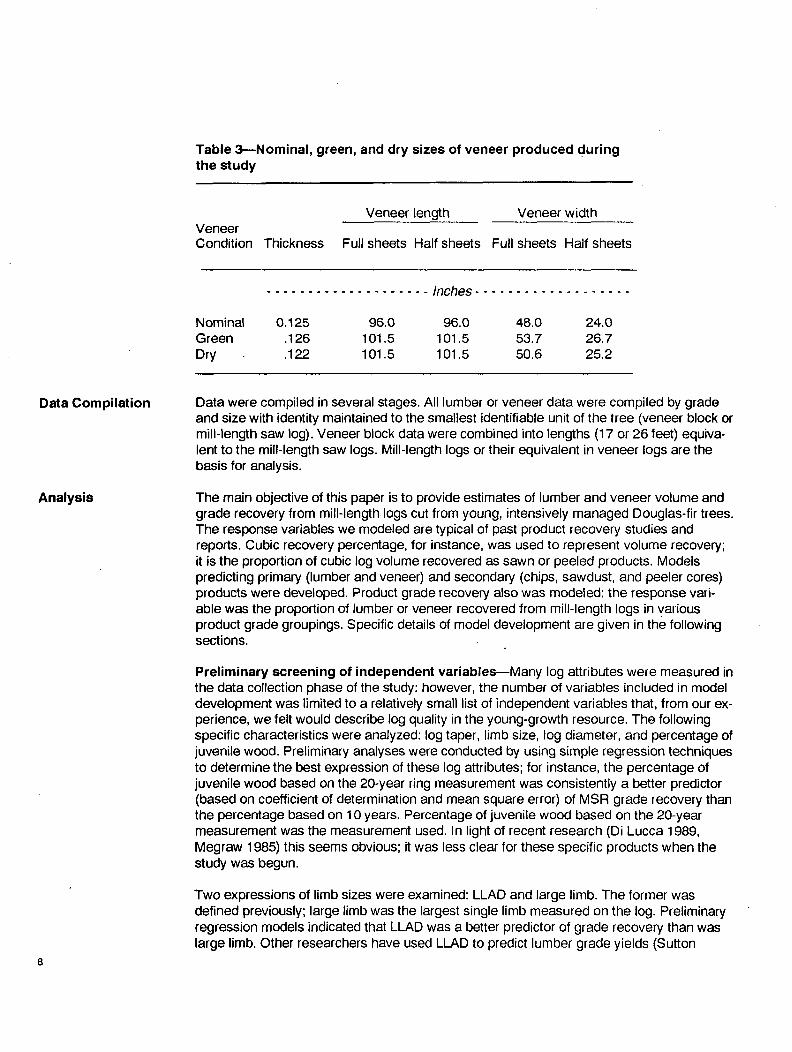
Table 3--Nominal, green, and dry sizes of veneer produced during the study
Veneer Condition Thickness
Veneer length Veneer width
Full sheets Half sheets Full sheets Half sheets
. . . . . . . . . . . . . . . . . . . . I n c h e s . . . . . . . . . . . . . . . . . . .
Nominal 0.125 96.0 96.0 48.0 24.0 Green .126 101.5 101.5 53.7 26.7 Dry .122 101.5 101.5 50.6 25.2
Data Compilation
Analysis
Data were compiled in several stages. All lumber or veneer data were compiled by grade and size with identity maintained to the smallest identifiable unit of the tree (veneer block or mill-length saw log). Veneer block data were combined into lengths (17 or 26 feet) equiva- lent to the mill-length saw logs. Mill-length logs or their equivalent in veneer logs are the basis for analysis.
The main objective of this paper is to provide estimates of lumber and veneer volume and grade recovery from mill-length logs cut from young, intensively managed Douglas-fir trees. The response variables we modeled are typical of past product recovery studies and reports. Cubic recovery percentage, for instance, was used to represent volume recovery; it is the proportion of cubic log volume recovered as sawn or peeled products. Models predicting primary (lumber and veneer) and secondary (chips, sawdust, and peeler cores) products were developed. Product grade recovery also was modeled; the response vari- able was the proportion of lumber or veneer recovered from mill-length logs in various product grade groupings. Specific details of model development are given in the following sections.
Preliminary screening of independent variables--Many log attributes were measured in the data collection phase of the study: however, the number of variables included in model development was limited to a relatively small list of independent variables that, from our ex- perience, we felt would describe log quality in the young-growth resource. The following specific characteristics were analyzed: log taper, limb size, log diameter, and percentage of juvenile wood. Preliminary analyses were conducted by using simple regression techniques to determine the best expression of these log attributes; for instance, the percentage of juvenile wood based on the 20-year ring measurement was consistently a better predictor (based on coefficient of determination and mean square error) of MSR grade recovery than the percentage based on 10 years. Percentage of juvenile wood based on the 20-year measurement was the measurement used. In light of recent research (Di Lucca 1989, Megraw 1985) this seems obvious; it was less clear for these specific products when the study was begun.
Two expressions of limb sizes were examined: LLAD and large limb. The former was defined previously; large limb was the largest single limb measured on the log. Preliminary regression models indicated that LLAD was a better predictor of grade recovery than was large limb. Other researchers have used LLAD to predict lumber grade yields (Sutton
1984). The LLAD is a better index of quality than largest single limb because conditions producing large limbs can affect one or more sides of the tree; a single rough face does not affect quality as much as four rough faces do. Log taper was expressed as end area ratios and as inches of taper per foot of log length; inches per foot of log length was the only measure of taper that was significant (p<0.05) in predicting lumber volume recovery.
Simple correlations also identified log attributes that were related to product volume and grade recovery because of their relation with other log attributes. Two variables, growth rate and log age, fell into this category. Growth rate (rings per inch) was of interest because of its use in lumber grade descriptions and as a silvicultural diagnostic. Growth rate is a limiting factor in structural lumber grades, a minimum of four rings per inch is required unless the rings contain one-third or more of summerwood. Degrade due to rings per inch was not a factor in this study because nearly all lumber met the grade criteria. The main effect on product recovery we observed during the sawing was due to large limbs and not growth rate. We chose not to include growth rate as an independent variable because it was highly correlated with limb size. Log age was not included in the set of independent variables because it was highly correlated with the percentage of juvenile wood, which affects grade recovery directly.
Lumber and veneer volume recovery--Cubic recovery percentage of sawn and peeled products was computed from gross cubic log volumes and rough green product volumes. Cubic recovery of lumber and sawdust were modeled for the saw logs; recovery of veneer and peeler core was modeled for the veneer logs. Chip recovery was estimated by sub- tracting the sum of product volumes from the gross cubic log volume. For the saw-log sample, sawdust was computed by multiplying the surface area of lumber by one-half the saw kerf of the mill. Multiple regression was used to develop predictive models that in- cluded the following independent variables if they were statistically significant (p<0.05): log diameter, log taper, LLAD, and percentage of juvenile wood.
MSR lumber grade recovery--The proportion of lumber volume in the MSR lumber grade groups was computed for each mill-length log. Grade recovery was estimated by an expo- nential model, developed by regression, and by using nonlinear least squares. Other models forms were tried (logarithmic transformations and simultaneous equations): how- ever, preliminary analyses of the data indicated that little would be gained by using the more complex procedures. Ernst and Harm (1984) predict cumulative percentage of lumber grade recovery for three grades with a logistic model. A key attribute of the logistic model is that estimates are restricted to between 0 and 1 by the form of the model.
We chose to model individual grades rather than accumulating; the cumulative approach is desirable in that variability is dampened and model consistency is improved. The negative side is that variables important in accounting for variability in grade recovery might be overlooked in the analysis of accumulated grades. We felt this would be a liability with these data because we were developing relations between independent variables and products never modeled in prior recovery studies.
Percentage of grade recovery was predicted instead of absolute volume for two reasons. First, use of absolute volumes in prediction equations usually involves a correction for unequal variances; this typically is done by dividing the dependent variable by the square of the log diameter multiplied by log length (D2L) (Schumacher and Jones 1940). Dividing absolute volumes by D2L is essentially the same as the proportion. Second, estimates based on percentages are less affected by variation in volume recovery among logs.
Equations were developed for all grade groups except the middle grade (1450f 1.3E). Recovery in this grade was estimated by subtracting the sum of the other grade groups from 100. Functions of the variables LLAD, percentage of juvenile wood, and log diameter were considered. The general form of the equation is:
PG = Boexp(BlX , + B~:~Y~ + .... + BnX,,) ,
where: PG = proportion of grade recovery; /
B~ = coefficients, i = 0,1,...,n;
X~ = independent variables, i=0,1 ..... n; and
exp = exponent of natural log e (2.71828).
Visual lumber grade and veneer grade recovery--The same nonlinear approach was used to develop models predicting visually graded lumber and veneer yields. For lumber, separate models were developed for the Select Structural, No. 1, No. 3, and Economy grades; yields for the No. 2 grade were obtained by subtraction. For veneer, the four grades were combined into three: A and B, C, and D and Utility. Separate models were developed for the A and B and the D and Utility; yields in the C grade were obtained by subtraction.
Degrade due to warp and wane--The intent of collecting data on warp was twofold; we wanted, first, to ensure that manufacturir~g defects were not responsible for major losses in lumber grade and, second, to make broad inferences relative to the impact of juvenile wood on drying-related defects such as warp. The occurrence of wane was monitored to ensure that excessive losses in lumber grade due to manufacturing defects were not incurred. Statistical analyses were not conducted on these data; only the number of boards degraded because of warp and wane is reported.
Results and Discussion Lumber, Sawdust, and Chip Volume Recovery
10
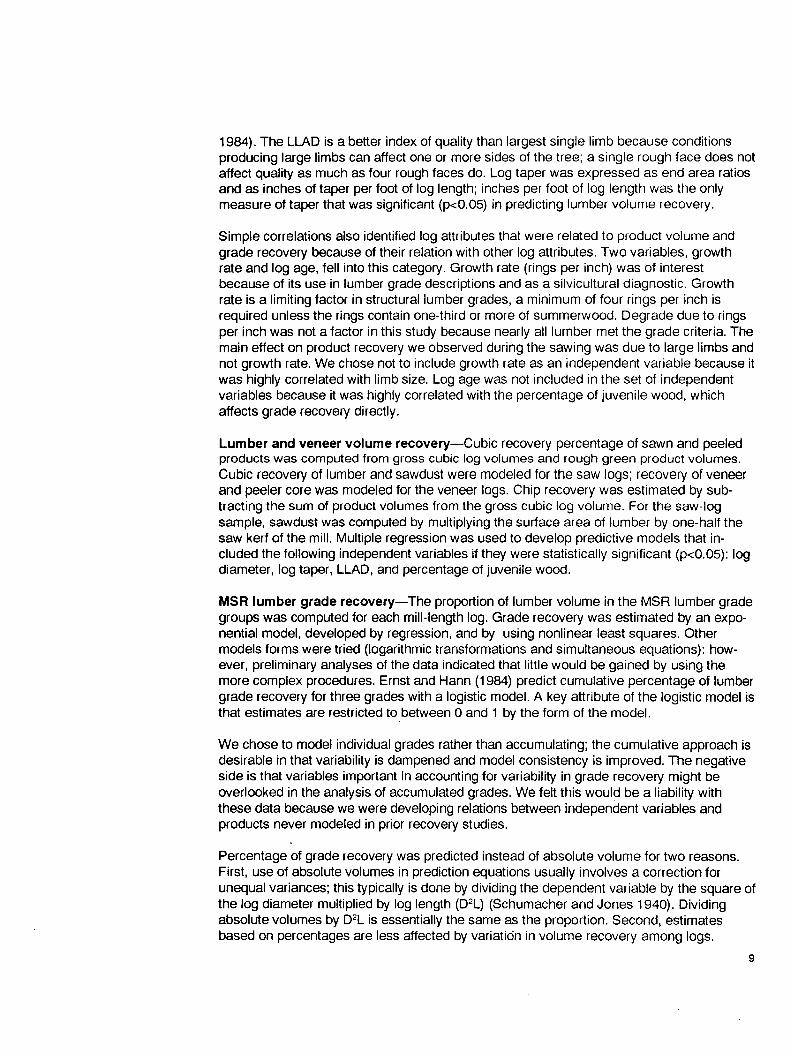
Log diameter and log taper were correlated with the recovery of rough green lumber and sawdust; log diameter was the more important of the two. Figure 2 shows the trends of lumber, sawdust, and chip recovery graphed over log diameter; the equa- tions, R 2, and standard error of the estimate (SEE) are with the figure. Taper in this figure is set to 0.25 inch per foot. The trend over diameter is consistent with past recovery studies; recovery increases rapidly in small logs and levels off for large logs. Though log taper was statistically significant (p<0.05) in the model predicting lumber recovery, the actual effect was small. Recovery from a 16-inch log with a taper of 0.1 inch per foot was about 59 percent of its cubic log volume in rough green lumber; when taper is increased to 0.4 inch per foot, the recovery drops off to about 56 per- cent. Mean taper for this study was 0.155 inch per foot, the range was from 0 to 0.441, and the standard deviation was 0.086 inch per foot of log length. The trend of decreas- ing cubic recovery with increasing log taper was consistent with other studies (Dobie 1964, Hallock and others 1979).
Because sawdust is computed directly from the surface area of the lumber produced, log diameter and taper were significant in predicting sawdust recovery percentages, but the impact was small. For the entire range of log diameter and log taper, sawdust recovery ranged between 6 and 8 percent of log volume. Volume of chippable wood
100
A
C (1) ! . _
(1) Q.
Q) > o (1) rr
80
60
40 I;:
0 5
Chippable
"- Rough green lumber
taper = 0.25 inch/foot
i i ~) = i
1 15
Log diameter (inches)
Models , coeff ic ients, and stat ist ics
RG lumber
Sawdust
Chippable
71.83 - 178/D- 12.4 taper
9.6 - 20/D - 1.9 taper
20
R 2 SEE
0.32 10.07
.23 1.41
by subtraction: 100 - (RG lumber +sawdust)
Veneer, Core, and Chip Volume Recovery
Figure 2--Cubic recovery percent of rough green lumber, sawdust, and chips.
was estimated to be the difference between the volume of the log and the predicted volume of green lumber plus sawdust.
Choosing not to manufacture 1 -inch lumber had a small impact on volume recovery; we estimate that cubic recovery would have increased by about 2 percent if 1 -inch lumber had been saved. Chip and sawdust recovery also would have been slightly impacted. A few small-diameter logs were longer than 20 feet and had to be sawn on the main carriage rather than on the quad band; this had a minor impact on the recovery for small-diameter logs. In general, we feel that volume recovery was typical of mills in the region sawing this resource and product mix.
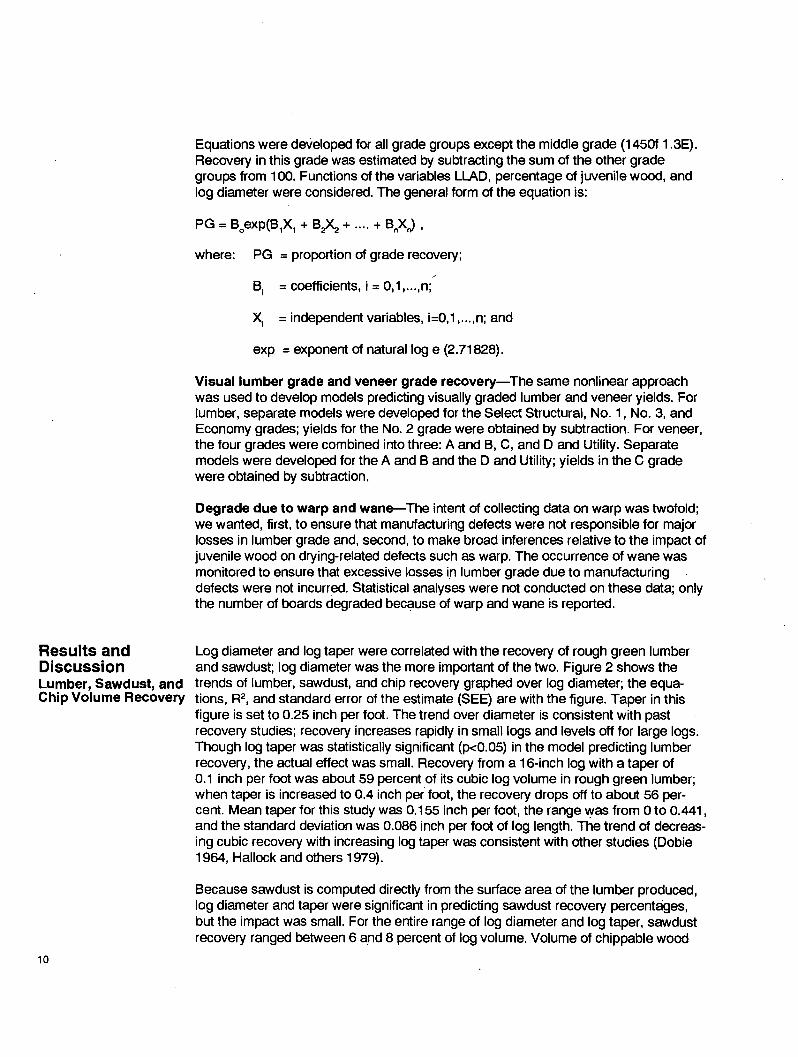
Log diameter and LLAD were found to be correlated with the recovery of rough green veneer. This can be seen in figure 3 where the proportion of log volume recovered as veneer is graphed over log diameter for three levels of LLAD; the equations, R 2, and SEE also are displayed in the figure. Veneer recovery increased rapidly as log size increased because the constant size (5.6 inches) of the unpeeled core is a greater proportion of the volume of small logs than of large logs. The LLAD was negatively correlated with veneer recovery. Veneer recovery from a 20-inch log with a LLAD of 0.5 inch was about 83 percent of the cubic log volume; recovery drops off to about 73 percent when LLAD is increased to 2.5 inches. The losses are due to a combination of factors associated with the occurrence of large limbs in young-growth logs. Large knots can be detected by optical
11

100 == E 80
8. 60 v
E" - Q 40 O u 20
n- O
5
LLAD=2 .5 Veneer
. . . . m . . . . = . . . . = .
10 15 20 25
~- 100 r-"
U L .
Q)
v
0 U Q)
80 I 60
40
20
0 5
I I A r ~ I ] "
10 15 20 25
.-.100
G) O 1 ._
Q) t3.
v
Q)
O O
n. ,
8O
60
40
20
0 5 1 0 15 20 25
Log diameter (inches)
Models, coefficients, and statistics
green veneer = 101.2 - 360.8/D - 1.6 LLAD =
core = -6.7 + 252.7/D
chippable =100 - (green veneer +core)
R 2
0.27
.74
SEE 9.50
2.26
12
• Figure 3---Cubic recovery percent of green veneer, chips, and core for three levels of LLAD.
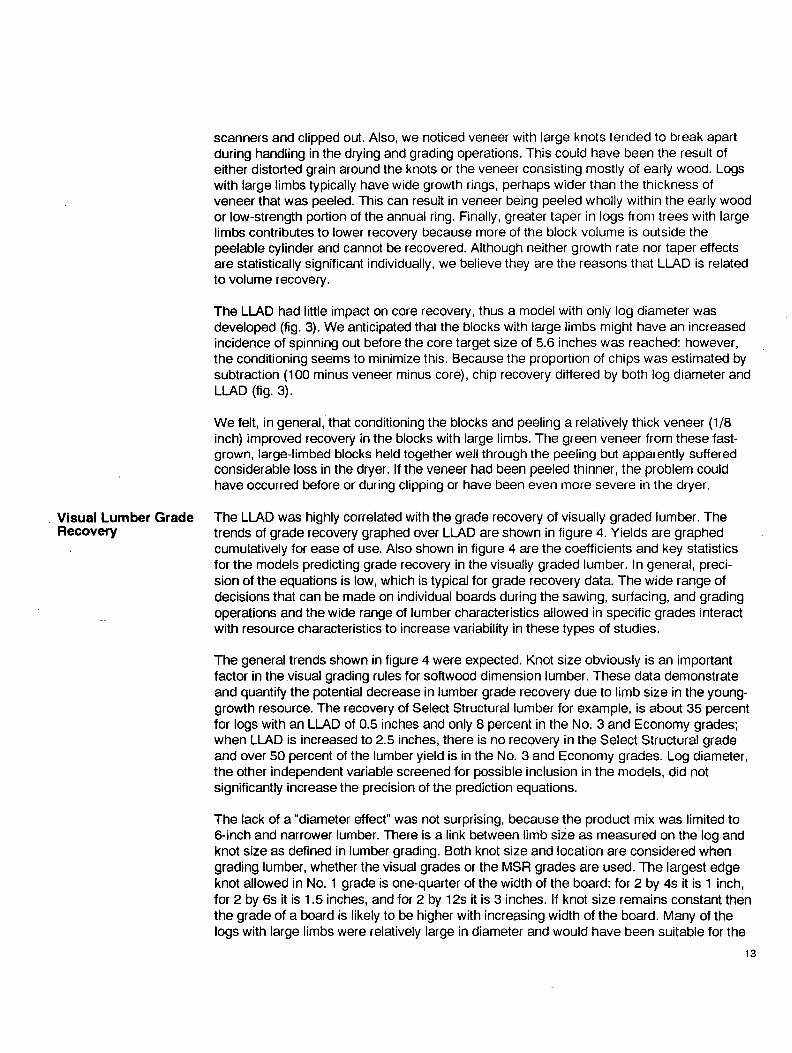
scanners and clipped out. Also, we noticed veneer with large knots tended to break apart during handling in the drying and grading operations. This could have been the result of either distorted grain around the knots or the veneer consisting mostly of early wood. Logs with large limbs typically have wide growth rings, perhaps wider than the thickness of veneer that was peeled. This can result in veneer being peeled wholly within the early wood or low-strength portion of the annual ring. Finally, greater taper in logs from trees with large limbs contributes to lower recovery because more of the block volume is outside the peelable cylinder and cannot be recovered. Although neither growth rate nor taper effects are statistically significant individually, we believe they are the reasons that LLAD is related to volume recovery.
The LLAD had little impact on core recovery, thus a model with only log diameter was developed (fig. 3). We anticipated that the blocks with large limbs might have an increased incidence of spinning out before the core target size of 5.6 inches was reached: however, the conditioning seems to minimize this. Because the proportion of chips was estimated by subtraction (100 minus veneer minus core), chip recovery differed by both log diameter and LLAD (fig. 3).
We felt, in general, that conditioning the blocks and peeling a relatively thick veneer (1/8 inch) improved recovery in the blocks with large limbs. The green veneer from these fast- grown, large-limbed blocks held together well through the peeling but apparently suffered considerable loss in the dryer. If the veneer had been peeled thinner, the problem could have occurred before or during clipping or have been even more severe in the dryer.
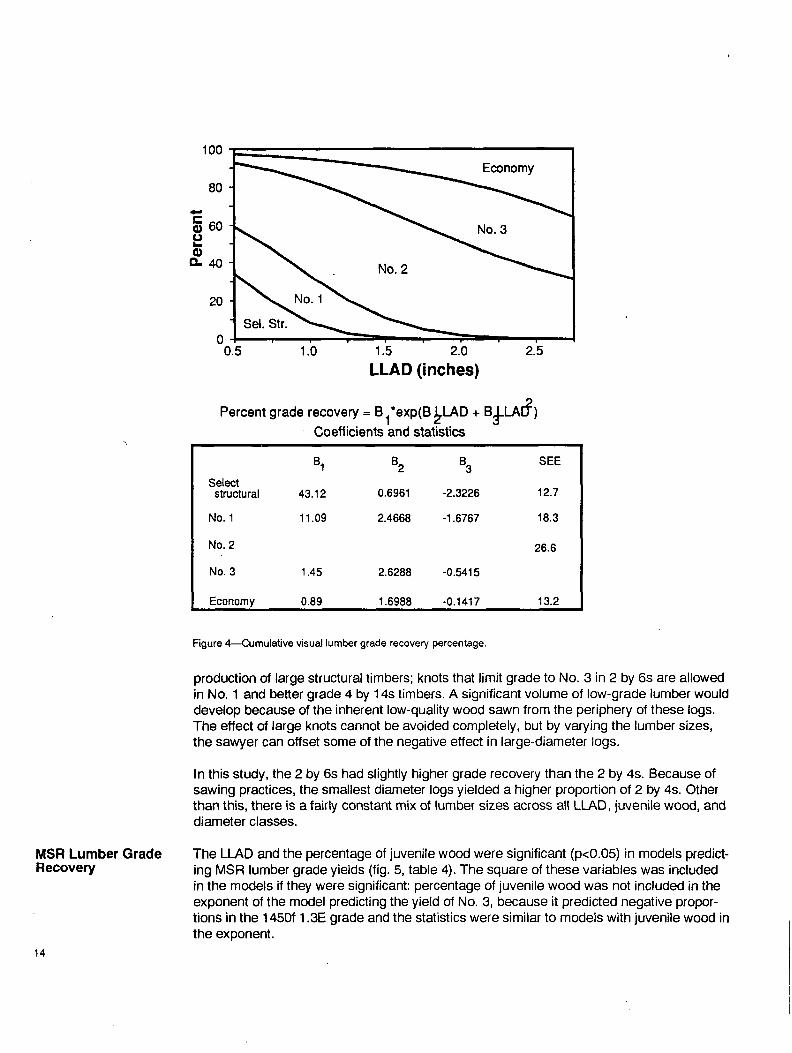
Visual Lumber Grade Recovery
The LLAD was highly correlated with the grade recovery of visually graded lumber. The trends of grade recovery graphed over LLAD are shown in figure 4. Yields are graphed cumulatively for ease of use. Also shown in figure 4 are the coefficients and key statistics for the models predicting grade recovery in the visually graded lumber. In general, preci- sion of the equations is low, which .is typical for grade recovery data. The wide range of decisions that can be made on individual boards during the sawing, surfacing, and grading operations and the wide range of lumber characteristics allowed in specific grades interact with resource characteristics to increase variability in these types of studies.
The general trends shown in figure 4 were expected. Knot size obviously is an important factor in the visual grading rules for softwood dimension lumber. These data demonstrate and quantify the potential decrease in lumber grade recovery due to limb size in the young- growth resource. The recovery of Select Structural lumber for example, is about 35 percent for logs with an LLAD of 0.5 inches and only 8 percent in the No. 3 and Economy grades; when LLAD is increased to 2.5 inches, there is no recovery in the Select Structural grade and over 50 percent of the lumber yield is in the No. 3 and Economy grades. Log diameter, the other independent variable screened for possible inclusion in the models, did not significantly increase the precision of the prediction equations.
The lack of a "diameter effect" was not surprising, because the product mix was limited to 6-inch and narrower lumber. There is a link between limb size as measured on the log and knot size as defined in lumber grading. Both knot size and location are considered when grading lumber, whether the visual grades or the MSR grades are used. The largest edge knot allowed in No. 1 grade is one-quarter of the width of the board: for 2 by 4s it is 1 inch, for 2 by 6s it is 1.5 inches, and for 2 by 12s it is 3 inches. If knot size remains constant then the grade of a board is likely to be higher with increasing width of the board. Many of the logs with large limbs were relatively large in diameter and would have been suitable for the
13
100
• ,-, 80
O - 4 0
20
0 0.5 1.0 1.5 2.0 2.5
LLAD (inches)
Percent grade recovery = B l*exp(B L~LAD + B3LLAD2 ) Coefficients and statistics
B 1 B 2 B 3 S E E
Select structural 43.12 0.6961 -2.3226 12.7
No. 1 11.09 2.4668 -1.6767 18.3
No. 2 26.6
No. 3 1.45 2.6288 -0.5415
Economy 0.89 1.6988 -0.1417 13.2
MSR Lumber Grade Recovery
14
Figure 4--Cumulative visual lumber grade recovery percentage.
production of large structural timbers; knots that limit grade to No. 3 in 2 by 6s are allowed in No. 1 and better grade 4 by 14s timbers. A significant volume of low-grade lumber would develop because of the inherent low-quality wood sawn from the periphery of these logs. The effect of large knots cannot be avoided completely, but by varying the lumber sizes, the sawyer can offset some of the negative effect in large-diameter logs.
In this study, the 2 by 6s had slightly higher grade recovery than the 2 by 4s. Because of sawing practices, the smallest diameter logs yielded a higher proportion of 2 by 4s. Other than this, there is a fairly constant mix of lumber sizes across a~l LLAD, juvenile wood, and diameter classes.
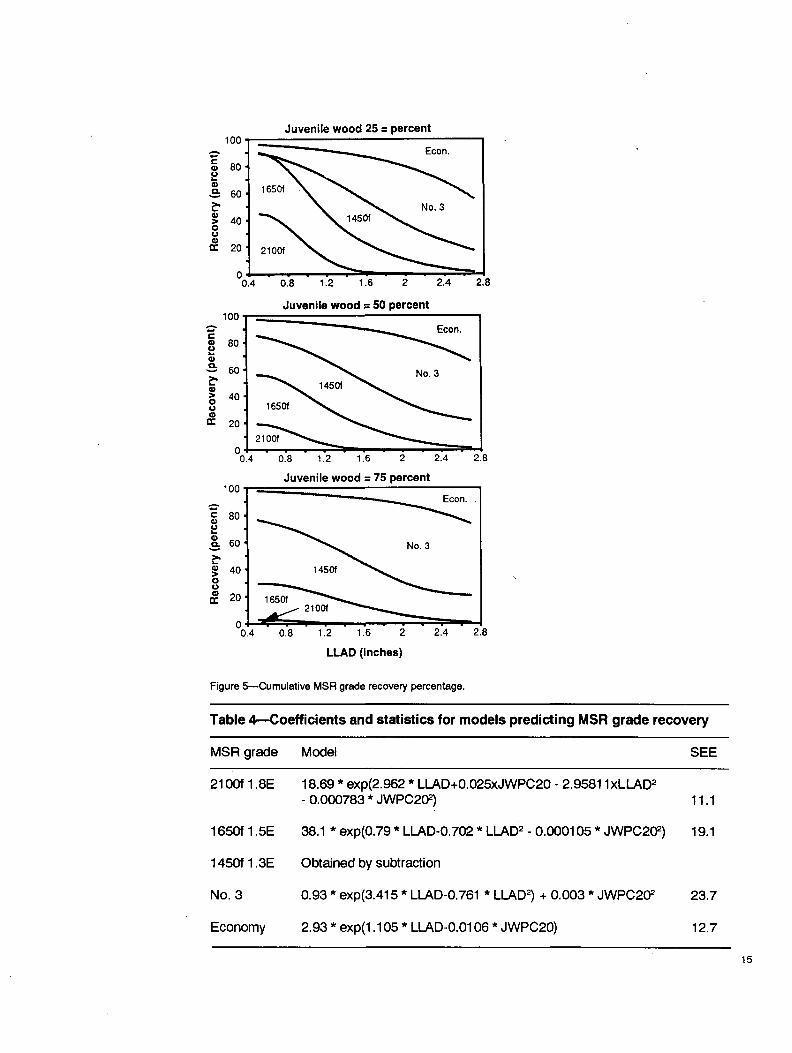
The LLAD and the percentage of juvenile wood were significant (p<0.05) in models predict- ing MSR lumber grade yields (fig. 5, table 4). The square of these variables was included in the models if they were significant: percentage of juvenile wood was not included in the exponent of the model predicting the yield of No. 3, because it predicted negative propor- tions in the 1450f 1.3E grade and the statistics were similar to models with juvenile wood in the exponent.
100 Juvenile wood 25 = percent
~' ~ ~ No. 3
0.4 0.8 1.2 1.6 2 2.4 2.8
100 Juvenile wood = 50 percent
~" T ~ Econ.]
-~ 801 ~ ~ .03 / 4 0 ] ~ 1450f ~ /
8 .I /
0.4 0.8 1.2 1.6 2 2.4 2.8
Juvenile wood = 75 percent 100
60 ~ . No. 3
"~ 40 1450f ~
i1:20
0 r . . . . . . . . . . 0.4 0.8 1.2 1.6 2 2.4 2.8
LLAD (inches)
Figure 5--Cumulative MSR grade recovery percentage.
Table 4-- -Coef f ic ien ts and s ta t i s t i cs for models predicting MSR grade recove ry
MSR grade Model SEE
2100f 1.8E 18.69 * exp(2,962 * LLAD+0,025xJWPC20 - 2.9581 l x L L A D 2 - 0.000783 * JWPC202) 11.1
38.1 * exp(0.79 * LLAD-0,702 * LLAD 2 - 0.000105 * JWPC202) 19.1
Obtained by subtraction
0.93 * exp(3.415 * LLAD-0,761 * LLAD 2) + 0.003 * J W P C 2 ~ 23.7
2.93 * exp(1.105 * LLAD-0.0106 * JWPC20) 12.7
1650f 1.5E
1450f 1.3E
No. 3
Economy
15
Degrade Due to Warp and Wane
16
Graphs of the residuals did not show homogeneity of variance in the 2100f 1.8E and 1650f 1.5E grades; however, transformations of the response variables or the use of weighted least squares did not improve the residual patterns for the 2100f 1.8E grade. The funda- mental problem may be a weak sample in the larger limb sizes. We accepted this violation of the assumption of equal variances because not all the equations were affected and better results using weighted least squares are not always guaranteed (Judge and others 1988).
Log diameter also was significant in some of the equations predicting MSR grade yields; however, the effect was small and contradictory to what should theoretically happen in grade recovery. We did not include log diameter in the final equations because a dispropor- tionate number of large-diameter logs with large limbs was specific to our sample.
The general trends in MSR grade recovery are graphed (fig. 5) over LLAD for three levels of juvenile wood: 25, 50, and 75 percent. The impact of juvenile wood, limb size, and their interactive effects are evident in this figure. For low and moderate amounts of juvenile wood (25 and 50 percent), increasing limb size reduces the recovery in the higher MSR grades. When LLAD is 1 inch and juvenile wood is 25 percent, the recovery in 2100f 1.8E and 1650f 1.5E is over 50 percent; when LLAD increases to 2 inches, the recovery in these same grades drops to less than 20 percent. The percentage of juvenile wood had no effect on the recovery of Economy grade lumber, because this grade has no stiffness require- ments. The major effect was lumber grade dropping from 1650f and better grades to 1450f and No. 3 grades because the stiffness required in the higher grades is not found in the portion of the log that we defined as juvenile wood.
Lumber was assigned visual grades (with warp and wane ignored) to determine if any manufacturing procedures had serious negative effects on lumber grade. The visual grades, which are discussed first, were affected more than the MSR grades.
The number of boards degraded under visual grading rules because of either warp or wane are shown in table 5. Less than 1 percent (70 boards) of the study lumber was degraded due to warp. Of the degraded boards, nearly half changed from No. 1 or better grade to No. 2 grade because warp exceeded grade limits as defined in section 752.00 of the lumber grading rules (WWPA 1981). Limitations for warp in a 16-foot-long 2 by 4 are as follows:
Maximum warp allowed in grade
Type of warp No. 1 No. 2 No. 3
. . . . . . . . . I n ches . . . . . . . . .
Cup 1/32 1/32 1/16 Twist 3/4 1 1 - 1/2 Crook 3/4 1 1-1/2 Bow 2-1/2 3-1/4 5
Only 15 boards were degraded from No. 2 and better grades to No. 3 grade because warp exceeded the above limits in one or more measurement. The other 21 boards had severe warp problems exceeding the amounts allowed in No. 3 grade; it was our observation that warp in these cases usually was related to compression wood around large knots rather than to the presence of juvenile wood. In general, warp was not a significant factor causing
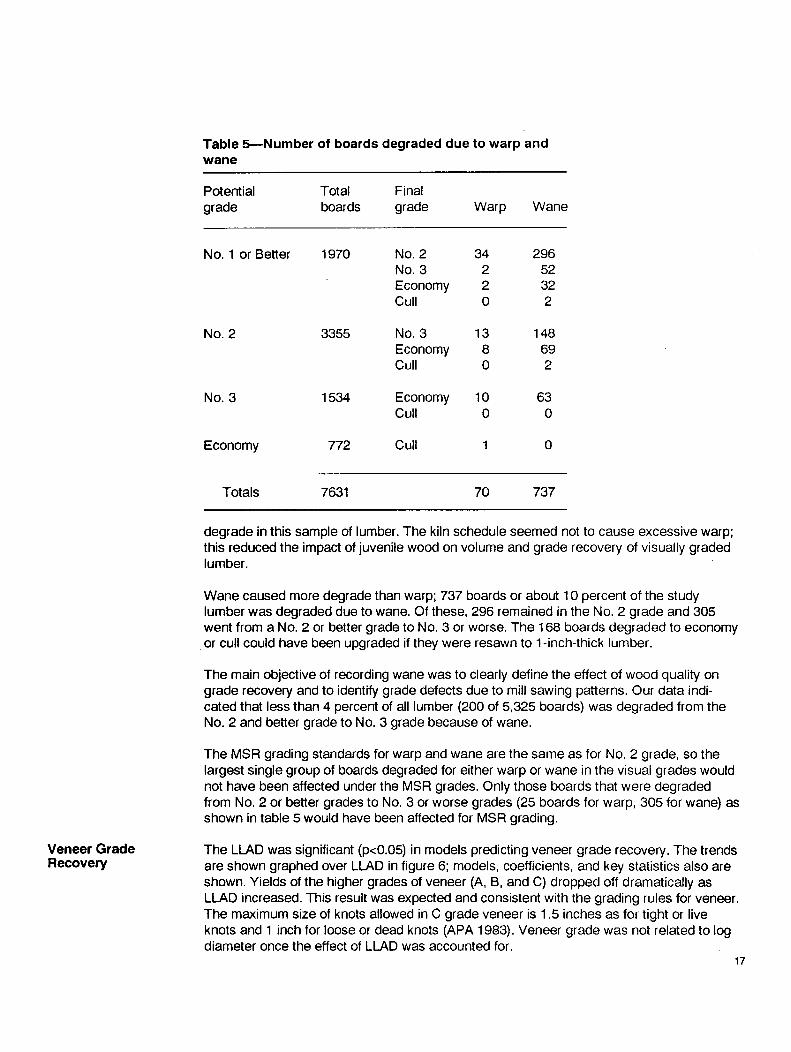
Table 5- -Number of boards degraded due to warp and wane
Potential Total Final grade boards grade Warp Wane
No. 1 or Better 1970
No. 2 3355
No. 2 34 296 No. 3 2 52 Economy 2 32 Cull 0 2
No. 3 13 148 Economy 8 69 Cull 0 2
No. 3 1534 Economy 10 63 Cull 0 0
Economy 772 Cull 1 0
Totals 7631 70 737
Veneer Grade Recovery
degrade in this sample of lumber. The kiln schedule seemed not to cause excessive warp; this reduced the impact of juvenile wood on volume and grade recovery of visually graded lumber.
Wane caused more degrade than warp; 737 boards or about 10 percent of the study lumber was degraded due to wane. Of these, 296 remained in the No. 2 grade and 305 went from a No. 2 or better grade to No. 3 or worse. The 168 boards degraded to economy or cull could have been upgraded if they were resawn to 1-inch-thick lumber.
The main objective of recording wane was to clearly define the effect of wood quality on grade recovery and to identify grade defects due to mill sawing patterns. Our data indi- cated that less than 4 percent of all lumber (200 of 5,325 boards) was degraded from the No. 2 and better grade to No. 3 grade because of wane.
The MSR grading standards for warp and wane are the same as for No. 2 grade, so the largest single group of boards degraded for either warp or wane in the visual grades would not have been affected under the MSR grades. Only those boards that were degraded from No. 2 or better grades to No. 3 or worse grades (25 boards for warp, 305 for wane) as shown in table 5 would have been affected for MSR grading.
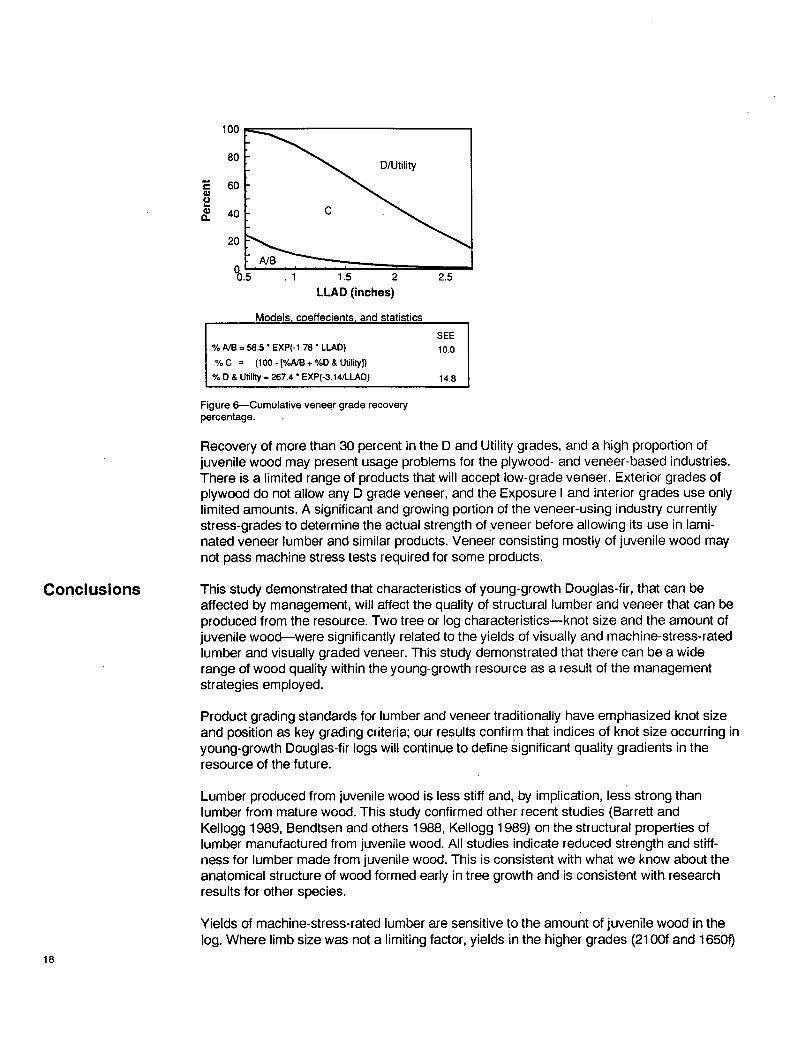
The LLAD was significant (p<0.05) in models predicting veneer grade recovery. The trends are shown graphed over LLAD in figure 6; models, coefficients, and key statistics also are shown. Yields of the higher grades of veneer (A, B, and C) dropped off dramatically as LLAD increased. This result was expected and consistent with the grading rules for veneer. The maximum size of knots allowed in C grade veneer is 1.5 inches as for tight or live knots and 1 inch for loose or dead knots (APA 1983). Veneer grade was not related to log diameter once the effect of LLAD was accounted for.
17
100
.u D,,
80
60
40
20
~ tility
° o ; ' " : I . . . . . 1.'s" 2.s LLAD (inches)
Models 1 coeffecients t and statistics
% A/B = 58.5 "EXP(-1.78 * LLAD)
% C = (100- [%A/B + %D & Utility])
% D & Utility = 267.4 * EXP(-3.14/LLAD)
SEE
10.0
14.8
Figure 6 - -Cumula t i ve veneer grade recovery percentage.
Recovery of more than 30 percent in the D and Utility grades, and a high proportion of juvenile wood may present usage problems for the plywood- and veneer-based industries. There is a limited range of products that will accept low-grade veneer. Exterior grades of plywood do not allow any D grade veneer, and the Exposure I and interior grades use only limited amounts. A significant and growing portion of the veneer-using industry currently stress-grades to determine the actual strength of veneer before allowing its use in lami- nated veneer lumber and similar products. Veneer consisting mostly of juvenile wood may not pass machine stress tests required for some products.
Conclusions This study demonstrated that characteristics of young-growth Douglas-fir, that can be affected by management, will affect the quality of structural lumber and veneer that can be produced from the resource. Two tree or log characteristics--knot size and the amount of juvenile wood--were significantly related to the yields of visually and machine-stress-rated lumber and visually graded veneer. This study demonstrated that there can be a wide range of wood quality within the young-growth resource as a result of the management strategies employed.
Product grading standards for lumber and veneer traditionally have emphasized knot size and position as key grading criteria; our results confirm that indices of knot size occurring in young-growth Douglas-fir logs will continue to define Significant quality gradients in the resource of the future.
Lumber produced from juvenile wood is less stiff and, by implication, less strong than lumber from mature wood. This study confirmed other recent studies (Barrett and Kellogg 1989, Bendtsen and others 1988, Kellogg 1989) on the structural properties of lumber manufactured from juvenile wood. All studies indicate reduced strength and stiff- ness for lumber made from juvenile wood. This is consistent with what we know about the anatomical structure of wood formed early in tree growth and is consistent with research results for other species.
18
Yields of machine-stress-rated lumber are sensitive to the amount of juvenile wood in the log. Where limb size was not a limiting factor, yields in the higher grades (2100f and 16500

decreased as the proportion of juvenile wood in the log increased. The yields of visually graded lumber were not directly related to measures of juvenile wood but were related only tolimb size. The visual lumber grading rules do not escape, however, the problems associ- ated with juvenile wood. Lumber graded under structural rules are assigned design proper- ties, and lumber cut from logs with a high proportion of juvenile wood rarely will meet these criteria. Current visual lumber grading rules use rings per inch and percentage of summer- wood limitations to eliminate weak lumber. It is not clear how well these criteria are working with young growth or what modifications will be needed to maintain the integrity of implied design values.
Juvenile wood has a reputation for inherent dimensional instability and for developing severe warp due to variation in rates of Io.ngitudinal shrinkage (Bendtsen 1978). Experi- ence in this study indicated that warp is a minor problem with Douglas-fir, and not all the warp was related to juvenile wood. Other recent studies (Mackay 1989, Milota 1990) confirm this. Kiln drying can cause problems with warp, but several schedules currently in use result in only minor amounts and degrees of warp.
Applications The intent of this study was to define how a range of resource characteristics would interact with the volume and grade yield of products produced under current product standards. We intentionally selected trees from a wide range of stand conditions so that a maximum range of log characteristics would be included in the sample. Our objective was not to analyze specific management regimes or stands but to link product quality to log characteristics. We intentionally modeled independent variables (limb size, amount of juvenile wood, and so forth) that will facilitate evaluation based on end-product values of forest management activities.
One barrier to this evaluation was the lack of a precise definition for juvenile wood and the age when juvenile wood formation ceases. Our results indicate that for predicting MSR lumber grades, 20 years is far superior to 10 years; but this does not define the cessation of juvenile wood formation. The transition is gradual and probably differs among trees and may differ geographically as in Southern pines (Clark and Saucier 1989). Work by Di Lucca (1989) indicates that the transition to mature wood is at 23 years based only on specific gravity. The most current studies examining the effect of juvenile wood on Douglas-fir wood properties use different delineations of juvenile wood; our study and the one by Barrett and Kellogg (1989) used 20 years; the work by Bendtsen and others (1988) used 18 years. Defining juvenile wood is an intricate problem, change is rapid initially and slow later, and several characteristics indicative of juvenility are changing at different rates. Twenty years is, in the regression sense, so highly intercorrelated with either 18 or 23 that any of the three would have served equally well.
Silvicultural regimes influence the size, condition, and frequency of branching in trees, and evaluation of treatments should include their impact on product quality. An initial step to link silvicultural activities to wood quality would be to broaden the scope of growth and yield models. Prediction of volume has been the focus of growth and yield models, while wood quality was assumed to be constant regardless of silvicultural treatment. Our data show a wide range of quality in young growth based on just one quality index, average limb size. Estimates of branch frequency and branch size as the stand develops are available (Maguire and others 1988), and work is continuing on this problem.
Juvenile wood is an important concern in young growth, and growth and yield models should include it as standard for silvicultural diagnostics. This will require agreement on
19

what juvenile wood is, when it is formed, and how it is impacted by tree spacing, fertiliza- tion, genetic selection, or other stand treatments. Estimates of limb size and juvenile wood volumes will facilitate linkage between tree growth and wood quality needed to measure the economic impact of stand management.
As with use of any empirical data base, there are liabilities. One key concern is extrapola- tions; in this situation, we need to consider both a "narrow" and a "broad" type of extrapola- tion. In a narrow sense, we cannot make predictions for logs outside the range of charac- teristics included in our sample or for products we did not manufacture in this study; we are limited by the range of the resource we sampled and the products we chose to manu- facture. In selecting the sample, we examined more than 200 stands and selected the sample stands to reflect the widest possible variation in tree and log characteristics. It is unlikely that stand management will result in characteristics not falling within the range of the sample. The product choices, visually graded lumber and veneer, represent most of the current market and MSR graded lumber is a fast-gr0wing segment of the market.
In the broader sense, there are liabilities in using measures of quality that are relevant today, to make decisions that will impact wood quality decades in the future. Will the wood quality attributes important today be important in the future? This is an unknown; opinions differ depending on an individual's view of what lies ahead for the forest product industry in the Pacific Northwest. We believe that structural properties were a key to the acceptance of Douglas-fir products and will continue to be important in the future. This region does not have the low production and marketing costs required to compete in a commodity market for forest products. Engineered uses of wood are increasing, and these uses will accentu- ate the need for accurate and reliable design values. This is happening at the same time as overall quality in the Douglas-fir resource and in timber sources worldwide apparently is declining.
These data are needed by analysts, economists, and managers planning and evaluating silvicultural regimes. This study was designed with the intent of being compatible with the Tree-Val model (Briggs 1989) but can be used with any model that has the capacity to estimate values. In addition to use by land managers, this information can be used to make product decisions for young-growth timber cut from existing forests. Forest manag- ers have a wide range of options available for managing the next generation of forests. Genetic selection, initial spacing, timing and degree of thinnings, pruning, and rotation age impact the apparent quality of trees produced from the forest. Until now there was no way to tie the effect of these changes in appearance to ultimate product value.
Economic analyses largely have ignored the effect of wood quality on stand value because these relations were poorly defined. Typically, the cost of forest operations have been weighed against the production of volume per acre, with the implicit assumption that all wood was of the same quality. This report demonstrates that there is a wide range of quality produced from young-growth resources, and that quality will be a factor in estimat- ing the economic impact of stand management.
Acknowledgments
20
Because this research was sponsored by a cooperative, many people contributed to the study. Simpson Timber Company provided the plant for manufacturing the study logs into products. Bohemia Inc., Bureau of land Management, Cavenham Industries, Longview Fibre, Port Blakely Mill Co., USDA Forest Service, University of Washington, Washington Department of Natural Resources, Weyerhaeuser Co., and Willamette Industries provided the sample trees and the expertise of their land managers in locating and selecting the sample for the study.
Li tera ture C i ted
Special thanks goes to the Technical Advisory Committee for assistance with technical problems in the study design and for technical review of the final report. Committee mem- bers who reviewed the report are:
David R. Briggs Douglas A. Maguire Bradley E. Shelley Robert A. Megraw Robert M. Kellogg William L. Galligan Susan A. WUlits Gregory P. Johnson
University of Washington University of Washington West Coast Lumber Inspection Bureau Weyerhaeuser Co. Forintek Canada Corp. Frank Lumber Co. USDA Forest Service, Pacific Northwest Research Station International Paper Co.
Reviewers not associated with the Technical Advisory Committee were: f
Joseph R. Saucier USDA Forest Service, Southeastern Forest Experiment Station
Kent A. Macdonald USDA Forest Service, Forest Products Laboratory
American Institute of Timber Construction. 1983. Inspection manual. AITC 200-83. Englewood, CO. 96 p.
American Plywood Association. 1983. U.S. product standard PS 1-83. Tacoma, WA.
Barrett, J.D.; Kellogg, R.M. 1989. Strength and stiffness of dimension lumber. In: Second growth Douglas-fir; its management and conversion for value. Special Publ. SP-32. Vancouver, BC: Forintek Canada Corp.: 50-58.
Bendtsen, B. Allan. 1978. Properties of wood from improved and intensively managed trees. Forest Products Journal. 28(10): 61-72.
Bendtsen, B. Allan; Plantiga, Pamela A.; Snellgrove, Thomas A. 1988. The influence of juvenile wood on the mechanical properties of 2x4 cut from Douglas-fir plantations. In: Proceedings International conference on timber engineering; 1988 September. Seattle, WA. Madison, WI. Forest Products Research Society: 226-240.
Briggs, David. 1989. Tree value systems: description and assumptions. Gen. Tech. Rep. PNW-GTR-239. Portland, OR: U.S. Department of Agriculture. Forest Service, Pacific Northwest Research Station. 24 p.
Bruce, David. 1982. Butt log volume estimators. Forest Science. 28(3): 489-503.
Clark, Alec, III.; Saucier, J.R. 1989. Influence of initial planting density, geographic location and species in juvenile wood formation in southern pine. Forest Products Journal. 39(7/8): 42-48.
Di Lucca, C.M. 1989. Juvenile-mature wood transition. In: Second growth Douglas-fir: its management and conversion for value. Special Publ. SP-32. Vancouver, BC: Forintek Canada Corp.: 23-38.
Dobie, J. 1964. Log taper related to lumber production. B.C. Lumberman. 48(5): 80, 82, 84-85.
21
Ernst, S.; Hann, D.W. 1984. Volume and value prediction for young-growth true fir trees. Forest Science. 30(4): 871-882.
Fahey, Thomas D. 1987. Douglas-fir veneer: green veneer grades, layup loss, and green veneer and plywood recovery. Forest Products Journal. 37(11/12): 45-50.
Hallock, Hiram; Steele, Philip; Richard Selin. 1979. Comparing lumber yields from board-foot and cubically scaled logs. Re.s. Pap. FPL-324. Madison, WI; U.S. Department of Agriculture, Forest Service, Forest Products Laboratory. 16 p.
Judge, George G; Hill, Carter R.; Griffith, William E. [and others]. 1988. Introduction to the theory and practice of econometrics. 2d ed. New York: John Wiley and Sons. 1024 p.
Kellogg, R.M. 1989. Second growth Douglas-fir: its management and conversion for value. Special publ. SP-32. Vancouver, BC: Forintek Canada Corp. 173 p.
King, James E. 1966. Site index curves for Douglas-fir in the Pacific Northwest. Weyer- haeuser Forestry Pap. 8, Centralia, WA: Weyerhaeuser Co. 49 p.
Lane, P.H. 1971. Identifying veneer in recovery studies. Forest Products Journal. 21 (6): 32-33.
Larson P.R. 1969. Wood formation and the concept of wood quality. Bull. 74. New Haven, CT: School of Forestry, Yale University.
Mackay, J.F.G. 1989. Kiln drying lumber. In: Second growth Douglas-fir: its management and conversion for value. Special publ. SP-32, Vancouver, BC: Forintek Canada Corp.: 75-77.
Maguire, D.A.; Hann, D.W.; Kershaw, J.A., Jr. 1988. Prediction of branch diameter and branch distribution for Douglas-fir in southwestern Oregon. In: Forest growth modeling and prediction. Gen. Tech. Rep. NC-120. St. Paul, MN. U.S. Department of Agriculture, Forest Service, North Central Forest Experiment Station: 1029-1036.
Megraw, Robert A. 1985. Douglas-fir wood properties: In: Proceedings, Douglas-fir: stand management for the future. [Dates unknown];[Location of symposium unknown]. Seattle, WA: University of Washington: 81-96.
Milota, Michael R. 1990. Effect of log size and juvenile wood on drying. In: Proceedings, Western Dry Kiln Association annual meeting; 1990 May; Reno, NV. Corvallis, OR: Western Dry Kiln Association.
Panshin, A.J.; de Zeeuw, C. 1980. Textbook of wood technology. 4th ed. New York: McGraw-Hill.
Schumacher, F.X.; Jones, W.C. 1940. Empirical log rules and the allocation of log sawing time to log size. Journal of Forestry. 83(8): 477-484.
Senft, John F.; Bendtsen, Alan B.; Galligan, William L. 1985. Weak wood: fast-grown trees make problem lumber. Journal of Forestry. 83(8): 477-484.
Sutton, W.R.J. 1984. New Zealand experience with radiata pine. Vancouver, BC: Univer- sity of British Columbia.
22
Western Wood Products Association. 1981. Standard grading rules for western lumber. Portland, OR. 222 p.
A P P E N D I X StandHi~or ies
Stand
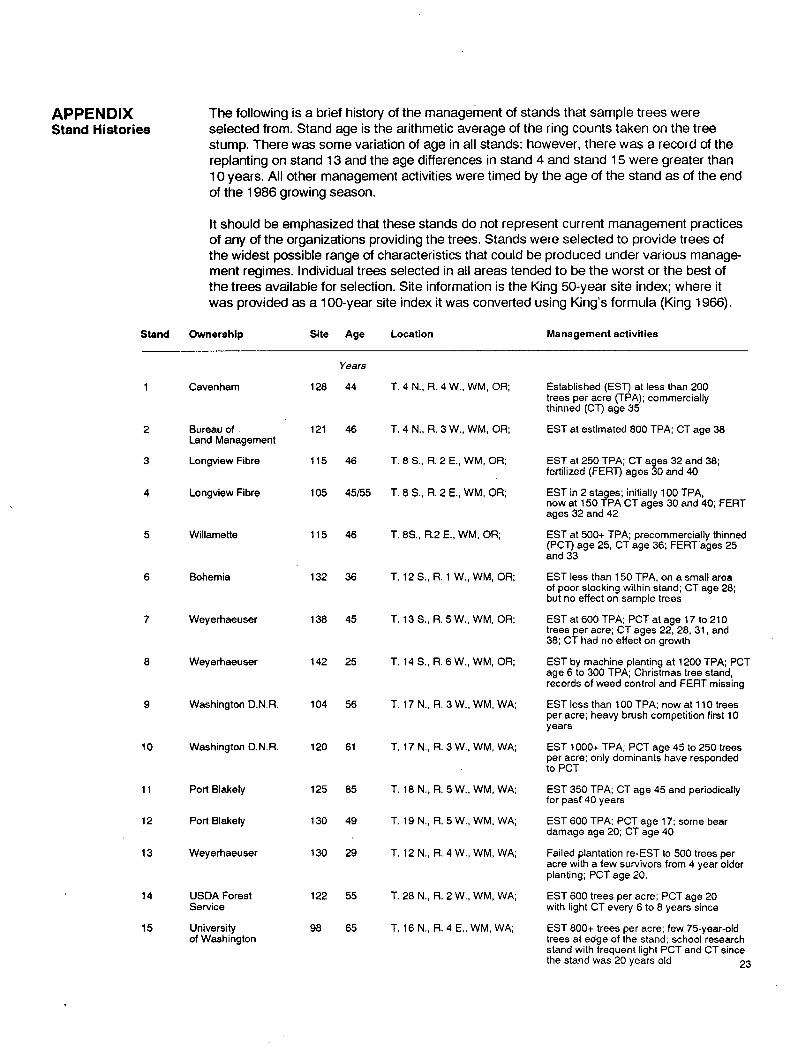
The following is a brief history of the management of stands that sample trees were selected from. Stand age is the arithmetic average of the ring counts taken on the tree stump. There was some variation of age in all stands: however, there was a record of the replanting on stand 13 and the age differences in stand 4 and stand 15 were greater than 10 years. All other management activities were timed by the age of the stand as of the end of the 1986 growing season.
It should be emphasized that these stands do not represent current management practices of any of the organizations providing the trees. Stands were selected to provide trees of the widest possible range of characteristics that could be produced under various manage- ment regimes. Individual trees selected in all areas tended to be the worst or the best of the trees available for selection. Site information is the King 50-year site index; where it was provided as a 100-year site index it was converted using King's formula (King 1966).
Ownership Site Age Location Management activities
10
11
12
13
14
15
Cavenham 128
Years
44
Bureau of . 121 46 Land Management
Longview Fibre 115 46
Longview Fibre 105 45/55
Willame~e 115 46
Bohemia 132 36
Weyerhaeuser 138 45
Weyerhaeuser 142 25
Washington D.N.R. 104 56
Washington D.N.R. 120 61
Port Blakely 125 85
Port Blakely 130 49
Weyerhaeuser 130 29
USDA Forest 122 55 Service
University 98 65 of Washington
T. 4 N., R. 4 W., WM, OR;
T. 4 N., R. 3 W., WM, OR;
T. 8 S., R. 2 E., WM, OR;
T. 8 S., R. 2 E., WM, OR;
T. 8S., R.2 E., WM, OR;
T. 12S., R. 1 W., WM, OR;
T. 13 S., R. 5W., WM, OR;
T. 14S., R. 6 W., WM, OR;
T. 17 N., R. 3 W., WM, WA;
T. 17 N., R. 3 W., WM, WA;
T. 18 N., R. 5 W., WM, WA;
T. 19 N., R. 5 W., WM, WA;
T. 12 N., R. 4 W., WM, WA;
T. 28 N., R. 2 W., WM, WA;
T. 16 N., R. 4 E., WM, WA;
Established (EST) at less than 200 trees per acre (TPA); commercially thinned (CT) age 35
EST at estimated 800 TPA; CT age 38
EST at 250 TPA; CT ages 32 and 38; fertilized (FERT) ages 30 and 40
EST in 2 stages; initially 100 TPA, now at 150 TPA CT ages 30 and 40; FERT ages 32 and 42
EST at 500+ TPA; precommercially thinned (PCT) age 25, CT age 36; FERTages 25 and 33
EST less than 150 TPA, on a small area of poor stocking within stand; CT age 28; but no effect on sample trees
EST at 600 TPA; PCT at age 17 to 210 trees per acre; CT ages 22, 28, 31, and 38; CT had no effect on growth
EST by machine planting at 1200 TPA; PCT age 6 to 300 TPA; Christmas tree stand, records of weed control and FERT missing
EST less than 100 TPA; now at 110 trees per acre; heavy brush competition first 10 years
EST 1000+ TPA; PCT age 45 to 250 trees per acre; only dominants have responded to PCT
EST 350 TPA; CT age 45 and periodically for past'40 years
EST 600 TPA; PCT age 17; some bear damage age 20; CT age 40
Failed plantation re-EST to 500 trees per acre with a few survivors from 4 year older planting; PCT age 20.
EST 600 trees per acre; PCT age 20 with light CT every 6 to 8 years since
EST 800+ trees per acre; few 75-year-old trees at edge of the stand; school research stand with frequent light PCT and CT since the stand was 20 years old 23
~ 2 . 5
¢- u 2 c-
Q < 1.5 .- I ._1
1
0.5
0
2 1
1 2 1 2
2 4 1 3 2 3
1- 1 1 1 5 3 1 2
1 3 7 6 3 5 7 10
1 4 13 5 9 4 3 5 16
1 12 9 22 12 10 12 9 60
9 15 13 5 8 3 10 41
3 23 32 20 17 9 4 9 26
7 19 19 14 5 6 4 4 7
9 17 10 12 5 5 1
I I I I I I I I I I
20 40 60 80 100 Juvenile wood (percent)
3
,-,2.5 ffl
e -
u 2 e -
o 1.5 5 - J
1
0.5 i | 1 1 1 1 1
0 5
1 2
1 1 1 3
1 2 1 1 2 1 1 1 1 1 1 2
1 2 1 2 1 3 1 1 4 1
1 6 5 5 6 6 4 2 4 2 4 2 3 2 1
2 1 1 4 4 1 3 4 5 3 4 3 4 3 3 1 1
7 2 9 9 614171512 8 1 1 4 7 5 1 4 2 2
2 1 6 7 1 1 1 2 1 2 1 2 5 4 6 6 7 2 2
5197161416111211 7 1 0 4 3 7 1
3 7 317 8 1 0 9 7 6 4 3 2 4 1 1
3 7 8 5 1 0 6 5 6 1 2 3 1 2 i i i i
10 15 20 Log diameter (inches)
i
25 30
100
~, 8o
e~ v 60 0
~ 40 E I l l
N 2o
0 0
17482220181814 6 2 1 1
216 410 5 5 3 1
2 8 4 4 6 5 5 4 1
1 7 1 4 310 6 4 3 1
8 5 8 4 9 6 5 7 6 5 1 2
5 7 7 5 9101312 8 7 7 3 1 1 2 1
2 1 7 1 4 1 1 1 3 1 0 6 1 0 7 1 4 8 8 4 3
2 5 1 0 5 9 1 1 1 1 8 1 0 9 6 2 3 3
2 1 3 2 5 1 3 4 1 2 1
1 . . . . . . . . . . . ,
5 10 15 20 Log diameter (inches)
, o
25 30
24
Figure 7 ~ a m p l e f requency among the three independent var iab les used to mode l lumber vo lume and 9rade recovery. Total number of saw logs in the samp le was 694. LLAD is the average of the largest l imbs in each log quadrant, juveni le wood is the wood within the f irst 20 growth rings for each log.
3
A
2.5 J= U
• -= 2
¢3 < ..J 1.5 - I
0.5
2
1 1 4 1
2 2 3 4 2
5 4 2 2 1
4 5 7 3 6
2 5 7 3 5 1
4 9 16 8 7 5 5
1 3 7 3 2 2 2
13 11 15 6 5
5 17 7 1
9 4
I I I I I I t
20 40 60 80
J u v e n i l e w o o d ( p e r c e n t )
!
100
"-" 2.5 Q r- u r- 2
° l
1.5 _1 -- I
1 - w
0.5 -
100
A
r- 80 u
Q . • ---- 60 - " 0 0 0
40 -
c G) > 20 -
- - j
0 0
1 1
1 1 1 1 1 1 1
1 2 2 2 1 1 1 3 3
1 1 2 4 2 2 1 1 1
2 4 3 6 1 1 2 3 1 2 1 1
1 1 2 6 2 3 3 2 2 3
5 9 1 0 6 3 5 6 5 1 3 3 1
3 4 4 3 2 1 2 1 1 2 1 1
2 5 6 7 6 6 6 2 2 2 2 1 2 1
3 7 4 3 3 3 2 1 2 1 1
1 3 1 4 2 1 1
L o g d i a m e t e r ( i n c h e s )
4 5 1 1
1 1 2
2 3 4 1
2 2 3 4 1 1 1 2 1 1
1 2 6 7 1 4 3 1
3 6 4 5 3 5 3 2 3 2 1
4 9 6 6 7 7 8 5 4 3 3 1
1 2 7 1 2 4 9 5 6 5 2 3 4 2 1
1 2 3 3 4 3 1 4 4 3 4 2 1
° 1
. . . . = . . . . i . . . . , . . . . = . . i i I i i
5 10 15 20 25
L o g d i a m e t e r ( i n c h e s )
30
30
Figure 8 ~ S a m p l e frequency among the three independent variables used to model veneer volume and grade recovery. Total number of veneer logs in the sample was 267. LLAD is the average of the largest limbs in each. log quadrant, juvenile wood is the wood within the first 20 growth rings for each log.
25

Fahay, Thomas D.; Cahlll, James M.; Snellgrove, Thomas A.; Heath, Unde S. 1991. Lumber and veneer recovery from intensively managed young-growth Douglas-fir. Res. Pap. PNW-RP- 437. Portland, OR: U.S. DeparVnent of Agriculture, Forest Service, Pacific Northwest Research Station. 25 p.
The objective of the study was to develop models that predict lumber and veneer recovery as a function of young-growth log characteristics. Empirical lumber and veneer recovery data for logs cut from more than 300 young-growth Douglas-fir trees were used in model development. Trees were sampled from 15 stands in western Oregon and Washington and represent a wide range of growing conditions, sites, ages, and stocking history. Models ware developed that predict (1) the volume recovery of pdmary (lumber and veneer) and secondary (chips, sawdust, and peeler cores) products, (2) lumber grade recovery based on machine stress-rated rules, (3) lumber grade recovery based on visual grading rules, and (4) veneer grade recovery. Log characteristics investigated were log diameter, the proportion of juvenile wood present in the log, leg taper, and limb size. Lumber degrade caused by warping of juvenile wood was evaluated for low tempera- ture, low humidity, kiln schedule.
Keywords: Douglas-fir, young-growth, juvenile wood, lumber volume recovery, lumber grade yields, wood strength, machine grading, veneer volume recovery, veneer grade yields, Washing- ton, Oregon.
The Forest Service of the U.S. Department of Agriculture is dedicated to the principle of multiple use management of the Nation's forest resources for sustained yields of wood, water, forage, wildlife, and recreation. Through forestry research, cooperation with the States andprivate forest owners, and management of the National Forests and National Grasslands, it strives--as directed by Congress---to provide increasingly greater service to a growing Nation.
The U.S. Department of Agriculture is an Equal Opportunity Employer. Applicants for all Department programs will be given equal consideration without recj..ard to age, race, color, sex, religion, or national ongln.
Pacific Northwest Research Station 333 S.W. First Avenue P.O. Box 3890 Portland, Oregon g7208-3890
-N,'~T!ONAL]
U.S. Department of Agriculture Pacific Northwest Research Station 333 S.W. First Avenue P.O. Box 3890 Portland, Oregon 97208
BULK RATE POSTAGE ÷ FEES PAID USDA-FS
PERMIT No. G
Official Business Penalty for Private Use, $300
do NOT detach label