Embed Size (px)
Citation preview

Journal of Physics Conference Series
OPEN ACCESS
Lumped parameter identification of a quarter cartest rigTo cite this article Y Taskin et al 2013 J Phys Conf Ser 410 012089
View the article online for updates and enhancements
You may also likeFinite Element Model of Multi-Body BrakeQuarter Car for Braking AnalysisM J Han C H Lee T W Park et al
-
Influence of Energy Input on the Flow PastHypersonic Aircraft X-43Ya V Khankhasaeva V E Borisov and A ELutsky
-
Numerical Investigation of ContinuousDamping of The Semi-Active SuspensionSystem for Passenger CarM R Ahmed A R Yusoff and F R MRomlay
-
This content was downloaded from IP address 1023924770 on 14022022 at 1710
Lumped parameter identification of a quarter car test rig
Y Taskin13 N Yagiz1 and I Yuksek2 1 Department of Mechanical Engineering Faculty of Engineering Istanbul University 34320 Avcilar Istanbul Turkey 2 Department of Mechatronics Engineering Faculty of Mechanical Engineering Yildiz Technical University Besiktas Istanbul Turkey
E-mail ytaskinistanbuledutr
Abstract Quarter car model is a simple and widely used mathematical model to analyze the vibration and control problem of vehicles In this study a quarter car test rig is modeled as a lumped parameter system Model parameters of the system are determined by measurements and experiments Forced vibration method is used to identify the stiffness and damping parameters of the lumped model A modal shaker is used to generate the road input in the test rig The accelerations of the road input sprung and unsprung masses are measured by piezoelectric accelerometers The frequency response functions are obtained by using acceleration data The identified parameters of the test rig are adjusted by comparing the experimental and simulation results
1 Introduction Quarter car model represents only the vertical motion of vehicle body and wheel Thus vertical dynamics of vehicles can be investigated easily by using this model A great deal of research has been carried out on improving ride comfort and road holding with quarter car models during last three decades [1-3] In addition to theoretical and numerical studies there have been several experimental studies realized during the same period of time [4-9]
In this paper a quarter car test rig which is constructed in laboratory environment is modeled as a lumped parameter system to determine system parameters Model parameters of the system are investigated by forced vibration method experiments using acceleration data
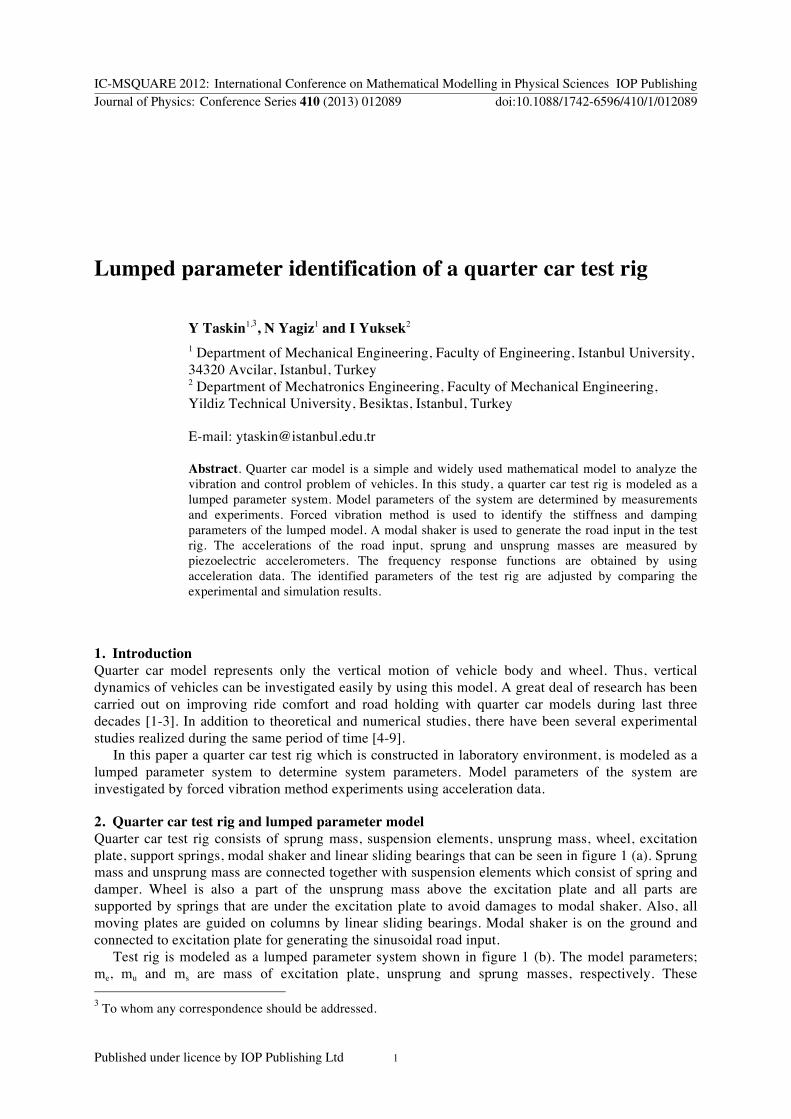
2 Quarter car test rig and lumped parameter model Quarter car test rig consists of sprung mass suspension elements unsprung mass wheel excitation plate support springs modal shaker and linear sliding bearings that can be seen in figure 1 (a) Sprung mass and unsprung mass are connected together with suspension elements which consist of spring and damper Wheel is also a part of the unsprung mass above the excitation plate and all parts are supported by springs that are under the excitation plate to avoid damages to modal shaker Also all moving plates are guided on columns by linear sliding bearings Modal shaker is on the ground and connected to excitation plate for generating the sinusoidal road input
Test rig is modeled as a lumped parameter system shown in figure 1 (b) The model parameters me mu and ms are mass of excitation plate unsprung and sprung masses respectively These 3 To whom any correspondence should be addressed
IC-MSQUARE 2012 International Conference on Mathematical Modelling in Physical Sciences IOP PublishingJournal of Physics Conference Series 410 (2013) 012089 doi1010881742-65964101012089
Published under licence by IOP Publishing Ltd 1
parameters are determined by measurements on a digital scale and are listed in table 1 bw bss bu bs and be are damping coefficients of wheel suspension system linear sliding bearings on unsprung mass sprung mass and excitation plate respectively ks kw and kss are stiffness coefficients of support springs wheel and suspension system respectively Damping and stiffness parameters are determined by forced vibration method which is explained in the following section F represents the sinusoidal excitation force that can be generated by modal shaker
(a) Quarter car test rig (b) Lumped parameter model
Figure 1 Test rig and model
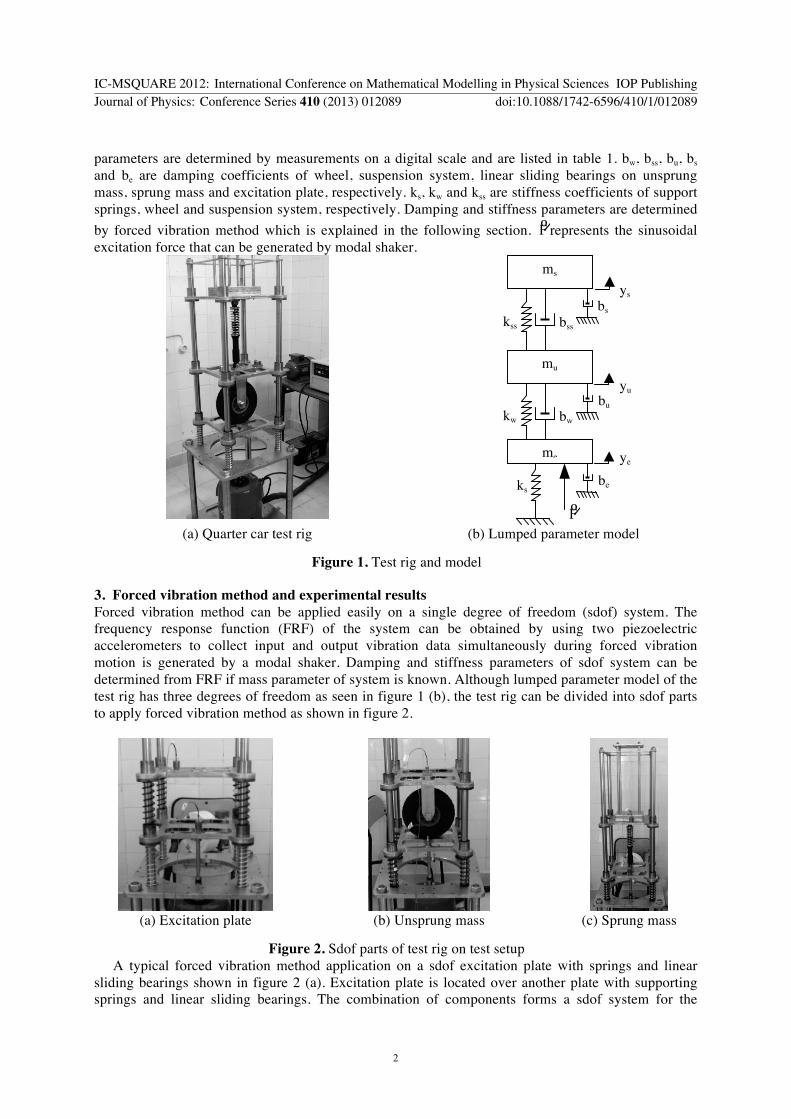
3 Forced vibration method and experimental results Forced vibration method can be applied easily on a single degree of freedom (sdof) system The frequency response function (FRF) of the system can be obtained by using two piezoelectric accelerometers to collect input and output vibration data simultaneously during forced vibration motion is generated by a modal shaker Damping and stiffness parameters of sdof system can be determined from FRF if mass parameter of system is known Although lumped parameter model of the test rig has three degrees of freedom as seen in figure 1 (b) the test rig can be divided into sdof parts to apply forced vibration method as shown in figure 2
(a) Excitation plate (b) Unsprung mass (c) Sprung mass
Figure 2 Sdof parts of test rig on test setup A typical forced vibration method application on a sdof excitation plate with springs and linear
sliding bearings shown in figure 2 (a) Excitation plate is located over another plate with supporting springs and linear sliding bearings The combination of components forms a sdof system for the
ms
mu
bss
ye
yu
ys
me
ks be
bu
bs
F
kss
bw kw
IC-MSQUARE 2012 International Conference on Mathematical Modelling in Physical Sciences IOP PublishingJournal of Physics Conference Series 410 (2013) 012089 doi1010881742-65964101012089
2
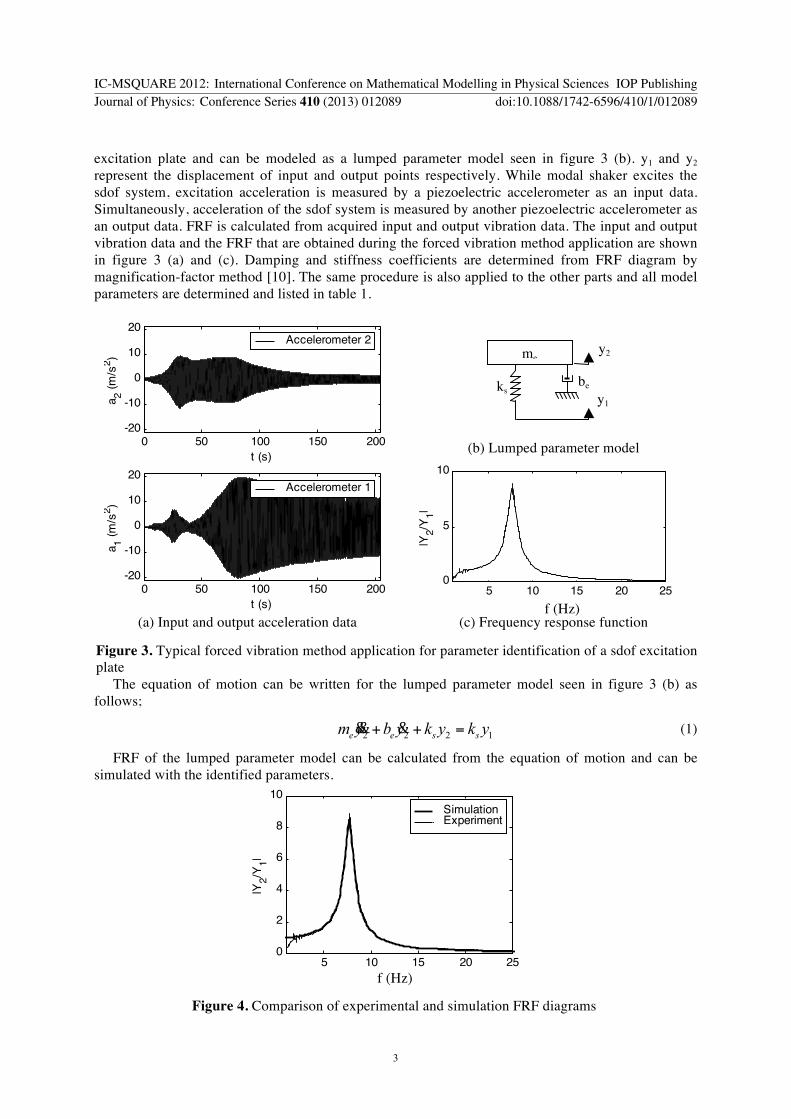
excitation plate and can be modeled as a lumped parameter model seen in figure 3 (b) y1 and y2 represent the displacement of input and output points respectively While modal shaker excites the sdof system excitation acceleration is measured by a piezoelectric accelerometer as an input data Simultaneously acceleration of the sdof system is measured by another piezoelectric accelerometer as an output data FRF is calculated from acquired input and output vibration data The input and output vibration data and the FRF that are obtained during the forced vibration method application are shown in figure 3 (a) and (c) Damping and stiffness coefficients are determined from FRF diagram by magnification-factor method [10] The same procedure is also applied to the other parts and all model parameters are determined and listed in table 1
0 50 100 150 200-20
-10
0
10
20
t (s)
a 1 (ms
2 )
0 50 100 150 200-20
-10
0
10
20
t (s)
a 2 (ms
2 )
Accelerometer 1
Accelerometer 2
(b) Lumped parameter model
5 10 15 20 250
5
10
f (Hz)
|Y2Y
1|
(a) Input and output acceleration data (c) Frequency response function
Figure 3 Typical forced vibration method application for parameter identification of a sdof excitation plate
The equation of motion can be written for the lumped parameter model seen in figure 3 (b) as follows
2 2 2 1e e s sm y b y k y k y+ + =ampamp amp (1)
FRF of the lumped parameter model can be calculated from the equation of motion and can be simulated with the identified parameters
5 10 15 20 250
2
4
6
8
10
f (Hz)
|Y2Y
1|
SimulationExperiment
Figure 4 Comparison of experimental and simulation FRF diagrams
y2 me
ks be
y1
f (Hz)
f (Hz)
IC-MSQUARE 2012 International Conference on Mathematical Modelling in Physical Sciences IOP PublishingJournal of Physics Conference Series 410 (2013) 012089 doi1010881742-65964101012089
3
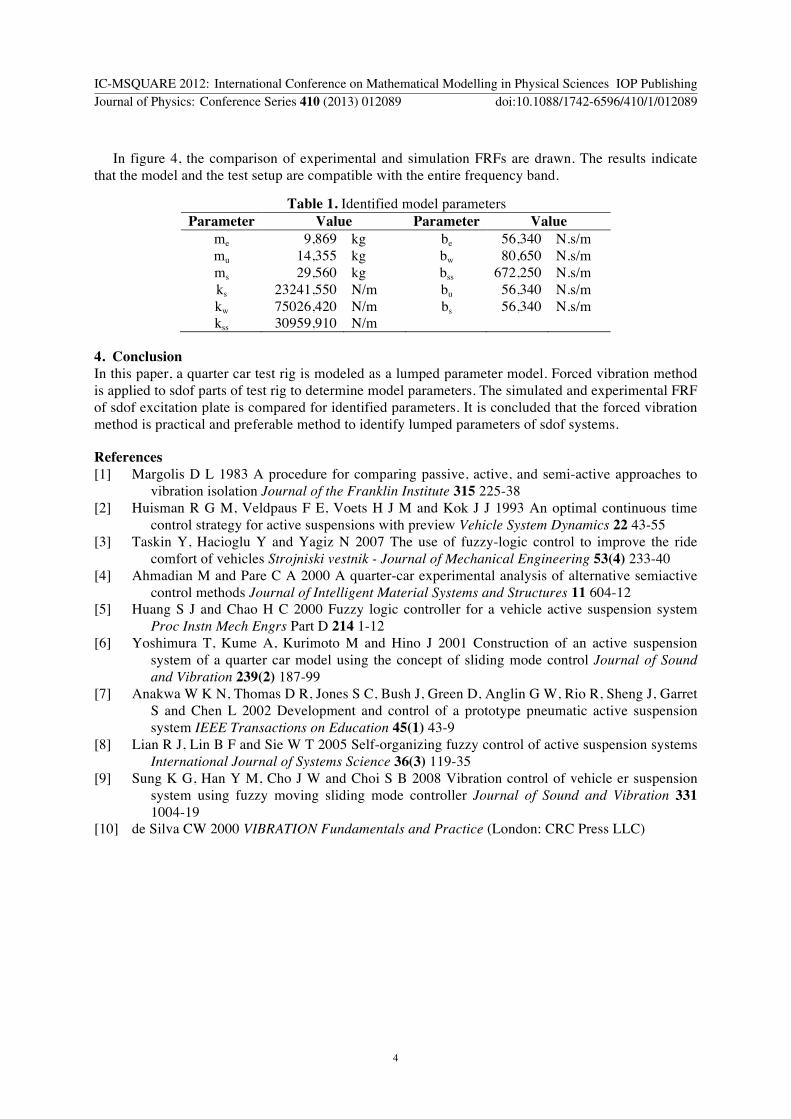
In figure 4 the comparison of experimental and simulation FRFs are drawn The results indicate that the model and the test setup are compatible with the entire frequency band
Table 1 Identified model parameters Parameter Value Parameter Value
me 9869 kg be 56340 Nsm mu 14355 kg bw 80650 Nsm ms 29560 kg bss 672250 Nsm ks
23241550 Nm bu 56340 Nsm kw 75026420 Nm bs 56340 Nsm kss 30959910 Nm
4 Conclusion In this paper a quarter car test rig is modeled as a lumped parameter model Forced vibration method is applied to sdof parts of test rig to determine model parameters The simulated and experimental FRF of sdof excitation plate is compared for identified parameters It is concluded that the forced vibration method is practical and preferable method to identify lumped parameters of sdof systems
References [1] Margolis D L 1983 A procedure for comparing passive active and semi-active approaches to
vibration isolation Journal of the Franklin Institute 315 225-38 [2] Huisman R G M Veldpaus F E Voets H J M and Kok J J 1993 An optimal continuous time
control strategy for active suspensions with preview Vehicle System Dynamics 22 43-55 [3] Taskin Y Hacioglu Y and Yagiz N 2007 The use of fuzzy-logic control to improve the ride
comfort of vehicles Strojniski vestnik - Journal of Mechanical Engineering 53(4) 233-40 [4] Ahmadian M and Pare C A 2000 A quarter-car experimental analysis of alternative semiactive
control methods Journal of Intelligent Material Systems and Structures 11 604-12 [5] Huang S J and Chao H C 2000 Fuzzy logic controller for a vehicle active suspension system
Proc Instn Mech Engrs Part D 214 1-12 [6] Yoshimura T Kume A Kurimoto M and Hino J 2001 Construction of an active suspension
system of a quarter car model using the concept of sliding mode control Journal of Sound and Vibration 239(2) 187-99
[7] Anakwa W K N Thomas D R Jones S C Bush J Green D Anglin G W Rio R Sheng J Garret S and Chen L 2002 Development and control of a prototype pneumatic active suspension system IEEE Transactions on Education 45(1) 43-9
[8] Lian R J Lin B F and Sie W T 2005 Self-organizing fuzzy control of active suspension systems International Journal of Systems Science 36(3) 119-35
[9] Sung K G Han Y M Cho J W and Choi S B 2008 Vibration control of vehicle er suspension system using fuzzy moving sliding mode controller Journal of Sound and Vibration 331 1004-19
[10] de Silva CW 2000 VIBRATION Fundamentals and Practice (London CRC Press LLC)
IC-MSQUARE 2012 International Conference on Mathematical Modelling in Physical Sciences IOP PublishingJournal of Physics Conference Series 410 (2013) 012089 doi1010881742-65964101012089
4
Lumped parameter identification of a quarter car test rig
Y Taskin13 N Yagiz1 and I Yuksek2 1 Department of Mechanical Engineering Faculty of Engineering Istanbul University 34320 Avcilar Istanbul Turkey 2 Department of Mechatronics Engineering Faculty of Mechanical Engineering Yildiz Technical University Besiktas Istanbul Turkey
E-mail ytaskinistanbuledutr
Abstract Quarter car model is a simple and widely used mathematical model to analyze the vibration and control problem of vehicles In this study a quarter car test rig is modeled as a lumped parameter system Model parameters of the system are determined by measurements and experiments Forced vibration method is used to identify the stiffness and damping parameters of the lumped model A modal shaker is used to generate the road input in the test rig The accelerations of the road input sprung and unsprung masses are measured by piezoelectric accelerometers The frequency response functions are obtained by using acceleration data The identified parameters of the test rig are adjusted by comparing the experimental and simulation results
1 Introduction Quarter car model represents only the vertical motion of vehicle body and wheel Thus vertical dynamics of vehicles can be investigated easily by using this model A great deal of research has been carried out on improving ride comfort and road holding with quarter car models during last three decades [1-3] In addition to theoretical and numerical studies there have been several experimental studies realized during the same period of time [4-9]
In this paper a quarter car test rig which is constructed in laboratory environment is modeled as a lumped parameter system to determine system parameters Model parameters of the system are investigated by forced vibration method experiments using acceleration data
2 Quarter car test rig and lumped parameter model Quarter car test rig consists of sprung mass suspension elements unsprung mass wheel excitation plate support springs modal shaker and linear sliding bearings that can be seen in figure 1 (a) Sprung mass and unsprung mass are connected together with suspension elements which consist of spring and damper Wheel is also a part of the unsprung mass above the excitation plate and all parts are supported by springs that are under the excitation plate to avoid damages to modal shaker Also all moving plates are guided on columns by linear sliding bearings Modal shaker is on the ground and connected to excitation plate for generating the sinusoidal road input
Test rig is modeled as a lumped parameter system shown in figure 1 (b) The model parameters me mu and ms are mass of excitation plate unsprung and sprung masses respectively These 3 To whom any correspondence should be addressed
IC-MSQUARE 2012 International Conference on Mathematical Modelling in Physical Sciences IOP PublishingJournal of Physics Conference Series 410 (2013) 012089 doi1010881742-65964101012089
Published under licence by IOP Publishing Ltd 1
parameters are determined by measurements on a digital scale and are listed in table 1 bw bss bu bs and be are damping coefficients of wheel suspension system linear sliding bearings on unsprung mass sprung mass and excitation plate respectively ks kw and kss are stiffness coefficients of support springs wheel and suspension system respectively Damping and stiffness parameters are determined by forced vibration method which is explained in the following section F represents the sinusoidal excitation force that can be generated by modal shaker
(a) Quarter car test rig (b) Lumped parameter model
Figure 1 Test rig and model
3 Forced vibration method and experimental results Forced vibration method can be applied easily on a single degree of freedom (sdof) system The frequency response function (FRF) of the system can be obtained by using two piezoelectric accelerometers to collect input and output vibration data simultaneously during forced vibration motion is generated by a modal shaker Damping and stiffness parameters of sdof system can be determined from FRF if mass parameter of system is known Although lumped parameter model of the test rig has three degrees of freedom as seen in figure 1 (b) the test rig can be divided into sdof parts to apply forced vibration method as shown in figure 2
(a) Excitation plate (b) Unsprung mass (c) Sprung mass
Figure 2 Sdof parts of test rig on test setup A typical forced vibration method application on a sdof excitation plate with springs and linear
sliding bearings shown in figure 2 (a) Excitation plate is located over another plate with supporting springs and linear sliding bearings The combination of components forms a sdof system for the
ms
mu
bss
ye
yu
ys
me
ks be
bu
bs
F
kss
bw kw
IC-MSQUARE 2012 International Conference on Mathematical Modelling in Physical Sciences IOP PublishingJournal of Physics Conference Series 410 (2013) 012089 doi1010881742-65964101012089
2
excitation plate and can be modeled as a lumped parameter model seen in figure 3 (b) y1 and y2 represent the displacement of input and output points respectively While modal shaker excites the sdof system excitation acceleration is measured by a piezoelectric accelerometer as an input data Simultaneously acceleration of the sdof system is measured by another piezoelectric accelerometer as an output data FRF is calculated from acquired input and output vibration data The input and output vibration data and the FRF that are obtained during the forced vibration method application are shown in figure 3 (a) and (c) Damping and stiffness coefficients are determined from FRF diagram by magnification-factor method [10] The same procedure is also applied to the other parts and all model parameters are determined and listed in table 1
0 50 100 150 200-20
-10
0
10
20
t (s)
a 1 (ms
2 )
0 50 100 150 200-20
-10
0
10
20
t (s)
a 2 (ms
2 )
Accelerometer 1
Accelerometer 2
(b) Lumped parameter model
5 10 15 20 250
5
10
f (Hz)
|Y2Y
1|
(a) Input and output acceleration data (c) Frequency response function
Figure 3 Typical forced vibration method application for parameter identification of a sdof excitation plate
The equation of motion can be written for the lumped parameter model seen in figure 3 (b) as follows
2 2 2 1e e s sm y b y k y k y+ + =ampamp amp (1)
FRF of the lumped parameter model can be calculated from the equation of motion and can be simulated with the identified parameters
5 10 15 20 250
2
4
6
8
10
f (Hz)
|Y2Y
1|
SimulationExperiment
Figure 4 Comparison of experimental and simulation FRF diagrams
y2 me
ks be
y1
f (Hz)
f (Hz)
IC-MSQUARE 2012 International Conference on Mathematical Modelling in Physical Sciences IOP PublishingJournal of Physics Conference Series 410 (2013) 012089 doi1010881742-65964101012089
3
In figure 4 the comparison of experimental and simulation FRFs are drawn The results indicate that the model and the test setup are compatible with the entire frequency band
Table 1 Identified model parameters Parameter Value Parameter Value
me 9869 kg be 56340 Nsm mu 14355 kg bw 80650 Nsm ms 29560 kg bss 672250 Nsm ks
23241550 Nm bu 56340 Nsm kw 75026420 Nm bs 56340 Nsm kss 30959910 Nm
4 Conclusion In this paper a quarter car test rig is modeled as a lumped parameter model Forced vibration method is applied to sdof parts of test rig to determine model parameters The simulated and experimental FRF of sdof excitation plate is compared for identified parameters It is concluded that the forced vibration method is practical and preferable method to identify lumped parameters of sdof systems
References [1] Margolis D L 1983 A procedure for comparing passive active and semi-active approaches to
vibration isolation Journal of the Franklin Institute 315 225-38 [2] Huisman R G M Veldpaus F E Voets H J M and Kok J J 1993 An optimal continuous time
control strategy for active suspensions with preview Vehicle System Dynamics 22 43-55 [3] Taskin Y Hacioglu Y and Yagiz N 2007 The use of fuzzy-logic control to improve the ride
comfort of vehicles Strojniski vestnik - Journal of Mechanical Engineering 53(4) 233-40 [4] Ahmadian M and Pare C A 2000 A quarter-car experimental analysis of alternative semiactive
control methods Journal of Intelligent Material Systems and Structures 11 604-12 [5] Huang S J and Chao H C 2000 Fuzzy logic controller for a vehicle active suspension system
Proc Instn Mech Engrs Part D 214 1-12 [6] Yoshimura T Kume A Kurimoto M and Hino J 2001 Construction of an active suspension
system of a quarter car model using the concept of sliding mode control Journal of Sound and Vibration 239(2) 187-99
[7] Anakwa W K N Thomas D R Jones S C Bush J Green D Anglin G W Rio R Sheng J Garret S and Chen L 2002 Development and control of a prototype pneumatic active suspension system IEEE Transactions on Education 45(1) 43-9
[8] Lian R J Lin B F and Sie W T 2005 Self-organizing fuzzy control of active suspension systems International Journal of Systems Science 36(3) 119-35
[9] Sung K G Han Y M Cho J W and Choi S B 2008 Vibration control of vehicle er suspension system using fuzzy moving sliding mode controller Journal of Sound and Vibration 331 1004-19
[10] de Silva CW 2000 VIBRATION Fundamentals and Practice (London CRC Press LLC)
IC-MSQUARE 2012 International Conference on Mathematical Modelling in Physical Sciences IOP PublishingJournal of Physics Conference Series 410 (2013) 012089 doi1010881742-65964101012089
4