Embed Size (px)
Citation preview

Lunar opposition effect as inferred from Chandrayaan-1M3 data
Vadym Kaydash,1 Carle Pieters,2 Yuriy Shkuratov,1 and Viktor Korokhin1
Received 16 December 2012; revised 9 April 2013; accepted 16 May 2013.
[1] The shadow-hiding and coherent backscattering enhancement mechanisms areconsidered to be the major contributors to the brightness opposition effect of the Moon.However, the actual proportions of the mechanisms at different phase angles still remain notwell determined. In order to assess the lunar phase function across small phase angles, weutilize imaging spectrometer data acquired by the Moon Mineralogy Mapper (M3) onboardthe Chandrayaan-1 spacecraft. We calculated phase functions of apparent reflectance andcolor ratios in the wavelength range 541–2976 nm for several mare and highland areas. Asinferred from changes in the wavelength dependence of the phase curves, the shadow-hidingeffect is a major component of the brightness opposition surge at phase angle> 2�. Thecoherent backscattering enhancement may contribute some to the opposition effect at phaseangles< 2�. We found nonmonotonic behavior of color-ratio phase curves that reveal theminimum at ~ 2–4�. Using lunar observations, this is the first reliable evidence of thecolorimetric opposition effect found earlier for lunar samples.
Citation: Kaydash, V., C. Pieters, Y. Shkuratov, and V. Korokhin (2013), Lunar opposition effect as inferred fromChandrayaan-1M3 data, J. Geophys. Res. Planets, 118, doi:10.1002/jgre.20098.
1. Introduction
[2] The brightness dependence on phase angle a (phasefunction f(a)) carries information about the surface composi-tion and microstructure, and therefore photometry is used tostudy the Moon with telescopic and orbital spectrophotomet-ric surveys [Muinonen et al., 2011; Shkuratov et al., 2011;Hapke et al., 2012]. Among the remarkable photometricproperties of the Moon is the strong backscattering or bright-ness opposition effect (BOE). This fairly wide backscatteringsurge of the Moon at phase angles a ≤ 7� can be caused bythree lightscattering phenomena: (1) single particle scat-tering, (2) shadow-hiding phenomenon with incoherentmultiple scattering, and (3) the coherent backscattering en-hancement [e.g., Shkuratov et al., 2012].[3] The phase functions of single particles typically have a
small backscatter lobe if the particle is not too small ascompared to wavelength. Usually, the backscattering surgesof aggregated or irregularly shaped particles have a widthnearly 15� and amplitude ~ 1.5 [e.g., Zubko et al., 2008].The second phenomenon relates to shadows cast by regolithparticles on each other and incoherent multiple scattering thatreduces the shadows. The third phenomenon results fromconstructive interference of rays propagating in a particulatemedia along direct and time reversal trajectories. When a
approaches zero the constructive interference obtains a pref-erence, which produces a backscattering spike if single scat-tering albedo is high enough to generate multiple scattering[e.g., Shkuratov et al., 2011, 2012]. Each of the three phe-nomena depends on physical properties of the regolith, suchas its porosity and sizes of particles. Thus, it is important tointerpret photometric measurements in terms of which mech-anism dominates the lunar BOE [e.g., Shkuratov et al., 2011,2012; Hapke et al., 2012].[4] The Moon is not observed from the Earth at a< 1� out
of eclipse, thus studies of the BOE were substantially in-tensified after retrieving data from orbital surveys of thelast decades, e.g., Clementine, SMART-1, Chandrayaan-1,Kaguya, Change’E-2, and Lunar Reconnaissance Orbiter(LRO). Comparison of the reports on the space-derivedphotometry obtained by several groups of researchers revealsrather contradictory results. The conclusion by Buratti et al.[1996] on the main cause of the lunar opposition surge(0–5�) was thought to be due to the shadow-hiding phenom-enon while the coherent backscattering effect plays only aminor contribution. Also, Hillier et al. [1999] deduced thatonly a small coherent backscatter component exists for thebrightest regions over the 0.75–1.00mm wavelength range.Hapke et al. [1998] and Helfenstein et al. [1997] found thecontribution of coherent backscatter enhancement to be sig-nificant at phase angles< 5�. Kreslavsky et al. [2001]reported that the coherent component manifests itself onlyin the near-infrared (NIR) range where lunar albedo is highenough [see also Shkuratov et al., 2012].[5] Recent analysis of the LRO data for highland regions
by Hapke et al. [2012] showed that the coherent backscatterenhancement contributes nearly 40% in the UV, increasingto over 60% in the red. A significant contribution of this en-hancement to the BOE at a< 10� is also assessed inMuinonen et al. [2011]. Thus, several authors concluded that
1Astronomical Institute of Kharkov V.N. Karazin National University,Kharkov, Ukraine.
2Department of Geological Sciences, Brown University, Providence,Rhode Island, USA.
Corresponding author: V. Kaydash, Astronomical Institute of KharkovV.N. Karazin National University, Sumskaya 35, Kharkov 61022, Ukraine.([email protected])
©2013. American Geophysical Union. All Rights Reserved.2169-9097/13/10.1002/jgre.20098
1
JOURNAL OF GEOPHYSICAL RESEARCH: PLANETS, VOL. 118, 1–12, doi:10.1002/jgre.20098, 2013

the BOE contains a large component of coherent backscatter-ing. On the other hand, a significant dependence of the angu-lar width of the BOE on wavelength, which was theoreticallypredicted, has not been found [Hapke et al., 2012]. Previousstudies of the wavelength dependence of the BOE angularwidth over a range of 415–1000 nm [Buratti et al., 1996;Hillier et al., 1999; Shkuratov et al., 1999; Kreslavskyet al., 2000] also did not detect wavelength dependence.Shkuratov et al. [2011, 2012] summarizing results of lunarBOE studies noted that to estimate the contributions of theshadowing and coherent enhancement phenomena to thebackscattering peak at each phase angle is a difficult prob-lem, even if theoretical models easily provide this. Theproblem is that models, using the coherent backscatteringeffect in an ad hoc manner, can force the effect to com-pensate for shortcomings of other model components toachieve the best fit.[6] There is even a point of view presented recently by
Hapke et al. [2012]: “our current understanding of the coher-ent backscatter opposition effect is incomplete orperhaps incorrect.”[7] Thus, we may conclude that a detailed study of the
lunar phase function in a wide spectral range at angles a< 5�is crucial for the testing of the BOE mechanisms andassessing the physical properties of the lunar surface. In thispaper, we utilize spectral image cubes acquired by theChandrayaan-1 Moon Mineralogy Mapper (M3) in a spectralrange 541–2976 nm to estimate the wavelength dependenceof the lunar phase function at small phase angles.
2. M3 Data Used
2.1. General Description
[8] The M3 is an imaging spectrometer, which was se-lected as a NASA Discovery Mission of Opportunity in2005 and was launched on 22 October 2008 on board theChandrayaan-1 spacecraft of the Indian Space ResearchOrganization [Pieters et al., 2009]. The M3 instrument
operates as a pushbroom imaging spectrometer with a fieldof view of 24�. Key spectral and radiometric characteristicsof the instrument are the following: (1) spectra are measuredin the 430–3000 nm range with 10 nm constant sampling andFWHM< 15 nm (low-resolution mode combines twicelower spatial and 20–40 nm spectral resolution), (2) 12 bitssampling dynamic range, (3) response linear to 1%, (4) abso-lute accuracy within 10%, and (5) SNR> 400 when imagingequatorial regions [Lundeen et al., 2011; Green et al., 2011].Optimal surface lighting at image acquisition and numeroustechnical challenges during the flight limited the entire orbitalsurvey to several optical periods. Each period is character-ized by different spatial coverage, illumination/observationgeometry, and spatial resolution [Lundeen et al., 2011;Boardman et al., 2011]. Mostly nadir observations werecarried out in the low-resolution mode during the mission.[9] Science data calibration for M3 includes a sequence of
processing algorithms applied to calibrate downlinked dataspectrally, radiometrically, and spatially [Green et al.,2011]. The M3 Level 1b calibration algorithm converts themeasured raw digital numbers to spectral radiance units ofspatially coregistered images of each wavelength, calculatingthe surface coordinates and illumination/observation geome-try of all pixels. The M3 Level 2 processing converts the at-sensor radiance data (Level 1b) to radiance factor values atan incidence angle i of 30� and an emission angle e of 0�.This level includes a photometric correction, an algorithmfor removing the thermal contribution to spectra (mainly after2000 nm for warm regions), and an optional Ground Truthcorrection based on laboratory spectra of the mature highlandsoil 62231 from the Apollo 16 landing site [Lundeen et al.,2011]. The Ground Truth calibration allows one, for in-stance, to relate M3 and Clementine UV-Vis data. This paperdoes not exploit this calibration. We used M3 images radio-metrically calibrated in spectral radiance (W/m2/mm/sr), thenconverted into radiance factor values, applying the thermalcorrection. The M3 images we used are publicly availablein the Planetary Data System at http://pds-imaging.jpl.nasa.gov/data/m3/.[10] The data presented here were acquired in the M3
Global Mode; thus, they are of a lower spectral resolutionthan in the M3 Target Mode. Taking into account the elimina-tion of degraded spectral channels [Lundeen et al., 2011],there are in total 83 usable spectral bands from 540.84 to2976.2 nm with a spectral resolution of 20 nm for the bandsfrom 730 to 1548 nm and 40 nm for other spectral ranges.
2.2. Source M3 Data
[11] In the current study, we focus on M3 images with theso-called opposition geometry (i.e., at a ~ 0). Because of thenear nadir-looking mode (e~ 0), this illumination/observationgeometry naturally occurs at the near-equatorial regions ofthe Moon, where i ~ 0. Among several optical periods ofthe mission only the period OP2C1 (20 May to 23 June2009) satisfies the required opposition geometry along withlarge coverage of the Moon. All M3 images of the OP2C1are taken in the low-resolution Global imaging mode at280m/pixel [Lundeen et al., 2011].[12] Figure 1 presents a portion of the M3 mosaic for the re-
flectance (radiance factor) at a wavelength l= 1489 nm. Thisis adopted from http://target.lroc.asu.edu/da/qmap.html. Thedata resulted from OP2C1 images calibrated with the Level
Figure 1. A portion of M3 reflectance mosaic at 1489 nmrendered at 125m/pixel. Observations within the optical pe-riod OP2C1 are used. Mosaic was provided by BrownUniversity / ACT Corporation. Opposition spots are markedwith arrows.
KAYDASH ET AL.: LUNAR OPPOSITION EFFECT FROM M3
2
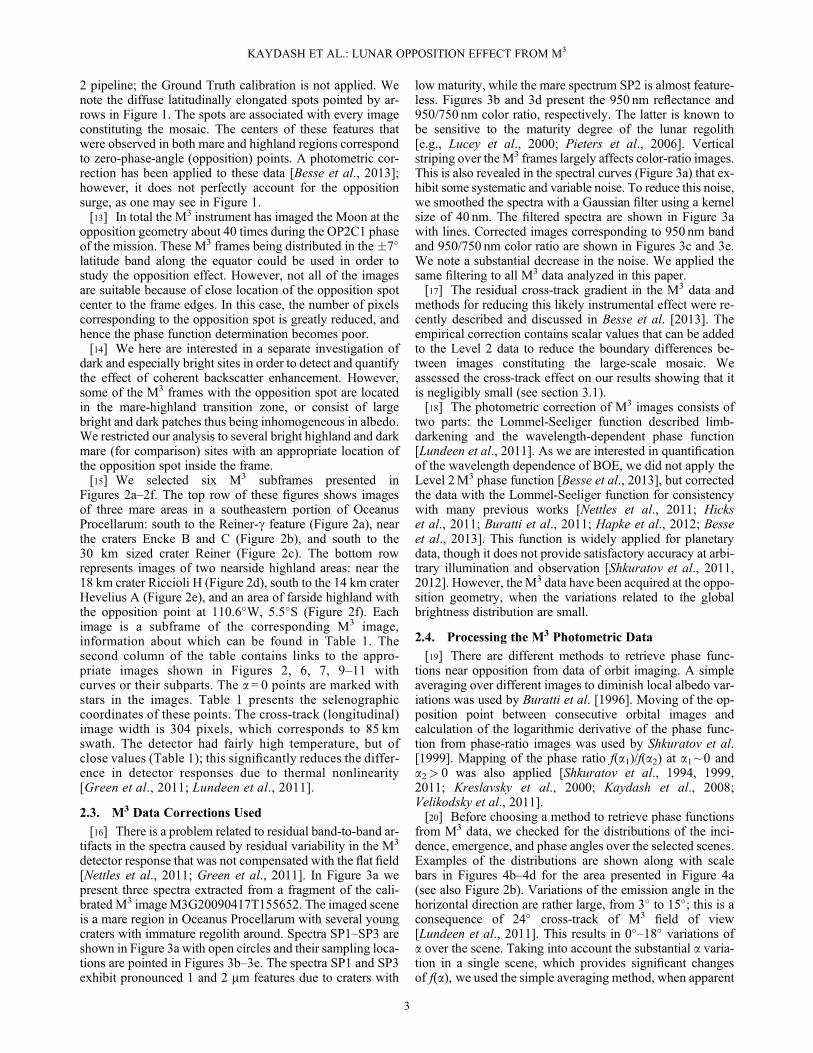
2 pipeline; the Ground Truth calibration is not applied. Wenote the diffuse latitudinally elongated spots pointed by ar-rows in Figure 1. The spots are associated with every imageconstituting the mosaic. The centers of these features thatwere observed in both mare and highland regions correspondto zero-phase-angle (opposition) points. A photometric cor-rection has been applied to these data [Besse et al., 2013];however, it does not perfectly account for the oppositionsurge, as one may see in Figure 1.[13] In total the M3 instrument has imaged the Moon at the
opposition geometry about 40 times during the OP2C1 phaseof the mission. These M3 frames being distributed in the�7�latitude band along the equator could be used in order tostudy the opposition effect. However, not all of the imagesare suitable because of close location of the opposition spotcenter to the frame edges. In this case, the number of pixelscorresponding to the opposition spot is greatly reduced, andhence the phase function determination becomes poor.[14] We here are interested in a separate investigation of
dark and especially bright sites in order to detect and quantifythe effect of coherent backscatter enhancement. However,some of the M3 frames with the opposition spot are locatedin the mare-highland transition zone, or consist of largebright and dark patches thus being inhomogeneous in albedo.We restricted our analysis to several bright highland and darkmare (for comparison) sites with an appropriate location ofthe opposition spot inside the frame.[15] We selected six M3 subframes presented in
Figures 2a–2f. The top row of these figures shows imagesof three mare areas in a southeastern portion of OceanusProcellarum: south to the Reiner-g feature (Figure 2a), nearthe craters Encke B and C (Figure 2b), and south to the30 km sized crater Reiner (Figure 2c). The bottom rowrepresents images of two nearside highland areas: near the18 km crater Riccioli H (Figure 2d), south to the 14 km craterHevelius A (Figure 2e), and an area of farside highland withthe opposition point at 110.6�W, 5.5�S (Figure 2f). Eachimage is a subframe of the corresponding M3 image,information about which can be found in Table 1. Thesecond column of the table contains links to the appro-priate images shown in Figures 2, 6, 7, 9–11 withcurves or their subparts. The a = 0 points are marked withstars in the images. Table 1 presents the selenographiccoordinates of these points. The cross-track (longitudinal)image width is 304 pixels, which corresponds to 85 kmswath. The detector had fairly high temperature, but ofclose values (Table 1); this significantly reduces the differ-ence in detector responses due to thermal nonlinearity[Green et al., 2011; Lundeen et al., 2011].
2.3. M3 Data Corrections Used
[16] There is a problem related to residual band-to-band ar-tifacts in the spectra caused by residual variability in the M3
detector response that was not compensated with the flat field[Nettles et al., 2011; Green et al., 2011]. In Figure 3a wepresent three spectra extracted from a fragment of the cali-brated M3 imageM3G20090417T155652. The imaged sceneis a mare region in Oceanus Procellarum with several youngcraters with immature regolith around. Spectra SP1–SP3 areshown in Figure 3a with open circles and their sampling loca-tions are pointed in Figures 3b–3e. The spectra SP1 and SP3exhibit pronounced 1 and 2 mm features due to craters with
low maturity, while the mare spectrum SP2 is almost feature-less. Figures 3b and 3d present the 950 nm reflectance and950/750 nm color ratio, respectively. The latter is known tobe sensitive to the maturity degree of the lunar regolith[e.g., Lucey et al., 2000; Pieters et al., 2006]. Verticalstriping over theM3 frames largely affects color-ratio images.This is also revealed in the spectral curves (Figure 3a) that ex-hibit some systematic and variable noise. To reduce this noise,we smoothed the spectra with a Gaussian filter using a kernelsize of 40 nm. The filtered spectra are shown in Figure 3awith lines. Corrected images corresponding to 950 nm bandand 950/750 nm color ratio are shown in Figures 3c and 3e.We note a substantial decrease in the noise. We applied thesame filtering to all M3 data analyzed in this paper.[17] The residual cross-track gradient in the M3 data and
methods for reducing this likely instrumental effect were re-cently described and discussed in Besse et al. [2013]. Theempirical correction contains scalar values that can be addedto the Level 2 data to reduce the boundary differences be-tween images constituting the large-scale mosaic. Weassessed the cross-track effect on our results showing that itis negligibly small (see section 3.1).[18] The photometric correction of M3 images consists of
two parts: the Lommel-Seeliger function described limb-darkening and the wavelength-dependent phase function[Lundeen et al., 2011]. As we are interested in quantificationof the wavelength dependence of BOE, we did not apply theLevel 2M3 phase function [Besse et al., 2013], but correctedthe data with the Lommel-Seeliger function for consistencywith many previous works [Nettles et al., 2011; Hickset al., 2011; Buratti et al., 2011; Hapke et al., 2012; Besseet al., 2013]. This function is widely applied for planetarydata, though it does not provide satisfactory accuracy at arbi-trary illumination and observation [Shkuratov et al., 2011,2012]. However, the M3 data have been acquired at the oppo-sition geometry, when the variations related to the globalbrightness distribution are small.
2.4. Processing the M3 Photometric Data
[19] There are different methods to retrieve phase func-tions near opposition from data of orbit imaging. A simpleaveraging over different images to diminish local albedo var-iations was used by Buratti et al. [1996]. Moving of the op-position point between consecutive orbital images andcalculation of the logarithmic derivative of the phase func-tion from phase-ratio images was used by Shkuratov et al.[1999]. Mapping of the phase ratio f(a1)/f(a2) at a1 ~ 0 anda2> 0 was also applied [Shkuratov et al., 1994, 1999,2011; Kreslavsky et al., 2000; Kaydash et al., 2008;Velikodsky et al., 2011].[20] Before choosing a method to retrieve phase functions
from M3 data, we checked for the distributions of the inci-dence, emergence, and phase angles over the selected scenes.Examples of the distributions are shown along with scalebars in Figures 4b–4d for the area presented in Figure 4a(see also Figure 2b). Variations of the emission angle in thehorizontal direction are rather large, from 3� to 15�; this is aconsequence of 24� cross-track of M3 field of view[Lundeen et al., 2011]. This results in 0�–18� variations ofa over the scene. Taking into account the substantial a varia-tion in a single scene, which provides significant changesof f(a), we used the simple averaging method, when apparent
KAYDASH ET AL.: LUNAR OPPOSITION EFFECT FROM M3
3

reflectance values are averaged over an image in concentricelliptical bins of constant phase angles. When averaging thereflectance we have masked mare and highland craters, lowreflectance areas (for highlands), and bright features in mareareas, e.g., the Reiner-g formation. Maps of masked areasare presented in the right subimages of Figures 2a–2f.
The maps are initially produced with a filter that exagger-ates local albedo contrasts calculating the second derivativein the central pixel of a small window sliding over theimages. This procedure effectively filters out tiny craters,steep-slope details, bright rays, etc. Then we have outlinedmanually large objects that disturb albedo homogeneity
Figure 2. Six areas under study: (a, b, c) upper row and (d, e, f) lower row present mare and highlandareas, respectively. The left part of Figures 2a–2f presents reflectance at 1489 nm and the right part thecorresponding distributions of masked pixels. Opposition spots are marked with stars. North is up, westto right elsewhere in the images. The M3 image numbers and coordinates of zero-phase angle spots aregiven in the Table 1.
Table 1. The M3 Images Selected; All of Them Were Acquired in the Suboptical Period OP2C1
M3 Image IDMare/Highland
(Figures 2, 6, 7, 9–11) Detector T�KOpposition PointLongitude, (�)
Opposition PointLatitude, (�)
M3G20090613T032520 Mare (a) 164.96 �58.7 3M3G20090611T090220 Mare (b) 164.12 �35 �2.5M3G20090612T183813 Mare (c) 165.3 �54.1 3.5M3G20090614T090712 Highland (d) 165.9 �75.3 1.0M3G20090613T200943 Highland (e) 165.38 �68.2 1.6M3G20090617T005342 Highland (f) 168.71 �110.6 �5.5
KAYDASH ET AL.: LUNAR OPPOSITION EFFECT FROM M3
4

Figure 3. Examples of the spectra extracted from calibrated M3 image M3G20090417T155652 (acquiredat 17 April 2009, detector temperature is 147.03 �K, a = 60�). (a) Spectra SP1–SP3: open circles presentLevel 2 calibrated data, lines are the same after the Gaussian filtering. (b and c) Radiance factor atl = 950 nm before and after the Gaussian filtering. (d and e) Same for the color ratio 950/750 nm. TheSP1–SP3 sampling locations are pointed with circles in images. The dynamic range of pairs Figures 3b,3c and 3d, 3e is the same. The center of the area shown in Figures 3b–3e is located at 325.06�W, 5.2�S.
KAYDASH ET AL.: LUNAR OPPOSITION EFFECT FROM M3
5

Figure 4. Distributions of photometric angles over the selected part of the M3 imageM3G20090611T090220 (Figure 2b). (a–d) Apparent reflectance at 1489nm, incidence angle i, emission anglee, and phase angle a. Angle ranges in degrees are shown in scale bars. The opposition point is markedwith stars.
Figure 5. (a) A sketch of the division of a subframe (see Figure 2a) into four quadrangles in the probablepoint a = 0. Filled circle marks the opposition point as inferred from the geometry of illumination andobservation supplied with the Level 1b calibrated data. Star marks the point calculated in the currentstudy. The distance between these points is ~10 km. (b) Phase curves for Figure 5a calculated in fourquadrangles. Q1, Q2, Q3, and Q4 curves are derived for corresponding quadrangles. Curves markedwith “supplied” are derived for location of zero-phase point from supplied M3 geometry information,curves marked “calculated” are derived for calculated location of zero-phase point.
KAYDASH ET AL.: LUNAR OPPOSITION EFFECT FROM M3
6

over the scene, e.g., Reiner-g (Figure 2a), dark units, craters(Riccioli H in highland scene, see Figure 2d) etc. Some ofthe band-to-band artifacts in the M3 spectra caused bythe residual variability in detector response are seen asthin along-track vertical strips. We applied to the M3 data
a procedure, which largely reduces this variability,though some strips remain not entirely compensated.These objects also are manually outlined in frame masks(e.g., Figures 2a and 2c).[21] The reflectance averaging in concentric elliptical bins
of constant a requires obviously the true location of opposi-tion point. We checked whether the actual location of thepoint as inferred from the reflectance images is consistent withthe zero-phase-angle point obtained from the illumination/observation geometry supplied with the Level 1b calibration.We averaged reflectance in the bins of constant a in fourquadrangles that are produced by crossing the image by ver-tical and horizontal lines intersecting in the probable opposi-tion point (Figure 5a). If the point coincides with the actualopposition point, then the four phase curves f(a) should max-imally coincide with each other. We searched for the mostprobable center of the opposition spot in the neighborhoodof the visible opposition spot each time calculating fourphase curves comparing them. An example of calculationof the actual zero-phase-angle point from the M3 reflectancedata is given in Figure 5b. Phase curves in the upper plot ofFigure 5b are derived with location of zero-phase point fromsupplied M3 geometry information; phase curves in the lowerplot are derived with location of the point as inferred from thereflectance images. We note that for all six sites the coinci-dence of Q1..Q4 phase curves is better for calculated valuesof zero-phase point than for one supplied with M3 calibrateddata. In such a way for the six scenes under study we foundshifts between the calculated and supplied opposition points.We introduced the shifts to the spatial distributions of i, e,and a before calculations of the phase dependences of radi-ance factor. The shifts vary from 3 to 10 km with major
Figure 6. Spectra of radiance factor for the six analyzedsites. Spectral intensities are derived by averaging pixel valuesin the phase angle bin centered at a =10�. The bars for eachspectrum are equal to the standard deviation of albedo varia-tions in a selected bin.
Figure 7. Phase functions for areas shown in Figures 2a–2f. (a–c) Mare and (d–f) highland sites. Eachcurve is normalized on its own value at a = 10�. (g) For the rainbow-style color coding all 83 curves fromthe wavelength range 541–2976 nm are used.
KAYDASH ET AL.: LUNAR OPPOSITION EFFECT FROM M3
7

components oriented along-track. We consider that theseshifts are owing to a problem with the Chandrayaan-1pointing after both star trackers were lost and the orbit alti-tude was raised [Boardman et al., 2011; Lundeen et al.,2011]. The finally determined opposition points are markedby stars in Figures 2a–2f and listed in Table 1.[22] Phase curves were sampled in every 0.3� with a bin
width of 0.3�. The first sampling bin including the oppositionpoint integrates all pixels inside the 0–0.3� range. This binconsists of the minimal number of pixels; in our case it was~400–600 depending on the number of masked pixels foreach scene. The width of bins is a trade-off between theresolution of phase curve and the number of pixels fallingin each bin, which influences the photometric accuracy.
3. Spectral Behavior of BOE: Resultsand Discussion
3.1. Normalized Phase Function
[23] In Figure 6 we present spectra of radiance factor forthe six analyzed areas. The spectra are produced by averag-ing the radiance factor values for all 83 wavelengths insidethe phase angle bin centered at a = 10�. Bars for each spec-trum show the standard deviation in this bin. Thus, the barsdo not characterize errors of spectral measurements; theyonly describe albedo variations in the bin. As can be antici-pated the mare and highland areas form two albedo groups.
Figure 8. Phase functions for selected spectral bands.Each curve is normalized on its own value at a= 10�.Dots show phase curves derived from M3 data subjectedto the cross-track correction [Besse et al., 2013], solidcurves present phase curves derived from noncorrectedM3 data.
Figure 9. Spectral dependences of ratios f(0.15�)/f(10�), f(2�)/f(10�), f(5�)/f(10�), f(6�)/f(10�), and f(7�)/f(10�)for six areas from Figures 2a–f. (a–c) Mare and (d–f) highland sites. Each spectrum obtained at a givenphase angle is divided to spectrum at a= 10�. The curves are not normalized.
KAYDASH ET AL.: LUNAR OPPOSITION EFFECT FROM M3
8

[24] We calculated the radiance factor as a function of a forthe six areas shown in Figures 2a–2f at all 83 wavelengthsand show the phase curves in Figures 7a–7f. The plots inupper and lower rows of Figures 7a–7f correspond to the mareand highland regions, respectively. Each curve is normalized onits own value at a =10�. The legend of the rainbow-style colorcoding for all 83 curves is presented in Figure 7g, so that bluishcolors refer to shorter wavelengths and the reddish ones repre-sent longer wavelengths. Numbers shown in Figure 7g arewavelengths in nanometers. Figures 7a–7f show the phasecurves with small peaks and wavy features. Their reasonsare the residual vertical streakiness remained after theGaussian spectral smoothing (see Figures 3b–3e) and realalbedo variations over the scenes. Although averaging overa bins decreases these effects, some noise still presents onthe final phase curves and can be seen as false details ofphase functions simultaneously in all spectral bands.Owing to real differences in illumination for the six studiedareas, the maximal values of a for each scene vary from 13�to 18�. We also have taken into account the decreasing num-ber of pixels (and hence quality of phase function) when abins approach the frame edges. This typically occurs for a11� when the number of pixels in proper a bins decreasestwice as compared to most populated bins. Thus we stoppedall phase functions at 11� for their reliable comparison.[25] In Figure 8 we present an example of f(a) with and
without compensation of residual cross-track gradient inthe M3 data discussed in Besse et al. [2013]. The correc-tion intends to improve mosaicked images by reducingboundaries between them. This is dependent on l, see http://
pds-imaging.jpl.nasa.gov/data/m3/CH1M3_0004/EXTRAS/CROSSTRACK_CORR_TABLES/. As can be seen inFigure 8, the curves reveal very little differences between twosets of data. The result is obtained for the region shown inFigure 2a, but the same is observed for all areas under study.Very small influence of the correction is also found for colorratios C(a) = f(l1,a)/f(l2,a).[26] Inspection of the phase functions in Figures 7a–7f
and Figure 8 reveals an inverse wavelength dependenceof their steepness: the slope of phase function is greaterfor shorter wavelengths both for highlands and mare areas.The slope and shape of phase curves slightly differfrom area to area, but one may conclude that the phaseratio f(0.15�)/f(10�) is about 1.4–1.6 for all these areas,with an exclusion (~1.7–1.9) for the area displayed inFigure 2d.
3.2. Wavelength Dependence of Phase Ratios
[27] For a detailed investigation of the phase slope, we cal-culated several phase ratios f(0.15�)/f(10�), f(2�)/f(10�), f(5�)/f(10�), f(6�)/f(10�), f(7�)/f(10�) and plotted them as a functionof wavelength l for the studied areas (Figures 9a–9f).All the ratios decrease with l, only f(0.15�)/f(10�) revealsalmost neutral behavior for some areas. Since the lunarreflectance generally increases with l, we may concludethat the slope of phase curves diminish with surface albedoincreasing. Such a behavior of the phase curves is character-istic when incoherent multiple scattering weakens theshadow-hiding effect. If the coherent backscatteringenhancement is significant, the opposite dependence of the
Figure 10. Phase-angle ratios f(0.15�)/f(1�), f(2�)/f(3�), f(5�)/f(7�), and f(6�)/f(10�) plotted as a function ofl for areas from Figures 2a–2f. (a–c) Mare and (d–f) highland areas. Phase ratios are normalized to theirown values at 540 nm. The color strip coding of the wavelengths is the same as in Figures 7a–7f.
KAYDASH ET AL.: LUNAR OPPOSITION EFFECT FROM M3
9

slope on albedo should be observed [Shkuratov et al., 2012].Indeed, increasing albedo implies the rising multiple scat-tering component that increases the amplitude of the coher-ent backscattering spike.[28] To clarify the role of the coherent backscatter en-
hancement in the formation of phase function, a more subtleanalysis is needed. Therefore, we study another set of phaseratios as functions of wavelength: f(0.15�)/f(1�), f(2�)/f(3�),f(5�)/f(7�), and f(6�)/f(10�). The result is presented inFigures 10a–10f. All curves are normalized to their ownvalues at 541 nm, so all phase ratios equal unity at the shortestwavelength 541 nm. The reason for choosing these ratios isthat the nonlinear increase of the reflectance related to the co-herent backscattering enhancement begins with a ~ 5�. Thus,one may formally consider the phase ratios f(0.15�)/f(1�) andf(2�)/f(3�) as an assessment of the enhancement.[29] As before the plots for mare and highland areas are
shown, respectively, in the upper and lower rows ofFigures 10a–10f. The color strip near the wavelength axis isthe same color coding as in Figures 9a–9f. The thin lines inthe color legends correspond to the 20 nm spectral resolutionfor the bands from 730 to 1548 nm.[30] The f(0.15�)/f(1�) plots (solid black lines) reveal an
increase of the phase slope with l for all areas fromFigures 2a–2f. One exclusion is almost neutral dependencefor the area in Figure 2d, for which the spectrum of reflectancehas a minimal phase slope. The greatest increase—up to 6% forthe longest wavelengths—is observed in Figures 10a and 10f.Such a behavior means that the BOE amplitude in the range0–1� tends to increase with albedo in spite of the reverse influ-ence of incoherent multiple scattering. Thus, the wavelengthdependence of the ratio f(0.15�)/f(1�) is clear evidence that
the coherent backscattering enhancement becomes importantfor the Moon at a< 2� for l from 541 to 2976 nm. Overall,this result does not contradict the earlier measurements byClementine [Buratti et al., 1996; Hillier et al., 1999;Shkuratov et al., 1999; Kreslavsky et al., 2000], where the au-thors did not find BOE spectral dependence, since they investi-gated a narrower spectral range 415–1000 nm.[31] There are factors that may significantly suppress the
very narrow coherent spike 0–1� of the Moon. First of all,this is the masking effect related to the Sun that has the anglesize of 0.5�. Smoothing with such a “window” destroys anarrow spike decreasing its amplitude. Even a large spikethat is very narrow can be almost eliminated if integrated(i.e., averaged) in a rather wide range of phase angles[Shkuratov et al., 1999]. Another reason that can destroy anarrow spike is the bin resolution that is 0.3� in our analysis.It should be emphasized that both these factors affect thecoherent backscattering as well as shadow-hiding compo-nents of BOE at phase angles small enough. Figures 5b,7a, 7f, and 8 demonstrate rounding of f(a) at a< 0.5�, asshould be. The evenning can be partially compensated whena strong brightness spike takes place at a< 0.5�; perhapsthis is observed in Figures 7b, 7d, 7e. However, there is al-ways a phase angle at which the rounding must be formed;pure cusps in electromagnetic wave scattering are impossi-ble. Thus, we may conclude that the Moon probably has anotable effect of the coherent backscattering enhancementat a< 1� in the NIR spectral range, but this effect issmoothed by the Sun whose angular size is 0.5�.[32] The area presented in Figure 2d has the opposition
point located in the closest proximity of the bright craterRiccioli H rim. Although we excluded the crater itself from
Figure 11. Phase dependences of color ratio C(a) =A(l,a)/A(l0,a), where l0 = 540.84 nm, for areas shownin Figures 2a–2f. (a–c) Mare and (d–f) highland sites. Each curve is normalized on its own value at a =2�. (g)For the rainbow-style color coding 83 curves from the wavelength range 541–2976 nm are used.
KAYDASH ET AL.: LUNAR OPPOSITION EFFECT FROM M3
10

the analysis when we calculated the phase curves(see Figure 2d), this area has the highest albedo observed inour study. It does not reveal the f(0.15�)/f(1�) increasing withl and has large f(0.15�)/f(10�) values. These facts do not con-tradict each other. Indeed, the regolith of young crater rimsconsists of coarser particles. This provides larger interferencebases in multiple lightscattering [Shkuratov et al., 1999], andowing to that the coherent backscattering spike may becomenarrower than 1�. The high ratio f(0.15�)/f(10�) can be causedby anomalous roughness of crater rims. Large blocks, boul-ders, and rocks covered with regolith produce a complicatedhierarchical topography that can exhibit steep phase curves[Shkuratov and Helfenstein, 2001].[33] The phase ratio f(2�)/f(3�) (dashed black lines) is al-
most constant over the wavelength range for mare areas(Figures 10a–10c) and even slightly decreases for highlands(Figures 10d–10f). Thus, one can conclude that the contribu-tions of the coherent backscatter enhancement and incoherentmultiple scattering equalize each other in the range 2–3�.This points out that the coherent backscattering spike canbe somewhat wider than 2�.[34] In Figures 10a–10f we also show the phase ratios
f(5�)/f(7�) and f(6�)/f(10�). All areas presented inFigures 2a–2f show decreasing ratios with l. For f(6�)/f(10�)the amplitude decrease is up to 6%. Hence, we confirm an in-verse wavelength (albedo) dependence of the steepness ofphase curves at the 5–10� phase range [e.g., Velikodskyet al., 2011; Shkuratov et al., 2011]. We note nonmonotonousbehavior of phase ratios f(5�)/f(7�) and f(6�)/f(10�) at thewavelength near 1mm and partially near 2mm. These featuresof phase ratios resemble inversed absorption bands in typicallunar spectra. Yokota et al. [2011] also found this effect forratios f(5�)/f(30�) and f(10�)/f(30�) calculated with Kaguyadata for the 500–1600 nm range. The result is quite obvious,as in the absorption bands the incoherent multiple scatteringdecreases with decreasing albedo.[35] Thus, taking into account the observed spectral behav-
ior of the phase ratios, we may conclude that shadow-hidingand incoherent multiple scattering are the major componentsof light scattering at a> 2� even in NIR, where lunar albedois substantially higher than in the visible spectral range. Thisis in sharp contrast to the conclusion by Hapke et al. [2012]who suggested that the coherent backscatter enhancementcontributes nearly 40% in the UV, increasing to over 60%in the red light.
3.3. Phase Curve of Color Ratio
[36] The described spectral variations of phase functions urgeus to investigate phase curves of color ratios C(a) = f(l1,a)/f(l2,a). The function C(a) is poorly studied. The color-ratio in-creasing when l1> l2 (reddening) with a was found manyyears ago using telescope observations of the Moon [McCord,1969;Mikhail, 1970; Lane and Irvine, 1973]. Recent telescopedata confirmed this reddening [Korokhin et al., 2007; Kaydashet al., 2010]. The same effect has been foundwith space-derivedobservations [Buratti et al., 1996; Shkuratov et al., 1999;Kreslavsky et al., 2000; Denevi et al., 2010]. Hicks et al.[2011] provided an empirical photometric function in the541–2976nm and confirmed reddening for the highlands atlarge phase angles up to 80�, though their model wasunderconstrained at angles less than 35�. Yokota et al. [2011]developed another model for the lunar phase function in
the 500–1600 nm range and examined the wavelength depen-dence of the function; they found phase reddening for the rangeof a =5–75�.[37] On the other hand, a nonmonotonic behavior of C(a)
in visible spectral interval was noted by several authors usinglaboratory measurements of lunar regolith samples. Thesemeasurements revealed in some cases a minimum of thefunction C(a) in the range ~5–15� [O’Leary and Briggs,1973; Akimov et al., 1979; Shkuratov et al., 1996, 2011,2012]. Eight lunar samples measured by Hapke et al.[1998] exhibited such a minimum at 3–4� for red/blue colorratios. Korokhin et al. [2007] reported that the minimumwould exist at 10� using reanalyzed integral observations ofthe Moon by Lane and Irvine [1973]. The increase of C(a)at small decreasing a was named the color opposition effect(COE) [Shkuratov et al., 1996].[38] Using the M3 multispectral data, we are able to obtain
new independent information on the phase dependence of colorratios. Figures 11a–11f show the functions C(l,a) = f(l,a)/f(l0,a) calculated for the areas shown in Figures 2a–2f usingthe 83 color ratios. The rainbow-style color coding is presentedin the legend (Figure 11g). As can be seen, the phase curves re-veal a clear minimum of C(a) depending on area. At wave-lengths below 1000 nm a shallow minimum at 4–6� (or nominimum at all) can be seen. For l> 1000 nm this minimumis more pronounced and located at 2–4�. We again note an ex-clusion related to the area shown in Figure 2d that exhibits amonotonic increase of C(a) for all l. Such a behavior has beenobserved for a highland sample of immature regolith from thelanding site of Soviet Luna-20 [Shkuratov et al., 1996, 2012].[39] The minimum can be in principle due to the coherent
backscattering enhancement and the spectral difference ofthe backscattering lobe of phase functions of single-particlescattering [Shkuratov et al., 2012]. The latter mechanismmay be responsible rather for wide minima located for rego-lith samples at a= 10�–15� [Shkuratov et al., 1996]. As forthe minimum at a= 2–4�, it is caused rather by the coherentbackscattering enhancement. The area shown in Figure 2ddoes not have the minimum, which is consistent with the as-sumption that coherent backscattering enhancement peak forimmature lunar soils is located at a< 1�.[40] Our results reveal the colorimetric opposition effect
(COE) of the Moon in NIR. While the observed amin ~ 2–4�values are in accordance with the measurements of C(633/433 nm, a) for eight lunar samples by Hapke et al. [1998],this cannot be treated as evidence of a 40–60% contributionof the coherent backscattering to the total flux, which was de-duced in Hapke et al. [2012]. We interpret our results as thecoherent backscattering noticeably affects lunar phase curvesonly at a< 2�, and its values do not exceed 5–7% even inNIR spectrum range.
4. Conclusion
[41] 1. Using data of the Chandrayaan-1 imaging spec-trometer M3, we suggest a new detailed description of thelunar opposition effect and its dependence on wavelengthin the range 541–2976 nm. Our analysis showed that the dataare suitable for this task if we reduce the noise using aGaussian smoothing filter decreasing both spectral and spa-tial resolution. We found that errors in M3 pointing maychange the actual position of the opposition point in images
KAYDASH ET AL.: LUNAR OPPOSITION EFFECT FROM M3
11

acquired during the suboptical period OP2C1 of the mission.Real locations were reconstructed from the images them-selves and used for further photometric analysis.[42] 2. For M3 data, phase dependences of the color ratios
reveal a nonmonotonic behavior or COE. We found a mini-mum of phase functions of color ratio at amin ~ 2–4�. Atlarger phase angles reddening of spectra are observed. Atsmaller phase angles our result clearly shows in general spec-tral blueing. This minimum would be considered as the firstreliable indicator of a small coherent backscattering enhance-ment component at a< 1–2�.[43] 3. We calculated phase curves of reflectance and color
ratios for six mare and highland areas in the phase anglerange 0–10�. The slope of color-ratio curves increases withwavelength at a from 0–1�. In the 2–3� range this slope isspectrally insensitive, and for the 5–10� range it decreaseswith wavelength. We interpret these results as evidence ofdominating shadow-hiding and incoherent multiple scatter-ing in the lunar opposition effect at a> 2�. At a< 2� the co-herent backscattering enhancement may also contribute toscattering; however, its values are rather small, 5–7% evenat l = 3 mm, where lunar surface albedo is rather high.[44] 4. Adding more sites imaged with M3 under opposi-
tion geometry and thus deriving the “mean” (in terms ofalbedo) phase dependence of color ratio is the goal forfuture work.
[45] Acknowledgments. This work was partially supported by BrownUniversity of Providence, RI USA, with the attribution of visiting position toV. G. Kaydash. The M3 instrument was funded as a mission of opportunitythrough the NASA Discovery program. These analyses were supported throughthe NASA Lunar Science Institute (NNA09DB34A). Authors thank YasuhiroYokota and two anonymous reviewers for remarks that improved the paper.
ReferencesAkimov, L. A., I. I. Antipova-Karataeva, and Y. G. Shkuratov (1979),Indicatrix measurements of lunar samples from landing sites of Luna 24,Luna 16, and Luna 20, Lunar Planet. Sci. Conf. 10th, LPI, Houston,pp. 9–11.
Besse, S., J. Sunshine, M. Staid, J. Boardman, C. Pieters, P. Guasqui,E. Malaret, S. McLaughlin, Y. Yokota, and J.-Y. Li (2013), A visibleand near-infrared photometric correction for Moon Mineralogy Mapper(M3), Icarus, 222, 229–242.
Boardman, J. W., C. M. Pieters, R. O. Green, S. R. Lundeen, P. Varanasi,J. Nettles, N. Petro, P. Isaacson, S. Besse, and L. A. Taylor (2011),Measuring moonlight: An overview of the spatial properties, lunar coverage,selenolocation, and related Level 1B products of the Moon MineralogyMapper, J. Geophys. Res., 116, E00G14, doi:10.1029/2010JE003730.
Buratti, B. J., J. K. Hiller, and M. Wang (1996), The lunar opposition surge:observation by Clementine, Icarus, 124, 490–499.
Buratti, B. J., M. D. Hicks, J. Nettles, M. Staid, C. M. Pieters, J. Sunshine,J. Boardman, and T. C. Stone (2011), A wavelength-dependent visibleand infrared spectrophotometric function for the Moon based on ROLOdata, J. Geophys. Res., 116, E00G03, doi:10.1029/2010JE003724.
Denevi, B. W., M. S. Robinson, B. W. Hapke, S. J. Lawrence,S. M. Wiseman, B. L. Jolliff, and the LROC Team (2010), Global ultravi-olet through visible color observations of the Moon with the LunarReconnaissance Orbiter wide angle camera, Lunar Planet. Sci. Conf.41st, No. 2263, LPI, Houston, USA.
Green, R. O., et al. (2011), The Moon Mineralogy Mapper (M3) imagingspectrometer for lunar science: Instrument description, calibration, on-orbit measurements, science data calibration and on-orbit validation,J. Geophys. Res., 116, E00G19, doi:10.1029/2011JE003797.
Hapke, B., R. Nelson, and W. Smythe (1998), The opposition effect of theMoon: coherent backscatter and shadow hiding, Icarus, 133, 89–97.
Hapke, B., B. Denevi, H. Sato, S. Braden, and M. Robinson (2012), Thewavelength dependence of the lunar phase curve as seen by the LunarReconnaissance Orbiter wide-angle camera, J. Geophys. Res., 117,E00H15, doi:10.1029/2011JE003916.
Helfenstein, P., J. Veverka, and J. Hillier (1997), The lunar opposition effect:A test of alternative models, Icarus, 128, 2–14.
Hicks, M. D., B. J. Buratti, J. Nettles, M. Staid, J. Sunshine, C. M. Pieters,S. Besse, and J. Boardman (2011), A photometric function for analysis of lu-nar images in the visual and infrared based on Moon Mineralogy Mapperobservations, J. Geophys. Res., 116, E00G15, doi:10.1029/2010JE003733.
Hillier, J. K., B. J. Buratti, and K. Hill (1999), Multispectral photometry ofthe Moon and absolute calibration of the Clementine UV/Vis camera,Icarus, 141, 205–225.
Kaydash, V., M. Kreslavsky, Y. Shkuratov, S. Gerasimenko, P. Pinet,S. Chevrel, J.-L. Josset, S. Beauvivre, B. Foing, and AMIE Smart-1 team(2008), The opposition effect of the Moon from SMART-1 AMIE data.Lunar and Planetary Science XXXIX, Abstract # 1195.
Kaydash, V. G., S. Y. Gerasimenko, Y. G. Shkuratov, N. V. Opanasenko,Y. I. Velikodsky, and V. V. Korokhin (2010), Mapping of phase ratio ofcolor index for two areas of the lunar nearside, Sol. Syst. Res, 44(4),267–280.
Korokhin, V. V., Y. I. Velikodsky, Y. G. Shkuratov, and U.Mall (2007), Thephase dependence of brightness and color of the lunar surface: a studybased on integral photometric data, Sol. Syst. Res, 41(1), 19–27.
Kreslavsky, M. A., Y. G. Shkuratov, Y. I. Velikodsky, V. G. Kaydash,D. G. Stankevich, and C. M. Pieters (2000), Photometric properties ofthe lunar surface derived from Clementine observations, J. Geophys. Res.,105(E8), 20,281–20,296.
Kreslavsky, M. A., Y. G. Shkuratov, V. G. Kaydash, V. V. Omelchenko,D. T. Blewett, and P. G. Lucey (2001), Lunar opposition spike observedby Clementine NIR camera: preliminary results, Lunar Planet. Sci. Conf.32nd, Abstract no. 1140, LPI, Houston, USA.
Lane, A. L., and W. M. Irvine (1973), Monochromatic phase curves andalbedos for the lunar disk, Astron. J., 78(3), 267–277.
Lucey, P. G., D. T. Blewett, G. J. Taylor, and B. R. Hawke (2000), Imagingof the lunar surface maturity, J. Geophys. Res., 105, 20,377–20,386.
Lundeen, S., S. McLaughlin, and R. Alanis (2011), Moon MineralogyMapper Data Product Software Interface Specifications. Version 9.10.http://pds-imaging.jpl.nasa.gov/data/m3/ CH1M3_0004/DOCUMENT/DPSIS.PDF.
McCord, T. B. (1969), Color differences on the lunar surface, J. Geophys.Res., 74(12), 3131–3142.
Mikhail, J. S. (1970), Color variations with phase of selected regions of thelunar surface, The Moon, 2, 167–201.
Muinonen, K., H. Parviainen, J. Näränen, S. Beauvivre, P. Pinet, S. Chevrel,D. Koschny, B. Grieger, B. Foing, and SMART-1 AMIE Team (2011),Lunar mare single-scattering, porosity, and surface-roughness propertieswith SMART-1 AMIE, Astron. Astrophys., 531, A150.
Nettles, J. W., et al. (2011), Optical maturity variation in lunar spectra asmeasured by Moon Mineralogy Mapper data, J. Geophys. Res., 116,E00G17, doi:10.1029/2010JE003748.
O’Leary, B., and B. Briggs (1973), Optical properties of Apollo-12 Moonsamples, J. Geophys. Res., 78(5), 792–797.
Pieters, C. M., Y. G. Shkuratov, V. G. Kaydash, D. G. Stankevich, andL. Taylor (2006), Lunar soil characterization consortium analyses: pyrox-ene and maturity estimates derived from Clementine data, Icarus, 184,83–101.
Pieters, C. M., et al. (2009), The Moon Mineralogy Mapper (M3) onChandrayaan-1, Curr. Sci., 96(4), 500–505.
Shkuratov, Y., and P. Helfenstein (2001), The opposition effect and thequasi-fractal structure of regolith: Theory, Icarus, 152, 96–116.
Shkuratov, Y., L. Starukhina, M. Kreslavsky, N. Opanasenko, D. Stankevich,and V. Shevchenko (1994), Principle of perturbation invariance in photom-etry of atmosphereless celestial bodies, Icarus, 109, 168–190.
Shkuratov, Y. G., L. Y. Melkumova, N. V. Opanasenko, andD. G. Stankevich (1996), Phase dependence of the color index of solid sur-faces of celestial bodies, Sol. Syst. Res., 30, 71–79.
Shkuratov, Y., M. Kreslavsky, A. Ovcharenko, D. Stankevich, E. Zubko,C. Pieters, and G. Arnold (1999), Opposition effect from Clementine dataand mechanisms of backscatter, Icarus, 141, 132–155.
Shkuratov, Y., V. Kaydash, V. Korokhin, Y. Velikodsky, N. Opanasenko,and G. Videen (2011), Optical measurements of the Moon as a tool tostudy its surface, Planet. Space Sci., 59, 1326–1371.
Shkuratov, Y., V. Kaydash, D. Petrov, V. Korokhin, D. Stankevich, andG. Videen (2012), A critical assessment of the Hapke photometric model,Journ. Quant. Spectrosc. Rad. Transfer, 113(18), 2431–2456.
Velikodsky, Y. I., N. V. Opanasenko, L. A. Akimov, V. V. Korokhin,Y. G. Shkuratov, V. G. Kaydash, G. Videen, S. A. Ehgamberdiev, andN. E. Berdalieva (2011), New Earth-based absolute photometry of theMoon, Icarus, 214, 30–45.
Yokota, Y., et al. (2011), Lunar photometric properties at wavelengths 0.5-1.6mm acquired by SELENE Spectral Profiler and their dependency on lo-cal albedo and latitudinal zones, Icarus, 215, 639–660.
Zubko, E., Y. Shkuratov, M. Mishchenko, and G. Videen (2008), Light scat-tering in a finite multi-particle system, J. Quant. Spectrosc. Rad. Transfer,109, 2195–2206.
KAYDASH ET AL.: LUNAR OPPOSITION EFFECT FROM M3
12