Embed Size (px)
Citation preview

General Information
Location: BILBAO ESPICAO/IATA: LEBB / BIOLat/Long: N43° 18.07', W002° 54.63'Elevation: 136 ft
Airport Use: PublicDaylight Savings: ObservedUTC Conversion: -1:00 = UTCMagnetic Variation: 1.0° W
Fuel Types: 100 Octane (LL), Jet A-1Customs: YesAirport Type: IFRLanding Fee: YesControl Tower: YesJet Start Unit: NoLLWS Alert: YesBeacon: No
Sunrise: 0733 ZSunset: 1716 Z
Runway Information
Runway: 10Length x Width: 6266 ft x 148 ftSurface Type: asphaltTDZ-Elev: 116 ftLighting: Edge, ALS
Runway: 12Length x Width: 8530 ft x 148 ftSurface Type: asphaltTDZ-Elev: 131 ftLighting: Edge, ALS, Centerline
Runway: 28Length x Width: 6266 ft x 148 ftSurface Type: asphaltTDZ-Elev: 118 ftLighting: EdgeDisplaced Threshold: 1821 ft
Runway: 30Length x Width: 8530 ft x 148 ftSurface Type: asphaltTDZ-Elev: 134 ftLighting: Edge, ALS, Centerline, TDZDisplaced Threshold: 1509 ft
Communication Information
ATIS: 118.825 At or below 33574432 ft Out to 35 mi.Bilbao Tower: 118.500Bilbao Tower: 25.780 MilitaryBilbao Ground: 121.700Bilbao Approach: 127.450Bilbao Approach: 128.575 Secondary
General Information
Location: BILBAO ESPICAO/IATA: LEBB / BIOLat/Long: N43° 18.07', W002° 54.63'Elevation: 136 ft
Airport Use: PublicDaylight Savings: ObservedUTC Conversion: -1:00 = UTCMagnetic Variation: 1.0° W
Fuel Types: 100 Octane (LL), Jet A-1Customs: YesAirport Type: IFRLanding Fee: YesControl Tower: YesJet Start Unit: NoLLWS Alert: YesBeacon: No
Sunrise: 0733 ZSunset: 1716 Z
Runway Information
Runway: 10Length x Width: 6266 ft x 148 ftSurface Type: asphaltTDZ-Elev: 116 ftLighting: Edge, ALS
Runway: 12Length x Width: 8530 ft x 148 ftSurface Type: asphaltTDZ-Elev: 131 ftLighting: Edge, ALS, Centerline
Runway: 28Length x Width: 6266 ft x 148 ftSurface Type: asphaltTDZ-Elev: 118 ftLighting: EdgeDisplaced Threshold: 1821 ft
Runway: 30Length x Width: 8530 ft x 148 ftSurface Type: asphaltTDZ-Elev: 134 ftLighting: Edge, ALS, Centerline, TDZDisplaced Threshold: 1509 ft
Airport Information For LEBBPrinted on 27 Jan 2018Page 1(c) JEPPESEN SANDERSON, INC., 2018, ALL RIGHTS RESERVED
jep=JEPPESEN
JeppView for Windows

General Information
Location: BILBAO ESPICAO/IATA: LEBB / BIOLat/Long: N43° 18.07', W002° 54.63'Elevation: 136 ft
Airport Use: PublicDaylight Savings: ObservedUTC Conversion: -1:00 = UTCMagnetic Variation: 1.0° W
Fuel Types: 100 Octane (LL), Jet A-1Customs: YesAirport Type: IFRLanding Fee: YesControl Tower: YesJet Start Unit: NoLLWS Alert: YesBeacon: No
Sunrise: 0733 ZSunset: 1716 Z
Runway Information
Runway: 10Length x Width: 6266 ft x 148 ftSurface Type: asphaltTDZ-Elev: 116 ftLighting: Edge, ALS
Runway: 12Length x Width: 8530 ft x 148 ftSurface Type: asphaltTDZ-Elev: 131 ftLighting: Edge, ALS, Centerline
Runway: 28Length x Width: 6266 ft x 148 ftSurface Type: asphaltTDZ-Elev: 118 ftLighting: EdgeDisplaced Threshold: 1821 ft
Runway: 30Length x Width: 8530 ft x 148 ftSurface Type: asphaltTDZ-Elev: 134 ftLighting: Edge, ALS, Centerline, TDZDisplaced Threshold: 1509 ft
Communication Information
ATIS: 118.825 At or below 33574432 ft Out to 35 mi.Bilbao Tower: 118.500Bilbao Tower: 25.780 MilitaryBilbao Ground: 121.700Bilbao Approach: 127.450Bilbao Approach: 128.575 Secondary
Communication Information
ATIS: 118.825 At or below 33574432 ft Out to 35 mi.Bilbao Tower: 118.500Bilbao Tower: 25.780 MilitaryBilbao Ground: 121.700Bilbao Approach: 127.450Bilbao Approach: 128.575 Secondary
Airport Information For LEBBPrinted on 27 Jan 2018Page 2(c) JEPPESEN SANDERSON, INC., 2018, ALL RIGHTS RESERVED
jep=JEPPESEN
JeppView for Windows

BILBAO, SPAINLEBB/BIOBILBAO .AIRPORT.BRIEFING.
+ JEPPESEN
1.1. ATIS*D-ATIS 118.825
1.2. NOISE ABATEMENT PROCEDURES1.2.1. RUN-UP TESTS
Run-up test higher than idle regime will be requested to CECOPS through SITA orfax.Run-up tests at medium or high regime are not allowed between 2400-0600 LT.
1.3. LOW VISIBILITY PROCEDURES (LVP)1.3.1. GENERAL
Low visibility take-offs are authorized from RWY 30.LVP shall be applied for take-off, when RVR measurement of any transmissometeris 500m or below, or, in case transmissometers are out of service, visibility is800m or below.Pilots shall be informed about the application of LVP by the appropriate ATISservice with the phraseology "Low Visibility Procedure in force".During LVP, de-icing is only available on stand 13.LVP shall be cancelled when RVR measurements of every transmissometer arehigher than 1000m, or the visibility is higher than 1000m in case transmissome-ters are out of service and meteorological conditions have a strong tendency toimprove.Operation of Code F ACFT not allowed during LVP.
1.3.2. GROUND MOVEMENT
1.3.2.1. GENERALWhen the RVR is 1000m or below, in addition to appropriate lighting, stop barsthat protect the RWY access and lights of intermediate holding positions will beactivated.Pilots shall verify at every moment the ACFT position, checking that taxiing isbeing executed under total safety conditions. In case of being disoriented or indoubt, pilots shall stop the ACFT and immediately notify TWR.When a departing ACFT needs to return to the apron, the pilot shall inform TWRand wait for new taxiing instructions.
1.3.2.2. ARRIVALACFT that have already landed, shall- notify RWY vacated and TWY used when all the TWY centerline lights have
become green instead of green-yellow;- wait for taxiing instructions from TWR.
North Apron:
South Apron:
RWY 30 in use: ACFT shall leave RWY by TWY C5, or C6 and then taxi via TWY Tto gate B, A1 or A2 (according to the parking assigned and ATCinstructions), where a "Follow-me" vehicle will be waiting.
RWY 30 in use: Traffic shall be instructed to leave the RWY by gate D1 to proceedto the stand guided by a "Follow-me" vehicle.
10-1P27 NOV 15 .Eff.10.Dec.
1. GENERAL
| JEPPESEN, 2007, 2015. ALL RIGHTS RESERVED.
Printed from JeppView for Windows 5.3.0.0 on 27 Jan 2018; Terminal chart data cycle 01-2018 (Expired); Notice: After 25 Jan 2018, 0000Z, this chart may no longer be valid
BILBAO, SPAINLEBB/BIOBILBAO .AIRPORT.BRIEFING.
+ JEPPESEN
1.3.2.3. DEPARTURE
From North Apron:
From South Apron:
1.3.3. ANOMALOUS OCCURRENCES IN MANOEUVRING AREA
Uncertainty regarding the Position on the Manoeuvring AreaIf a pilot is in doubt about the position of the ACFT relative to the manoeuvringarea, he shall immediately stop the ACFT and shall notify ATC (including the lastknown position).In situations where the pilot doubts about the position of the ACFT with refer-ence to the manoeuvring area, but recognizes that the ACFT is on a RWY, he shallimmediately notify ATC (including the last known position). He shall evacuate theRWY as soon as possible if he is able to locate an appropriate near TWY, unlessATC stated otherwise, and then stop the ACFT.
Loss of Visual Contact between TrafficIn case of loss of visual contact between an ACFT and another, or a vehicle withits own separation, ATC shall immediately be informed and the ACFT shall stop.ATC will then take necessary actions.
Failure of an ACFTACFT shall notify the situation to ATC and wait for the arrival of assistance. Incase it is on a RWY, if possible and if ATC does not indicate the contrary, shallevacuate the RWY.
1.3.4. COMMUNICATION FAILUREDeparture ACFT shall continue on the assigned route and stop at the limit of theATC clearance, taking extreme caution, where it shall maintain position and shallwait for the arrival of an assistance vehicle.If an arriving ACFT has just landed, it shall maintain position when leaving andshall wait for the arrival of an assistance vehicle.If the ACFT already had a taxiing ATC clearance, it shall continue on the assignedroute to the limit of such authorization, taking extreme caution, then maintainposition and wait for the arrival of an assistance vehicle.
1.4. TAXI PROCEDURES- TWY A1 and C1 restricted to MAX Code C ACFT.- TWY S1 restricted to MAX Code A ACFT.- Taxiing via TWYs A1 and A2 not authorized if ACFT with code letter E leaves
stand 111.- Taxiing via TWY T3 or T4 is not allowed if an ACFT is on holding position C4.- Taxiing of ACFT with code letter E via TWY T1 not authorized if other ACFT is
on de-icing aprons.- Taxiing of ACFT with code letter E in the curved sections of TWYs C2 and C6
must be made with oversteering manoeuvre.- Code letter F ACFT Antonov-124 must use an oversteering manoeuvre on the
access TWY to the stand after entering via TWY D3.
RWY 30 in use: ACFT shall leave the apron via gate B, A1 or A2, according to ATCinstructions. It shall taxi via TWY T to the RWY holding positionK1, or C2, or C1, according to ATC instructions.
RWY 30 in use: ACFT shall be guided by a "Follow-me" vehicle and shall leave theapron by D3. It shall taxi to the RWY holding position in TWY D1,where it shall wait for ATC clearance to cross the RWY in use. The"Follow-me" vehicle guidance shall be made to the North apron.ACFT shall keep on taxiing on TWY T to the RWY holding positionK1, or C2, or C1, according to ATC instructions.
10-1P127 NOV 15 .Eff.10.Dec.
1. GENERAL
| JEPPESEN, 2007, 2015. ALL RIGHTS RESERVED.
Printed from JeppView for Windows 5.3.0.0 on 27 Jan 2018; Terminal chart data cycle 01-2018 (Expired); Notice: After 25 Jan 2018, 0000Z, this chart may no longer be valid

BILBAO, SPAINLEBB/BIOBILBAO .AIRPORT.BRIEFING.
+ JEPPESEN
1.5. PARKING INFORMATIONSouth Apron- Stand 7 push-back required if stand 8 is occupied.- Stand 8 push-back required if stand 9 is occupied.- Stand 9 push-back required if stand 10 is occupied, towed exit for ACFT longer
than A320.- Stand 10 push-back required if stand 11 is occupied, towed exit for ACFT
longer than A320.- Stand 11 towed exit for ACFT longer than A320.- Stand 89 push-back required.- Stands H1 thru H5 are helicopter stands.
North Apron- Stand 7 push-back required if stand 8 is occupied, towed exit for ACFT longer
than A320.- Stand 9 push-back required if stand 8 is occupied.- On stands 12 and 13 push-back required when stand 123 is occupied, towed
exit for ACFT longer than CRJ2.- Stand 14 thru 17 towed exit for ACFT longer than CRJ2.- Stand 19 push-back required if stand 20 is occupied.- Stand 21 push-back required if stand 20 is occupied, towed exit for ACFT
longer than A320.- Stands 1 thru 6A, 8, 11, 11A, 20, 78, 89 and 123 push-back required.- Stands H12 and H21 are helicopter stands.
1.6. OTHER INFORMATION1.6.1. GENERAL
RWYs 10 and 30 right-hand circuit.Apron South not visible from Control Tower.The minimum vertical margin for the wheel clearance is not sufficient for code EACFT and code F ACFT Antonov-124.PAPI RWY 12/30 not usable for code E ACFT and code F ACFT Antonov-124.
1.6.2. WIND PHENOMENAWith upper winds from the SW and surface winds with a southerly component,shear effects associated to moderate to severe turbulence appear in differentforms:- Strong vertical wind gradient, in general with a significant crosswind compo-
nent of direction from 170^ to 230^ and intensity above 20 KT.- Situations where low-level wind is funneled through the valley, generating
vertical wind shear with surface winds of direction from 120^ to 150^ andintensity of 15 to 25 KT.
These situations are encountered most frequently from October to March.
10-1P229 SEP 17 .Eff.12.Oct.
1. GENERAL
| JEPPESEN, 2014, 2017. ALL RIGHTS RESERVED.
Printed from JeppView for Windows 5.3.0.0 on 27 Jan 2018; Terminal chart data cycle 01-2018 (Expired); Notice: After 25 Jan 2018, 0000Z, this chart may no longer be valid

BILBAO, SPAINLEBB/BIOBILBAO .AIRPORT.BRIEFING.
+ JEPPESEN
2.1. SPEED RESTRICTIONS2.1.1. SPEED ADJUSTMENTS UNDER RADAR CONTROL
- MAX 250 KT at or below FL 120.- MAX 210 KT when starting the turn to intercept ILS/LOC.- MAX 180 KT when turn is completed and ACFT is established on ILS/LOC course
within 20NM of the landing THR.- MAX 160 KT when crossing 4NM to landing THR.- ACFT with cruising speed lower than the mentioned above shall maintain cruis-
ing speed up to the adjusting fix concerned.
2.2. TAXI PROCEDURESACFT with code letter E must leave RWY 12 via TWY C2 and RWY 30 via TWY C6,and must taxi on TWY T to TWY A2.Entry into apron via TWYs A1 or B not authorized for ACFT with code letter E.ACFT with code letter E entering stand 6A must use oversteering manoeuvreunder guidance of a signalman.For code letter F ACFT Antonov-124 cargo operations:
RWY 12: ACFT must leave RWY 12 via TWY C2, taxiing on TWY T to TWY C4, crossRWY 10/28 to TWY D3 and enter South Apron.
RWY 30: ACFT must leave RWY 30 via TWY D1, cross RWY 10/28 and enter viaTWY D3 to South Apron.
10-1P329 SEP 17 .Eff.12.Oct.
2. ARRIVAL
| JEPPESEN, 2015. ALL RIGHTS RESERVED.
Printed from JeppView for Windows 5.3.0.0 on 27 Jan 2018; Terminal chart data cycle 01-2018 (Expired); Notice: After 25 Jan 2018, 0000Z, this chart may no longer be valid

BILBAO, SPAINLEBB/BIOBILBAO .AIRPORT.BRIEFING.
+ JEPPESEN
3.1. DE-ICINGDe-icing apron is available for ACFT with MAX wingspan 126.3’/38.5m.De-icing on stand 111 is available for ACFT up to code letter E.
3.2. START-UP, PUSH-BACK & TAXI PROCEDURES3.2.1. START-UP
Request clearance to start up engines from GROUND and report:- Callsign;- Parking stand;- ATIS message received.Pilots shall request clearance for taxi on the appropriate frequency.Departing ACFT above code letter C shall report to ATC during first contact toTower.
3.2.2. PUSH-BACKACFT must be ready for towed push-back or taxiing within the next 5 MIN fromthe approved start-up time; otherwise pilots shall contact ATC.Unless otherwise instructed, push-back manoeuvres shall be carried out facingEast for RWY 30 and facing West for RWY 12.Simultaneous push-back manoeuvres between stands 2 and 6A not authorized ifACFT with code letter E is pushed back from stand 6A.Simultaneous push-back manoeuvres in stands 1 thru 6, 7 and 21 not authorizedwith B767, A306 or B752 ACFT is pushed back from stands 1 thru 6.Simultaneous push-backs shall not be authorized between stands 2 and 21.
3.2.3. TAXI PROCEDURESTaxi to holding position C1 is not allowed if holding position C2 is occupied.ACFT with code letter E must exit the apron via TWY A2 and must taxi on TWY Tto enter RWY 12 via TWY C6 or RWY 30 via holding position K1 and, with ATCclearance, TWY C2.For code letter F ACFT Antonov-124 cargo operations:
RWY HOLDING POSITION K1Due to RWY 30 displaced THR, an ACFT taxiing from RWY holding position K1 toTHR RWY 30 penetrates the APCH obstacle limitation surface. TWY C1 holding position is available for ACFT with MAX height of 31.66’/9.65m.TWY C2 holding position is available for ACFT with MAX height of 24.9’/7.6m.Normally, departing ACFT will be instructed to holding position K1 by ATC.ACFT shall notify they are ready to departure when reaching the holding positionK1.
3.3. SPEED RESTRICTIONSMAX 250 KT until leaving FL 100.
RWY 12: ACFT must leave Apron via TWY D2, wait for ATC clearance to enterRWY 10/28 and taxi via TWY D1 to RWY 12.
RWY 30: ACFT must leave apron via TWY D2, wait for ATC clearance to enterRWY 10/28, cross RWY 12/30 and leave via TWY C4 to TWY T to RWYholding position K1. ATC clearance will give access to RWY 30 via TWY C2.
10-1P420 JAN 17 .Eff.2.Feb.
3. DEPARTURE
| JEPPESEN, 2015, 2017. ALL RIGHTS RESERVED.
Printed from JeppView for Windows 5.3.0.0 on 27 Jan 2018; Terminal chart data cycle 01-2018 (Expired); Notice: After 25 Jan 2018, 0000Z, this chart may no longer be valid

JEPPESEN
FRANCE
DOSUL MAPAX BISKA
SANBI
ASPES
KALDO SUNIRROSTO
VENTICHOMI
PAKKI
KARMASARRA
LOPNA
AMTOS
Vitoria(Foronda)
SanSebastian
Logrono
Pamplona
Burgos
Santander
43-00
43-30
Apt Elev Alt Set: hPa Trans level: By ATC Trans alt: 6000'
137'
LEBB/BIO.RADAR.MINIMUM.ALTITUDES.10-1RBILBAO
BILBAO, SPAIN
42-00
42-30
44-00
44-30
02-0002-3003-0003-3004-00
(G)
BREST LFRR FIR
MADRID LECM FIR
(G
)
2379'
4839'
4363'
4396'5636'
5079'
4902'
3412'
4232'
4035'
4708'
6332'7415'
7316'6335'
4708'
3517'
2625'
224^
23 APR 10
| JEPPESEN, 2010. ALL RIGHTS RESERVED.New chart.
100
2030
4050
10
SSN VOR DMEBLV VOR DME
PPN VOR DMEPAMPLONA
DGO VOR DMEDOMINGO
VRA VOR DMEVITORIA
SNR VOR DME
BILBAO SAN SEBASTIAN
SANTANDER
SPAIN
VFD VOR DMEVITORIA
PAP VOR DMEPAMPLONA
LPA VOR DMELOGRONO
60NM
40NM
20NM
60NM
40NM
20NM
60NM
40NM
The published minimum altitudes integrate no correction for low temperatures.
LE(P)-142
Bilbao
CONTOURINTERVALS
2000
4000
6000
8000
CHANGES:
50NM
50NM
50NM
BO
RDEA
UX L
FBB F
IR
290^
263^
239^
210^
124^
21NM 19.5N
M
24NM
34NM
13NM
44NM
6500
6500
4000
4000
5500
4500
65006000
5100
7000
8000
5000
4500
3500
7000
6000
(G)
Printed from JeppView for Windows 5.3.0.0 on 27 Jan 2018; Terminal chart data cycle 01-2018 (Expired); Notice: After 25 Jan 2018, 0000Z, this chart may no longer be valid
D
R304
D8.0R301
D10.0
291^
309^
321^D15.0
R349
D23.2
D10.0R301 BLV
D8.0R304 BLV
BURGOS
VITORIA
LEBG
LEVT
42-30
43-00
43-30
03-0003-30 02-30
90 95
6759
264^
084^
174^
4500
6200
7000BLV VOR
Apt Elev
136118.825*D-ATIS
CEGAM
BILBAO
B L V115.9 BLVD
303^
CEGAM 2T
VITORIA
V R A116.6 VRAD
003^
356^
332^
KALDO
169^
ASPES
FL7
0R1
83
FL70
FL7
0
FL70
36.2
R123R176
MHA 5600
4500
D15.0 BLV
SOMAN(IAF)
D17.0 BLV
MAPAX
ROSTO
SUNIR
(IAF)
(IAF)
4500
121^
124^ 40004000
(DGO 2X, MAPAX 1Z: IAF)
4000
4000
6000
MA
PA
X
1T, 1
Z
6.2
Alt Set: hPaTrans level: By ATC
324^
144^
D6.0
121^
D14.0
MHA 4000
124^D12.0
MHA 4000
ROSTO
DGO 2XMAPAX 1Z
DG
O 1
T
10 20 30 40 500 5 15 25 35 455
DGO 1ZMAPAX 1T
112.6 DGOD
DOMINGO
D G O
(IAF)
5638
7.0
DG
O 1
T,
2X, 1
Z
HOLDINGS OVER
SUNIR
(MAPAX 1T: IAF)
17
34
34
DGO 2
X, 1
Z
D15 .0 A
rc
(D15.0 BLV)
D15.0 Arc
.STA
R.
JEPPESEN
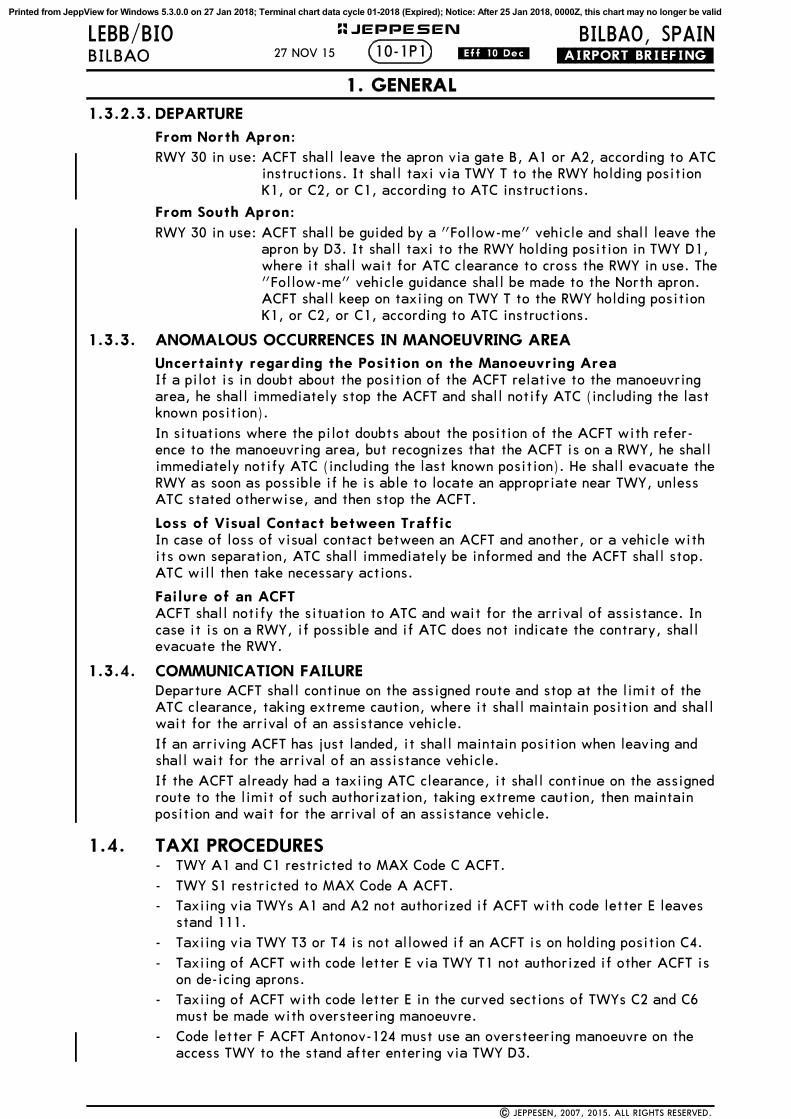
.SPEED: MAX 250 KT AT OR BELOW FL120
251^
279^D15.0
CONTOURINTERVALS
6000
4000
2000
RWY 12 ARRIVALS
CHA
NG
ES:|
JEPPESEN, 2017. A
LL RIGHTS RESERV
ED.
CEGAM 2T [CEGA2T]
MAPAX 1T [MAPA1T]MAPAX 1Z [MAPA1Z]
New
format.
RWY 12 A
RRIVALS
CEG
AM 2T [CEG
A2T]
MAPA
X 1T [M
APA
1T]MAPA
X 1Z
[MAPA
1Z]
DOMINGO 2X (DGO 2X) [DGO2X]DOMINGO 1Z (DGO 1Z) [DGO1Z]
DOMINGO 1T (DGO 1T) [DGO1T]DOMINGO 2X
(DGO 2X
) [DGO2X
]DOMINGO 1T (D
GO 1T) [D
GO1T]
DOMINGO 1Z
(DGO 1Z
) [DGO1Z
]
LEBB/BIO10-2
BILB
AO
BILBAO, SPA
IN10 FEB
17Printed from JeppView for Windows 5.3.0.0 on 27 Jan 2018; Terminal chart data cycle 01-2018 (Expired); Notice: After 25 Jan 2018, 0000Z, this chart may no longer be valid

R111^BLV
R117^BLV
D14.0D18.0
R117
LOGRONO
VITORIALEVT
LERJ
42-30
43-00
43-30
03-00
03-00
02-00
02-30
90
95
90
67
59
90
264^
084^
174^
7000
6200 4500
BLV VOR
291^ 297^
Apt Elev
136*D-ATIS
118.825
CEGAM
LEKTO
303^
043^
KARMA
MAPAX
MAPAX1K, 1Q
FL75
6000
ALBIZ
PAKKI
SARRA
(IAF)
(IAF)
(IAF)
(IAF)
9.2
297^
291^
342^
332^
6000
6000
FL70CEGAM 1K, 1Q
DGO 1L, 1Q
CEG
AM
1Q
DG
O 1
Q
6000
BRNA
V
(D24.0 BLV)
(BLV R123/D27.0)
CEG
AM
1K
DGO 1
LMAPAX 1Q: 6000
MAPAX 1K
MAPAX 1Q
MAPAX 1K: 5200FL
70
DGO 1
L, 1
Q
Alt Set: hPaTrans level: By ATC
112.6 DGOD
115.9 BLVD
DOMINGO
D G O
BILBAO
B L V
5 10 15 20 25 30 35 40 4505
MHA 6000 MHA 6000
D18.0 D22.0 43.0
6.0
6.0
D22.0 Arc
9
4
(BLV R123/D36.2)
HOLDING OVER
ALBIZ SARRA
5079
10 FEB 17
LEBB/BIO.STA
R.
JEPPESEN
BILB
AO
BILBAO, SPA
IN10-2A
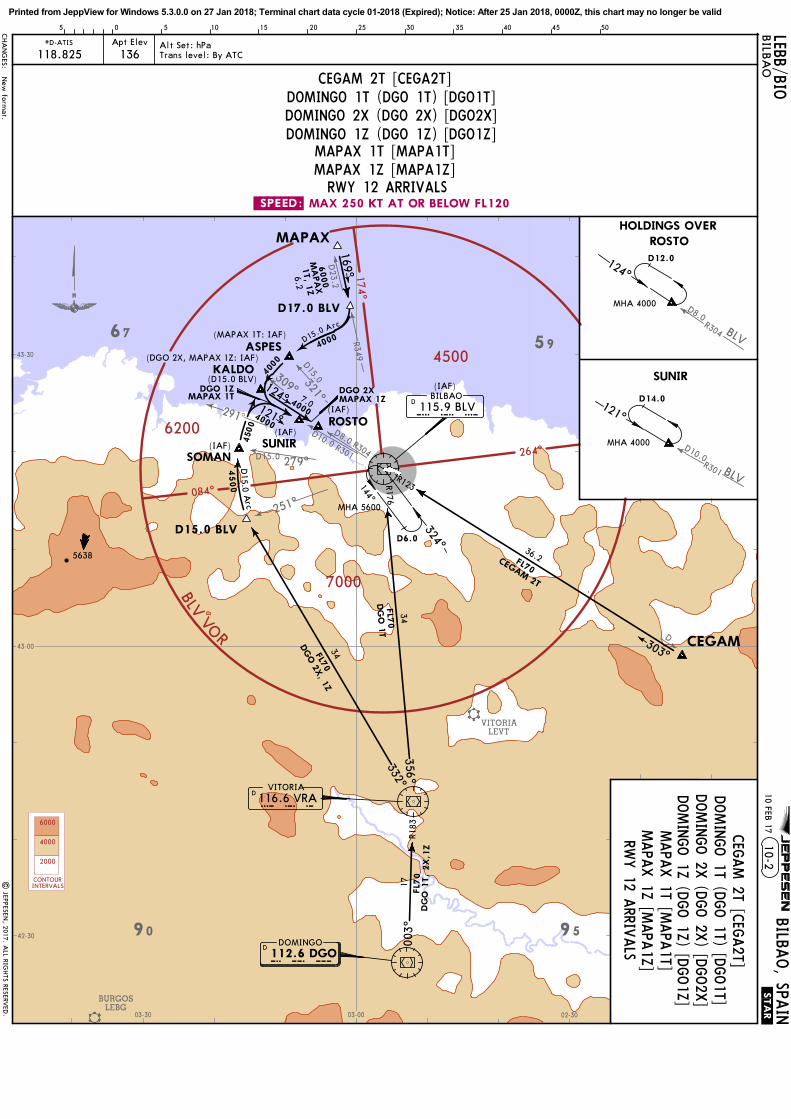
.SPEED: MAX 250 KT AT OR BELOW FL120
349^D
23.2
067^
092^
R111 D14.0
D18.0
D20.0
CONTOURINTERVALS
6000
4000
2000
RWY 30 ARRIVALS
RWY 30 RNAV ARRIVALSBRNAV APPROVAL REQIRED
CEGAM 1K [CEGA1K]DOMINGO 1L (DGO 1L) [DGO1L]
MAPAX 1K [MAPA1K]MAPAX 1Q [MAPA1Q]
CEGAM 1Q [CEGA1Q]DOMINGO 1Q (DGO 1Q) [DGO1Q]
CHA
NG
ES:|
JEPPESEN, 2017. A
LL RIGHTS RESERV
ED.
New
format.
RWY 30 A
RRIVALS
RWY 30 RN
AV A
RRIVALS
CEG
AM 1K
[CEG
A1K
]DOMINGO 1L (D
GO 1L) [D
GO1L]
MAPA
X 1K
[MAPA
1K]
MAPA
X 1Q
[MAPA
1Q]
CEG
AM 1Q
[CEG
A1Q
]DOMINGO 1Q
(DGO 1Q
) [DGO1Q
]
Printed from JeppView for Windows 5.3.0.0 on 27 Jan 2018; Terminal chart data cycle 01-2018 (Expired); Notice: After 25 Jan 2018, 0000Z, this chart may no longer be valid
D8.
0D10
.0
R325
321^
D15.0
R301
R304
309^
D10
.0R3
01BL
V
D28.0
SANTANDER
Seve B
alleste
ros-Santa
nder
LEXJ
D20
.0
43-30
03-00
03-30
67
59
264^
084^
174^
6200
7000
4500
BLV VOR
Apt
Ele
v
136
118.
825
*D
-ATI
S
ASPES SUNIR
KA
LDO
RO
STO
SA
NBI
124^
132^
121^
145^
086^
6000
4000
6000
4000
4000
4000
SNR 2
T,
2Z
SNR 2TSN
R 2Z
DOSU
L 1T
SNR
2T
DOSUL 1
T, 1
Z
D15.0
SNR
D17.0
BLV
DO
SUL
(DO
SUL
1T:
IAF)
(DO
SUL
1Z,
SNR
2Z:
IAF)
(D15
.0 B
LV)
(IA
F)
(IA
F)
4000
(IA
F)
DO
SUL
1Z
SNR 2
Z4000
D12.0 M
HA
400
0
D14.0
MH
A 4
000
HO
LDIN
G O
VER
SUNIR
Alt
Set
: hP
aTr
ans
leve
l: B
y A
TC
115.
9 BLV
DBIL
BA
O
B L
V
115.3
SNR
SNR
DSA
NTA
ND
ER
15.0
5.0
7.0
11.0
4538
05101520 525
4
5
11
N43
25.
7 W
003
14.0
D15.0
Arc
.STA
R.
JEPPESEN
31 M
AR
17
CO
NTO
UR
INTE
RVA
LS
6000
4000
2000
OR B
ELO
W F
L120
MA
X 2
50 K
T A
T.SPEED
:RW
Y 1
2 ARR
IVALS
121^
CHA
NG
ES:
| J
EPPE
SEN
, 20
17.
ALL
RIG
HTS
RES
ERVED
.
DOSU
L 1Z
[DOSU
1Z]
SANTA
NDER
2T
(SNR
2T) [SNR2
T]SA
NTA
NDER
2Z (SN
R 2Z
) [SNR2
Z]
DOSU
L 1T
[DOSU
1T]
LEBB
/BIO
BILB
AO, SP
AIN
10-2
BBIL
BA
O
Reis
sue.
Printed from JeppView for Windows 5.3.0.0 on 27 Jan 2018; Terminal chart data cycle 01-2018 (Expired); Notice: After 25 Jan 2018, 0000Z, this chart may no longer be valid

D D
D
18.0
R117
BLV
SANTANDER
Seve B
alleste
ros-Santa
nder
LEXJ
43-30
03-00
03-30
02-30
67
59 26
4^
084^
174^
4500
7000
6200
BLV
VOR
Apt Elev
136*D-ATIS
118.825
ALB
IZ
SA
RRA
CA
LCE
102^
145^ 10
3^
111^
117^
R283R3
25
FL8
0
FL8
0
6000
6000
6000
SNR 2
K,
2Q
DOSUL 2
K, 2
Q
DOSU
L 2Q
SNR 2
Q
DOSUL
2K
SNR 2
K
DO
SUL
(IA
F)
(IA
F)29
1^
D18.0
MH
A 6
000
| JEPPESEN, 2017. ALL RIGHTS RESERVED.
115.3
SNR
D
115.
9 BLV
D
SAN
TAN
DER
S N
R
BIL
BA
O
B L
V
MH
A 6
000
D22.0
HO
LDIN
G O
VER
SA
RRA
Alt Set: hPaTrans level: By ATC
1020
3040
500
515
2535
455
26.0
17.0
14.0
18.0
28.0
5016
31 MAR 17 .STAR.
JEPPESEN
10-2CLEBB/BIOBILBAO
BILBAO, SPAIN
None.
CO
NTO
UR
INTE
RVA
LS
6000
4000
2000
.SPEED: MAX 250 KT AT OR BELOW FL120
D
RWY 30 ARRIVALS
CHANGES:
297^
DOSUL 2K [DOSU2K] DOSUL 2Q [DOSU2Q]
SANTANDER 2K (SNR 2K) [SNR2K]SANTANDER 2Q (SNR 2Q) [SNR2Q]
Printed from JeppView for Windows 5.3.0.0 on 27 Jan 2018; Terminal chart data cycle 01-2018 (Expired); Notice: After 25 Jan 2018, 0000Z, this chart may no longer be valid
D23.4
014^025^
118 D̂
9.0
090^
D29
.0
PAMPLONA
SAN S
EBASTIA
N
BIA
RRIT
ZPays B
asque
LESO
LFBZ
LEPP
43-00
43-30
03-00
02-00
02-30
01-30
90
95
90
67
59
90
264^
084^
174^
4500
7000
6200
BLV
VOR
1200
3200
Apt
Ele
v
136
EXPE
CT
clos
e-in
obs
tacl
es.
7.0%
V/V
(fp
m)
532
709
1063
1418
1772
2127
Gnd
spe
ed-K
T75
100
150
200
250
300
OXERA
145^
BIS
KA
FEBRI
BISK
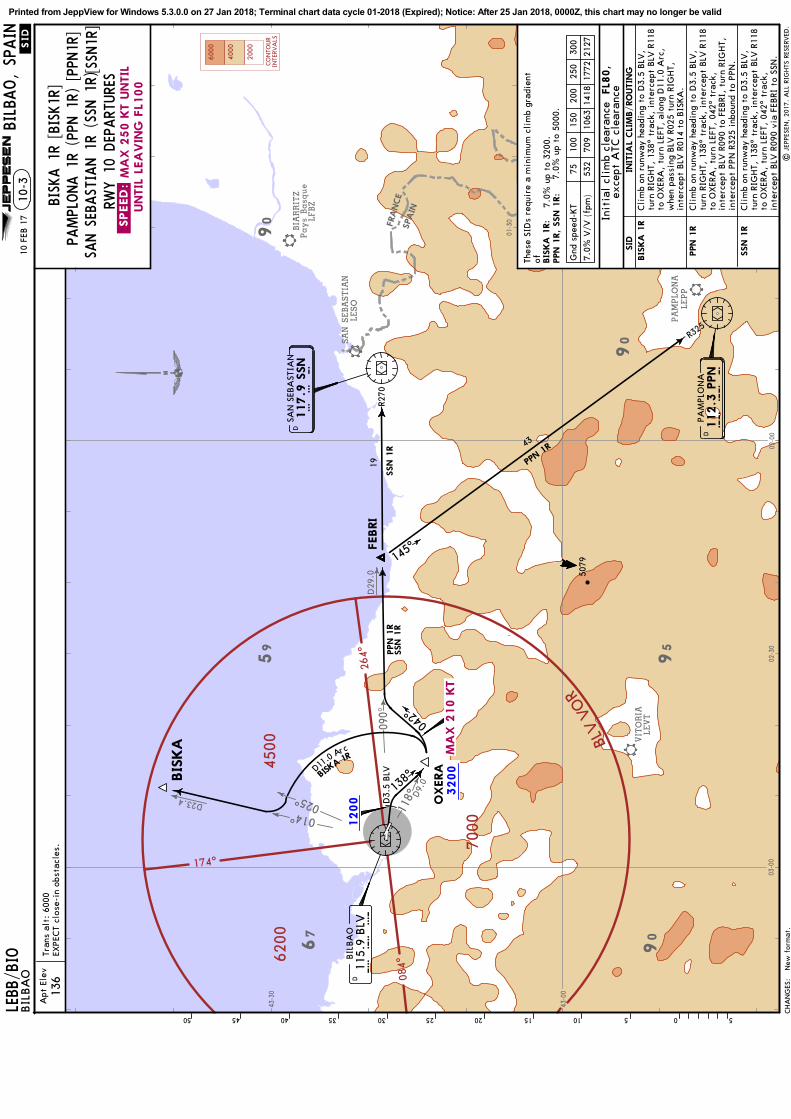
A 1R
D3.
5 BLV
138^
042^
PPN 1
RSSN 1
R
R270
SSN 1
R
PPN 1
R
R325
115.
9 BLV
D
117.9
SSN
D 112.3
PPN
DPA
MPL
ON
A
P P
N
SAN
SEB
AST
IAN
S S
N
BIL
BA
O
B L
V
Tran
s al
t: 6
000
Cli
mb
on r
unw
ay h
eadi
ng t
o D
3.5
BLV
,tu
rn R
IGH
T, 1
38^
trac
k, i
nter
cept
BLV
R11
8to
OXER
A,
turn
LEF
T, 0
42^
trac
k,
inte
rcep
t BLV
R09
0 vi
a FE
BRI
to
SSN
.
Cli
mb
on r
unw
ay h
eadi
ng t
o D
3.5
BLV
,tu
rn R
IGH
T, 1
38^
trac
k, i
nter
cept
BLV
R11
8 to
OXER
A,
turn
LEF
T, 0
42^
trac
k,
inte
rcep
t BLV
R09
0 to
FEB
RI,
turn
RIG
HT,
inte
rcep
t PP
N R
325
inbo
und
to P
PN.
1020304050 0515253545 5[SSN
1R]
5079
43
19
D11.0
Arc
Cli
mb
on r
unw
ay h
eadi
ng t
o D
3.5
BLV
,tu
rn R
IGH
T, 1
38^
trac
k, i
nter
cept
BLV
R11
8 to
OXER
A,
turn
LEF
T, a
long
D11
.0 A
rc,
whe
n pa
ssin
g BLV
R02
5 tu
rn R
IGH
T,
inte
rcep
t BLV
R01
4 to
BIS
KA
.
JEPPESEN
MA
X 2
10 K
T
UNTIL
LEA
VIN
G F
L100
.SPEED
:M
AX 2
50 K
T U
NTIL
VIT
ORIA
LEVT
SPA
IN
FRA
NCE
CO
NTO
UR
INTE
RVA
LS
6000
4000
2000
RWY 1
0 DEP
ART
URE
S
BIS
KA
1R:
PPN 1
R,
SSN 1
R:
CHA
NG
ES:
| J
EPPE
SEN
, 20
17.
ALL
RIG
HTS
RES
ERVED
.
BISK
A 1
R [BISK1R
]PA
MPL
ONA 1
R (PPN
1R) [PP
N1R
]
BIS
KA
1R
PPN 1
R
SSN 1
R
SID
INIT
IAL
CLI
MB/RO
UTIN
G
exce
pt A
TC c
lear
anceF
L80,
Init
ial
clim
b cl
eara
nce
7.0%
up
to 5
000.
7.0%
up
to 3
200.
New
for
mat
.
SAN SEB
AST
IAN 1
R (SSN
1R)
Thes
e SI
Ds
requ
ire
a m
inim
um c
lim
b gr
adie
nt
of
.SID.
LEBB
/BIO
10-3
BILB
AO, SP
AIN
10 F
EB 1
7BIL
BA
OPrinted from JeppView for Windows 5.3.0.0 on 27 Jan 2018; Terminal chart data cycle 01-2018 (Expired); Notice: After 25 Jan 2018, 0000Z, this chart may no longer be valid

014^D23.4
026^
115^
D8.
0 123^
090^
SAN S
EBASTIA
N
BIA
RRIT
ZPays B
asque
LFBZ
LESO
43-00
43-30
03-00
02-00
02-30
01-00
01-30
90
95
90
67
59
90
11
3
264^
084^
174^
6200
7000
4500
BLV
VOR
3200
Apt
Ele
v
136
EXPE
CT
clos
e-in
obs
tacl
es.
15.6
123^
12.4
145^
BISK
A 3B
BIS
KA LU
KEP
FEBRI
CEG
AM
MA
LOB
042^
PPN 2
GSSN 2
BSSN 2
B
PPN 2
G
PPN 1
H
R270
R303R3
25
117.9
SSN
D
112.3
PPN
D
115.
9 BLV
D
SAN
SEB
AST
IAN
S S
N
PAM
PLO
NA
P P
N
BIL
BA
O
B L
V
[SSN
2B]
Tran
s al
t: 6
000
1020304050 0515253545 5
Cli
mb
on r
unw
ay h
eadi
ng t
o LU
KEP
, tu
rn
LEFT
, 04
2^ t
rack
, tu
rn R
IGH
T, i
nter
cept
BLV
R09
0 to
FEB
RI,
turn
RIG
HT,
int
erce
pt
PPN
R32
5 in
boun
d to
PPN
.Cli
mb
on r
unw
ay h
eadi
ng t
o LU
KEP
, tu
rn
RIG
HT,
int
erce
pt B
LV R
123
via
CEG
AM
to M
ALO
B,
then
to
PPN
.Cli
mb
on r
unw
ay h
eadi
ng t
o LU
KEP
, tu
rn
LEFT
, 04
2^ t
rack
, tu
rn R
IGH
T, i
nter
cept
BLV
R09
0 vi
a FE
BRI
to
SSN
.
7.0%
V/V
(fp
m)
532
709
1063
1418
1772
2127
Gnd
spe
ed-K
T75
100
150
200
250
300
5079
19
43
D10.0 A
rc
Cli
mb
on r
unw
ay h
eadi
ng t
o LU
KEP
, tu
rn
LEFT
, al
ong
D10
.0 A
rc,
whe
n pa
ssin
g BLV
R02
6 tu
rn R
IGH
T, i
nter
cept
BLV
R01
4 to
BIS
KA
.
10 F
EB 1
7LEBB
/BIO
.SID.
JEPPESEN
BIL
BA
O10
-3A
BILB
AO, SP
AIN
MA
X 2
10KT
UNTIL
LEA
VIN
G F
L100
.SPEED
:M
AX 2
50 K
T U
NTIL
D29
.0
D36.
2
D51.
8
D
PAMPLONA
VIT
ORIA
LEPP
LEVT
SPAIN
FRANCE
CO
NTO
UR
INTE
RVA
LS
6000
4000
2000
RWY 1
2 DEP
ART
URE
S
BISK
A 3
B [BISK3B
]PA
MPL
ONA 2
G (PP
N 2
G) [PPN
2G]
PAMPL
ONA 1
H (PP
N 1
H) [PPN
1H]
CHA
NG
ES:
| J
EPPE
SEN
, 20
17.
ALL
RIG
HTS
RES
ERVED
.
SAN SEB
AST
IAN 2
B (SSN
2B)
New
for
mat
.
BIS
KA
3B
SID
PPN 2
G
SSN 2
B
PPN 1
H
Init
ial
clim
b cl
eara
nce
INIT
IAL
CLI
MB/RO
UTIN
G
FL8
0,
exce
pt A
TC c
lear
ance
BIS
KA
3B:
PPN 2
G,
PPN 1
H,
SSN 2
B:
7.0%
up
to 4
500.
7.0%
up
to 5
000.
Thes
e SI
Ds
requ
ire
a m
inim
um c
lim
b gr
adie
nt
of
Printed from JeppView for Windows 5.3.0.0 on 27 Jan 2018; Terminal chart data cycle 01-2018 (Expired); Notice: After 25 Jan 2018, 0000Z, this chart may no longer be valid
D23.4
PAMPLONA
SAN S
EBASTIA
N
BIA
RRIT
ZPays B
asque
LFBZ
LESO
LEPP
43-00
43-30
03-00
02-00
02-30
01-30
90
95
90
67
59
90
264^
084^
174^
4500
7000
6200
BLV
VO
R
1000
Apt
Ele
v
136
SA
NTU
BIS
KA
FEBRI
145^
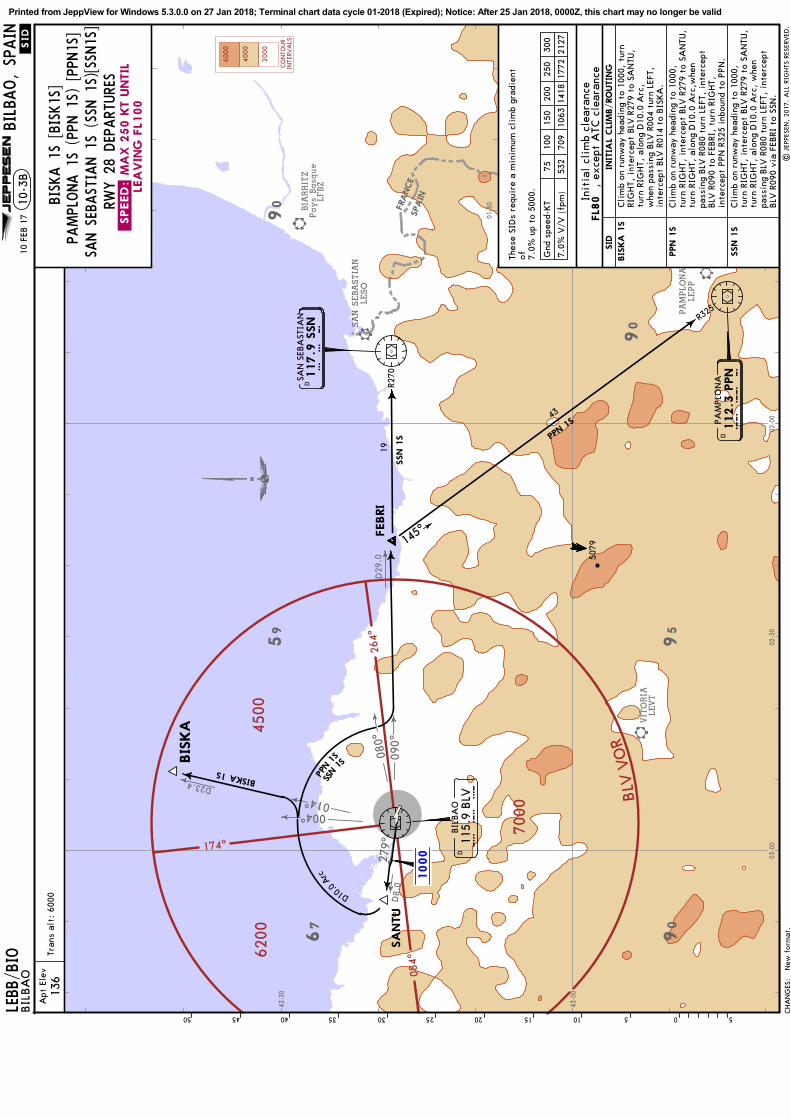
BISKA 1S
PPN
1S
SSN 1
S
R270
SSN 1
S
R325
115.
9 BLV
D
112.3
PPN
D
117.9
SSN
D
BIL
BA
O
B L
V
SAN
SEB
AST
IAN
S S
N
PAM
PLO
NA
P P
N
whe
n pa
ssin
g BLV
R00
4 tu
rn L
EFT,
in
terc
ept
BLV
R01
4 to
BIS
KA
.
7.0%
V/V
(fp
m)
532
709
1063
1418
1772
2127
Gnd
spe
ed-K
T75
100
150
200
250
300
[SSN
1S]
Tran
s al
t: 6
000
1020304050 0515253545 5
PPN 1
S
5079
D10.0
Arc
19
43
turn
RIG
HT,
alo
ng D
10.0
Arc
,whe
n pa
ssin
g BLV
R08
0 tu
rn L
EFT,
int
erce
pt
BLV
R09
0 to
FEB
RI,
turn
RIG
HT,
inte
rcep
t PP
N R
325
inbo
und
to P
PN.
turn
RIG
HT,
alo
ng D
10.0
Arc
, w
hen
pass
ing
BLV
R08
0 tu
rn L
EFT,
int
erce
pt
BLV
R09
0 vi
a FE
BRI
to
SSN
.
JEPPESEN
LEA
VIN
G F
L100
MA
X 2
50 K
T U
NTIL
.SPEED
:
279^
D8.
0
080^
090^
D29
.0
014^004^
VIT
ORIA
LEVT
FRA
NCE
SPA
IN
CO
NTO
UR
INTE
RVA
LS
6000
4000
2000
RWY 2
8 DEP
ART
URE
S
SID
Init
ial
clim
b cl
eara
nce
BIS
KA
1S
PPN 1
S
INIT
IAL
CLI
MB/RO
UTIN
G
SSN 1
S
Cli
mb
on r
unw
ay h
eadi
ng t
o 10
00,
turn
RIG
HT,
int
erce
pt B
LV R
279
to S
AN
TU,
Cli
mb
on r
unw
ay h
eadi
ng t
o 10
00,
turn
RIG
HT,
int
erce
pt B
LV R
279
to S
AN
TU,
CHA
NG
ES:
| J
EPPE
SEN
, 20
17.
ALL
RIG
HTS
RES
ERVED
.
, ex
cept
ATC
cle
aran
ceFL8
0BISK
A 1
S [BISK1S
]PA
MPL
ONA 1
S (PPN
1S) [PP
N1S
]SA
N SEB
AST
IAN 1
S (SSN
1S)
New
for
mat
.
Thes
e SI
Ds
requ
ire
a m
inim
um c
lim
b gr
adie
nt
of 7.0%
up
to 5
000.
Cli
mb
on r
unw
ay h
eadi
ng t
o 10
00,
turn
RI
GH
T, i
nter
cept
BLV
R27
9 to
SA
NTU
, tu
rn R
IGH
T, a
long
D10
.0 A
rc,
.SID.
LEBB
/BIO
BILB
AO, SP
AIN
10-3
B10
FEB
17
BIL
BA
OPrinted from JeppView for Windows 5.3.0.0 on 27 Jan 2018; Terminal chart data cycle 01-2018 (Expired); Notice: After 25 Jan 2018, 0000Z, this chart may no longer be valid
014^
313^
D23.4
PAMPLONA
SAN S
EBASTIA
N
BIA
RRIT
ZPays B
asque
LEPP
LESO
LFBZ
43-00
43-30
03-00
02-00
02-30
01-30
90
95
90
67
59
90
264^
084^
174^
4500
6200
7000
BLV V
OR
6500
3000
Apt
Ele
v
136
EXPE
CT
clos
e-in
obs
tacl
es.
BIS
KA
090^
077^
105^
145^
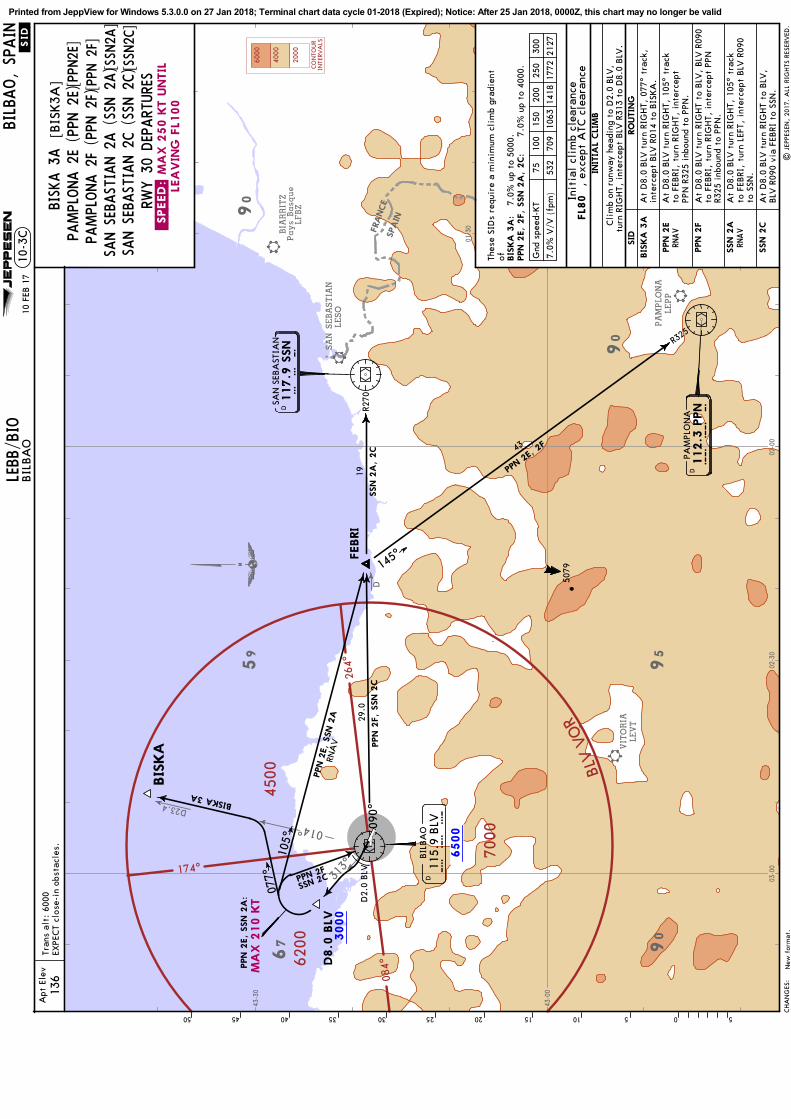
BISKA 3A
PPN 2F
SSN 2C
PPN 2
E, SSN 2
ARN
AV PPN 2
F,
SSN 2
CSSN 2
A,
2C
PPN 2
E, 2
F
R270
R325
D2.
0 BLV
D8.0
BLV
FEBRI
115.
9 BLV
D
117.9
SSN
D
112.3
PPN
D
BIL
BA
O
B L
V
SAN
SEB
AST
IAN
S S
N
P P
NPA
MPL
ON
A
RNAV
RNAV
At
D8.
0 BLV
tur
n RI
GH
T, 0
77^
trac
k,
inte
rcep
t BLV
R01
4 to
BIS
KA
.A
t D
8.0
BLV
tur
n RI
GH
T, 1
05^
trac
k to
FEB
RI,
turn
RIG
HT,
int
erce
pt
PPN
R32
5 in
boun
d to
PPN
.
At
D8.
0 BLV
tur
n RI
GH
T to
BLV
, BLV
R09
0 to
FEB
RI,
turn
RIG
HT,
int
erce
pt P
PNR3
25 i
nbou
nd t
o PP
N.
At
D8.
0 BLV
tur
n RI
GH
T, 1
05^
trac
k to
FEB
RI,
turn
LEF
T, i
nter
cept
BLV
R09
0to
SSN
.
At
D8.
0 BLV
tur
n RI
GH
T to
BLV
, BLV
R09
0 vi
a FE
BRI
to
SSN
.
turn
RIG
HT,
int
erce
pt B
LV R
313
to D
8.0
BLV
.
7.0%
V/V
(fp
m)
532
709
1063
1418
1772
2127
Gnd
spe
ed-K
T75
100
150
200
250
300
Tran
s al
t: 6
000
[SSN
2C]
[SSN
2A]
[PPN
2F]
[PP
N2E
]
1020304050 0515253545 5
29.0
5079
PPN 2
E,
SSN 2
A:
19
43
10 F
EB 1
7LEBB
/BIO
.SID.
JEPPESEN
BIL
BA
O10
-3C
BILB
AO, SP
AIN
MA
X 2
10 K
T
LEA
VIN
G F
L100
MA
X 2
50 K
T U
NTIL
.SPEED
:
D
VIT
ORIA
LEVT
FRA
NCE
SPA
IN
CO
NTO
UR
INTE
RVA
LS
6000
4000
2000
RWY 3
0 DEP
ART
URE
S
BIS
KA
3A
:PPN 2
E,
2F,
SSN 2
A,
2C:
PPN 2
E
PPN 2
F
SSN 2
C
SSN 2
A
BIS
KA
3A
SID
INIT
IAL
CLI
MB
RO
UTIN
G
Init
ial
clim
b cl
eara
nce
CHA
NG
ES:
| J
EPPE
SEN
, 20
17.
ALL
RIG
HTS
RES
ERVED
.
FL8
0,
exce
pt A
TC c
lear
ance
Cli
mb
on r
unw
ay h
eadi
ng t
o D
2.0
BLV
,
7.0%
up
to 5
000.7.
0% u
p to
400
0.
SAN SEB
AST
IAN 2
C (SSN 2
C)
SAN SEB
AST
IAN 2
A (SSN 2
A)
PAMPL
ONA 2
F (PPN
2F)
PAMPL
ONA 2
E (PPN
2E)
BISK
A 3
A[B
ISK3A
]
New
for
mat
.
Thes
e SI
Ds
requ
ire
a m
inim
um c
lim
b gr
adie
ntof
Printed from JeppView for Windows 5.3.0.0 on 27 Jan 2018; Terminal chart data cycle 01-2018 (Expired); Notice: After 25 Jan 2018, 0000Z, this chart may no longer be valid

D
43-00
43-30
03-00
03-30
02-30
90
67 59
264^
084^
174^
BLV
VO
R
4500
6200
7000
5000
1200
3200
Apt Elev
136 EXPECT close-in obstacles.
7.0% V/V (fpm) 532 709 1063 1418 1772 2127
Gnd speed-KT 75 100 150 200 250 300
Trans alt: 6000
22.1
283^
216^
262^CALCE 1R
AMTO
S 1X
DOSUL 1R
MAPAX 1R
D11.0 Arc
DOSU
L 1R
MA
PA
X 1
R
D3.5 BLVR082
AMTOS
CALCE
DOSUL MAPAX
OXERA115.9 BLV
DBILBAO
B L V
| JEPPESEN, 2017. ALL RIGHTS RESERVED.New format.
Climb on runway heading to D3.5 BLV, turn RIGHT, 138^ track, intercept BLV R118 to OXERA.
At OXERA turn LEFT, intercept BLV R082 inbound to BLV, BLV R216 to AMTOS.
At OXERA turn LEFT, intercept BLV R082 inbound to BLV, BLV R283 to CALCE.
138^
AMTOS 1XCALCE 1R
1020
3040
500
515
2535
455
17.0
4252
AMTOS 1R:
AMTOS 1RD11.0 Arc
At OXERA turn LEFT, along D11.0 Arc, when passing BLV R360 turn RIGHT, intercept BLV R349 to MAPAX.
At OXERA turn LEFT, along D11.0 Arc, when passing BLV R336 turn RIGHT, intercept BLV R325 to DOSUL.
At OXERA turn RIGHT, along D11.0 Arc, when passing BLV R207 turn LEFT, intercept BLV R216 to AMTOS.
10 FEB 17 .SID.
JEPPESEN BILBAO, SPAINLEBB/BIOBILBAO 10-3D
.SPEED: MAX 250 KT UNTIL LEAVING FL100
MAX 210 KT
MAX 250 KT
325^
D28.0
336^349^
360^
D23.2
207^
D
118^D9.0
CONTOURINTERVALS
6000
4000
2000
CALCE 1R
MAPAX 1R
DOSUL 1R
AMTOS 1X
AMTOS 1R
INITIAL CLIMB
SID ROUTING
RWY 10 DEPARTURES
AMTOS 1R [AMTO1R]AMTOS 1X [AMTO1X]CALCE 1R [CALC1R]DOSUL 1R [DOSU1R]MAPAX 1R [MAPA1R]
Initial climb clearance FL80 , except ATC clearance
CHANGES:
These SIDs require a minimum climb gradient of7.0% up to 3200.
Printed from JeppView for Windows 5.3.0.0 on 27 Jan 2018; Terminal chart data cycle 01-2018 (Expired); Notice: After 25 Jan 2018, 0000Z, this chart may no longer be valid
325^
D28.0
337^349^
D23.2
001^
D
43-00
43-30
03-00 02-30
90
67
59
264^
084^
174^
7000
6200 4500
BLV VOR
32005000
Apt Elev
136
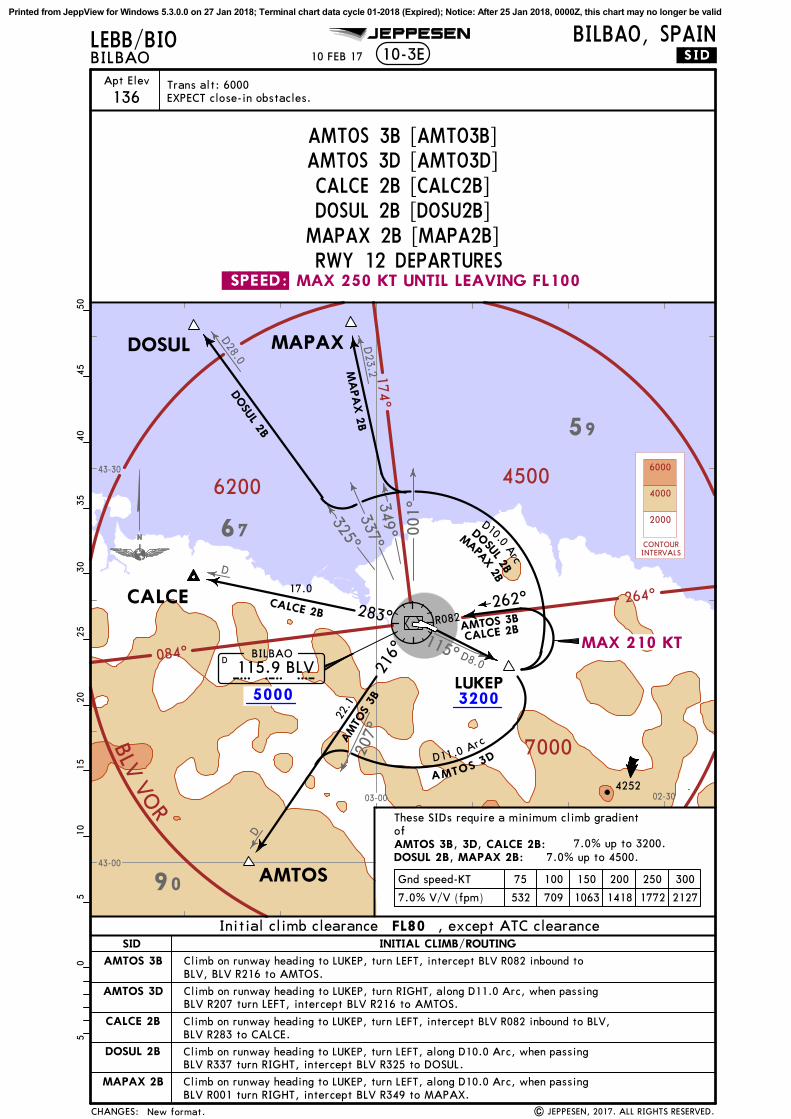
Climb on runway heading to LUKEP, turn LEFT, intercept BLV R082 inbound to BLV, BLV R216 to AMTOS.
EXPECT close-in obstacles.
7.0% V/V (fpm) 532 709 1063 1418 1772 2127
Gnd speed-KT 75 100 150 200 250 300
| JEPPESEN, 2017. ALL RIGHTS RESERVED.
Trans alt: 6000
22.1
AMTO
S 3B
CALCE 2B
DOSU
L 2B
MA
PA
X 2
B
AMTOS 3B
CALCE 2B
AMTOS 3D
262^283^
216^
DOSUL 2
MAPAX
2BB
DOSUL MAPAX
AMTOS
CALCE
LUKEP
DBILBAO
115.9 BLVB L V
1020
3040
500
515
2535
455
New format.
R082
17.0
4252
D10.0 Arc
D11.0 Arc
Climb on runway heading to LUKEP, turn LEFT, intercept BLV R082 inbound to BLV, BLV R283 to CALCE.
Climb on runway heading to LUKEP, turn LEFT, along D10.0 Arc, when passing BLV R337 turn RIGHT, intercept BLV R325 to DOSUL.
Climb on runway heading to LUKEP, turn LEFT, along D10.0 Arc, when passing BLV R001 turn RIGHT, intercept BLV R349 to MAPAX.
Climb on runway heading to LUKEP, turn RIGHT, along D11.0 Arc, when passing BLV R207 turn LEFT, intercept BLV R216 to AMTOS.
10 FEB 17 .SID.
JEPPESEN BILBAO, SPAINLEBB/BIOBILBAO 10-3E
MAX 250 KT UNTIL LEAVING FL100.SPEED:
MAX 210 KT115^ D8.0
207^
D
CONTOURINTERVALS
6000
4000
2000
CALCE 2B
SID
MAPAX 2B
DOSUL 2B
AMTOS 3D
AMTOS 3B
INITIAL CLIMB/ROUTING
RWY 12 DEPARTURES
AMTOS 3B, 3D, CALCE 2B:DOSUL 2B, MAPAX 2B:
AMTOS 3B [AMTO3B]AMTOS 3D [AMTO3D]CALCE 2B [CALC2B]DOSUL 2B [DOSU2B]MAPAX 2B [MAPA2B]
CHANGES:
, except ATC clearanceFL80Initial climb clearance
7.0% up to 3200.7.0% up to 4500.
These SIDs require a minimum climb gradient of
Printed from JeppView for Windows 5.3.0.0 on 27 Jan 2018; Terminal chart data cycle 01-2018 (Expired); Notice: After 25 Jan 2018, 0000Z, this chart may no longer be valid
315^
339^349^
D23.2
325^
D28.0
279^D8.0
283^
D17.0
D22.
1
43-00
43-30
03-00
03-30
02-30
90
67
59
264^
084^
174^
7000
6200 4500
BLV VOR
1000
Apt Elev
136
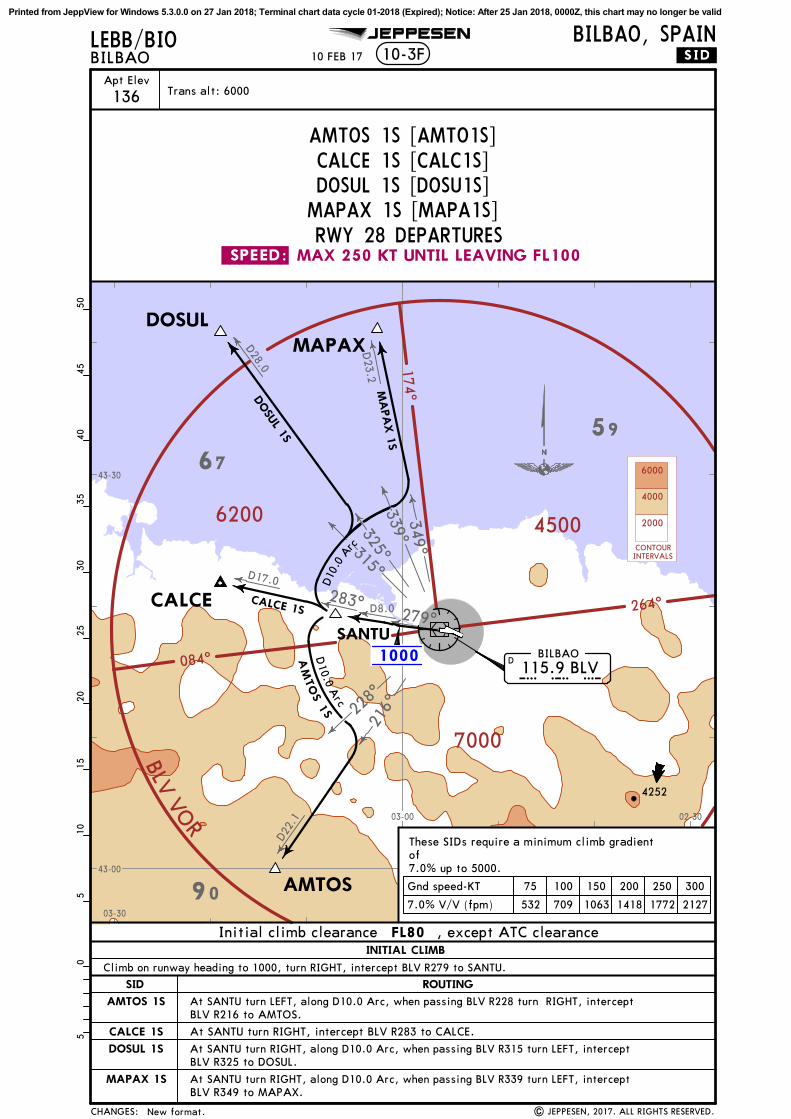
At SANTU turn RIGHT, intercept BLV R283 to CALCE.
10 FEB 17
7.0% V/V (fpm) 532 709 1063 1418 1772 2127
Gnd speed-KT 75 100 150 200 250 300
CALCE
DOSUL
MAPAX
AMTOS
CALCE 1S
DOSU
L 1S
MA
PA
X 1
S
SANTU
115.9 BLVDB L V
BILBAO
| JEPPESEN, 2017. ALL RIGHTS RESERVED.New format.
Trans alt: 600010
2030
4050
05
1525
3545
5
4252
D10
.0 A
rc
A
S
MTO
S 1
D10.0 A
rc
At SANTU turn RIGHT, along D10.0 Arc, when passing BLV R339 turn LEFT, intercept BLV R349 to MAPAX.
At SANTU turn RIGHT, along D10.0 Arc, when passing BLV R315 turn LEFT, intercept BLV R325 to DOSUL.
At SANTU turn LEFT, along D10.0 Arc, when passing BLV R228 turn RIGHT, intercept BLV R216 to AMTOS.
.SID.
JEPPESEN BILBAO, SPAIN10-3F
LEBB/BIOBILBAO
.SPEED: MAX 250 KT UNTIL LEAVING FL100
228^
216^
CONTOURINTERVALS
6000
4000
2000
RWY 28 DEPARTURES
AMTOS 1S
SID
INITIAL CLIMB
ROUTING
CALCE 1S
DOSUL 1S
MAPAX 1S
CHANGES:
AMTOS 1S [AMTO1S]CALCE 1S [CALC1S]DOSUL 1S [DOSU1S]MAPAX 1S [MAPA1S]
Climb on runway heading to 1000, turn RIGHT, intercept BLV R279 to SANTU.
Initial climb clearance FL80 , except ATC clearance
These SIDs require a minimum climb gradient of7.0% up to 5000.
Printed from JeppView for Windows 5.3.0.0 on 27 Jan 2018; Terminal chart data cycle 01-2018 (Expired); Notice: After 25 Jan 2018, 0000Z, this chart may no longer be valid

349^
D23.2
325^
D28.0
D17.0
D
43-00
43-30
03-00
03-30
90
6759
264^
084^
174^
45006200
7000
BLV VO
R
4000
3000
Apt Elev
136
At D8.0 BLV turn RIGHT, intercept BLV R325 to DOSUL.
At D8.0 BLV turn RIGHT, 052^ track, intercept BLV R349 to MAPAX.
EXPECT close-in obstacles.
7.0% V/V (fpm) 532 709 1063 1418 1772 2127
Gnd speed-KT 75 100 150 200 250 300
216^
052^
AM
TO
S 3
C
CALCE 3A
DOSU
L 2A
MA
PA
X 2
AA
MTO
S 2A
AMTO
S 2A22
.1
D2.0 BLV
115.9 BLVD
BILBAO
B L V
CALCE
DOSUL MAPAX
AMTOS
At D8.0 BLV turn RIGHT to BLV, BLV R216 to AMTOS.
At D8.0 BLV turn LEFT, intercept BLV R283 to CALCE.
| JEPPESEN, 2017. ALL RIGHTS RESERVED.
Trans alt: 6000
New format.
D8.0 BLV
1020
3040
500
515
2535
455
5016
D10.0 A
rc
At D8.0 BLV turn LEFT, along D10.0 Arc, when passing BLV R228 turn RIGHT, intercept BLV R216 to AMTOS.
10 FEB 17 .SID.
JEPPESEN BILBAO, SPAIN10-3G
LEBB/BIOBILBAO
.SPEED: MAX 250 KT UNTIL LEAVING FL100
313^283^
228^
CONTOURINTERVALS
6000
4000
2000
RWY 30 DEPARTURES
AMTOS 2A
SID
INITIAL CLIMB
ROUTING
AMTOS 3C
CALCE 3A
DOSUL 2A
MAPAX 2A
Climb on runway heading to D2.0 BLV, turn RIGHT, intercept BLV R313 to D8.0 BLV.
CHANGES:
AMTOS 2A [AMTO2A]AMTOS 3C [AMTO3C]CALCE 3A [CALC3A]DOSUL 2A [DOSU2A]MAPAX 2A [MAPA2A]
Initial climb clearance FL80 , except ATC clearance
These SIDs require a minimum climb gradient of7.0% up to 5000.
Printed from JeppView for Windows 5.3.0.0 on 27 Jan 2018; Terminal chart data cycle 01-2018 (Expired); Notice: After 25 Jan 2018, 0000Z, this chart may no longer be valid

.SID.LEBB/BIO
10-3HJEPPESEN
| JEPPESEN, 2013. ALL RIGHTS RESERVED.New chart.
22 FEB 13 .Eff.7.Mar.
Climb on runway heading to 1800', turn LEFT (MAX 250 KT), climb on002^ heading to 4000' and wait for ATC instructions.
Climb on runway heading to 1800', turn LEFT (MAX 250 KT), climb on002^ heading to 5000' and wait for ATC instructions.
Climb on 293^ heading to 4500', turn following ATC instructions.
Climb on runway heading to 4500', turn following ATC instructions.
BILBAO, SPAIN
CHANGES:
BILBAO
RWYS 10, 12, 28, 30 CONTINGENCY DEPARTURES
In the event of failure of one or more navaids used for the departuresfrom runways 10, 12, 28, 30 the following procedures shall be carried out:
RWY 10:
RWY 12:
RWY 28:
RWY 30:
These departures require minimum climb gradientsof
RWY 12:
RWY 10: 6.5% to 4000'.
6.5% to 5000'.
6.7% to 4500'.RWY 28, 30:
75 100 150 200 250 300Gnd speed-KT
6.7% V/V(fpm)
6.5% V/V(fpm) 494 658 987 1317 1646 1975
509 679 1018 1357 1696 2036
Printed from JeppView for Windows 5.3.0.0 on 27 Jan 2018; Terminal chart data cycle 01-2018 (Expired); Notice: After 25 Jan 2018, 0000Z, this chart may no longer be valid
ControlTower
APRONNORTH
APRONSOUTH
GENERALAVIATION
APRON
RWY
ADDITIONAL RUNWAY INFORMATION
ThresholdLANDING BEYOND
USABLE LENGTHS
WIDTHTAKE-OFFGlide Slope
*Tower
121.7 118.5
RVRRVR
7021' 5988'2140m 1825m
VOR D1
D2 D3
C5
A2
C1
K1
C2
B
T2
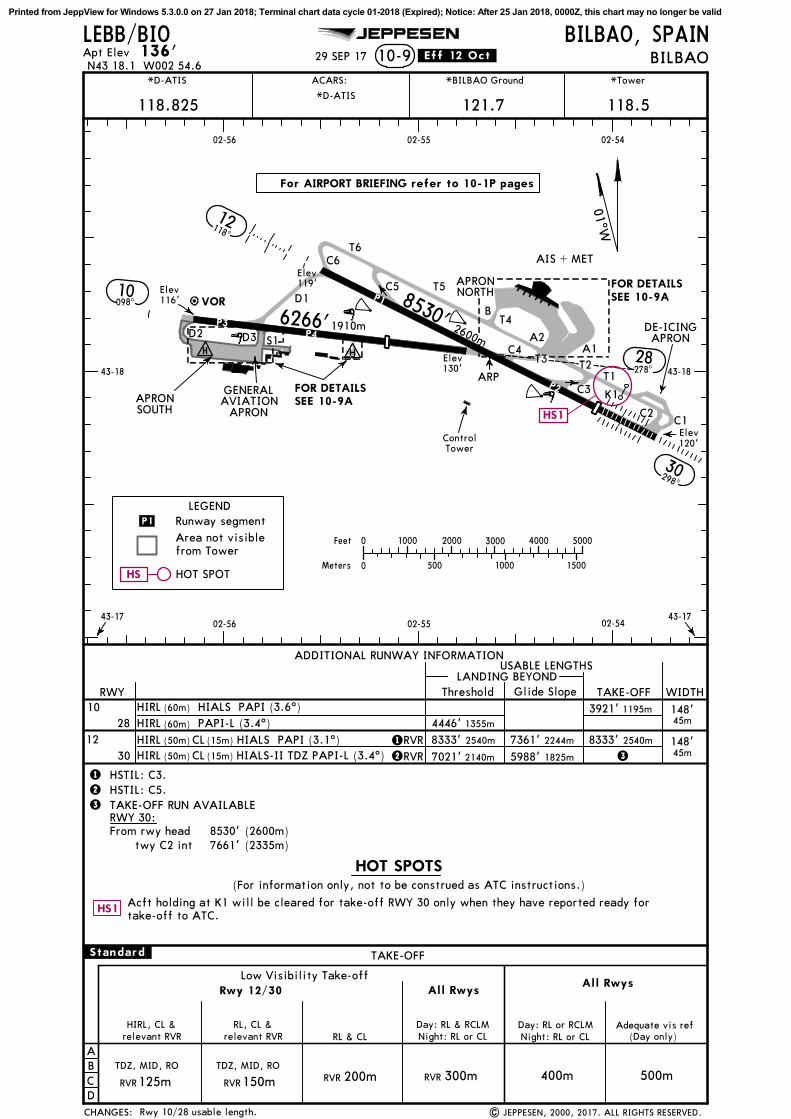
Apt Elev 136' BILBAO10-9BILBAO, SPAIN
43-18 43-18
02-55
02-55
02-56
02-56 02-54
02-5443-17 43-17
A1
2
1
LEBB/BIO
C6
C3
C4T3
T4
T5
T6AIS + MET
For AIRPORT BRIEFING refer to 10-1P pages
7361' 2244m
| JEPPESEN, 2000, 2017. ALL RIGHTS RESERVED.
01^W
JEPPESEN
FOR DETAILSSEE 10-9A
FOR DETAILSSEE 10-9A
3
3 TAKE-OFF RUN AVAILABLE
From rwy headtwy C2 int
RWY 30:8530' (2600m)7661' (2335m)
T1
4446' 1355m
3921' 1195m
2540m8333' 8333' 2540m
DE-ICINGAPRON
Acft holding at K1 will be cleared for take-off RWY 30 only when they have reported ready fortake-off to ATC.
1
2
HSTIL: C3.HSTIL: C5.
*BILBAO Ground
118.825
S1
*D-ATIS
*D-ATIS
ACARS:
29 SEP 17 .Eff.12.Oct.
TAKE-OFF
ABCD
Day: RL or RCLMNight: RL or CL (Day only)
Adequate vis refHIRL, CL &relevant RVR
RL, CL &relevant RVR RL & CL
Day: RL & RCLMNight: RL or CL
Low Visibility Take-off
.Standard.
TDZ, MID, RO TDZ, MID, RO
RVR125m 150m 200m 400m 500mRVR RVR 300mRVR
All RwysRwy 12/30
Rwy 10/28 usable length.
All Rwys
P1
Elev130'
Elev119'
Elev116'
Elev120'
ARP
10098^
6266' 1910m
1028 45m
148'
8530'2600m
1230 45m
148'
N43 18.1 W002 54.6
CHANGES:
(60m)
(60m)
(50m)
(50m) (15m)
(15m)
28278^
30298^
HIRLHIRLHIRLHIRL
CLCL
PAPI (3.1^)
12118^
HIALS PAPI (3.6^)
5000
1500
1000
1000500
0
0
Feet
Meters
2000 3000 4000
HIALSPAPI-L (3.4^)
HOT SPOT
HIALS-II TDZ PAPI-L (3.4^)
P1
P3P4
P2
LEGENDRunway segmentArea not visible from Tower
(For information only, not to be construed as ATC instructions.)
HOT SPOTS
HS1
HS
HS1
Printed from JeppView for Windows 5.3.0.0 on 27 Jan 2018; Terminal chart data cycle 01-2018 (Expired); Notice: After 25 Jan 2018, 0000Z, this chart may no longer be valid
1
2
34
5
6
7
8
9
1011
12
1314
15
16
17
18
1920 21
RWY 12/30
6A
78
89
A2
B
A1
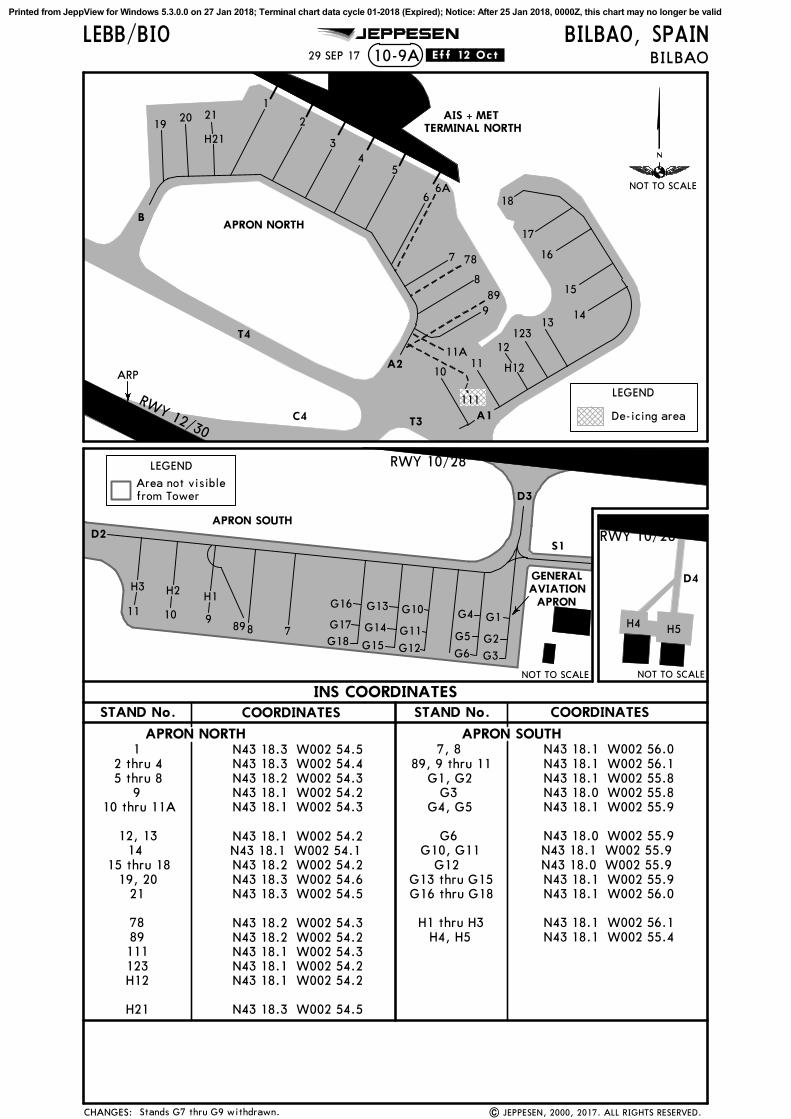
BILBAOBILBAO, SPAIN
10-9A
AIS + METTERMINAL NORTH
APRON NORTH
APRON SOUTHAPRON NORTH
LEBB/BIO
T4
C4 T3
ARP
INS COORDINATESSTAND No. COORDINATES STAND No. COORDINATES
11A
123
JEPPESEN
| JEPPESEN, 2000, 2017. ALL RIGHTS RESERVED.
RWY 10/28
D2
D3
8 791011
89
G16
G17G18
G10
G11
G12 G6
G5
G4 G1
G2
G3
G13
G14
G15
H3 H2 H1
N43 18.3 W002 54.5N43 18.3 W002 54.4N43 18.2 W002 54.3N43 18.1 W002 54.2N43 18.1 W002 54.3
N43 18.1 W002 54.2N43 18.1 W002 54.1 N43 18.2 W002 54.2N43 18.3 W002 54.6N43 18.3 W002 54.5
N43 18.2 W002 54.3N43 18.2 W002 54.2N43 18.1 W002 54.3N43 18.1 W002 54.2N43 18.1 W002 54.2
N43 18.3 W002 54.5
NOT TO SCALE
NOT TO SCALE
De-icing area
12 thru 45 thru 8
910 thru 11A
12, 13
14 15 thru 18
19, 2021
7889111123H12
H21
S1
NOT TO SCALE
H4 H5
D4
RWY 10/28
H12
H21
29 SEP 17 .Eff.12.Oct.
N43 18.1 W002 56.0N43 18.1 W002 56.1N43 18.1 W002 55.8N43 18.0 W002 55.8N43 18.1 W002 55.9
N43 18.0 W002 55.9N43 18.1 W002 55.9 N43 18.0 W002 55.9 N43 18.1 W002 55.9N43 18.1 W002 56.0
N43 18.1 W002 56.1N43 18.1 W002 55.4
Stands G7 thru G9 withdrawn.
7, 889, 9 thru 11
G1, G2G3
G4, G5
G6G10, G11
G12 G13 thru G15G16 thru G18
H1 thru H3
H4, H5
111
CHANGES:
APRON SOUTH
GENERALAVIATIONAPRON
LEGEND
Area not visible from Tower
LEGEND
Printed from JeppView for Windows 5.3.0.0 on 27 Jan 2018; Terminal chart data cycle 01-2018 (Expired); Notice: After 25 Jan 2018, 0000Z, this chart may no longer be valid
309^
1000
10001000
1000
1000
1000
10001000
1000
2000
2000
2000
2000
2000
2000
2000
3000
3000
2000
D8.0BLV
D5.0BLV
SANBI
1
D12.5
D2.4
324^
144^ 5600
(IAF)
118^
308^310^314^318^
1 (MAX 160 KT)
(MAX 180 KT)
(MAX 210 KT)
(MAX 230 KT)
BLV
IBOD2.0 BLV
D13.0 IBOD12.6 BLV
ASPES
301^
D14.0BLV
121^
ILS DME
I B O118^ *111.55 IBO
15
DME
Arc
BLV
40
00
118^
10 DME A
rc BL VIBO
D6.1D5.7 BLV
IBOD9.5 BLV
MHA4000
43-10
43-20
43-30
02-4002-5003-0003-1003-20
SUNIR
112^
D6.0 BLV
MAX 210 KT
D10.0/R-301 BLV
D4.0 IBOD3.6 BLV
D9.8
132^
7.54000to D13.0 IBO
SOMAN 3
315 DME Arc BLV4500
BILBAO, SPAINBILBAO 11-1
BRIE
FIN
G S
TRIP
TM
LEBB/BIO JEPPESEN
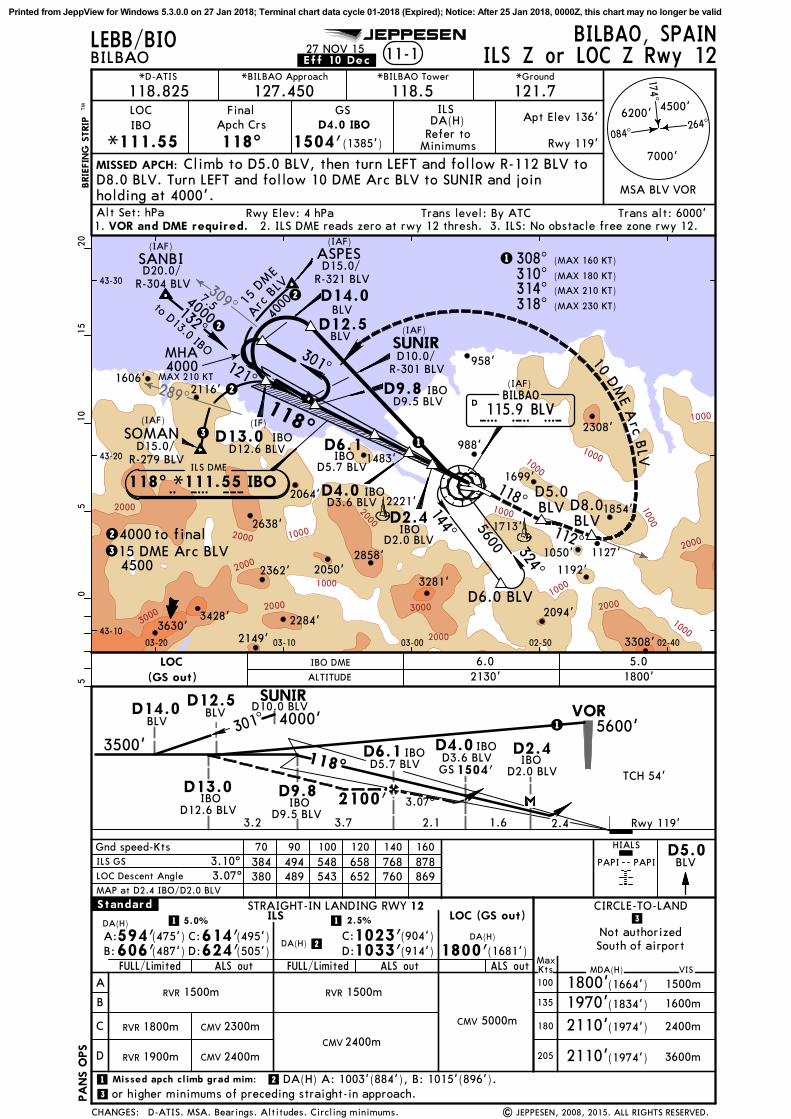
ILS Z or LOC Z Rwy 12
D5.0
12
VOR
D2.4
SUNIR
1301^
South of airportNot authorized
A
B
C
D
MDA(H)
CIRCLE-TO-LAND
1500m
1600m
STRAIGHT-IN LANDING RWY
MaxKts100
135
180
205
2400m
VIS
1800'1970'
(1664')
(1834')
(1974')2110'
BLV
D6.1
DA(H)
1800'(1681')
DA(H)
606'(487')
2300mCMV
2400mCMV
RVR
HIALS
ALS out ALS out
Gnd speed-Kts 70 90 100 120 140 160384 548494 658 768 878380 543489 652 760 869
ILS GS 3.10^
B: 624'(505')D:
ILS LOC (GS out)
ALS out(914')D:
DA(H)1033'
1
2
IBOD5.7 BLV IBO
D2.0 BLVD13.0
IBOD12.6 BLV
IBO
118^
D9.5 BLV
MAP at D2.4 IBO/D2.0 BLV
D12.5BLVD14.0
BLV
TCH 54'
| JEPPESEN, 2008, 2015. ALL RIGHTS RESERVED.
D4.0 IBOD3.6 BLVGS1504'
3.07^
3.07^
FULL/Limited FULL/Limited
.Standard.2.5%
594'(475')A: 614'(495')C: (904')C:1023'1
RVR 1500m RVR 1500m
5000mCMV1800m
2400mCMVRVR 1900m
LOC Descent Angle
D9.8
3
PAPIPAPI
05
510
1520
*BILBAO Approach *BILBAO Tower *Ground
LOCIBO
FinalApch Crs
118^ 1504'(1385')
DA(H)
MISSED APCH:
Alt Set: hPa Rwy Elev: 4 hPa Trans level: By ATC
GS ILS
*111.55Refer to
Minimums
D8.0 BLV. Turn LEFT and follow 10 DME Arc BLV to SUNIR and joinholding at 4000'.
D4.0 IBO
1. VOR and DME required.Trans alt: 6000'
2. ILS DME reads zero at rwy 12 thresh. 3. ILS: No obstacle free zone rwy 12.
118.5 121.7
21 DA(H) A: 1003'(884'), B: 1015'(896').Missed apch climb grad mim:
3 or higher minimums of preceding straight-in approach.
5.0%
2110'(1974') 3600m
Climb to D5.0 BLV, then turn LEFT and follow R-112 BLV to
27 NOV 15.Eff.10.Dec.
24000 to final
2
2
2
*D-ATIS
118.825 127.450
Apt Elev 136'
Rwy 119'
264^084^
174^
7000'
6200' 4500'
MSA BLV VOR
D15.0/R-321 BLV
D15.0/R-279 BLV
D20.0/R-304 BLV
289^
(IAF)
D115.9 BLV
BILBAO
B L V
(IAF)
(IF)
(IAF)
(IAF)
CHANGES:
5600'4000'
1.6 2.43.2
2100'
3.7
IBO DME
ALTITUDE 2130'6.0LOC
(GS out)
D10.0 BLV
3500'
1800'5.0
2.1
PA
NS O
PS
1713'
3428'
2638'
3281'
1854'
2858'
2149'
2221'
2116'
1483'
2362'
3630'
1606'
2064'
2094'
2308'
2050'
3308'
2284'
1192'
988'
1699'
958'
1050' 1127'
Rwy 119'
D-ATIS. MSA. Bearings. Altitudes. Circling minimums.
Printed from JeppView for Windows 5.3.0.0 on 27 Jan 2018; Terminal chart data cycle 01-2018 (Expired); Notice: After 25 Jan 2018, 0000Z, this chart may no longer be valid

1000
10001000
1000
1000
1000
10001000
1000
2000
2000
2000
2000
2000
2000
2000
3000
3000
2000 D5.0IBO
BILBAO, SPAINBILBAO 11-2
*BILBAO Approach *BILBAO Tower *Ground
118.5 121.7BRIE
FIN
G S
TRIP
TM
LOCIBO
FinalApch Crs
118^ 1504'(1385')
DA(H)
MISSED APCH:
D2.4
118^
Alt Set: hPa Rwy Elev: 4 hPa Trans level: By ATC Trans alt: 6000'
LEBB/BIO
GS ILS
*111.55
IBO
D13.0IBO
ASPES
ILS DME
I B O118^ *111.55 IBO 118^
IBOD6.1
IBO
43-10
43-20
43-30
02-4002-5003-0003-1003-20
05
510
1520
Refer toMinimums
JEPPESEN
D4.0 IBO
D4.0IBO
1. 2. ILS DME reads zero at rwy 12 threshold.
D9.8SOMAN
ILS Y or LOC Y Rwy 12
BILBAO*395 BB
VOR and DME and ADF required.
PROCEDURE TO BE USED ONLYWHEN BLV VOR UNSERVICEABLE.
334^
3. ILS: No obstacle free zone rwy 12.
Climb on rwy heading to D5.0 IBO, then turn LEFT
vectoring.(MAX 230 KT) on 334^ climbing to 3500', expect radar
SANTANDER115.3 SNR
DS N R
VITORIA116.6 VRA
DV R A
D32.7/R-086 SNR
D28.2/R-104 SNRD40.6/R-335 VRA
3 or higher minimums of preceding straight-in approach.
D5.0
12
D2.4
South of airportNot authorized
A
B
C
D
MDA(H)
CIRCLE-TO-LAND
1500m
1600m
STRAIGHT-IN LANDING RWY
2400m
VIS
1800'1970'
(1664')
(1834')
(1984')2120'
IBO
DA(H)1800'(1681')
DA(H)
606'(487')
2300mCMV
2400mCMV
RVR
HIALS
ALS out ALS out
Gnd speed-Kts 70 90 100 120 140 160384 548494 658 768 878380 543489 652 760 869
ILS GS 3.10^
B: 624'(505')D:
ILS LOC (GS out)
ALS out
(914')D:DA(H)
1033'
1
2
21
IBO
D13.0 IBO IBO
TCH 54'
D4.0 IBO
3.07^
FULL/Limited FULL/Limited
.Standard. 5.0%2.5%
594'(475')A: 614'(495')C: (904')C:1023'1
DA(H) A: 1003'(884'), B: 1015'(896').
RVR 1500m RVR 1500m
5000mCMV1800m
2400mCMVRVR 1900m
LOC Descent Angle
D9.8
Missed apch climb grad mim:
3
PAPIPAPI
MAP at D2.4 IBO
onhdg
RWY
GS1504'IBOD6.1
118^118^
3600m(1984')2120'
D25.5/R-086 SNRSANBI
4000' 4000'
4500'
MaxKts100
135
180
205
| JEPPESEN, 2013, 2015. ALL RIGHTS RESERVED.
27 NOV 15.Eff.10.Dec.
*D-ATIS
118.825 127.450
Apt Elev 136'
Rwy 119'
264^084^
174^
7300'
6700'4500'
MSA B Lctr
CHANGES:
IBO DME
ALTITUDE 2130'6.0
(IF)
(IAF)
LOC(GS out) 1800'
5.0
(IAF)
PA
NS O
PS
1.6 2.43.2
2100'
3.7
3500'
2.1
(IAF)
1713'
3428'
2638'
3281'
1854'
2858'
2149'
2221'
2116'
1483'
2362'
3630'
1606'
2064'
2094'
2308'
2050'
3308'
2284'
1192'
988'
1699'
958'
1050'1127'
Rwy 119'
D-ATIS. Bearings. GS.
Printed from JeppView for Windows 5.3.0.0 on 27 Jan 2018; Terminal chart data cycle 01-2018 (Expired); Notice: After 25 Jan 2018, 0000Z, this chart may no longer be valid
1000
10001000
1000
2000
20002000
2000
2000
20002000
1000
1000
2000
2000
3000
1000
3000
400 0
3000
43-10
43-20
02-3002-4002-5003-00
D2.0 BLV
KARMAD20.1 BLV
(IF)
317^
3.9 6000297^
SARRA
IBLD11.3D12.9 BLV
D18.0 BLV
IBLD6.5
D8.0 BLV
D4.0IBL
D5.5 BLV
IBLD1.0D2.6 BLV
IBLD8.6D10.1 BLV
D13.5D15.0 BLV
IBL
IBLD3.0D4.5 BLV
D11.7 IBLD13.2 BLV
117^
D22.0BLV
MHA6000
D18.6 IBL
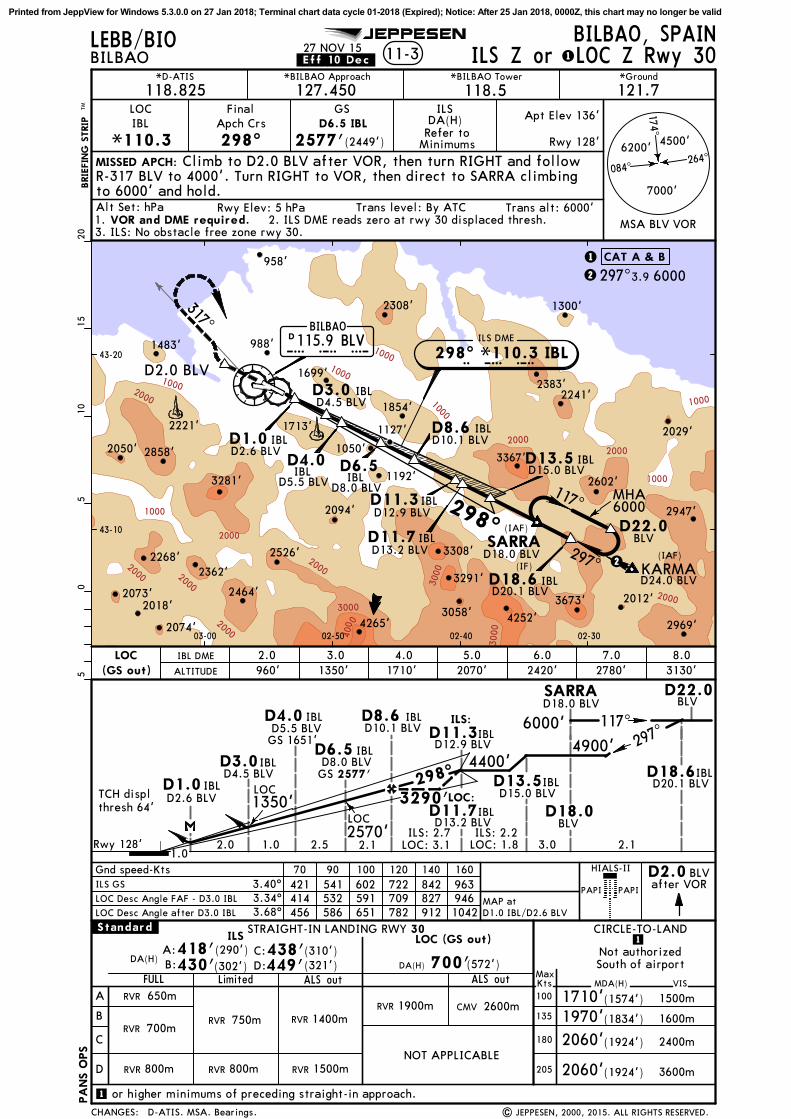
298^
BILBAO, SPAINBILBAO 11-3
*BILBAO Approach *BILBAO Tower *GroundBRIE
FIN
G S
TRIP
TM
Alt Set: hPa Rwy Elev: 5 hPa Trans level: By ATC Trans alt: 6000'
118.5 121.7LOC
*110.3IBL
FinalApch Crs
298^
GS
2577'(2449')
ILSDA(H)
MISSED APCH:
D6.5 IBLRefer to
Minimums
Climb to D2.0 BLV after VOR, then turn RIGHT and follow
LEBB/BIO
2. ILS DME reads zero at rwy 30 displaced thresh.1.
JEPPESEN
VOR and DME required.3. ILS: No obstacle free zone rwy 30.
ILS Z or LOC Z Rwy 30
R-317 BLV to 4000'. Turn RIGHT to VOR, then direct to SARRA climbingto 6000' and hold.
STRAIGHT-IN LANDING RWY
A
B
C
D
FULL ALS out
30
MDA(H)
CIRCLE-TO-LANDILS
MaxKts100
135
180
205
VIS
1500m
1600m
2400m
3600m
ALS out
LOC (GS out)
DA(H) 700'(572')
3.40^Gnd speed-Kts
PAPI
LOC
(GS out) ALTITUDE
IBL DME
1710'1970'2060'
(1574')
(1924')
(1834')
South of airportNot authorized
CMV 2600mRVR
RVR 1900mRVR 1400m
RVR
650m
700m
(1924')2060'
A:B:
C:D:
(290')(302')
(310')(321')
DA(H)418'430'
438'449'
ILS GSBLVD2.0
after VOR70 90 100 120 140 160421 541 602 722 842 963414 532 591 709 827 946
PAPI
4.01710'
5.0 6.02420' 3130'
8.02070'
7.0
HIALS-II
| JEPPESEN, 2000, 2015. ALL RIGHTS RESERVED.
3.01350'
2.0960'
456 586 651 782 912 1042
2780'
3.34^3.68^LOC Desc Angle after D3.0 IBL
MAP atD1.0 IBL/D2.6 BLV
Limited
RVR 750m
.Standard.
NOT APPLICABLE
1
1 or higher minimums of preceding straight-in approach.
LOC Desc Angle FAF - D3.0 IBL
05
510
1520
117^
BLV
IBL
297^
D18.0 BLV
BLV
298^
IBL
IBL
IBLIBL
ILS:
LOC:
IBL
CAT A & B
27 NOV 15.Eff.10.Dec.
RVR 800m RVR 800m RVR 1500m
*D-ATIS
118.825 127.450
Apt Elev 136'
Rwy 128'
264^084^
174^
7000'
6200' 4500'
MSA BLV VOR
297^D24.0 BLV
2(IAF)
2
ILS DME
298^ *110.3 IBLI B LD115.9 BLV
BILBAO
B L V
(IAF)
1
1
CHANGES:
PA
NS O
PS
4900'6000'
D18.6D20.1 BLV
SARRA
D18.0
2.1
D22.0
1.02.0 2.1 3.0
4400'
3290'
1.0
1350'TCH displthresh 64'
D11.3IBLD12.9 BLV
D8.0 BLV2577'GS
LOC2570'
D5.5 BLV1651'GS
2.5
D4.0
D2.6 BLVD1.0
D4.5 BLVD3.0
IBL
D6.5
D8.6D10.1 BLV
LOC: 1.8ILS: 2.2ILS: 2.7
LOC: 3.1
D11.7IBLD13.2 BLV
LOC D15.0 BLVD13.5
1127'1713'
2383'
2362'
3281'
1854'
2268'
2464'3673'
2602'
2969'4252'
2858'
2221'
3367'
4265'
1483'
2526'
2947'
2029'
3291'
2094'
1300'2308'
2074'
2050'
2073'
3308'
2018'
1050'
2012'3058'
1192'
2241'
988'
1699'
958'
Rwy 128'
D-ATIS. MSA. Bearings.
Printed from JeppView for Windows 5.3.0.0 on 27 Jan 2018; Terminal chart data cycle 01-2018 (Expired); Notice: After 25 Jan 2018, 0000Z, this chart may no longer be valid

1000
1000 1000
1000
2000
20002000
2000
2000
20002000
1000
1000
2000
2000
3000
1000
3000
400 0
3000
43-10
43-20
02-3002-4002-50
KARMA(IF)
298^
D18.6 IBL
IBLD11.3
IBLD6.5
D4.0IBL
PROCEDURE TO BE USED ONLYWHEN BLV VOR UNSERVICEABLE.
BILBAO*395 BB
298^
063^
298^ 7.34400
BILBAO, SPAINBILBAO 11-4
*BILBAO Approach *BILBAO Tower *GroundBRIE
FIN
G S
TRIP
TM
Alt Set: hPa Rwy Elev: 5 hPa Trans level: By ATC Trans alt: 6000'
118.5 121.7LOC
*110.3IBL
FinalApch Crs
298^
GS
2577'(2449')
ILSDA(H)
MISSED APCH:
D6.5 IBLRefer to
Minimums4500'6700'
7300'
084^264^
174^
MSA
LEBB/BIO
2. ILS DME reads zero at rwy 30 displaced thresh.1.
JEPPESEN
ILS Y Rwy 30
DME and ADF required.B Lctr
A
B
C
D
STRAIGHT-IN LANDING RWY
FULL ALS out
30
MDA(H)
CIRCLE-TO-LAND
ILS
MaxKts100
135
180
205
VIS
1500m
1600m
2400m
3600m
3.40^Gnd speed-Kts
PAPI
1800'1970'2120'
(1664')
(1984')
(1834')
South of airportNot authorized
(1984')2120'
DA(H)
298^
70 90 100 120 140 160421 541 602 722 842 963 PAPI
HIALS-II
IBL
Limited
.Standard.
IBL
GS 2000'
hdgon RWY
Missed apch climb grad mim 4.0%
ALS out
DA(H)
Missed apch climb grad mim 2.5%
6000'
210 KT) onto 063^ from Lctr climbing to 3500'. Expect radar vectoring.
05
510
15
3. ILS: No obstacle free zone rwy 30.
FULL/Limited
A:B:
C:D:
(591')(603')
(611')(622')
719'731'
739'750'
RVR 1500m
CMV 2100m
CMV 2200m
RVR 1500m
CMV 2400m
A:B:
C:D:
(272')(284')
(292')(303')
400'412'
420'431'
RVR 750m
RVR 1300m
RVR 1400m
RVR
RVR
600m
700m
RVR 650m
Climb on rwy heading to 2000', then turn RIGHT (MAX
| JEPPESEN, 2013, 2015. ALL RIGHTS RESERVED.
27 NOV 15 .Eff.10.Dec.
03-00
*D-ATIS
118.825 127.450
Apt Elev 136'
Rwy 128'
(IAF)
ILS DME
298^ *110.3 IBLI B L
PA
NS O
PS
CHANGES:
Rwy 128' 4.0 4.8
4400'
TCH displthresh 64'
D11.3IBL
2577'GS
1651'GS
2.5
D4.0
D6.5
1127'1713'
2383'
2362'
3281'
1854'
2268'
2464'3673'
2602'
2969'4252'
2858'
2221'
3367'
4265'
1483'
2526'
2947'
2029'
3291'
2094'
1300'2308'
2074'
2050'
2073'
3308'
2018'
1050'
2012'3058'
1192'
2241'
988'
1699'
958'
D-ATIS. Bearings.
Printed from JeppView for Windows 5.3.0.0 on 27 Jan 2018; Terminal chart data cycle 01-2018 (Expired); Notice: After 25 Jan 2018, 0000Z, this chart may no longer be valid

1000
1000
1000
2000
20002000
2000
2000
20002000
1000
1000
2000
2000
3000
1000
3000
400 0
3000
43-10
43-20
02-3002-4002-50
KARMA(IF)
298^
D18.6 IBL
IBLD10.8
IBLD5.7
D1.0IBL
PROCEDURE TO BE USED ONLYWHEN BLV VOR UNSERVICEABLE.
BILBAO*395 BB
298^
063^
298^ 7.84000
BILBAO, SPAINBILBAO 11-5
*BILBAO Approach *BILBAO Tower *GroundBRIE
FIN
G S
TRIP
TM
Alt Set: hPa Rwy Elev: 5 hPa Trans level: By ATC Trans alt: 6000'
118.5 121.7LOC
*110.3IBL
FinalApch Crs
298^ 4000'(3872')
MISSED APCH:
4500'6700'
7300'
084^264^
174^
MSA
LEBB/BIO
2. LOC DME reads zero at rwy 30 displaced thresh.1.
JEPPESEN
LOC Y Rwy 30
DME and ADF required. B Lctr
A
B
C
D
05
510
1520
STRAIGHT-IN LANDING RWY 30
MDA(H)
CIRCLE-TO-LAND
MaxKts100
135
180
205
VIS
1500m
1600m
2400m
3600m
Gnd speed-Kts
PAPI
1800'1970'2120'
(1664')
(1984')
(1834')
South of airportNot authorized
(1984')2120'
298^
70 90 100 120 140 160
PAPI
HIALS-II
IBL
.Standard.
IBL
2000'
hdgon RWY
ALS out(672')DA(H) 800'
RVR 1500m
CMV 2400m
Minimum AltD10.8 IBL
DA(H)
800'(672')
D3.5IBL
IBL
Descent angle 3.38^ 419 538 598 718 837 957
MAP at D1.0 IBL
2230'1440'
Climb on rwy heading to 2000', then turn RIGHT (MAX
210 KT) onto 063^ from Lctr climbing to 3500'. Expect radar vectoring.
6000'
03-00
27 NOV 15 .Eff.10.Dec.
| JEPPESEN, 2013, 2015. ALL RIGHTS RESERVED.
*D-ATIS
118.825 127.450
Apt Elev 136'
Rwy 128'
(IAF)
LOC DME
298^ *110.3 IBLI B L
PA
NS O
PS
CHANGES:
Rwy 128' 2.5 5.1
4000'
D10.8IBL
2.2
D3.5D5.7
D1.0
1.0
IBL DME
ALTITUDE
2.0 3.01260'
4.01620'
5.01980'
6.02330'
7.02690'
8.03050'
9.03410'
10.03770'900'
1127'1713'
2383'
2362'
3281'
1854'
2268'
2464'3673'
2602'
2969'4252'
2858'
2221'
3367'
4265'
1483'
2526'
2947'
2029'
3291'
2094'
1300'2308'
2074'
2050'
2073'
3308'
2018'
1050'
2012'3058'
1192'
2241'
988'
1699'
958'
D-ATIS. Bearings.
Printed from JeppView for Windows 5.3.0.0 on 27 Jan 2018; Terminal chart data cycle 01-2018 (Expired); Notice: After 25 Jan 2018, 0000Z, this chart may no longer be valid
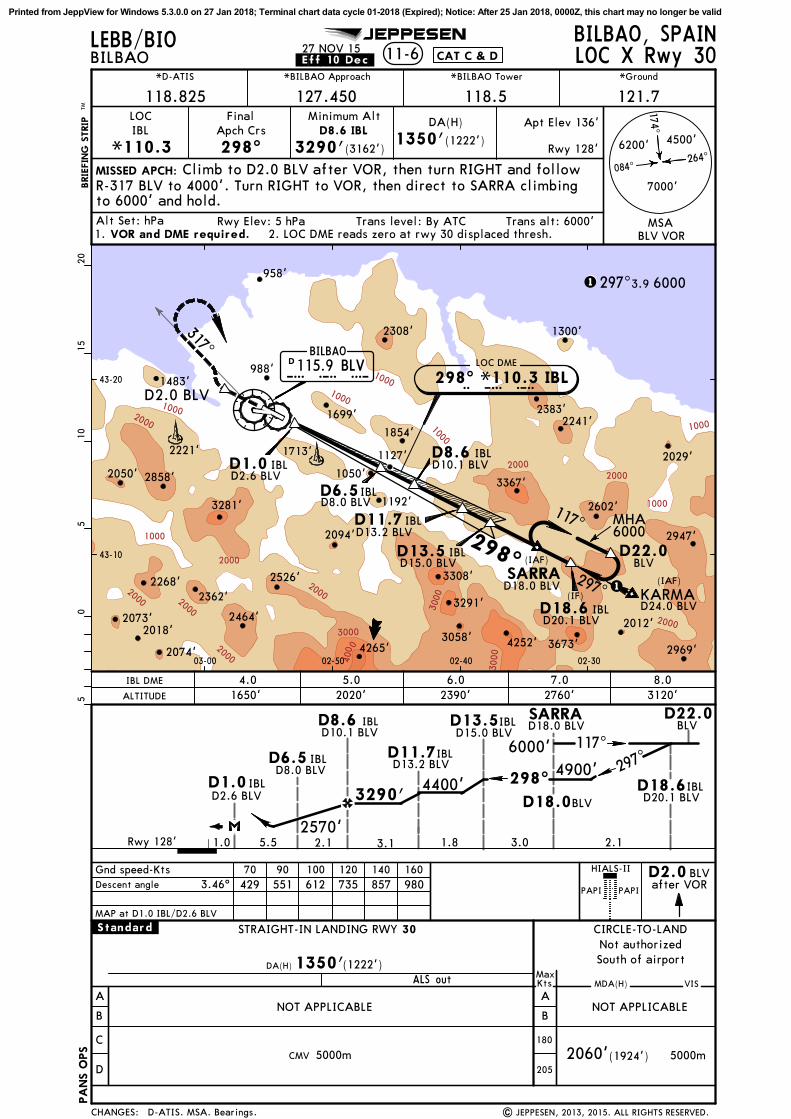
1000
10001000
1000
2000
20002000
2000
2000
20002000
1000
1000
2000
2000
3000
1000
3000
400 0
3000
43-10
43-20
02-3002-4002-50
BILBAO, SPAINBILBAO 11-6
STRAIGHT-IN LANDING RWY
A
B
C
D
30
MDA(H)
CIRCLE-TO-LAND
MaxKts
180
205
VISALS outDA(H)
3.46^Gnd speed-Kts
PAPI
*BILBAO Approach *BILBAO Tower *GroundBRIE
FIN
G S
TRIP
TM
ALTITUDE
IBL DME
D2.0 BLV
KARMA
D20.1 BLV
(IF)
South of airportNot authorized
CMV 5000m
Alt Set: hPa Rwy Elev: 5 hPa Trans level: By ATC Trans alt: 6000'
05
510
1520
317^
118.5 121.7LOC
*110.3IBL
FinalApch Crs
298^ 3290'(3162')
DA(H)
MISSED APCH:
D8.6 IBL
3.9 6000297^
4500'6200'
7000'
084^264^
174^
BLVD2.0after VOR
70 90 100 120 140 160429 551 612 735 857 980 PAPI
LEBB/BIO
HIALS-II
2. LOC DME reads zero at rwy 30 displaced thresh.1.
JEPPESEN
.Standard.
IBL
IBLD8.6D10.1 BLV
D13.5D15.0 BLV
IBL
VOR and DME required.MSA
BLV VOR
LOC X Rwy 30CAT C & D
Minimum Alt
1350'(1222')
D11.7 IBLD13.2 BLV
D1.0 IBLD2.6 BLV
D6.5D8.0 BLV
IBL
4.01650'
5.02020'
6.02390' 2760'
7.0 8.03120'
Descent angle
MAP at D1.0 IBL/D2.6 BLV
A
BNOT APPLICABLENOT APPLICABLE
1350'(1222')
5000m2060' (1924')
Climb to D2.0 BLV after VOR, then turn RIGHT and followR-317 BLV to 4000'. Turn RIGHT to VOR, then direct to SARRA climbingto 6000' and hold.
298^
117^
BLVD22.0
SARRAD18.0 BLV
D18.6 IBL
MHA6000
IBL
IBL
117^BLV
IBL
D18.0 BLV
BLV
03-00
27 NOV 15.Eff.10.Dec.
| JEPPESEN, 2013, 2015. ALL RIGHTS RESERVED.
*D-ATIS
118.825 127.450
Apt Elev 136'
Rwy 128'
297^
297^
298^
D24.0 BLV
CHANGES:
1(IAF)
1
LOC DME
298^ *110.3 IBLI B LD115.9 BLV
BILBAO
B L V
Rwy 128' 1.0 2.1 3.0
4400'3290'
5.5
4900'
2570'
D2.6 BLVD1.0
PA
NS O
PS
3.1 1.8
(IAF)
D8.0 BLVD6.5
IBLD8.6D10.1 BLV
D11.7IBLD13.2 BLV
D15.0 BLVD13.5
6000'
D22.0
D18.6D20.1 BLV
SARRA
D18.0
2.1
1127'1713'
2383'
2362'
3281'
1854'
2268'
2464'
3673'
2602'
2969'4252'
2858'
2221'
3367'
4265'
1483'
2526'
2947'
2029'
3291'
2094'
1300'2308'
2074'
2050'
2073'
3308'
2018'
1050'
2012'3058'
1192'
2241'
988'
1699'
958'
D-ATIS. MSA. Bearings.
Printed from JeppView for Windows 5.3.0.0 on 27 Jan 2018; Terminal chart data cycle 01-2018 (Expired); Notice: After 25 Jan 2018, 0000Z, this chart may no longer be valid

1000
1000
1000
1000
1000
1000
1000
2000
2000
2000
2000
3000
2000
2000
2000
2000
2000
3000
3000
3000
KALDO
43-10
43-20
43-30
BILBAO, SPAINBILBAO 13-1
*BILBAO Approach *BILBAO Tower *Ground
118.5 121.7BRIE
FIN
G S
TRIP
TM
1
D8.0
D6.0
D11.0
D12.0
2
02-4002-5003-0003-10
D2.0
D6.0
324^
144^ 5600
028^112^
(IAF)
124^
304^
D8.0on
R-112
PAPIBLV
115.9
12
VOR
D2.0
ROSTO
D11.0 D6.0
1D12.0
304^
124^
South of airportNot authorized
A
B
C
D
MDA(H)
CIRCLE-TO-LAND
1500m
1600m
STRAIGHT-IN LANDING RWY
MaxKts100
135
180
205
4000m
VIS
1710'1970'
(1574')
(1834')
(1974')2110'
05
510
1520
D5.0
D11.0
BLV115.9
D5.0
Missed apch climb gradient mim 2.5%
DA(H)
5000mCMV
1430'(1311')DA(H) 980'(861')
3600m
RVR 1500m
CMV
Missed apch climb gradient mim 5.0%
313^316^320^323^
1
4.0 3600124^
LEBB/BIO
HIALS
ALS out ALS out
PAPI
(MAX 160 KT)
(MAX 180 KT)
(MAX 210 KT)
(MAX 230 KT)210 KT
4000MHA
MAX
VOR Rwy 12
[FD12]
[5~VOR]
[MD12]
[5~VOR]
[FD12]
[MD12]
MAX 210 KT
| JEPPESEN, 2001, 2015. ALL RIGHTS RESERVED.
VOR
115.9BLV
FinalApch Crs
124^ 2300'(2181')
DA(H)
MISSED APCH:
Minimum AltD6.0
4500'6200'
7000'
084^264^
174^
Alt Set: hPa Rwy Elev: 4 hPa Trans level: By ATC Trans alt: 6000'MSA BLV VOR
Refer toMinimums
Climb direct to VOR, follow R-112 to D8.0, then turn LEFT
climbing to 4000' and hold.on 028^ climbing to 3500'. Turn LEFT to VOR, then direct to ROSTO
1. 2. Final approach track offset 7^ from rwy centerline.
JEPPESEN
TCH 54'3.24^
.Standard.
4000mCMV
DME required.
1
1 or higher minimums of preceding straight-in approach.
27 NOV 15 .Eff.10.Dec.
Gnd speed-KtsDescent Angle 3.24^
70 90 100 120 140 160401 516 573 688 803 917
MAP at D2.0
*D-ATIS
118.825 127.450
Apt Elev 136'
Rwy 119'
ROSTOD8.0
D15.0
(IAF)
CHANGES:
D115.9 BLV
BILBAO
B L V
5600'3600'
4000'
3.0 2.05.0
2300'
(IF)
1.0
2010'
D8.0
(IAF)
2
BLV DME
ALTITUDE 2010'5.0
1670'4.0
PA
NS O
PS
0.4 0
1127'1713'
2383'
3428'
2362'
2638'
3281'
1854'
2268'
2858'
2149'
2221'
3367'
2116'
1483'
2526'
2362'
2268'
2064'
3291'
2094'
1300'
2807'
2308'
2050'
3308'
1050'
2284'
1192'
2362'
2241'
988'
1699'
2208'
958'
Rwy 119'
D-ATIS. MSA. Bearings. Circling minimums.
Printed from JeppView for Windows 5.3.0.0 on 27 Jan 2018; Terminal chart data cycle 01-2018 (Expired); Notice: After 25 Jan 2018, 0000Z, this chart may no longer be valid
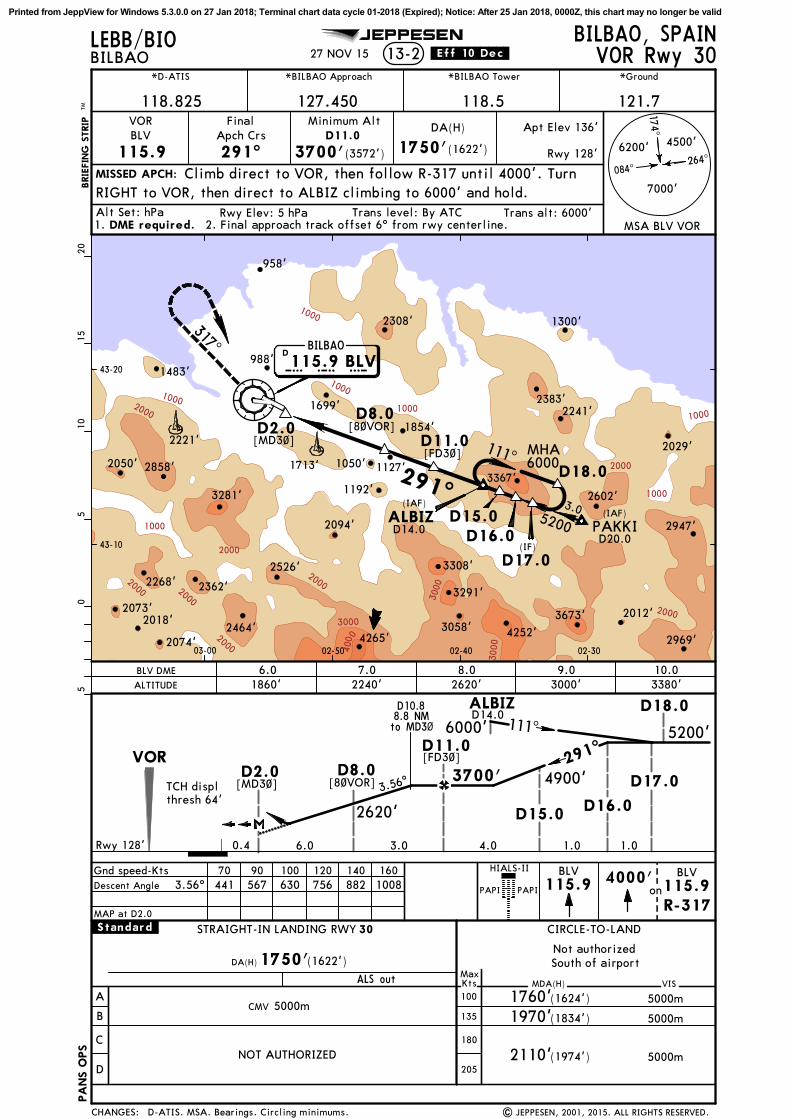
1000
1000
1000
2000
2000
2000
2000
20002000
1000
1000
2000
2000
3000
1000
3000
400 0
3000
1000
43-10
43-20
02-3002-4002-50
BILBAO, SPAINBILBAO 13-2
*BILBAO Approach *BILBAO Tower *Ground
118.5 121.7BRIE
FIN
G S
TRIP
TM
VOR
115.9BLV
FinalApch Crs
291^ 3700'(3572')
DA(H)
MISSED APCH:
6000MHA
PAKKI
D17.0
Minimum AltD11.0
1750'(1622')
Climb direct to VOR, then follow R-317 until 4000'. Turn
onR-317
4000'
A
B
C
D
CIRCLE-TO-LANDSTRAIGHT-IN LANDING RWY 30
ALS out MDA(H)MaxKts100
135
180
205
VIS
5000m
5000m
5000m
DA(H)1750'(1622')
D18.0291^
111^D11.0
D2.0D8.0
ALBIZ3.0
317^
4500'6200'
7000'
084^264^
174^
Alt Set: hPa Rwy Elev: 5 hPa Trans level: By ATC Trans alt: 6000'MSA BLV VOR
1760'1970'
(1624')
(1834')
South of airportNot authorized
(1974')2110'
CMV 5000m
05
510
1520
D15.0
VOR
BLV115.9
BLV115.9
5200D16.0
111^
RIGHT to VOR, then direct to ALBIZ climbing to 6000' and hold.
291^
PAPI PAPI
LEBB/BIO
HIALS-II
1. DME required. 2. Final approach track offset 6^ from rwy centerline.
VOR Rwy 30
[MD3~] [8~VOR]
[FD3~]
[MD3~][8~VOR]
[FD3~]
| JEPPESEN, 2001, 2015. ALL RIGHTS RESERVED.
JEPPESEN
3.56^
.Standard.
TCH displthresh 64'
NOT AUTHORIZED
D10.88.8 NMto MD3~
27 NOV 15 .Eff.10.Dec.
03-00
Gnd speed-KtsDescent Angle 3.56^
70 90 100 120 140 160441 567 630 756 882 1008
MAP at D2.0
*D-ATIS
118.825 127.450
Apt Elev 136'
Rwy 128'
CHANGES:
Rwy 128' 0.4 6.0
5200'
3700'
(IAF)
BLV DME
ALTITUDE 1860'6.0
2240'7.0
2620'8.0
3000'9.0
3380'10.0
(IF)
(IAF)
D
115.9 BLVBILBAO
B L V
D2.0 D8.0
D11.0
3.0
2620' D16.0
ALBIZ
6000'
4900'
4.0 1.0
D15.0
D14.0
D14.0
D17.0
1.0
D18.0
PA
NS O
PS
1127'1713'
2383'
2362'
3281'
1854'
2268'
2464'3673'
2602'
2969'4252'
2858'
2221'
3367'
4265'
1483'
2526'
2947'
2029'
3291'
2094'
1300'2308'
2074'
2050'
2073'
3308'
2018'
1050'
2012'3058'
1192'
2241'
988'
1699'
958'
D-ATIS. MSA. Bearings. Circling minimums.
D20.0
Printed from JeppView for Windows 5.3.0.0 on 27 Jan 2018; Terminal chart data cycle 01-2018 (Expired); Notice: After 25 Jan 2018, 0000Z, this chart may no longer be valid
TERMINAL CHART CHANGE NOTICES
Chart Change Notices for Airport LEBB
Type: TerminalEffectivity: TemporaryBegin Date: 20180104End Date: 20180630
During activation of Phase 2 on works of Replacement of cabling (based on SUP 129-17), TWY D1 is u/s.
TERMINAL CHART CHANGE NOTICES
Chart Change Notices for Airport LEBB
Type: TerminalEffectivity: TemporaryBegin Date: 20180104End Date: 20180630
During activation of Phase 2 on works of Replacement of cabling (based on SUP 129-17), TWY D1 is u/s.
Terminal Chart Change NoticesPage 1 - Printed on 27 Jan 2018Notice: After 25 Jan 2018, 0000Z, this data may no longer be valid(c) JEPPESEN SANDERSON, INC., 2018, ALL RIGHTS RESERVED
jep=JEPPESEN
JeppView for Windows


![What's your `eX5 - ARTHURarthur.hpt.at/php/online_links/links/LP_21456.pdf · 71 unit ( 8]z[ dg xdd`4 4gcf vjg rctcitcrj qp vjg tkijv cpf eqpegpvtcvg qp vjg igpgtcn kfgc 6jgp eqppgev](https://img.pdfslide.net/doc/110x75/5e0ae2d2a4f7bb729e6b3f48/whats-your-ex5-71-unit-8z-dg-xdd4-4gcf-vjg-rctcitcrj-qp-vjg-tkijv-cpf-eqpegpvtcvg.jpg)