Embed Size (px)
Citation preview
MARCH 2010
Luzerne County School Assessment Report
2010The School Assessment Report (SAR) provides educators, administrators, parents, business and industry, and civic leaders with information regarding student proficiencies.
Math & Reading

2 | P a g e
Table of Contents Executive Summary ........................................................................................................................ 5 Report Methodology ....................................................................................................................... 5 Introduction ..................................................................................................................................... 6
Education Reform Since 2000 .................................................................................................... 7 Adequate Yearly Progression ..................................................................................................... 7
Proficiency Trends 2002-2009 ........................................................................................................ 9 Proficiency Results by School District for 2008-2009 ................................................................. 10
Number of Students Tested ....................................................................................................... 10 Proficiency Changes 2008-2009 ............................................................................................... 12
Progression of Proficiency Results by School District for 2008-2009 ......................................... 13 Proficiency in Subgroups .............................................................................................................. 15
Students with Disabilities ......................................................................................................... 16 Specially Designed Instruction ............................................................................................. 16
Economically Disadvantaged.................................................................................................... 18 African-American Students ...................................................................................................... 19 Hispanic Students...................................................................................................................... 21
Conclusion .................................................................................................................................... 23 Appendix: Luzerne County School Proficiency Scores ................................................................ 24
Crestwood School District ........................................................................................................ 24 Dallas School District ............................................................................................................... 25 Greater Nanticoke Area School District ................................................................................... 26 Hanover Area School District ................................................................................................... 27 Hazleton Area School District .................................................................................................. 28 Lake Lehman School District ................................................................................................... 29 Northwest Area School District ................................................................................................ 30 Pittston Area School District .................................................................................................... 31 Wilkes-Barre Area School District ........................................................................................... 32 Wyoming Area School District ................................................................................................. 33 Wyoming Valley West School District ..................................................................................... 34
References ..................................................................................................................................... 35
3 | P a g e
List of Figures Figure 1: Luzerne County Math Proficiency Results 2002-2009 ................................................. 10 Figure 2: Luzerne County Reading Proficiency Results 2002-2009 ............................................ 10 Figure 3: County-wide Progression of PSSA Math & Reading Performance 2003-2009 ............ 15 Figure 4: IEP Student Math Proficiency ....................................................................................... 17 Figure 5: IEP Student Reading Proficiency .................................................................................. 17 Figure 6: Economically Disadvantaged Student Math Proficiency .............................................. 18 Figure 7: Economically Disadvantaged Student Reading Proficiency ......................................... 19 Figure 8: African American Math Proficiency 2008-2009 ........................................................... 20 Figure 9: African American Reading Proficiency 2008-2009 ...................................................... 20 Figure 10: Hispanic Math Proficiency 2008-2009........................................................................ 21 Figure 11: Hispanic Reading Proficiency 2008-2009 ................................................................... 22 Figure 12: Crestwood SD: Math Proficiency 2008-2009 ............................................................. 24 Figure 13: Crestwood SD: Reading Proficiency 2008-2009 ........................................................ 24 Figure 14: Dallas SD: Math Proficiency 2008-2009 .................................................................... 25 Figure 15: Dallas SD: Reading Proficiency 2008-2009 ............................................................... 25 Figure 16: Greater Nanticoke Area SD: Math Proficiency 2008-2009 ........................................ 26 Figure 17: Greater Nanticoke Area SD: Math Proficiency 2008-2009 ........................................ 26 Figure 18: Hanover Area SD: Math Proficiency 2008-2009 ....................................................... 27 Figure 19: Hanover Area SD: Reading Proficiency 2008-2009 ................................................... 27 Figure 20: Chart 18: Hazleton Area SD: Math Proficiency 2008-2009 ....................................... 28 Figure 21: Hazleton Area SD: Reading Proficiency 2008-2009 ................................................. 28 Figure 22: Lake Lehman SD: Math Proficiency 2008-2009 ........................................................ 29 Figure 23: Lake Lehman SD: Reading Proficiency 2008-2009 ................................................... 29 Figure 24: Northwest Area SD: Math Proficiency 2008-2009 ..................................................... 30 Figure 25: Northwest Area SD: Reading Proficiency 2008-2009 ............................................... 30 Figure 26: Pittston Area SD: Math Proficiency 2008-2009.......................................................... 31 Figure 27: Pittston Area SD: Reading Proficiency 2008-2009 ..................................................... 31 Figure 28: Wilkes-Barre Area SD: Math Proficiency 2008-2009 ................................................ 32 Figure 29: Wilkes-Barre Area SD: Reading Proficiency 2008-2009 ........................................... 32 Figure 30: Wyoming Area SD: Math Proficiency 2008-2009 ...................................................... 33 Figure 31: Wyoming Area SD: Reading Proficiency 2008-2009 ................................................. 33 Figure 32: Wyoming Valley West SD: Math Proficiency 2008-2009 .......................................... 34 Figure 33: Wyoming Valley West SD: Reading Proficiency 2008-2009 ..................................... 34

4 | P a g e
List of Tables Table 1: Students Tested in Math 2008-2009 ............................................................................... 11 Table 2: Students Tested in Reading 2008-2009 .......................................................................... 11 Table 3: Luzerne County Math Proficiency 2008-2009 ............................................................... 12 Table 4: Luzerne County Reading Proficiency 2008-2009 .......................................................... 13 Table 5: Progression of PSSA Math Performance 2003-2009 .................................................... 14 Table 6: Progression of PSSA Reading Performance 2003-2009 ................................................ 14 Table 7: Number of Students Tested in Math by Subgroup ......................................................... 15 Table 8: Number of Students Tested in Reading by Subgroup .................................................... 15
Principal Researchers Sherry Tracewski Teri Ooms Associate Researchers Christina Miller Stephanie Fields Anna Nakonechy Please contact The Institute for reprint permission and appropriate citation of work.

5 | P a g e
Executive Summary According to the U.S. Census Bureau’s American Community Survey 2008 population estimate, Luzerne County has a population of approximately 311,983. Moreover, the county’s median age is 42.2 years, its median annual per capita income is $23,247 and its median household income is $41,820. Both income levels rank below the national averages. The county includes eleven school districts, which, in 2008‐2009, reported an 86‐99% graduation rate. There is often a link between educational attainment and poverty; poverty rates steadily decrease with higher educational attainment levels. Luzerne County reported a 24.2% poverty rate associated with individuals who did not graduate high school, compared with an 11.4% poverty rate among their high school graduate (or equivalent) peers. It is important to remember that a student’s performance reflects the collective effort of schools and their communities. Research has shown that the education levels and contributions of parents are critical factors that impact a child's academic performance. To help all students reach their full potential, it is necessary that they, along with their teachers, families, and communities collectively engage in efforts to improve student performance. State test proficiency by subject provides an overall summary of school, school district, or state performance in a particular subject and includes students at all grade levels tested. Proficient is the minimum level of academic performance that all students are expected to attain under the No Child Left Behind Act; however, each state may administer its own exam and set its own proficiency standards. It should be noted that student performance data displayed may differ slightly from state reported data due to rounding differences.
This SAR’s group (fifth, eighth, and eleventh graders) consisted of more than 9,354 Luzerne County students, including 1,178 students with disabilities who completed PSSA testing during the 2007‐2008 school year. During 2008‐2009 school year, 9,405 Luzerne County students took the PSSA, including 1,302 students with disabilities. Since 2007‐2008, Luzerne County experienced an increase of 51 students and 124 students with disabilities.
Report Methodology This document is designed to summarize the performance and monitor the progress of Luzerne County public schools since 2002, when NCLB was enacted. In doing so, this SAR aims to identify Luzerne County’s strengths as well as areas that require timely improvement. It should be noted that the goal of this particular study is to evaluate the performance of students in fifth, eighth, and eleventh grades only. As such, statistics and comparisons reported herein are reflective of those grades only and not necessarily the entire population being tested.

6 | P a g e
PSSA scores, which serve as the foundation of the report, are found on the Pennsylvania Department of Education’s website at http://www.pde.state.pa.us. PSSA results are organized by county and divided into the following proficiency ratings: advanced, proficient, basic, and below basic. The total number of proficient scores is calculated by combining the number of PSSA test takers who scored advanced or proficient on the test’s mathematics or reading sections. (Note: There are a few inconsistencies in data arrangement for earlier years in which PSSA scores were recorded. For example, student population figures were not recorded, and some state averages were missing. The Pennsylvania Department of Education has since organized recent PSSA data in a more consistent manner.) For clarification, those students requiring an Individualized Educational Program are classified as “IEP” students. This category includes any student with a disability who requires a service or accommodation in addition to the standard educational approach used for non‐IEP students. Usually, the term IEP involves at least one of the following disabilities: autism, deafness, deaf‐blindness, emotional disturbance, hearing impairment, learning disability, mental retardation, multiple disabilities, orthopedic impairment, other health‐impairment, speech or language impairment, traumatic brain injury or visual impairment including blindness.
Economically disadvantaged students comprise another subcategory. This group includes those who are eligible for free or reduced fee lunch. Data on this subcategory is not available for each year since 2002, which introduces uncertainty in the subcategory’s trend predictions.
Similarly, data for both African American and Hispanic students is sparse at best, with data lacking for most school districts. For schools with fewer than ten students in the subgroup, data is not reported.
Introduction The purpose of the School Assessment Report (SAR) is to provide educators, administrators, parents, business and industry, and civic leaders with information regarding student proficiencies in our public K‐12 school system – the same system that trains our future workforce. Since local and regional economies are dependent upon the strength of the workforce, K‐12 education is a strong economic development tool. To guarantee an adequate future workforce, within the next several years (through 2014), the Commonwealth of Pennsylvania must ensure that each child is proficient in reading and mathematics – a goal that coincides with the Federal No Child Left Behind Act (NCLB) provisions. Moreover, parents, guardians and educators can mutually assist in student proficiency improvements if they take the necessary actions to help students learn and advance their basic reading and mathematics skills.

7 | P a g e
The SAR measures and analyzes Pennsylvania System of School Assessment (PSSA) statistics from 2002 to 2009, and reports on the efficiency and progress of Luzerne County’s public education system. Fifth, eighth, and eleventh grade student proficiencies are evaluated across Luzerne County and are compared with state and county averages. While the PSSA is broken down into four sections of proficiency – reading, writing, mathematics and science, this SAR examines reading and mathematics proficiencies only.
Education Reform Since 2000 The Federal government enactment NCLB in 2002. NCLB aims to ensure that American students are equipped with the necessary tools for future success. NCLB attempts to: • Gear school curriculum toward PSSA tests and essential skills needed to succeed in school
and out. • Use the latest technology to improve PSSA scores. • Narrow proficiency gaps between students with disadvantages and those without. • Strengthen standards for incoming teachers to improve education quality. • Create competition among schools in their drive to succeed.
Adequate Yearly Progression NCLB requires student proficiency in mathematics and reading by 2014. To meet the goal of achieving 100% proficiency, the Federal government has developed for each state Adequate Yearly Progression (AYP) goals. AYP goals are measured by three indicators:
School Attendance (for schools without a high school graduating class): Target of 90% or any improvement from previous year.
Achieving Proficiency (Performance):
To meet the performance target required for AYP, schools and every measurable subgroup in each school must have at least 56% tested students achieve a score of proficient or higher on the mathematics assessment and 63% of tested students achieve a score of proficient score or higher on the reading assessment.
Taking the Test (Participation):
At least 95% of students overall and within each measurable subgroup must take the PSSA.

8 | P a g e
AYP goals are intended to move schools toward full proficiency and make them more accountable to students, parents, teachers and the community. AYP measurements can positively affect schools that consistently miss their targets. The results allow schools and districts to evaluate their students’ progress to make full proficiency a reality. It is to believe today’s seventh graders will be 11th graders by the year 2014 when full proficiency will be reached. Pennsylvania’s 2008 AYP goals were 56% of students scoring proficient or higher in mathematics, and 63% of students scoring proficient or higher in reading. For 2009, the mathematics AYP goal increases to 61%, while the reading AYP goal rises to 75%. Targets increase annually until 2014, when schools are required to reach 100% proficiency in both subject. If a school meets its AYP goals in all areas, it will not be identified as needing improvement. The school must apply strategic interventions to its special education program and providers. Such interventions include investments in curriculum and instruction. If a school fails to achieve its AYP goals within two years, NCLB sanctions will be implemented.
For a school to meet AYP, all AYP targets must be met. However the total number of targets used for AYP can vary. This occurs mainly because the targets associated with subgroups that have fewer than 40 students in the school do not apply. Therefore, schools with fewer than 40 students are still accountable and are evaluated when the scores have been completed and processed.
School district targets are assessed at three grade levels: fifth, eighth, and eleventh. To meet AYP goals in academic performance or test participation, the district must achieve all targets for both subjects in one grade span only. All school districts must meet both targets in school attendance and graduation in order to be considered.
NCLB legislation was to be re‐authorized by the Federal government in 2008; however, the legislation was tabled for a number of reasons. The emergence of a Democratic administration suggests that NCLB may be repealed or re‐written. A number of NCLB components must be revisited in order for the act to be truly effective. Following are some specific NCLB criticisms/concerns:
Students with disabilities who require Individualized Education Programs (IEPs) are mandated by law to take the same standardized test as regular education students, and their scores are equally factored into a school’s overall proficiency score. The fact that students with disabilities are required to take the same standardized test as regular education students contradicts earlier Federal mandates requiring students with IEPs to receive individualized educational instruction and assessment. In addition, their scores may unfairly skew a school’s overall proficiency score.

9 | P a g e
Students who are new to the English language (ELLs—English Language Learners, or LEP—Limited English Proficiency) are largely subject to the same standardized test as regular education students. The test is written and must be completed in English. These scores are also equally factored into a school’s overall proficiency score. An exception to this involves students who are in their first year in the school district and have had limited or no exposure to the English language. In such instance, these students may be permitted to take a Spanish language version of the standardized mathematics test and their scores are not included in the district’s overall AYP. The test’s reading and writing portions are optional. While the reading and writing tests are in English, students are permitted to use word‐to‐word dictionaries that translate native language to English or English to native language. It should be noted, however, that certain restrictions apply on types of dictionaries allowed and their use. In addition, interpreters may also be used. Students may take Spanish test versions for the first three years of their enrollment in the U.S. school system.
Schools in urban areas typically include higher percentages of IEP, ELL, or LEP, and economically disadvantaged students. Based on the overall proficiency scores for these schools, one may assume that these districts are not scoring as well as their suburban or rural counterparts (as suburban and rural schools’ AYPs are not greatly negatively impacted by such factors).
Proficiency Trends 2002‐2009 In Luzerne County, and statewide, since 2002 students have displayed remarkable increases in mathematics proficiencies. Similarly, the county’s students have also displayed consistently improved reading scores. Since testing began in 2002, Luzerne County’s mathematics proficiencies have also been consistently higher than state averages. Its reading proficiency performance levels, on the other hand, were initially below state averages in 2002 and 2003, but have since exceeded them. Overall, each Luzerne County school district has demonstrated marked improvements in mathematics and reading proficiencies since initial PSSA testing in 2002. With the exception of the 2005‐2006 school year, the county’s IEP students have also made steady mathematics and reading proficiency progress. The county’s economically disadvantaged students have turned out fluctuating proficiency rates for both mathematics and reading, with each year’s results alternately increasing and decreasing. Hispanic and African‐ American students also demonstrated similar inconsistencies, with subgroup scores varying from year to year, compared with their peers’ performance. In the 2001‐2002 school year, Luzerne County students averaged a 52.0% mathematics proficiency score, compared with 51.5% statewide. By the 2004‐2005 school year, Luzerne County students achieved a 67.5% mathematics proficiency score, compared with 58.9% statewide. In the 2008‐2009 school year, the county’s students achieved a 67.1% mathematics proficiency score, compared with 66.5% statewide.

10 | P a g e
Figure 1: Luzerne County Math Proficiency Results 2002‐2009
0
10
20
30
40
50
60
70
80
Luzerne County reading proficiency scores have fluctuated between 2002 and 2009, but have shown an overall increase for the time period. In 2002, Luzerne County fifth, eighth, and eleventh grade students averaged a score of 56.3%. By 2009, this average score increased to 69.8%.
Figure 2: Luzerne County Reading Proficiency Results 2002‐2009
0
10
20
30
40
50
60
70
80
Proficiency Results by School District for 2008‐2009
Number of Students Tested The number of students tested in math and reading fluctuated slightly between grades. The tables below show the number of students tested in each school district in 2009.

11 | P a g e
Table 1: Students Tested in Math 2008‐2009
School District 5th Grade 8th Grade 11th GradeCrestwood SD 234 242 260Dallsas SD 220 219 199Greater Nanticoke Area SD 157 179 167Hanover Area SD 146 146 149Hazleton Area SD 757 802 746Lake‐Lehman SD 138 164 183Northwest Area SD 104 118 125Pittston Area SD 237 213 280Wilkes‐Barre Area SD 483 469 502Wyoming Area SD 192 188 207Wyoming Valley West SD 361 417 401Total by Grade 3029 3157 3219County Total 9405
Table 2: Students Tested in Reading 2008‐2009
School District 5th Grade 8th Grade 11th GradeCrestwood SD 234 242 259Dallsas SD 219 219 198Greater Nanticoke Area SD 157 177 167Hanover Area SD 146 146 148Hazleton Area SD 757 801 747Lake‐Lehman SD 138 164 183Northwest Area SD 103 118 125Pittston Area SD 237 213 280Wilkes‐Barre Area SD 483 468 502Wyoming Area SD 191 188 207Wyoming Valley West SD 360 411 399Total by Grade 3025 3147 3215County Total 9387
12 | P a g e
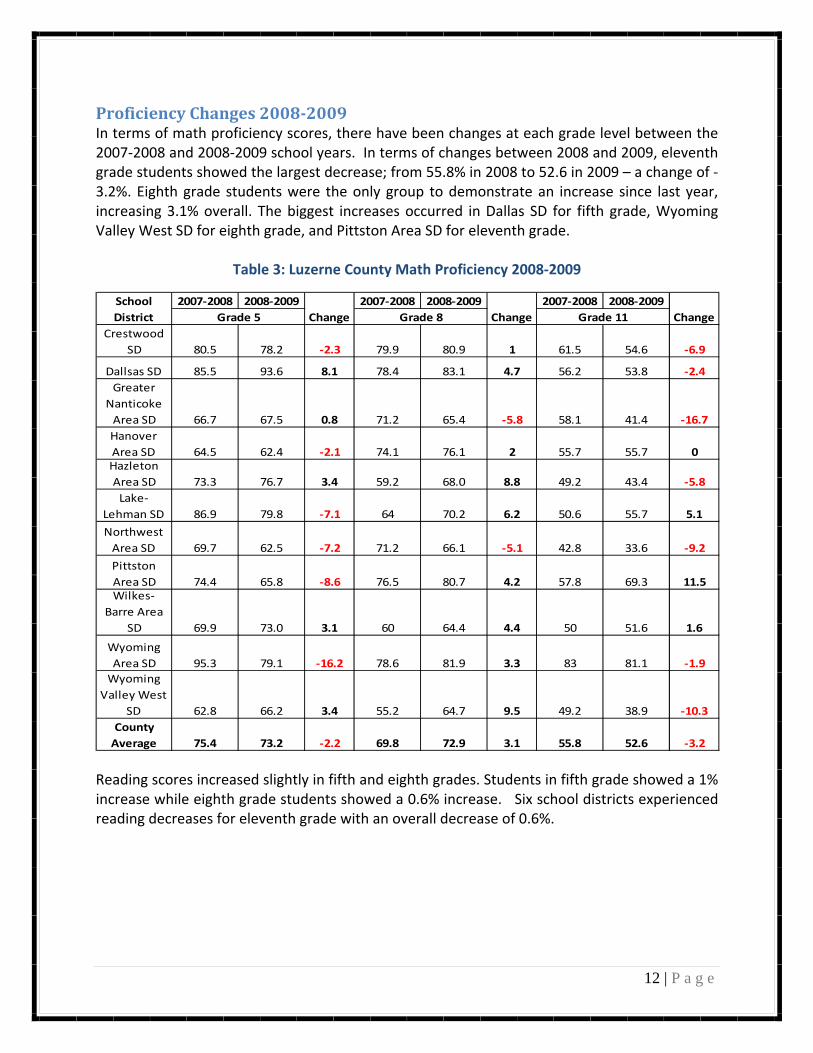
Proficiency Changes 20082009 In terms of math proficiency scores, there have been changes at each grade level between the 2007‐2008 and 2008‐2009 school years. In terms of changes between 2008 and 2009, eleventh grade students showed the largest decrease; from 55.8% in 2008 to 52.6 in 2009 – a change of ‐3.2%. Eighth grade students were the only group to demonstrate an increase since last year, increasing 3.1% overall. The biggest increases occurred in Dallas SD for fifth grade, Wyoming Valley West SD for eighth grade, and Pittston Area SD for eleventh grade.
Table 3: Luzerne County Math Proficiency 2008‐2009
2007‐2008 2008‐2009 2007‐2008 2008‐2009 2007‐2008 2008‐2009
80.5 78.2 ‐2.3 79.9 80.9 1 61.5 54.6 ‐6.9
85.5 93.6 8.1 78.4 83.1 4.7 56.2 53.8 ‐2.4
66.7 67.5 0.8 71.2 65.4 ‐5.8 58.1 41.4 ‐16.7
64.5 62.4 ‐2.1 74.1 76.1 2 55.7 55.7 0
73.3 76.7 3.4 59.2 68.0 8.8 49.2 43.4 ‐5.8
86.9 79.8 ‐7.1 64 70.2 6.2 50.6 55.7 5.1
69.7 62.5 ‐7.2 71.2 66.1 ‐5.1 42.8 33.6 ‐9.2
74.4 65.8 ‐8.6 76.5 80.7 4.2 57.8 69.3 11.5
69.9 73.0 3.1 60 64.4 4.4 50 51.6 1.6
95.3 79.1 ‐16.2 78.6 81.9 3.3 83 81.1 ‐1.9
62.8 66.2 3.4 55.2 64.7 9.5 49.2 38.9 ‐10.3
75.4 73.2 ‐2.2 69.8 72.9 3.1 55.8 52.6 ‐3.2
School District Change Change ChangeGrade 5 Grade 8 Grade 11
Crestwood SD
Wyoming Valley West
SDCounty Average
Dallsas SDGreater
Nanticoke Area SDHanover Area SDHazleton Area SDLake‐
Lehman SD
Northwest Area SD
Pittston Area SDWilkes‐
Barre Area SD
Wyoming Area SD
Reading scores increased slightly in fifth and eighth grades. Students in fifth grade showed a 1% increase while eighth grade students showed a 0.6% increase. Six school districts experienced reading decreases for eleventh grade with an overall decrease of 0.6%.

13 | P a g e
Table 4: Luzerne County Reading Proficiency 2008‐2009
2007‐2008 2008‐2009 2007‐2008 2008‐2009 2007‐2008 2008‐2009
69.3 78.2 8.9 87.0 89.7 2.7 72.8 72.2 ‐0.6
80.8 81.3 0.5 86.1 93.1 7.0 73.1 76.3 3.2
55.3 59.2 3.9 75.0 68.9 ‐6.1 64.5 49.7 ‐14.8
53.3 50.0 ‐3.3 87.3 80.8 ‐6.5 70.2 65.5 ‐4.7
59.7 66.9 7.2 74.0 74.1 0.1 55.2 53.1 ‐2.1
76.1 78.2 2.1 81.8 85.4 3.6 69.8 72.6 2.8
62.6 65.0 2.4 84.6 78.8 ‐5.8 66.0 60.8 ‐5.2
64.8 60.8 ‐4.0 83.9 85.0 1.1 68.6 77.8 9.2
53.5 55.7 2.2 73.1 79.2 6.1 60.4 65.6 5.2
81.2 68.1 ‐13.1 84.4 88.9 4.5 76.4 76.8 0.4
57.1 60.6 3.5 76.5 75.4 ‐1.1 59.9 59.2 ‐0.7
64.8 65.8 1.0 81.2 81.8 0.6 66.9 66.3 ‐0.6
School District Change Change ChangeGrade 5 Grade 8 Grade 11
County Average
Wyoming Valley West
SD
Wyoming Area SD
Crestwood SD
Dallsas SD
Greater Nanticoke Area SDHanover Area SD
Lake‐Lehman SD
Hazleton Area SD
Wilkes‐Barre Area
SD
Pittston Area SD
Northwest Area SD
Progression of Proficiency Results by School District for 2008‐2009 This SAR reports the progress of certain distinct Luzerne County classes, the 2002‐2003 fifth grade class – and their scores as eighth graders and eleventh graders in the 2005‐2006 and 2008‐2009 school years. Overall, this class increased their math scores in eighth grade; going from 67.4% to 75%. Pittston Area and Wilkes‐Barre Area demonstrated the largest increases with 20.3% and 20.1% respectively. In eleventh grade, this class saw their scores dramatically decrease going from 75.0% as eighth graders to 52.6% ‐ a change of ‐22.4%.

14 | P a g e
Table 5: Progression of PSSA Math Performance 2003‐2009
2002‐2003 2005‐2006 2008‐2009Grade 5 Grade 8 Grade 11
CRESTWOOD SD 75.4 82.3 6.9 54.6 ‐27.7DALLAS SD 77.9 86.5 8.6 53.8 ‐32.7GREATER NANTICOKE AREA SD 52.6 56.8 4.2 41.4 ‐15.4HANOVER AREA SD 59.1 65.1 6 55.7 ‐9.4HAZLETON AREA SD 66.8 67 0.2 43.4 ‐23.6LAKE‐LEHMAN SD 64.1 71.8 7.7 55.7 ‐16.1NORTHWEST AREA SD 69.8 78.9 9.1 33.6 ‐45.3PITTSTON AREA SD 57.9 78.2 20.3 69.3 ‐8.9WILKES‐BARRE AREA SD 62.4 82.5 20.1 51.6 ‐30.9WYOMING AREA SD 87.3 84.3 ‐3 81.1 ‐3.2WYOMING VALLEY WEST SD 68.6 71.1 2.5 38.9 ‐32.2County Average 67.4 75 7.6 52.6 ‐22.4
School DistrictChange 5th‐8th
Change 8th‐11th
Reading scores show a similar trend with this class increasing in eighth grade; going from 65.5% to 68%. As they did in math, Pittston Area and Wilkes‐Barre Area demonstrated the largest increases in reading with 21.9% and 12.9% respectively. In eleventh grade, this class saw their scores decrease slightly ― from 68% as eighth grades to 66.3% ― a change of ‐1.7%. In reading, four school districts increased their reading score: Greater Nanticoke Area, Hanover Area and Lake‐Lehman, and Wyoming Valley West.
Table 6: Progression of PSSA Reading Performance 2003‐2009
2002‐2003 2005‐2006 2008‐2009Grade 5 Grade 8 Grade 1174.6 77 2.4 72.2 ‐4.872.8 76.5 3.7 76.3 ‐0.245.8 46 0.2 49.7 3.759.8 60.5 0.7 65.5 5.070.1 63.8 ‐6.3 53.1 ‐10.760.9 50 ‐10.9 72.6 22.669.7 68.6 ‐1.1 60.8 ‐7.856.5 78.4 21.9 77.8 ‐0.663.5 76.4 12.9 65.6 ‐10.882.2 94.1 11.9 76.8 ‐17.364.3 57 ‐7.3 59.2 2.265.5 68 2.5 66.3 ‐1.7
School DistrictChange 5th‐8th
Change 8th‐11th
County AverageWyoming Valley West SDWyoming Area SDWilkes‐Barre Area SDPittston Area SDNorthwest Area SDLake‐Lehman SDHazleton Area SDHanover Area SDGreater Nanticoke Area SDDallsas SDCrestwood SD

15 | P a g e
The figure below demonstrates the math and reading for this class in fifth, eighth, and eleventh grades.
Figure 3: County‐wide Progression of PSSA Math & Reading Performance 2003‐2009
0
10
20
30
40
50
60
70
80
90
2002‐2003 (5th Grade) 2005‐2006 (8th Grade) 2008‐2009 (11th Grade)
Math
Reading
Proficiency in Subgroups The tables below show the number of students in each subgroup tested in 2009.
Table 7: Number of Students Tested in Math by Subgroup
Grade 5 Grade 8 Grade 11
IEP 435 470 397Economically Disadvantaged 1438 1384 1054
African American 130 106 104
Hispanic 300 286 233
Table 8: Number of Students Tested in Reading by Subgroup
Grade 5 Grade 8 Grade 11
IEP 434 468 395Economically Disadvantaged 1436 1375 1051
African American 130 129 104
Hispanic 300 306 232

16 | P a g e
Students with Disabilities For the purposes of this report, a student with a disability is defined as any student that requires the use of an Individualized Education Program (IEP) to meet his/her educational goals. In Luzerne County, over 1,302 fifth, eighth and eleventh grade students with disabilities took the mathematics portion of the PSSA during the 2008‐2009 school year, while over 1,297 fifth, eighth, and eleventh grade students took the reading portion of the test during the same timeframe. Students with disabilities demonstrated similar mathematics and reading proficiencies, with ratings of 23.4% and 23.1%, respectively. It should be noted that although the scores of students with disabilities are often reported separately from the aggregated data, their scores are factored equally into each school district’s proficiency total and AYP goals When compared with their peers in Luzerne County, students with disabilities perform at a lower level at all grade levels in both mathematics and reading. This is particularly evident in the eighth and eleventh grades, when math proficiency scores are generally lower than fifth grades scores. Obviously there are times when students with disabilities have a harder time succeeding their educational purposes and many things then occur, including:
• Modifications to the content of the program • Lowered success criteria for academic success • Increased emphasis on daily living skills and decrease on educational assignments • Alternative state assessments, such as off‐grade level assessments
Specially Designed Instruction Specially designed instruction affects the instructional content, method of instructional delivery, and the performance methods and criteria that are necessary to assist the student make meaningful educational progress. This instruction is designed by or with an appropriately credentialed special education teacher or related service provider. For some students, teachers may need to present information through the use of manipulative. For other students, teachers may need to select and teach only important key concepts and then alter evaluation activities and criteria to match this content change. The IEP team should determine whether a specific type of instruction should be included in a student’s IEP. Generally, if the methodology is an essential part of what is required to meet the individualized needs of the student, the methodology should be included. For instance, if a student has a learning disability and has not learned to read using traditional methods, then another method may be required. When including such an IEP recommendation, the team should describe the components of the appropriate type of methodology as opposed to naming a specific program.

17 | P a g e
IEP students scored lower than all students as a whole in both 2008 and 2009. The trends, however; are the same with fifth grade scores being the highest and eleventh grade scores the lowest. For math, IEP students scored lower in 2009 in all grades examined.
Figure 4: IEP Student Math Proficiency
39.7
25.8
8.3
39.0
21.5
9.8
0
5
10
15
20
25
30
35
40
45
Grade 5 Grade 8 Grade 11
2008
2009
Reading scores showed a different trend than math. IEP student experienced a significant increase in eighth grade scores in 2008 and 2009. Like all other groups, reading scores dropped in eleventh grade decreasing by 22.2% in 2009. In addition, eighth and eleventh grade scores increased between 2008 and 2009 – increasing 1.8% and 2% respectively.
Figure 5: IEP Student Reading Proficiency
24.2
34.1
11.7
19.8
35.9
13.7
0
5
10
15
20
25
30
35
40
Grade 5 Grade 8 Grade 11
2008
2009

18 | P a g e
Economically Disadvantaged Economically disadvantaged students constitute another subgroup whose performance is monitored and analyzed via PSSA testing. The Pennsylvania Department of Education categorizes a student as “economically disadvantaged” based on his or her participation in the public school system’s free or reduced fee lunch program. Traditionally, students who are raised in low‐income environments tend to perform at a significantly lower level than peers from a higher socioeconomic background. In Luzerne County, over 3,876 fifth, eighth and eleventh grade students classified as economically disadvantaged took the mathematics portion of the PSSA during the 2008 ‐2009 school year, while over 3,864 took the reading portion. The state average for this subgroup is 36.7%.; overall this subgroup has not achieved the lowest scores. Conversely, of all the subgroups examined, economically disadvantaged students reported the highest mathematics proficiency ratings. Students that fall into the economically disadvantaged population trended similar to all students as a whole. Scores remained somewhat consistent in each grade with fifth and eleventh showing slight decreasing and eighth experiencing a minor gain.
Figure 6: Economically Disadvantaged Student Math Proficiency
64.159.5
39.1
62.1 60.5
38.2
0
10
20
30
40
50
60
70
Grade 5 Grade 8 Grade 11
2008
2009

19 | P a g e
Again, as in math, reading proficiency scores remained somewhat consistent in each grade with eighth eleventh showing slight decreasing and fifth experiencing a minor gain.
Figure 7: Economically Disadvantaged Student Reading Proficiency
51.4
70.3
49.251.0
72.3
50.1
0
10
20
30
40
50
60
70
80
Grade 5 Grade 8 Grade 11
2008
2009
AfricanAmerican Students African‐American students comprise another subgroup also monitored by PSSA testing, as dictated by NCLB. Just 363 African‐American students in Luzerne County were tested in both the mathematics and reading sections of the PSSA during the 2008‐2009 school year. It should be noted that only four districts (Greater Nanticoke Area, Hazleton Area, Wilkes‐Barre Area, and Wyoming Valley West) included schools with African‐American populations large enough to be scored and independently reported (population greater than 10). Furthermore, given the little data available both in this testing year and in prior years the overall analysis may vary depending on each district. African‐American students achieved proficiency ratings of 59.1% in mathematics and 76.2% in reading. Luzerne County’s African‐American students trail their peers in reading proficiencies at all grade levels examined. While the subgroup’s mathematics scores are lower, they are still higher than certain districts and grades. Obviously, African‐American students are competitive with their non‐African‐American peers at some grade levels and subjects (i.e., eighth grade math), however the overwhelming majority of grade levels show vast performance discrepancies, in some cases by as much as 40%. African American students scored lower than all students as a whole in both 2008 and 2009. The trends, however, are the same with fifth grade scores being the highest and eleventh grade

20 | P a g e
scores the lowest. African American fifth grade students increased their math scores by 12.9% between 2008 and 2009. Although eighth graders scored the highest among the three grades, they experienced the greatest decrease between the two years examined, dropping 17.3% in 2009.
Figure 8: African American Math Proficiency 2008‐2009
40.4
63.5
30.3
53.3
46.2
24.9
0
10
20
30
40
50
60
70
Grade 5 Grade 8 Grade 11
2008
2009
Reading scores are nearly opposite math scores for the African American student population with fifth graders dropping and eight and eleventh graders increasing in 2009. Eight grade students showed a 12.8% increase and eleventh graders showed a 17.1% increase between 2008 and 2009 while fifth grade students experienced a 9.9% decrease for the same period.
Figure 9: African American Reading Proficiency 2008‐2009
50.6 50.1
28.9
40.7
62.9
43.0
0
10
20
30
40
50
60
70
Grade 5 Grade 8 Grade 11
2008
2009

21 | P a g e
Hispanic Students In Luzerne County, 840 Hispanic students took the mathematics portion of the PSSA during the 2008‐2009 school year, while 838 took the reading portion. This group of testers earned a mathematics proficiency score of 43.2% and a reading proficiency score of 41.6%. Not all students at all grade levels in each district are included in PSSA results, as grades with fewer than ten students in a particular subgroup are not measured. Like the African‐American subgroup population, only three districts had Hispanic populations large enough be scored and independently reported. Again, the generalizations and analysis that follow should be tempered with caution given the little data available both in this testing year and in prior years. As the data suggests, Hispanic students in fifth, eighth, and eleventh grades are having a difficult time competing with peers in both mathematics and reading, with total proficiency scores trailing by as much as 25% at many grade levels. The greatest mathematics and reading disparities between Hispanic and non‐Hispanic students occur at the eleventh grade level – where scores differed by up to 30%. Hispanic students experienced increased math proficiency at every level between 2008 and 2009. Fifth grade student showed the most substantial gain – increasing 14.7% Eleventh graders showed the lowest gain with 4.5%. Hispanic student performed lower overall in math when compared to all students tested.
Figure 10: Hispanic Math Proficiency 2008-2009
50.6 50.1
28.9
65.362.6
33.4
0
10
20
30
40
50
60
70
Grade 5 Grade 8 Grade 11
2008
2009

22 | P a g e
Hispanic students showed similar trends in reading – with each group experiencing an increase between 2008 and 2009. Unlike other groups, the eleventh grade students demonstrated the largest gain – increasing 18.6%.
Figure 11: Hispanic Reading Proficiency 2008‐2009
36.8
57
31
44.6
70.2
49.6
0
10
20
30
40
50
60
70
80
Grade 5 Grade 8 Grade 11
2008
2009

23 | P a g e
Conclusion Overall, Luzerne County’s public education system has shown improvements since the 2002 inception of NCLB. Five of eleven school districts experienced declines in eleventh grade scores in both subjects within a year. In the transition from fifth to eighth grade (2002 to 2005), students experienced a 6.5% increase in mathematics proficiency scores and a 7.2% increase in reading proficiency scores. Unfortunately, during the time between eighth and eleventh grades (2005 to 2008), these same students experienced a mathematics proficiency decrease of 22.4% and a reading proficiency decrease of 1.7%. By eleventh grade, nearly all proficiencies decreased and changes from 2002–2009 in both reading and mathematics represented only a slight overall improvement. None of Luzerne County’s school districts reported a 100% proficiency rating at any grade level in mathematics or reading during 2008 or 2009 – as students largely vary by academic proficiency level and subgroup. There are many reasons for a decline in performance, which must be considered in order to make improvements. Such issues may require adjusting the current curriculum, remediating students, and tracking their progress. More teachers, classroom aides, and tutors could be considered to guide students toward academic success. Also, smaller class sizes, homogeneous class structures, and other teaching methods could be employed depending on a school’s specific issues. Achieving or exceeding state targets should be the primary goal, since Pennsylvania’s average proficiencies in the 2008‐2009 school year reached only 73.8% for mathematics and 73% for reading, compared with 56% and 63% in the 2007‐2008 school year, respectively. While goal percentages increase annually to reach NCLB’s end proficiency goal of 100% by 2014, school districts must continually aim to exceed state targets and show consistent improvements each year. Moreover, if school districts fail to meet target levels, they are subject to penalties and sanctions, or may be mandated to develop improvement plans, provide tutoring or be taken over by the state. Proficiency examinations in other subjects have recently been added (science, writing, and social studies) and may continue to be added over time. Therefore, schools that have reduced instruction time in those subjects to focus on mathematics, reading, and writing PSSAs may be doing themselves a disservice. It is critical for school districts to determine best practices to ensure proficiencies in all subjects are met. Teaching specifically to the PSSA should be avoided. The education triad (administrators, teachers, and parents) must form a more effective collaborative effort to ensure that real learning is taking place. It is especially critical for parents and families to stress to their children the importance of education. Studies show that students with encouraging parents/families have a higher chance of succeeding in their academic progress than those from families who do not support their educational advancement. For Pennsylvania, emphasis on improving higher education attainment and other continuing education is critical. The economic development success of any region is dependent upon the quality of its workforce. That quality training begins in elementary school. Specifically, the best economic development strategy is one that maximizes the potential of Pre‐K – 12 educations.

24 | P a g e
Appendix: Luzerne County School Proficiency Scores
Crestwood School District Crestwood School District’s math scores remained relatively consistent between 2008 and 2009. Only eighth grade students saw an increase during this time – gaining 1%. Both fifth and eleventh grades showed a decrease.
Figure 12: Crestwood SD: Math Proficiency 2008‐2009
80.5 79.9
61.5
78.2 80.9
54.6
0
10
20
30
40
50
60
70
80
90
Grade 5 Grade 8 Grade 11
2008
2009
Crestwood School District’s reading scores were also fairly consistent between 2008 and 2009. Fifth and eighth graders made strides within the year improving 8.9% and 2.7% respectively. However, the eleventh graders scores declined by ‐0.6%.
Figure 13: Crestwood SD: Reading Proficiency 2008‐2009
69.3
87
72.878.2
89.7
72.2
0
10
20
30
40
50
60
70
80
90
100
Grade 5 Grade 8 Grade 11
2008
2009
25 | P a g e
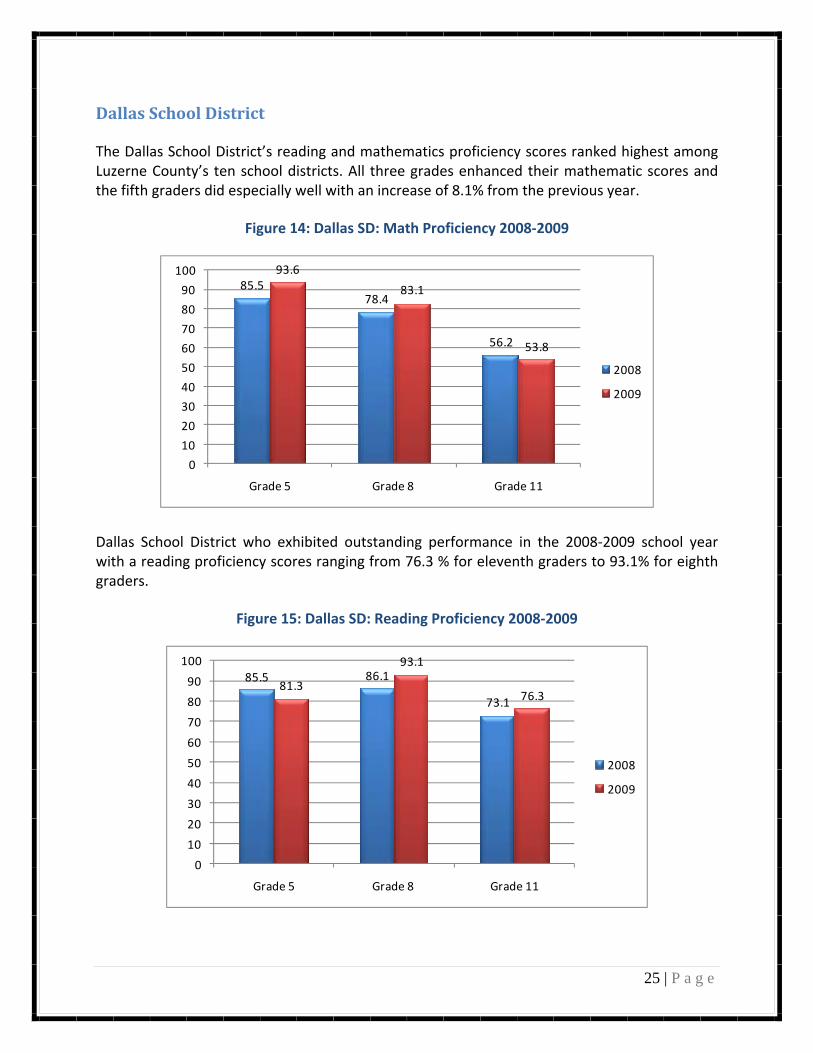
Dallas School District The Dallas School District’s reading and mathematics proficiency scores ranked highest among Luzerne County’s ten school districts. All three grades enhanced their mathematic scores and the fifth graders did especially well with an increase of 8.1% from the previous year.
Figure 14: Dallas SD: Math Proficiency 2008‐2009
85.578.4
56.2
93.6
83.1
53.8
0
10
20
30
40
50
60
70
80
90
100
Grade 5 Grade 8 Grade 11
2008
2009
Dallas School District who exhibited outstanding performance in the 2008‐2009 school year with a reading proficiency scores ranging from 76.3 % for eleventh graders to 93.1% for eighth graders.
Figure 15: Dallas SD: Reading Proficiency 2008‐2009
85.5 86.1
73.181.3
93.1
76.3
0
10
20
30
40
50
60
70
80
90
100
Grade 5 Grade 8 Grade 11
2008
2009
26 | P a g e
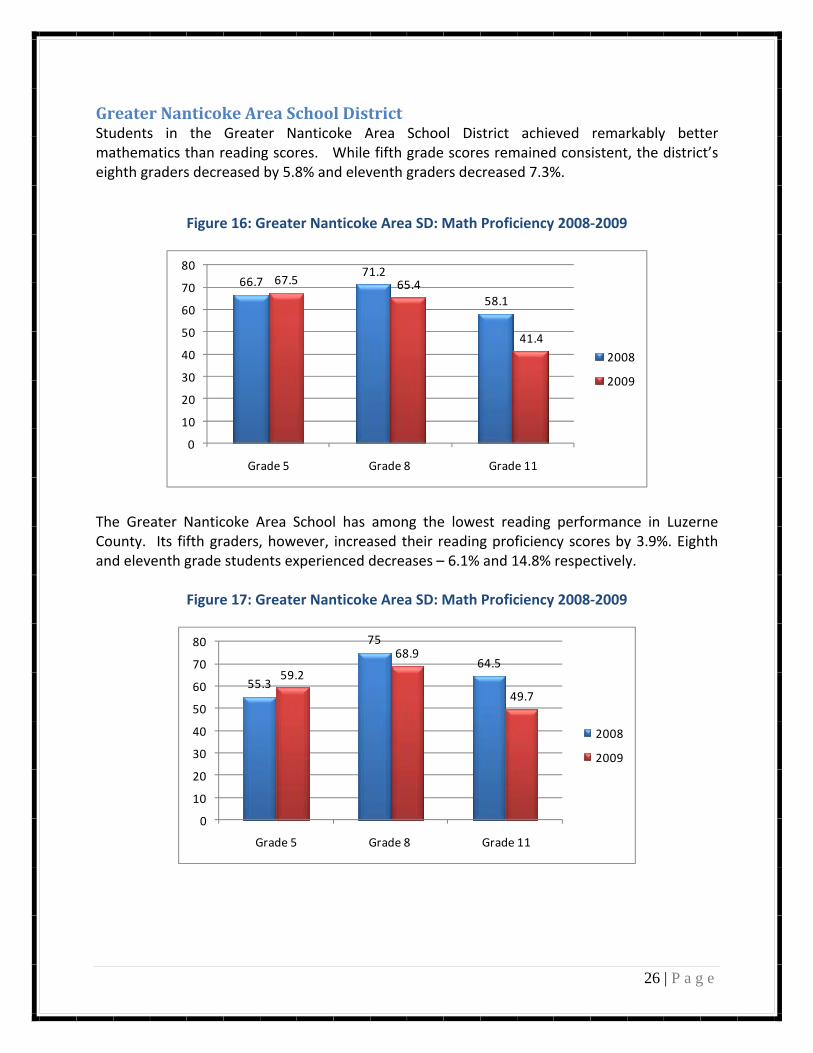
Greater Nanticoke Area School District Students in the Greater Nanticoke Area School District achieved remarkably better mathematics than reading scores. While fifth grade scores remained consistent, the district’s eighth graders decreased by 5.8% and eleventh graders decreased 7.3%.
Figure 16: Greater Nanticoke Area SD: Math Proficiency 2008‐2009
66.771.2
58.1
67.5 65.4
41.4
0
10
20
30
40
50
60
70
80
Grade 5 Grade 8 Grade 11
2008
2009
The Greater Nanticoke Area School has among the lowest reading performance in Luzerne County. Its fifth graders, however, increased their reading proficiency scores by 3.9%. Eighth and eleventh grade students experienced decreases – 6.1% and 14.8% respectively.
Figure 17: Greater Nanticoke Area SD: Math Proficiency 2008‐2009
55.3
75
64.559.2
68.9
49.7
0
10
20
30
40
50
60
70
80
Grade 5 Grade 8 Grade 11
2008
2009

27 | P a g e
Hanover Area School District The students’ scores in the Hanover School District varied by grade. Fifth grade students showed a 2.1% decrease in math proficiency from 2008 to 2009 while eight grade students showed improvement and eleventh grade students maintained their average score.
Figure 18: Hanover Area SD: Math Proficiency 2008‐2009
64.5
74.1
55.762.4
76.1
55.7
0
10
20
30
40
50
60
70
80
Grade 5 Grade 8 Grade 11
2008
2009
Hanover Area School District’s reading proficiency scores for the 2008‐2009 school year all showed decreased from the previous year. The largest increase occurred in the eighth grade where students showed a 6.5% decrease; however, this group also had the highest scores among all three grades.
Figure 19: Hanover Area SD: Reading Proficiency 2008‐2009
53.3
87.3
70.2
50.0
80.8
65.5
0
10
20
30
40
50
60
70
80
90
100
Grade 5 Grade 8 Grade 11
2008
2009

28 | P a g e
Hazleton Area School District All but one group of students in the Hazleton Area school district showed improvement between 2008 and 2008. Eleventh grader students experienced a 5.8% mathematics proficiency decline.
Figure 20: Chart 18: Hazleton Area SD: Math Proficiency 2008‐2009
73.3
59.2
49.2
76.7
68.0
43.4
0
10
20
30
40
50
60
70
80
90
Grade 5 Grade 8 Grade 11
2008
2009
The graph above shows that students in the Hazleton Area School District achieved an increase of 5.2% in their reading proficiency average, although eleventh graders experienced a decline within the past year of ‐2.1%. The fifth graders have exhibited outstanding performance with an increase of 7.2% in their reading proficiency scores.
Figure 21: Hazleton Area SD: Reading Proficiency 2008‐2009
59.7
74
55.2
66.974.1
53.1
0
10
20
30
40
50
60
70
80
Grade 5 Grade 8 Grade 11
2008
2009

29 | P a g e
Lake Lehman School District Eighth and eleventh graders in the Lake Lehman School District did rather well in term of their math proficiency with a positive increase of 6.2% and 5.8% respectively. The fifth graders declined significantly with a 7.1% decrease from the year before, however their overall scores are still fairly high.
Figure 22: Lake Lehman SD: Math Proficiency 2008‐2009
86.9
64
50.6
79.8
70.2
55.7
0
10
20
30
40
50
60
70
80
90
100
Grade 5 Grade 8 Grade 11
2008
2009
Lake Lehman School District students faired very well in 2008‐2009 for reading proficiency. All three grades analyzed had positive results and overall increased their reading proficiency score by an average of 4%.
Figure 23: Lake Lehman SD: Reading Proficiency 2008‐2009
76.181.8
69.8
78.285.4
72.6
0
10
20
30
40
50
60
70
80
90
Grade 5 Grade 8 Grade 11
2008
2009

30 | P a g e
Northwest Area School District Among all eleven school districts in Luzerne County, students in the Northwest Area School District scored the lowest on the mathematics portion of the PSSA. Eleventh grade students scored the lowest of all three grades dropping from 42.8% in 2008 to 33.6% in 2009. According to the AYP status, Northwest Area School District has been given a warning that improvements are warranted since it ranks last in performance among all Luzerne County schools.
Figure 24: Northwest Area SD: Math Proficiency 2008‐2009
69.7 71.2
42.8
62.566.1
33.6
0
10
20
30
40
50
60
70
80
Grade 5 Grade 8 Grade 11
2008
2009
Student in the Northwest Area School District had much higher reading proficiency scores when compared to math. Fifth grade students actually showed an increase in math proficiency, increasing by 2.4%. Although eight graders scored the highest among all three grades, they experienced a significant decrease; from 84.6% in 2008 to 78.8% in 2009.
Figure 25: Northwest Area SD: Reading Proficiency 2008‐2009
62.6
84.6
6665.0
78.8
60.8
0
10
20
30
40
50
60
70
80
90
Grade 5 Grade 8 Grade 11
2008
2009

31 | P a g e
Pittston Area School District Overall, two out of the three groups examined in the Pittston School District increased their mathematic proficiency scores. The district’s eleventh graders performed the best by increasing their overall mathematics score by 11.5% which led them to achieve the second highest score in their grade within the county. However, the district’s fifth graders performed the worst – with a mathematics proficiency decline of 8.6%.
Figure 26: Pittston Area SD: Math Proficiency 2008‐2009
74.4 76.5
57.865.8
80.7
69.3
0
10
20
30
40
50
60
70
80
90
Grade 5 Grade 8 Grade 11
2008
2009
Reading proficiency scores for the students in the Pittston Area School District showed a similar trend to math scores for 2008 and 2009. The eleventh graders had the highest percentage change of 9.2%. The district’s fifth graders, however, experienced a decline of 4%, while eighth grade students increase only slightly.
Figure 27: Pittston Area SD: Reading Proficiency 2008‐2009
74.4
83.9
68.660.8
85.077.8
0
10
20
30
40
50
60
70
80
90
Grade 5 Grade 8 Grade 11
2008
2009

32 | P a g e
WilkesBarre Area School District Although the eighth and eleventh grade students in the Wilkes‐Barre Area School District showed improved, they are still below average for both grades within Luzerne County.
Figure 28: Wilkes‐Barre Area SD: Math Proficiency 2008‐2009
69.9
60
5053.5
73.1
60.4
0
10
20
30
40
50
60
70
80
Grade 5 Grade 8 Grade 11
2008
2009
During the 2008‐2009 school year, the district improved its reading scores by an average of 4.1%. The eighth graders did especially well with a 5.2% increase. Although the fifth and eleventh graders increased their scores, they are still significantly lower than the 71.7% average.
Figure 29: Wilkes‐Barre Area SD: Reading Proficiency 2008‐2009
53.5
73.1
60.455.7
79.2
65.6
0
10
20
30
40
50
60
70
80
90
Grade 5 Grade 8 Grade 11
2008
2009

33 | P a g e
Wyoming Area School District Wyoming Area School district’s fifth graders experienced a decline of 16.2% in mathematics proficiencies from 2007‐2008 to 2008‐2009. As a result, the district lost its 2007‐2008 title of having the highest mathematics proficiency score when the Dallas School District beat their scores. Although the fifth graders’ scores declined and brought down the district’s average, the eighth graders achieved a high score of 81.9% and eleventh graders scored 81.1%.
Figure 30: Wyoming Area SD: Math Proficiency 2008‐2009
95.3
78.68379.1 81.9 81.1
0
20
40
60
80
100
120
Grade 5 Grade 8 Grade 11
2008
2009
Fifth graders experienced the greatest decline of 13.1% putting them below the average of the county. The eighth graders are performing exceptionally well with the third highest score for eighth graders among all districts.
Figure 31: Wyoming Area SD: Reading Proficiency 2008‐2009
81.2 84.476.4
68.1
88.9
76.8
0
10
20
30
40
50
60
70
80
90
100
Grade 5 Grade 8 Grade 11
2008
2009

34 | P a g e
Wyoming Valley West School District Two out of the three groups examined at Wyoming Valley West school district increased their scores from last year. The eighth graders performed exceptionally well within the past school year; however, they are still below average within the county. The district’s eleventh graders scored the lowest average in the most recent round of testing within the county.
Figure 32: Wyoming Valley West SD: Math Proficiency 2008‐2009
62.8
55.249.2
66.2 64.7
38.9
0
10
20
30
40
50
60
70
Grade 5 Grade 8 Grade 11
2008
2009
During the 2008‐2009 school year, only one grade increased their reading proficiency scores – fifth graders increased their scores by 3.5%. Eighth graders experienced a 0.9% reading proficiency decline from year to year while eleventh graders’ decrease was 0.7%
Figure 33: Wyoming Valley West SD: Reading Proficiency 2008‐2009
57.1
76.5
59.960.6
75.4
59.2
0
10
20
30
40
50
60
70
80
90
Grade 5 Grade 8 Grade 11
2008
2009

35 | P a g e
References Hall, Sarah. Grading Our Schools: Annual Analysis of Education Stats. (June 28, 2009). (http://www.thetimes-tribune.com/news/grading_our_schools_annual_analysis_of_education_stats? parentPage=2.1252). Hall, Sarah. Area Schools Improve Test Scores. (September 3, 2009). The Times Tribune Newspaper. (http://www.thetimes-tribune.com/news/area_schools_improve_state_test_scores). PA Department of Education. (September 8, 2009). PSSA Results for 2008-2009 Academic School Year and 2007-2008 Academic School Year Results. (http://www.pde.state.pa.us/a_and_t/cwp/view.asp?A=3&Q=150034). PA Department of Education. (PA-PACT). (September 22, 2009). http://www.pde.state.pa.us/k12/cwp/view.asp?A=165&Q=139520). PA Department of Education/Academic Achievement Report for 2008-2009. AYP Facts and FAQ’s. (September 3, 2009 and September 22, 2009). (http://paayp.emetric.net/). School Data Direct. CCSSO’s: A service provided by the State Education Data Center. (September 24, 2009). (http://www.schooldatadirect.org/). “The Morning Call Use it, for Life.” PSSA Results 2009: School Districts in Luzerne County. (September 10, 2009). (http://projects.mcall.com/PSSA-results/county-districts/Luzerne/). U.S. Department of Education. IES: National Center for Education Statistics/State Profile. (September 10, 2009). (http://ies.ed.gov/). U.S. Department of Education. Students. (September 22, 2009). (http://www.ed.gov/students/landing.jhtml). U.S. Census Bureau 2008 American Community Survey. (March 3, 2010). (http://www.census.edu).