Embed Size (px)
Citation preview

1
LW-H Equilibrium Measurements andUnified Predictions of Hydrate-Containing
Phase Equilibriafor Methane, Ethane, Propaneand Their Mixtures
S. O. Yang, Y. S. Kim, S. K. Ryu and C. S. Lee
Thermodynamics and Properties LaboratoryDept. of Chemical Engineering, Korea University

2
Motivation
The methane hydrate as a possible energy resource or the CO2hydrate as a deep-ocean sequestration Necessity for reliable solubility data in water-rich phase of
hydrate-containing systems (H-LW). Measurement of solubility using indirect method for sparingly
soluble gas components.
Necessity for comprehensive calculation methods Unified method to the hydrate-containing systems The applicability of Nonrandom lattice fluid hydrogen bonding
theory (You et al. 1994a, 1994b; Lee et al., 2001)

3
Computation of Hydrate Phase Equilibria
Equality of Chemical potential(or fugacity)
where α or β denotes V, LW, LC or Ice phase.
is obtained from EOS and from vapor pressure and saturated molar volume(Sloan et al., 1976)
• H-LW-V, H-I-V, H-LW-LC : Yang et al.(2000), Present work (Mixture)• H-LW-V, H-I-V : Klauda and Sandler (2000)• H-Lc, H-V, H-LW : Yang et al.(2000, 2001), Present work (Mixture)• H-Lc, H-V : Sloan(1976)
( ) ( ) or EHii
EHii
EHi
Hiii
Hi μμμμμμμμμ βαβα −=−=−==
( )βαii
Hi fff ==
βαμ or i
IceW
EHW μμ and

4
Computation of Hydrate Phase Equilibria
is obtained from(Holder et al.,1980)
• H-LW-V, H-I-V : Holder et al.(1980), Sloan (1998)• H-V, H-LC : Anderson and Prausnitz(1986), Munck et al.(1988)
is obtained from the statistical model by van der Waals and Platteeuw (1959).
EHWW μμ βα −or )( and ),(),,( 00 PVTHPT EH
WEH
WEHW ΔΔΔμ
wwPP
EHWT
T
EHWoo
EHWW
EHW xdP
RTVdT
RTH
RTPT
RT ooγμμμ ln),(
2 −Δ+Δ−Δ=−
Π
EHW
HW μμ −
Π+−= j jmjm mEHW
HW fCRT ]1ln[ ,νμμ

5
Chemical Potential in Fluid Phase
Nonrandom Lattice Fluid Hydrogen Bonding Theory NLF EOS by You et al. [1994 a, b] Expansion to associating system using Veytsman statistics[1990]
by Yeom et al. [1999] A normalization of Veytsman statistics by Lee et al. [2001]
Parameters for NLF-HB theory Pure species : energy and size parameters Hydrogen-bonding energy and entropy for H2O-H2O interaction Binary interaction parameter for interactions between molecules

6
Chemical Potential of Water in Hydrate Phase
Statistical model by van der Waals and Platteeuw(1959)
is the fugacity of a component j in the equilibrium fluid phase.
Cj,m is the Langmuir constants.
• Calculated from the Kihara potential function • Kihara potential parameters are fitted from the three-phase
equilibrium pressure for each guest species.
Π+−= j jmjm mEHW
HW fCRT ]1ln[ ,νμμ
]/)exp[( 00 RTPf jjj μμ −= ΠΠ
drrkT
rWkT
TCiR
mj
−=
0
2,
)(exp4)( π

7
Chemical Potential of Empty Hydrate
φWsatEH of the empty hydrate is assumed to be unity.
Vapor pressure of empty hydrates• Fitted to equilibrium pressures of multi-guest and simple hydrates• Structure I :
• Structure II :
Molar volume of empty hydrates• Correlated equation regressed by Avlonitis (1994)•
( ) ( )satEHW
satEHW
satEHW
satEHWW
EHW PPVPRT −++= φμμ ln0
TatmP EHsatW /25.6072410.17]/ln[ −=
TatmP EHsatW /34.6121515.17]/ln[ −=
])()()(1[ 303
202010 TTkTTkTTkVV satEH
W −+−+−+=

8
Chemical Potential of Ice
If saturated vapor pressure and molar volume of ice are known
Fugacity coefficient of ice,φWsatI is assumed to be unity.
Saturated vapor pressure is obtained from subcooled water properties(Perry et al., 1989)
Molar volume of ice use the correlation equation regressed by Avlonitis (1994)
( ) ( )satIW
satIW
satIW
satIWW
IW PPVPRT −++= φμμ ln0
5171.537.64159247.17]/ln[
+−=
TbarPsatI
W

9
Experiments
Direct method for small gas solubility Applicable to salt-containing systems Measurements by expansion of a liquid sample Mole fraction of gas calculated by pressure changes in expansion
chamber
• Yang, S. O., Yang, I. M., Kim, Y. S. and Lee, C. S., “Measurementand prediction of phase equilibria for water+CO2 in hydrate formingconditions”, Fluid Phase Equilib., 175 (2000), 79-85
• Yang, S. O., Cho, S. H., Lee, H. and Lee, C. S., “Measurement andprediction of phase equilibria for water+methane in hydrate formingconditions”, Fluid Phase Equilib., 185 (2001), 53-63
Not applicable to very sparingly soluble hydrocarbons

10
Experiments
Indirect method for very small gas solubility With known composition of liquid phase, the phase transition
point is detected by visual inspection.
• Rumph, B. and Maurer, G., “An Experimental and Theoretical Investigation on the solubility of Carbon Dioxide in Aqueous Solutions of Strong Electrolytes”, Ber. Bunsenges. Phys. Chems., 97(1993), 85-97
Present study for water + methane or ethane in hydrate-forming conditions

11
Experimental Apparatus
3
2
6
7
5
PPT
T
8
9
14
11
1P
12
10
1315
4
2
Figure 1. The experimental apparatus for measurement of the equilibrium pressure and thesolubility of dissolved gas in the hydrate containing equilibria(1)vacuum pump; (2)magnetic stirrer; (3)sampling cell; (4)sampling valve; (5)sampling loop;(6)metering pump; (7)density transducer; (8)water bath; (9)equilibrium cell; (10)flask;(11)syringe pump; (12)line filter; (13)gas bomb; (14) pressure gauge (15) McHugh typevariable volume view cell

12
The Reliability of the Experimental Procedure
Comparison between present methane solubility in water and those of DECEHEMA series
The accuracy in mole fraction Present work : 4.8 % AAD DECHEMA : 5.3 % AAD
Pressure / MPa
0 5 10 15 20
XC
H4
0.0001
0.001
0.01
Yarym-Agaev et al. [1983]Culverson and Mcketta [1951]Yokoyama et al. [1988]Wang et al.[1995]Deffy et al. [1961]CalculatedPreasent Work

13
Three Phase Equilibria for Methane Hydrates
Temperature / K
260 265 270 275 280 285 290 295
Pres
sure
/ M
Pa
1
10
100
Data of Deaton and Frost (1946)Data of McLeod and Campbell (1961) Data of Jhaveri and Robinson (1965)Data of Galloway et al. (1970) Data of Verma (1974) Data of de Roo (1983) Data of Thakore and Holder (1987)Data of Yang et al. (2000)Calculated by Sloan (1998)Present calculation
Figure 2. Comparison of experimental and calculated equilibriumpressure of methane hydrate in three phase equilibria

14
Three Phase Equilibria for Ethane Hydrates
Temperature / K
255 260 265 270 275 280 285 290 295
Pres
sure
/ M
Pa
0.1
1
10
Data of Robert et al. (1940)Data of Deaton Frost (1946)Data of Reamer et al. (1952)Data of Galloway et al. (1970)Data of Holder and Grigoriou (1980)Data of Ng and Robinson (1985)Data of Avlontis (1988)Calculated by Sloan (1998)Present calculation
Figure 3. Comparison of experimental and calculated equilibriumpressure of ethane hydrate in three phase equilibria

15
Temperature / K
240 250 260 270 280 290
Pres
sure
/ M
Pa
0.1
1
10
Data of Wilcox et al. (1941)Data of Miller and Strong (1946)Data of Deaton and Frost (1946)Data of Reamer et al. (1952)Data of Robinson and Mehta (1971)Data of Verma (1974)Data of Thakore and Holder (1987)Data of Holder and Godbole (1982)Data of Patil (1987)Calculated by Sloan (1998)Present calculation
Figure 4. Comparison of experimental and calculated equilibriumpressure of propane hydrate in three phase equilibria
Three Phase Equilibria for Propane Hydrates

16
Three Phase Equilibria for Mixed Hydrates
Figure 5. Comparison of calculated dissociation pressure of methane+ethane hydrate with measurements by Deaton and Frost (1946) for structure I
Temperature / K
260 270 280 290 300
Pres
sure
/ M
Pa
1
10
100
Methane in vapor = 100%Methane in vapor = 95.0%Methane in vapor = 90.4%Methane in vapor = 56.4%Methane in vapor = 0%Present calculation for pure methanePresent calculation for methane 95%Present calculation for methane 90%Present calculation for methane 80%Present calculation for methane 56%Present calculation for methane 30%Present calculation for methane 10%Present calculation for pure ethane

17
Three Phase Equilibria for Mixed Hydrates
Temperature / K
270 275 280 285 290
Pres
sure
/ M
Pa
1
10
Ethane in vapor = 67.8%Ethane in vapor = 74.0%Ethane in vapor = 81.4%Ethane in vapor = 85.0% ~ 85.7%Ethane in vapor = 100%Present calculation for ethane 67.8%Present calculation for ethane 74.0%Present calculation for ethane 81.4%Present calculation for ethane 85.0%Present calculation for pure ethane
Figure 6. Comparison of calculated equilibrium pressure of ethane +propane hydrate with measurements for structure I hydrate

18
Three Phase Equilibria for Mixed Hydrates
Temperature / K
270 272 274 276 278 280
Pres
sure
/ M
Pa
0.1
1
10
Ethane in vapor = 81.4%Ethane in vapor = 72.9~74.0%Ethane in vapor = 65.8~67.8%Ethane in vapor = 44.3~45.9%Ethane in vapor = 28%Ethane in vapor = 0%Present calculation for ethane 81.4%Present calculation for ethane 73.5%Present calculation for ethane 66.8%Present calculation for ethane 45.0%Present calculation for ethane 28.0%Present calculation for ethane 0%
Figure 7. Comparison of calculated equilibrium pressure of ethane+ propane hydrate with measurements for structure II hydrate

19
Solubility of Methane in H-Lw Equilibria
Figure 8. Comparison of calculated methanesolubility in liquid water phase of H-Lwequilibria with present experimental data
Temperature / K
272 274 276 278 280 282 284
Mol
e fr
actio
n of
met
hane
in w
ater
0.0000
0.0005
0.0010
0.0015
0.0020
Present measurements at 5.1 MPaPresent measurements at 10.1 MPaPresent measurements at 12.7 MPaPresent measurements at 14.3 MPaRegressed value from Yang et al. (2001)Calculated value from Handa (1990)Regressed value of present experimentaldata at 273.15KLinear regression line of present experimental data
Temperature / K
272 274 276 278 280 282 2840.0005
0.0010
0.0015
0.0020
Present measurements at 5.1 MPaPresent measurements at 10.1 MPaPresent measurements at 12.7 MPaPresent measurements at 14.3 MPaPresent calculation
Figure 9. Comparison of present experimentalmethane solubility in liquid water phase of H-Lw equilibria with experimental data by Yang etal. (2001) and Handa's prediction (1990)

20
Solubility of Ethane in H-Lw Equilibria
Temperature / K
274 276 278 280 282 284
Mol
e fr
actio
n of
eth
ane
in w
ater
0.0001
0.0002
0.0003
0.0004
0.0005
0.0006
Present calculation at 10.1 MPaPresent calculation at 15.1 MPaPresent calculation at 20.1 MPaPresent measurement at 10.1 MPaPresent measurement at 15.1 MPaPresent measurement at 20.1 MPa
Figure 10. Comparison of calculated ethane solubility in liquid waterphase of H-Lw equilibria with present experimental data

21
Water Content of Hydrocarbon-Rich Phase in H-Πi Equilibria
Figure 11. Comparison of calculated water contents in methane-rich phaseof H-V equilibria with isobaric experimental data by Aoyagi et al. (1980)and Sloan's calculation (1998)
Temperature / K
230 240 250 260 270 280
Wat
er c
onte
nts /
ppm
0
50
100
150
200
250
Data of Aoyagi et al. (1980) at 3.45 MPaData of Aoyagi et al. (1980) at 6.90 MPaData of Aoyagi et al. (1980) at 10.34 MPaCalculated by Sloan (1998)Present calculation
22
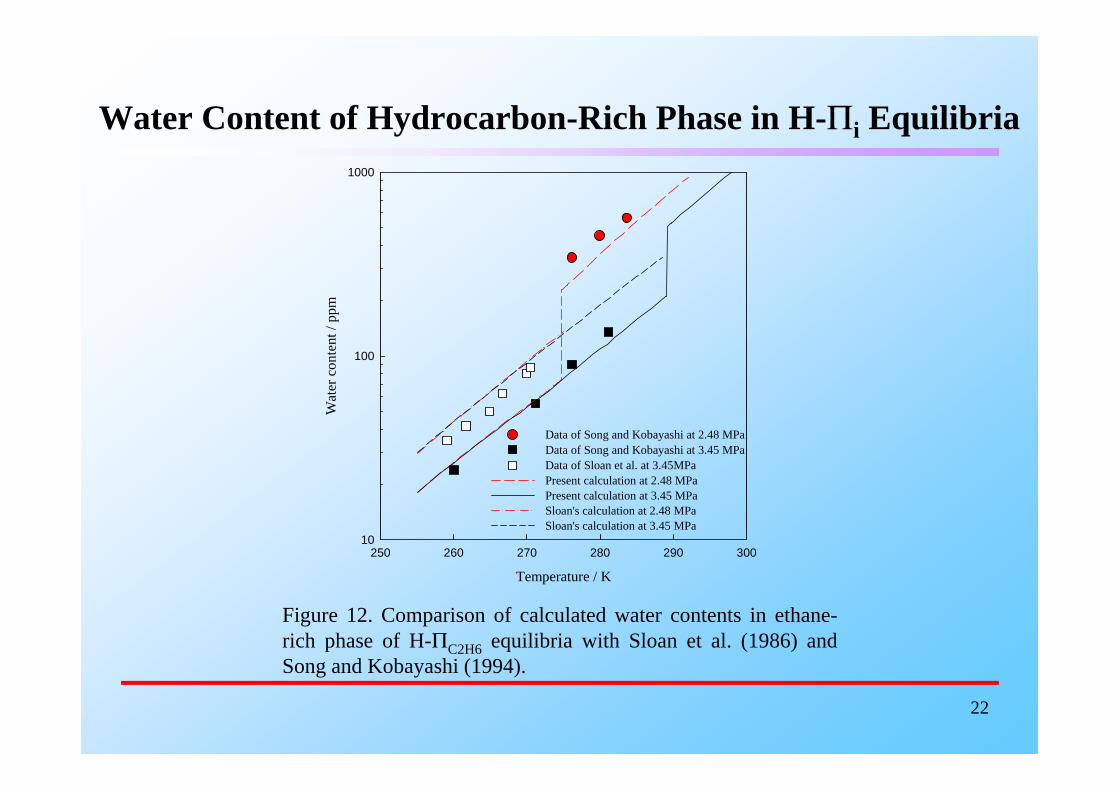
Water Content of Hydrocarbon-Rich Phase in H-Πi Equilibria
Figure 12. Comparison of calculated water contents in ethane-rich phase of H-ΠC2H6 equilibria with Sloan et al. (1986) andSong and Kobayashi (1994).
Temperature / K
250 260 270 280 290 300
Wat
er c
onte
nt /
ppm
10
100
1000
Data of Song and Kobayashi at 2.48 MPaData of Song and Kobayashi at 3.45 MPaData of Sloan et al. at 3.45MPaPresent calculation at 2.48 MPaPresent calculation at 3.45 MPaSloan's calculation at 2.48 MPa Sloan's calculation at 3.45 MPa

23
Water content of hydrocarbon-rich phase in H-Πi equilibria for mixed hydrate
Figure 13. Comparison of calculated water contents in hydrocarbon-rich phase of H-L equilibria with isobaric experimental data of Songand Kobayashi (1994) for water+ethane+propane system at 3.45 MPa
Temperature / K
250 260 270 280 290 300
Wat
er c
onte
nt /
ppm
10
100
Ethane in liquid = 100%Ethane in liquid = 50%Ethane in liquid = 75%Ethane in liquid = 89.5%Calculated for ethane in liquid = 100%Calculated for ethane in liquid =50% Calculated for ethane in liquid = 75% Calculated for ethane in liquid = 89.5% Calculated for propane in liquid = 100%

24
Water content of hydrocarbon-rich phase in H-Πi equilibria for mixed hydrate
Figure 14. Comparison of calculated water content in hydrocarbon-rich phase of H-Vequilibria with isobaric experimental data of Song and Kobayashi (1982) for water +methane + propane system, mole fraction of propane in vapor phase is 0.0531
Temperature / K
230 240 250 260 270 280 290
Wat
er c
onte
nt /
ppm
0
100
200
300
400
500
600
Data of Song and Kobayashi (1982) at 2.07 MPa Data of Song and Kobayashi (1982) at 3.45 MPaData of Song and Kobayashi (1982) at 6.89 MPaData of Song and Kobayashi (1982) at 10.34 MPaCalculated for 2.07 MPaCalculated for 3.45 MPaCalculated for 6.89 MPaCalculated for 10.34 MPa

25
Conclusions
Solubilities in water-rich phase of H-LW for methane and ethanehydrate were obtained with the accuracy of 3.1 % and 5.3 % inmole fraction, respectively.
A unified calculation method was investigated with thenonrandom lattice fluid hydrogen bonding theory. The Kiharaparameters in vdWP model and the vapor pressure of the emptyhydrate were optimized.
With a single binary parameter and hydrogen bonding energy,various phase equilibria of simple hydrate and mixed hydratewere calculated with good accuracy.