Embed Size (px)
Citation preview

Lymphocyte dynamics during a BVDV challenge in calves
A Step Toward Understanding How BVDV Infection Facilitates the Development of BRDC

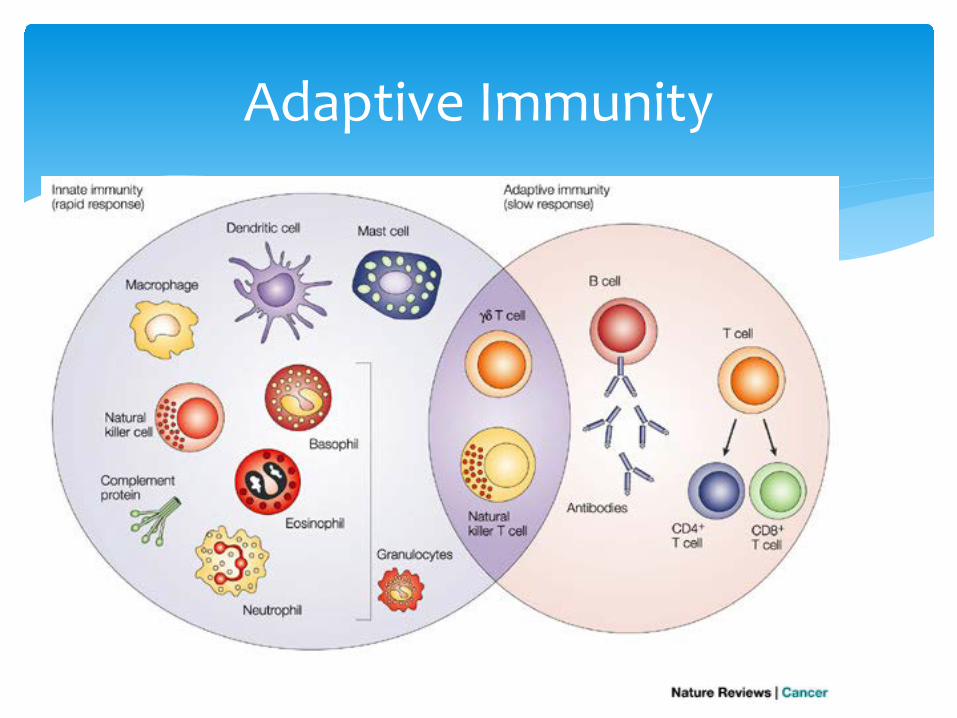
∗ Innate immunity: 1) rapid, 2) invariant, 3) limited in specificity, and 4) the response to a particular type of microbe is not larger or faster after a previous encounter (no memory response). Innate and acquired immune components constantly interact to produce a coordinated defense system.
∗ Contrasts with acquired immunity: 1) requires time (4 days-3 weeks) for induction, 2) variant (a unique response to each foreign substance), 3) highly specific, and 4) Second and subsequent encounters with same foreign material produces larger, more rapid response (basis for vaccination)
∗ Innate immunity consists of barriers (skin and mucus membranes), chemical defense (lipids, acid, wax), cells (monocytes, macrophage, neutrophils, eosinophils and mast cells – and platelets) and factors (complement, interferon, antimicrobial peptides, lipid mediators, acute phase proteins and others)
Immunity in Cattle

Innate Immune Cells

∗ Mediate by lymphocytes∗ There are several types of lymphocytes
∗ B cells – as resting B cells (with a target, but not productive yet), activated B cells (expanded clones that make antibody), plasma cells (antibody factories) and memory B cells (more with the same target, quick to restart)
∗ T cells – T helper 1 cells (drive action with IFN-gamma), T helper 2 cells (drive antibody and fix damage), T helper 17 cells (recruit and activate innate cells), Treg cells (act as the breaks of the immune response), and T memory cells (all of the above waiting to go again on signs of damage, danger and attack)
Adaptive Immunity

∗ Antibodies ∗ IgG1, IgG2, and IgM protect the circulation and
internal tissues. IgM too big to enter tissue, IgG2 rides cells into tissues∗ IgA protects the mucosal surfaces and blocks entry of
invaders∗ IgG mediates recruitment of neutrophils∗ IgG2 primes of neutrophils
Specific Immunological Activities: Antibody
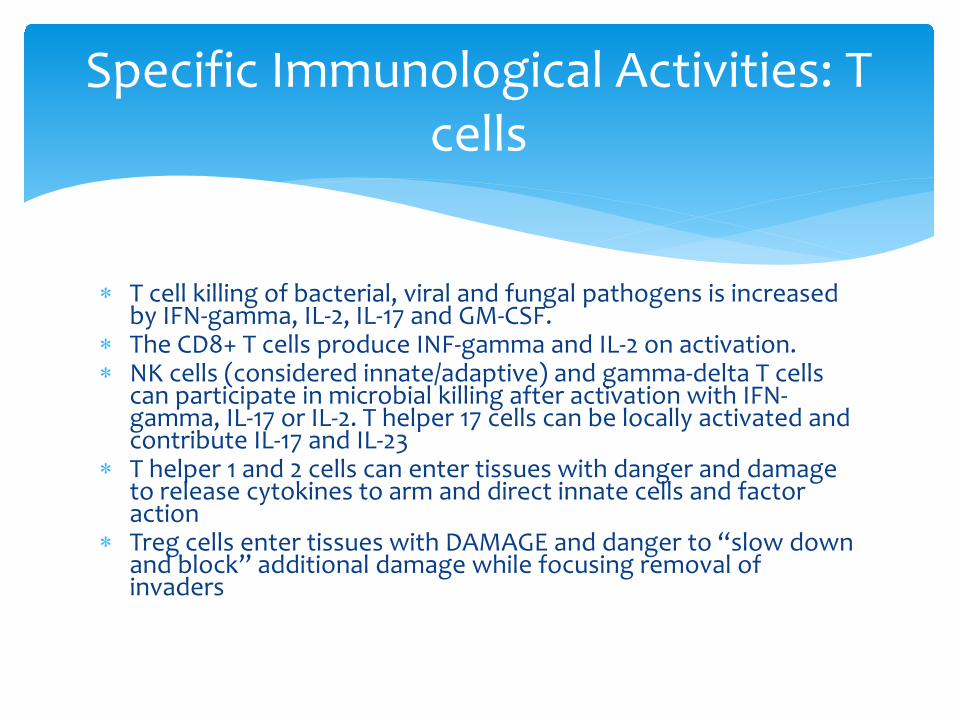
∗ T cell killing of bacterial, viral and fungal pathogens is increased by IFN-gamma, IL-2, IL-17 and GM-CSF.
∗ The CD8+ T cells produce INF-gamma and IL-2 on activation.∗ NK cells (considered innate/adaptive) and gamma-delta T cells
can participate in microbial killing after activation with IFN-gamma, IL-17 or IL-2. T helper 17 cells can be locally activated and contribute IL-17 and IL-23
∗ T helper 1 and 2 cells can enter tissues with danger and damage to release cytokines to arm and direct innate cells and factor action
∗ Treg cells enter tissues with DAMAGE and danger to “slow down and block” additional damage while focusing removal of invaders
Specific Immunological Activities: T cells
Adaptive Immunity

Immune Development in the Calf
∗ Constructs containing live or killed pathogens, close “relatives” of pathogens, and (when necessary) agents and complexes to induce damage and danger in the environment where the construct is given
∗ Vaccines are designed to “trick” the body into recognizing that it is invaded with a dangerous and damaging agent so it will mount a tissue level response that will call for a systemic construction of adaptive immune cells and factors (antibody and cytokine)
∗ Vaccines are seldom given by the “normal” route of colonization used by pathogens to cause disease, but provide protection because the induced adaptive cells and factors enter tissues with damage and danger in the future
Vaccines
∗ Designed to mimic tissue the biology of invaders and induce a lasting adaptive immune response
∗ Many designs are used, most to prevent the disease associated with invaders of the tissues
∗ Some are also designed to accelerate and enhance the immune response to an ongoing threat
Practical Vaccines

∗ Modified Live or Live-Attenuated vaccines
∗ Designed for subcutaneous delivery∗ Designed for intramuscular delivery∗ Designed for mucosal (often intranasal) delivery (less
common)∗ Killed and Subunit Vaccines with Adjuvant
∗ Designed for subcutaneous delivery∗ Designed for intramuscular delivery∗ Proposed for mucosal delivery
Common Vaccine C
∗ Bovine Viral Diarrhea Virus (BVDV) is a common pathogen of cattle. It has world-wide distribution.
∗ It is a small, single positive stranded RNA virus of the Pestivirus genus in the Flavivius Family.
∗ BVDV acute infection is associated with immune suppression (including lymphopenia, leukopenia, platelet depletion, and general clinical observations of innate and adaptive functional suppression).
∗ Highly acute BVDV infections are also associated with significant inflammatory damage in target tissues (lung and GI)
Bovine Viral Diarrhea Virus
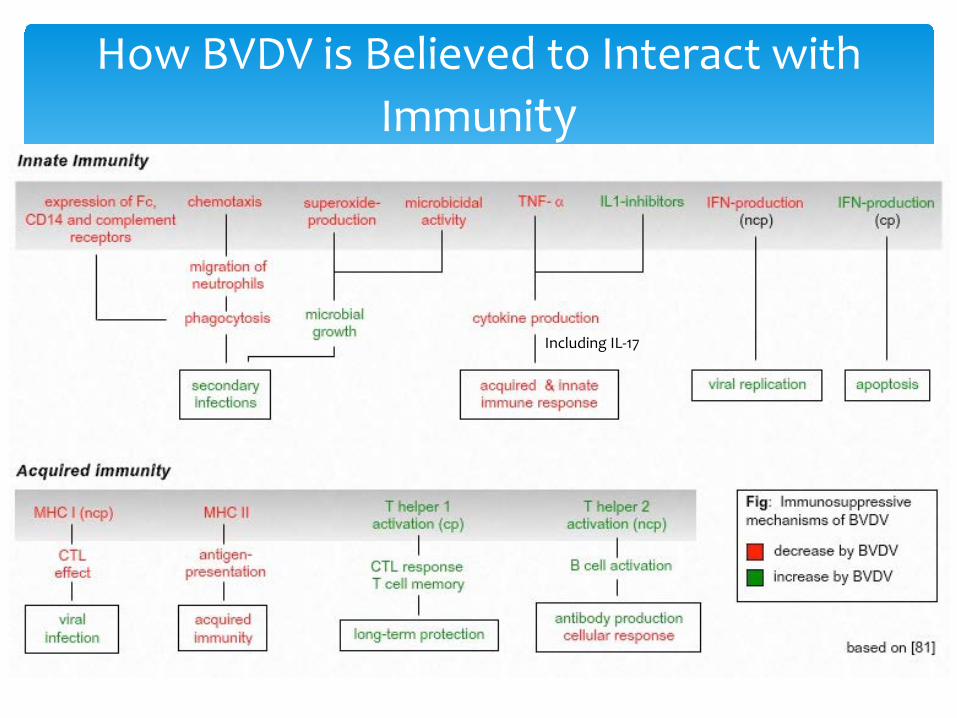
How BVDV is Believed to Interact with Immunity
Including IL-17

∗ In vivo consequences of BVDV acute infection suggest suppressive consequences. Acutely infected cattle often develop secondary infections, particularly respiratory infections. Further, more virulent viral infections are associated with significant inflammatory consequences
∗ In vitro models of BVDV infection have demonstrated inhibition of neutrophil, monocyte, dendritic cell and monocyte function. Infection of lymphocytes with certain high virulence strains and impact on in vitro lymphocyte blastogenesis and induced cytokine production has been demonstrated.
BVDV Immune Suppression

∗ Even after a number of in vitro studies, no clear evidence of lymphocyte mediated suppressive activity has been published to date
∗ In vitro studies done at UGA in the recent past indicate that direct interaction between live BVDV viruses and isolated bovine mononuclear cells induce changes consistent with the development of suppressive activity by T cells.
BVDV and Lymphocyte Mediated Suppression

∗ Mononuclear cells were collected from 10 previously vaccinated dairy cows or heifers
∗ Three BVD reference viral isolates were tested in the studies: NY-1 (ncp type 1a, low virulence), NADL (cp type 1a, moderate virulence), 1373 (ncp type 2a high virulence) each at 4 different multiplicity of infection (MOI). Phorbol myristate acetate (PMA) was used as a positive control inducer of suppressor cells (demonstrated in the 1980 with bovine T cells)
∗ Cells exposed to BVDV and their supernatants were assessed for their capacity to suppress super antigen and mitogen responses, induce IL-10 and IFN-gamma, and for changes in the cellular phenotype
In vitro Assessment of BVDV Interaction with Bovine Mononuclear
Cells
∗ Mononuclear cells (2x10⁷ per well) were incubated with BVDV virus at 0.3, 0.5, 1.0 and 2.0 MOI for 24, 48 and 72 hours or controls (SEB, PMA and medium only)
∗ The supernatants were collected by centrifugation into sterile tubes and pooled for treatment replicates. Supernatant was added as 12.5%, 25% or 50% of culture medium and fresh donor mononuclear cells and stimulated with optimal levels of ConcanavlinA, Staphylococcal enterotoxin B or Pokeweed Mitogen at 3x10⁶ per ml.
∗ The cells were removed from the plates, washed in PBS, treated with 200µg/ml of Mitomycin C for 1 hour (to block future DNA synthesis), and suspended at 6x10⁶ per ml in complete medium. They were mixed with fresh donor mononuclear cells and stimulated with optimal levels of Concanavlin A, Staphylococcal enterotoxin B or Pokeweed Mitogen.
∗ Cultures were plated in 96 well round bottom well plates. The plates were incubated for 40 hours. At that point, 0.2µCi of 3H-TdR per well was added. The plates were incubated for 6 more hours. The DNA from the cells harvested and assessed for incorporation of TdR into new DNA.
∗ Suppression was calculated as percent of control (medium only cells or supernatant).
Measurement of Suppressor Function

Lymphocyte Clonal Expansion
∗ Mononuclear cells were incubated with the BVDV viral strains or PMA for 1, 2 and 3 days in culture
∗ The cells were collected, washed and their proliferation blocked.
∗ They were added in equal numbers with “donor responder cells”.
∗ The relative proliferative response in the presence BVDV exposed cells was expressed as percent of the response with cells exposed to medium only
T Cell-mediated Functional Suppression

Evidence of Cell-Mediated Suppressor Function after BVDV
Exposure of MNC
30.00
50.00
70.00
90.00
110.00
130.00
150.0013
73 0
.3
1373
0.5
1373
1.0
1373
2.0
NA
DL
0.5
NA
DL
1.0
NA
DL
2.0
NY-
1 0.
5
NY-
1 1.
0
NY-
1 2.
0
% c
ontro
l res
pon
se
BVDV strain and MOI
Figure. 6. Percent of proliferative response relative to cultures with control cells added
Con A
SEB
PWM

Cell Dose Effect
0
10000
20000
30000
40000
50000
0.1 0.5 1 2
CPM
3H
fraction of responding cells
ConA cell dose effect
Control by celldose
PMA cell dose
BVDV cell dose
0
5000
10000
15000
20000
25000
0.1 0.5 1 2
CPM
3H
Fraction of responding cells
SEB cell dose effect
Control cell dose
PMA cells dose
BVDV cell dose
0
5000
10000
15000
20000
25000
0.1 0.5 1 2
PWM cell dose effect
Control cell dose
PMA cell dose
BVDV cell dose
Comparison of PMA (0.1µM) and BVDV 1373 at 1.0 MOI for dose dependent cell to cell inhibition of the proliferation response

∗ Supernatant was collected from the D3 cultures before harvesting the cells.
∗ The supernatant was diluted with medium to yield a final concentration of 12.5%, 25% or 50% of culture medium.
∗ Donor responder cells were added as the other 50% of volume.
∗ Inhibition of proliferation was expressed as percent of new DNA synthesis relative to cells exposed to medium only
Release of Suppressive Factors by BVDV exposed Mononuclear Cells
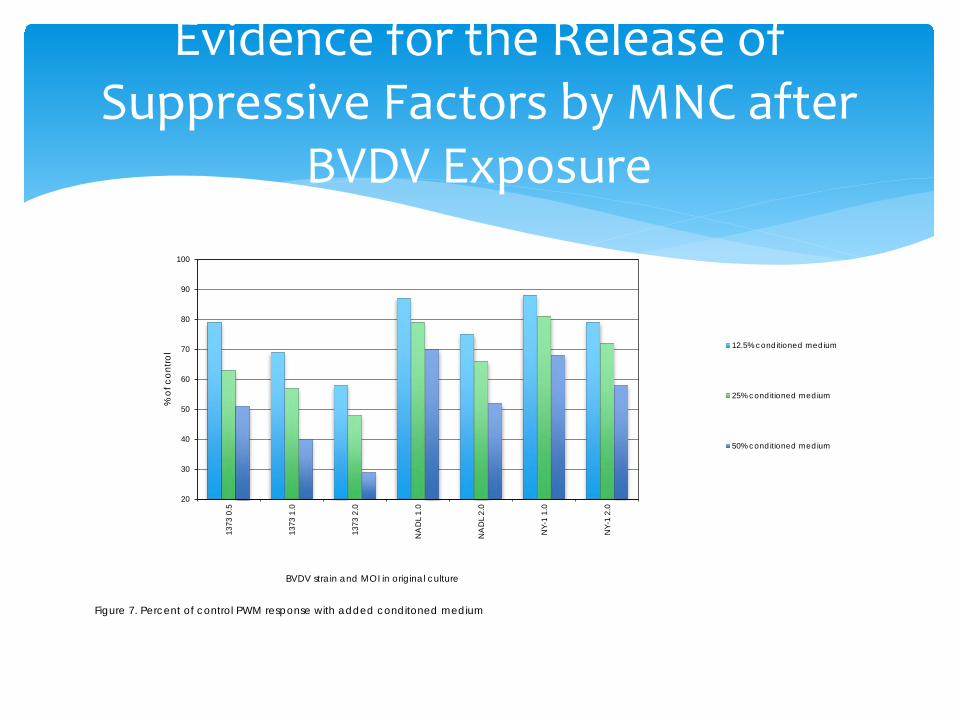
Evidence for the Release of Suppressive Factors by MNC after
BVDV Exposure
20
30
40
50
60
70
80
90
100
1373
0.5
1373
1.0
1373
2.0
NA
DL
1.0
NA
DL
2.0
NY-
1 1.
0
NY-
1 2.
0
% o
f con
trol
BVDV strain and MOI in original culture
Figure 7. Percent of control PWM response with added conditoned medium
12.5% conditioned medium
25% conditioned medium
50% conditioned medium
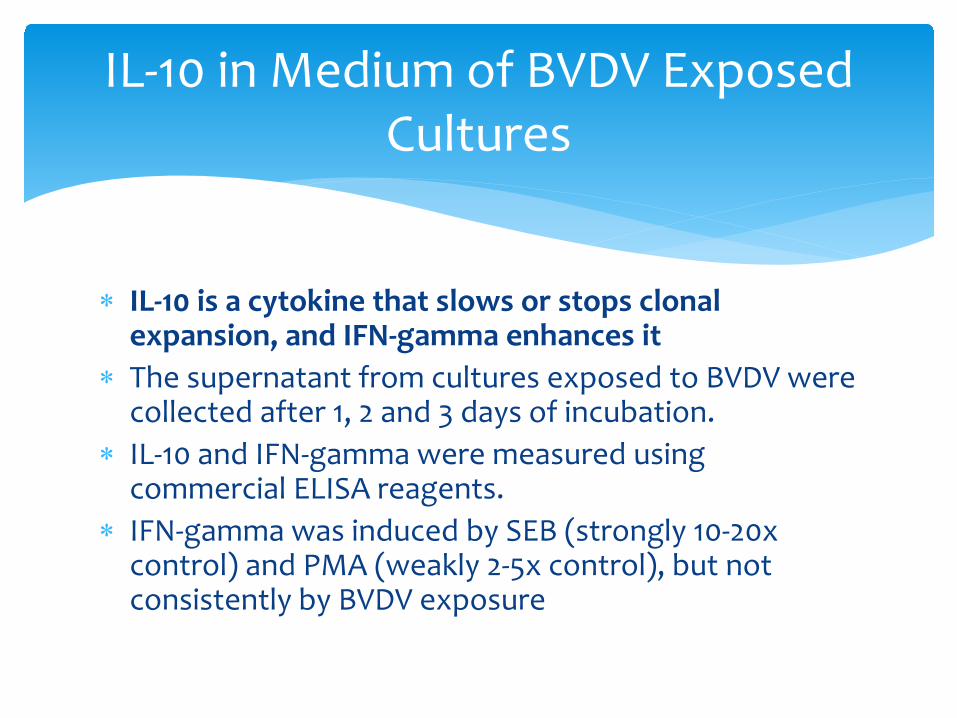
∗ IL-10 is a cytokine that slows or stops clonal expansion, and IFN-gamma enhances it
∗ The supernatant from cultures exposed to BVDV were collected after 1, 2 and 3 days of incubation.
∗ IL-10 and IFN-gamma were measured using commercial ELISA reagents.
∗ IFN-gamma was induced by SEB (strongly 10-20x control) and PMA (weakly 2-5x control), but not consistently by BVDV exposure
IL-10 in Medium of BVDV Exposed Cultures

Evidence of IL-10 Production after Exposure to BVDV (A suppressive
Cytokine)
0
2
4
6
8
10
1213
73 0
.3
1373
0.5
1373
1.0
1373
2.0
NA
DL
0.5
NA
DL
1.0
NA
DL
2.0
NY-
1 0.
5
NY-
1 1.
0
NY-
1 2.
0
Fold
con
trol
BVDV strain and MOI in culture
Figure 1. IL-10 in medium after exposure of MNC to BVDV
Day 1 in culture
Day 2 in culture
Day 3 in culture
01234567
D1 D2 D3
Fold
Control Day of Culture
IL-10 Induced by PMA 0.1µM

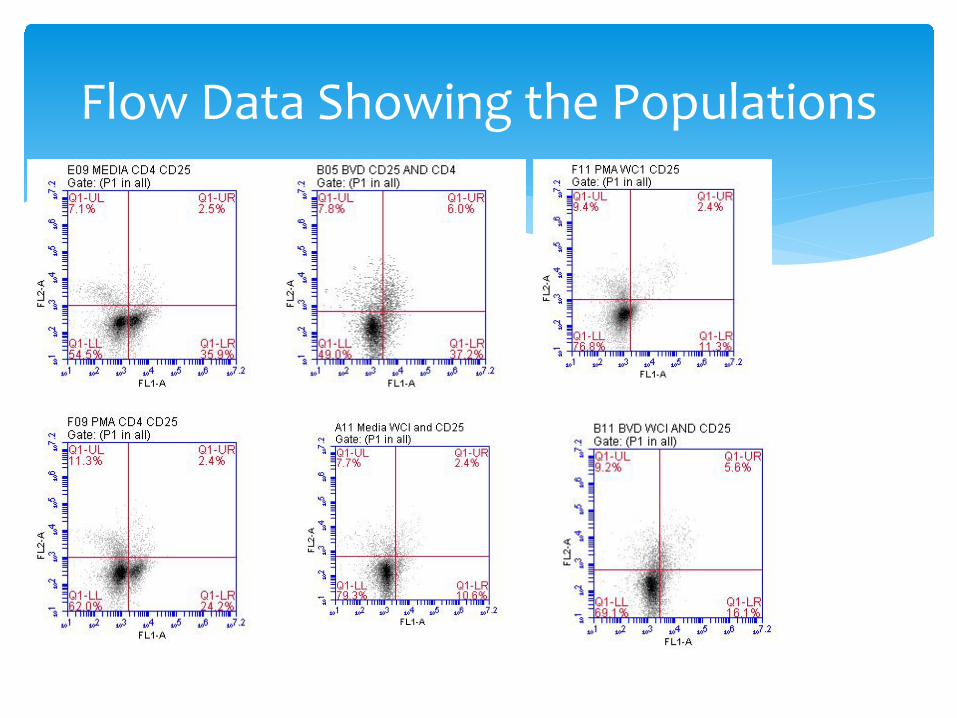
∗ Treg cells (that suppress immune action) have the phenotypes – CD4+CD25+(FoxP3+), CD4+CD39+(FoxP3-)
∗ The mononuclear cells were placed in culture at 1x10⁷ per ml
∗ The cells were collected from cultures on D1, D2 and D3 of incubation with the BVDV viruses.
∗ The cells were stained in 2-colors for CD4 (green), CD8 (green), CD39 (red) and CD25 (orange).
∗ Fraction of cells (as %) and number of receptors per cell (MFI) were measured for CD4+CD25+, CD8+CD25+,and CD4+CD39+ populations
BVDV Induced Phenotypic Change

The Flow Cytometer
Flow Data Showing the Populations
Induction of Cells with a Classical Suppressor Phenotype by BVDV Exposure
0
5
10
15
20
25
30
35
40
45
50
�co
nt
�13
73 0
.3
�13
73 0
.5
�13
73 1
.0
�13
73 2
.0
�N
AD
L 0.
5
�N
AD
L 1.
0
�N
AD
L 2,
0
�N
Y-1
0.5
�N
Y-1
1.0
�N
Y-1
2.0
% C
25+
cells
BVDV strain and MOI
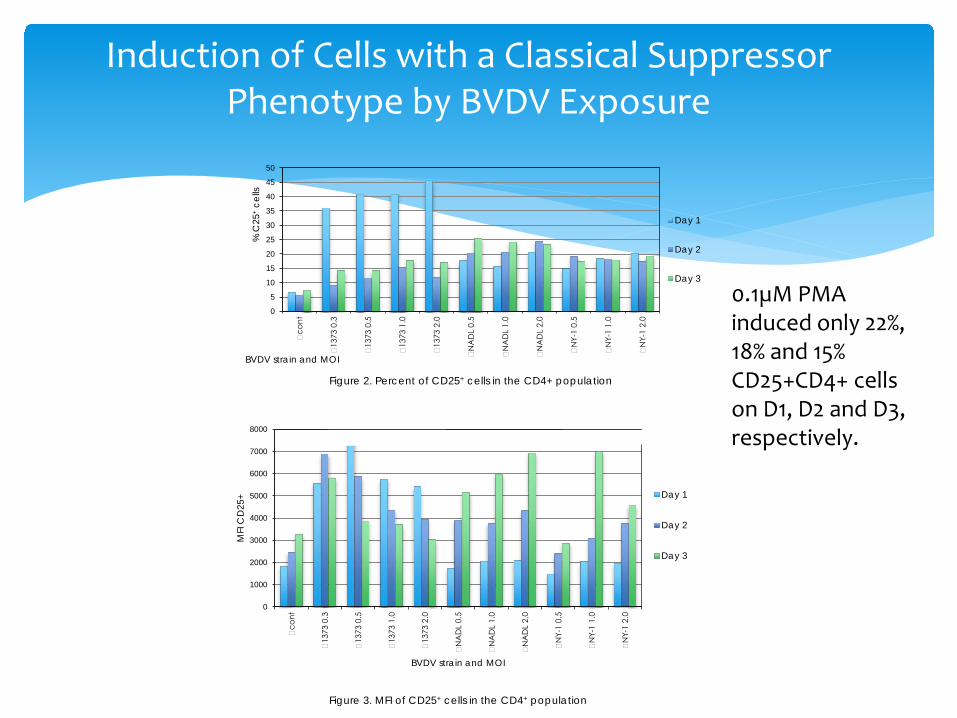
Figure 2. Percent of CD25+ cells in the CD4+ population
Day 1
Day 2
Day 3
0
1000
2000
3000
4000
5000
6000
7000
8000
�co
nt
�13
73 0
.3
�13
73 0
.5
�13
73 1
.0
�13
73 2
.0
�N
AD
L 0.
5
�N
AD
L 1.
0
�N
AD
L 2,
0
�N
Y-1
0.5
�N
Y-1
1.0
�N
Y-1
2.0
MFI
CD
25+
BVDV strain and MOI
Figure 3. MFI of CD25+ cells in the CD4+ population
Day 1
Day 2
Day 3
0.1µM PMA induced only 22%, 18% and 15% CD25+CD4+ cells on D1, D2 and D3, respectively.

CD39 expression
Induction of a CD39+ Phenotype by BVDV Exposure
0
5
10
15
20
25
30
35
�co
nt
�13
73 0
.3
�13
73 0
.5
�13
73 1
.0
�13
73 2
.0
�N
AD
L 0.
5
�N
AD
L 1.
0
�N
AD
L 2,
0
�N
Y-1
0.5
�N
Y-1
1.0
�N
Y-1
2.0
% C
D39
+ ce
lls
BVDV strain and MOI
Figure 4. Percent of CD39+ cells in the CD4+ population
Day 1
Day 2
Day 3
0
1000
2000
3000
4000
5000
6000
7000
8000
9000
�co
nt
�13
73 0
.3
�13
73 0
.5
�13
73 1
.0
�13
73 2
.0
�N
AD
L 0.
5
�N
AD
L 1.
0
�N
AD
L 2,
0
�N
Y-1
0.5
�N
Y-1
1.0
�N
Y-1
2.0
MFI
CD
39+
BVDV strain and MOI
Figure 5. MFI of CD39+ cells in the CD4+ population
Day 1
Day 2
Day 3
0.1µM PMA induced 35%, 41%, and 48% CD39+ CD4+ cells with an MFI of 6500-9000 on D1, D2, and D3, respectively. It appears that PMA induces adenosine mediated suppressor activity

∗ Demonstration of cell-mediated suppression of T and B cell function using superantigen (SEB) and mitogen (Con A –T cell only and PWM- B and T cells) after exposure to BVDV. The suppression was equivalent to or greater than that induced with PMA at 0.1µM
∗ Demonstration of the production of suppressor factors by mononuclear cells after exposure to BVDV.
∗ Demonstration that BVDV exposure induces a large increase in IL-10 (suppressive cytokine) from mononuclear cells.
∗ The more virulent the BVDV strain utilized, the stronger the effect.
In Vitro Immune Suppression Assessments So Far

∗ Consistent with the induction of classical Treg cells, CD4+CD25+ cells were induced by exposure to BVDV viruses.
∗ Consistent with adenosine active suppressor cells, CD4+CD39+ cells were induced by exposure to BVDV viruses and PMA.
∗ Phenotypic enhancement was greater with more virulent viruses
CD4 Phenotypic changes Induced by BVDV Virus

∗ Assessment of TGF-beta and IL-35 should be done for supernatants from BVDV exposed cells
∗ As gamma-delta cells have been demonstrated to be the primary Treg in cattle (and possibly all ruminants), isolated WC1+CD25+ cells should be assessed for suppressor activity. Also, CD4+CD25+ cells with Treg activity generally have FoxP3 intracellular expression in other species. This does not seem to be the case for cattle.
∗ Measuring the interaction with mononuclear cells from calves prior to BVDV vaccination should be compared to assure that this is a “native” response or a consequence of vaccination induced immune activity
What needs to be done yet with the in vitro model
∗ The most important direct interactions between BVDV and the host happen in the somatic tissues
∗ Tissue level interactions and responses are critical to the innate and adaptive immune responses to BVDV.
∗ Tissue level interactions are reflected in the circulating cells in blood
Direct Interaction with BVDV – What Must We Assume

An Example Tissue Level Environment

Tissue Level Damage Elements Enhance Danger

∗ The invader (BVDV) infects cells causing:∗ Damage (release of intracellular contents not normally
seen in the tissue spaces)∗ Danger signals (surface and non-structural proteins,
dsRNA, ssDNA, unmethylated DNA, unusual hairpins in the nucleic acid)
∗ Targets for the development of an immune response∗ These are reported to the organized lymphoid tissues
What Happens in the Tissues?

“Information” Flows to the Adaptive Factory from the Tissues
“Information” (primarily antigen, damage and danger signals) flow to the organized lymphoid tissues (such as lymph nodes
Clonal expansion is followed by effector differentiation and memory cell development
The organized lymphoid tissues are divided into B cell and T cell areas that are connected and after expansion the effector cells (and eventually the memory cells) move to the blood and lymph.
∗ The tissue has a large number of somatic cells (epithelial, muscle and endothelial) that interact with foreign invaders
∗ Leukocytes enter and reside in the tissues. Some leukocytes enter then leave to traffic in the lymphatic system
∗ All these cells respond to inputs and produce outputs that impact the level of damage, danger and target antigen in the tissue
Many Players Leading to Three Focused Messages (The Attractors)

Somatic Cells and Virus
Drive signals of Damage
Differentiate iDC
Changes in movement of cells, platelets and factors from circulation
Local cell gene expression and activation
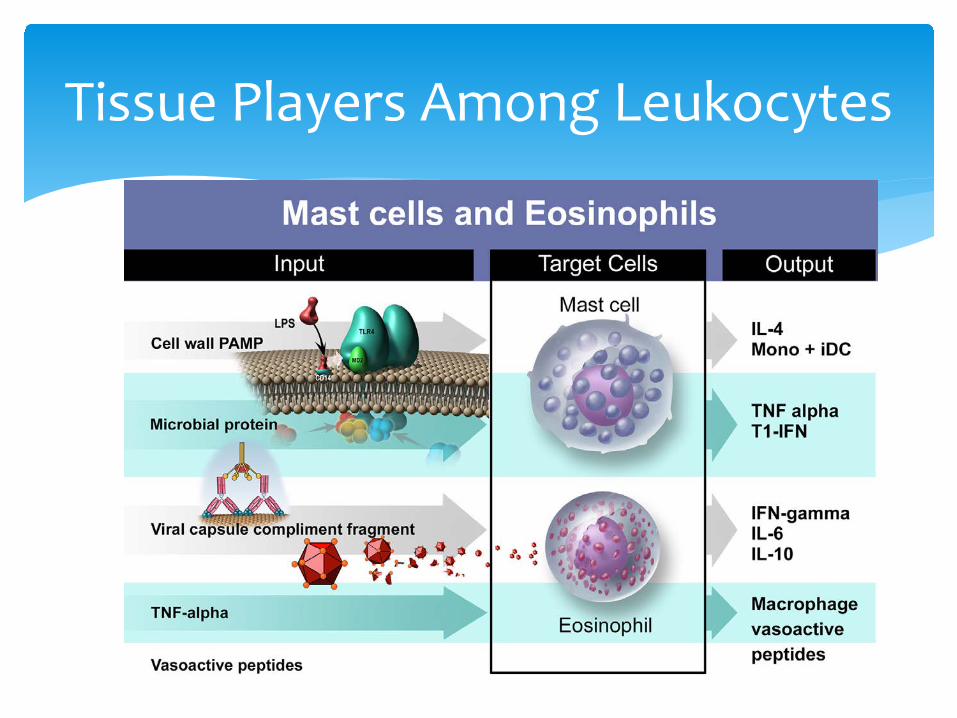
Tissue Players Among Leukocytes

Tissue Players Among Leukocytes
Recruit neutrophils and monocytes
Activate macrophage, DC and neutrophil activation
Arm local defenses kill invaders directly
Release target antigen and danger signals
Mediate damage

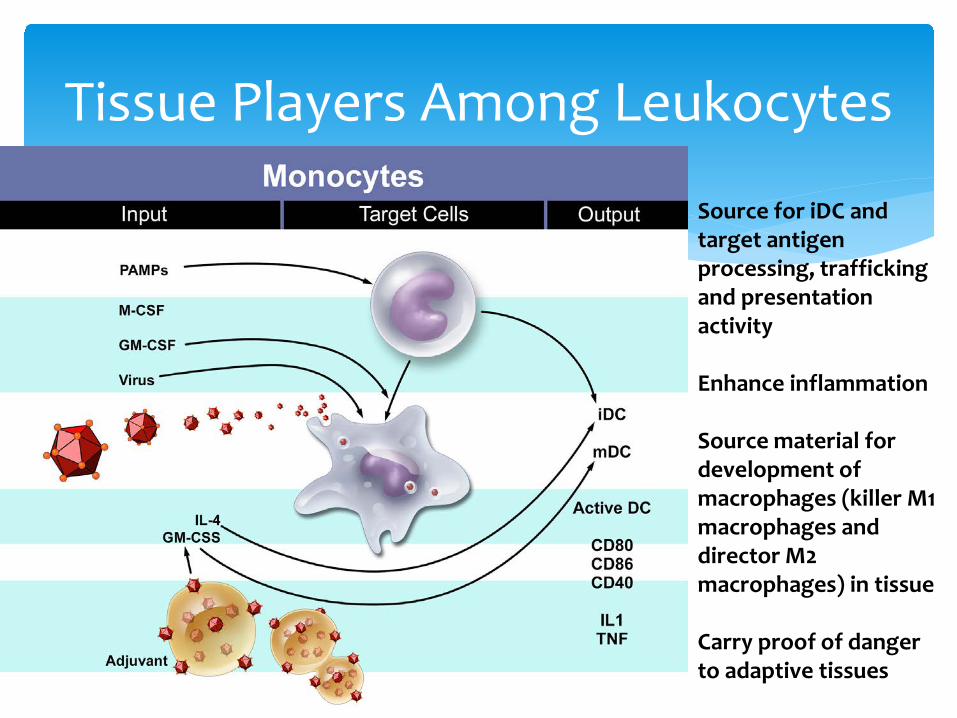
Tissue Players Among Leukocytes
Tissue Players Among Leukocytes
Source for iDC and target antigen processing, trafficking and presentation activity
Enhance inflammation
Source material for development of macrophages (killer M1 macrophages and director M2 macrophages) in tissue
Carry proof of danger to adaptive tissues
Tissue Players Among Leukocytes: Dendritic Cells
Monocyte derived dendritic cells developed in tissues

Dendritic Cell Interactions with Virus
Dendritic cells (iDCand their bone marrow derived cousins)
are the core signal (antigen and danger) carrier from tissues to
Adaptive Immune Factories (lymph nodes, spleen, and other lymphoid tissues)

Tissue Players:How this comes together in tissues

∗ Tissue pressure increases with activation in the tissues∗ DC traffic in the lymph carrying signals of danger and
target antigen, neutrophils bring whole antigen context (for B cells) and factors indicating damage also traffic.
∗ The composite of damage, danger and target antigen are the necessary and sufficient components to launch the order.
∗ What is made and delivered is dependent on the absolute and relative levels of each of these three.
Transition to the Adaptive Tissues-Making and Filling the Orders
∗ The tissue signals of damage, danger and target antigen control the activation and specific differentiation of adaptive cells.
∗ This process makes “tools” for use in activating, targeting, dampening, or effecting molecularly specific responses in the tissues when the outcome determining products traffic to those sites.
∗ The adaptive response is the servant of the tissues and the “products” from the immune factories return to the tissues with targeting to those showing damage and danger.
Adaptive Immune Tissue is a Factory Filling Orders for Use by Tissue
Environments

The T cell ResponseIn the organized lymphoid tissues, tissue DC, factors and other leukocytes interact with local DC to present antigen to T cells in the context of damage and danger
Low levels of damage, danger and antigen allows for initial clonal expansion
As the levels from tissues rise with time, effector cells are differentiated (DTH, killer cells), and if the balance changes (less danger and damage, but lots of antigen) memory is developed, or excessive damage Treg develop and traffic.

T and B cells Return to the Tissue

∗ BVDV infection initiated on the nasal/respiratory mucosal surface with epithelial and local macrophage infection
∗ Local activation of innate (macrophage, mast cell, neutrophil) cells and factors, activation of local gamma-delta T cells and NK cell, production of IL-17, IL-22, IL-12, IL-4, IL-6, IL-1beta, and TNF-alpha
∗ Recruitment of neutrophils and monocytes, differentiation of M1 macrophages, armed neutrophils and iDC
∗ Danger, damage and antigen sampled leading to initiation of a “factory order”
Dynamics of T Lymphocytes During an Acute BVDV Infection
∗ Initial stimulation in the context of damage, danger and target antigen leads to expansion of clones (fuel and raw materials)
∗ After 2-5 days, increased levels of all signals (as factors with the migrating DC) allow the expanded cells from clones to differentiate effector cells and make them return to the tissues
∗ After a period (6-20 days), excessive damage may occur, leading to differentiation of Treg cells to dampen the level of response and control tissue level killing
∗ Damage and danger may drop off (30-60 days), but target antigen may remain high from tissue leading to memory cell development. Memory cells form two pools, local to lymphoid tissue and circulating in blood and tissues. [Our trial ended before this window]
In the Organized Lymphoid Tissues
∗ To this point, we are discussing an in vitro model of the interactions between BVDV viruses and the host immune system
∗ We have focused on lymphocytes and their interaction leading to induction of suppressor functional activity, release of suppressor products (shown a supernatant mediated suppression of proliferation and release of IL-10), and the induction of suppressor phenotypes (CD4-25 and CD4-39) on cells.
∗ NOW- we will go to the circulating cells in infected calves and ask---
A Second Experimental Approach

∗ 1) What changes in T cell phenotype do we see in the circulation of infected calves?
∗ 2) Are the novel phenotypic populations consistent with the induction of the suppressor function we observed in vitro?
∗ 3) Can we map the dynamic changes in immune activation and cell phenotype relative to the acute infection? (Do blood T cells give us a window into the output of the factories at the mucosal and systemic level?)
The Second Approach
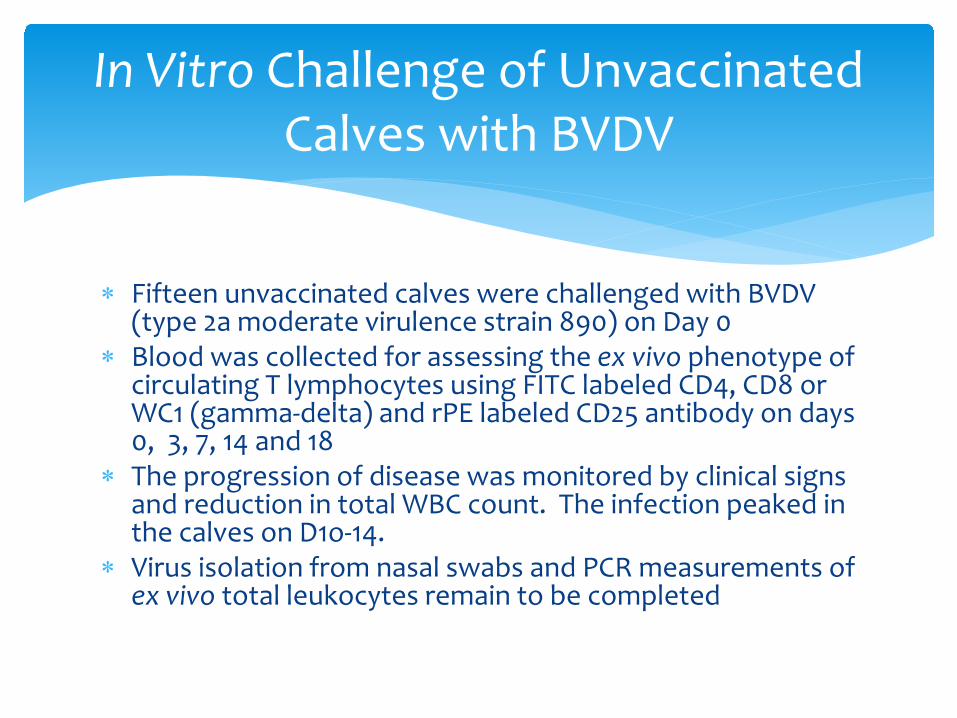
∗ Fifteen unvaccinated calves were challenged with BVDV (type 2a moderate virulence strain 890) on Day 0
∗ Blood was collected for assessing the ex vivo phenotype of circulating T lymphocytes using FITC labeled CD4, CD8 or WC1 (gamma-delta) and rPE labeled CD25 antibody on days 0, 3, 7, 14 and 18
∗ The progression of disease was monitored by clinical signs and reduction in total WBC count. The infection peaked in the calves on D1o-14.
∗ Virus isolation from nasal swabs and PCR measurements of ex vivo total leukocytes remain to be completed
In Vitro Challenge of Unvaccinated Calves with BVDV

∗ ADC blood was collected and a buffy coat generated∗ Red blood cells were removed by Tris-ammonium
chloride lysis∗ Total leukocytes were adjusted to 3x10⁶ viable cells
per ml, 100µl of cells were used for staining with the antibodies at pre-optimized concentrations
∗ The cells were stained for 1h at 4ºC∗ The unbound antibody wash removed with 4
washings∗ After the last wash, the cells were fixed in 4%
formaldehyde. The fixed cells were analyzed on a flow cytometer
Ex Vivo Phenotypic Analysis

Course of Infection in Unvaccinated Calves
02468
101214161820
0 5 10 15 20
Combined
Score
Day after Infection
Evidence of Disease
Disease score

Typical Staining Patterns for CD4-25, CD8-25 and WC1-25 and CD4, CD8,
WC1, and CD25 populations
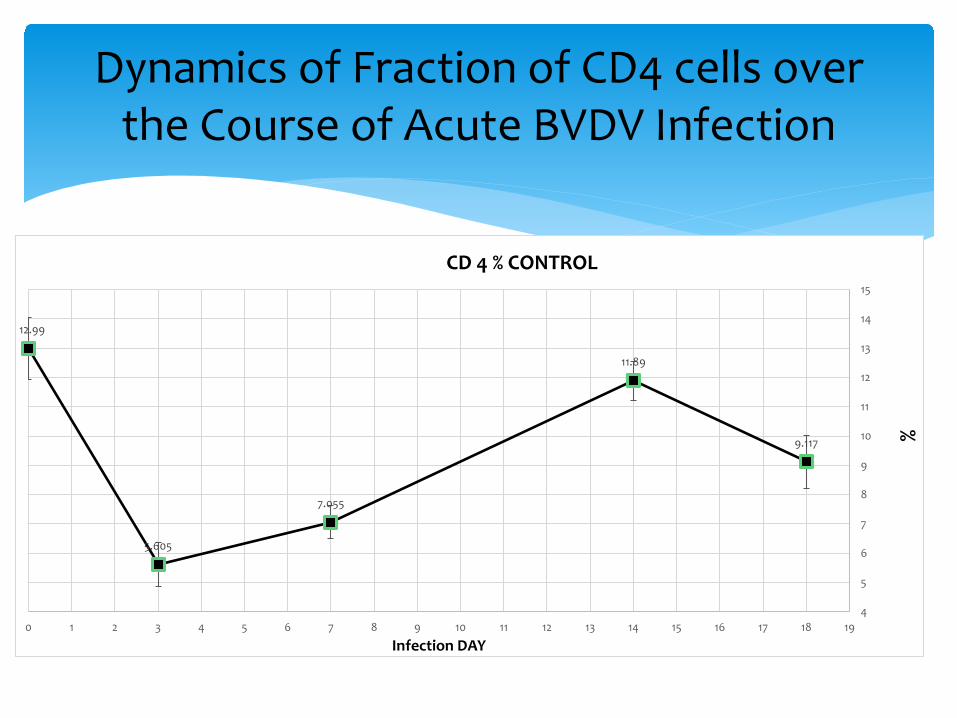
Dynamics of Fraction of CD4 cells over the Course of Acute BVDV Infection
12.99
5.605
7.055
11.89
9.117
4
5
6
7
8
9
10
11
12
13
14
15
0 1 2 3 4 5 6 7 8 9 10 11 12 13 14 15 16 17 18 19
%
Infection DAY
CD 4 % CONTROL

Dynamics of MFI of CD4 cells over the Course of Acute BVDV Infection
8150.35
6175.2
6541.09
7504.37 7515.17
6000
6500
7000
7500
8000
8500
9000
0 1 2 3 4 5 6 7 8 9 10 11 12 13 14 15 16 17 18 19
MFI
VA
LUES
Infection DAY
CD 4 MFI CONTROL
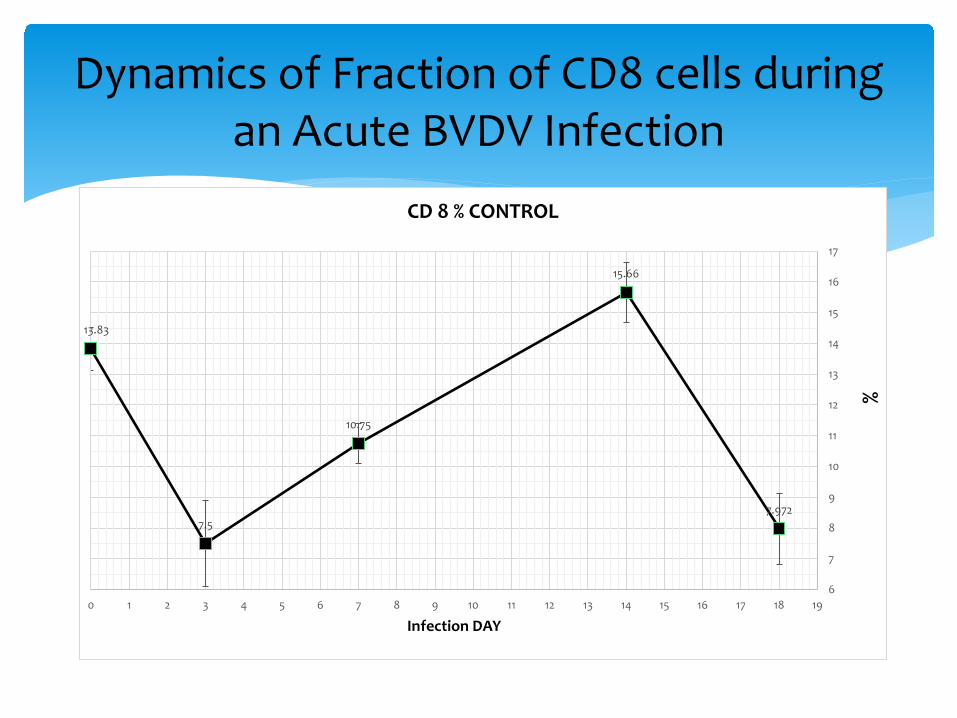
Dynamics of Fraction of CD8 cells during an Acute BVDV Infection
13.83
7.5
10.75
15.66
7.972
6
7
8
9
10
11
12
13
14
15
16
17
0 1 2 3 4 5 6 7 8 9 10 11 12 13 14 15 16 17 18 19
%
Infection DAY
CD 8 % CONTROL
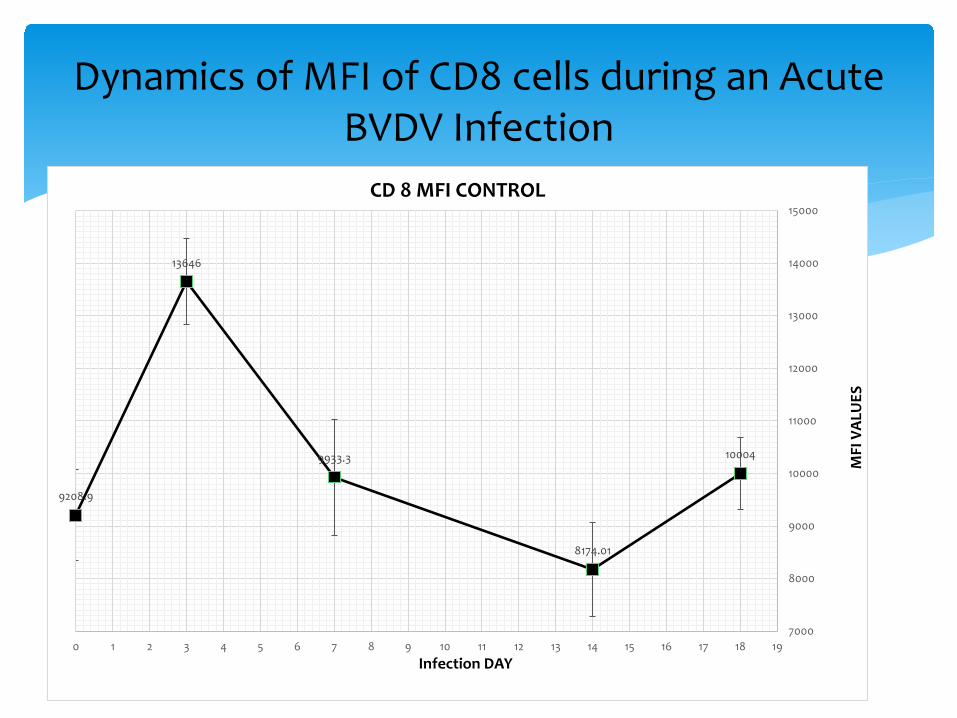
Dynamics of MFI of CD8 cells during an Acute BVDV Infection
9208.9
13646
9933.3
8174.01
10004
7000
8000
9000
10000
11000
12000
13000
14000
15000
0 1 2 3 4 5 6 7 8 9 10 11 12 13 14 15 16 17 18 19
MFI
VA
LUES
Infection DAY
CD 8 MFI CONTROL

Dynamics of Fraction of WC1cells during an Acute BVDV Infection
20.01 19.85
35.09
31.01
36.76
15
17
19
21
23
25
27
29
31
33
35
37
39
41
0 1 2 3 4 5 6 7 8 9 10 11 12 13 14 15 16 17 18 19
%
INFECTION DAY
WC 1 % CONTROL

Dynamics of MFI of WC1cells during an Acute BVDV Infection
27544
2342323143
29725
28506
21000
22000
23000
24000
25000
26000
27000
28000
29000
30000
31000
0 1 2 3 4 5 6 7 8 9 10 11 12 13 14 15 16 17 18 19
MFI
VA
LUES
INFECTION DAY
WC1 MFI CONTROL
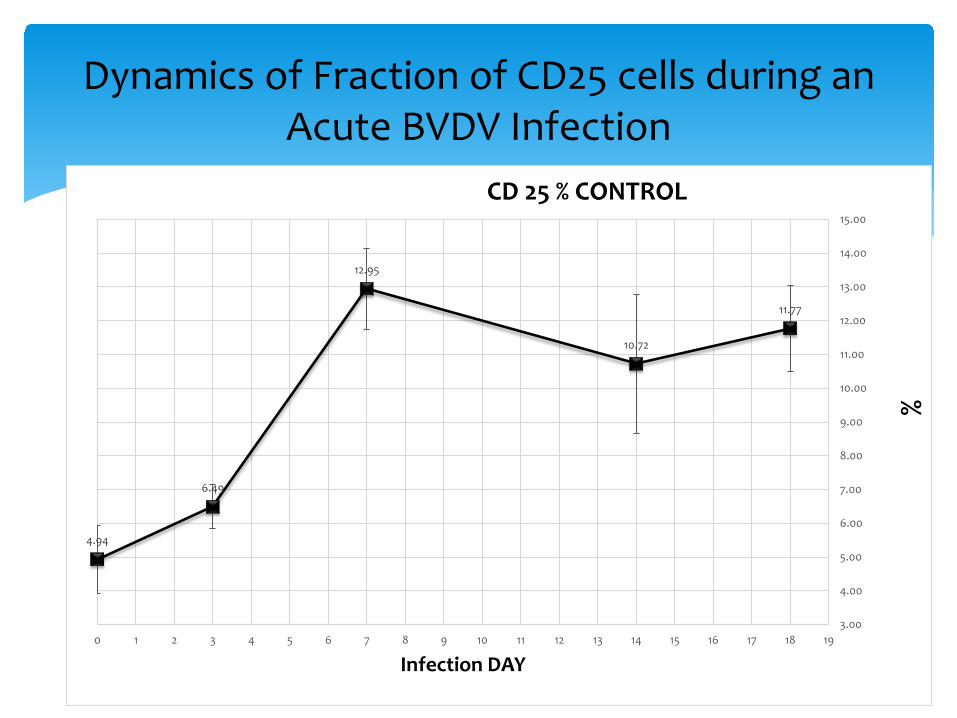
Dynamics of Fraction of CD25 cells during an Acute BVDV Infection
4.94
6.49
12.95
10.72
11.77
3.00
4.00
5.00
6.00
7.00
8.00
9.00
10.00
11.00
12.00
13.00
14.00
15.00
0 1 2 3 4 5 6 7 8 9 10 11 12 13 14 15 16 17 18 19
%
Infection DAY
CD 25 % CONTROL

Dynamics of MFI of CD25 cells during an Acute BVDV Infection
768.31
2379.51
1730.26
1274.04
784.94
0 1 2 3 4 5 6 7 8 9 10 11 12 13 14 15 16 17 18 19
MFI
VA
LUES
Infection DAY
CD 25 MFI CONTROL
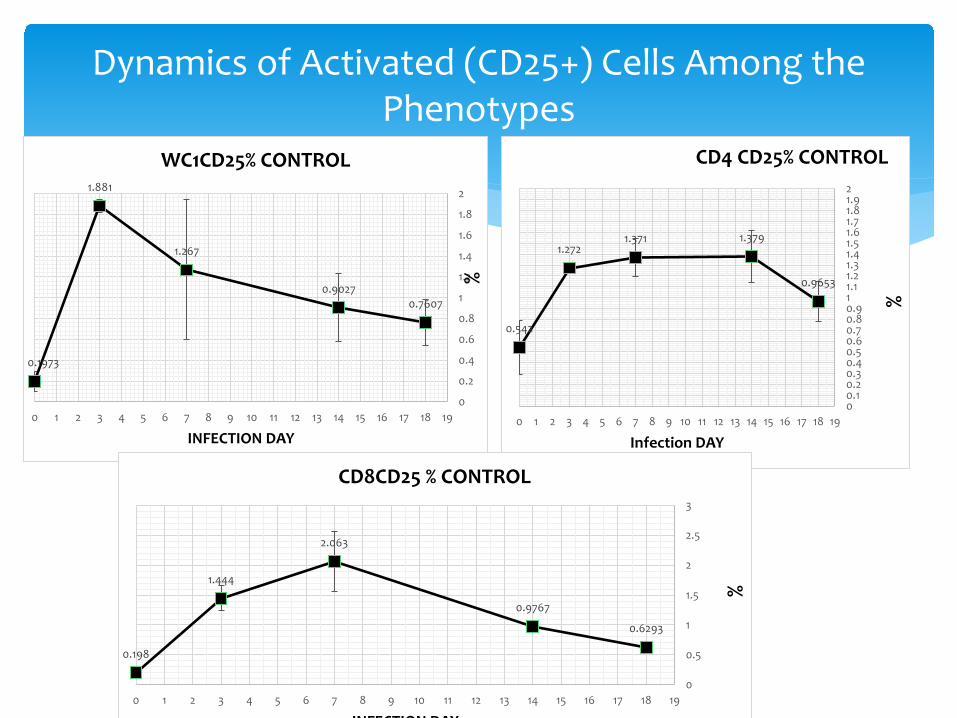
Dynamics of Activated (CD25+) Cells Among the Phenotypes
0.1973
1.881
1.267
0.90270.7607
0
0.2
0.4
0.6
0.8
1
1.2
1.4
1.6
1.8
2
0 1 2 3 4 5 6 7 8 9 10 11 12 13 14 15 16 17 18 19
%INFECTION DAY
WC1CD25% CONTROL
0.542
1.2721.371 1.379
0.9653
00.10.20.30.40.50.60.70.80.911.11.21.31.41.51.61.71.81.92
0 1 2 3 4 5 6 7 8 9 10 11 12 13 14 15 16 17 18 19
%
Infection DAY
CD4 CD25% CONTROL
0.198
1.444
2.063
0.9767
0.6293
0
0.5
1
1.5
2
2.5
3
0 1 2 3 4 5 6 7 8 9 10 11 12 13 14 15 16 17 18 19
% INFECTION DAY
CD8CD25 % CONTROL

∗ WC1 (gamma-delta T cells) were activated in the mucosal tissues. They activated local responses, proliferated and were armed. They began circulating with a rapid display of activation antigen (CD25) on their surface.
∗ Once the message of danger, damage and BVDV antigen reached the organized lymphoid tissue, CD4 cells became activated, proliferated, armed and began to circulate. CD4 cells were recruited to the secondary lymphoid tissues (the decline), then activated cells circulate looking for trouble
∗ CD8 cells moved to secondary lymphoid tissues, followed CD4 cells in proliferation and activation, then activated CD8 cells circulate.
∗ All looking to bring “tools” to fight in the tissues
What Happened?

∗ Tissue level interaction of BVDV with cells of the host provide the damage and danger context.
∗ Damage and danger lead to sampling of “antigen” in the tissue and trafficking of these to the “factories”
∗ The instructions to the factory change with time and the progress of the infection changing the nature of the products on a democratic basis from the tissue microenvironments.
∗ The matured products leave the factory and seek sites for crossing the endothelial barrier indicating damage and danger below
What does this mean about the cascade of immune events in acute
BVDV infection?

This Leads to More Damage and Suppressor Cell Activity in Response
Return to the tissues of antibody, activated T cells and infiltrating PMN and monocytes adds to tissue damage calling for differentiation of Tregactivity in organized lymphoid tissues. Gamma-delta and CD4 Treg cells are induced.This is supported by the in vitro and ex vivo measurements in these studies

∗ BVDV infection generates changes in the circulating lymphocytes of calves.
∗ These changes included an indication of the dynamics of lymphocyte activation in the calf relative to the progress of the disease.
∗ Monitoring the lymphocyte phenotypes (both those from this pilot study and pan-B cell, pan-T cell, CD39+ cells, and memory cell markers) may be useful in understanding the immune pathogenesis of BVDV infection, including generating evidence of damage mediated induction of T lymphocyte suppressor cells.
Take Home Message