Embed Size (px)
Citation preview
Fishtrap Creek Water Quality Monitoring Summary
1
Appendix A to City of Lynden’s 2015 Annual Report
Fishtrap Creek Water Quality Violation -- S4.F.3 Report
Background
The City of Lynden was notified by Whatcom County of water quality standard violations for fecal
coliform in Fishtrap Creek, Waters of the State. Following the S4.F protocol outlined in the NPDES Phase
II stormwater permit, the City drafted this memorandum to document the effort to identify potential
sources of fecal coliform reaching the mainstem of Fishtrap Creek and report the combined sampling
results of 3 entities.
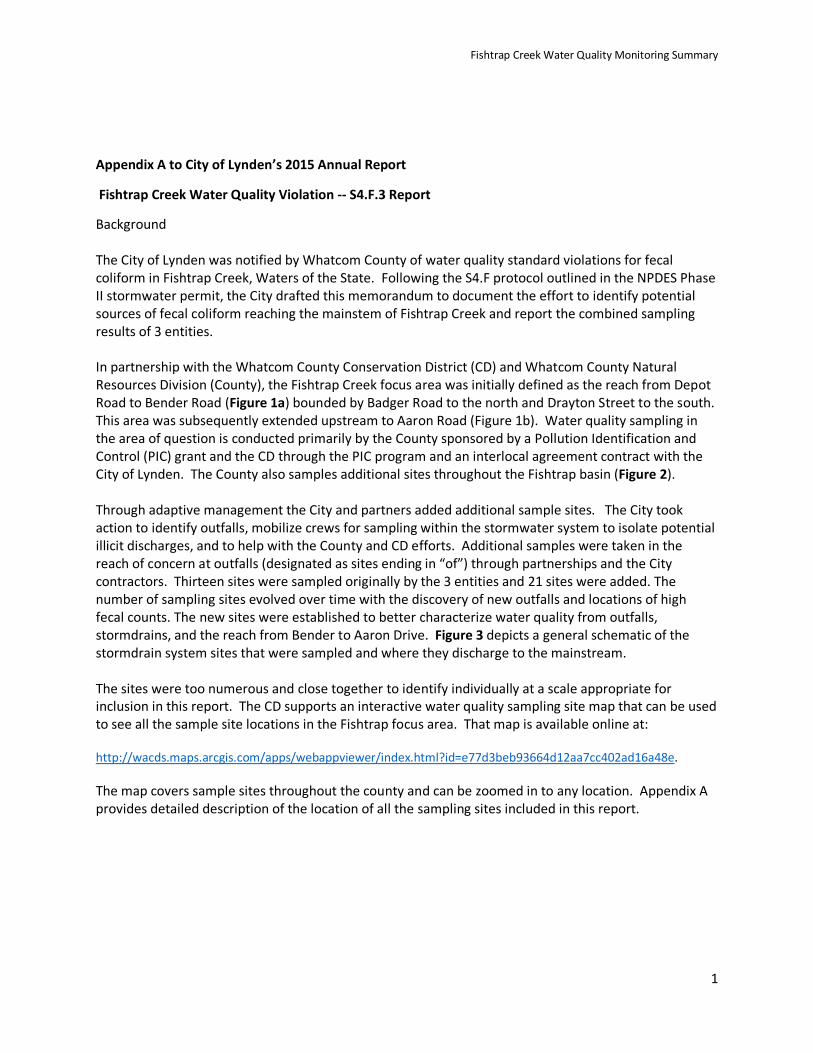
In partnership with the Whatcom County Conservation District (CD) and Whatcom County Natural
Resources Division (County), the Fishtrap Creek focus area was initially defined as the reach from Depot
Road to Bender Road (Figure 1a) bounded by Badger Road to the north and Drayton Street to the south.
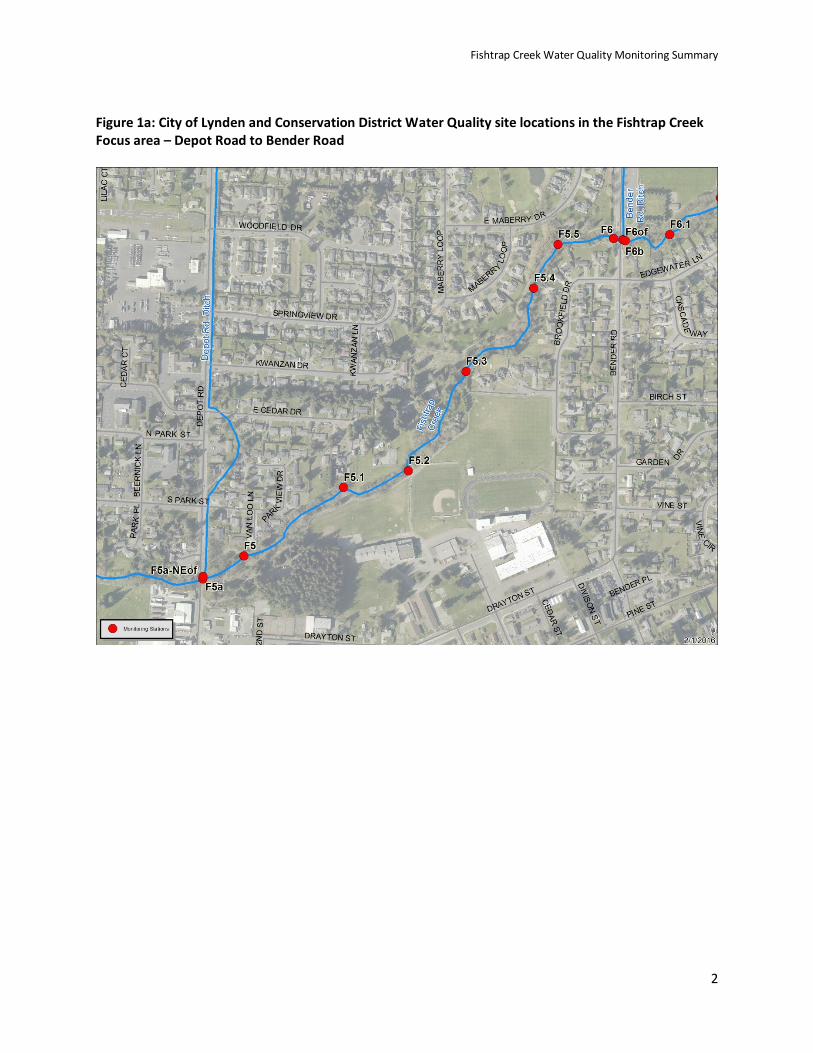
This area was subsequently extended upstream to Aaron Road (Figure 1b). Water quality sampling in
the area of question is conducted primarily by the County sponsored by a Pollution Identification and
Control (PIC) grant and the CD through the PIC program and an interlocal agreement contract with the
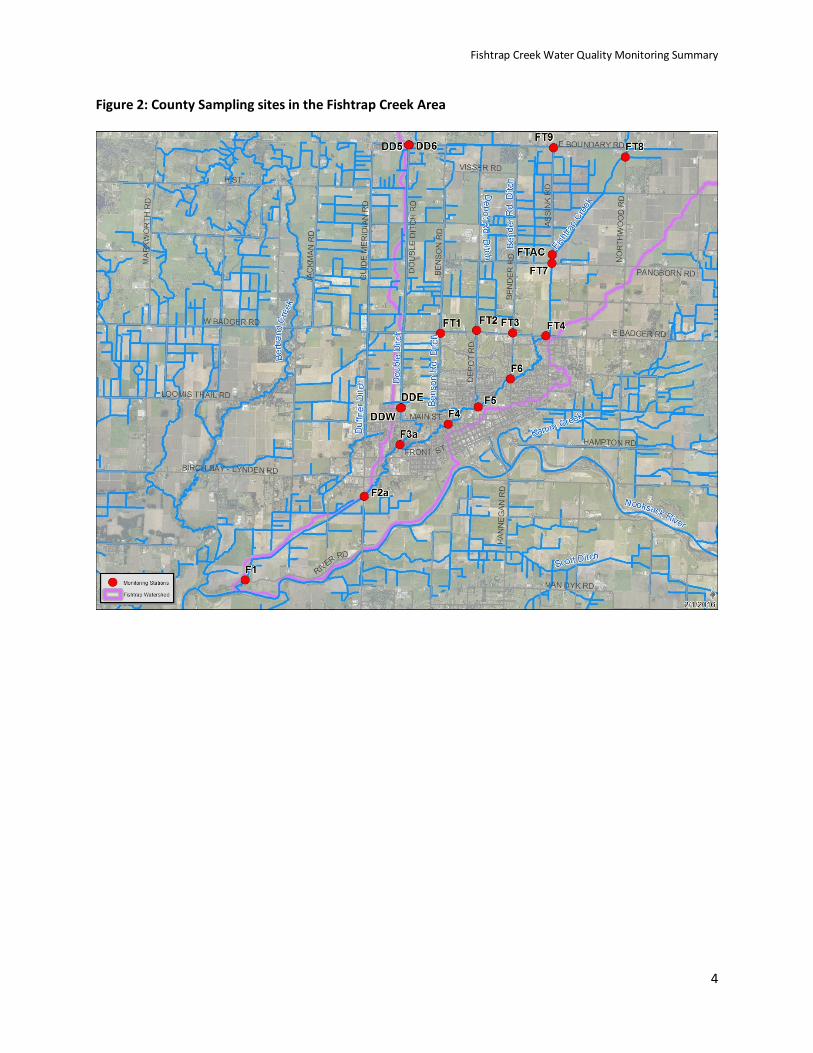
City of Lynden. The County also samples additional sites throughout the Fishtrap basin (Figure 2).
Through adaptive management the City and partners added additional sample sites. The City took
action to identify outfalls, mobilize crews for sampling within the stormwater system to isolate potential
illicit discharges, and to help with the County and CD efforts. Additional samples were taken in the
reach of concern at outfalls (designated as sites ending in “of”) through partnerships and the City
contractors. Thirteen sites were sampled originally by the 3 entities and 21 sites were added. The
number of sampling sites evolved over time with the discovery of new outfalls and locations of high
fecal counts. The new sites were established to better characterize water quality from outfalls,
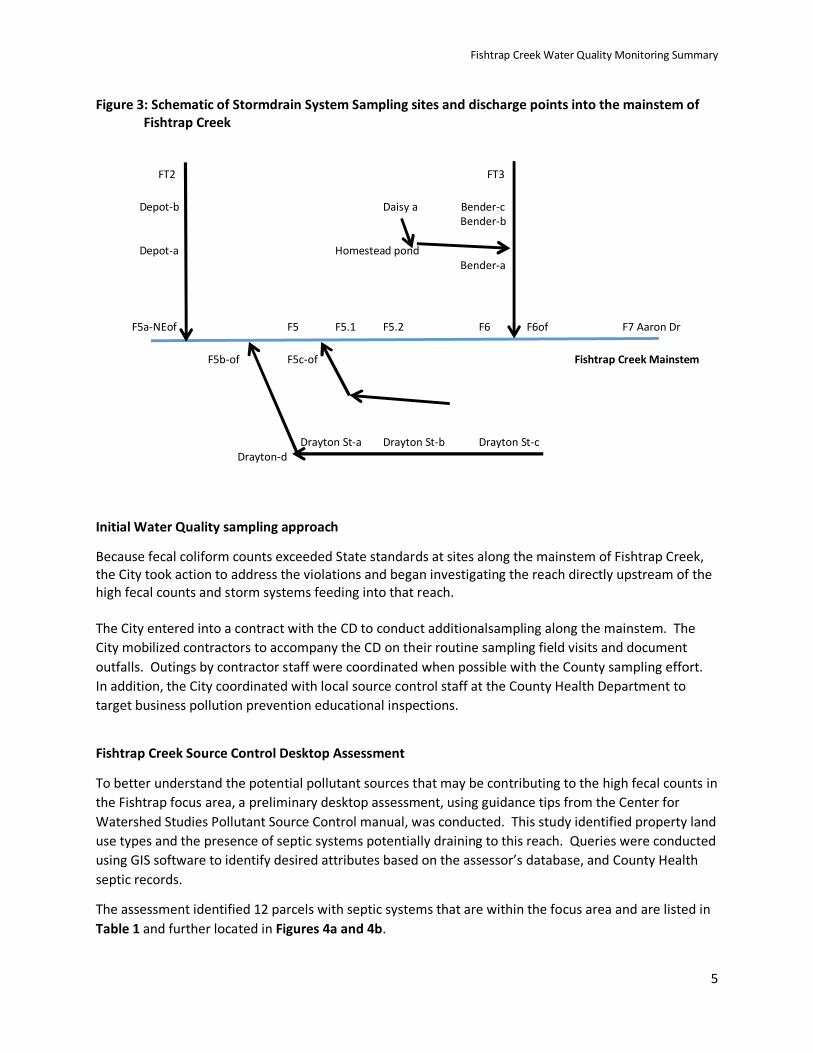
stormdrains, and the reach from Bender to Aaron Drive. Figure 3 depicts a general schematic of the
stormdrain system sites that were sampled and where they discharge to the mainstream.
The sites were too numerous and close together to identify individually at a scale appropriate for
inclusion in this report. The CD supports an interactive water quality sampling site map that can be used
to see all the sample site locations in the Fishtrap focus area. That map is available online at:
http://wacds.maps.arcgis.com/apps/webappviewer/index.html?id=e77d3beb93664d12aa7cc402ad16a48e.
The map covers sample sites throughout the county and can be zoomed in to any location. Appendix A
provides detailed description of the location of all the sampling sites included in this report.
Fishtrap Creek Water Quality Monitoring Summary
2
Figure 1a: City of Lynden and Conservation District Water Quality site locations in the Fishtrap Creek
Focus area – Depot Road to Bender Road
Fishtrap Creek Water Quality Monitoring Summary
3
Figure1b: City of Lynden and Conservation District Water Quality site locations in the Fishtrap Creek
Focus area -- Bender Road to Aaron Road
Fishtrap Creek Water Quality Monitoring Summary
4
Figure 2: County Sampling sites in the Fishtrap Creek Area
Fishtrap Creek Water Quality Monitoring Summary
5
Figure 3: Schematic of Stormdrain System Sampling sites and discharge points into the mainstem of
Fishtrap Creek
FT2 FT3
Depot-b Daisy a Bender-c
Bender-b
Depot-a Homestead pond
Bender-a
F5a-NEof F5 F5.1 F5.2 F6 F6of F7 Aaron Dr
F5b-of F5c-of Fishtrap Creek Mainstem
Drayton St-a Drayton St-b Drayton St-c
Drayton-d
Initial Water Quality sampling approach
Because fecal coliform counts exceeded State standards at sites along the mainstem of Fishtrap Creek,
the City took action to address the violations and began investigating the reach directly upstream of the
high fecal counts and storm systems feeding into that reach.
The City entered into a contract with the CD to conduct additionalsampling along the mainstem. The
City mobilized contractors to accompany the CD on their routine sampling field visits and document
outfalls. Outings by contractor staff were coordinated when possible with the County sampling effort.
In addition, the City coordinated with local source control staff at the County Health Department to
target business pollution prevention educational inspections.
Fishtrap Creek Source Control Desktop Assessment
To better understand the potential pollutant sources that may be contributing to the high fecal counts in
the Fishtrap focus area, a preliminary desktop assessment, using guidance tips from the Center for
Watershed Studies Pollutant Source Control manual, was conducted. This study identified property land
use types and the presence of septic systems potentially draining to this reach. Queries were conducted
using GIS software to identify desired attributes based on the assessor’s database, and County Health
septic records.
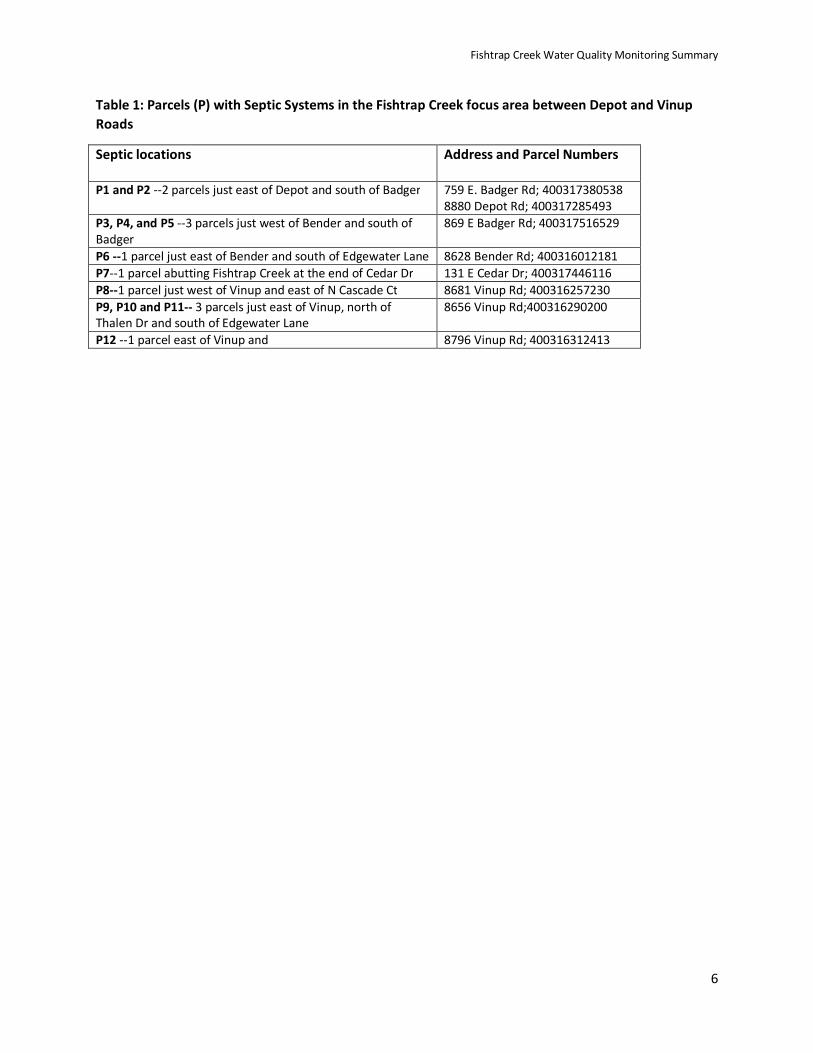
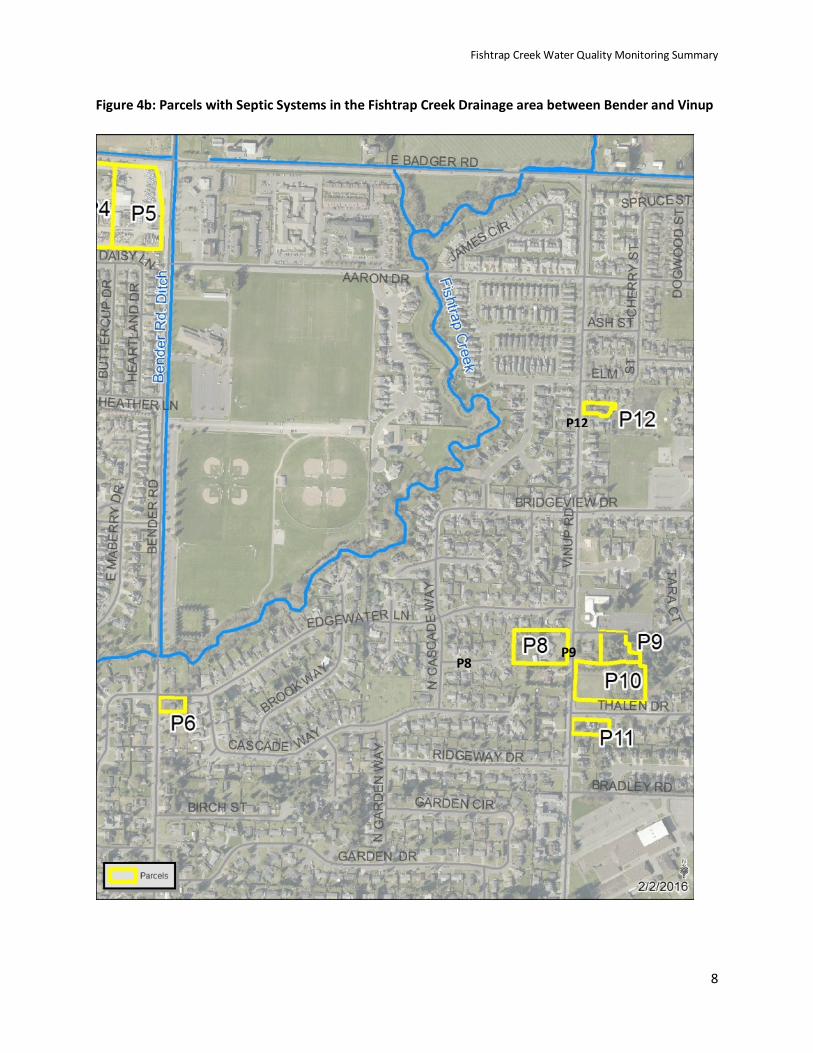
The assessment identified 12 parcels with septic systems that are within the focus area and are listed in
Table 1 and further located in Figures 4a and 4b.
Fishtrap Creek Water Quality Monitoring Summary
6
Table 1: Parcels (P) with Septic Systems in the Fishtrap Creek focus area between Depot and Vinup
Roads
Septic locations
Address and Parcel Numbers
P1 and P2 --2 parcels just east of Depot and south of Badger 759 E. Badger Rd; 400317380538
8880 Depot Rd; 400317285493
P3, P4, and P5 --3 parcels just west of Bender and south of
Badger
869 E Badger Rd; 400317516529
P6 --1 parcel just east of Bender and south of Edgewater Lane 8628 Bender Rd; 400316012181
P7--1 parcel abutting Fishtrap Creek at the end of Cedar Dr 131 E Cedar Dr; 400317446116
P8--1 parcel just west of Vinup and east of N Cascade Ct 8681 Vinup Rd; 400316257230
P9, P10 and P11-- 3 parcels just east of Vinup, north of
Thalen Dr and south of Edgewater Lane
8656 Vinup Rd;400316290200
P12 --1 parcel east of Vinup and 8796 Vinup Rd; 400316312413
Fishtrap Creek Water Quality Monitoring Summary
7
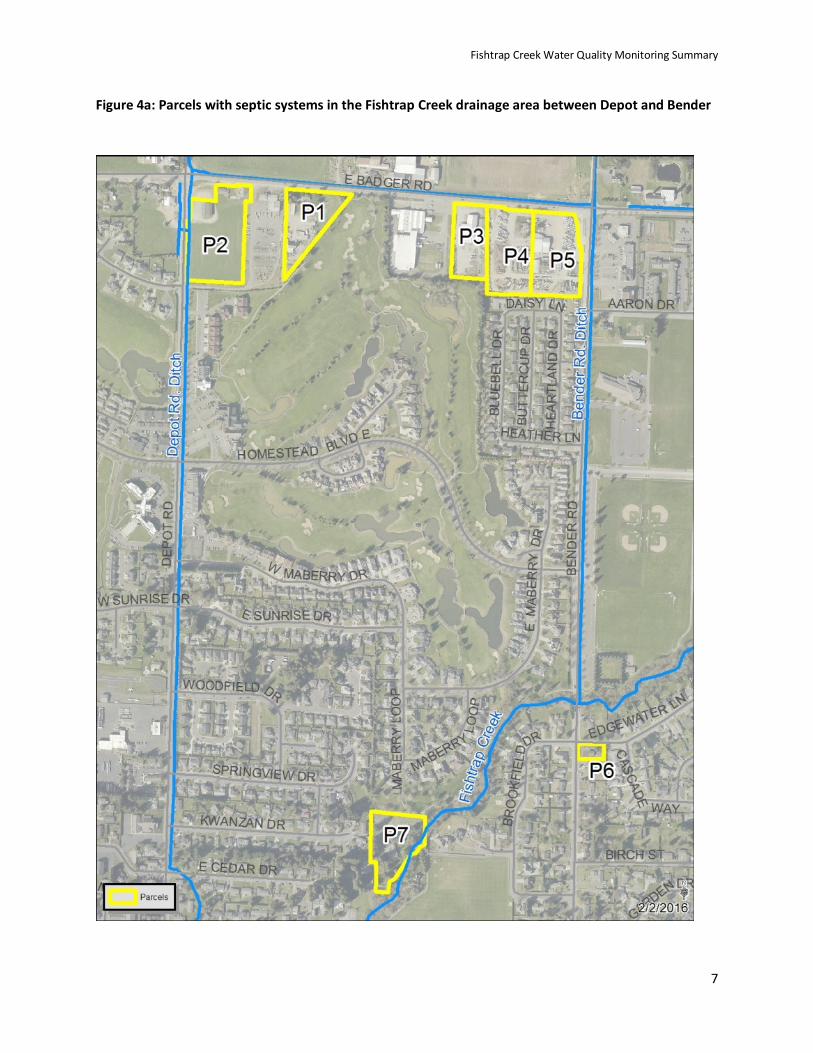
Figure 4a: Parcels with septic systems in the Fishtrap Creek drainage area between Depot and Bender
Fishtrap Creek Water Quality Monitoring Summary
8
Figure 4b: Parcels with Septic Systems in the Fishtrap Creek Drainage area between Bender and Vinup
P8 P9
P12
Fishtrap Creek Water Quality Monitoring Summary
9
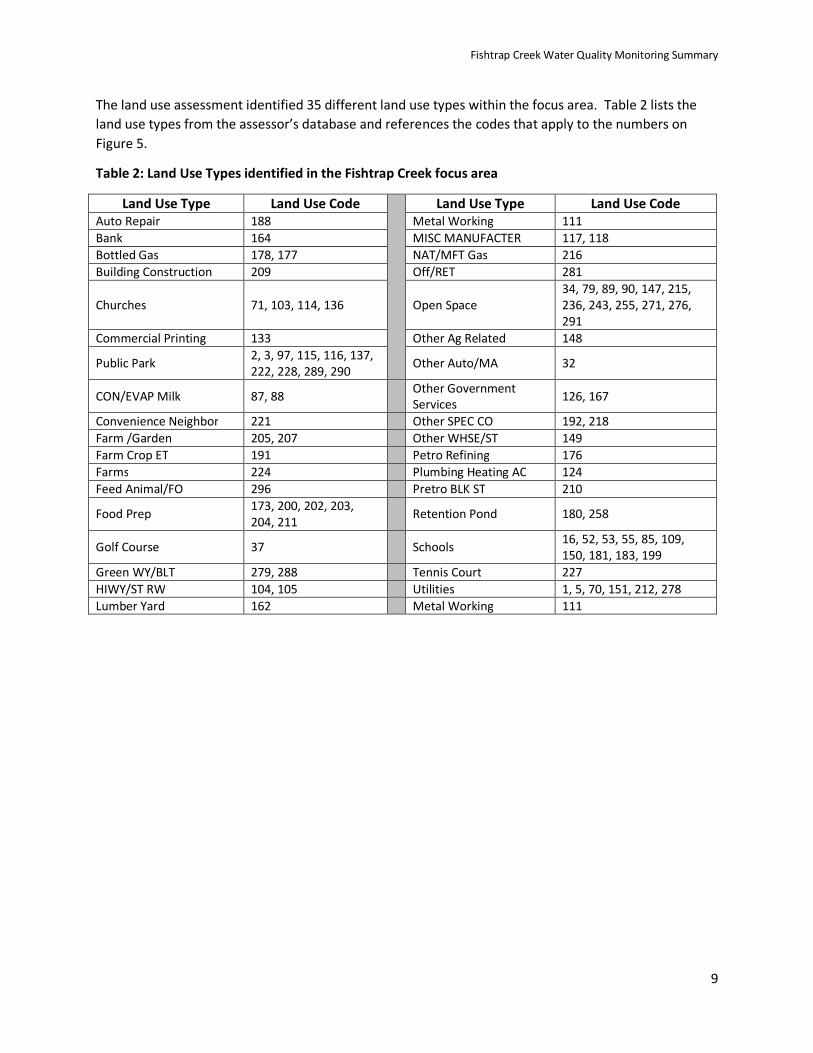
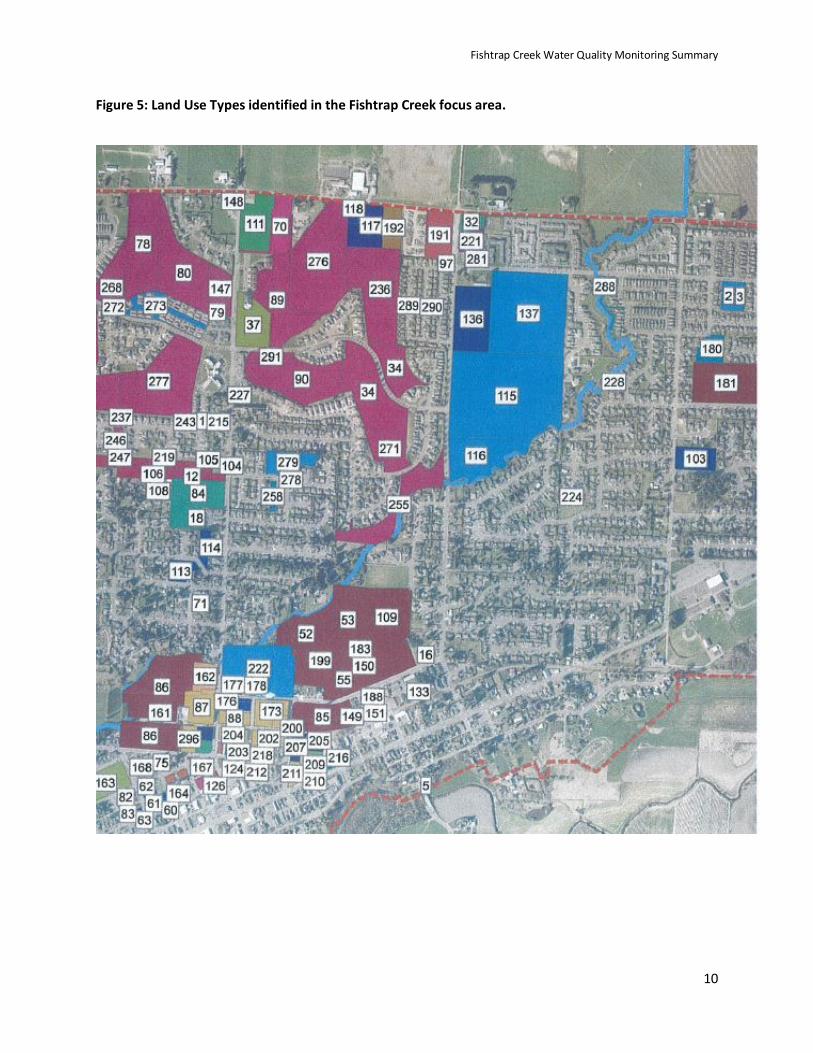
The land use assessment identified 35 different land use types within the focus area. Table 2 lists the
land use types from the assessor’s database and references the codes that apply to the numbers on
Figure 5.
Table 2: Land Use Types identified in the Fishtrap Creek focus area
Land Use Type Land Use Code
Land Use Type Land Use Code
Auto Repair 188 Metal Working 111
Bank 164 MISC MANUFACTER 117, 118
Bottled Gas 178, 177 NAT/MFT Gas 216
Building Construction 209 Off/RET 281
Churches 71, 103, 114, 136 Open Space
34, 79, 89, 90, 147, 215,
236, 243, 255, 271, 276,
291
Commercial Printing 133 Other Ag Related 148
Public Park 2, 3, 97, 115, 116, 137,
222, 228, 289, 290 Other Auto/MA 32
CON/EVAP Milk 87, 88 Other Government
Services 126, 167
Convenience Neighbor 221 Other SPEC CO 192, 218
Farm /Garden 205, 207 Other WHSE/ST 149
Farm Crop ET 191 Petro Refining 176
Farms 224 Plumbing Heating AC 124
Feed Animal/FO 296 Pretro BLK ST 210
Food Prep 173, 200, 202, 203,
204, 211
Retention Pond 180, 258
Golf Course 37
Schools 16, 52, 53, 55, 85, 109,
150, 181, 183, 199
Green WY/BLT 279, 288 Tennis Court 227
HIWY/ST RW 104, 105 Utilities 1, 5, 70, 151, 212, 278
Lumber Yard 162 Metal Working 111
Fishtrap Creek Water Quality Monitoring Summary
10
Figure 5: Land Use Types identified in the Fishtrap Creek focus area.
Fishtrap Creek Water Quality Monitoring Summary
11
Adaptive Management of Water Quality Sampling Program
Based on the additional sampling and the results of the desktop source study, an augmented sampling
regime was adopted. Approximately 21 mainstem sites and additional outfall sites were added. Storm
system monitoring was also expanded and ammonia was added as a parameter at some of the storm
system sites.
The presence of ammonia in stormwater samples can be an indicator of the presence of sanitary sewage
however there are other potential sources. Below is a listing of possible point sources of ammonia
(available online: http://www.water-research.net/index.php/ammonia-in-groundwater-runoff-and-
streams).
• Agricultural: The primary agricultural sources include accidental releases of ammonia-rich
fertilizer during transport (because of vehicle accident, faulty hose connections, and human
error); and livestock waste (from barnyards, feedlots, pastures, and rangeland).
• Residential and Urban: Household use of ammonia-containing cleaning products, on-lot septic
systems, and improper disposal of ammonia products may contribute to nonpoint pollution.
• Point sources: The following industrial processes produce ammonia emissions and effluent:
conversion of coal to coke in coke plants, metallurgic operations, ceramic production, strip
mining, chemical synthesis (nitric acid, synthetic monomers, and plastics), waste gas treatment,
sewage treatment plants, production of ammonium nitrate explosive, refrigeration equipment,
household cleaners, oil refineries, and food processing.
Elevated levels of bacteria in the focus area have been common but not consistent. The sample results
vary across sites and time with no identifiable pattern. There is little elevation change within the City of
Lynden’s jurisdiction. This often leads to stagnant water or dry storm drain facilities. No flow or little
flow made sampling difficult at times and frequently a sample was not attainable.
The City street crews adjusted their catchbasin cleaning circuit to prioritize vactoring out the stormwater
facilities feeding into this reach. These catchbasins and storm mains had yet to reach the normal
cleaning threshold and most only had a few inches of sediment. Proactively cleaning the catchbasins
was hoped to reduce the “first flush” effect transporting pollutants into the downstream receiving
waters. The City intends to adapt the storm system cleaning schedule where practical to give priority for
cleaning areas that drain to sampling sites that have repeated high fecal counts.
Discussion of Water Quality Sampling Results
The effort to identify sources of bacteria discharging either directly or through the stormdrain system to
Fishtrap Creek was inconclusive. While most samples exceeded the water quality standard, the
concentrations were highly variable throughout the reach and over time. A longer duration sample pool
may offer more insight into the impact of seasonality on sample variability. Sporadic high fecal counts
occurred but often were followed by low counts. This would seem to indicate that there may not be
cross-connections as the high values would be more persistent if a permanent connection existed. On
the other hand, the time of sampling may not coincide with high usage from nearby residences. The
sporadic high counts could be related to a number of causes including but not limited to:
Fishtrap Creek Water Quality Monitoring Summary
12
• re-suspension into the water column of fecal loads stored in the sediments in Fishtrap Creek,
• temperature fluctuations and ultra-violet input,
• pet and bird waste deposited prior to storm events,
• septic system failure or leakage following high precipitation inputs,
• antecedent conditions, water table level or,
• intermittent or one time illicit discharge.
At this point, there is not enough data from which to develop geomeans for fecal coliform at each site.
The fact that obtaining samples from outfalls and the storm system is often difficult due to stagnant
water or dry conditions will continue to be a challenge in looking at trends. The detailed results of the
fecal coliform sampling from late August through mid-November 2015, by date and site in the focus
area, can be found in Appendix B. A summary of the findings is presented below. Three paths were
investigated:
• Understanding the upstream to downstream variance in fecal coliform counts for each sampling
event,
• Understanding site stormdrain line patterns over time, and
• Looking at changes in inputs network-wide over time and as related to precipitation.
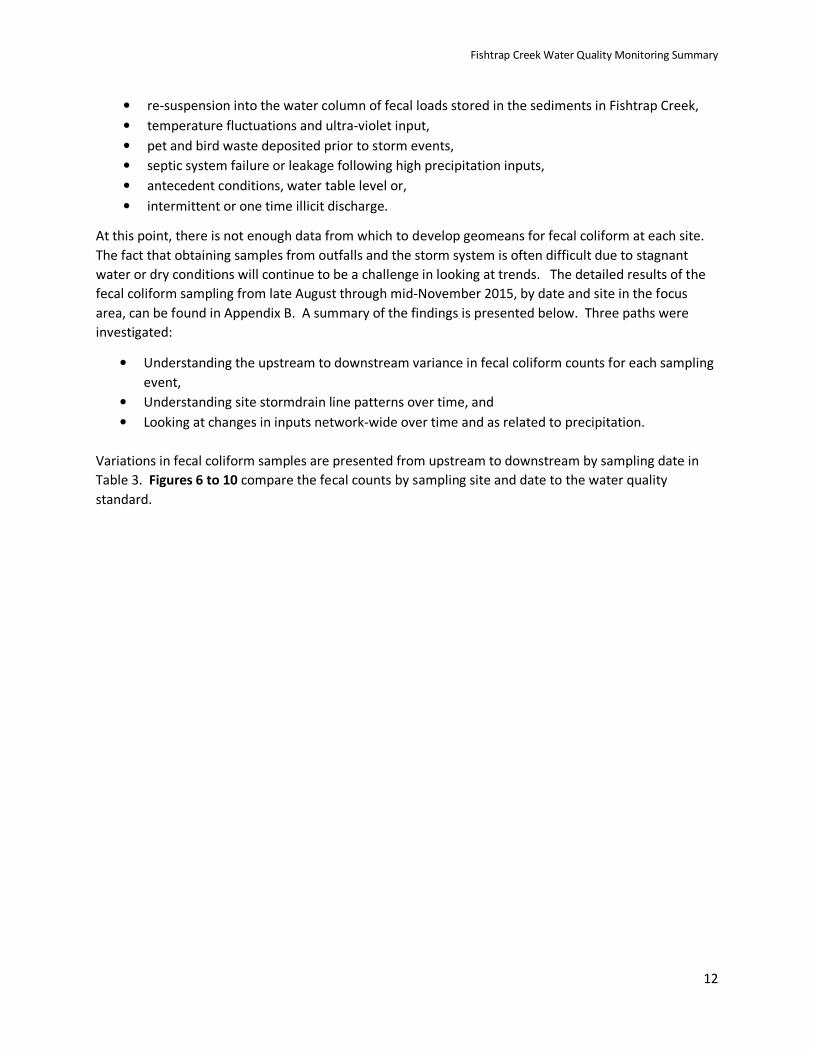
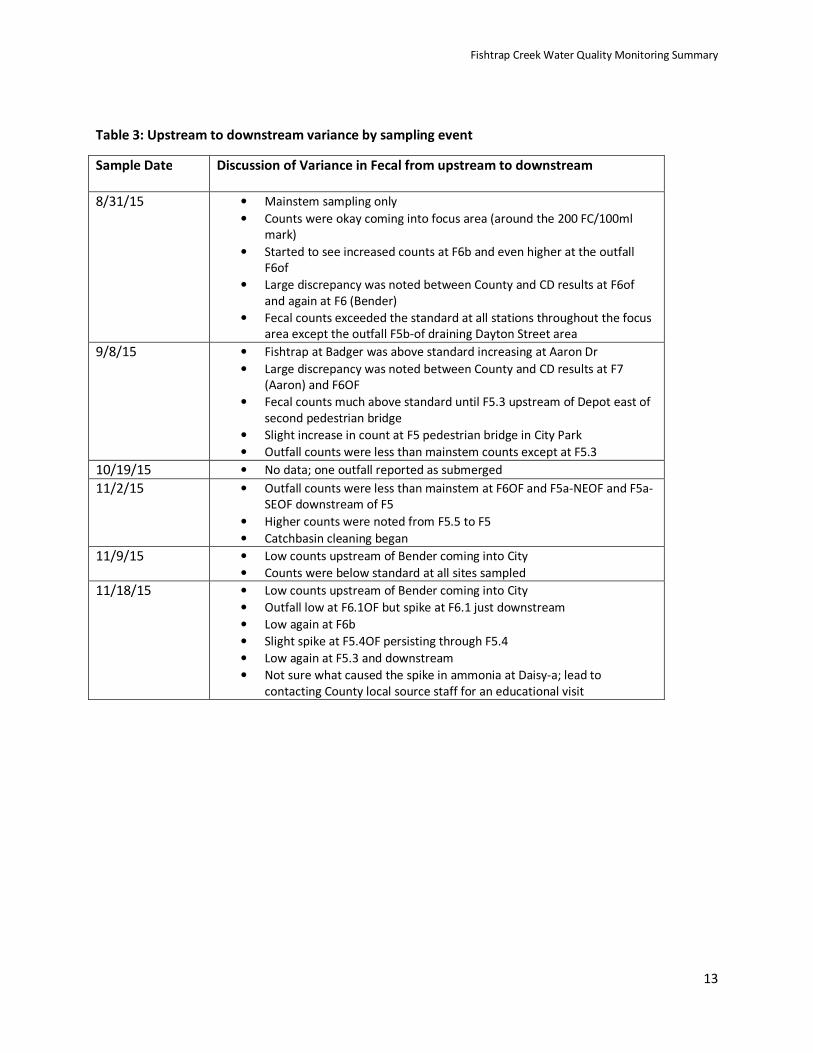
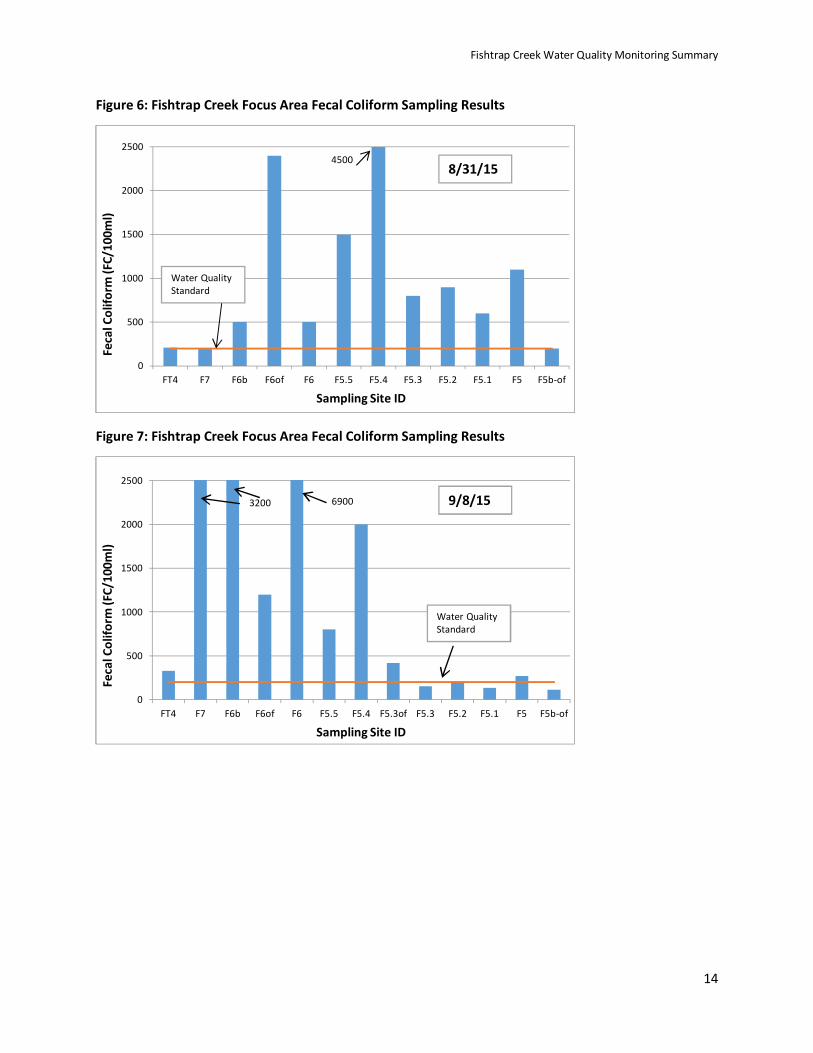
Variations in fecal coliform samples are presented from upstream to downstream by sampling date in
Table 3. Figures 6 to 10 compare the fecal counts by sampling site and date to the water quality
standard.
Fishtrap Creek Water Quality Monitoring Summary
13
Table 3: Upstream to downstream variance by sampling event
Sample Date Discussion of Variance in Fecal from upstream to downstream
8/31/15
• Mainstem sampling only
• Counts were okay coming into focus area (around the 200 FC/100ml
mark)
• Started to see increased counts at F6b and even higher at the outfall
F6of
• Large discrepancy was noted between County and CD results at F6of
and again at F6 (Bender)
• Fecal counts exceeded the standard at all stations throughout the focus
area except the outfall F5b-of draining Dayton Street area
9/8/15 • Fishtrap at Badger was above standard increasing at Aaron Dr
• Large discrepancy was noted between County and CD results at F7
(Aaron) and F6OF
• Fecal counts much above standard until F5.3 upstream of Depot east of
second pedestrian bridge
• Slight increase in count at F5 pedestrian bridge in City Park
• Outfall counts were less than mainstem counts except at F5.3
10/19/15 • No data; one outfall reported as submerged
11/2/15 • Outfall counts were less than mainstem at F6OF and F5a-NEOF and F5a-
SEOF downstream of F5
• Higher counts were noted from F5.5 to F5
• Catchbasin cleaning began
11/9/15 • Low counts upstream of Bender coming into City
• Counts were below standard at all sites sampled
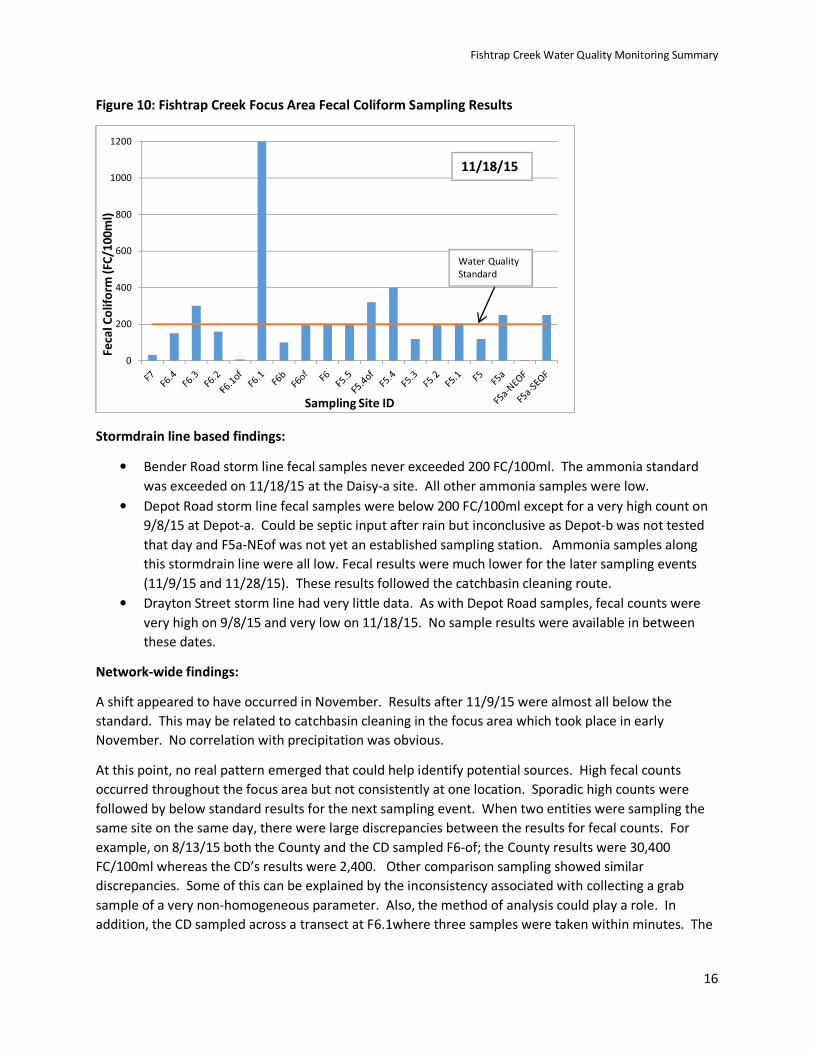
11/18/15 • Low counts upstream of Bender coming into City
• Outfall low at F6.1OF but spike at F6.1 just downstream
• Low again at F6b
• Slight spike at F5.4OF persisting through F5.4
• Low again at F5.3 and downstream
• Not sure what caused the spike in ammonia at Daisy-a; lead to
contacting County local source staff for an educational visit
Fishtrap Creek Water Quality Monitoring Summary
14
Figure 6: Fishtrap Creek Focus Area Fecal Coliform Sampling Results
Figure 7: Fishtrap Creek Focus Area Fecal Coliform Sampling Results
0
500
1000
1500
2000
2500
FT4 F7 F6b F6of F6 F5.5 F5.4 F5.3 F5.2 F5.1 F5 F5b-of
Fe
cal
Co
lifo
rm (
FC
/10
0m
l)
Sampling Site ID
8/31/15
Water Quality
Standard
4500
0
500
1000
1500
2000
2500
FT4 F7 F6b F6of F6 F5.5 F5.4 F5.3of F5.3 F5.2 F5.1 F5 F5b-of
Fe
cal
Co
lifo
rm (
FC
/10
0m
l)
Sampling Site ID
9/8/15
Water Quality
Standard
69003200
Fishtrap Creek Water Quality Monitoring Summary
15
Figure 8: Fishtrap Creek Focus Area Fecal Coliform Sampling Results
Figure 9: Fishtrap Creek Focus Area Fecal Coliform Sampling Results
0
200
400
600
800
1000
1200
1400
1600
1800
Fe
cal
Co
lifo
rm (
FC
/10
0m
l)
Sampling Site ID
11/2/15
Water Quality
Standard
0
50
100
150
200
250
Fe
cal
Co
lifo
rm (
FC
/10
0m
l)
Sampling Site ID
11/9/15
Water Quality
Standard
Fishtrap Creek Water Quality Monitoring Summary
16
Figure 10: Fishtrap Creek Focus Area Fecal Coliform Sampling Results
Stormdrain line based findings:
• Bender Road storm line fecal samples never exceeded 200 FC/100ml. The ammonia standard
was exceeded on 11/18/15 at the Daisy-a site. All other ammonia samples were low.
• Depot Road storm line fecal samples were below 200 FC/100ml except for a very high count on
9/8/15 at Depot-a. Could be septic input after rain but inconclusive as Depot-b was not tested
that day and F5a-NEof was not yet an established sampling station. Ammonia samples along
this stormdrain line were all low. Fecal results were much lower for the later sampling events
(11/9/15 and 11/28/15). These results followed the catchbasin cleaning route.
• Drayton Street storm line had very little data. As with Depot Road samples, fecal counts were
very high on 9/8/15 and very low on 11/18/15. No sample results were available in between
these dates.
Network-wide findings:
A shift appeared to have occurred in November. Results after 11/9/15 were almost all below the
standard. This may be related to catchbasin cleaning in the focus area which took place in early
November. No correlation with precipitation was obvious.
At this point, no real pattern emerged that could help identify potential sources. High fecal counts
occurred throughout the focus area but not consistently at one location. Sporadic high counts were
followed by below standard results for the next sampling event. When two entities were sampling the
same site on the same day, there were large discrepancies between the results for fecal counts. For
example, on 8/13/15 both the County and the CD sampled F6-of; the County results were 30,400
FC/100ml whereas the CD’s results were 2,400. Other comparison sampling showed similar
discrepancies. Some of this can be explained by the inconsistency associated with collecting a grab
sample of a very non-homogeneous parameter. Also, the method of analysis could play a role. In
addition, the CD sampled across a transect at F6.1where three samples were taken within minutes. The
0
200
400
600
800
1000
1200
Fe
cal
Co
lifo
rm (
FC
/10
0m
l)
Sampling Site ID
11/18/15
Water Quality
Standard
Fishtrap Creek Water Quality Monitoring Summary
17
samples varied from 1,000 FC/100ml on the southside near the bank to 600 midstream and 350 on the
northside near the bank.
Conclusions
While no clear pattern or source of high fecal counts were noted, the data suggests that water quality
violations continue to happen even if sporadically. With this in mind, the City plans to take the following
actions as a result of this investigation:
• Continue working with the County on a coordinated sampling calendar between the County and
CD/ Lynden’s efforts. Interest on storm events was targeted initially by the CD and Lynden,
however, more consistent data can be collected with a coordinated sample event calendar.
• The County uses Edge Analytical labs for analysis while the CD and Lynden use Exact Scientific.
Consistency in lab techniques would help eliminate a variable. Each entity has contracts and
work load reasons to stick with the current labs. The County has however offered to supply
duplicate samples periodically to Exact Scientific as quality assurance protocol.
• Continue to respond to dry weather outfall discharges. City staff or contractors will trace
sources of dry weather flows from the outfalls to Fishtrap Creek as practical . Notification of
outfall discharges from County and WCD sampling efforts will drive the schedule of drainage
system monitoring
• Work further with County Health to educate businesses on good housekeeping
• Work with the County to determine the status of the septic systems that may be draining to this
reach by developing a notification protocol regarding County inspections and dye test results.
• Continue to fund the Conservation District’s monitoring efforts and public education and
outreach / stewardship components.
• Investigate the cost of sampling sediment in Fishtrap Creek mainstem and prioritize locations to
bracket potential re-suspension issues.
• Review data as it is available and determine if additional adjustments and or actions need to be
taken. The County has developed an interactive map online that will allow quicker access to lab
results Whatcom County Water Quality results page and interactive
maps: http://www.co.whatcom.wa.us/2170/Water-Quality-Monitoring-Results
• Establish a protocol with the County and CD and Ecology on ERTS reporting. The first agency in
that knows of a violation should process the ERTS. Since the City has developed this
implementation plan, S4F work should not be subject to ERTS every sampling day.
• Work with DOE and EPA to be informed of Industrial Stormwater General Permit compliance
visits and enforcement issues for industries within City jurisdiction so that the City can develop
appropriate response, enforcement, or permitting actions
• Within staffing limitations, the City crew will schedule more frequent cleaning of facilities
upstream of elevated bacteria values.

Fishtrap Creek Water Quality Monitoring Summary
18
Appendix A
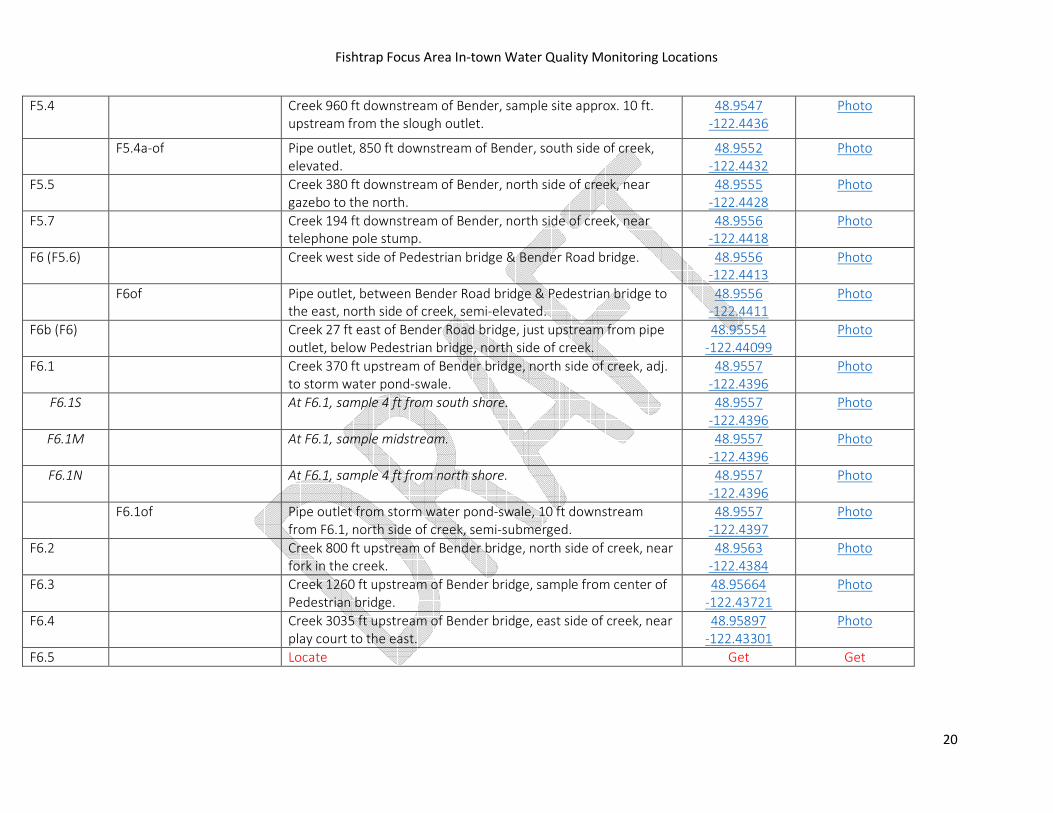
Water Quality Sampling Site Location Descriptions
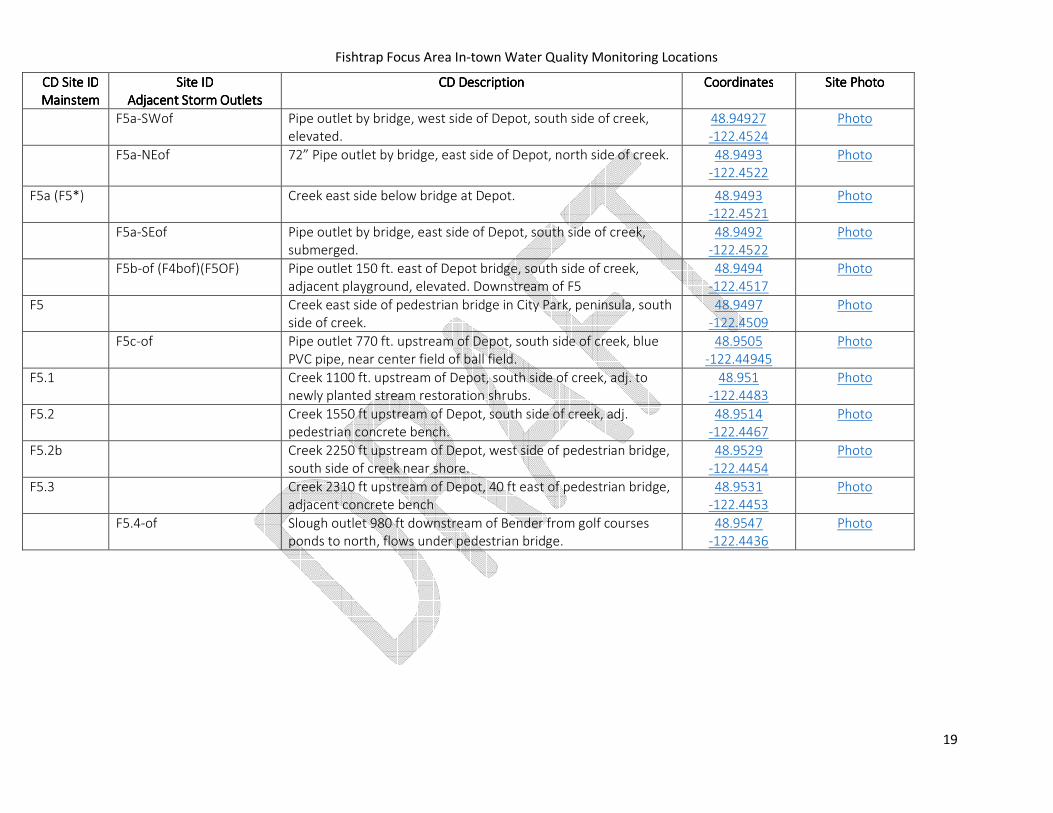
Fishtrap Focus Area In-town Water Quality Monitoring Locations
19
CD CD CD CD Site IDSite IDSite IDSite ID
MainstemMainstemMainstemMainstem
Site IDSite IDSite IDSite ID
Adjacent Storm OutletsAdjacent Storm OutletsAdjacent Storm OutletsAdjacent Storm Outlets
CD CD CD CD DescriptionDescriptionDescriptionDescription CoordinatesCoordinatesCoordinatesCoordinates Site PhotoSite PhotoSite PhotoSite Photo
F5a-SWof Pipe outlet by bridge, west side of Depot, south side of creek,
elevated.
48.94927
-122.4524
Photo
F5a-NEof 72” Pipe outlet by bridge, east side of Depot, north side of creek. 48.9493
-122.4522
Photo
F5a (F5*) Creek east side below bridge at Depot. 48.9493
-122.4521
Photo
F5a-SEof Pipe outlet by bridge, east side of Depot, south side of creek,
submerged.
48.9492
-122.4522
Photo
F5b-of (F4bof)(F5OF) Pipe outlet 150 ft. east of Depot bridge, south side of creek,
adjacent playground, elevated. Downstream of F5
48.9494
-122.4517
Photo
F5 Creek east side of pedestrian bridge in City Park, peninsula, south
side of creek.
48.9497
-122.4509
Photo
F5c-of Pipe outlet 770 ft. upstream of Depot, south side of creek, blue
PVC pipe, near center field of ball field.
48.9505
-122.44945
Photo
F5.1 Creek 1100 ft. upstream of Depot, south side of creek, adj. to
newly planted stream restoration shrubs.
48.951
-122.4483
Photo
F5.2 Creek 1550 ft upstream of Depot, south side of creek, adj.
pedestrian concrete bench.
48.9514
-122.4467
Photo
F5.2b Creek 2250 ft upstream of Depot, west side of pedestrian bridge,
south side of creek near shore.
48.9529
-122.4454
Photo
F5.3 Creek 2310 ft upstream of Depot, 40 ft east of pedestrian bridge,
adjacent concrete bench
48.9531
-122.4453
Photo
F5.4-of Slough outlet 980 ft downstream of Bender from golf courses
ponds to north, flows under pedestrian bridge.
48.9547
-122.4436
Photo
Fishtrap Focus Area In-town Water Quality Monitoring Locations
20
F5.4 Creek 960 ft downstream of Bender, sample site approx. 10 ft.
upstream from the slough outlet.
48.9547
-122.4436
Photo
F5.4a-of Pipe outlet, 850 ft downstream of Bender, south side of creek,
elevated.
48.9552
-122.4432
Photo
F5.5 Creek 380 ft downstream of Bender, north side of creek, near
gazebo to the north.
48.9555
-122.4428
Photo
F5.7 Creek 194 ft downstream of Bender, north side of creek, near
telephone pole stump.
48.9556
-122.4418
Photo
F6 (F5.6) Creek west side of Pedestrian bridge & Bender Road bridge. 48.9556
-122.4413
Photo
F6of Pipe outlet, between Bender Road bridge & Pedestrian bridge to
the east, north side of creek, semi-elevated.
48.9556
-122.4411
Photo
F6b (F6) Creek 27 ft east of Bender Road bridge, just upstream from pipe
outlet, below Pedestrian bridge, north side of creek.
48.95554
-122.44099
Photo
F6.1 Creek 370 ft upstream of Bender bridge, north side of creek, adj.
to storm water pond-swale.
48.9557
-122.4396
Photo
F6.1S At F6.1, sample 4 ft from south shore. 48.9557
-122.4396
Photo
F6.1M At F6.1, sample midstream. 48.9557
-122.4396
Photo
F6.1N At F6.1, sample 4 ft from north shore. 48.9557
-122.4396
Photo
F6.1of Pipe outlet from storm water pond-swale, 10 ft downstream
from F6.1, north side of creek, semi-submerged.
48.9557
-122.4397
Photo
F6.2 Creek 800 ft upstream of Bender bridge, north side of creek, near
fork in the creek.
48.9563
-122.4384
Photo
F6.3 Creek 1260 ft upstream of Bender bridge, sample from center of
Pedestrian bridge.
48.95664
-122.43721
Photo
F6.4 Creek 3035 ft upstream of Bender bridge, east side of creek, near
play court to the east.
48.95897
-122.43301
Photo
F6.5 Locate Get Get
Fishtrap Focus Area In-town Water Quality Monitoring Locations
21
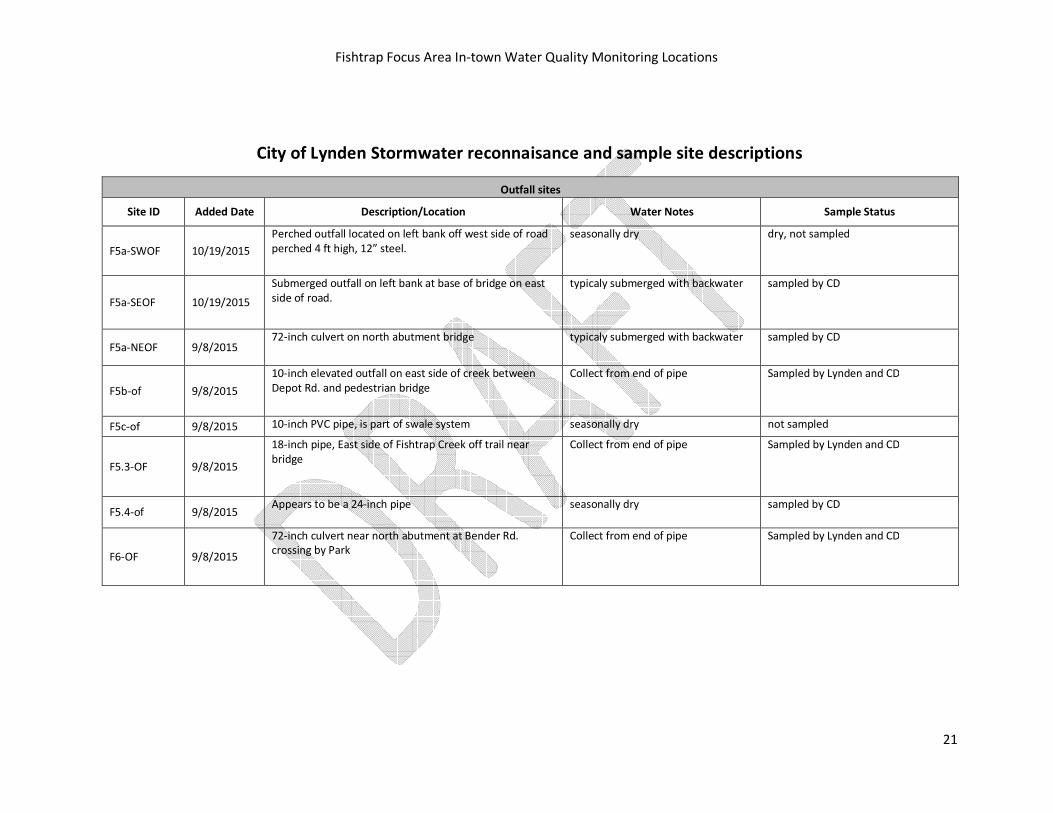
City of Lynden Stormwater reconnaisance and sample site descriptions
Outfall sites
Site ID Added Date Description/Location Water Notes Sample Status
F5a-SWOF 10/19/2015
Perched outfall located on left bank off west side of road
perched 4 ft high, 12” steel.
seasonally dry dry, not sampled
F5a-SEOF 10/19/2015
Submerged outfall on left bank at base of bridge on east
side of road.
typicaly submerged with backwater sampled by CD
F5a-NEOF 9/8/2015 72-inch culvert on north abutment bridge typicaly submerged with backwater sampled by CD
F5b-of 9/8/2015
10-inch elevated outfall on east side of creek between
Depot Rd. and pedestrian bridge
Collect from end of pipe Sampled by Lynden and CD
F5c-of 9/8/2015 10-inch PVC pipe, is part of swale system seasonally dry not sampled
F5.3-OF 9/8/2015
18-inch pipe, East side of Fishtrap Creek off trail near
bridge
Collect from end of pipe Sampled by Lynden and CD
F5.4-of 9/8/2015 Appears to be a 24-inch pipe seasonally dry sampled by CD
F6-OF 9/8/2015
72-inch culvert near north abutment at Bender Rd.
crossing by Park
Collect from end of pipe Sampled by Lynden and CD
Fishtrap Focus Area In-town Water Quality Monitoring Locations
22
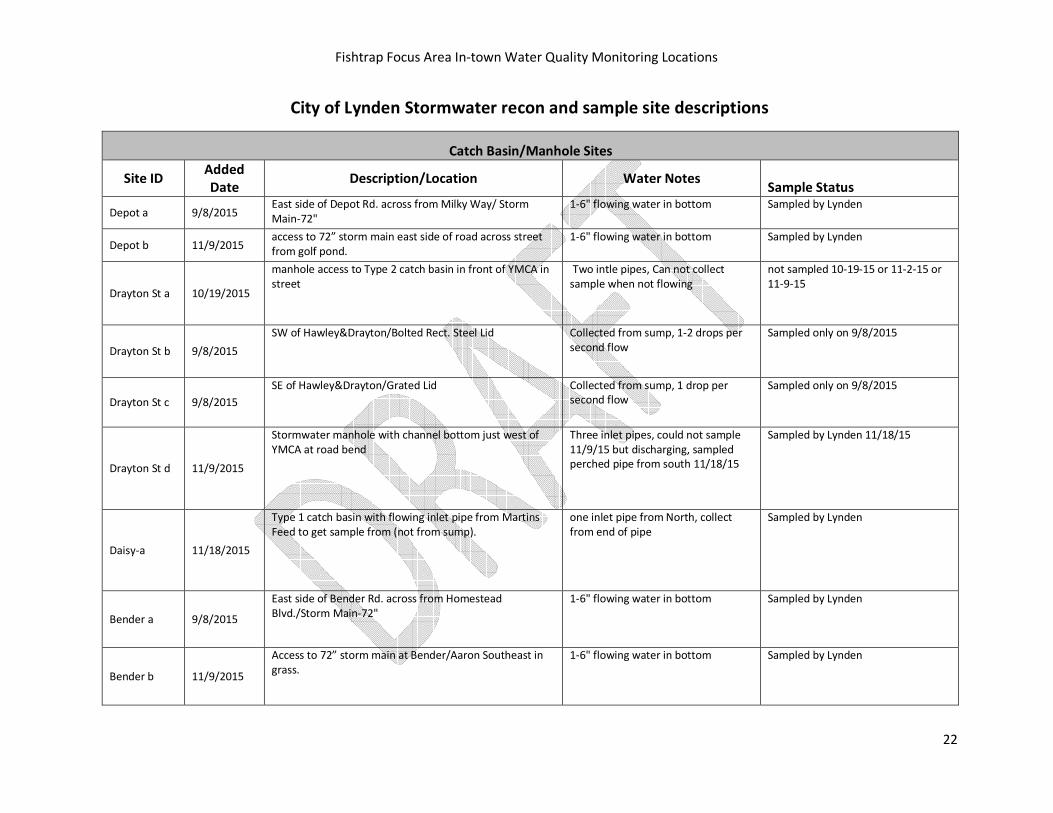
City of Lynden Stormwater recon and sample site descriptions
Catch Basin/Manhole Sites
Site ID Added
Date Description/Location Water Notes
Sample Status
Depot a 9/8/2015 East side of Depot Rd. across from Milky Way/ Storm
Main-72"
1-6" flowing water in bottom Sampled by Lynden
Depot b 11/9/2015 access to 72” storm main east side of road across street
from golf pond.
1-6" flowing water in bottom Sampled by Lynden
Drayton St a 10/19/2015
manhole access to Type 2 catch basin in front of YMCA in
street
Two intle pipes, Can not collect
sample when not flowing
not sampled 10-19-15 or 11-2-15 or
11-9-15
Drayton St b 9/8/2015
SW of Hawley&Drayton/Bolted Rect. Steel Lid Collected from sump, 1-2 drops per
second flow
Sampled only on 9/8/2015
Drayton St c 9/8/2015
SE of Hawley&Drayton/Grated Lid Collected from sump, 1 drop per
second flow
Sampled only on 9/8/2015
Drayton St d 11/9/2015
Stormwater manhole with channel bottom just west of
YMCA at road bend
Three inlet pipes, could not sample
11/9/15 but discharging, sampled
perched pipe from south 11/18/15
Sampled by Lynden 11/18/15
Daisy-a 11/18/2015
Type 1 catch basin with flowing inlet pipe from Martins
Feed to get sample from (not from sump).
one inlet pipe from North, collect
from end of pipe
Sampled by Lynden
Bender a 9/8/2015
East side of Bender Rd. across from Homestead
Blvd./Storm Main-72"
1-6" flowing water in bottom Sampled by Lynden
Bender b 11/9/2015
Access to 72” storm main at Bender/Aaron Southeast in
grass.
1-6" flowing water in bottom Sampled by Lynden
Fishtrap Focus Area In-town Water Quality Monitoring Locations
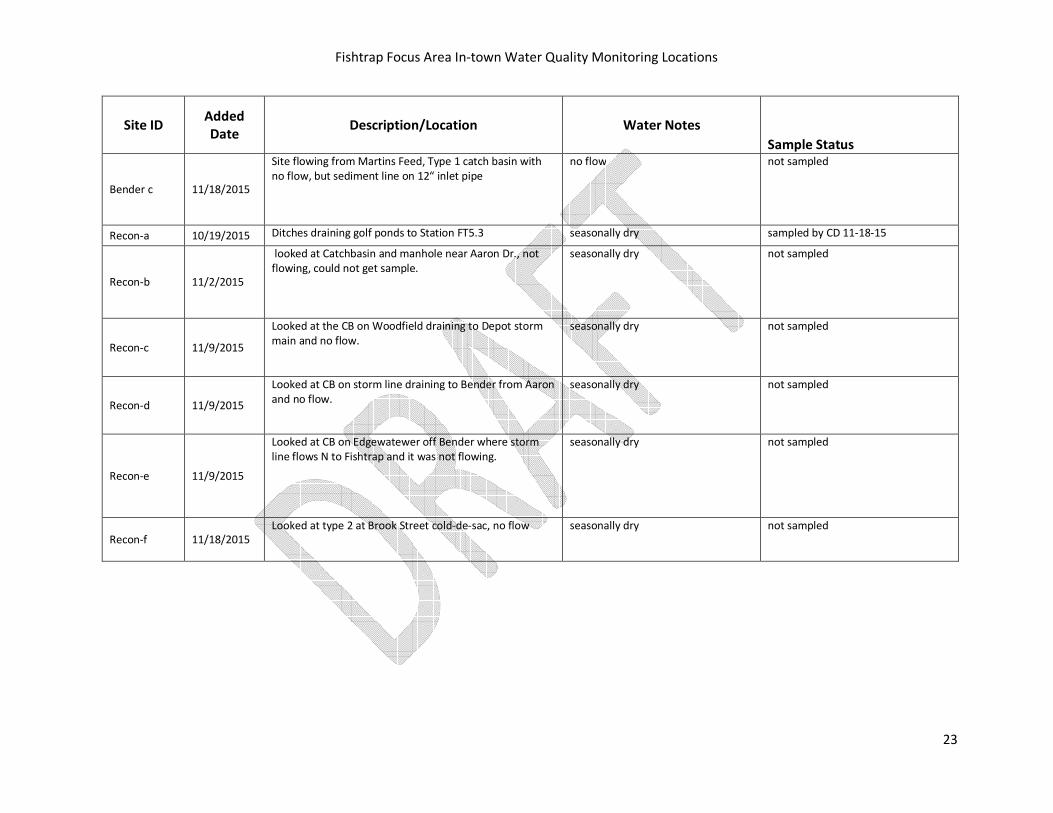
23
Site ID Added
Date Description/Location Water Notes
Sample Status
Bender c 11/18/2015
Site flowing from Martins Feed, Type 1 catch basin with
no flow, but sediment line on 12“ inlet pipe
no flow not sampled
Recon-a 10/19/2015 Ditches draining golf ponds to Station FT5.3 seasonally dry sampled by CD 11-18-15
Recon-b 11/2/2015
looked at Catchbasin and manhole near Aaron Dr., not
flowing, could not get sample.
seasonally dry not sampled
Recon-c 11/9/2015
Looked at the CB on Woodfield draining to Depot storm
main and no flow.
seasonally dry not sampled
Recon-d 11/9/2015
Looked at CB on storm line draining to Bender from Aaron
and no flow.
seasonally dry not sampled
Recon-e 11/9/2015
Looked at CB on Edgewatewer off Bender where storm
line flows N to Fishtrap and it was not flowing.
seasonally dry not sampled
Recon-f 11/18/2015
Looked at type 2 at Brook Street cold-de-sac, no flow seasonally dry not sampled

Fishtrap Focus Area In-town Water Quality Sampling Results
24
Appendix B
Water Quality Sampling Results Since August, 2015
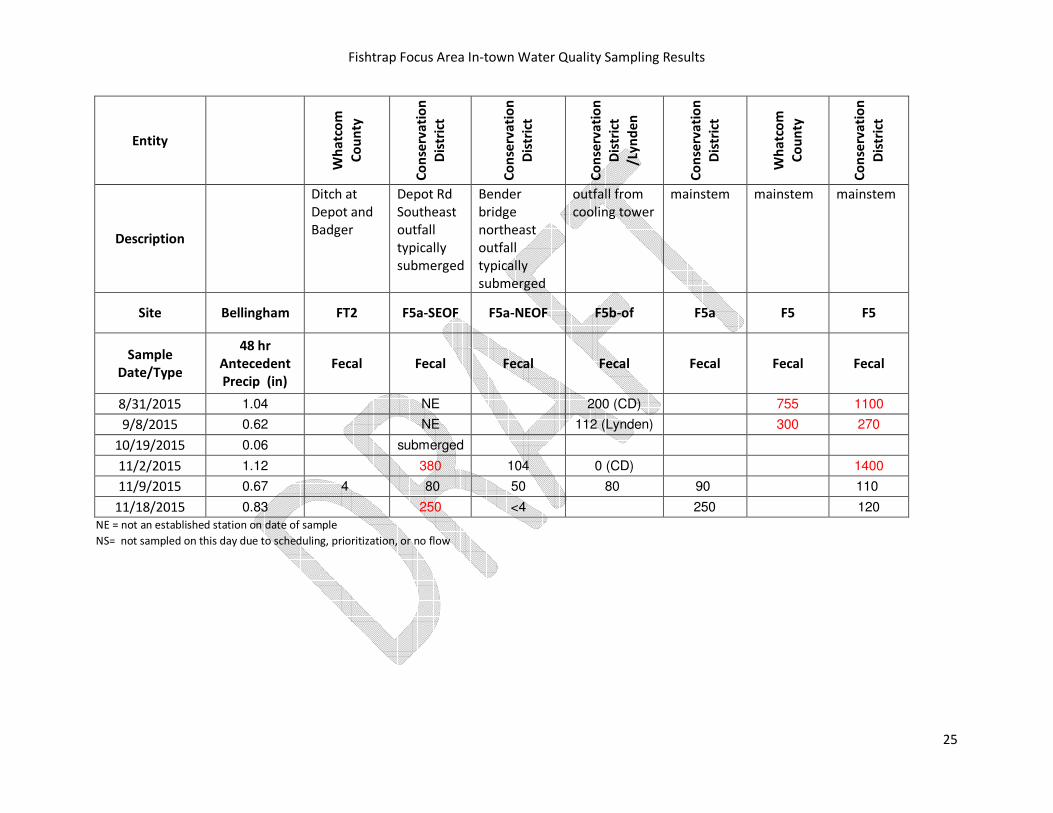
Fishtrap Focus Area In-town Water Quality Sampling Results
25
Entity
Wh
atc
om
Co
un
ty
Co
nse
rva
tio
n
Dis
tric
t
Co
nse
rva
tio
n
Dis
tric
t
Co
nse
rva
tio
n
Dis
tric
t
/Ly
nd
en
Co
nse
rva
tio
n
Dis
tric
t
Wh
atc
om
Co
un
ty
Co
nse
rva
tio
n
Dis
tric
t
Description
Ditch at
Depot and
Badger
Depot Rd
Southeast
outfall
typically
submerged
Bender
bridge
northeast
outfall
typically
submerged
outfall from
cooling tower
mainstem mainstem mainstem
Site Bellingham FT2 F5a-SEOF F5a-NEOF F5b-of F5a F5 F5
Sample
Date/Type
48 hr
Antecedent
Precip (in)
Fecal Fecal Fecal Fecal Fecal Fecal Fecal
8/31/2015 1.04 NE 200 (CD) 755 1100
9/8/2015 0.62 NE 112 (Lynden) 300 270
10/19/2015 0.06 submerged
11/2/2015 1.12 380 104 0 (CD) 1400
11/9/2015 0.67 4 80 50 80 90 110
11/18/2015 0.83 250 <4 250 120
NE = not an established station on date of sample
NS= not sampled on this day due to scheduling, prioritization, or no flow
Fishtrap Focus Area In-town Water Quality Sampling Results
26
Entity
Co
nse
rva
tio
n
Dis
tric
t
Co
nse
rva
tio
n
Dis
tric
t
Co
nse
rva
tio
n
Dis
tric
t
Co
nse
rva
tio
n
Dis
tric
t
/Ly
nd
en
Co
nse
rva
tio
n
Dis
tric
t
Co
nse
rva
tio
n
Dis
tric
t
/Ly
nd
en
Co
nse
rva
tio
n
Dis
tric
t
Co
nse
rva
tio
n
Dis
tric
t
Description
mainstem
mainstem
mainstem
outfall
mainstem
outfall,
seasonally
dry
mainstem
mainstem
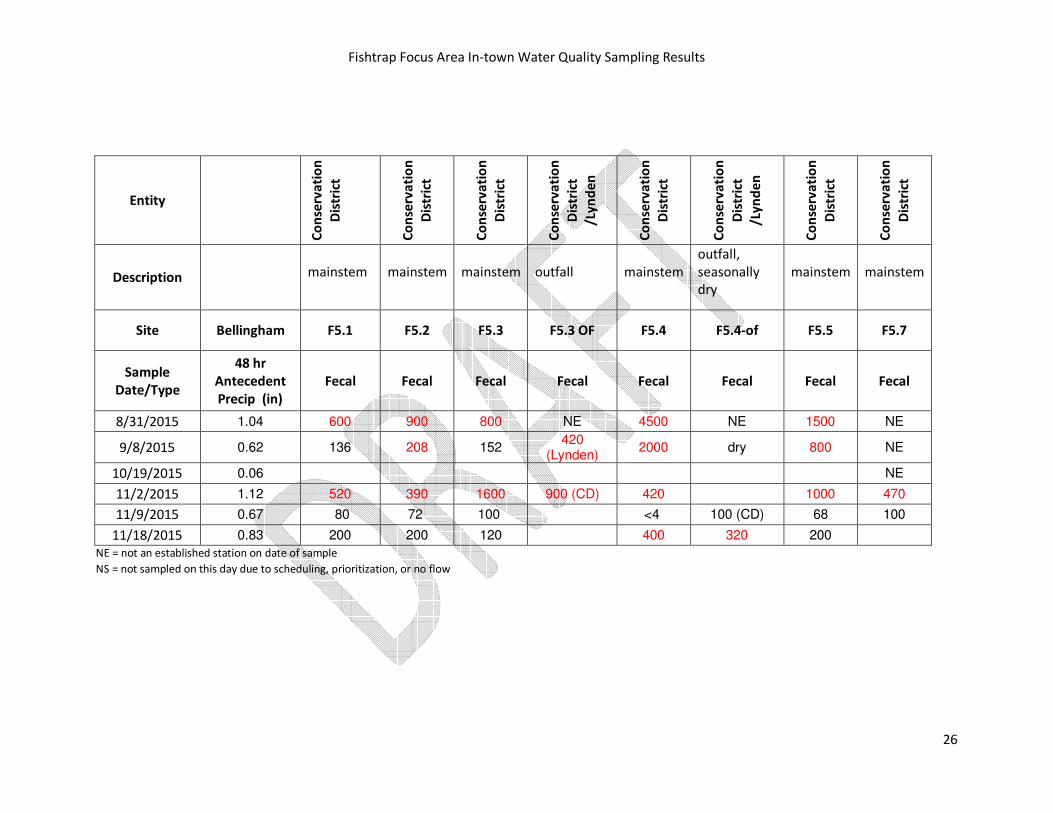
Site Bellingham F5.1 F5.2 F5.3 F5.3 OF F5.4 F5.4-of F5.5 F5.7
Sample
Date/Type
48 hr
Antecedent
Precip (in)
Fecal Fecal Fecal Fecal Fecal Fecal Fecal Fecal
8/31/2015 1.04 600 900 800 NE 4500 NE 1500 NE
9/8/2015 0.62 136 208 152 420
(Lynden) 2000 dry 800 NE
10/19/2015 0.06 NE
11/2/2015 1.12 520 390 1600 900 (CD) 420 1000 470
11/9/2015 0.67 80 72 100 <4 100 (CD) 68 100
11/18/2015 0.83 200 200 120 400 320 200
NE = not an established station on date of sample
NS = not sampled on this day due to scheduling, prioritization, or no flow
Fishtrap Focus Area In-town Water Quality Sampling Results
27
Entity
Wh
atc
om
Co
un
ty
Co
nse
rva
tio
n
Dis
tric
t
Wh
atc
om
Co
un
ty
Wh
atc
om
Co
un
ty
Co
nse
rva
tio
n
Dis
tric
t
/Ly
nd
en
Co
nse
rva
tio
n
Dis
tric
t
Co
nse
rva
tio
n
Dis
tric
t
Co
nse
rva
tio
n
Dis
tric
t
Description
mainstem Immediately
DS of Bender
Rd
Ditch at
Badger
and
Bender
outfall us of
bender rd
bridge
outfall us of
bender rd
bridge
immediately
US of
Bender RD
mainstem outfall
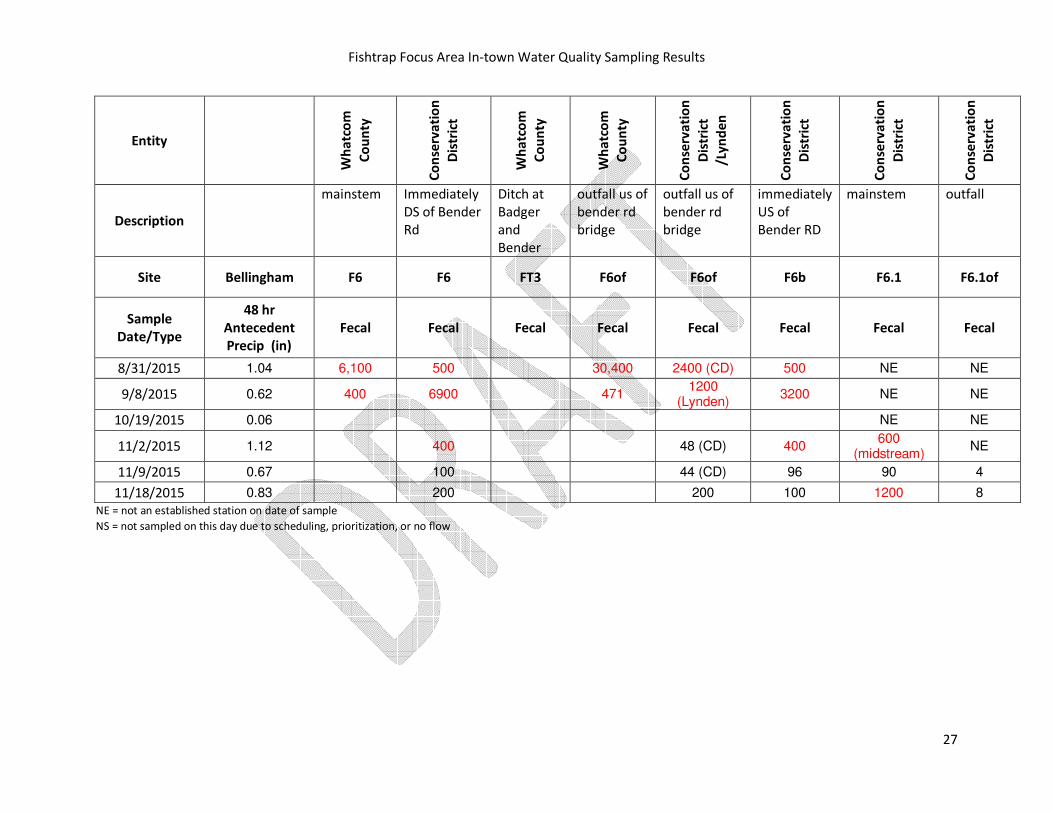
Site Bellingham F6 F6 FT3 F6of F6of F6b F6.1 F6.1of
Sample
Date/Type
48 hr
Antecedent
Precip (in)
Fecal Fecal Fecal Fecal Fecal Fecal Fecal Fecal
8/31/2015 1.04 6,100 500 30,400 2400 (CD) 500 NE NE
9/8/2015 0.62 400 6900 471 1200
(Lynden) 3200 NE NE
10/19/2015 0.06 NE NE
11/2/2015 1.12 400 48 (CD) 400 600
(midstream) NE
11/9/2015 0.67 100 44 (CD) 96 90 4
11/18/2015 0.83 200 200 100 1200 8
NE = not an established station on date of sample
NS = not sampled on this day due to scheduling, prioritization, or no flow
Fishtrap Focus Area In-town Water Quality Sampling Results
28
Entity
Co
nse
rva
tio
n
Dis
tric
t
Co
nse
rva
tio
n
Dis
tric
t
Co
nse
rva
tio
n
Dis
tric
t
Co
nse
rva
tio
n
Dis
tric
t
Wh
atc
om
Co
un
ty
Co
nse
rva
tio
n
Dis
tric
t
Wh
atc
om
Co
un
ty
Description
mainstem mainstem mainstem mainstem Fishtrap
@ Aaron
Dr.
Fishtrap
@ Aaron
Dr.
Fishtrap
@Badger
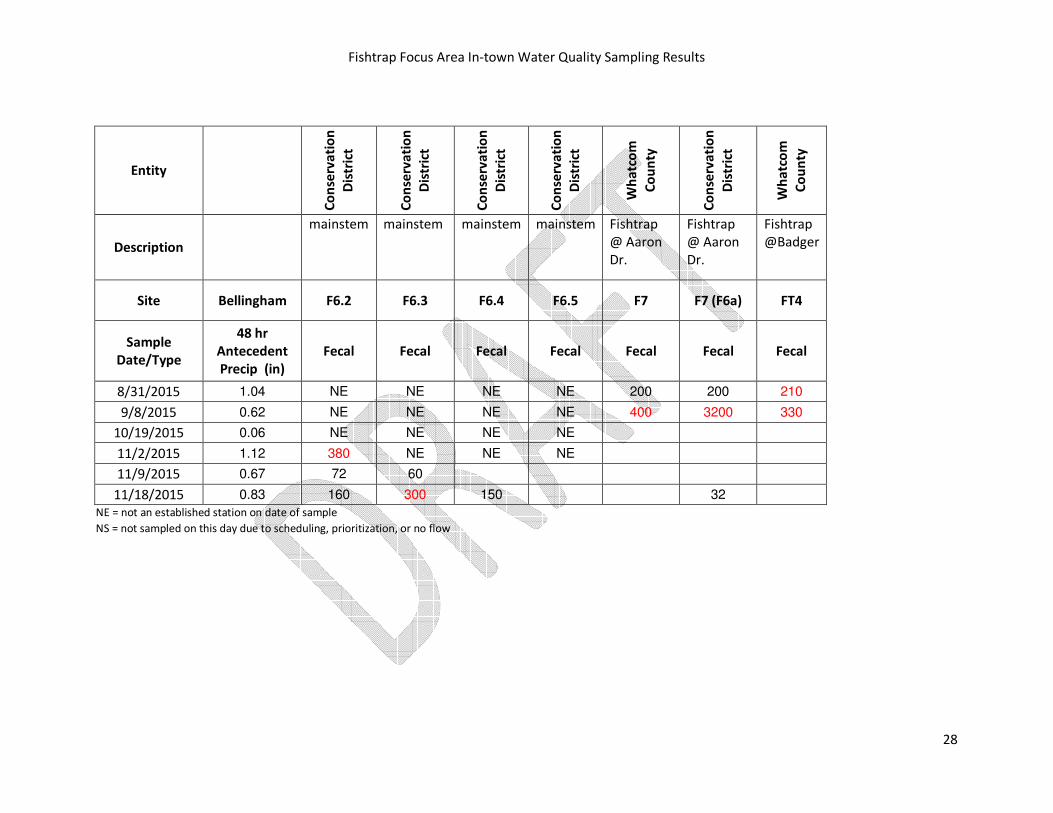
Site Bellingham F6.2 F6.3 F6.4 F6.5 F7 F7 (F6a) FT4
Sample
Date/Type
48 hr
Antecedent
Precip (in)
Fecal Fecal Fecal Fecal Fecal Fecal Fecal
8/31/2015 1.04 NE NE NE NE 200 200 210
9/8/2015 0.62 NE NE NE NE 400 3200 330
10/19/2015 0.06 NE NE NE NE
11/2/2015 1.12 380 NE NE NE
11/9/2015 0.67 72 60
11/18/2015 0.83 160 300 150 32
NE = not an established station on date of sample
NS = not sampled on this day due to scheduling, prioritization, or no flow
Fishtrap Focus Area In-town Water Quality Sampling Results
29
Entity
Lyn
de
n
Lyn
de
n
Lyn
de
n
Lyn
de
n
Lyn
de
n
Description
stormwater main stormwater main Catch basin,
trickle of flow
sampled
sump
Catch basin,
trickle of flow
sampled
sump
manhole with channel
bottom, sampled
perched pipe from south
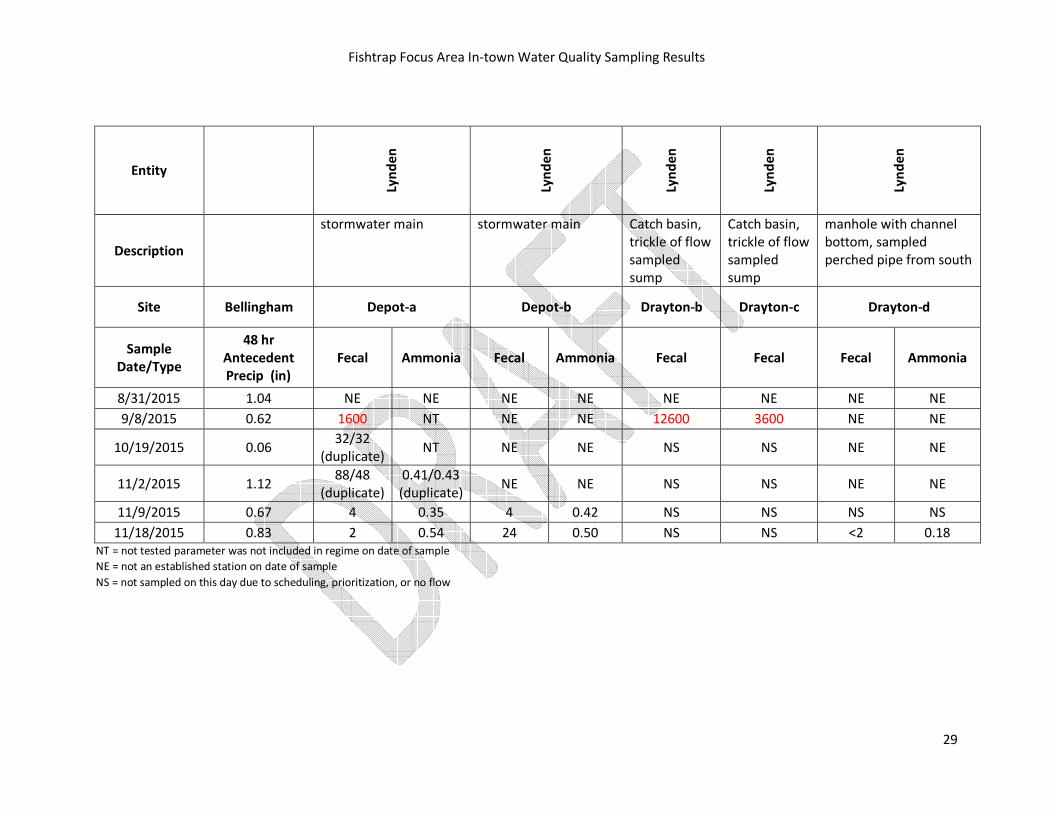
Site Bellingham Depot-a Depot-b Drayton-b Drayton-c Drayton-d
Sample
Date/Type
48 hr
Antecedent
Precip (in)
Fecal Ammonia Fecal Ammonia Fecal Fecal Fecal Ammonia
8/31/2015 1.04 NE NE NE NE NE NE NE NE
9/8/2015 0.62 1600 NT NE NE 12600 3600 NE NE
10/19/2015 0.06 32/32
(duplicate) NT NE NE NS NS NE NE
11/2/2015 1.12 88/48
(duplicate)
0.41/0.43
(duplicate) NE NE NS NS NE NE
11/9/2015 0.67 4 0.35 4 0.42 NS NS NS NS
11/18/2015 0.83 2 0.54 24 0.50 NS NS <2 0.18
NT = not tested parameter was not included in regime on date of sample
NE = not an established station on date of sample
NS = not sampled on this day due to scheduling, prioritization, or no flow
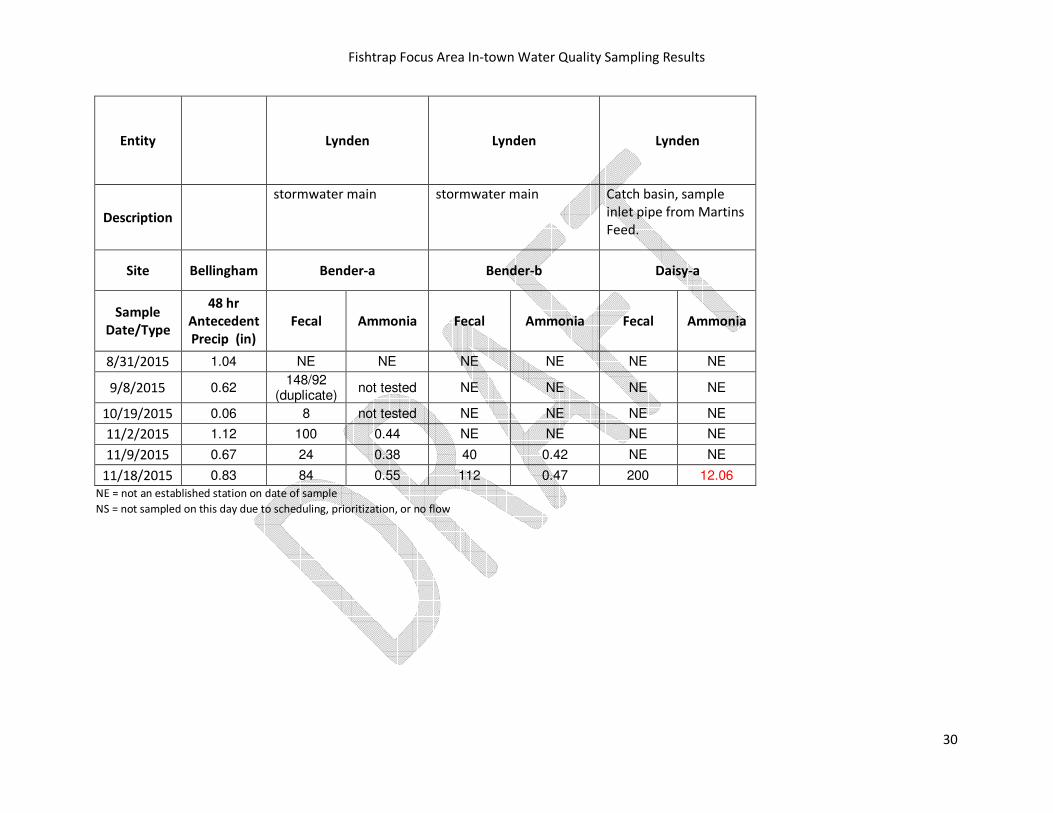
Fishtrap Focus Area In-town Water Quality Sampling Results
30
Entity Lynden Lynden Lynden
Description
stormwater main stormwater main Catch basin, sample
inlet pipe from Martins
Feed.
Site Bellingham Bender-a Bender-b Daisy-a
Sample
Date/Type
48 hr
Antecedent
Precip (in)
Fecal Ammonia Fecal Ammonia Fecal Ammonia
8/31/2015 1.04 NE NE NE NE NE NE
9/8/2015 0.62 148/92
(duplicate) not tested NE NE NE NE
10/19/2015 0.06 8 not tested NE NE NE NE
11/2/2015 1.12 100 0.44 NE NE NE NE
11/9/2015 0.67 24 0.38 40 0.42 NE NE
11/18/2015 0.83 84 0.55 112 0.47 200 12.06
NE = not an established station on date of sample
NS = not sampled on this day due to scheduling, prioritization, or no flow