Embed Size (px)
Citation preview

MMATHEMATICSATHEMATICSas a TTeachable eachable MMomentoment
MMeaningeaning
CChoicehoice
DDiversityiversity
TTrustrust
TTimeime
1
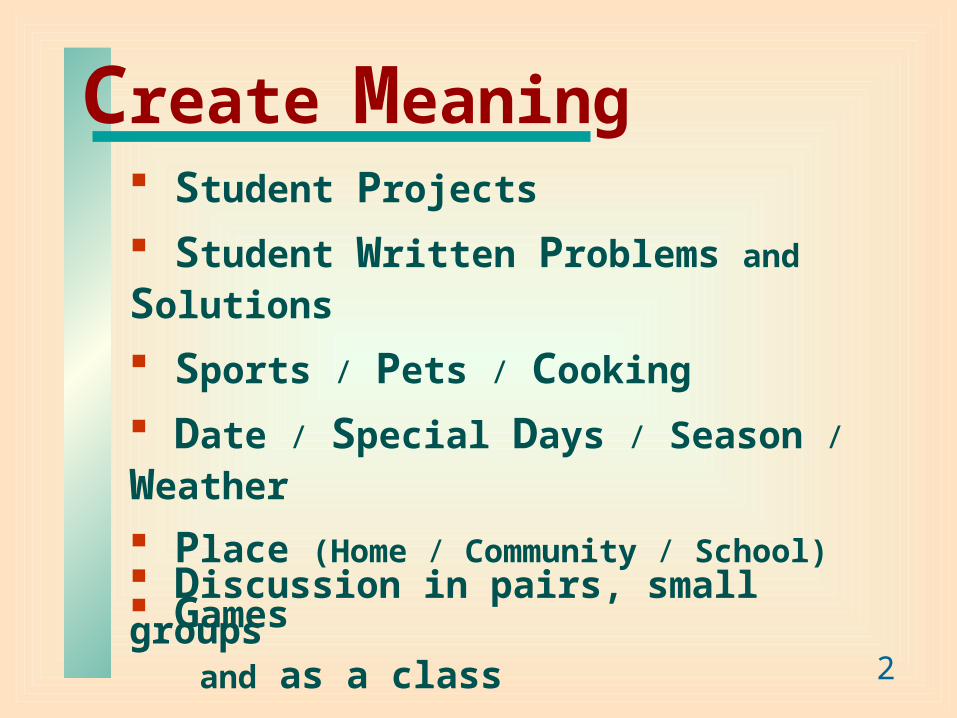
Student Projects
Student Written Problems and Solutions
Sports / Pets / Cooking
Date / Special Days / Season / Weather
Place (Home / Community / School)
Games
Discussion in pairs, small groups and as a class
Create
Meaning
2

Choices provide meaning through a sense of:
ControlControl
CommitmenCommitmentt ChallengeChallenge
Projects, Student Written Problems, “How Many Ways” sheets,
and Discussion are all embedded with choice.
Give Choices
3

Encourage alternative strategies.
Ask “How?” not “Why?”
Give students choice in the order, methods, strategies and topics.
Make sure all students are involved in creating rules and sharing strategies.
Value Diversity
Diversity should be treated as a positive factor in the classroom.
We need to:We need to:
4

Create a
Climate of
TrustAsk open-ended questions and
value diverse strategies for solving problems.
Ask students to explain, discuss and show – especially when their answers are correct.
Value errors as opportunities to investigate conceptual understanding and create
new understandings.
5

6
Ensure There
is Adequate
TimeTeach the curriculum in an integrated manner
so that there are opportunities to review every major theme or
skill set.
Integrate the intended learning outcomes (ILOs)
into major themes and evaluate over the
whole year.
Value accuracy over speed.
Avoid:Races
Contestsand
Strictly Timed Basic Fact Tests

Review of
Silent
Mouthing
Use the “silent mouthing technique:
When students make errors give them hints, suggest that they are close, acknowledge that they are a step ahead or say, “That is the answer to a different question.”
Student FeedbackStudent Feedbackto give: to give:
Slower processors and complex thinkers the time they need to do the question.
7

Review of
Place Value
Place value should be taught at least once a week but preferably a place value connection should be made almost every day.
The connections to algebraic thinking should be made (collecting like terms) as this will pay off when doing operations with fractions and algebraic expressions.
8

Organization of
the CURRICULUM
All four strands (ŸNumber Sense,
ŸSpatial Sense, ŸProbability and Data Sense
and ŸPattern and Relationship
Sense) should be covered every month
(every week in Primary).
Problem solving often embeds three of the strands depending on whether the problem has a focus on spatial relationships or data relationships. It is usually preferable to introduce a new topic through a problem. The Japanese teachers use this technique effectively.
9

Making Meaning with the WEEKLY GRAPH
Graphing is a tool for
making meaning
if the data is collected
from the students.
The “Weekly Graph” is
intended to be student
driven
by the fourth week
at the latest.
Eventually the
“Weekly Graph”
becomes a day for
teaching proportional
thinking, decimals,
fractions, percents,
graphing, patterns and
relations, and
probability.
10

Watch for the “big ideas”Watch for the “big ideas”in the video.in the video.
What teaching techniques are effective?
What Mathematical concepts are covered?
11

How manyILOS were covered in
the previous video clip?
How do we find the time to teach
this way?
12
NEWNEW Strategies for Strategies for OLDOLD Ideas Ideas
Intermediate
Students
Where do we find the time to teach this way?
If students are taught this way, how will they do on the FSA tests?
13

Multi-step Divisionand
Decimal Fractions
The first few times multi-step division is taught it should be done as a whole class.
The errors made should be used as opportunities to investigate conceptual understanding.
Placement of the decimal in the quotient should be done by asking,
“Where does it make sense to put the decimal so that the answer makes sense?”
14

PProcess for rocess for
TTeachingeaching
11 ÷ ÷ 99 If possible, do multi-step division on grid paper
(cm graph paper works well).
If grid paper is not available, use lined paper turned sideways so that the lines become grids for keeping the numerals
in the correct position.
15

)9 10
-01
.0
0
1
- 91
.0
0
1
- 91
)9 0. 0 0 0 0 0 0 00.1 1 1 1 1 1 1
19 0.1
Ÿ=
19 0.1=or
11 ÷ ÷ 99
16

Many algorithms are culture specific time savers that create accuracy.
The multi-digit regrouping system we use for subtracting is based on the principle of equivalence and is done differently in parts of Europe.
Some Europeans use a system that depends on the principles of balance and equivalence.
17

Many algorithms are culture specific time savers that create accuracy.
The algorithm we use for multi-digit multiplication has changed considerably over the years.
In the middle ages we used a box or window method.
In the fifties we moved the second product over one space which paralleled the way we multiplied using adding machines. Now we add a zero
for the second product. 18

Algorithms in the 21st Century
Algorithms should be developed through discussion with learners because the purpose of teaching algorithms is to develop understanding.
The focus should be on accuracy, then on efficiency.
The most efficient algorithm today is always based on today’s technology.
The most efficient algorithm today is the calculator or the computer but we do need to understand the underlying concept or we don’t know if the answer makes sense. 19

FRACTIONS are RICH in PATTERNS
Working at your table or in your group, assign different members of the group to find the decimal fraction for:
17
, 27
, 37
, 47
, 57
, 67
, 77
, 87
,
Do you notice
any patterns?
How many remainders did it take before you
achieved a repeating decimal pattern?
20

Common Fractions
SimplestForm
DecimalEquivalent
PercentageEquivalent
14 = 2
8= 3
12 = 416 = 5
20 = 40100
On your “Memorable Fractions” sheet please write in all the fractions studied in the video.
Include some of the equivalent fractions for these.
For example:(the first fraction
illustrated in the video)
There were three other fractions in the problem. There was one fraction from the graph.
WWEEKEEK OONENEof theof the
WWeekly eekly GGraphraph
21

WWEEKEEK OONENEof theof the
WWeekly eekly GGraphraph
Have the students draw a bar graph of the results.
Do not give students criteria for creating a good graph. Discuss the results and focus on the fact that graphs are supposed to give you a lot of information at a glance. This means that the graph should be neat, have a title and a legend (if necessary).
In the end, the class will have developed assessment criteria from a meaningful context by having students notice what makes a graph a good communication tool.
Self-evaluation is often the most effective.
22

Have students discuss (write) what they know about the class by analyzing the data (graph).
Use the think/pair/share method to create discussion, then share as a group (valuing diversity, creating trust and developing meaning through choice).
Can they think of any questions or extensions?
Use these for further research.
WWEEKEEK OONENEof theof the
WWeekly eekly GGraphraph
23

WWEEKEEK TTWOWOof theof the
WWeekly eekly GGraphraph
Collect data.
Decide which fractions (decimals and percents) you wish to study. If you are worried about coloring in the hundreds squares for a tricky fraction, leave this part until the next day and try it yourself. Enter the fractions on the Memorable Fraction sheet.
Draw a circle graph of the data.
Review the criteria.
24

Can be rich in CURRICULUM Connections
If the number of voters in the class is: 12
151820243036or
Do the following:
Have the students find the prime factorization of 360 and the prime factorization of the number who voted (e.g. 30).
Write the equation in fractional form:36030
2 x 2 x 2 x 3 x 3 x 52 x 3 x 5
=
25

Find the ones.
36030
2 x 2 x 2 x 3 x 3 x2 x 3 x 5
= 5
This principle was used in the video to make equivalent fractions – in particular:
25
2020
40100
x =
PPRINCIPLE of RINCIPLE of ONEONE
14
520
52 x 2 x 5
==
26

PPRINCIPLERINCIPLE of of
EQUIVALENCEEQUIVALENCE
Throughout the video and on the “Memorable
Fractions” sheet, the students have been
making equivalent fractions and have learned
that every fraction can be expressed as an
infinite number of common fractions, exactly
one decimal fraction and one percentage
fraction. It can also be expressed as a ratio.
27

PPRINCIPLERINCIPLE of of BALANCEBALANCE
In the video one student noticed that when
equivalent fractions are generated, both the
numerator and denominator have to be multiplied
by the same number.
This is also an example of the Principle of One as:
14
520
55
x ==x
28

Please solve the Please solve the following:following:Don’t forget to show your steps.
2x + 5 = 31
2x + 5 – 5 = 31 – 5
2x = 26
2x = 262 = 2
x x == 13 13
29

PPRINCIPLERINCIPLE of of ZEROZERO
This step is necessary for equation solving and is the only principle that is not generated in doing the “Weekly Graph”.
It should have been generated much earlier in the primary grades when doing the “How Many Ways Can You Make a Number” activity during Calendar Time.
How many different ways can you make __________ ?
+ - x ÷
30

How How Many Many WaysWays
??
31

How How Many Many WaysWays
??
32

Mark Criteria
Mark Criteria
Where any sentence contains theAddition operation
Where any sentence contains theSubtraction operation
Where any sentence contains theMultiplication operation
Where any sentence contains theDivision operation
Where any sentence containsmore than two terms(e.g. 2 x 3 + 5 = 10)
Where any sentence containsmore than two operations(e.g. 2 x 3 + 4 = 10)
Where any sentence contains a numbermore than the goal number(in this case 10)
Where any sentence contains a numbersubstantially greater than the goal number(in this case 50 or 100)
Where any group of sentences showsevidence of a pattern(e.g. 1 + 9, 2 + 8, 3 + 7)
Where any sentence shows knowledge of the power of zero(e.g. 6 – 6 + 10 = 10 or 10 + 0 = 10)
Where any sentence usesdoubling and halving to generate new questions(e.g. 4 x 6 = 24, 2 x 12 = 24, 1 x 24 = 24)
Where any sentence shows knowledge ofthe power of one(e.g. 6 ÷ 6 + 9 = 10 or 10 x 1 = 10)
Where any sentence shows knowledge ofthe commutative principle(e.g. 6 + 4 = 10 and 4 + 6 = 10)
Where any sentence shows knowledge ofthe number Note: this applies only for numbers greater than 10, such as 24. In upper intermediate grades, award marks for exponential notation also.(e.g. 20 + 4 = 24 and 2 x 10 + 4 = 24)
Where any sentence contains brackets, such as: (3 + 2) + (3 + 2) + (3 + 2) + (3 + 2) + 4 = 24
Where any sentence contains exponents, square roots, factorials, or fractions.Note: there should be no expectation of the demonstration of exponents, square roots or factorials before grade six, but their use should be acknowledged and rewarded where a student chooses to employ such operations in earlier grades.
How Many Different Ways Can You Make a Number?How Many Different Ways Can You Make a Number?
1
11
1
1
1
1
1
1
1
1
1
1
1
1
1
33

PPRINCIPLESRINCIPLES of of
EQUATION SOLVINGEQUATION SOLVING
Principle of ZeroZero
Principle of OneOne
Principle of EquivalenceEquivalence
Principle of BalanceBalanceThese four principles should be generated by and attributed to students. They are all you need to solve most equations and work with rational expressions throughout high school.
34

ConnectionConnectionss
ALGEBRAICALGEBRAIC
THINKINGTHINKINGtoto
The principle of one and the principle of balance are used in rationalizing radical expressions.
The principles of one and balance can be used to generate an easy to remember algorithm for dividing fractions.
35

PPRINCIPLE of RINCIPLE of ONEONE
2357
1
23
57
x= 2
357
x =
7575
x
x= 14
15
We refer to this as Invert and Multiply which has no other
application in mathematics.
The Principle of OnePrinciple of One has many applications.
36
ConnectionConnectionss
ALGEBRAICALGEBRAIC
THINKINGTHINKINGtoto
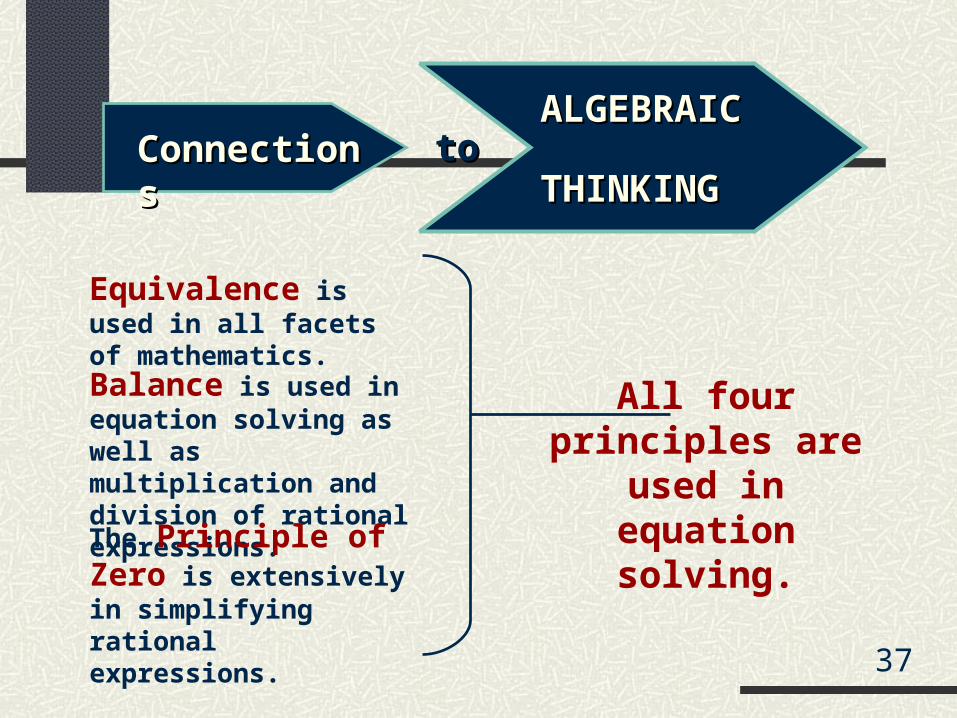
Equivalence is used in all facets of mathematics.Balance is used in equation solving as well as multiplication and division of rational expressions.
The Principle of Zero is extensively in simplifying rational expressions.
All four principles are used in
equation solving.
37

Probability can be introduced during the “Weekly Graph” process.
Probability was introduced in the first session when playing “hangman” which is an activity students love to play.
Probability sense is an important skill we use in everyday life.
38

In your group, have one person shuffle the red deck (cards numbered 1 to 10) and a different person shuffle the blue deck.
TTen-en-FFramerame
PProbabilityrobability
Place the decks face
down side-by-side.
Predict the sum if you were to turn over the top two cards.
Collect the predictions from the whole group.
39

Was the most common prediction a 7?
TTen-en-FFramerame
PProbabilityrobability
Turn over the two decks and find all the combinations that equal 77.
It often is.
What is the probability of turning over two cards whose sum is 77?
How many did you get?
Check with other groups to see how many they got.
Discuss the reason for your answers until you come to a consensus.
What would the probability be for getting 66? 55?
Now watch the video. 40

NEWNEW Strategies for Strategies for OLDOLD Ideas Ideas
Intermediate
Students
Which ILOs were covered in the activity?
What are some connected or follow-up activities that you could use?
41

ConnectionConnectionss
ADDINGADDING
FACTSFACTStoto
Introducing the ten-frame cards this way allows grade four to eight students to look at numbers in a new way and learn to add visually without counting.
The games shown in the video are called “Solitaire 10” and “Concentration 10”. Some students in intermediate grades have difficulty adding, and this is a new way to learn an old concept of making tens.
42

ConnectionConnectionss
““ALL THEALL THE
FACTS” FACTS” SheetSheettoto
All the Addition Facts You Ever Need to Know (B)
8 + 2 = 6 + 0 = 2 + 9 = 8 + 0 =
8 + 3 = 6 + 9 = 7 + 3 = 1 + 1 =
6 + 8 = 9 + 3 = 8 + 5 = 5 + 5 =
3 + 1 = 3 + 4 = 5 + 4 = 7 + 5 =
1 + 2 = 4 + 9 = 9 + 1 = 6 + 4 =
7 + 4 = 2 + 2 = 3 + 3 = 2 + 3 =
9 + 9 = 3 + 5 = 0 + 1 = 1 + 7 =
0 + 9 = 2 + 5 = 6 + 7 = 2 + 0 =
3 + 6 = 4 + 1 = 4 + 0 = 8 + 8 =
0 + 3 = 1 + 5 = 2 + 4 = 7 + 0 =
1 + 8 = 4 + 4 = 6 + 5 = 2 + 6 =
5 + 0 = 6 + 1 = 2 + 7 = 1 + 9 =
4 + 8 = 5 + 9 = 6 + 6 = 8 + 9 =
7 + 8 = 3 + 7 =
Column 1 Column 2 Column 3 Column 4
Name left to learn
All the Addition Facts You Ever Need to Know (B)
8 + 2 = 6 + 0 = 2 + 9 = 8 + 0 =
8 + 3 = 6 + 9 = 7 + 3 = 1 + 1 =
6 + 8 = 9 + 3 = 8 + 5 = 5 + 5 =
3 + 1 = 3 + 4 = 5 + 4 = 7 + 5 =
1 + 2 = 4 + 9 = 9 + 1 = 6 + 4 =
7 + 4 = 2 + 2 = 3 + 3 = 2 + 3 =
9 + 9 = 3 + 5 = 0 + 1 = 1 + 7 =
0 + 9 = 2 + 5 = 6 + 7 = 2 + 0 =
3 + 6 = 4 + 1 = 4 + 0 = 8 + 8 =
0 + 3 = 1 + 5 = 2 + 4 = 7 + 0 =
1 + 8 = 4 + 4 = 6 + 5 = 2 + 6 =
5 + 0 = 6 + 1 = 2 + 7 = 1 + 9 =
4 + 8 = 5 + 9 = 6 + 6 = 8 + 9 =
7 + 8 = 3 + 7 =
Column 1 Column 2 Column 3 Column 4
43

ConnectionConnectionss
SUBTRACTIONSUBTRACTION FACTSFACTS
toto
Visual tools are powerful.
After just this one lesson, which may take two or three days to complete, most students when asked to visualize how to make ’15’ with the cards will say, “Get a ten and a five”.
When they say, “Six”, ask them
how they see the six.
They should say, “One and Five”.
This tool works for subtracting 9, 8 and 5, which is almost half of the subtracting facts.
Now ask them to cover up or
take away nine.
44

ConnectionConnectionss
PROBABILITYPROBABILITYwithwith
All of the fractions generated in the video
were for ‘what you would expect to get’.
This is called the “Expected Probability”.
What we are really interested in is
the “Experimental Probability”.
The next step is to have each pair or students
do 100 trials each and compare the Expected
Probability to the Experimental Probability.
The difference explains why people gamble.
45

ConnectionConnectionss
TECHNOLOGYTECHNOLOGYwithwith
If each student in the class does 100 trials and then the data is put on a spreadsheet, it is clear that while some students will win if they pick their favourite number, others will lose.
However, the experimental results for the whole class will usually mirror the expected probability.
Government figures the odds, pays less than the expected probability, and makes lots of money.
Gambling then is a tax on the under-educated, often the poor.
46

ConnectionConnectionss
TECHNOLOGYTECHNOLOGYwithwith
A B C D EErica Kaeli Sarah Alyssa J essie
1 2 2 1 0 1
2 1 1 3 2 1
3 2 2 3 4 2
4 4 4 5 5 4
5 2 5 5 2 4
6 7 5 7 6 3
7 6 10 8 11 4
8 7 5 5 8 10
9 6 10 6 8 14
10 18 13 8 7 15
11 11 9 11 9 9
12 13 12 8 9 11
13 4 5 8 6 6
14 8 5 2 5 4
15 3 2 9 8 6
16 0 3 4 4 4
17 2 6 4 3 2
18 3 1 1 2 0
19 1 0 2 1 0
20
21
22
100 100 100 100 100
47

ConnectionConnectionss
TECHNOLOGYTECHNOLOGYwithwith
Do the same activity with six-sided, ten-sided, or twelve-sided dice.
Probability of getting a specific number or color of SmartiesTM or other candies on Halloween or Valentines Day.
Probability of a new student in class wanting a specific kind of pizza, liking a certain pop star, or wearing a certain kind of clothing.
48

ConnectionConnectionss
DECIMAL DECIMAL FRACTIONS FRACTIONS PROJECTPROJECT
to theto the
Take out the Decimal Fractions Project sheet.Enter all the fractions and decimals collected so far.
Find the prime factorization of the denominator for each fraction (use fractions in their lowest terms only.)
Do you see any patterns?
49

SSTUDENTTUDENT FFRACTIONRACTION DDECIMALECIMAL IINVESTIGATIONNVESTIGATION
SSHEETHEETFraction Decimal
Check if aRepeatingDecimal
Check if aTerminating
Decimal Prime Factorization of the Denominator
25
0.4 5
200.25
310
0.3 19
0.1 9 = 3 x 3
5 = 5
10 = 2 x 5
so 4 = 2 x 25 20
1 4
=
50

ConnectionConnectionss
NUMBER LINESNUMBER LINEStoto
0 1
Draw a line from 0 to 2.
58
Place the fraction
on the line.58
110
2
14
12
34
121
The important issue when connecting number lines to
rational numbers is to create reference points
(tenths, quarters and halves).
19
Place the fraction
on the line.19
27
Place the fraction
on the line.27
85
Place the fraction
on the line.85
83%
Place 83%on the line.
150%
Place 150%on the line.
0.7
Place 0.7 on the line.
51

ConnectionConnectionss
NUMBER LINESNUMBER LINEStoto
Sometimes it is important to have the number lines drawn vertically so that the student makes the connection to a thermometer.
Then it is easy to introduce the idea of integers and negative integers in a natural context.
0
52

MAKING MEMORIESMAKING MEMORIES
In the last session the “Norman” story was introduced as a way to create a metaphor (based on scientific theory
about the way we create memories) about how Norman learned to add 8 + 7 and other numbers by breaking the number up and using doubles.
Other students were asked if they did the question in different ways and five responded.
How can this story be used in a classroom when there is a student who yells out answers or interrupts with what he or she considers interesting comments?
53

MAKING MEMORIESMAKING MEMORIES
What have you mylenized over the
course of the two videos?
Please take 2 minutes of silence to write out a list.
When the two minutes are up, the facilitator will ask you to share
a strategy or concept you learned that you feel
will be useful.
This writing and then sharing helps
“re-mylenize” your learning.
54

Create a Class List with some or all of the following headings:
EEVALUATINGVALUATINGWWeeklyeekly GGraphraph AActivitiesctivities
Name
Collects &Organizes
Data
Creates aCIRCLE Graphfrom Raw Data
Creates aBAR Graph
from Raw Data
Creates aPICTOGRAPHfrom Raw Data
InterpretsGraphs
CreatesQuestions or
Word-Problemsfrom Data
Tim
Bethany
J eevan
Morgan
Chris
55

Create Criteria for Create Criteria for each Headingeach HeadingCollects &
OrganizesData
Creates aCIRCLE Graphfrom Raw Data
Creates aBAR Graph
from Raw Data
Creates aPICTOGRAPHfrom Raw Data
InterpretsGraphs
CreatesQuestions or
Word-Problemsfrom Data
Example:Creates a CIRCLE Graph from Raw
Data.
Can create a circle graph using percentages and
includes headings and legend. The graph is
easy to interpret (neat and complete).
Can create a circle graph using
a circle graph frame and includes headings
and legend. The graph is easy to
interpret (neat and complete).
Can create a circle graph using
a circle graph frame but is missing
headings or legend.The graph is difficult
to interpret(may not be neat or
complete).
Serious errors and hardly gets
started.
56

CCircle ircle GGraphraph
Number of Siblings
Zero siblings
One sibling
Two siblings
Three siblings
27 students in the class told how many siblings they have.
DataData
HeadinHeadingg
LegendLegend
NeatnesNeatnesss
3
125
7
57

EVALUATINGDecimals / Fractions / Percentage
Example for Multi-age Grade 6/7(Grade 6 gets a 4 in the 3 category) Is fluent among the three forms of a rational
number, both repeating and terminating common fractions, including most of halves, thirds, quarters, fifths, sixths, eighths, tenths, twentieths, fortieths, fiftieths, hundredths, and thousandths.
Makes occasional errors with tenths and hundredths.
Can give the three forms for tenths and hundredths.
Is fluent for the three forms for halves, quarters, fifths, tenths and hundredths.
58

Example for Multi-age Grade 6/7(Grade 6 gets a 4 in the 3 category)Given a set of ordinary or special
dice or a spinner, can create a data set and interpret both the expected and experimental probability.
Creates a data set and interprets but makes some errors (not fundamental).
Gets a good start and creates a data set but not both of expected and experimental. Barely gets started if at
all, needs a lot of help.
4
3
2
1
59

TeachingTeaching ClassesClasses
There is some research that shows that students in multi-age classes demonstrate superior learning.
This may result from the fact that the teacher knows she has to individualize more because of the spread of ability.
In fact, this is true for all classes even when they are streamed.
I have found it most effective when teaching a multi-age class to teach to the top grade and evaluate
the lower grade at their own level.
60

EVALUATIONEVALUATIONWork with someone at your table to create criteria for
at least one of the Intended Learning Outcomes that
you will be evaluating.
Keep in mind that the creation of criteria is always a
process of negotiation between you, the curriculum and
your context (class and school).
If you involve the students in creation of the criteria,
they often create criteria that has a high standard of
expectation for excellence.
61

and
Good Problem Solvers:
Get started Get unstuck Persevere Can solve problems in more
than one way Self-correct
62

FACILITATINGProblem Solving
Use the think / pair / share method.
Give problems that are multi-step and take note of student strategies.
Record the strategies, slowly building up a list.
Discuss the efficacy and efficiency of the various strategies that students use.
63

FACILITATINGProblem Solving
Use model problems and have students write problems using the frame as a model.
Encourage the use of mathematical vocabulary by giving bonus marks.
Encourage the use of mathematical vocabulary by creating a word wall or a glossary in student workbooks.
64

STRATEGIES forGetting Unstuck
Look for a pattern
Make a model
Draw a diagram
Create a table, chart or list
Use logic
Create a simpler related problem
Work backwards
Seek help from a peer, the internet, a book65
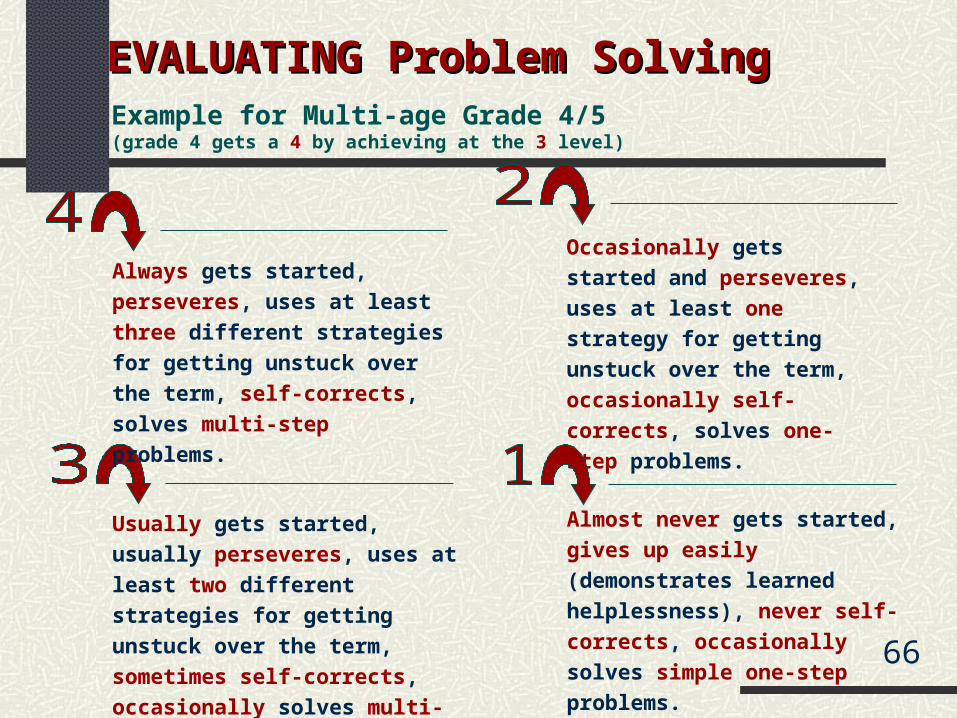
EVALUATING Problem SolvingEVALUATING Problem SolvingExample for Multi-age Grade 4/5(grade 4 gets a 4 by achieving at the 3 level)
Occasionally gets started and
perseveres, uses at least one
strategy for getting unstuck
over the term, occasionally
self-corrects, solves one-step
problems.
Usually gets started, usually
perseveres, uses at least two
different strategies for getting
unstuck over the term, sometimes
self-corrects, occasionally solves
multi-step problems.
Almost never gets started, gives
up easily (demonstrates learned
helplessness), never self-
corrects, occasionally solves
simple one-step problems.
Always gets started, perseveres,
uses at least three different
strategies for getting unstuck
over the term, self-corrects,
solves multi-step problems.
66

IIMPLEMENTATIONMPLEMENTATION
Take the time to make a plan for
implementation.
What obstacles do you
perceive?
What help do you need?What help do you need?67

Fuson, Karen C., Kalchman, Mindy and Bransford, John D., Chapter 5, “Mathematical Understanding: An Introduction in How Students Learn Mathematics in the Classroom”, Ed. Donovan, Susanne and Bransford, John D., National Academies Press, Washington, D.C. 2005
Buschman, Larry E.E... Mythmatics” Teaching Children Mathematics, Vol.12, No.3, Oct. 2005, p136 –143
Calkins, Trevor “Mathematics as a Teachable Moment” Grades K-3, Power of Ten Educational Consulting Ltd, Victoria, B.C. 2004
Calkins, Trevor “Mathematics as a Teachable Moment” Grades 4 - 6, Power of Ten Educational Consulting Ltd, Victoria, B.C. 2004
Silver, Edward A and Cai, Jinfa. “Assessing Students’ Mathematical Problem Posing” Teaching Children Mathematics, Vol.12, No.3, Oct. 2005, p129 -135
Bibliography
68

Slide presentation created by:
Trevor CalkinsPower of Ten Educational Consulting
809 Kimberley PlaceVictoria, B. C.
V8X 4R2www.poweroften.ca
Power Point presentation constructed by:
Karen HendersonP. O. Box 18
Shawnigan Lake, B. C.V0R 2W0
69