Embed Size (px)
Citation preview
NASA CR-
M Axiomatix
Reproduced by
NATIONAL TECHNICAL c .INFORMATION SERVICE ca- '
US Depaltment of Commerce
Springfield, VA. 22151
C-
(NASA-CR-141779) INTEGRATED SOURCE AND N75-22561
CHANNEL ENCODED DIGITAL COMMUNICATION SYSTEMDESIGN STUDY Final Report (Axiomatix,Marina del Rey, Calif.) 45 p HC $3.75 Unclas
CSCL 17B G3/32 19475 )
Marina del Rey * California
https://ntrs.nasa.gov/search.jsp?R=19750014489 2018-07-16T07:07:59+00:00Z

INTEGRATED SOURCE AND CHANNELENCODED DIGITAL COMMUNICATION
SYSTEM DESIGN STUDY
FINAL REPORT
Contract No. NAS 9-13467Exhibit C
Prepared by
Gaylord K. HuthBruce D. Trumpis
Sergei Udalov
Axiomatix13900 Panay Way, Suite llOM
Marina del Rey, California 90291
Prepared for
NASA Lyndon B. Johnson Space CenterHouston, Texas 77058
PRIES SUBJECT TO G
Reproduced by Axiomatix Report No. R7504-1NATIONAL TECHNICAL April 25, 1975INFORMATION SERVICE
US Department of CommerceSpringfield, VA. 22151
TABLE OF CONTENTS
Page
LIST OF FIGURES .................... iii
1.0 INTRODUCTION ................. 1
2.0 MOTIVATION ..... .... .... ..... 2
3. 0 SUMMARY OF BURST ERROR CORRECTION FORTHE SPACE SHUTTLE COMMAND CHANNELS . ... 5
4.0 COSTAS RECEIVER PERFORMANCECONSIDERATIONS .......... ...... 12
4. 1 Summary of "Optimum Performance ofCostas Type Receivers" . ... ... . . . . . 12
4. 2 Summary of Design and Performance ofCostas Receivers Containing BandpassLimiters .... ...... .. ...... 15
5.0 SUMMARY OF EXPERIMENTAL TECHNIQUESFOR MEASURING LOW LEVEL SPECTRALCOMPONENTS FOR MICROWAVE SIGNALS . . . . . 20
6.0 KU-BAND RETURN LINK MODULATIONTECHNIQUES ........... .. ... . . 24
6. 1 Summary of Feasibility Study of an InterplexModulation System for the Orbiter's Ku-BandLink ...................... 24
6. 2 Summary of Multiplexing Modulation Formats
for the Orbiter's Ku-Band Return Link ... . . 27
6.3 Convolutional Encoding and Viterbi Decodingat 50 Mbps .. . .. . ........ .. 33
7.0 AREAS FOR FURTHER STUDY . . . . . . . . . . 37
7. 1 Spread Spectrum Acquisition and Tracking . . 37
7.2 Three-Channel Data Multiplexing Techniques . 37
7.3 MFSK Coding .. . . ..... . . .. . . . 38
7.4 System Acquisition Characteristics . . . . . . 38
7.5 Modulation-Coding Interface Characteristics . . 38
REFERENCES . ..... .... . .. ... . .... . . 40
LIST OF FIGURES
Page
1. A Burst Correcting Decoder (127, 50) BCH Code . . .. 6
2. Revised Circuitry for Burst Decoder ... . . . . . . 7
3. Command Channel Performance for STDN-to-Orbiterand Orbiter-to-NASA Payload Links ..... . .. . 8
4. Command Channel Performance for SCF-to-OrbiterLink . . . . . . . . . . . . . . . . . . . . . . . 9
5. Command Channel Performance for TDRSS-to-Orbiter Link ....... ....... ..... 10
6. Probability of False Acceptance vs. Probability
of Bit Error for Burst Decoder ... . . . . . . . 11
7. Comparison of the Effectiveness of Various ArmFilters in Reducing the Squaring Loss L for VariousValues of ST/N 0 . . . . . .. . . . . . . . . . 13
8. Ratio of Optimum Bandwidth to Symbol Rate versusSymbol Energy to Noise Ratio, R d .......... 14
9. Ratio Bi/ s Which Minimizes the Squaring LossVersus Rd .................... 16
10. Loss in Loop Signal-to-Noise Ratio Due to thePresence of a Limiter for Various Values of Rd . . . . 17
11. Signal Amplitude Suppression Factor Versus IF
SNR for the CW and Costas Loop . ..... . . . . . 18
12. Variation of Loop Bandwidth with Signal Level for
Optimum Values of B.i/. ............... . 191 S
13. Low-Level Sideband Measurement . ......... 21
14. 800B System Block Diagram . ........... . 23
15. Three-Channel Interplex Modulator . ........ 25
16. Three-Channel Interplex Demodulator Block Diagram . 26
17. Basic Modulator/Demodulator Configurationfor Ku-Band Return Link -- Mode 1. . . . . . . . . 29
18. Data-to-Crosstalk Ratio vs. Carrier TrackingError t for a Two-Channel QuadriphaseDemodulator and Power Ratio P 1
= 4P 2 . . . . . . . . 30
19. Three-Channel PSK Modulator/Demodulator . .... 32
iii

Page
20. Convolutional Encoding and Viterbi Decoding
at 50 Mbps ....... ............... 34
21. Alternate Encoder for Figure 20 . .......... 35
iv
1. 0 INTRODUCTION
This report summarizes the results of several study tasks pertaining
to various aspects of Space Shuttle communication system. The tasks
performed can be logically divided into the following four categories:
1. Study of burst error correction for Shuttle command channels.
2. Performance optimization and design considerations for Costas
receivers with and without bandpass limiting.
3. Investigation of experimental techniques for measuring low
level spectral components of microwave signals, and
4. Investigation and comparison of potential modulation and coding
techniques for the Ku-band return link.
Section 2 defines the motivation for the study tasks undertaken.
A summary of burst error correction study is given in Section 3 with the
details in References 1 and 2. Studies pertaining to optimization of Costas
receivers are presented in Section 4 with the details in References 3 and 4.
Investigation of the experimental techniques for spectrum measurement
are summarized in Section 5 with details in Reference 5. Studies related
to Ku-band modulation formats are discussed in Section 6 with details in
References 6 and 7. Coding and decoding considerations for the 50 Mbps
Ku-band link are also considered in Section 6.
(
2
2.0 MOTIVATION
Depending on the particular mission and the phase of the mission,
the Space Shuttle will utilize either the S-band or the Ku-band communi-
cation links. The S-band communication can be carried out either directly
between the Shuttle and the supporting ground stations such as the Space
Tracking and Data Network (STDN) or via a tracking and data relay satellite
system (TDRSS). The Ku-band link, however, will be established only via
TDRS and will provide the Shuttle with a wideband capability during the
"on-orbit" phase of the mission.
Because of restrictions placed on the antenna dimensions and RF
power limitations at both the Shuttle and the TDRS, the S-band link will
have to operate at Es/N0 values of less than 0 dB. In fact, the threshold
design point for the forward S-band link is at E /N O = -5 dB. This implies
that particular attention must be paid to the design of this link to obtain
maximum efficiency. Coding, burst error correction, and an optimized
demodulator must be employed. These techniques, of course, are also
applicable to the Ku-band link. Coding has been extensively analyzed and
documented as a part of an earlier effort (References 8 and 9). Convolutional
encoding and Viterbi decoding has been recommended and accepted as a
technique for improving bit error probability of the weak links. This tech-
nique, however, while providing improved signal margins, has a side effect
of generating error bursts which are particularly deleterious to the opera-
tion of the command portion of the S-band forward link. Consequently, the
purpose of the studies summarized in Section 3 of this report was to develop
a burst error correction scheme to protect the forward link commands
against this type of error.
Because all of the S-band and most of the Ku-band digital channels
utilize phase-shift keyed (PSK) suppressed carrier modulation, either a
squaring or a Costas loop must be used by the receivers for carrier tracking
and data recovery. Of the two loops, the Costas demodulator is generally
Up to 1 Mbps on the forward links and up to 50 Mbps on the returnlinks.
3
the easier one to implement, and hence this type of demodulator is com-
monly used in digital data receivers. Similar to the squaring loop, the
Costas demodulator employs a nonlinear device--in this case a multiplier,
which results in a "squaring" loss. This squaring loss becomes a major
limiting factor when the E s/N ratio within the arm filter bandwidth of the
Costas loop gets close to 0 dB or becomes negative, which is the case with
a marginal link. The purpose of the arm filters is to prefilter the data
signals prior to application to the multiplier which recovers the carrier
tracking error from the data signals. Thus, it is evident that the efficiency
of arm filtering plays an important role in determining the squaring loss
generated by the multiplier.
Although a considerable amount of analytical work has been carried
out and documented on the subject of Costas demodulator performance, the
effect of arm filters on data distortion, which in turn determines the squaring
loss has not previously been considered in detail. Thus, the task summarized
in Section 4. 1 is specifically directed towards defining the relationship between
the arm filter bandwidth, the roll-off characteristics, the data rate, and the
squaring loss. The specific case considered is that of Manchester data. As
a result of this task, the arm filter characteristics which minimize squaring
loss are established for a Costas loop. The results are particularly useful
for optimizing threshold performance of the Costas demodulators used for
the Shuttle's S-band and Ku-band links.
In addition to the optimization of the arm filters, a related study was
carried out to determine the effect of a bandpass limiter on the performance
of the Costas demodulator. Bandpass limiters, like automatic gain control
(AGC), are commonly included ahead of the Costas demodulator to restrict
the absolute level of signal-plus noise power applied to the demodulator and
thus to maintain the design point parameters of the carrier tracking loop.
However, because the limiter is a nonlinear element, it affects the
performance of the demodulator. Of specific significance is the perform-
ance degradation introduced by the limiter at low signal-to-noise ratios. As
a result of this additional study task, quantitative data useful for Shuttle

4
link receiver optimization are derived. The results are summarized in
Section 4. 2.
The investigation of techniques for microwave signal spectrum mea-
surement, as summarized in Section 5, was motivated by the requirements
to maintain tight specifications on spurious radiations of the S-band link
transmitters. Several experimental approaches are described, and the
technique involving a commercially available test set is recommended.
Ku-band link modulation techniques are still under consideration.
The most probable candidate for digital transmission is quadriphase multi-
plexing of two, and possibly three, digital channels. Interplex and similar
techniques have been investigated and their capabilities and limitations have
been defined. The techniques considered are summarized in Section 6.

5
3.0 SUMMARY OF BURST ERROR CORRECTION FOR THESPACE SHUTTLE COMMAND CHANNELS
Up to now, the requirements on the command channel have been that-2
the probability of command rejection, P , be less than 10 and the proba--18
bility of false acceptance, Pfa' be less than 10 These requirements
were easily met with a (127, 50) BCH command code and an error detector.
A study was initiated to see if there was some method to decrease P withr
no increase in signal power. The detailed results of this study are given
in Reference 1.
The uplinks or command links considered were from the STDN,
SCF, and TDRS to the Orbiter. The last two of these links output error
bursts into the command word so a burst error decoder was chosen over
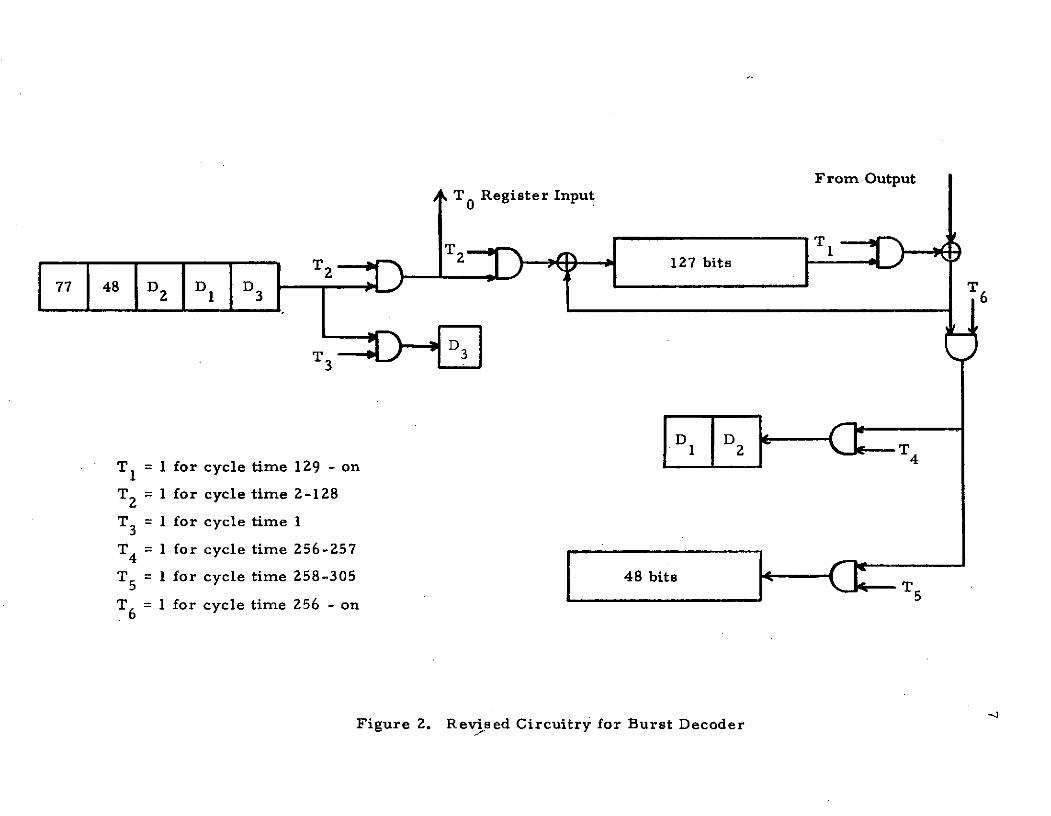
a random error decoder. A burst decoder was derived for cyclic codes;
the implementation of such a decoder for the (127, 50) command code is
shown in Figures 1 and 2. Note that this decoder is only slightly more
complex than the error detector.
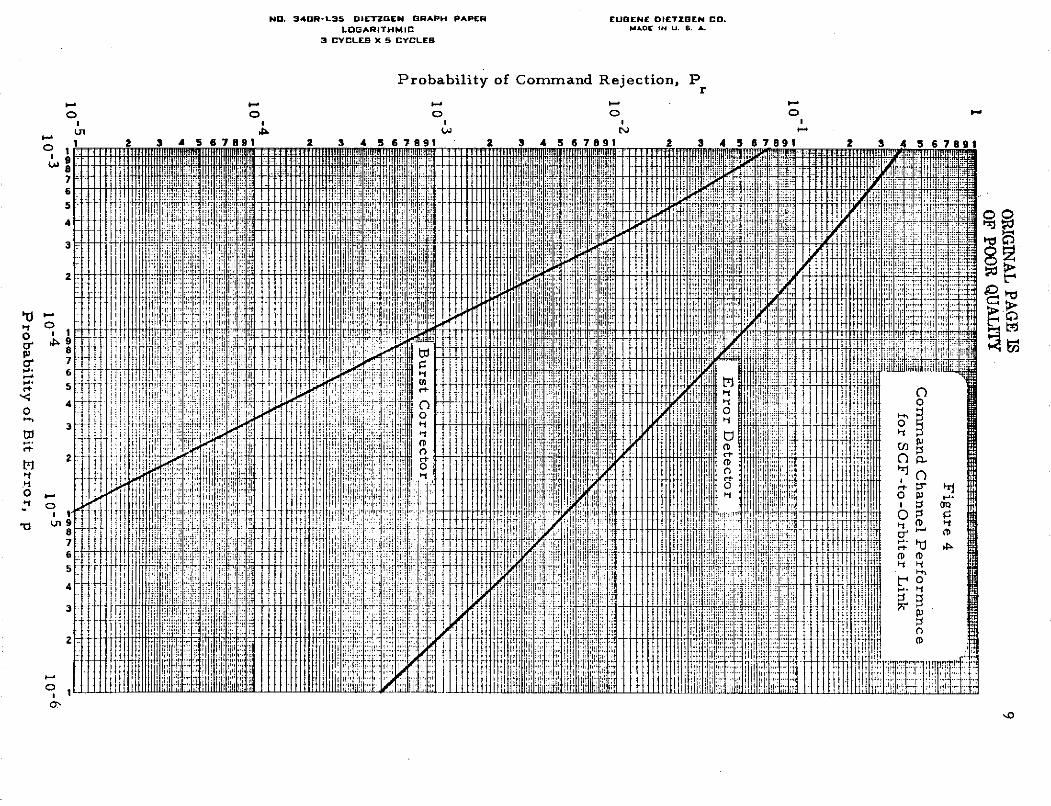
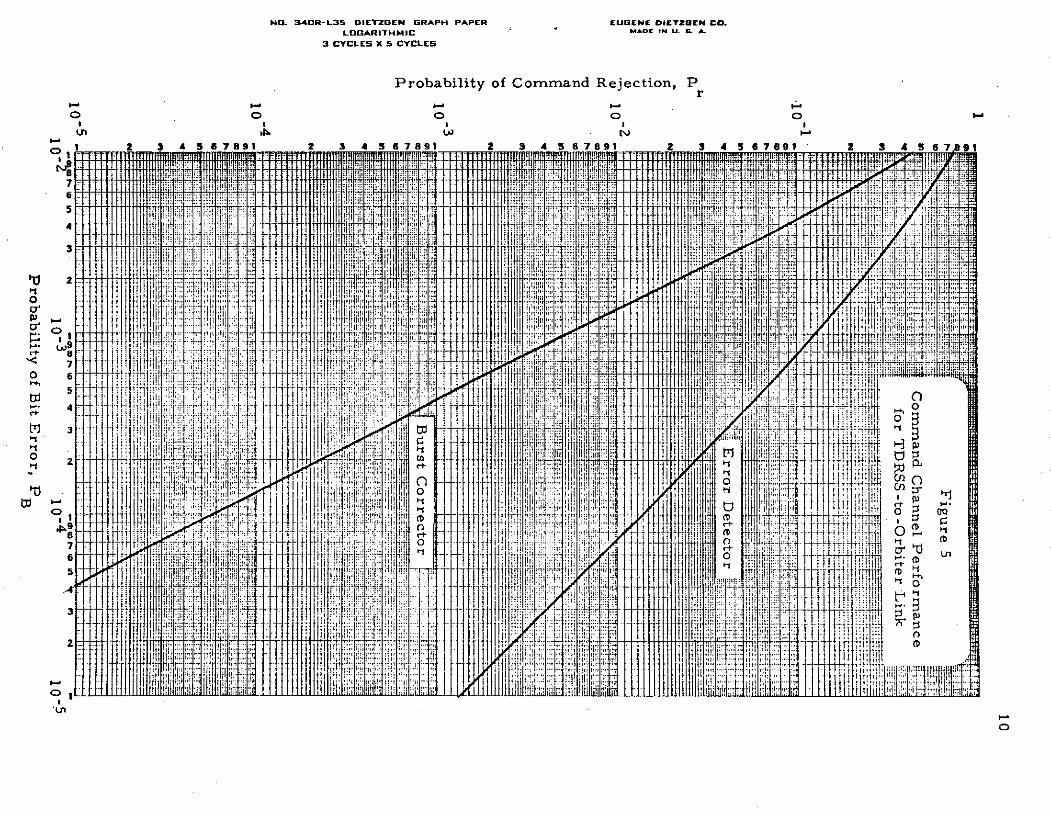
The command rejection performance of the burst decoder and the
error detector is shown in Figures 3, 4, and 5 for the three S-band links.
The performance increase is at least two orders of magnitude. The prob-
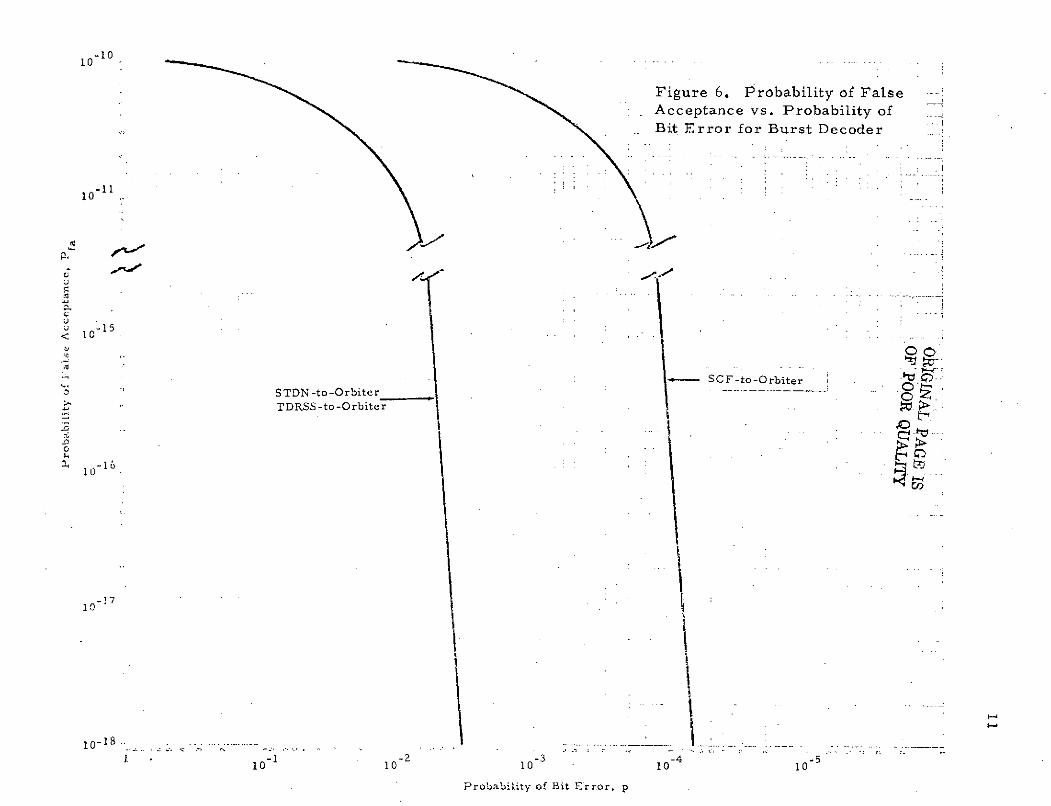
ability of false acceptance performance is shown in Figure 6. Note that
the 1018 requirement can be met at reasonable bit error rates.
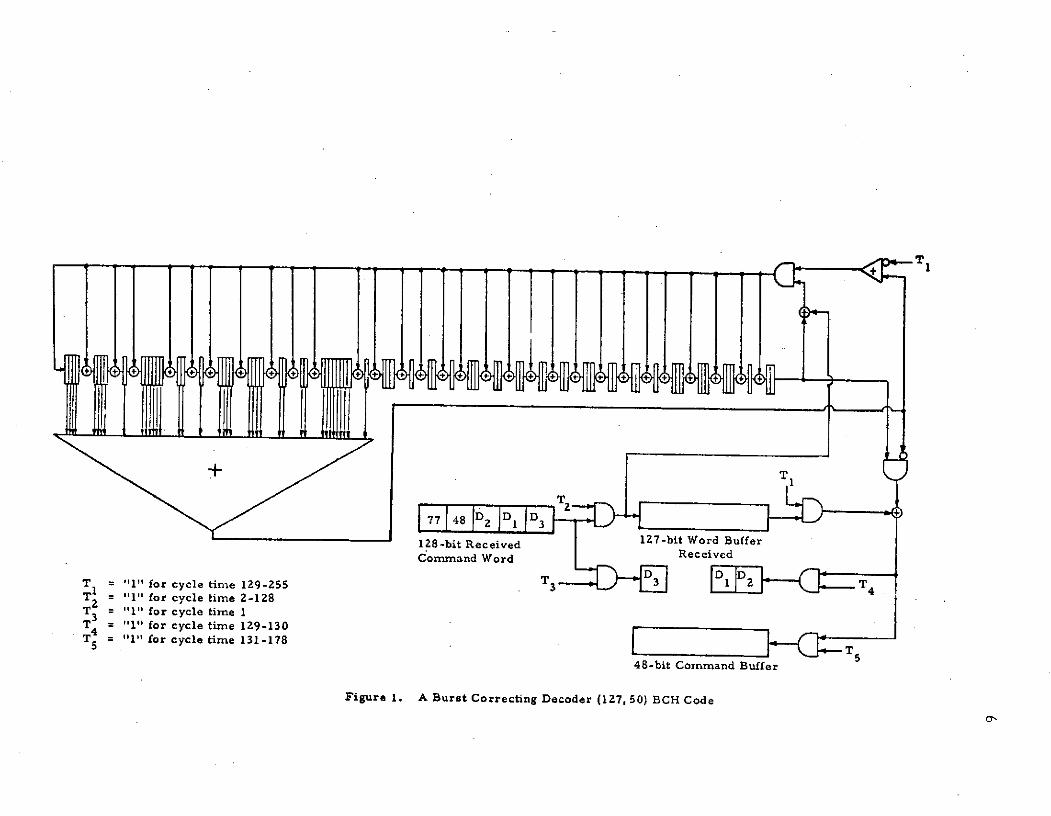
1
TTz
77 48D2 DI D3
128-bit Received 127-bit Word Buffer
Command Word Received
T = "1" for cycle time 129-255 43 4.
T 2 = "1" for cycle time 2-128T 3 = 111" for cycle time 1T = "1" for cycle time 129-130T5 = "1" for cycle time 131-178 T
48-bit Command Buffer
Figure 1. A Burst Correcting Decoder (127, 50) BCH Code
From OutputT O Register Input
T2 T
TT
T 2 = 1 127 bits
77 48 D D D T2 1 3 6
T1 D2T, = 1 for cycle time 129 - on4
T 2 = 1 for cycle time 2-128
T3 = 1 for cycle time 1
T = 1 for cycle time 256-257
T 5 = 1 for cycle time 258-305 48 bits 5
T = 1 for cycle time 256 - on
Figure 2. Revised Circuitry for Burst Decoder

NO. 34R-L35 DIETZGEN GRAPH PAPER EUOENE DIETZOEN CO.
LOGARITHMIC MAIDE IN U. S. A.
3 CYCLES X 5 CYCLES
Probability of Command Rejection, P r
I.- I.-o o 0 o o
01I 2 3 A 5 67891 2 3 4 5 67891 2 3 4 5" 67891 2 3 4 5 67891 2 4 5 67891
6 - T 4 iu H-, 1 1 I jI I I .i.N9
til 1111 .jI I~l "Pi -TT !11 -*Q1'~ ti -1 tIt I
5-.. .... TitlH:4
ifIII t1 ii n 11 H TW IM] II 03
J -1! l, t1 !lppl
-- i j]j , ,
7 t ilI : : 1:- 1 i I'.
'I 0
i<: 5 i!L! :il ...
5 0lililii !iii~ i iii0 f i: o l uT
4l o
0; 3I' ! 1 ll l ;i ',',:. 'I " r ," !T'lll
iVI! C+ ltv a L) I
2 if IN 401; C
'EI(Da (Dit T C+
~9 Wi "; P
7 :
6 -1 Ir
fill i , Ii, a
Ti vu,
;jji i.4 fl '1'iiI ii~
2 F, i: f i: ii;i n il
t il 1 ,1,11n fli' -
C ~ jjj :00
NO. 340R-L35 DIETZGEN GRAPH PAPER EUOENE DIETZGEN CO.
LOGARITHMIC MADE IN U. 6. A.
3 CYCLES X 5S CYCLES
Probability of Command Rejection, P r
I I I I
W N, 2 3 4 5 67891 2 3 4 5 6 891 2 3 4 5 67891 3 4 5 6 7891 2 5 67891
iiNr I Hir:: w
H I M 1i 111111111__l! I P i;T3 I 1 11 1 1T__IIII I9
4+7 : s I 14 114 1
:I: M ti.! E5 li- "s.:
i iiS ! .. . ... f
10; iff ! .........
It +++++++++++Iiit
.l- i/ ilttl i iiiiiiii I : iili4i4 ............ 1 ......Ull " H 4 ii
"0~J ' t-"]. ... ..
8 i + +!: Iii!iliIt i :';i!
i: 7V. 4 1i + .........5 41 .-t tN4 I .1 111 w l
0
300
I J.' Oita0
if t I,
541;ii :1V t7' 0fti
3 i u. IL141if! i t If! pvj
:X (D
2 : lit
L 141 i ticr. ,llii r
NO. 340R-L35 DIETZUEN GRAPH PAPER EUGENE DIETZGEN CO.
LOGARITHMIC MADE IN U. 6- A.
3 CYCLES X 5 CYCLES
Probability of Command Rejection, Pr0 0 0 0 i
I I I I I
S2 3 A 5 6 7891 2 3 45 6 7891 2 3 4 5 6 7891 2 3 4 5 6 7 91 2 4 5 7 91I FT I. M .7TM i F! "lTHl I II ... ..
of.; it; i .f]f [f iX . it il nll l
I-' Iu Ii 4 I ,'
7 .t-r 1
2II 4 I Ihh#; #T I : ...... 1 . T .... 1.25 T
41 iTf !i :i
2
8 lii i ., s+2f!i ". ......
7I
5 "i ":W I'ItI oi-4 ii i0tii !ii iii
T1IL,
lit l, !Vr(D (D
87-C:I ~I, ,,I,, i iLnliilji c
10- 1 0
Figure 6. Probability of FalseAcceptance vs. Probability ofBit Error for Burst Decoder
10-1110
v 0-15
-II-< 10
STDN -to-Orbiter .STDRSS-to-Orbiter.
10-16 t
t79-4
10
10-1 -"
I 10-1 10-2 10-3 10-4 10-5
Probability of Bit Error, p
12
4.0 COSTAS RECEIVER PERFORMANCE CONSIDERATIONS
4. 1 Summary of "Optimum Performance of Costas Type Receivers"
This section addresses several problem areas associated with the
design and optimum performance of suppressed carrier tracking receivers.
In particular, the design of a Costas loop with both active and passive filters
in the loop arms is considered for the case where the usual restrictive
assumption that the arm filters are sufficiently wide to pass the data mod-
ulation undistorted is not imposed.' This leads to some new and important
results concerning the optimum choice of arm filter bandwidths and spectral
roll-off. Use of the results in a design lead to the most noise immune loop
that can be constructed using passive arm filters.
Since the MAP estimator for the signal phase is a Costas-type loop
with integrate and dump circuits in the arms when symbol sync is known,
the noise immunity of the approach is derived and compared with that of a
Costas loop containing a variety of passive arm filters. In fact, in the region
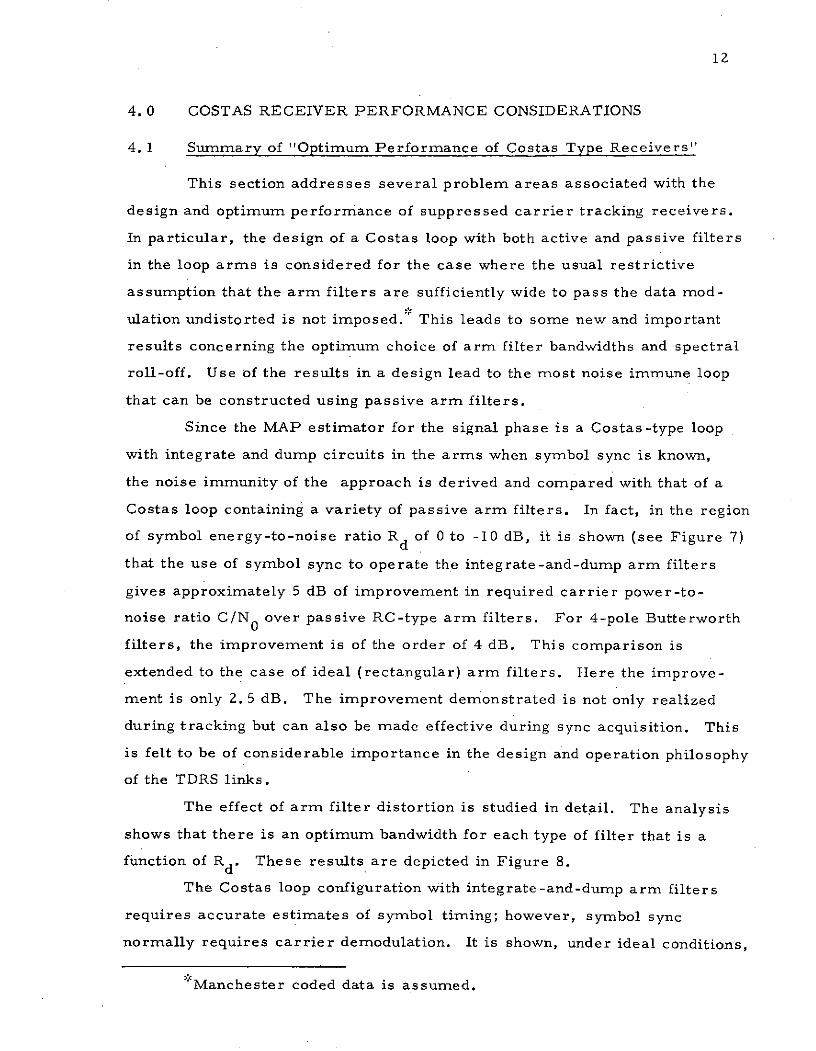
of symbol energy-to-noise ratio R d of 0 to -10 dB, it is shown (see Figure 7)
that the use of symbol sync to operate the integrate-and-dump arm filters
gives approximately 5 dB of improvement in required carrier power-to-
noise ratio C/NO over passive RC-type arm filters. For 4-pole Butterworth
filters, the improvement is of the order of 4 dB. This comparison is
extended to the case of ideal (rectangular) arm filters. Here the improve-
ment is only 2. 5 dB. The improvement demonstrated is not only realized
during tracking but can also be made effective during sync acquisition. This
is felt to be of considerable importance in the design and operation philosophy
of the TDRS links.
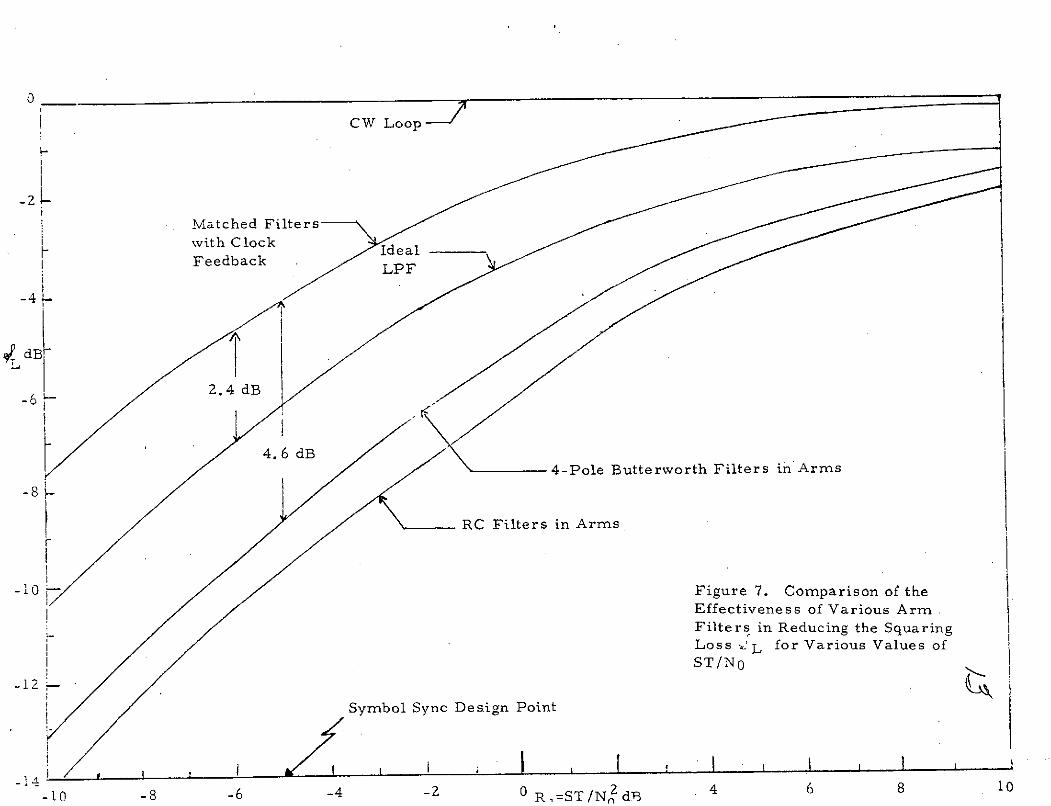
The effect of arm filter distortion is studied in detail. The analysis
shows that there is an optimum bandwidth for each type of filter that is a
function of Rd . These results are depicted in Figure 8.
The Costas loop configuration with integrate-and-dump arm filters
requires accurate estimates of symbol timing; however, symbol sync
normally requires carrier demodulation. It is shown, under ideal conditions,
Manchester coded data is assumed.
CW Loop
-2Matched Filterswith ClockFeedback
LPF
-4 L
dB
2.4 dB
-8
RC Filters in Arms
-10 Figure 7. Comparison of theEffectiveness of Various ArmFilters in Reducing the SquaringLoss - L for Various Values ofST/NO
-12
Symbol Sync Design Point
-10 -8 -6 -4 -2 0 R,=ST/N2dB 4 6 8 10
One-Pole _
Butterworth
Four-Pole_Butterworth
Ideal LowPass Filter
Figure 8. Ratio of Optimum Bandwidth to SymbolRate versus Symbol Energy to NoiseRatio, R d .
d'
-10 -8 -6 -4 -2 0 2 4 6 8 102 10
15
that symbol sync can occur prior to carrier acquisition. But further work
is needed since neither the effect of inaccurate clock timing nor IF filtering
which can produce intersymbol interference is considered.
4. 2 Summary of Design and Performance of Costas ReceiversContaining Bandpass Limiters
This section addresses several key questions and gives various new
results in the design of a Costas tracking loop preceded by a bandpass
limiter (BPL). The BPL is required to control the signal amplitude at
the loop input during carrier acquisition when the coherent AGC is not
operating properly.
As in the previous section, the squaring loss of the combined BPL/
Costas loop was derived assuming a hard limiter, and optimum arm filter
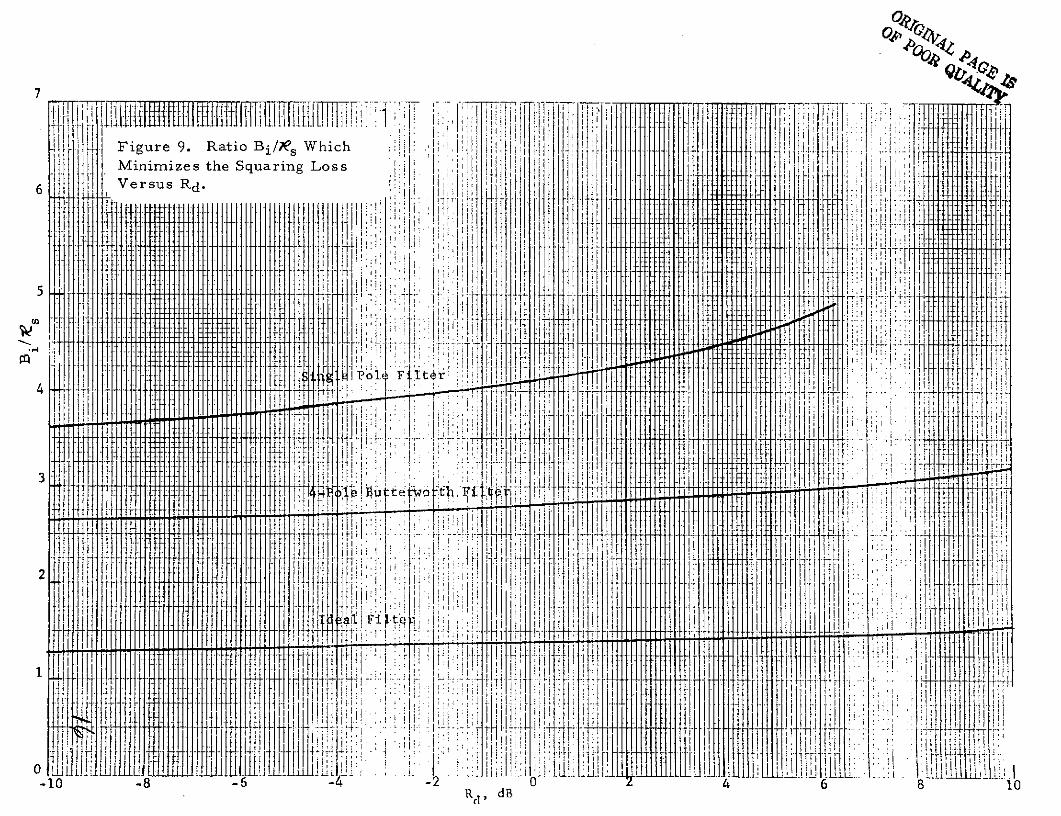
bandwidths were found." This result is shown in Figure 9, and we note that
these bandwidths differ from those computed for a Costas loop without a
BPL. The minimized squaring loss for the BPL/Costas loop is considerably
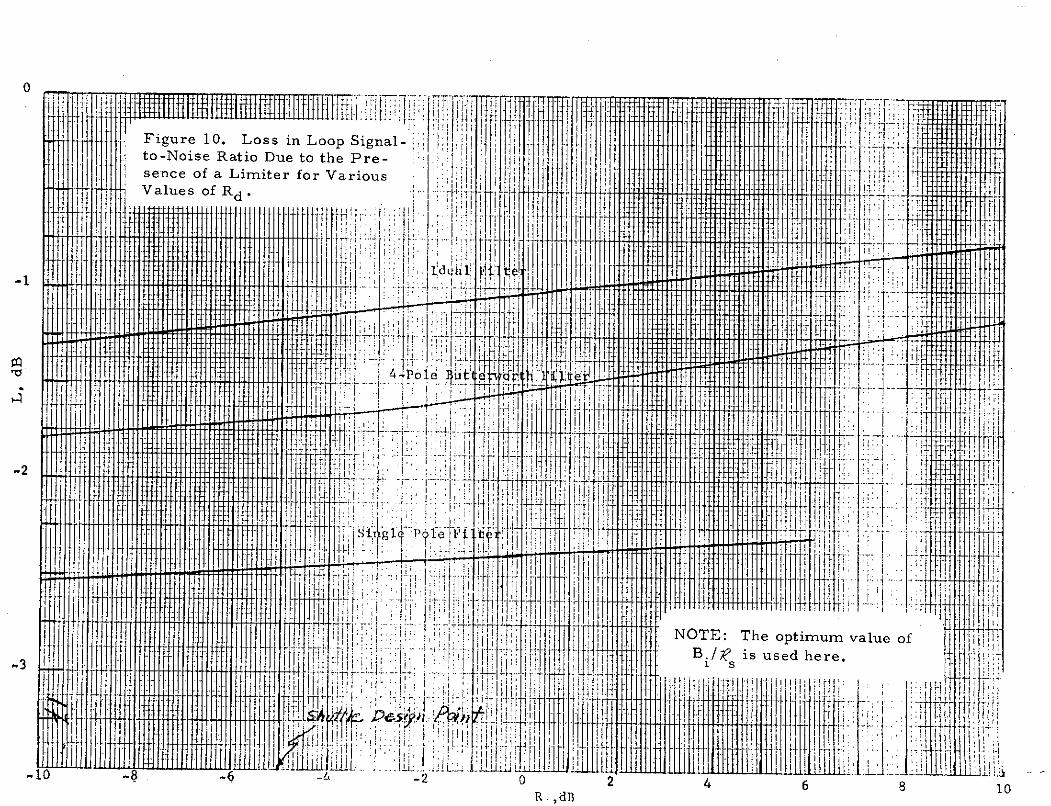
more than for the Costas loop alone. The addition loss due to the BPL is
shown in Figure 10.
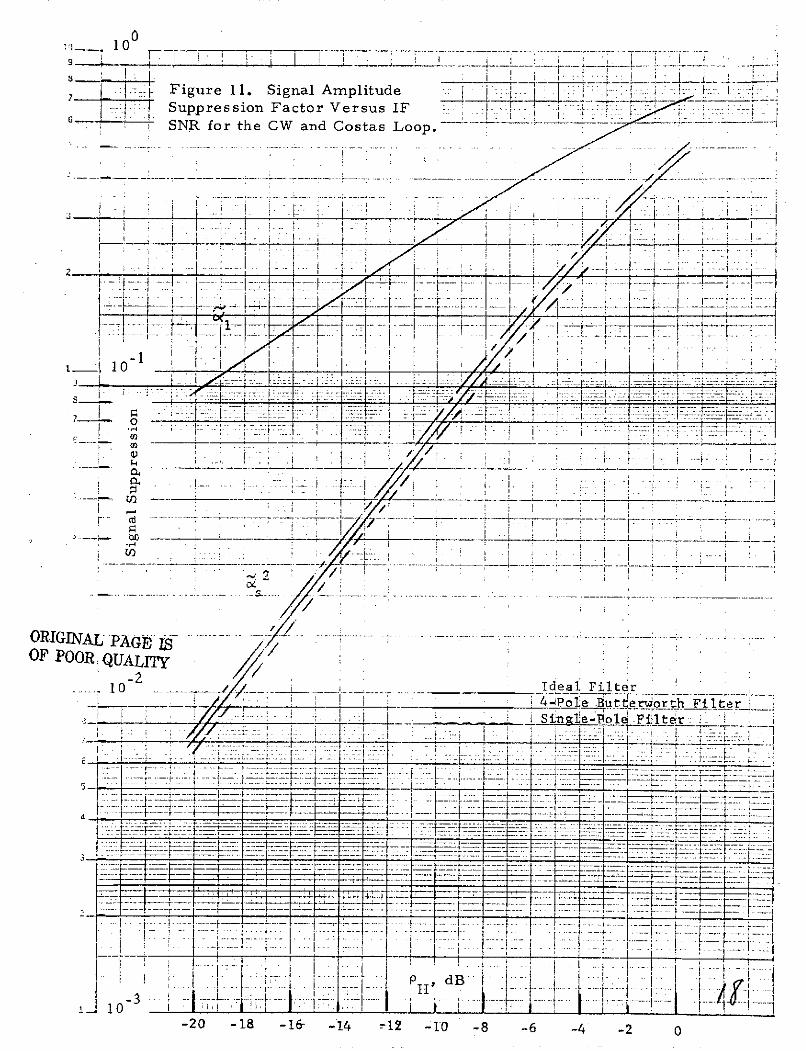
A new expression for the signal amplitude suppression factor due to
a BPL preceding a Costas loop was derived and compared to that for a phase
locked loop, as shown in Figure 11. Figure 12 shows the variation in loop
bandwidth with signal level due to the signal suppression phenomenon.
Manchester encoded data is assumed.
I~ ~ ~ ~~~~i ii ! i-- i i "- ...'..
Figure 9. Ratio Bi/,Vs Which I iMinimizes the Squaring Loss i iVersus R d .
+
. . ,! i.' t -
i * ! , i i/
i-1+
0 I t 'C
4I
I l i I
,; . . .. . . . L-!- i '-. i :-.-
.- . , r l i
I~ I .' i iI
III' I Ii ,.ii
t.iil ifitff f-i! :I!; N~
I0 -8 -5j -, .... F -2. -6!._.
- I0
+R , d B
W; TM
-10 -8 -6 2 R li- dB 4 6 8 10
777- --- I--- .;; .i .... . ...
Figure 10. Loss in Loop Signal-i : :
~l~ ,i I', !#-I
to-Noise Ratio Due to the Pre- . . , :jl2f sence of a Limiter for Various 'H-1 to N ois Ra io D e to the 1~reI
'Values of Rd. -:I .. i
r J! :+-H 4'- li
SI 1 - + -
. T, , -- it
- z ,i' Iii: i"i ... Ki "
IT I-
4 , I-HK 4 i;!" i l
-4 -i R.-i
-2*.Krd
,ii iiI Iti1- IIt i 'I~ I '
TI .,, i' NOTE: The optimum value of:-
i. ..4 . l
H; " {'fj'jt:'B./ is usedhe .tiK ii j- h re-. Ii:
7 ",""7.1 'ti-i ... .~ u.
£.a : ei
[FOl vt-y~ II iT :-
-I0 -• -.! - L . i-2 f4j !0t1~tI[{ I
ilR. ,
ii iii
T Tr 1! ITi
-I lit 1u x jit -IT 1
1J i. i;-r1 - It f i f! 1.-:-
; 71 NOTE: The o p tim urn valu ofi 11 -i ._i. .i:i lB le s use here T 1
Jil. I- it L _ .1 ; 1L _': _ - I i - ; LL-1 0 -2 0 2 4 6 8 1ii.' L.. ~i I~1 ': f r iIi i 1 :iR ' I' dB''
10:J~ ~ ~ ~ ~ ~ ~I o .. !2 T .... i _ . -~-T-- .... ' - -- -- i' ......................... . . ..... ............ ' .= ............ ~ ! /__ ' ........ : "
. -i Figure 11. Signal Amplitude 7 7 7i 7:-- i - . .. .I Suppression Factor Versus IF
.. " ; iI.! - - i ,: "' " ,'-SNR for the CW and Costas Loop. _ -- i- - ....
- _ ._ ".~. _. ". _ ..... " ..... --4 -- i..~ . .. . l ... .. .
- - ------ ---- ------
2 - i i _ ii " .- , . i ,. - i ' / .. i ..P ... - - : - L = _- .~~~~___ 4 _~--~ -"!-
t 10
... . ... ! ~ " -: . ..- " ..... i .. ' " i :- !r i - - -- , !---- '! --- -- !--~ . ...i- ' - -I ' ' : .u i
oI
_ _ _ _ _ _ _ _ _ _ _ _ __ I, f - ii t
iL i_ _ I- -" i7 7 - '/ t". 7
-2 -~ ~ --- I . 4- o e Bu-r o th F l e
._. ... .... r-- .... : -- - ,. .. . t. . _ __- - : -- .. -- . ... . . ..... .. ......
. : . L I _ _ _ _ _ _ _. 1
,i . -' I
t i 10i : - - : -= -:: -; --- -- l :- : --- iil - I: - ir: : -t ( ....b - -_-, .X Z . ..I.... .. - = -- .::_ .I= = _-= . -.- . - .-.-- ---.- ' " i: =; ".-. . .' . . -... - ......
s- .-- -4-b-
-IT
- ------ --------- . . . -----------i7 i- .
" i v~i ....~ .. ... ~ _. _ I . I- - _ _ . . . . . _ _ _ _ _ . . ..
....------ "---- --- ---- -. ..... -- " -
r- -
... I
-20 -18 -16 -14 -12 10 -6 -4 -2 0
-... ~~:/ -._ ....... r .._. _ _. . _ . ............... I '- ----- --- - -OR GN AL PAG E ID ............. 7/- -1-- : ... .. ...... -- .... : _ 7 _. ...... i....- ....'.... ...OF POORt QUALITy/ " !" '
... 0 - /,/ " Ideal Filter ! ' " '-'F--I- . . .. .- I.---// ,-7. , , ! ' d : ,4-Po e But~t erw or h Fi t r
i:.-. I -- _.:. _i ( / 77 T :- - i._. : . _I~~I .... ,:i. .
- ... --- .... .. -- - [1--- ~- ....-- --..~~~.. .. .. . .. . ... ...... ... .. , .... .. ..b - , . . . .. . .. . . ... . .... .. ... ... .. . . .:- --- ..... ! -- i--- .. . .. . .... : :-_ ;.... .. . . . . . . ... . .. . . f= .. ..t . . - .. .. .. . ._ .. .. .. . . . . . . . t _ _ .. ...... ... .. .. .
' ,' ,- .... r...... .... 1 . .
!_--r- I---~---~--I-~--~- -- I---t-- !---I i i-- - ----- -- 1 -------I i - 20 -18 -l --- 1 I0- -8ri -6 - - 0-

-7-1 _ __ - - .. Z . . ..
- Figure 12. Variation of Loop ___ Bandwidth with Signal Level for _- :-- ----
SOptimum Values of B./ ::....
1 . _-..... ... ..
, H ...... ........ -- i--= 1- T? -, ---- :. -..- - :. 7.-- I -. . .. .-- - --. ,- , . -, ~ .. - , ..
7_ _ E:;.-:--=-- -:--=:---- = ......... ... -f- : T'- =--__~_-_i :t : = -== r -: =_ __:= ~_~.-I= : ::- : : ==.r: = -,-===-:_:-
4
0 ----------- -
L . .. . .) - --- _ .. S_ _ ,,_ .
1 3 - --- ---i
7-
..J. ,<---ss-z-:.:. .:vs... . -.- - -.... -..... .. . -. ...... - ..
-- .- . er - - - --, - i -.---- --.- - . . --- - '-- ---- .--- - ----.--- - -- - --- -
4--- -- -
-- -- . -.
- --- i--- - -r - - -
2-4
I t I
B _B
L Lo -
'-i10
2 _ V,-7 -- ___
7 _ c- - -W
0 Rd dB
i :P .--- u- -:- L. - ..-? . E : - U:_ L.--== -- :=P :-_-:=-- ._-.:d-:1 0... ... . . -= : = : = =--= =
: : - = = : = = - = - -b - = = : - = - ' ''" " -=" = :- = '= : : --- "" - := 2- =--.= 7 - -'
-8' -4 ::- ":... ========= = ==R====== ==== ====d=== ==== ==== = dB== = = 0 4: : : : .:_ C :..: W2 :__2._ .. .. . .
20
5.0 SUMMARY OF EXPERIMENTAL TECHNIQUES FOR MEASURING
LOW LEVEL SPECTRAL COMPONENTS OF MICROWAVE SIGNALS
The requirements placed on spectral purity of Space Shuttle micro-
wave communication transmitters demand control of spurious radiations.
In addition to the noise floor resulting from the multiplication of crystal
oscillator output frequencies to microwave region, various interfaces
between equipment subunits may result in discrete spectral components.
Although very small, these components may exceed the specification placed
on the systems performance.
The dynamic range and frequency resolution limitations of conven-
tional frequency-swept spectrum analyzers generally preclude the use of
these instruments from detecting extremely low level spectral components
of the microwave transmitters. Consequently, specialized techniques for
measuring spectral purity of the microwave transmitter must be devised
to test the compliance of any particular system with its specifications.
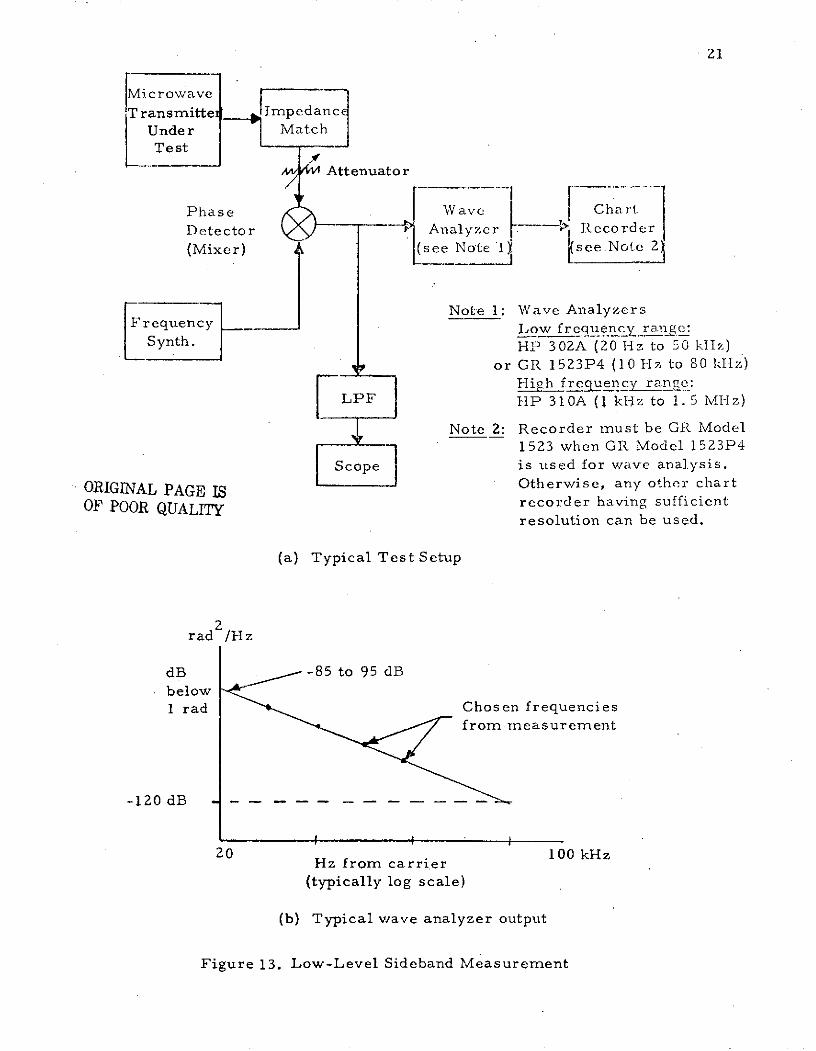
One of these specialized techniques involves the translation of the
microwave RF spectrum to baseband. The translation is accomplished by
mixing the RF microwave signal with a clean CW signal whose frequency
is either exactly equal to or is offset by a certain amount from the carrier
frequency of the measured signal. The resulting baseband spectrum is then
investigated by a low frequency wave analyzer whose output, in turn, can be
displayed on a chart recorder. A typical test setup and a corresponding
hypothetical spectrum are shown in part (a) and part (b) of Figure 13,
respectively.
The limitation of this technique is that it requires a very stable
reference oscillator and a phase detector (mixer) which is linear over the
dynamic range of signal fluctuation expected from the test signal.
An alternate technique employs a phase-locked loop (PLL) for the
translation of the RF signal sidebands to the baseband. Because the loop's
voltage-controlled oscillator (VCO) automatically locks to the transmitter's
carrier frequency and average phase, the problem of matching the test and
21
Microwave
Transmittei ImpedanceUnder MatchTest
Attenuator
Phase Wave Cha rt
Detector - Analyzer -- Recorder
(Mixer) (see Note 1 see.Note 2
Note 1: Wave AnalyzersFrequency Low frequenc y range:
Synth. IHP 302A (20 Hz to 50 kHz)or GR 1523P4 (10 Hz to 80 kHz)
jHih freency rance:LPF HP 310A (I kHz to 1.5 MHz)
Note 2: Recorder must be GR Model
1523 when GR Model 1523P4
Scope is used for wave analysis.
ORIGINAL PAGE IS Otherwise, any other chart
OF POOR QUALITY recorder having sufficientresolution can be used.
(a) Typical Test Setup
rad /Hz
dB -85to 95dBbelow1 rad Chosen frequencies
from measurement
-120 dB
Hz from carrier 100 kHz
(typically log scale)
(b) Typical wave analyzer output
Figure 13. Low-Level Sideband Measurement
22
reference frequencies is eliminated. Furthermore, phase and.frequency
fluctuations whose rates fall within the bandwidth of the PLL are tracked
out. This takes care of long- and medium-term frequency drifts.
On the other hand, phase noise and spurious frequency components
which are outside the tracking loop bandwidth appear at the output of the
phase detector of the PLL and can be applied to the input of the baseband
spectrum analyzer. Assuming that amplitude instabilities of the transmit-
ter's output and of the test equipment are extremely small, the phase detector
output will contain only the components due to frequency or phase jitter, or
both.
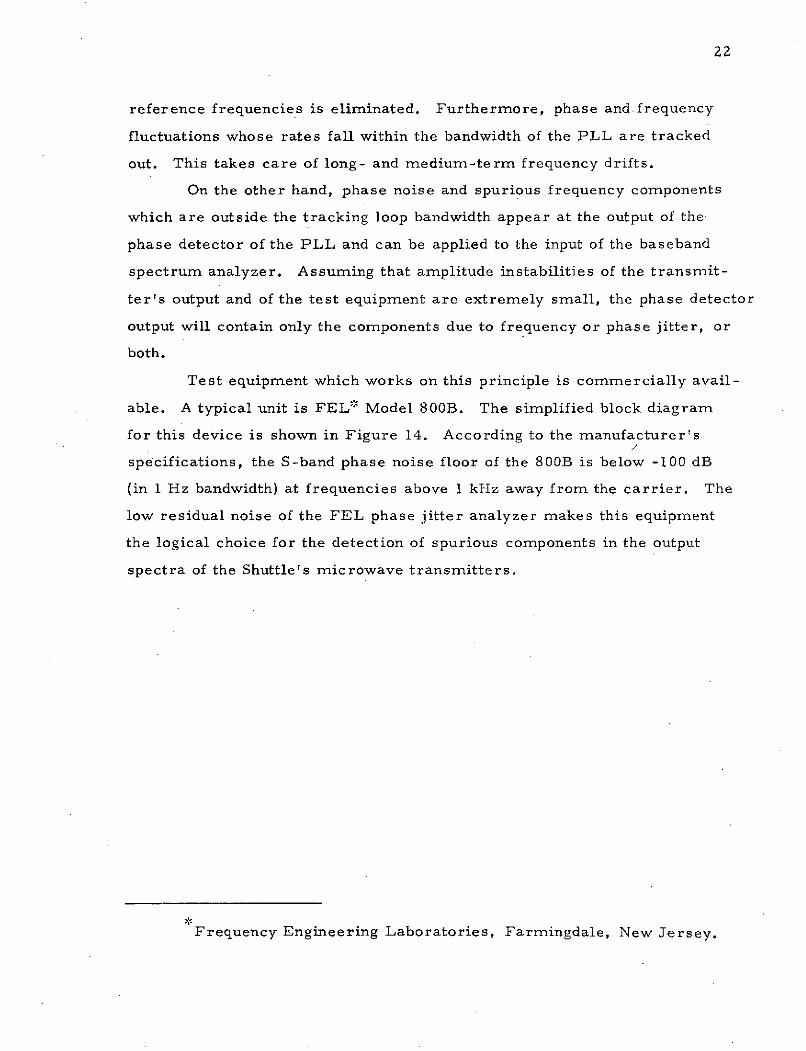
Test equipment which works on this principle is commercially avail-
able. A typical unit is FEL* Model 800B. The simplified block diagram
for this device is shown in Figure 14. According to the manufacturer's
specifications, the S-band phase noise floor of the 800B is below -100 dB
(in 1 Hz bandwidth) at frequencies above 1 kHz away from the carrier. The
low residual noise of the FEL phase jitter analyzer makes this equipment
the logical choice for the detection of spurious components in the output
spectra of the Shuttle's microwave transmitters.
Frequency Engineering Laboratories, Farmingdale, New Jersey.
/ SCOPE ORII \ nRECORDER
SCUNDEATOR MIXER IF PHASE ADJ LOOP
TEST I AMPLIFIER DETECTOR FILTER
EXT LO -
COMB GEN 8 MHz TUNABLE---- - VX CO -MULTIPLIER XTAL OSC
FIGURE 14. 800B SYSTEM BLOCK DIAGRAM
24
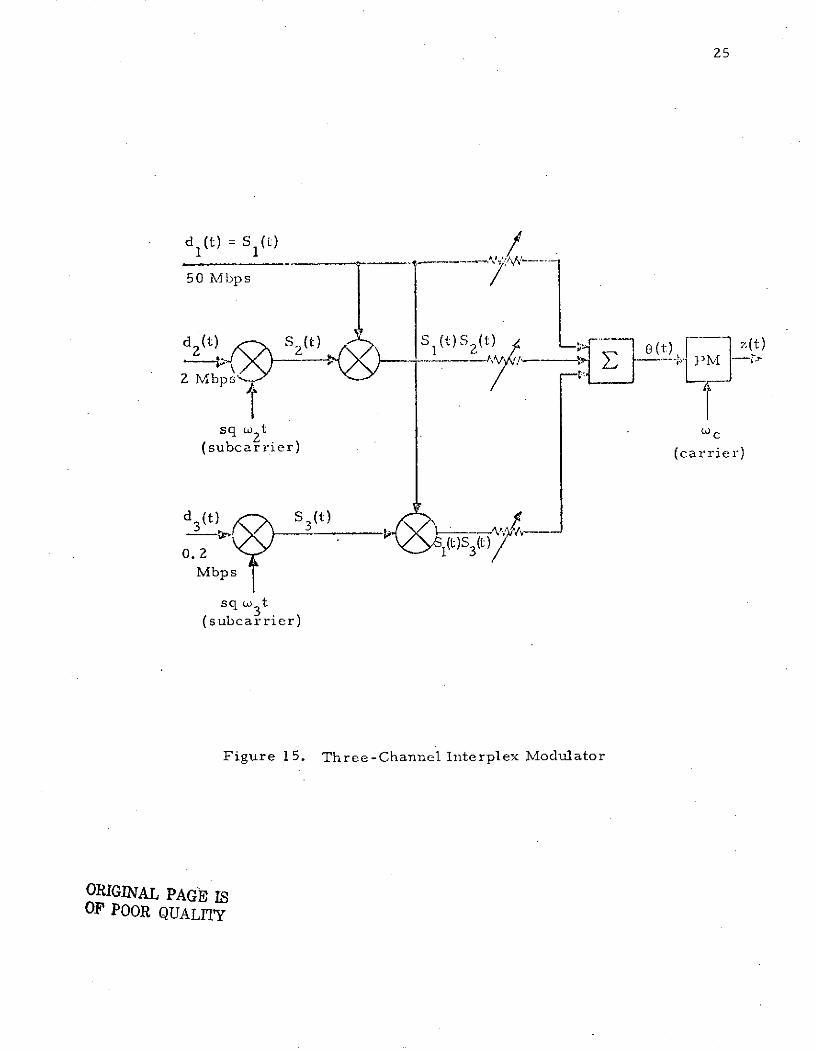
6. KU-BAND RETURN LINK MODULATION TECHNIQUES
6. 1 Summary of Feasibility Study of an Interplex ModulationSystem for the Orbiter's Ku-Band Link
The requirement for the Orbiter's Ku-band return link calls for
simultaneous transmission of at least two independent data channels, one
having a rate of up to 50 Mbps and the other having a rate of up to 2 Mbps.
It is also desirable, if feasible, to transmit a third data stream of opera-
tional data at a 192 kbps rate, in addition to the aforementioned data streams.
Because these three channels have different clocks, they cannot be trans-
mitted by time division multiplexing without employing a complex reclocking
scheme. Consequently, other modulation techniques involving phase multi-
plexing and use of subcarriers must be considered. Interplex is one of such
potentially applicable techniques.
The advantages of Interplex modulation as compared with conven-
tional phase shift multiplexing is that it minimizes the amount of RF power
wasted as intermodulation products and it also provides, under certain con-
ditions, for complete suppression of the carrier component, thus allowing
more power to be placed in the information-bearing sidebands. In this
report, the analysis of a three-channel Interplex system was carried out to
determine whether three data channels can be transmitted simultaneously.
The modulator and demodulator for such implementation are shown in
Figures 15 and 16, respectively. As shown in Figure 15, two lower rate
data streams are bi-phase modulated on two separate subcarriers and the
modulated subcarriers are then modulo-2 added with the high rate data
stream. The composite signals are then summed and applied to a phase
modulator.
For maximum suppression of the carrier and intermodulation com-
ponents, the high rate data stream modulation is assigned the modulation
index of ±90 degrees, i.e., antipodal modulation. The phase modulation
angles for the remaining channels are then assigned according to the rela-
tionship en = tan 1 an , where a = P /P is the ratio of the power in
25
d (t) S ( t) 0 .
50 Mbps
sq w2 t wc(subcarrier) (carrier)
d (t S (t)33
0.2 pt)S 3(t)
Mbps
sq w3t
(subcarrier)
Figure 15. Three-Channel Interplex Modulator
ORIGINAL PAGE ISOF POOR QUALITY
26
BM 1 S (t)
z(t) LPF 50 Mbps data
Ycos (wt +4)c
VCO 4_ Loop )M
90
j ZrZsin (wt + )
- LPF2
BM 2
SS2(t) d 2 (t)SFilter 2 Mbps data
sq w2tSC 3 S3(t) d 3(t)
Filter 192 kbps dataORIGINAL PAGE ISOF POOR QUALITY
sq w3t
Figure 16. Three-Channel Interplex Demodulator Block Diagram
27
the nth channel (n = 2, 3,... ) to the power in the "main" channel. In the
report, we have used the equal error rate criterion for all three channels
and thus the power allotted to the secondary channels was made proportional
to the data rates.
Because most of the signal power is assigned to the antipodal (bi-
phase) modulation, a Costas loop demodulator shown in Figure 16 can be
used for carrier tracking and data recovery. The secondary data channel
subcarriers are extracted from the lower (quadrature) arm of the Costas
loop and, after filtering, the data is recovered by re-inserting the appro-
priate subcarriers. Although some penalty is paid for not using the energy
in the secondary channels for carrier tracking, this penalty is generally
small, typically less than 1 dB if the combined power in the secondary
channels is at least 6 dB below the power in the primary channel.
When considering a multi-channel Interplex system, the crosstalk
between the channels must be taken into account. Of primary concern in
the crosstalk which is caused by the carrier tracking error. When this
error is present in the demodulator loop, the primary channel data starts
to appear in the secondary channels, and vice versa. However, for the
secondary channel power assignments proportional to data rate, the cross-
talk of the major channel into the secondary channel (worst case crosstalk)
is 10 dB below the secondary channel signal if the carrier tracking error
is less than 15 degrees in the numerical example presented in Reference 6.
With a properly designed loop, carrier tracking error can be maintained
below this value even for the worst case of Shuttle acceleration with respect
to TDRS.
Thus, the conclusion of the study is that, at least in principle, a
three-channel Interplex modulation/demodulation scheme can be mechanized
to accommodate the requirements of the return Ku-band link.
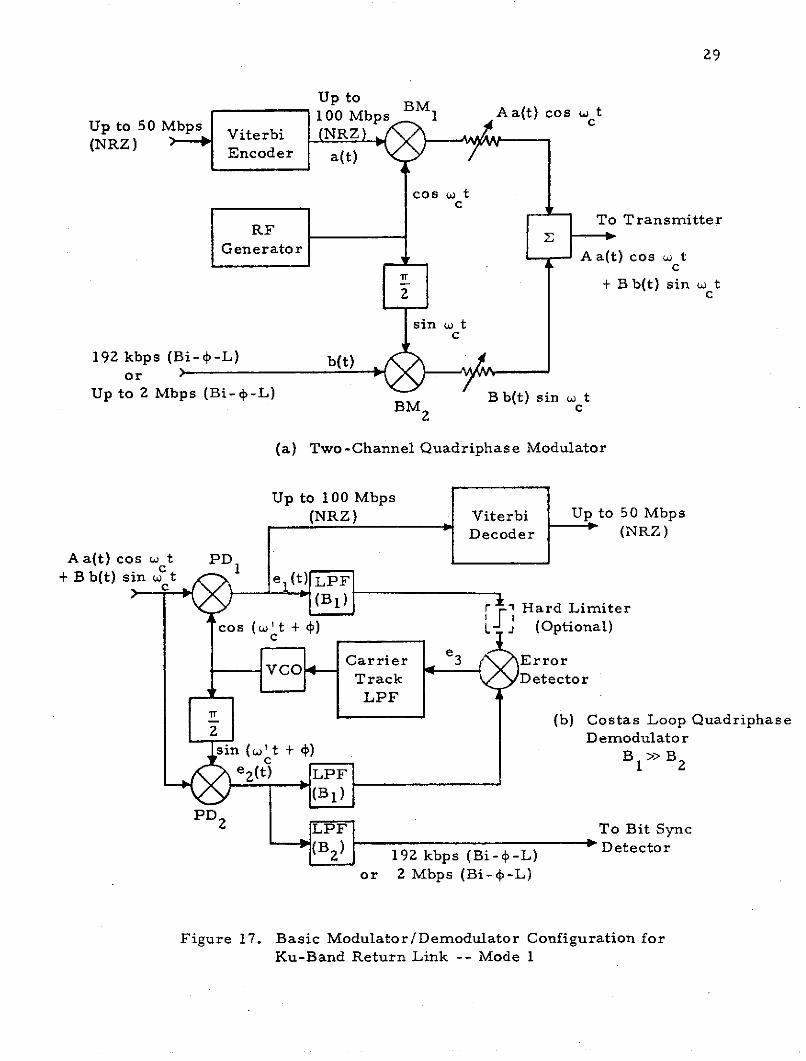
6. 2 Summary of Multiplexing Modulation Formats for theOrbiter's Ku-Band Return Link
Reference 7 considered various aspects of modulation format selec-
tion for the Ku-band return link. Specifically, the methods for modulation
28
and demodulation of return link data streams were considered. First, the
relatively straightforward problem of transmitting only two data streams
was considered. One possibility for achieving this is to use two orthogonal
components of a single carrier, with each component being bi-phase modu-
lated by its own data stream. The amplitudes of the two carrier components
are then adjusted for the required power division and combined to yield a
quadriphase modulated carrier. The rates of the two data streams can be
different and their clocks do not have to be synchronous.
If the power in one of the orthogonal components exceeds the power
in the second component by a significant amount, say by 6 dB or more, the
simplest way to recover the data and to provide carrier tracking is to use
a Costas loop demodulator. The demodulator then locks on to and tracks
the strongest of the two orthogonal carrier components. The basic modu-
lator/demodulator configurations for this scheme are shown in Figure 17.
With perfect carrier frequency and phase tracking, there is no cross-
talk between the two recovered data streams because of the orthogonality
of the two carriers. But if a carrier phase tracking error is present, cross-
coupling develops between the two demodulated data streams. In addition
to being a function of carrier tracking error, the crosscoupling is also a
function of power division between the channels and their respective band-
widths. In our study, we have considered the case where either the 192
kbps or the 2 Mbps data channel is quadriphase multiplexed with the 50
Mbps channel, the power in the 50 Mbps channel being four times the power
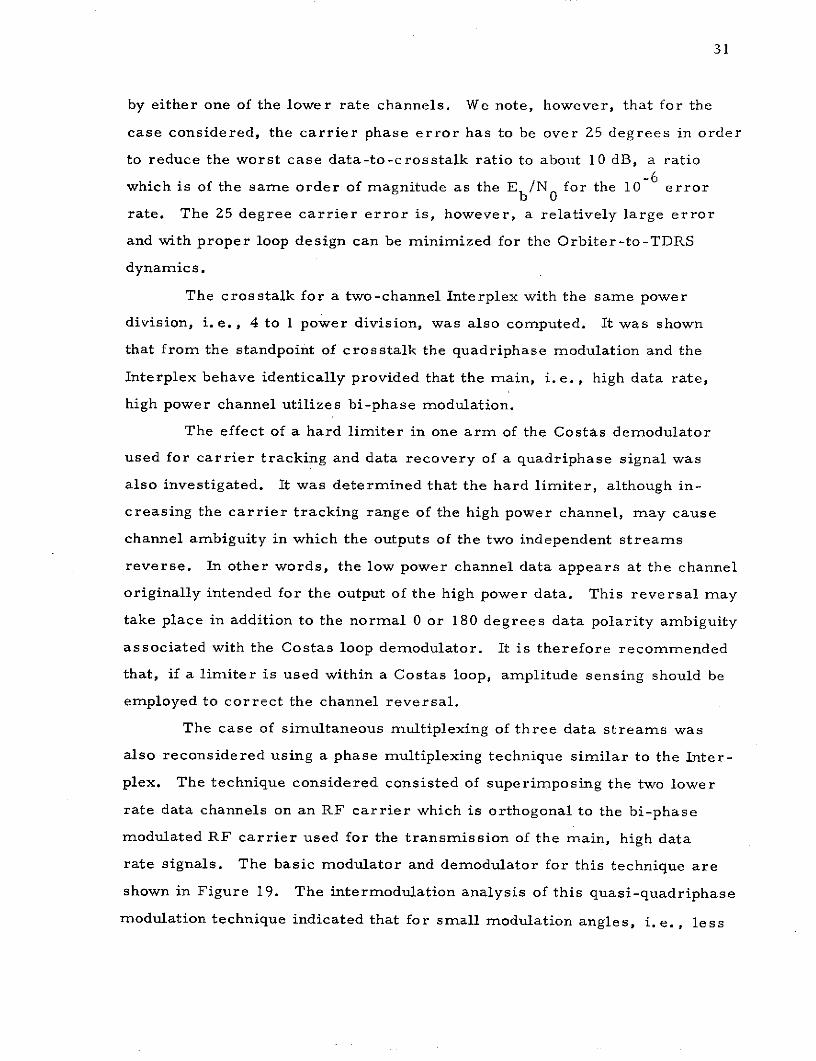
of either the 192 kbps or the 2 Mbps data channels. Figure 18 shows the
calculated data-to-crosstalk ratios vs. carrier tracking error for the afore-
mentioned conditions. In the figure, the curves labeled D 2 (1) represent the
ratio of either the 192 kbps or the 2 Mbps data to the crosstalk caused by
by the 50 Mbps stream. Conversely, the curve labeled D1(2) indicates
data-to-crosstalk ratio in the 50 Mbps channel, the crosstalk being caused
Because of 1/2 rate encoding, the symbol rate of this stream is100 Mbps.
29
Up toUp to 50Mbps 100 Mbps BM1 A a(t) cos w t
Viterbi NRZ(NRZ) Encoder a(t)
cos W tc
RF To Transmitter
Generator A a(t) cos w tC
+ Bb(t) sin o t2 c
sin w t
19 kbps (Bi--L)b(tor
Up to 2 Mbps (Bi-4-L) Bb(t) sin w tBM c
(a) Two-Channel Quadriphase Modulator
Up to 100 Mbps(NRZ) Viterbi Up to 50 Mbps
Decoder (NRZ)
A a(t) cos w t PD+ B b(t) sin Wt e, (t)LPF
Fr 1 Hard Limiter
cos (Wt + L J (Optional)
I |Carrier e3 ErrorTrack DetectorLPF
| (b) Costas Loop Quadriphase2s Demodulator
sin (' t + ) B1>> B2
e2(t) LPF1 2
PD2 LPF To Bit Sync
(B2 192 kbps (Bi- -L) Detector
or 2 Mbps (Bi-4-L)
Figure 17. Basic Modulator/Demodulator Configuration forKu-Band Return Link -- Mode 1

30
60
ORIGINAL PAGE IS50 OF POOR QUALITY
40
0.,44.
30
204D (1)
for 12 Mbps
10
S5 10 15 20 25
Carrier Tracking Error (degrees)
for a Two-Channel Quadriphase Demodulator andPower Ratio P1 = 4P2
31
by either one of the lower rate channels. We note, however, that for the
case considered, the carrier phase error has to be over 25 degrees in order
to reduce the worst case data-to-crosstalk ratio to about 10 dB, a ratio-6
which is of the same order of magnitude as the Eb/NO for the 10 error
rate. The 25 degree carrier error is, however, a relatively large error
and with proper loop design can be minimized for the Orbiter-to-TDRS
dynamics.
The crosstalk for a two-channel Interplex with the same power
division, i. e., 4 to 1 power division, was also computed. It was shown
that from the standpoint of crosstalk the quadriphase modulation and the
Interplex behave identically provided that the main, i.e., high data rate,
high power channel utilizes bi-phase modulation.
The effect of a hard limiter in one arm of the Costas demodulator
used for carrier tracking and data recovery of a quadriphase signal was
also investigated. It was determined that the hard limiter, although in-
creasing the carrier tracking range of the high power channel, may cause
channel ambiguity in which the outputs of the two independent streams
reverse. In other words, the low power channel data appears at the channel
originally intended for the output of the high power data. This reversal may
take place in addition to the normal 0 or 180 degrees data polarity ambiguity
associated with the Costas loop demodulator. It is therefore recommended
that, if a limiter is used within a Costas loop, amplitude sensing should be
employed to correct the channel reversal.
The case of simultaneous multiplexing of three data streams was
also reconsidered using a phase multiplexing technique similar to the Inter-
plex. The technique considered consisted of superimposing the two lower
rate data channels on an RF carrier which is orthogonal to the bi-phase
modulated RF carrier used for the transmission of the main, high data
rate signals. The basic modulator and demodulator for this technique are
shown in Figure 19. The intermodulation analysis of this quasi-quadriphase
modulation technique indicated that for small modulation angles, i. e., less

32
DSBSC AM Signal(i--L F(t) sin aC t
sin o tSC c Constant
Up to Envelope2 Mbps Amplitud PM
(Bi- -L) 2 LSignal toXmtr
CarrierOscc. os w t
cos (w t + dT)
Up to d 0O, 1
100 Mbps(NRZ) BM 1
(a) Three-Channel PM Multiplexer/Modulator
ORIGINAL PAGE ISOF POOR QUALITY Up to 100 Mbps
(NRZ) Viterbi I Up to 50 MbpsDecoder (NRZ)
(b) Costas Loop Three-Channel PSK Demodulato
VCO Track B 1 >> B 2 >> B3
LPF
(i-LLPF Up to 2 Mbps
FBPF 192 kbps(B(Bi- -L)
SC
Figure 19. Three-Channel PSK Modulator/Demodulator

33
than ±15 degrees total for the two low rate data channels, the quasi-
quadriphase technique is virtually identical to Interplex.
The conclusion was therefore reached that, within certain modu-
lation limits, the quadriphase and Interplex techniques are equivalent from
the standpoint of data crosstalk. The main difference between the two
techniques is that of implementation. Interplex techniques combine all
data signals at baseband and then applies them to a linear phase modulator
which operates on only one carrier. Quadriphase techniques require two
orthogonal carriers which, after modulation, are combined to provide a
composite carrier. Thus, the selection of either technique depends on the
system implementation chosen for any specific case.
6.3. Convolutional Encoding and Viterbi Decoding at 50 Mbps
6. 3. 1 Introduction
Convolutional coding for the 50 Mbps Ku-band channel presents an
interesting problem because no 50 Mbps Viterbi decoders have been built.
For the baseline code (R= 1/2, K= 7), 10 Mbps Viterbi decoders have been
built. Thus, an implementation can be envisioned which uses five encoders
and five decoders with some appropriate multiplexers and demultiplexers
in between, as shown in Figure 20. This section looks at some alternatives
to this implementation. Specifically, it discusses how the encoder portion
of Figure 20 can be done with one 31-stage shift.register and no mux/demux
units. Also, it shows how a conventional 7-stage encoder operating at 50
Mbps can be used with a wide variety of decoder implementations.
6. 3.2 Alternate 50 Mbps Coding Strategies
The encoder shown in Figure 20 consists of five 10 Mbps encoders
in parallel being fed by the demultiplexed 50 Mbps data stream. Another
implementation is to use a 31-stage shift register encoder operating at 50
Mbps, as shown in Figure 21. The tap or connection polynomials Gl(x)
and GZ(x) for the 31-stage encoder are related to the tap polynomials gl(x)
and g 2 (x) for the 7-stage encoder by G(x) = gl(x 5 ) and G 2 (x) = g 2 (x 5 ). The
first two symbols at the output of the long encoder correspond to the first
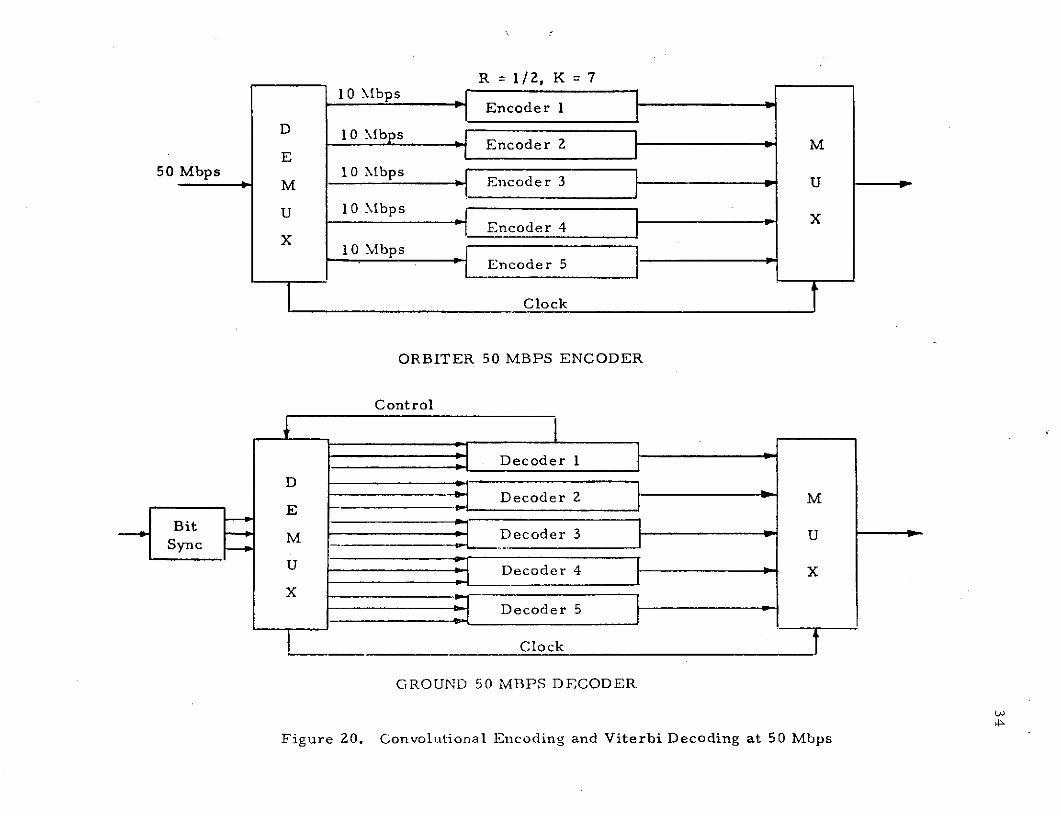
O I 5Encoder 4 X
X
10 Mbps
Encoder 5
ORBITER 50 MBPS ENCODER
Fu Decoder a V
Decoder 2 M
S Decoder 5
Clock
GROUNDRBITER 50 MBPS DECODER
FiDere 20. Convoluonal Encodiner and ViterbiDecoding at 50 Mbs

OutputFigure 21. Alternate Enoder for FiguInput
Output O
Figure 21. Alternate Encoder for Figure 20
36
to the first code branch of the first short encoder; the second two symbols
correspond to the first code branch of the second short encoder, etc. Note
that if this encoder is implemented, it must be decoded by the five parallel
Viterbi decoders or by a 50 Mbps sequential decoder, if available.
Now suppose that a 25 Mbps Viterbi decoder is developed. Then
only two of these decoders are needed for 50 Mbps. The encoder can either.
be two 25 Mbps 7-stage encoders in parallel or one 50 Mbps 13-stage
encoder with tap polynomials given by Gl(x) = gl(x 2 ) and G'(x) = g2(x
A normal 7-stage encoder operating at 50 Mbps could be used in the
Orbiter with any number of decoders at the ground station if the data is
blocked. This means that a number of information bits, say 100, is encoded
and blocked by finishing off with six additional data O's. These six zero bits
are called the tail, and their purpose is to bring the encoder (also the decoder)
back to the all-zero state. These extra bits correspond to 0. 25 dB loss in
Eb/N0; of course, this loss can be decreased by increasing the block length.
The received data blocks are distributed between the decoders. For example,
if five 10 Mbps decoders were used at the ground station, then the data blocks
are buffered at the input rate of 50 Mbps and distributed to each decoder at
a 10 Mbps rate. Thus, by varying the buffer organization from no buffer
for a single 50 Mbps decoder to five or more data block buffers, any number
of Viterbi decoders can be used, thereby lowering the effective data rate
at each decoder.
In conclusion, some alternatives to the Figure 20 implementation have
been presented. The five parallel 10 Mbps decoders can be used with any
of three encoder implementation. Similarly, there are three encoders for
two parallel 25 Mbps decoders. But for a 50 Mbps decoder, only one encoder,
the conventional 7-stage encoder, may be used. On the other hand, the 7-
stage encoder can operate with any of three decoder implementations.
37
7. O0 AREAS FOR FURTHER STUDY
During the course of the contract, a number of problem areas were
identified which require further study. These areas are summarized below.
7. 1 Spread Spectrum Acquisition and Tracking
Both the S-band and Ku-band may have to utilize direct sequence
PSK spectrum spreading to minimize the spectral density of the forward
link signals impinging upon the Earth. As is generally the case, the acqui-
sition or synchronization time must be minimized. There exist techniques
which speed up the time taken for the acquisition. One such technique is
sequential detection. The performance of this technique depends on the
signal-to-noise ratio at acquisition, the required probability of sync detec-
tion and the maximum time allowed for search. The exact tradeoffs between
these factors require further consideration to optimize the acquisition per-
formance for both the Ku-band and S-band spread spectrum links.
For the Ku-band link, the encoding of the forward link may increase
the data spectrum width to the same order of magnitude as that of spread
spectrum. This presents a rather unique situation which requires special
consideration.
Once the PN code acquisition is established, the code tracking com-
mences. Code tracking can be accomplished by such techniques as early-
late gate tracking or tau-jitter loop tracking. Both techniques have their
advantages and disadvantages. Generally, the early-late gate tracking
shows better theoretical performance, but its implementation may be more
complex than that of the tau-jitter loop. Thus, further consideration has
to be given to the tradeoffs involved between these techniques with particular
emphasis on the Shuttle spread spectrum link parameters.
7. 2 Three-Channel Data Multiplexing Techniques
Preliminary considerations have been given to the various techniques
for multiplexing on a single carrier of three data streams, each having
different data rates and clocks. This specifically applies to the Ku-band

38
return link. It was shown that, at least in principle, Interplex and related
quadriphase techniques can be used for phase multiplexing of three data
channels. The effects imposed by implementation configurations, however,
require further study to define the practical limitations of the three-channel
data multiplexing techniques considered so far. Alternate techniques such
as asynchronous time and/or frequency multiplexing may also be considered.
Also, acquisition methods and their peculiarities, such as possible false
locks and related phenomena, must be investigated for the various three-
channel multiplexing techniques.
7.3 MFSK Coding
Further work should be done in the design of 8-ary FSK convolutional
coding, particularly in the transmitter/receiver implementation. Both ortho-
gonal and nonorthogonal signals should be considered, with optimum frequency
deviations and receiver bandwidths being determined. An important aspect
is the signal design for a bandlimited channel. A new modulation technique,
quadrature phase frequency shift keying (QFSK), should be looked at for
possible bandwidth conservation.
7.4 System Acquisition Characteristics
The acquisition characteristics of the digital transmission system
for communications either directly from the ground or via TDRS to the
Orbiter need to be determined. The analysis of carrier, symbol sync,
Viterbi decoder branch sync, and multiplexer frame sync acquisition needs
to be refined to accurately predict the total system acquisition time as a
function of the received signal-to-noise ratio. Effects such as antenna
switching on system acquisition should be investigated. A basic set of
acquisition techniques and procedures needs to be developed for both direct
and TDRS links. In particular, the mutual acquisition of the Orbiter and
TDRS high gain antennas must be studied.
7. 5 Modulation -Coding Interface Characteristics
Sources of performance degradation on the Viterbi decoder due to
the PSK demodulation and bit sync need to be identified. Also, the types
39
of AGC need to be compared and the effects that the AGC has on the system
performance need to be investigated. The interface between the receiver
PSK demodulator and the digital signal processor needs to be carefully
analyzed to minimize the signal processor performance degradation.
40
REFERENCES
i. B. D. Trumpis, "Burst Error Correction for the Space Shuttle
Command Channels," Axiomatix Report No. R7410-1 (under NASA
Contract No. NAS 9-13467), October 2, 1974.
2. B. D. Trumpis, "Addendum to Burst Error Correction for the
Space Shuttle Command Channels, " Axiomatix Report No. R7501-1
(under NASA Contract No. NAS 9-13467), January 11, 1975.
3. W. C. Lindsey, "Optimum Performance of Costas Type Receivers,"
Axiomatix Report No. R7410-7 (under NASA Contract No. NAS 9-
13467), October 11, 1974.
4. W. C. Lindsey, "Design and Performance of Costas Receivers
Containing Bandpass Limiters, " Axiomatix Report No. R7502-2
(under NASA Contract No. NAS 9-13467), February 17, 1975.
5.. S. Udalov, "Experimental Techniques for Measuring Low Level
Spectral Components of Microwave Signals, " Axiomatix Report
No. R7410-6 (under NASA Contract No. NAS 9-13467), October 11,
1974.
6. S. Udalov, "Feasibility Study of an Interplex Modulation System
for the Orbiter's Ku-Band Link," Axiomatix Report No. R7410-5
(under NASA Contract No. NAS 9-13467), October 7, 1974.
7. S. Udalov, "Multiplexing Modulation Formats for the Orbiter's
Ku-Band Return Link, " Axiomatix Report No. R7502-1 (under
NASA Contract No. NAS 9-13467), February 13, 1975.
8. G. K. Huth, "Viterbi Decoder Performance and Complexity,"Axiomatix Report No. R7401-1 (under NASA Contract No. NAS
9-13467), January 23, 1974.
9. G. K. Huth, "Command Channel Coding for Shuttle Communications, "Axiomatix Report No. R7307-1 (under NASA Contract No. NAS 9-
13467), July 20, 1973. Also, G. K. Huth and B. H. Batson, "A
Command Encoding Scheme for a Multiplexed Space Communication
Link," NTC '73 Conference Record, Atlanta, Georgia, November
26-28, 1973.