Embed Size (px)
Citation preview
^Åèìáëáíáçå=oÉëÉ~êÅÜ=mêçÖê~ã=dê~Çì~íÉ=pÅÜççä=çÑ=_ìëáåÉëë=C=mìÄäáÅ=mçäáÅó=k~î~ä=mçëíÖê~Çì~íÉ=pÅÜççä=
SYM-AM-16-064
mêçÅÉÉÇáåÖë=çÑ=íÜÉ=
qÜáêíÉÉåíÜ=^ååì~ä=^Åèìáëáíáçå=oÉëÉ~êÅÜ=
póãéçëáìã=
qÜìêëÇ~ó=pÉëëáçåë=sçäìãÉ=ff= =
Materials Testing and Cost Modeling for Composite Parts Through Additive Manufacturing
Eric Holm, Chief of Command Civil Engineer Inspections, Air Force Materiel Command
Vhance Valencia, Assistant Professor, Air Force Institute of Technology Alfred Thal, Jr., Associate Professor, Air Force Institute of Technology Jason Freels, Assistant Professor, Air Force Institute of Technology
Adedeji Badiru, Dean, Air Force Institute of Technology
Published April 30, 2016
Approved for public release; distribution is unlimited.
Prepared for the Naval Postgraduate School, Monterey, CA 93943.

^Åèìáëáíáçå=oÉëÉ~êÅÜ=mêçÖê~ã=dê~Çì~íÉ=pÅÜççä=çÑ=_ìëáåÉëë=C=mìÄäáÅ=mçäáÅó=k~î~ä=mçëíÖê~Çì~íÉ=pÅÜççä=
The research presented in this report was supported by the Acquisition Research Program of the Graduate School of Business & Public Policy at the Naval Postgraduate School.
To request defense acquisition research, to become a research sponsor, or to print additional copies of reports, please contact any of the staff listed on the Acquisition Research Program website (www.acquisitionresearch.net).
^Åèìáëáíáçå=oÉëÉ~êÅÜ=mêçÖê~ãW=`êÉ~íáåÖ=póåÉêÖó=Ñçê=fåÑçêãÉÇ=`Ü~åÖÉ= - 246 -
Panel 17. Reducing Life-Cycle Costs: Adopting Emerging Manufacturing Technologies
Thursday, May 5, 2016
1:45 p.m. – 3:15 p.m.
Chair: Major General L. Neil Thurgood, U.S. Army, Deputy for Acquisition and Systems Management, OASA (ALT)
Discussant: Michael Schwind, Vice President of Federal Sector, Siemens PLM
Benchmarking Naval Shipbuilding With 3D Laser Scanning, Additive Manufacturing, and Collaborative Product Lifecycle Management
David Ford, Associate Professor, Texas A&M University Tom Housel, Professor, NPS Sandra Hom, Research Associate, NPS Jonathan Mun, Research Professor, NPS
Materials Testing and Cost Modeling for Composite Parts Through Additive Manufacturing
Eric Holm, Chief of Command Civil Engineer Inspections, Air Force Materiel Command Vhance Valencia, Assistant Professor, Air Force Institute of Technology Alfred Thal, Jr., Associate Professor, Air Force Institute of Technology Jason Freels, Assistant Professor, Air Force Institute of Technology Adedeji Badiru, Dean, Air Force Institute of Technology
^Åèìáëáíáçå=oÉëÉ~êÅÜ=mêçÖê~ãW=`êÉ~íáåÖ=póåÉêÖó=Ñçê=fåÑçêãÉÇ=`Ü~åÖÉ= - 264 -
Materials Testing and Cost Modeling for Composite Parts Through Additive Manufacturing
Eric S. Holm—recently graduated from the Air Force Institute of Technology (AFIT) with a Master of Science in engineering management. He holds a Bachelor of Science degree in civil engineering from the University of Virginia. Commissioned through the Reserve Officer Training Corps in 2006, he now has 10 years of active service as a Major and as a Civil Engineer officer in the United States Air Force. Major Holm is currently assigned to the Inspector General staff of the Air Force Materiel Command as Chief of Command Civil Engineer Inspections. [[email protected]]
Vhance V. Valencia—is an Assistant Professor in the Department of Systems Engineering and Management at the Air Force Institute of Technology (AFIT) located at Wright-Patterson AFB, OH. He is the program director for the Graduate Engineering Management program responsible for the program’s curriculum and oversight of 20 graduate students annually. Holding two degrees from AFIT, he earned an MS in engineering management and a PhD in systems engineering. He was recently selected for promotion to Lieutenant Colonel. His research interests include additive manufacturing applications for civil engineering, infrastructure asset management, geographic information systems, critical infrastructure protection, and unmanned aerial systems. [[email protected]]
Alfred E. Thal, Jr.—is an Associate Professor in the Department of Systems Engineering and Management at the Air Force Institute of Technology (AFIT) located at Wright-Patterson AFB, OH. He is the Curriculum Chair for the Engineering Management thrust area encompassing the Graduate Engineering Management and Graduate Cost Analysis programs. He holds a PhD in environmental engineering from the University of Oklahoma. His research interests include engineering and environmental management, project management, facility and infrastructure management, rapid product development, economic analysis, innovation, sustainability, and project management.
Jason K. Freels—is an Assistant Professor in the Department of Systems Engineering and Management at the Air Force Institute of Technology (AFIT) located at Wright-Patterson AFB, OH. He is a professor of systems engineering specializing in applied statistics, reliability, and lifecycle management. He earned both his MS, studying materials science and engineering, and his PhD, studying systems engineering, from AFIT. His research interests include survival/reliability analysis, systems engineering, optimization, structures and materials, and response surface methods. [[email protected]]
Adedeji B. Badiru—is Dean of the Graduate School of Engineering and Management at the Air Force Institute of Technology (AFIT). He was previously Professor and Head of Systems Engineering and Management at AFIT, Professor and Department Head of Industrial & Information Engineering at the University of Tennessee in Knoxville, and Professor of Industrial Engineering and Dean of University College at the University of Oklahoma, Norman. His areas of interest include mathematical modeling, project modeling and analysis, economic analysis, systems engineering, and efficiency/productivity analysis and improvement. He is the author of over 25 books, 34 book chapters, 70 technical journal articles, and 110 conference proceedings and presentations. [[email protected]]
Abstract Recent advances in additive manufacturing (3D printing) have introduced new parameters in reducing cost in manufacturing aircraft components. The additive process provides a possible means to reduce an aircraft’s lifecycle cost (LCC), but the effects of changed process parameters of additive manufacturing machines on final material characteristics are not well known. This research explores these effects with the intent to motivate greater use and application in aviation. We conduct this study in two parts. First, focusing on fused filament fabrication (FFF) through Mark Forged, Inc.’s Mark One machine, this research creates PA6 dog-bone specimens for (1) a design of experiments (DOE) procedure and (2) a destructive test of a continuous fiber composite specimen from the Mark One machine. Second, this
^Åèìáëáíáçå=oÉëÉ~êÅÜ=mêçÖê~ãW=`êÉ~íáåÖ=póåÉêÖó=Ñçê=fåÑçêãÉÇ=`Ü~åÖÉ= - 265 -
paper explores cost modeling issues using in the additive manufacturing industry with a specific focus on energy usage. Taken together, this research effort identifies critical factors in additive manufacturing towards revolutionizing the military supply chain.
Introduction Modern manufacturing processes tend to reflect globalization, a concentration on
core activities, shorter product life-cycles, and an increasing focus on customer needs (Baumers et al., 2012). This often results in advanced supply chains which are complex and long (Foran et al., 2005). However, additive manufacturing (AM) can simplify and reduce the supply chain associated with component manufacturing. This can be accomplished by avoiding the tools, dies, and material waste that accompany conventional manufacturing processes (Morrow et al., 2007; Serres et al., 2011). Additionally, and of primary importance to many organizations though, is the fact that AM offers the capability to produce small quantities of customized items at a relatively low average unit cost (Baumers et al., 2011). This is possible because geometric constraints typical of formative and subtractive processes are largely eliminated (Tuck et al., 2008; Baumers et al., 2011), which leads to advanced freeform fabrication (Meteyer et al., 2014) and the capability to create geometrically complex and novel items (Horn & Harrysson, 2012; Mani et al., 2014).
When viewed from a life-cycle perspective, a number of organizations recognize that environmental benefits and performance improvements can be achieved (Horn & Harrysson, 2012; Huang et al., 2013; Huang et al., 2015). For example, the “buy-to-fly” ratio (i.e., mass of raw material needed per unit mass of finished component) ranges from 12:1 to 25:1 for aircraft components made of aluminum and titanium alloys using conventional manufacturing processes (Oak Ridge National Laboratory, 2010; Huang et al., 2015). These high buy-to-fly ratios indicate that 92.3–96.2% of the raw material is wasted, which leads to large energy and environmental emissions footprints (Huang et al., 2015). Thus, AM has the potential to reduce the “cradle-to-grave” environmental impact by reducing waste and minimizing the consumption of natural resources associated with normal manufacturing processes (Morrow et al., 2007; Serres et al., 2011; Huang et al., 2015). Furthermore, the aircraft industry has increased fuel efficiency by incorporating AM components to reduce weight (Oak Ridge National Laboratory, 2010; Huang et al., 2015). Lindemann et al. (2013) cite a cost savings of $3,000 per year for each kilogram reduction in mass, and Huang et al. (2015) estimate that fuel consumption could be reduced by as much as 6.4% if AM was used to its full potential.
Despite these advantages and benefits, a number of limitations have been attributed to additive manufacturing. For example, Ruffo and Hague (2007) list the following limitations associated with AM technology: material selection and characteristics, process productivity, accuracy of product dimensions, surface quality, repeatability, and unit cost at medium and high volumes. However, the low throughput of AM processes is considered to be a primary limitation, which makes it less suitable for high-volume production (Huang et al., 2015). According to Huang et al. (2015), concerns with geometric repeatability, residual stresses, and high surface roughness make AM less appropriate for work requiring high dimensional precision, surface quality, and fatigue resistance. Additionally, during typical AM processes, Schroeder et al. (2015) found that quality concerns, from either operator or machine failures, led to high rejection rates; this means that “industry-standard product quality rates can rarely be achieved.” However, many of these concerns may be addressed in the next 5–20 years (Huang et al., 2015).
Therefore, the primary purpose of this paper is to address a few of the material characteristics. Specifically, the research investigated how variations in two AM process
^Åèìáëáíáçå=oÉëÉ~êÅÜ=mêçÖê~ãW=`êÉ~íáåÖ=póåÉêÖó=Ñçê=fåÑçêãÉÇ=`Ü~åÖÉ= - 266 -
parameters in fused filament fabrication (FFF), also known as fused deposition modeling (FDM), affected the mechanical properties of the two specimens being produced. A secondary purpose of the paper is to broadly review cost modeling issues, primarily from an energy consumption perspective, since research regarding major cost drivers is rather limited (Lindemann et al., 2012) and people tend to focus on purchasing and production costs (Lindemann et al., 2013). Therefore, this paper is a stepping-stone for further research to develop AM composite technology and encourage its use in high-performance applications. The long-term goal is the ability to produce aerospace parts through AM that meet the same service specifications as traditionally manufactured aerospace parts.
Background Fused deposition modeling is a subset of AM technology using selective deposition
processes commonly available in the commercial market under many different brand names. With FDM, a thermoplastic filament is pushed through a computer-controlled extrusion head and deposited on a build plate as a series of layers to form a three-dimensional object. Although FDM is a type of technology, fused deposition modeling and FDM are trademarked by Stratasys, which invented the process (Barnatt, 2013). Other terms used to describe FDM include plastic jet printing (PJP), fused filament modeling (FFM), and fused filament fabrication (FFF). FFF was coined by the RepRap project to avoid legal constraints with using the term FDM. Therefore, when referring to fused deposition modeling, the term FFF is used in this paper.
In FFF, the extrusion nozzle moves in a plane, parallel with the build surface or build plate in the plane (Ahn et al., 2002). A heated extrusion head melts the thermoplastic filament before it passes through the extrusion nozzle, and the AM machine deposits the viscous thermoplastic material onto the build surface as a series of rows. These rows are called rasters or roads. After this deposition, the build plate lowers (or the extrusion head raises) and the machine deposits another layer of thermoplastic material. This process repeats itself until the desired shape is complete (Gibson et al., 2010).
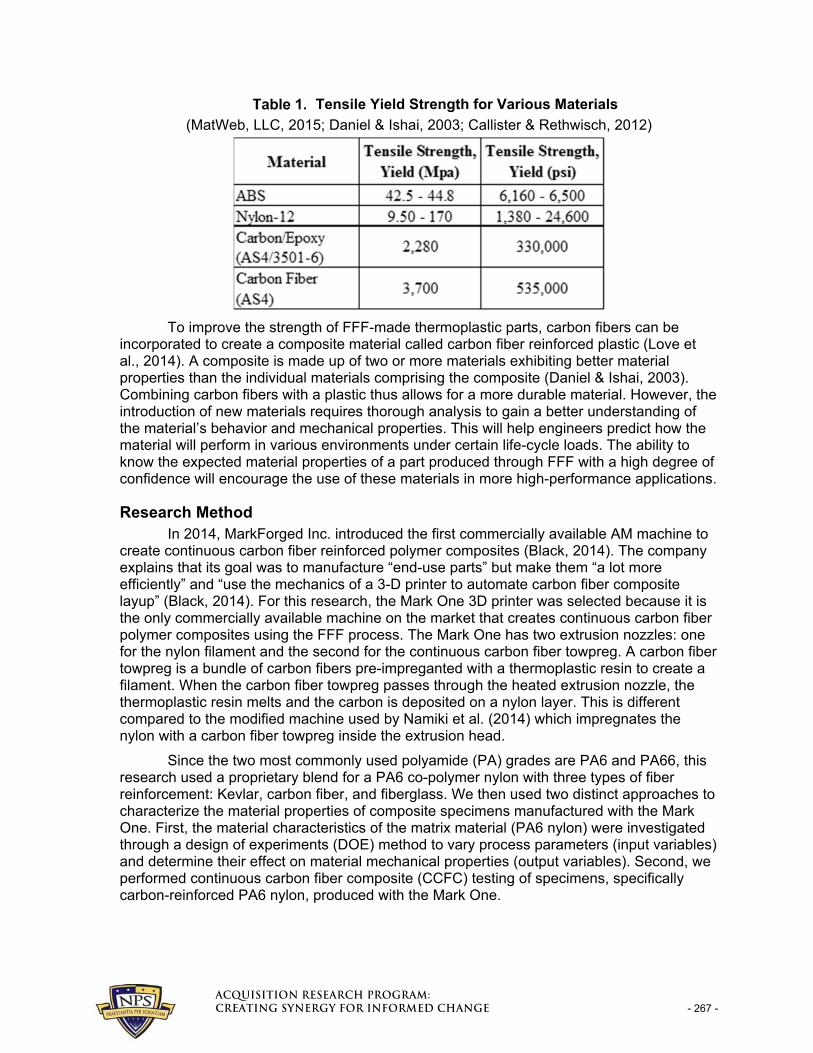
Thermoplastics are the most widely used feedstock in FFF processes, with the most common materials being acrylonitrile butadiene styrene (ABS), polycarbonate (PC), polylactide (PLA), and polyamide (PA). However, thermoplastics are low in strength compared to metals and their mechanical properties. For example, the maximum tensile strength for polymers is about 100 MPa (15,000 psi), and some metal alloys have tensile strengths of 4,100 MPa (600,000 psi) (Callister & Rethwisch, 2012). In comparison, Table 1 shows the tensile yield strength of ABS plastic, nylon-12, carbon fiber reinforced polymer, and carbon fiber made through conventional manufacturing processes (not additive). This decrease in strength limits their use in more high-performance applications such as aerospace, automotive industry, and infrastructure.
^Åèìáëáíáçå=oÉëÉ~êÅÜ=mêçÖê~ãW=`êÉ~íáåÖ=póåÉêÖó=Ñçê=fåÑçêãÉÇ=`Ü~åÖÉ= - 267 -
Tensile Yield Strength for Various Materials
(MatWeb, LLC, 2015; Daniel & Ishai, 2003; Callister & Rethwisch, 2012)
To improve the strength of FFF-made thermoplastic parts, carbon fibers can be incorporated to create a composite material called carbon fiber reinforced plastic (Love et al., 2014). A composite is made up of two or more materials exhibiting better material properties than the individual materials comprising the composite (Daniel & Ishai, 2003). Combining carbon fibers with a plastic thus allows for a more durable material. However, the introduction of new materials requires thorough analysis to gain a better understanding of the material’s behavior and mechanical properties. This will help engineers predict how the material will perform in various environments under certain life-cycle loads. The ability to know the expected material properties of a part produced through FFF with a high degree of confidence will encourage the use of these materials in more high-performance applications.
Research Method In 2014, MarkForged Inc. introduced the first commercially available AM machine to
create continuous carbon fiber reinforced polymer composites (Black, 2014). The company explains that its goal was to manufacture “end-use parts” but make them “a lot more efficiently” and “use the mechanics of a 3-D printer to automate carbon fiber composite layup” (Black, 2014). For this research, the Mark One 3D printer was selected because it is the only commercially available machine on the market that creates continuous carbon fiber polymer composites using the FFF process. The Mark One has two extrusion nozzles: one for the nylon filament and the second for the continuous carbon fiber towpreg. A carbon fiber towpreg is a bundle of carbon fibers pre-impreganted with a thermoplastic resin to create a filament. When the carbon fiber towpreg passes through the heated extrusion nozzle, the thermoplastic resin melts and the carbon is deposited on a nylon layer. This is different compared to the modified machine used by Namiki et al. (2014) which impregnates the nylon with a carbon fiber towpreg inside the extrusion head.
Since the two most commonly used polyamide (PA) grades are PA6 and PA66, this research used a proprietary blend for a PA6 co-polymer nylon with three types of fiber reinforcement: Kevlar, carbon fiber, and fiberglass. We then used two distinct approaches to characterize the material properties of composite specimens manufactured with the Mark One. First, the material characteristics of the matrix material (PA6 nylon) were investigated through a design of experiments (DOE) method to vary process parameters (input variables) and determine their effect on material mechanical properties (output variables). Second, we performed continuous carbon fiber composite (CCFC) testing of specimens, specifically carbon-reinforced PA6 nylon, produced with the Mark One.
^Åèìáëáíáçå=oÉëÉ~êÅÜ=mêçÖê~ãW=`êÉ~íáåÖ=póåÉêÖó=Ñçê=fåÑçêãÉÇ=`Ü~åÖÉ= - 268 -
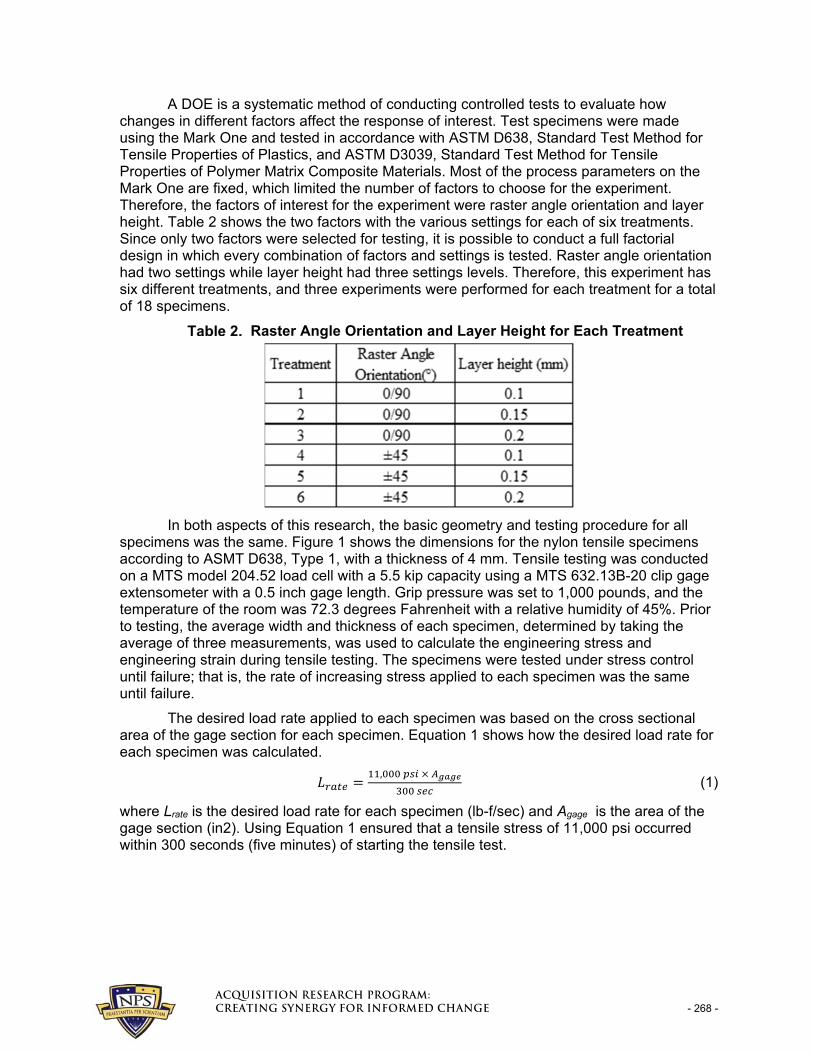
A DOE is a systematic method of conducting controlled tests to evaluate how changes in different factors affect the response of interest. Test specimens were made using the Mark One and tested in accordance with ASTM D638, Standard Test Method for Tensile Properties of Plastics, and ASTM D3039, Standard Test Method for Tensile Properties of Polymer Matrix Composite Materials. Most of the process parameters on the Mark One are fixed, which limited the number of factors to choose for the experiment. Therefore, the factors of interest for the experiment were raster angle orientation and layer height. Table 2 shows the two factors with the various settings for each of six treatments. Since only two factors were selected for testing, it is possible to conduct a full factorial design in which every combination of factors and settings is tested. Raster angle orientation had two settings while layer height had three settings levels. Therefore, this experiment has six different treatments, and three experiments were performed for each treatment for a total of 18 specimens.
Raster Angle Orientation and Layer Height for Each Treatment
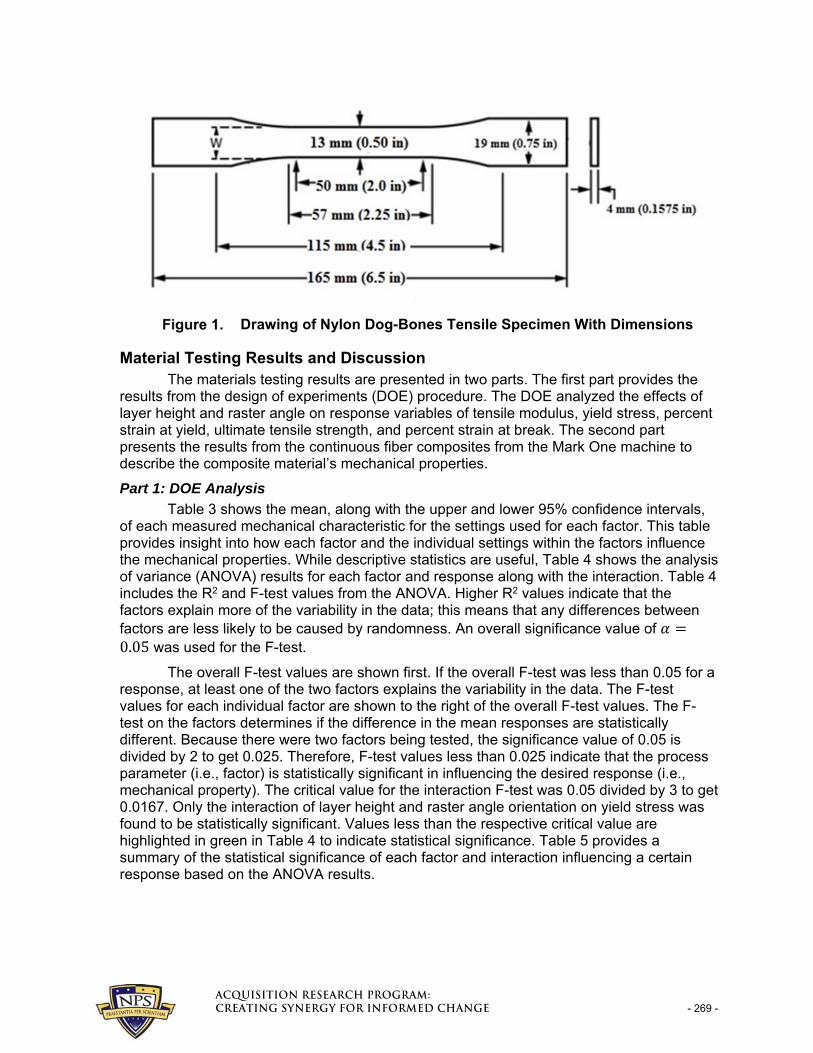
In both aspects of this research, the basic geometry and testing procedure for all specimens was the same. Figure 1 shows the dimensions for the nylon tensile specimens according to ASMT D638, Type 1, with a thickness of 4 mm. Tensile testing was conducted on a MTS model 204.52 load cell with a 5.5 kip capacity using a MTS 632.13B-20 clip gage extensometer with a 0.5 inch gage length. Grip pressure was set to 1,000 pounds, and the temperature of the room was 72.3 degrees Fahrenheit with a relative humidity of 45%. Prior to testing, the average width and thickness of each specimen, determined by taking the average of three measurements, was used to calculate the engineering stress and engineering strain during tensile testing. The specimens were tested under stress control until failure; that is, the rate of increasing stress applied to each specimen was the same until failure.
The desired load rate applied to each specimen was based on the cross sectional area of the gage section for each specimen. Equation 1 shows how the desired load rate for each specimen was calculated.
,
(1)
where Lrate is the desired load rate for each specimen (lb-f/sec) and Agage is the area of the gage section (in2). Using Equation 1 ensured that a tensile stress of 11,000 psi occurred within 300 seconds (five minutes) of starting the tensile test.
^Åèìáëáíáçå=oÉëÉ~êÅÜ=mêçÖê~ãW=`êÉ~íáåÖ=póåÉêÖó=Ñçê=fåÑçêãÉÇ=`Ü~åÖÉ= - 269 -
Drawing of Nylon Dog-Bones Tensile Specimen With Dimensions
Material Testing Results and Discussion The materials testing results are presented in two parts. The first part provides the
results from the design of experiments (DOE) procedure. The DOE analyzed the effects of layer height and raster angle on response variables of tensile modulus, yield stress, percent strain at yield, ultimate tensile strength, and percent strain at break. The second part presents the results from the continuous fiber composites from the Mark One machine to describe the composite material’s mechanical properties.
Part 1: DOE Analysis
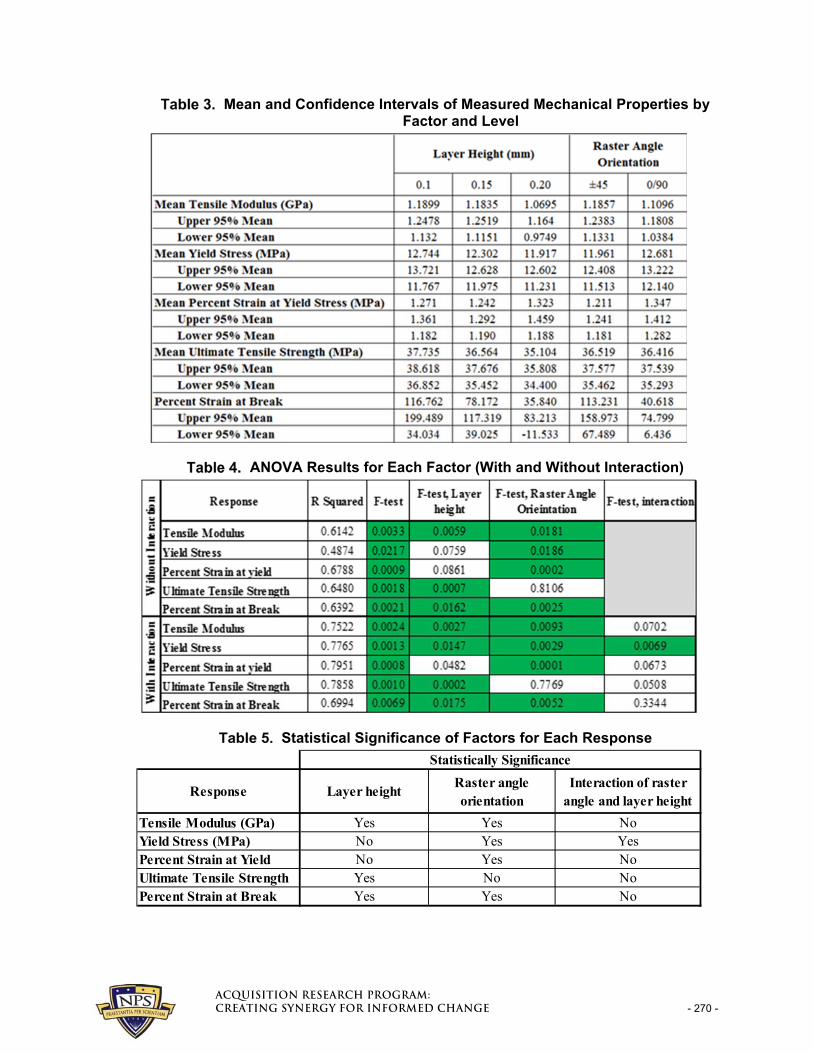
Table 3 shows the mean, along with the upper and lower 95% confidence intervals, of each measured mechanical characteristic for the settings used for each factor. This table provides insight into how each factor and the individual settings within the factors influence the mechanical properties. While descriptive statistics are useful, Table 4 shows the analysis of variance (ANOVA) results for each factor and response along with the interaction. Table 4 includes the R2 and F-test values from the ANOVA. Higher R2 values indicate that the factors explain more of the variability in the data; this means that any differences between factors are less likely to be caused by randomness. An overall significance value of 0.05 was used for the F-test.
The overall F-test values are shown first. If the overall F-test was less than 0.05 for a response, at least one of the two factors explains the variability in the data. The F-test values for each individual factor are shown to the right of the overall F-test values. The F-test on the factors determines if the difference in the mean responses are statistically different. Because there were two factors being tested, the significance value of 0.05 is divided by 2 to get 0.025. Therefore, F-test values less than 0.025 indicate that the process parameter (i.e., factor) is statistically significant in influencing the desired response (i.e., mechanical property). The critical value for the interaction F-test was 0.05 divided by 3 to get 0.0167. Only the interaction of layer height and raster angle orientation on yield stress was found to be statistically significant. Values less than the respective critical value are highlighted in green in Table 4 to indicate statistical significance. Table 5 provides a summary of the statistical significance of each factor and interaction influencing a certain response based on the ANOVA results.
^Åèìáëáíáçå=oÉëÉ~êÅÜ=mêçÖê~ãW=`êÉ~íáåÖ=póåÉêÖó=Ñçê=fåÑçêãÉÇ=`Ü~åÖÉ= - 270 -
Mean and Confidence Intervals of Measured Mechanical Properties by Factor and Level
ANOVA Results for Each Factor (With and Without Interaction)
Statistical Significance of Factors for Each Response
Response Layer heightRaster angle orientation
Interaction of raster angle and layer height
Tensile Modulus (GPa) Yes Yes NoYield Stress (MPa) No Yes YesPercent Strain at Yield No Yes NoUltimate Tensile Strength Yes No NoPercent Strain at Break Yes Yes No
Statistically Significance
^Åèìáëáíáçå=oÉëÉ~êÅÜ=mêçÖê~ãW=`êÉ~íáåÖ=póåÉêÖó=Ñçê=fåÑçêãÉÇ=`Ü~åÖÉ= - 271 -
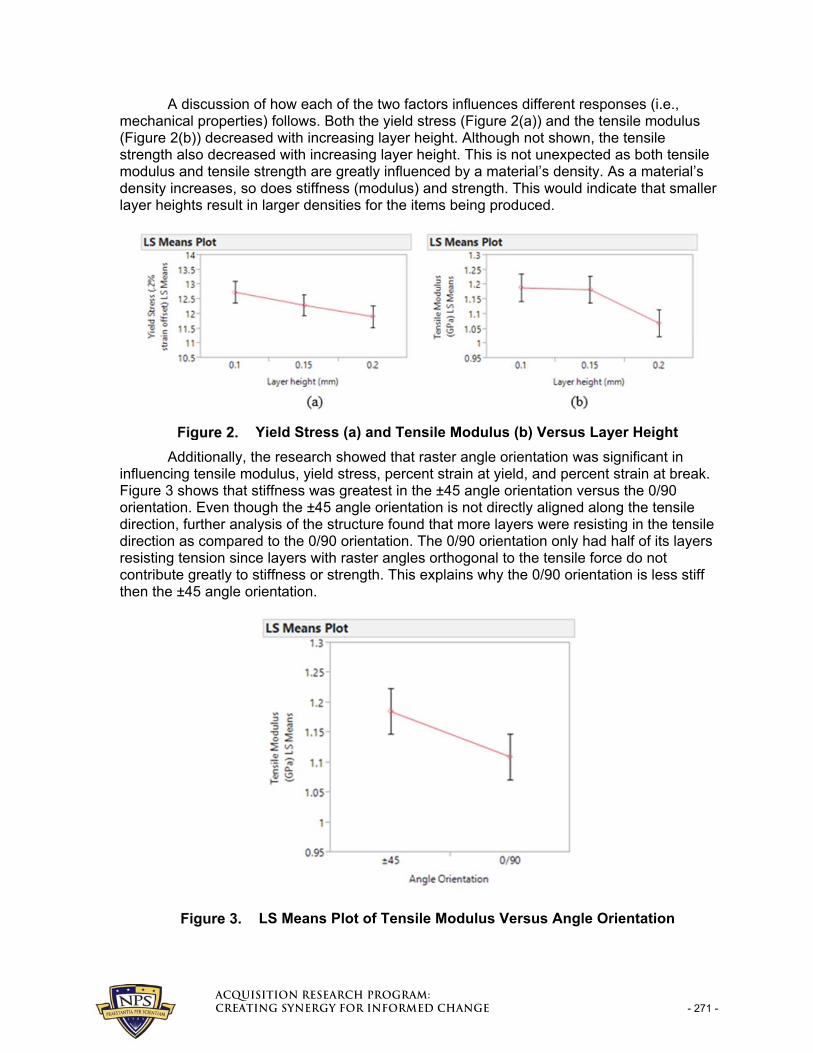
A discussion of how each of the two factors influences different responses (i.e., mechanical properties) follows. Both the yield stress (Figure 2(a)) and the tensile modulus (Figure 2(b)) decreased with increasing layer height. Although not shown, the tensile strength also decreased with increasing layer height. This is not unexpected as both tensile modulus and tensile strength are greatly influenced by a material’s density. As a material’s density increases, so does stiffness (modulus) and strength. This would indicate that smaller layer heights result in larger densities for the items being produced.
Yield Stress (a) and Tensile Modulus (b) Versus Layer Height
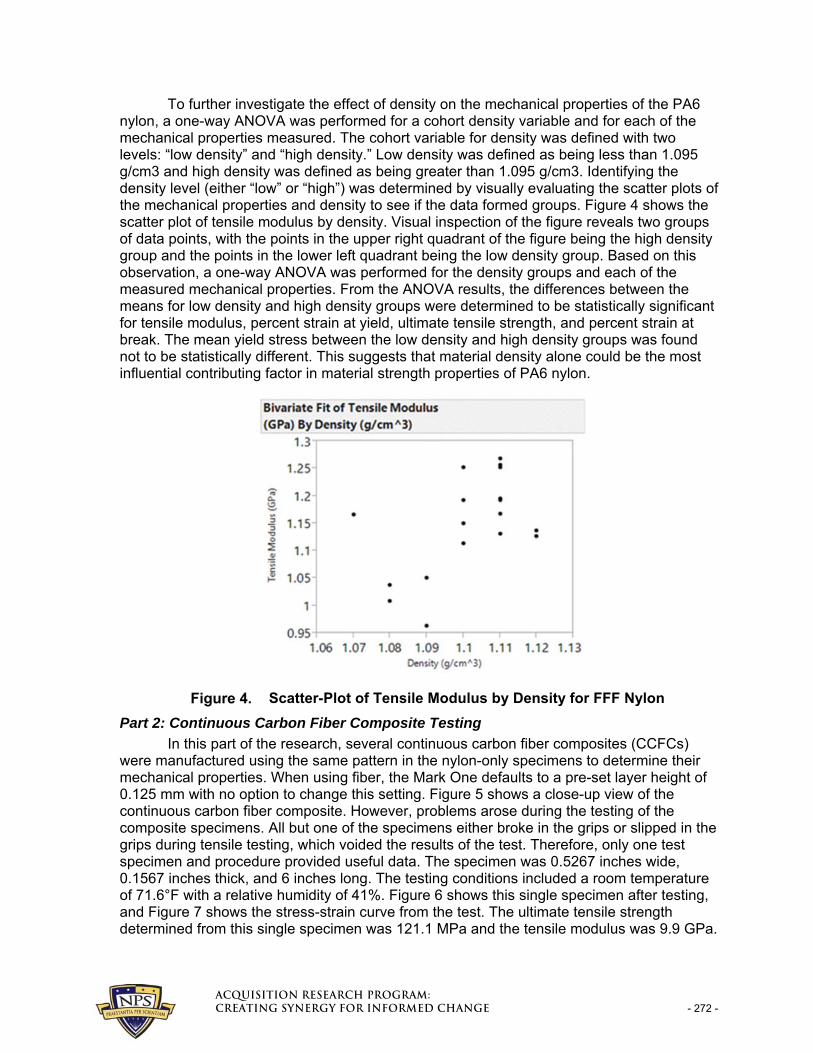
Additionally, the research showed that raster angle orientation was significant in influencing tensile modulus, yield stress, percent strain at yield, and percent strain at break. Figure 3 shows that stiffness was greatest in the ±45 angle orientation versus the 0/90 orientation. Even though the ±45 angle orientation is not directly aligned along the tensile direction, further analysis of the structure found that more layers were resisting in the tensile direction as compared to the 0/90 orientation. The 0/90 orientation only had half of its layers resisting tension since layers with raster angles orthogonal to the tensile force do not contribute greatly to stiffness or strength. This explains why the 0/90 orientation is less stiff then the ±45 angle orientation.
LS Means Plot of Tensile Modulus Versus Angle Orientation
^Åèìáëáíáçå=oÉëÉ~êÅÜ=mêçÖê~ãW=`êÉ~íáåÖ=póåÉêÖó=Ñçê=fåÑçêãÉÇ=`Ü~åÖÉ= - 272 -
To further investigate the effect of density on the mechanical properties of the PA6 nylon, a one-way ANOVA was performed for a cohort density variable and for each of the mechanical properties measured. The cohort variable for density was defined with two levels: “low density” and “high density.” Low density was defined as being less than 1.095 g/cm3 and high density was defined as being greater than 1.095 g/cm3. Identifying the density level (either “low” or “high”) was determined by visually evaluating the scatter plots of the mechanical properties and density to see if the data formed groups. Figure 4 shows the scatter plot of tensile modulus by density. Visual inspection of the figure reveals two groups of data points, with the points in the upper right quadrant of the figure being the high density group and the points in the lower left quadrant being the low density group. Based on this observation, a one-way ANOVA was performed for the density groups and each of the measured mechanical properties. From the ANOVA results, the differences between the means for low density and high density groups were determined to be statistically significant for tensile modulus, percent strain at yield, ultimate tensile strength, and percent strain at break. The mean yield stress between the low density and high density groups was found not to be statistically different. This suggests that material density alone could be the most influential contributing factor in material strength properties of PA6 nylon.
Scatter-Plot of Tensile Modulus by Density for FFF Nylon
Part 2: Continuous Carbon Fiber Composite Testing
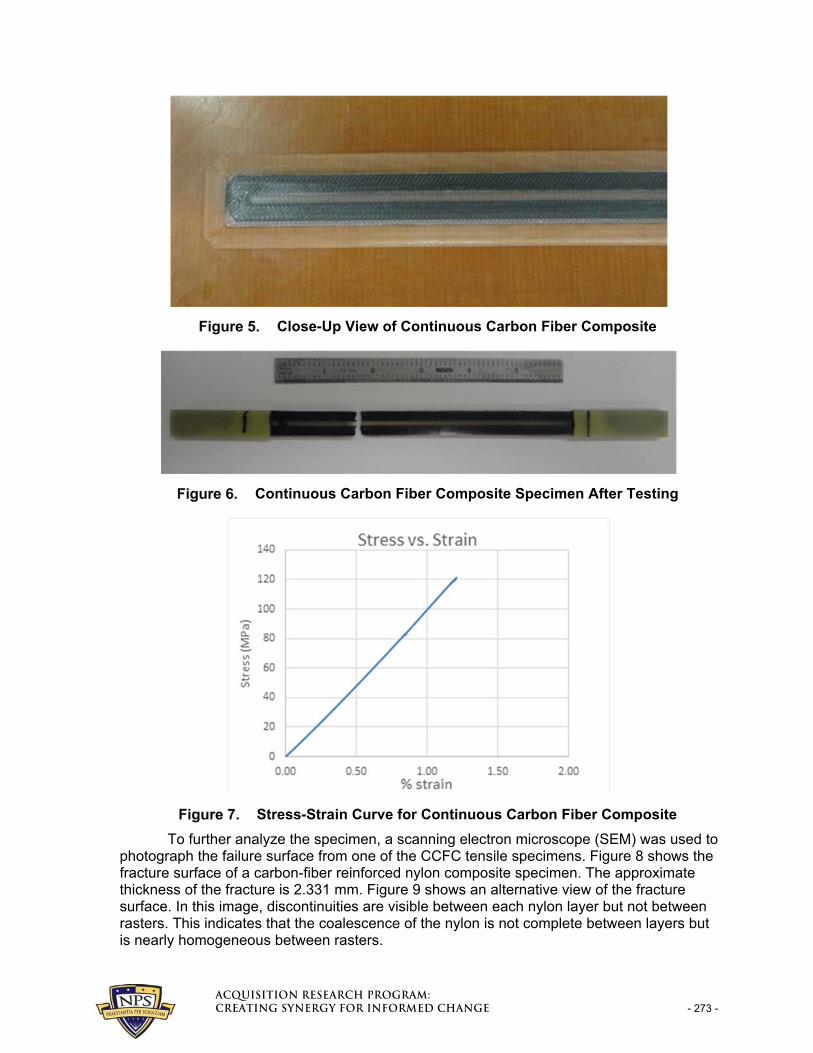
In this part of the research, several continuous carbon fiber composites (CCFCs) were manufactured using the same pattern in the nylon-only specimens to determine their mechanical properties. When using fiber, the Mark One defaults to a pre-set layer height of 0.125 mm with no option to change this setting. Figure 5 shows a close-up view of the continuous carbon fiber composite. However, problems arose during the testing of the composite specimens. All but one of the specimens either broke in the grips or slipped in the grips during tensile testing, which voided the results of the test. Therefore, only one test specimen and procedure provided useful data. The specimen was 0.5267 inches wide, 0.1567 inches thick, and 6 inches long. The testing conditions included a room temperature of 71.6°F with a relative humidity of 41%. Figure 6 shows this single specimen after testing, and Figure 7 shows the stress-strain curve from the test. The ultimate tensile strength determined from this single specimen was 121.1 MPa and the tensile modulus was 9.9 GPa.
^Åèìáëáíáçå=oÉëÉ~êÅÜ=mêçÖê~ãW=`êÉ~íáåÖ=póåÉêÖó=Ñçê=fåÑçêãÉÇ=`Ü~åÖÉ= - 273 -
Close-Up View of Continuous Carbon Fiber Composite
Continuous Carbon Fiber Composite Specimen After Testing
Stress-Strain Curve for Continuous Carbon Fiber Composite
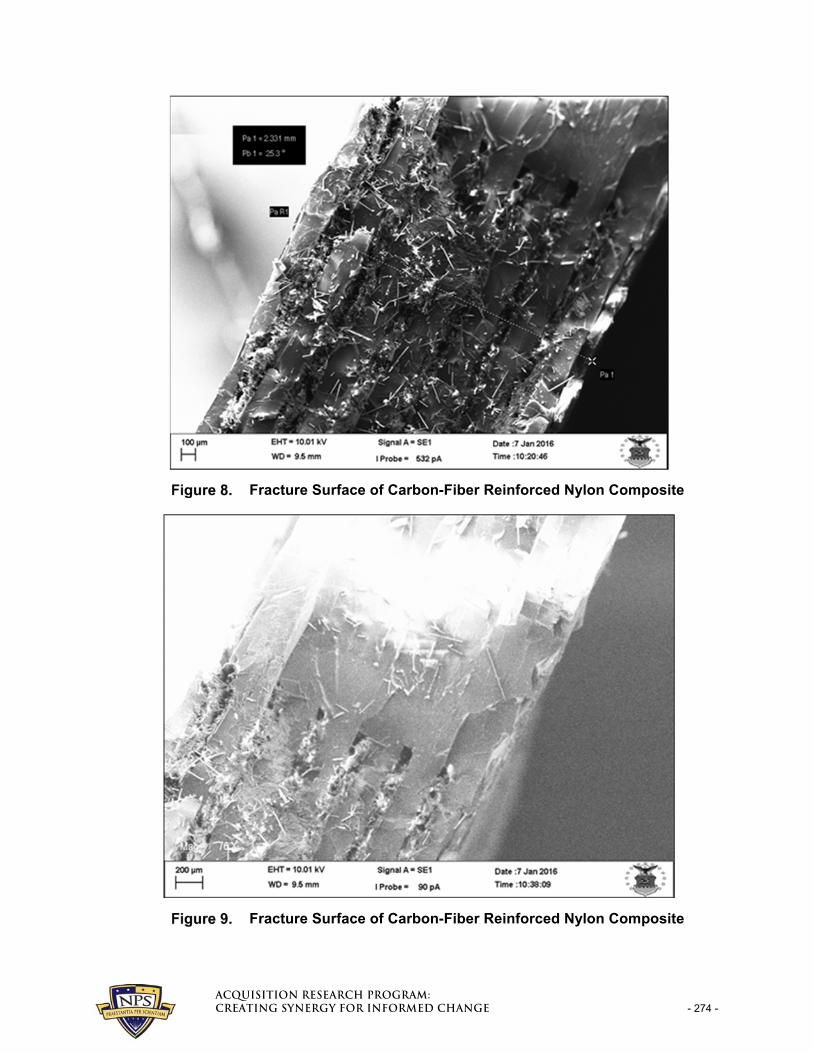
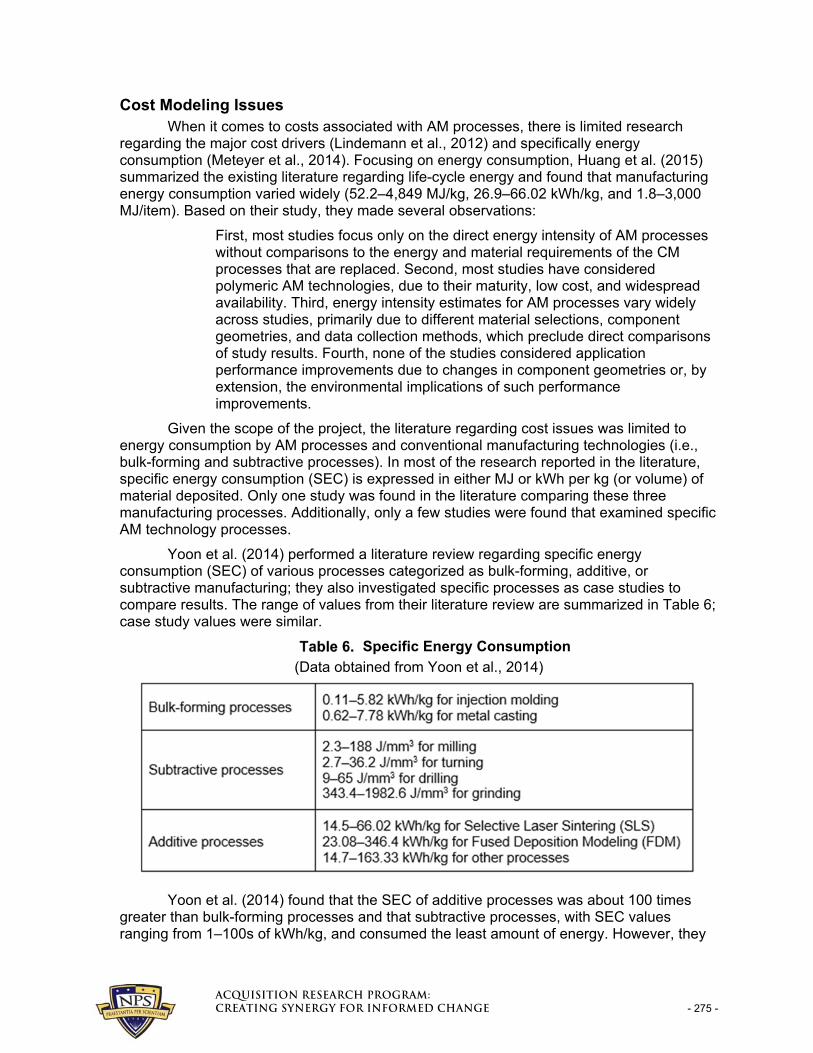
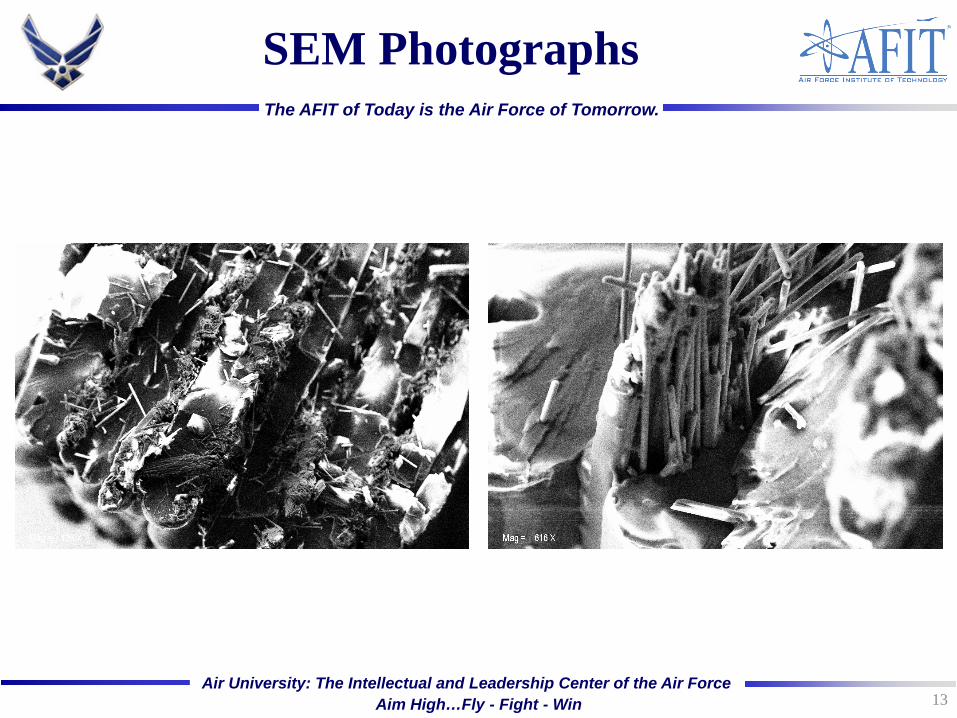
To further analyze the specimen, a scanning electron microscope (SEM) was used to photograph the failure surface from one of the CCFC tensile specimens. Figure 8 shows the fracture surface of a carbon-fiber reinforced nylon composite specimen. The approximate thickness of the fracture is 2.331 mm. Figure 9 shows an alternative view of the fracture surface. In this image, discontinuities are visible between each nylon layer but not between rasters. This indicates that the coalescence of the nylon is not complete between layers but is nearly homogeneous between rasters.
^Åèìáëáíáçå=oÉëÉ~êÅÜ=mêçÖê~ãW=`êÉ~íáåÖ=póåÉêÖó=Ñçê=fåÑçêãÉÇ=`Ü~åÖÉ= - 274 -
Fracture Surface of Carbon-Fiber Reinforced Nylon Composite
Fracture Surface of Carbon-Fiber Reinforced Nylon Composite
^Åèìáëáíáçå=oÉëÉ~êÅÜ=mêçÖê~ãW=`êÉ~íáåÖ=póåÉêÖó=Ñçê=fåÑçêãÉÇ=`Ü~åÖÉ= - 275 -
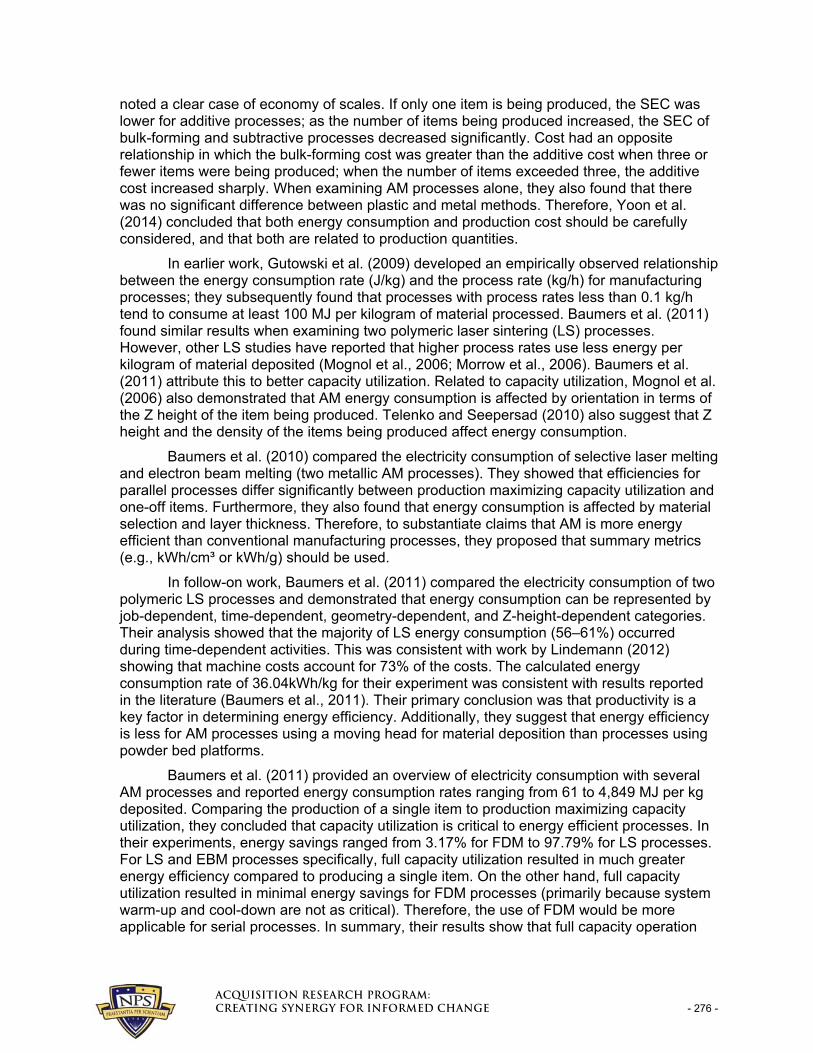
Cost Modeling Issues When it comes to costs associated with AM processes, there is limited research
regarding the major cost drivers (Lindemann et al., 2012) and specifically energy consumption (Meteyer et al., 2014). Focusing on energy consumption, Huang et al. (2015) summarized the existing literature regarding life-cycle energy and found that manufacturing energy consumption varied widely (52.2–4,849 MJ/kg, 26.9–66.02 kWh/kg, and 1.8–3,000 MJ/item). Based on their study, they made several observations:
First, most studies focus only on the direct energy intensity of AM processes without comparisons to the energy and material requirements of the CM processes that are replaced. Second, most studies have considered polymeric AM technologies, due to their maturity, low cost, and widespread availability. Third, energy intensity estimates for AM processes vary widely across studies, primarily due to different material selections, component geometries, and data collection methods, which preclude direct comparisons of study results. Fourth, none of the studies considered application performance improvements due to changes in component geometries or, by extension, the environmental implications of such performance improvements.
Given the scope of the project, the literature regarding cost issues was limited to energy consumption by AM processes and conventional manufacturing technologies (i.e., bulk-forming and subtractive processes). In most of the research reported in the literature, specific energy consumption (SEC) is expressed in either MJ or kWh per kg (or volume) of material deposited. Only one study was found in the literature comparing these three manufacturing processes. Additionally, only a few studies were found that examined specific AM technology processes.
Yoon et al. (2014) performed a literature review regarding specific energy consumption (SEC) of various processes categorized as bulk-forming, additive, or subtractive manufacturing; they also investigated specific processes as case studies to compare results. The range of values from their literature review are summarized in Table 6; case study values were similar.
Specific Energy Consumption
(Data obtained from Yoon et al., 2014)
Yoon et al. (2014) found that the SEC of additive processes was about 100 times greater than bulk-forming processes and that subtractive processes, with SEC values ranging from 1–100s of kWh/kg, and consumed the least amount of energy. However, they
^Åèìáëáíáçå=oÉëÉ~êÅÜ=mêçÖê~ãW=`êÉ~íáåÖ=póåÉêÖó=Ñçê=fåÑçêãÉÇ=`Ü~åÖÉ= - 276 -
noted a clear case of economy of scales. If only one item is being produced, the SEC was lower for additive processes; as the number of items being produced increased, the SEC of bulk-forming and subtractive processes decreased significantly. Cost had an opposite relationship in which the bulk-forming cost was greater than the additive cost when three or fewer items were being produced; when the number of items exceeded three, the additive cost increased sharply. When examining AM processes alone, they also found that there was no significant difference between plastic and metal methods. Therefore, Yoon et al. (2014) concluded that both energy consumption and production cost should be carefully considered, and that both are related to production quantities.
In earlier work, Gutowski et al. (2009) developed an empirically observed relationship between the energy consumption rate (J/kg) and the process rate (kg/h) for manufacturing processes; they subsequently found that processes with process rates less than 0.1 kg/h tend to consume at least 100 MJ per kilogram of material processed. Baumers et al. (2011) found similar results when examining two polymeric laser sintering (LS) processes. However, other LS studies have reported that higher process rates use less energy per kilogram of material deposited (Mognol et al., 2006; Morrow et al., 2006). Baumers et al. (2011) attribute this to better capacity utilization. Related to capacity utilization, Mognol et al. (2006) also demonstrated that AM energy consumption is affected by orientation in terms of the Z height of the item being produced. Telenko and Seepersad (2010) also suggest that Z height and the density of the items being produced affect energy consumption.
Baumers et al. (2010) compared the electricity consumption of selective laser melting and electron beam melting (two metallic AM processes). They showed that efficiencies for parallel processes differ significantly between production maximizing capacity utilization and one-off items. Furthermore, they also found that energy consumption is affected by material selection and layer thickness. Therefore, to substantiate claims that AM is more energy efficient than conventional manufacturing processes, they proposed that summary metrics (e.g., kWh/cm³ or kWh/g) should be used.
In follow-on work, Baumers et al. (2011) compared the electricity consumption of two polymeric LS processes and demonstrated that energy consumption can be represented by job-dependent, time-dependent, geometry-dependent, and Z-height-dependent categories. Their analysis showed that the majority of LS energy consumption (56–61%) occurred during time-dependent activities. This was consistent with work by Lindemann (2012) showing that machine costs account for 73% of the costs. The calculated energy consumption rate of 36.04kWh/kg for their experiment was consistent with results reported in the literature (Baumers et al., 2011). Their primary conclusion was that productivity is a key factor in determining energy efficiency. Additionally, they suggest that energy efficiency is less for AM processes using a moving head for material deposition than processes using powder bed platforms.
Baumers et al. (2011) provided an overview of electricity consumption with several AM processes and reported energy consumption rates ranging from 61 to 4,849 MJ per kg deposited. Comparing the production of a single item to production maximizing capacity utilization, they concluded that capacity utilization is critical to energy efficient processes. In their experiments, energy savings ranged from 3.17% for FDM to 97.79% for LS processes. For LS and EBM processes specifically, full capacity utilization resulted in much greater energy efficiency compared to producing a single item. On the other hand, full capacity utilization resulted in minimal energy savings for FDM processes (primarily because system warm-up and cool-down are not as critical). Therefore, the use of FDM would be more applicable for serial processes. In summary, their results show that full capacity operation
^Åèìáëáíáçå=oÉëÉ~êÅÜ=mêçÖê~ãW=`êÉ~íáåÖ=póåÉêÖó=Ñçê=fåÑçêãÉÇ=`Ü~åÖÉ= - 277 -
results in less energy consumption per kg of material deposited for all operating scenarios and materials used in their experiments.
After studying a Direct Metal Laser Sintering (DMLS) system, Baumers et al. (2012) found that energy consumption and production cost should not be considered dependent on production quantity. Instead, they suggest that capacity utilization is the primary factor determining process efficiency. After optimizing the build configuration using a volume packing algorithm, they developed a model using parameters for speed, energy consumption, and production cost. The time and energy consumption model they developed, which was validated experimentally, is shown in Equations 2 and 3,
1 1 1
( )( )yz x
Build Job Time Voxel xyzz y x
T T l T
(2)
1 1 1
( )(T ) ( )( )yz x
Build Job Time Build Energy Voxel xyzz y x
E E E l E
(3)
where TBuild and EBuild are the estimated build time and energy investment, respectively, for the complete build operation; TJob and EJob are the time and energy, respectively, associated with machine start-up; ETime is the energy consumption rate (MJ/s); αTime and αEnergy are the time and energy, respectively, associated with adding each layer of material; is the total number of layers; and TVoxel xyz and EVoxel xyz are the time and energy required to process each voxel (which is a three-dimensional pixel). The total cost estimate can then be expressed as
( )( ) ( )( ) ( )( )Build Indirect Build Raw material Build EnergyC C T w P E P (4)
where CBuild is the total cost estimate for the build operation, CIndirect is the indirect cost rate, is the mass of all parts manufactured, PRaw material is the unit price of the material used in the AM process, and PEnergy is the price of electricity. Using a full-capacity build experiment consisting of 85 items, Baumers et al. (2012) found that 92.6% of the voxels and 19.8% of the capacity volume were occupied and that 1,059.56 MJ of energy were consumed. This equated to 1.96 MJ/cm³ at a production cost of 5.71 £/cm³. Their results further demonstrated the importance of considering capacity utilization when determining cost and energy consumption metrics to reflect efficient processes.
Baumers et al. (2012) found that the single-step nature of additive processes facilitates the ability to measure energy consumption and production costs. However, since AM processes can simultaneously produce multiple items in a parallel fashion (Ruffo et al., 2006), the degree of capacity utilization affects energy consumption and production cost metrics (Ruffo et al., 2006; Ruffo & Hague, 2007; Baumers et al., 2011; Baumers et al., 2012). Therefore, it is necessary to allocate the total cost and energy consumption to each item being produced in an equitable manner. Baumers et al. (2012) concluded that the quantity and variety of items, in combination with the capability to utilize the available machine capacity, have an impact on process efficiency in terms of both energy and cost. Similarly, Lindemann et al. (2012) showed that AM is more attractive to companies involved in batch production who can maximize capacity utilization.
^Åèìáëáíáçå=oÉëÉ~êÅÜ=mêçÖê~ãW=`êÉ~íáåÖ=póåÉêÖó=Ñçê=fåÑçêãÉÇ=`Ü~åÖÉ= - 278 -
Conclusions The experiments conducted during this research showed that both layer height and
raster angle orientation impact the mechanical properties of the specimen manufacturing using the FFF process. Specifically, layer height was significant in influencing tensile modulus, ultimate tensile strength, and percent strain at break; and raster angle orientation was significant in influencing tensile modulus, yield stress, percent strain at yield, and percent strain at break. The optimal condition maximizing tensile modulus, ultimate tensile strength, and percent strain at break is a layer height of 0.1 mm and a ±45 raster angle orientation. The optimal condition that maximizes yield stress is a layer height of 0.1 mm and a 0/90 raster angle orientation. The optimal condition that maximizes percent strain at yield is a layer height of 0.2 mm and a 0/90 raster angle orientation. Additionally, the ultimate tensile strength and tensile modulus were lower for the FFF nylon than compression-molded nylon; however, the percent elongation at break was comparable. Finally, the composite specimen that was tested had an ultimate tensile strength of 121.1 MPa and a tensile modulus of 9.9 GPa.
Based on the limited literature review for cost and energy, the following points should be considered regarding energy consumption by AM processes. The most critical factor determining process efficiency, both in terms of energy consumption and production cost, appears to be capacity utilization. This implies that costs and energy consumption must be allocated in an equitable manner, which means that summary metrics (e.g., kWh/cm³ or kWh/g) must be used. Other factors, which can be related to capacity utilization, include Z height, density, material selection, and layer thickness. However, the time-dependent nature of energy consumption must also be considered; for example, LS and EBM processes benefit greatly from full capacity utilization while FDM processes benefit minimally.
Research Implications The research shows that the mechanical properties of FFF-manufactured items are
impacted by changing the process parameters of layer height and raster angle orientation. In the future, it is likely that engineers will be able to use additive manufacturing to create materials that meet certain performance requirements by specifying a unique treatment of additive manufacturing process parameters. Furthermore, measuring the density of additively manufactured parts could be a non-destructive method of quality assurance. The results from the density investigation revealed that different levels of density showed differences in the mean mechanical properties. The FFF nylon specimens with a “high” level of density showed greater ultimate tensile strength and tensile modulus compared to the FFF nylon specimens with a “low” level of density.
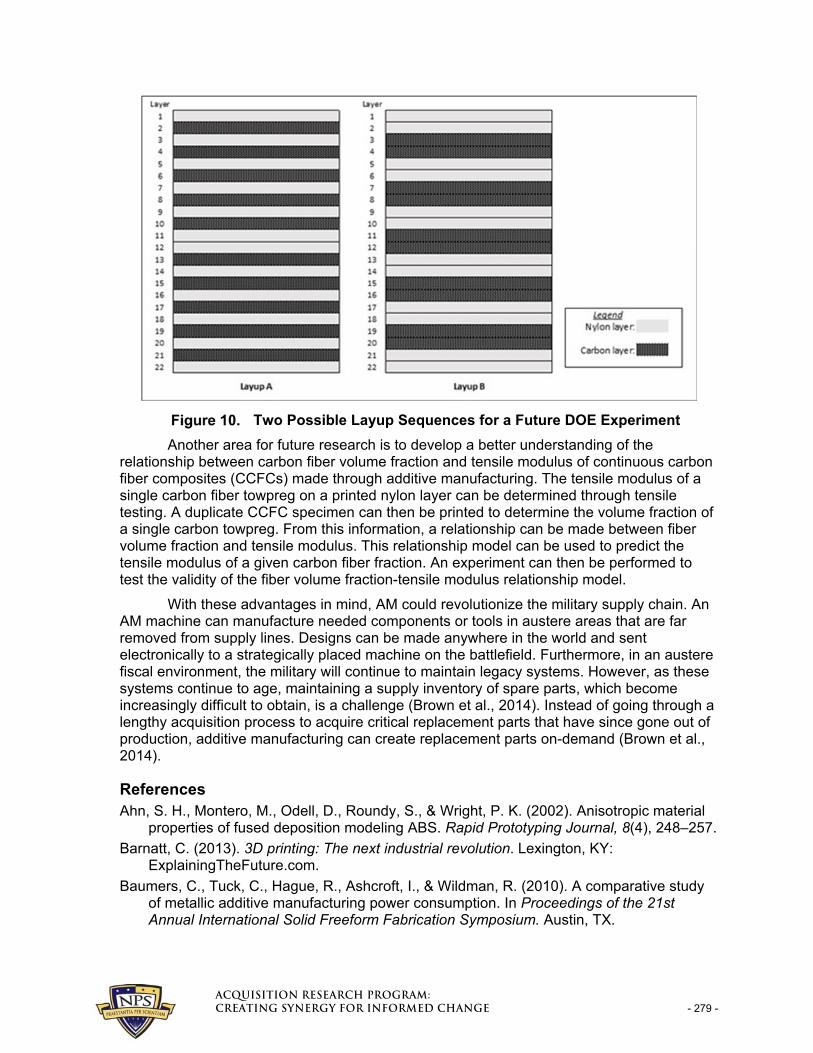
An area for future research is to investigate how different nylon and fiber layup sequences influence mechanical properties. Two possible layup sequences that could be tested are shown in Figure 10. Each sequence has the same number of nylon and carbon fiber layers, with 10 carbon fiber layers and 12 nylon layers. Each layup is also symmetric about the center of the layup to prevent moment forces from influencing testing results. For layup A, each carbon layer is sandwiched between two layers of nylon. For layup B, the layers alternate between two nylon layers and two carbon fiber layers.
^Åèìáëáíáçå=oÉëÉ~êÅÜ=mêçÖê~ãW=`êÉ~íáåÖ=póåÉêÖó=Ñçê=fåÑçêãÉÇ=`Ü~åÖÉ= - 279 -
Two Possible Layup Sequences for a Future DOE Experiment
Another area for future research is to develop a better understanding of the relationship between carbon fiber volume fraction and tensile modulus of continuous carbon fiber composites (CCFCs) made through additive manufacturing. The tensile modulus of a single carbon fiber towpreg on a printed nylon layer can be determined through tensile testing. A duplicate CCFC specimen can then be printed to determine the volume fraction of a single carbon towpreg. From this information, a relationship can be made between fiber volume fraction and tensile modulus. This relationship model can be used to predict the tensile modulus of a given carbon fiber fraction. An experiment can then be performed to test the validity of the fiber volume fraction-tensile modulus relationship model.
With these advantages in mind, AM could revolutionize the military supply chain. An AM machine can manufacture needed components or tools in austere areas that are far removed from supply lines. Designs can be made anywhere in the world and sent electronically to a strategically placed machine on the battlefield. Furthermore, in an austere fiscal environment, the military will continue to maintain legacy systems. However, as these systems continue to age, maintaining a supply inventory of spare parts, which become increasingly difficult to obtain, is a challenge (Brown et al., 2014). Instead of going through a lengthy acquisition process to acquire critical replacement parts that have since gone out of production, additive manufacturing can create replacement parts on-demand (Brown et al., 2014).
References Ahn, S. H., Montero, M., Odell, D., Roundy, S., & Wright, P. K. (2002). Anisotropic material
properties of fused deposition modeling ABS. Rapid Prototyping Journal, 8(4), 248–257.
Barnatt, C. (2013). 3D printing: The next industrial revolution. Lexington, KY: ExplainingTheFuture.com.
Baumers, C., Tuck, C., Hague, R., Ashcroft, I., & Wildman, R. (2010). A comparative study of metallic additive manufacturing power consumption. In Proceedings of the 21st Annual International Solid Freeform Fabrication Symposium. Austin, TX.
^Åèìáëáíáçå=oÉëÉ~êÅÜ=mêçÖê~ãW=`êÉ~íáåÖ=póåÉêÖó=Ñçê=fåÑçêãÉÇ=`Ü~åÖÉ= - 280 -
Baumers, M., Tuck, C., Bourell, D. L., Sreenivasan, R., & Hague, R. (2011). Sustainability of additive manufacturing: Measuring the energy consumption of the laser sintering process. Proceedings of the Institution of Mechanical Engineers, Part B: Journal of Engineering Manufacture, 225(12), 2228–2239.
Baumers, C., Tuck, C., Wildman, R., Ashcroft, I., & Hague, R. (2011). Energy inputs to additive manufacturing: Does capacity utilization matter? In Proceedings of the 22nd Annual International Solid Freeform Fabrication Symposium. Austin, TX.
Baumers, M., Tuck, C., Wildman, R., Ashcroft, I., Rosamond, E., & Hague, R. (2012). Combined build-time, energy consumption, and cost estimation for direct metal laser sintering. In Proceedings of the 23rd Annual International Solid Freeform Fabrication Symposium. Austin, TX.
Black, S. (2014, May). 3D printing continuous carbon fiber composites? High-Performance Composites.
Brown, R., Davis, J., Dobson, M., & Mallicoat, D. (2014, May–June). 3D printing: How much will it improve the dod supply chain of the future? Defense Acquisition, Technology and Logistics, 6–10.
Callister, W. D., & Rethwisch, D. G. (2012). Fundamentals of materials science and engineering: An integrated approach. John Wiley & Sons.
Daniel, I. M., & Ishai, O. (2003). Engineering mechanics of composite materials (2nd. ed.). New York, NY: Oxford University Press.
Foran, B., Lenzen, M., Dey, C., & Bilek, M. (2005). Integrating sustainable chain management with triple bottom line accounting. Ecological Economics, 52(2), 143–157.
Gibson, I., Rosen, D. W., & Stucker, B. (2010). Extrusion-based systems. In Additive manufacturing technologies: Rapid prototyping to direct digital manufacturing (pp. 160–186). Springer US.
Gutowski, T., Branham, M., Dahmus, J., Jones, A., Thiriez, A., & Sekulic, D. (2009). Thermodynamic analysis of resources used in manufacturing processes. Environmental Science & Technology, 43(5), 1584–1590.
Horn, T., & Harrysson, O. (2012). Overview of current additive manufacturing technologies and selected applications. Science Progress, 95(3), 255–282.
Huang, R., Liu, P., Mokasdar, A., & Hou, L. (2013). Additive manufacturing and its societal impact: A literature review. Journal of Advanced Manufacturing Technology, 67, 1191–1203.
Huang, R., Riddle, M., Graziano, D., Warren, J., Das, S., Nimbalker, S., Cresko, J., & Masanet, E. (2015). Energy and emissions saving potential of additive manufacturing: The case of lightweight aircraft components. Journal of Cleaner Production. http://dx.doi.org/doi:10.1016/j.jclepro.2015.04.109
Lindemann, C., Jahnke, U., Moi, M., & Koch, R. (2012). Analyzing product lifecycle costs for a better understanding of cost drivers in additive manufacturing. In Proceedings of the 23rd Annual International Solid Freeform Fabrication Symposium. Austin, TX.
Lindemann, C., Jahnke, U., Moi, M., & Koch, R. (2013). Impact and influence factors of additive manufacturing on product lifecycle costs. In Proceedings of the 24th Annual International Solid Freeform Fabrication Symposium. Austin, TX.
Love, L. J., Kunc, V., Elliot, A., & Blue, C. (2014). The importance of carbon fiber to polymer additive manufacturing. Journal of Materials Research, 29(17), 1893–1898.
^Åèìáëáíáçå=oÉëÉ~êÅÜ=mêçÖê~ãW=`êÉ~íáåÖ=póåÉêÖó=Ñçê=fåÑçêãÉÇ=`Ü~åÖÉ= - 281 -
Mani, M., Lyons, K., & Gupta, S. (2014). Sustainability characterization for additive manufacturing. Journal of Research of the National Institute of Standards and Technology, 119, 419–428.
MatWeb, LLC. (2015, August 28). Retrieved from MatWeb: Material Property Data website: http://www.matweb.com/
Meteyer, S., Xu, X., Perry, N., & Zhao, Y. (2014). Energy and material flow analysis of binder-jetting additive manufacturing processes. 21st CIRP Conference on Life-Cycle Engineering, Trondheim, Norway.
Mognol, P., Lepicart, D., & Perry, N. (2006). Rapid prototyping: Energy and environment in the spotlight. Rapid Prototyping Journal, 12(1), 26–34.
Morrow, W., Qi, H., Kim, I., Mazumder, J., & Skerlos, S. (2007). Environmental aspects of laser-based and conventional tool and die manufacturing. Journal of Cleaner Production, 15, 932–943.
Namiki, M., Ueda, M., Todoroki, A., Hirano, Y., & Matsuzaki, R. (2014). 3D printing of continuous fiber reinforced plastic. In Proceedings of SAMPE Seattle. Seattle, WA.
Oak Ridge National Laboratory. (2010). Aerospace Workshop planning session summary report. DOE/ITP/ORNL.
Ruffo, M., & Hague, R. (2007). Cost estimation for rapid manufacturing—Simultaneous production of mixed components using laser sintering. Proceedings of the Institution of Mechanical Engineers, Part B: Journal of Engineering Manufacture, 221(11), 1585–1591.
Ruffo, M., Tuck, C., & Hague, R. (2006). Cost estimation for rapid manufacturing—Laser sintering production for low to medium volumes. Proceedings of the Institution of Mechanical Engineers, Part B: Journal of Engineering Manufacture, 220(9), 1417–1427.
Schroeder, M., Falk, B., & Schmitt, R. (2015). Evaluation of cost structures of additive manufacturing processes using a new business model. 22nd CIRP Conference on Life-Cycle Engineering, Sydney, Australia.
Serres, N., Tidu, D., Sankare, S., & Hlawka, F. (2011). Environmental comparison of MESO-CLAD® process and conventional machining implementing life-cycle assessment. Journal of Cleaner Production, 19, 1117–1124.
Tuck, C., Hague, R., Ruffo, M., Ransley, M., & Adams, P. (2008). Rapid manufacturing facilitated customization. International Journal of Computer Integrated Manufacturing, 21(3), 245–258.
Yoon, H., Lee, J., Kim, H., Kim, M., Kim, E., Shin, Y., Chu, W., & Ahn, S. (2014). A comparison of energy consumption in bulk forming, subtractive, and additive processes: Review and case study. International Journal of Precision Engineering and Manufacturing–Green Technology, 1(3), 261–279.
Acknowledgments We thank our colleagues, Lt Col Chad Ryther and Dr. Craig Przybyla, from the Air
Force Research Laboratory’s Materials & Manufacturing Directorate (AFRL/RX) for their expertise and insight greatly assisting this research. Without their support and partnership, this work would not have been possible.

^Åèìáëáíáçå=oÉëÉ~êÅÜ=mêçÖê~ã=dê~Çì~íÉ=pÅÜççä=çÑ=_ìëáåÉëë=C=mìÄäáÅ=mçäáÅó=k~î~ä=mçëíÖê~Çì~íÉ=pÅÜççä=RRR=aóÉê=oç~ÇI=fåÖÉêëçää=e~ää=jçåíÉêÉóI=`^=VPVQP=
www.acquisitionresearch.net
Air University: The Intellectual and Leadership Center of the Air Force Aim High…Fly - Fight - Win
The AFIT of Today is the Air Force of Tomorrow.
Air Force Institute of Technology
Materials Testing and Cost Modeling for Composite Parts
Through Additive Manufacturing
Eric S. Holm Vhance V. Valencia Alfred E. Thal, Jr.
Jason K. Freels Adedeji B. Badiru
1
Air University: The Intellectual and Leadership Center of the Air Force Aim High…Fly - Fight - Win
The AFIT of Today is the Air Force of Tomorrow.
Additive Manufacturing Benefits
• Avoid tools, dies, and material waste associated with conventional manufacturing (Morrow et al., 2007; Serres et al., 2011)
• Produce small quantities of customized items at relatively low average unit cost (Baumers et al., 2011)
• Geometric constraints typical of formative and subtractive processes eliminated (Tuck et al., 2008; Baumers et al., 2011)
• Advanced freeform fabrication (Meteyer et al., 2014) • Geometrically complex and novel items (Horn and Harrysson,
2012; Mani et al., 2014) • Environmental benefits and performance improvements
• 12:1 to 25:1 “buy-to-fly” ratio (ORNL, 2010; Huang et al., 2015) • Aircraft industry … $3,000 annual fuel savings per kilogram reduction
in mass (Lindemann et al., 2013) and 6.4% reduction in fuel consumption (Huang et al., 2015)
2
Air University: The Intellectual and Leadership Center of the Air Force Aim High…Fly - Fight - Win
The AFIT of Today is the Air Force of Tomorrow.
Additive Manufacturing Limitations
• Ruffo and Hague (2007) • Material selection and characteristics • Process productivity • Accuracy of product dimensions
• Huang et al., (2015) • Low throughput • Geometric repeatability • Residual stresses
• Schroeder et al. (2015) • High rejection rates (operator or machine failures) • Industry standard for product quality rarely achieved
3
• Surface quality • Repeatability • Unit cost at medium and
high volumes
• Precision • Fatigue resistance • Surface quality and high
surface roughness
Air University: The Intellectual and Leadership Center of the Air Force Aim High…Fly - Fight - Win
The AFIT of Today is the Air Force of Tomorrow.
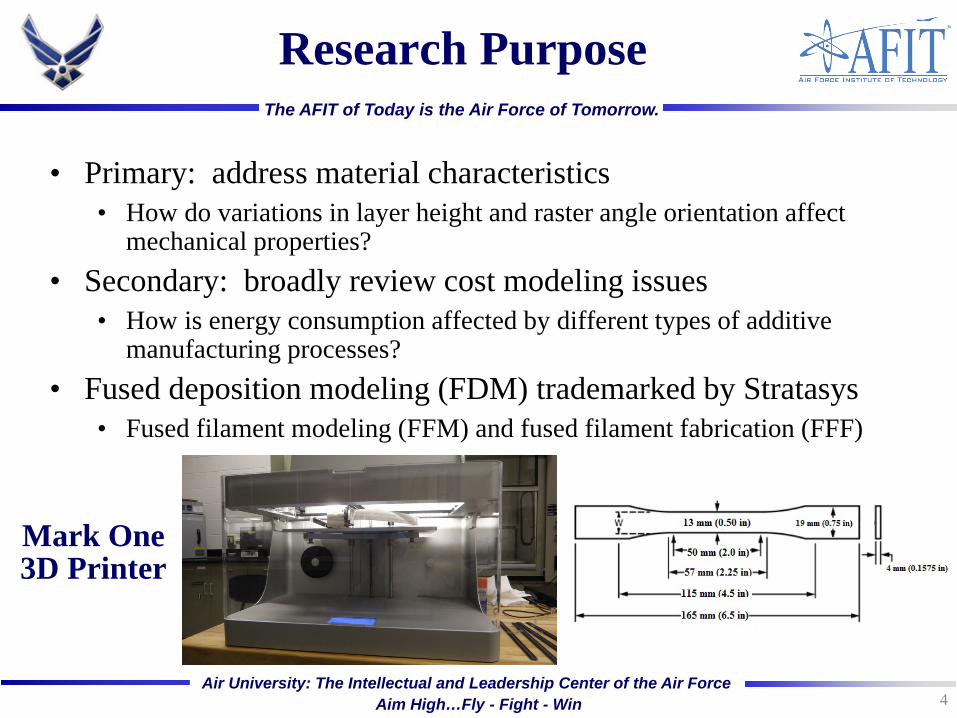
Research Purpose
• Primary: address material characteristics • How do variations in layer height and raster angle orientation affect
mechanical properties? • Secondary: broadly review cost modeling issues
• How is energy consumption affected by different types of additive manufacturing processes?
• Fused deposition modeling (FDM) trademarked by Stratasys • Fused filament modeling (FFM) and fused filament fabrication (FFF)
4
Mark One 3D Printer
Air University: The Intellectual and Leadership Center of the Air Force Aim High…Fly - Fight - Win
The AFIT of Today is the Air Force of Tomorrow.
Experimental Factors
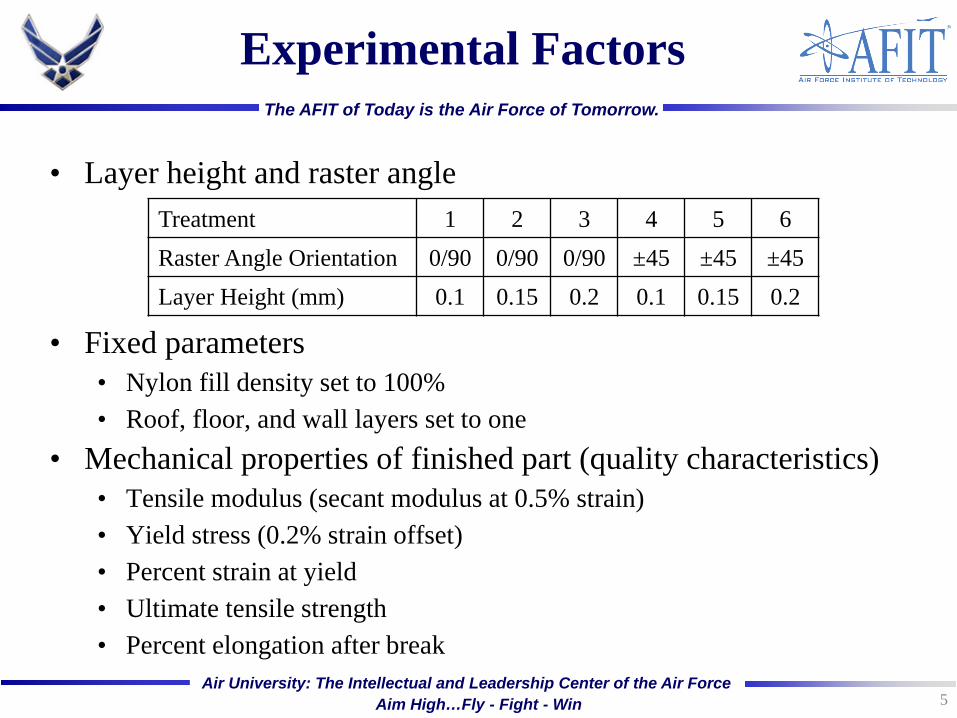
• Layer height and raster angle
• Fixed parameters • Nylon fill density set to 100% • Roof, floor, and wall layers set to one
• Mechanical properties of finished part (quality characteristics) • Tensile modulus (secant modulus at 0.5% strain) • Yield stress (0.2% strain offset) • Percent strain at yield • Ultimate tensile strength • Percent elongation after break
5
Treatment 1 2 3 4 5 6 Raster Angle Orientation 0/90 0/90 0/90 ±45 ±45 ±45 Layer Height (mm) 0.1 0.15 0.2 0.1 0.15 0.2
Air University: The Intellectual and Leadership Center of the Air Force Aim High…Fly - Fight - Win
The AFIT of Today is the Air Force of Tomorrow.
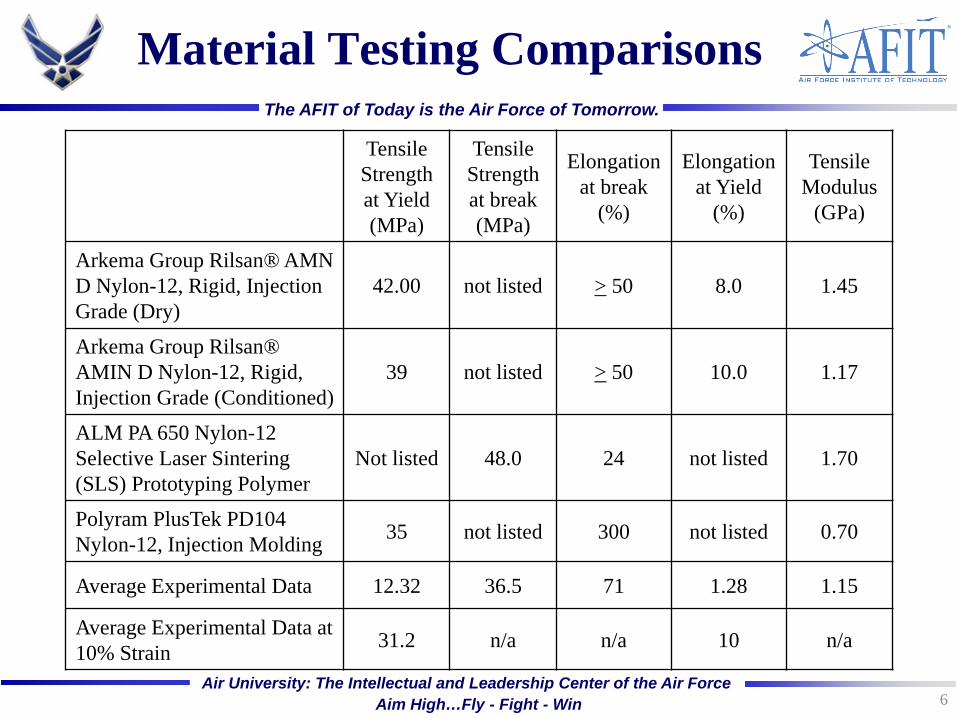
Material Testing Comparisons
6
Tensile Strength at Yield (MPa)
Tensile Strength at break (MPa)
Elongation at break
(%)
Elongation at Yield
(%)
Tensile Modulus
(GPa)
Arkema Group Rilsan® AMN D Nylon-12, Rigid, Injection Grade (Dry)
42.00 not listed > 50 8.0 1.45
Arkema Group Rilsan® AMIN D Nylon-12, Rigid, Injection Grade (Conditioned)
39 not listed > 50 10.0 1.17
ALM PA 650 Nylon-12 Selective Laser Sintering (SLS) Prototyping Polymer
Not listed 48.0 24 not listed 1.70
Polyram PlusTek PD104 Nylon-12, Injection Molding 35 not listed 300 not listed 0.70
Average Experimental Data 12.32 36.5 71 1.28 1.15
Average Experimental Data at 10% Strain 31.2 n/a n/a 10 n/a
Air University: The Intellectual and Leadership Center of the Air Force Aim High…Fly - Fight - Win
The AFIT of Today is the Air Force of Tomorrow.
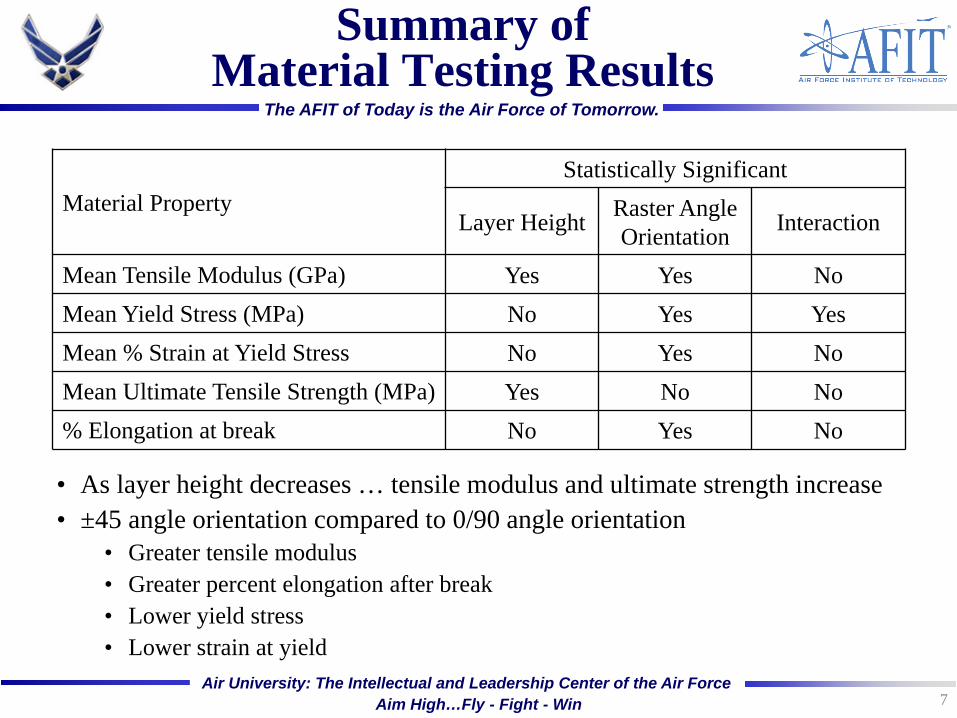
Summary of Material Testing Results
7
Material Property Statistically Significant
Layer Height Raster Angle Orientation Interaction
Mean Tensile Modulus (GPa) Yes Yes No Mean Yield Stress (MPa) No Yes Yes Mean % Strain at Yield Stress No Yes No Mean Ultimate Tensile Strength (MPa) Yes No No % Elongation at break No Yes No
• As layer height decreases … tensile modulus and ultimate strength increase • ±45 angle orientation compared to 0/90 angle orientation
• Greater tensile modulus • Greater percent elongation after break • Lower yield stress • Lower strain at yield
Air University: The Intellectual and Leadership Center of the Air Force Aim High…Fly - Fight - Win
The AFIT of Today is the Air Force of Tomorrow.
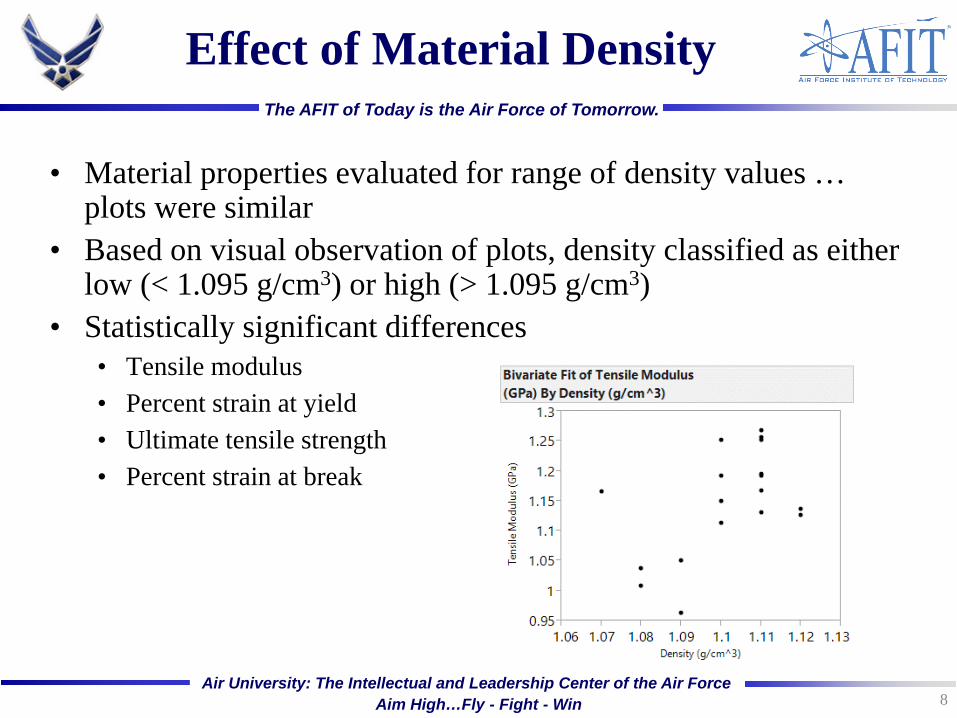
Effect of Material Density
• Material properties evaluated for range of density values … plots were similar
• Based on visual observation of plots, density classified as either low (< 1.095 g/cm3) or high (> 1.095 g/cm3)
• Statistically significant differences • Tensile modulus • Percent strain at yield • Ultimate tensile strength • Percent strain at break
8
Air University: The Intellectual and Leadership Center of the Air Force Aim High…Fly - Fight - Win
The AFIT of Today is the Air Force of Tomorrow.
Specific Energy Consumption (SEC) (Yoon et al., 2014)
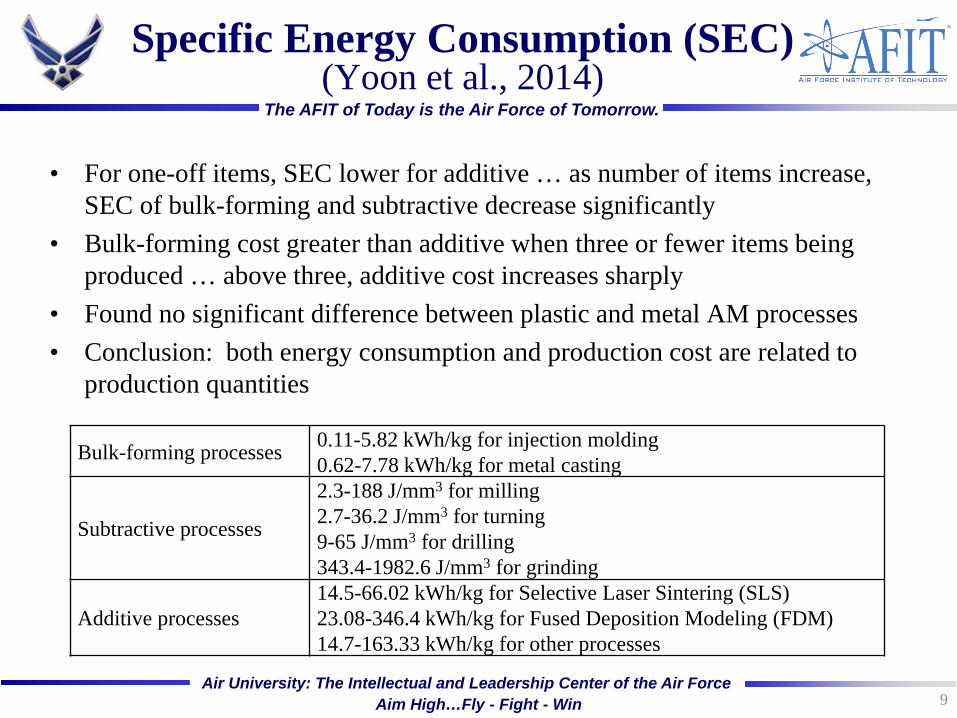
• For one-off items, SEC lower for additive … as number of items increase, SEC of bulk-forming and subtractive decrease significantly
• Bulk-forming cost greater than additive when three or fewer items being produced … above three, additive cost increases sharply
• Found no significant difference between plastic and metal AM processes • Conclusion: both energy consumption and production cost are related to
production quantities
9
Bulk-forming processes 0.11-5.82 kWh/kg for injection molding 0.62-7.78 kWh/kg for metal casting
Subtractive processes
2.3-188 J/mm3 for milling 2.7-36.2 J/mm3 for turning 9-65 J/mm3 for drilling 343.4-1982.6 J/mm3 for grinding
Additive processes 14.5-66.02 kWh/kg for Selective Laser Sintering (SLS) 23.08-346.4 kWh/kg for Fused Deposition Modeling (FDM) 14.7-163.33 kWh/kg for other processes
Air University: The Intellectual and Leadership Center of the Air Force Aim High…Fly - Fight - Win
The AFIT of Today is the Air Force of Tomorrow.
Cost Modeling
• Baumers et al. (2010) compared electricity consumption for selective laser melting and electron beam melting • Differences between maximizing capacity utilization and one-off items • Energy consumption affected by material selection and layer thickness • Proposed summary metrics … kWh/cm3 or kWh/g
• Baumers et al. (2011) categorized energy consumption • Job, time, geometry, and Z-height • Time-dependent activities consumed 56-61% of energy
• Lindemann (2012) … machine time accounts for 73% of costs • Bottom line … capacity utilization is critical to energy
efficient processes (Baumers et al., 2011) • Energy savings ranged from 3.2% for FDM to 97.8% for LS • Full capacity operation uses less energy per mass of material deposited
for all operating scenarios and materials they tested
10
Air University: The Intellectual and Leadership Center of the Air Force Aim High…Fly - Fight - Win
The AFIT of Today is the Air Force of Tomorrow.
Cost Modeling
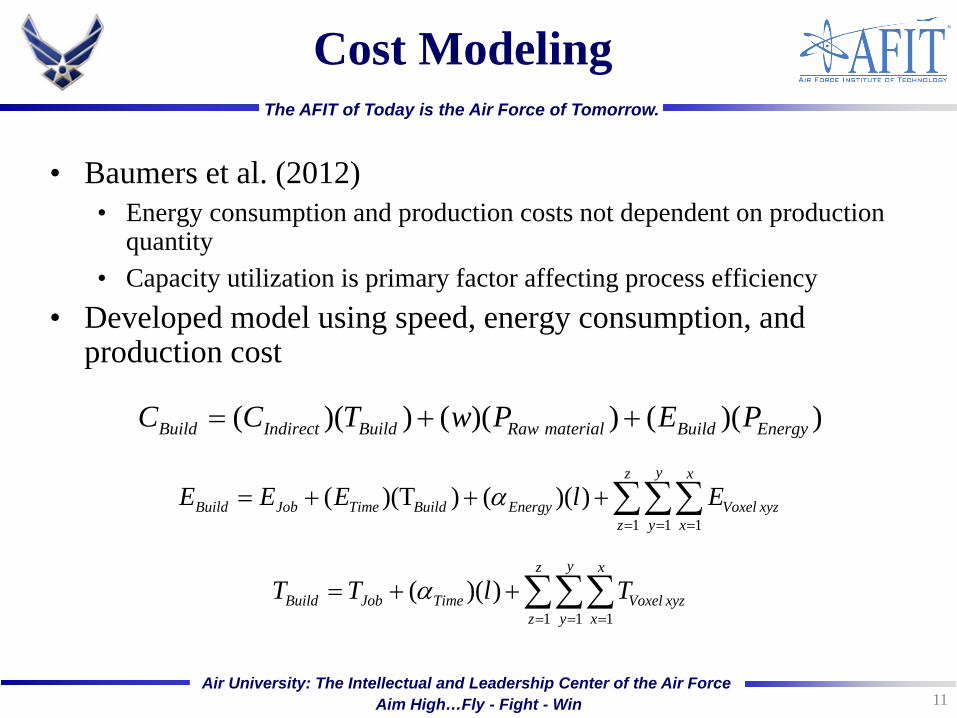
• Baumers et al. (2012) • Energy consumption and production costs not dependent on production
quantity • Capacity utilization is primary factor affecting process efficiency
• Developed model using speed, energy consumption, and production cost
11
( )( ) ( )( ) ( )( )Build Indirect Build Raw material Build EnergyC C T w P E P= + +
1 1 1( )(T ) ( )( )
yz x
Build Job Time Build Energy Voxel xyzz y x
E E E l Eα= = =
= + + +∑∑∑
1 1 1( )( )
yz x
Build Job Time Voxel xyzz y x
T T l Tα= = =
= + +∑∑∑
Air University: The Intellectual and Leadership Center of the Air Force Aim High…Fly - Fight - Win
The AFIT of Today is the Air Force of Tomorrow.
Final Cost Thoughts
• Baumers et al. (2012) concluded that quantity and variety of items, along with utilizing available machine capacity, affect process efficiency for both energy and cost
• Lindemann et al. (2012) showed that AM more attractive for batch production that can maximize capacity utilization
• Costs and energy consumption must be allocated in an equitable manner … which means that summary metrics like kWh/cm3 or kWh/g must be used
12
Air University: The Intellectual and Leadership Center of the Air Force Aim High…Fly - Fight - Win
The AFIT of Today is the Air Force of Tomorrow.
SEM Photographs
13

Air University: The Intellectual and Leadership Center of the Air Force Aim High…Fly - Fight - Win
The AFIT of Today is the Air Force of Tomorrow.
Questions?
14


![mêçÅÉÉÇáåÖë= - DTIC · Russia Council. Research interests include disruptive innovations in defense acquisition and the study of design skills. [gene.warner@me.com] or [eugene.e.warner4.civ@mail.mil]](https://img.pdfslide.net/doc/110x75/5e69345924b94a2a8218a944/m-dtic-russia-council-research-interests-include-disruptive.jpg)