Embed Size (px)
Citation preview
CY2017AssessmentAnalysis_final.docx Page 1 of 21
M E M O R A N D U M
February 3, 2016
To: Patrick Allen, Director, DCBS
Berri Leslie, Administrator, Oregon Health Insurance Marketplace
Carolina Marquette, Financial Services Manager
From: Gary Helmer, Senior Economist, DCBS
Subject: Oregon Health Insurance Marketplace (OHIM) Report on Administrative Charges for
CY 2017
Issue
DCBS needs to determine assessment rates for individual medical plans and for stand-alone
dental plans for CY 2017. The current assessment rates are $9.66 per member per month
(PMPM) for members of individual medical health plans and $0.97 PMPM for members of
stand-alone dental plans.
This memo provides calculations of the needed rates, an evaluation of the rates compared to the
statutory cap on assessments, and a comparison of the fund balance to the statutory fund balance
limit.
The financial stability of the OHIM fund depends on having revenue that covers expenditures
over a long time period. Therefore, although the focus of the analysis is on the next two years,
the analysis extends through CY 2021. The analysis first discusses the expenditure assumptions
and the revenue transferred from the Oregon Health Authority (OHA). It then provides a model
of marketplace enrollment through CY 2021, and the revenue generated by various assessment
rates. It ends with an analysis of the possible financial outcomes and a comparison of the
outcomes to the statutory caps.
Summary
The previous financial analyses have forecast a revenue surplus of several million dollars per
year. The CY 2016 enrollment has caused us to increase the long-term enrollment forecast by
more than 30 percent. The combination of these two items means that the assessment rates can
be lowered by nearly 40 percent.
We have modeled a medical assessment rate of $6.00 PMPM and a stand-alone dental
assessment rate of $0.57 PMPM.
Statute requires a rebate of funds above six months of expenditures. This rebate will be done as a
credit against future assessments. We will show three scenarios for this set of assessment rates:
the financial outcomes without regard to the statutory fund balance cap, financial outcomes with
annual credits as currently defined in the OAR, and financial outcomes with biennial credits.

CY2017AssessmentAnalysis_final.docx Page 2 of 21
Summary of assumptions
The Financial Services Manager’s February 2016 planned expenditures model for the 2015-
2017 and 2017-2019 biennia is used. This model includes actual expenditures through
December 2015. It also includes planned shared services expenditures for the 2015-2017 and
2017-2019 biennia.
The planned shared services expenditures for the 2015-2017 biennium are used. They are
forecast to grow at 3 percent per year in the 2017-2019 biennium. This is a standard
assumption DCBS uses for forecasting when no other information is available.
Expenditures are forecast to grow 3 percent per year after the 2017-2019 biennium.
The Financial Services Manager’s model of revenue transfers from the OHA for the 2015-
2017 and 2017-2019 biennia is used. The model includes actual revenue through December
2015.
The medical-plan enrollment forecast is based on early CY 2016 figures for CY 2016
enrollment, estimates of Oregon’s population growth, the percentages of eligible individuals
who purchase insurance, and the percentages who enroll through the exchange.
The initial analysis is for the current program, with and without the fund balance cap. The
fund cap is modeled two ways. The first model is for December-ending fund balances, as is
currently written in the OAR; the second model is for biennium-ending fund balances.
Federal charges are assumed to be collected by the federal government.
Neither revenue nor expenditures for the Small Business Health Options Program (SHOP)
are included in the analyses. These are unknown.

CY2017AssessmentAnalysis_final.docx Page 3 of 21
OHIM expenditures and transfers
OHIM planned expenditures
The table below shows actual expenditures through December 2015, detailed planned
expenditures for the rest of the biennium, and a summary of planned expenditures for the 2017-
2019 biennium.
Marketplace FY 2016 FY 2017
2015-2017
total FY 2018 FY 2019
2017-2019
total
Personal services $1,443,660 $1,512,570 $2,956,230
Services and supplies
Publicity & Publications 2,290,200 0 2,290,200
Professional Services 4,430,600 2,830,000 7,260,600
IT Professional Services 2,726,874 1,501,706 4,228,580
Attorney General Legal Fees 1,139,078 954,698 2,093,776
Facilities Rent & Taxes 166,308 179,232 345,540
Other S&S 212,482 733,425 945,907
Services and supplies total 10,965,541 6,199,061 17,164,602
Special Payments 500,000 500,000 1,000,000
Expenditure total $12,909,201 $8,211,631 $21,120,832
Call Center FY 2016 FY 2017
2015-2017
total FY 2018 FY 2019
2017-2019
total
Personal services $1,019,208 $591,059 $1,610,267
Services and supplies
Telecomm/Tech Svc & Supplies 49,668 90,890 140,558
Professional Services 3,655 2,800 6,455
IT Professional Services 378,000 756,000 1,134,000
Facilities Rent & Taxes 0 0 0
Other S&S 47,651 80,133 127,784
Services and supplies total 478,974 929,823 1,408,797
Expenditure total $1,498,183 $1,520,882 $3,019,065 $0 $0 $0
FY 2016 FY 2017
2015-2017
total FY 2018 FY 2019
2017-2019
total
Marketplace total $14,407,383 $9,732,513 $24,139,897 $10,561,294 $10,561,294 $21,122,587
DCBS Shared Services - Direct $186,860 $107,037 $293,897 $107,961 $107,961 $215,922
DCBS Shared Services - Indirect $534,133 $640,959 $1,175,092 $660,188 $679,994 $1,340,182
Total planned expenditures $15,128,376 $10,480,510 $25,608,885 $11,329,443 $11,349,248 $22,678,691
DCBS Health Insurance Marketplace, planned expenditures, FY 2016 - 2019with actual expenditures through December 2015
CY2017AssessmentAnalysis_final.docx Page 4 of 21
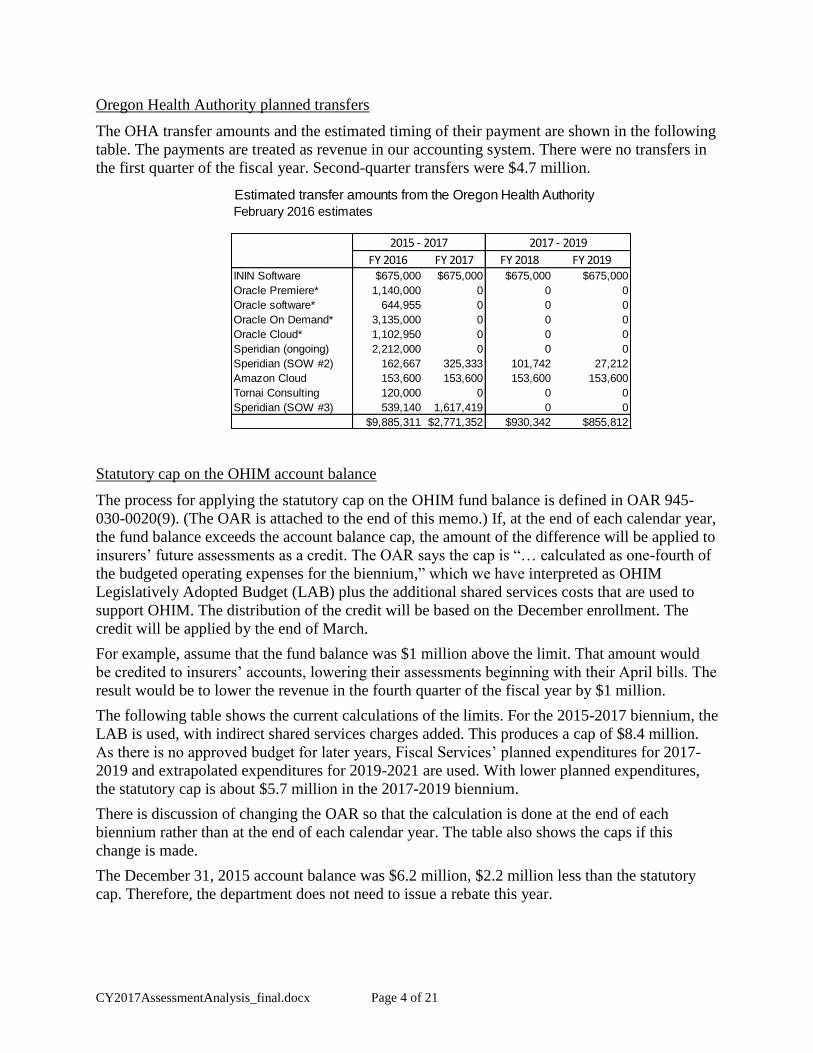
Oregon Health Authority planned transfers
The OHA transfer amounts and the estimated timing of their payment are shown in the following
table. The payments are treated as revenue in our accounting system. There were no transfers in
the first quarter of the fiscal year. Second-quarter transfers were $4.7 million.
Statutory cap on the OHIM account balance
The process for applying the statutory cap on the OHIM fund balance is defined in OAR 945-
030-0020(9). (The OAR is attached to the end of this memo.) If, at the end of each calendar year,
the fund balance exceeds the account balance cap, the amount of the difference will be applied to
insurers’ future assessments as a credit. The OAR says the cap is “… calculated as one-fourth of
the budgeted operating expenses for the biennium,” which we have interpreted as OHIM
Legislatively Adopted Budget (LAB) plus the additional shared services costs that are used to
support OHIM. The distribution of the credit will be based on the December enrollment. The
credit will be applied by the end of March.
For example, assume that the fund balance was $1 million above the limit. That amount would
be credited to insurers’ accounts, lowering their assessments beginning with their April bills. The
result would be to lower the revenue in the fourth quarter of the fiscal year by $1 million.
The following table shows the current calculations of the limits. For the 2015-2017 biennium, the
LAB is used, with indirect shared services charges added. This produces a cap of $8.4 million.
As there is no approved budget for later years, Fiscal Services’ planned expenditures for 2017-
2019 and extrapolated expenditures for 2019-2021 are used. With lower planned expenditures,
the statutory cap is about $5.7 million in the 2017-2019 biennium.
There is discussion of changing the OAR so that the calculation is done at the end of each
biennium rather than at the end of each calendar year. The table also shows the caps if this
change is made.
The December 31, 2015 account balance was $6.2 million, $2.2 million less than the statutory
cap. Therefore, the department does not need to issue a rebate this year.
Estimated transfer amounts from the Oregon Health Authority
February 2016 estimates
FY 2016 FY 2017 FY 2018 FY 2019ININ Software $675,000 $675,000 $675,000 $675,000
Oracle Premiere* 1,140,000 0 0 0
Oracle software* 644,955 0 0 0
Oracle On Demand* 3,135,000 0 0 0
Oracle Cloud* 1,102,950 0 0 0
Speridian (ongoing) 2,212,000 0 0 0
Speridian (SOW #2) 162,667 325,333 101,742 27,212
Amazon Cloud 153,600 153,600 153,600 153,600
Tornai Consulting 120,000 0 0 0
Speridian (SOW #3) 539,140 1,617,419 0 0
$9,885,311 $2,771,352 $930,342 $855,812
2015 - 2017 2017 - 2019

CY2017AssessmentAnalysis_final.docx Page 5 of 21
Marketplace medical-plan enrollment forecast
Insurer monthly reporting
Insurers provide enrollment figures each month. They provide the anticipated enrollment for the
upcoming month and revisions to the history of their monthly enrollment since January 2015.
Therefore, the CY 2015 enrollment figures change each month as insurers provide revised
information.
Since the department took over the marketplace regulation from Cover Oregon, OHIM staff has
worked with the insurers to ensure that they are reporting correctly. As a result, a number of the
insurers revised their reporting. This led to large revisions to their reports. This is illustrated in
the following figure; the light-blue bars reflect the reported enrollment for the month; the dark-
red bars show the revisions. The large revisions through October mostly reflect changes to
insurers’ reporting. Therefore, we have little history from which to predict normal patterns of
revisions. However, we expect that the monthly enrollment figures will tend to vary by several
percent for a couple of months and then change by 0.1 – 0.2 percent with each subsequent report.
The reporting of anticipated enrollment can also cause an issue at the beginning of the calendar
year. As illustrated in the figure, the January enrollment initially reported was low, about 72,500.
The February reports increased the January enrollment to about 106,200.
These adjustments have two impacts. First, it is difficult to use recent data to forecast trends.
Second, it affects the timing of revenues. With the large adjustments, the February 2016 invoices
will total about 80 percent more than the January invoices.
Statutory OHIM fund balance caps
Expenditures Positions FTE 2017-2019 2019-2021
Marketplace $30,525,202 24 24.0 $21,122,587 $22,408,953
Shared Services - direct $1,951,351 10 7.0 $215,922 $229,072
Shared Services - indirect $1,175,092 $1,340,182 $1,421,799
February 2016 revisions
$33,651,645 34 31.0 $22,678,691 $24,059,823
Statutory fund balance caps, annual refund Statutory fund balance caps, biennial refund
December 2015 $8,412,911 June 2017 $8,412,911
December 2016 $8,412,911 June 2019 $5,669,673
December 2017 $5,669,673 June 2021 $6,014,956
December 2018 $5,669,673
December 2019 $6,014,956
December 2020 $6,014,956
2015-2017 LAB Planned expenditures
The caps through June 2017 are based on the 2015-2017 LAB; later caps are based on estimates of
planned expenditures.

CY2017AssessmentAnalysis_final.docx Page 6 of 21
Medical-plan enrollment forecast
We need a long-term enrollment forecast to create OHIM’s long-term revenue forecast. We also
need a long-term forecast of average premium to estimate federal technology charges and to
show that the assessment rates are lower than the statutory caps.
The department’s health insurance actuaries have provided a forecast of enrollment increases and
premiums for CY 2016 and CY 2017. They forecast that individual-market enrollment (both
exchange and direct enrollment) should increase by 13 percent in CY 2016, and then remain
stable. They forecast the average premium to increase by 15 percent for CY 2016 and CY 2017.
These figures are used as a check on the reasonableness of the OHIM model.
The OHIM model used to forecast marketplace enrollment uses the following elements:
Growth of Oregon’s population under 65
Growth in the percentage of individuals with insurance
Percentage of insured individuals who enroll through the exchange
Relation of CMS enrollment to OHIM assessed enrollment
Distribution of enrollment over the calendar year
Note: The September data lacks a report from a large insurer.
(40,000)
0
40,000
80,000
120,000
160,000
Medical-plan enrollment, current month and net prior-month revisions
Current month Net revisions
2014 2015 2016 2017
Enrollment 204,100 208,000 235,000 235,000
Ave. premium $289 $298 $344 $395
Premiums ($millions) $710.0 $750.0 $970.0 $1,110.0
year-to-year percentage change
2014 2015 2016 2017
Enrollment 2% 13% 0%
Ave. premium 3% 15% 15%
Premiums 6% 29% 15%
Individual market estimatesDiv. of Financial Regulation (Jan. 2016)

CY2017AssessmentAnalysis_final.docx Page 7 of 21
The Office of Economic Analysis forecasts population growth. They forecast that the population
of Oregonians under 65 will increase by 0.6 - 0.7 percent per year.
In work by the McKinsey Center for U.S. Health System Reform, it was estimated that there
were about 358,000 Oregonians in CY 2015 who could have enrolled in individual plans. We
assume that this population will grow at the rate of the under-65 population. This assumption
does not take into account other possible causes for changes to the size of the individual
insurance market, such as employers’ decisions about whether to provide insurance or insurers’
entrance into or exit from the marketplace. We do not have any estimates for these other
changes.
About 65 percent of the eligible individuals were in enrolled in CY 2015; those without
insurance form the largest pool of people for growth in marketplace enrollment. We assume that
the percentage of enrolled individuals increases at a decreasing rate. Individual coverage should
increase over time, and there will always be individuals without insurance, but we do not know
what level of insurance coverage can be reached. For this model, we have assumed that by CY
2021, 88 percent of those eligible will be insured.
We also need to estimate the percentage of people who enroll through the exchange rather than
directly with insurers. Insurers reported that 47 percent of their CY 2015 members enrolled
through the exchange; they reported that 53 percent of their CY 2016 members went through the
exchange. We have assumed that this change will hold into the future.
We have different sources of enrollment data, and these sources have consistently provided
different figures. This is due in part to the timing of the different reports and the monthly
revisions of insurers’ reports. The following table shows the June and September 2015
enrollment reported through three sources: CMS reports, the insurers’ quarterly report to DFR,
and two of the insurers’ monthly reports. These differences have been consistent, and we have
assumed the difference will continue to occur.
Marketplace and Direct EnrollmentDecember 2015 coverage month; February report
Plan type Marketplace Direct Total % Marketplace
Marketplace
dist.
Bronze 19,646 24,770 44,416 44% 23%
Silver 56,313 44,567 100,880 56% 66%
Gold 7,975 23,128 31,103 26% 9%
Platinum 950 4,757 5,707 17% 1%
Catastrophic 521 349 870 60% 1%
85,405 97,571 182,976 47% 100%
Marketplace and Direct EnrollmentJanuary 2016 coverage month; February report
Plan type Marketplace Direct Total % Marketplace
Marketplace
dist.
Bronze 32,707 25,108 57,815 57% 31%
Silver 62,753 43,468 106,221 59% 59%
Gold 10,020 19,528 29,548 34% 9%
Platinum 0 4,210 4,210 0% 0%
Catastrophic 682 233 915 75% 1%
106,162 92,547 198,709 53% 100%

CY2017AssessmentAnalysis_final.docx Page 8 of 21
The growth trends that follow from these assumptions are shown in the following table. The
results show a marketplace enrollment increase of 31 percent in CY 2016, 7 percent in CY 2017,
and 3 percent per year in later years. The growth is driven primarily by an assumed increase in
the percentage of the population who are insured.
In addition to forecasting the year-to-year enrollment growth, the revenue depends on the
enrollment pattern over the calendar year. The CY 2015 enrollment pattern is shown in the
following figure. The model uses somewhat higher percentages for the first two months of the
calendar year and then the same distribution from March through December. As noted
previously, the January enrollment will generally be more uncertain than other months.
Enrollment
month CMS
Insurance
Division
OHIM -
10/2015 report
OHIM -
2/2016 report
June 102,912 107,497 96,859 96,574
September 99,654 102,113 91,099 92,847
Comparison of enrollment figures
• The June CMS data is from the CMS August report.• The September CMS data is from the CMS November report.• The Insurance Division data is reported within 30 days of the
end of the quarter.• The OHIM data is revised with each successive report month;
downward revisions of enrollment result in lowered assessments.
Model of marketplace enrollment increase through CY 2021
CY
Oregon
population, %
increase
Estimated
eligible
population % insured
%
marketplace
enrollment
% final
assessment
Forecast of
marketplace
enrollment
Marketplace
enrollment %
increase
2015 0.7% 357,788 65% 47% 93% 101,653
2016 0.7% 360,370 75% 53% 93% 133,220 31%
2017 0.7% 362,728 80% 53% 93% 143,031 7%
2018 0.6% 364,821 82% 53% 93% 147,453 3%
2019 0.6% 366,851 84% 53% 93% 151,889 3%
2020 0.6% 368,880 86% 53% 93% 156,366 3%
2021 0.6% 371,090 88% 53% 93% 160,961 3%
• The Oregon population is forecast by the Office of Economic Analysis, The figures are from the December 2015 forecast and show the forecast increase for people under 65.
• The estimate of the eligible population for CY 2015 is from the McKinsey Center. We assume the eligible population will grow at the same rate as the Oregon population.
• The percentage insured for CY 2015 is from the McKinsey Center. We assume it grows at a decreasing rate.
• The percentage of the enrollment done through the marketplace is based on insurers' CY 2015 reports.• The percentage of the enrollment that are finally assessed comes from a comparison of CMS and
insurer reports.• The forecast marketplace enrollment is computed as the product of the four prior items.

CY2017AssessmentAnalysis_final.docx Page 9 of 21
The following table shows insurers’ December 2015 and January 2016 enrollment, as of the
February 2016 report. The most important shift is the growth in Providence’s enrollment. As will
be shown later, Providence has low average premiums, so its growth lowers the growth in the
overall average premium.
The table also shows estimated April enrollment. OHIM staff contacted the insurers and
requested this information. The purpose was to see if the insurers were collectively expecting to
get the large increase in enrollment that CMS was reporting. Their expected enrollment was
close to the figure derived from the CMS data. This provides some validation of the forecast for
this year.
Medical-plan average premiums forecast
As noted earlier, the health insurance actuaries have forecast that average premiums will increase
by about 15 percent in CY 2016 and CY 2017 for the individual market. Based on the two
months of insurers’ CY 2016 data, we estimate the increase will be about 11 percent. This is
largely due to the shift toward Providence; without that shift, the growth in the average premium
would have been 19 percent.
Medical plan enrollment: December 2015, January 2016, and assumed April 2016, as of the Feb. 2016 report
Members Dist. Members Dist. Members Dist.
Atrio Health Plans Inc. 249 0.3% 1,399 1.3% 2,000 1.5%
BridgeSpan Health Company 179 0.2% 399 0.4% 399 0.3%
Health Republic Insurance Company 2,516 2.9% na na
Kaiser Found. Health Plan of the NW 6,130 7.2% 9,768 9.2% 19,000 14.2%
LifeWise Health Plan of Oregon 17,961 21.0% 10,526 9.9% 15,300 11.5%
Moda Health 34,216 40.1% 21,362 20.1% 26,000 19.5%
Oregon's Health CO-OP 7,069 8.3% 8,925 8.4% 8,925 6.7%
PacificSource Health Plans 1,972 2.3% 1,222 1.2% 1,200 0.9%
Providence Health Plan 15,094 17.7% 51,994 49.0% 60,500 45.3%
Trillium Community Health Plan 19 0.0% 15 0.0% 15 0.0%
Zoom Health Plan na 552 0.5% 120 0.1%
Total 85,405 100.0% 106,162 100.0% 133,459 100.0%
The April 2016 estimates were provided by the insurers; where estimates were not provided the January figures were used.
Est. April 2016Jan. 2016Dec. 2015

CY2017AssessmentAnalysis_final.docx Page 10 of 21
The insurers have consistently reported higher average premiums for OHIM than the insurance
actuaries have for the entire individual market; this is shown in the following table. In this
forecast, we assumed that this difference will decline. Given the enrollment shift we saw at the
beginning of CY 2016, we want to be somewhat cautious, so we have lowered the CY 2017
average increase to 12 percent, slightly lower than the actuaries’ estimate.
We have assumed a comparatively small increase of 5 percent per year for later years.
Summary of the medical-plan enrollment and premium forecast
The following table shows the results of the assumptions. It shows the expected revenue if the
current PMPM rate is retained. It also shows that while $9.66 is 2.9 percent of average premium
in CY 2015, $9.66 is expected to be 2.3 percent of the average assessment rate in CY 2017.
Medical plan average premium, 2015 and January-February 2016, as of the Feb. 2016 report
CY 2015 Jan-Feb 2016 % change
Atrio Health Plans Inc. $309 $339 10%
BridgeSpan Health Company 288 325 13%
Health Republic Insurance Company 320 na na
Kaiser Found. Health Plan of the NW 361 366 1%
LifeWise Health Plan of Oregon 305 375 23%
Moda Health 360 453 26%
Oregon's Health CO-OP 348 408 17%
PacificSource Health Plans 356 486 37%
Providence Health Plan 277 326 18%
Trillium Community Health Plan 314 447 42%
Zoom Health Plan na 264 na
Total $332 $369 11%
Ave medical premium
2014 2015 2016 2017
Insurance est. $289 $298 $344 $395
% change 3.2% 15.3% 14.8%
OHIM est. $326 $332 $369 $413
% change 1.9% 11.1% 12.0%
Difference $37 $34 $25 $18
Estimates of average premium

CY2017AssessmentAnalysis_final.docx Page 11 of 21
The following table shows the revenue that would be collected from selected levels of medical-
plan enrollment and assessment rates in CY 2017. The forecast average monthly enrollment is
about 132,000. If the assessment rate of $9.66 PMPM is retained, this would generate $15.34
million in revenue. An assessment rate of $6.00 PMPM would generate $9.53 million in revenue.
If the average enrollment were 10,000 lower, then a rate of $6.50 PMPM would be needed to
raise the same revenue.
Stand-alone dental plan enrollment and premiums forecast
Cover Oregon did not have any dental premiums data when they created the dental assessment
rate. They set the dental assessment rate as 10 percent of the medical assessment rate. That has
continued through CY 2016. We now have two years of dental premiums data. While the
medical assessment rate was 2.9 percent of average premium in CY 2015, the dental assessment
rate was 3.1 percent of the dental premium. We propose setting the dental assessment rate so that
the ratio of the dental rate to the medical rate is the same as the ratio of the average dental
Medical plans summary
2014 2015 2016 2017 2018 2019 2020 2021
Member months 699,687 1,092,367 1,473,940 1,577,116 1,624,429 1,673,162 1,723,357 1,775,058
Ave enrollment per month 58,307 91,031 122,828 131,426 135,369 139,430 143,613 147,921
Maximum monthly enr. 73,899 99,473 132,000 141,240 145,477 149,842 154,337 158,967
December enrollment 68,830 85,405 113,449 121,390 125,032 128,783 132,647 136,626
Member months/Dec. en. 10.2 12.8 13.0 13.0 13.0 13.0 13.0 13.0
Total premiums ($ millions) $228.28 $363.05 $544.17 $652.13 $705.28 $762.76 $824.93 $892.16
Ave premium $326 $332 $369 $413 $434 $456 $479 $503
Current assessment rate $9.38 $9.66 $9.66 $9.66 $9.66 $9.66 $9.66 $9.66
Assessments ($ millions) $6.56 $10.55 $14.24 $15.23 $15.69 $16.16 $16.65 $17.15
Rate as % of ave premium 2.9% 2.9% 2.6% 2.3% 2.2% 2.1% 2.0% 1.9%
Year-to-year percentage changes2015 2016 2017 2018 2019 2020 2021
Member months 56.1% 34.9% 7.0% 3.0% 3.0% 3.0% 3.0%
December enrollment 24.1% 32.8% 7.0% 3.0% 3.0% 3.0% 3.0%
Total premiums 59.0% 49.9% 19.8% 8.2% 8.2% 8.2% 8.2%
Ave premium 1.9% 11.1% 12.0% 5.0% 5.0% 5.0% 5.0%
Assessment rate 3.0% 0.0% 0.0% 0.0% 0.0% 0.0% 0.0%
Total assessments 60.8% 34.9% 7.0% 3.0% 3.0% 3.0% 3.0%
Notes: The CY 2014 data were compiled from multiple Cover Oregon documents.
The CY 2015 data are from insurers' February 2016 reports. Data will change as insurers provide revised data.
Data for CY 2016 and later are from the latest forecasts.
$9.66 $7.00 $6.50 $6.00 $5.50
Forecast + 20,000 $17.66 $12.79 $11.88 $10.97 $10.05
Forecast + 10,000 $16.50 $11.95 $11.10 $10.25 $9.39
Forecast = 132,316 $15.34 $11.11 $10.32 $9.53 $8.73
Forecast - 10,000 $14.18 $10.27 $9.54 $8.81 $8.07
Forecast - 20,000 $13.02 $9.43 $8.76 $8.09 $7.41
CY 2017 revenue ($ millions) from selected average
medical-plan enrollment and assessment rates
Ave monthly
enrollment
PMPM assessment rates
CY2017AssessmentAnalysis_final.docx Page 12 of 21
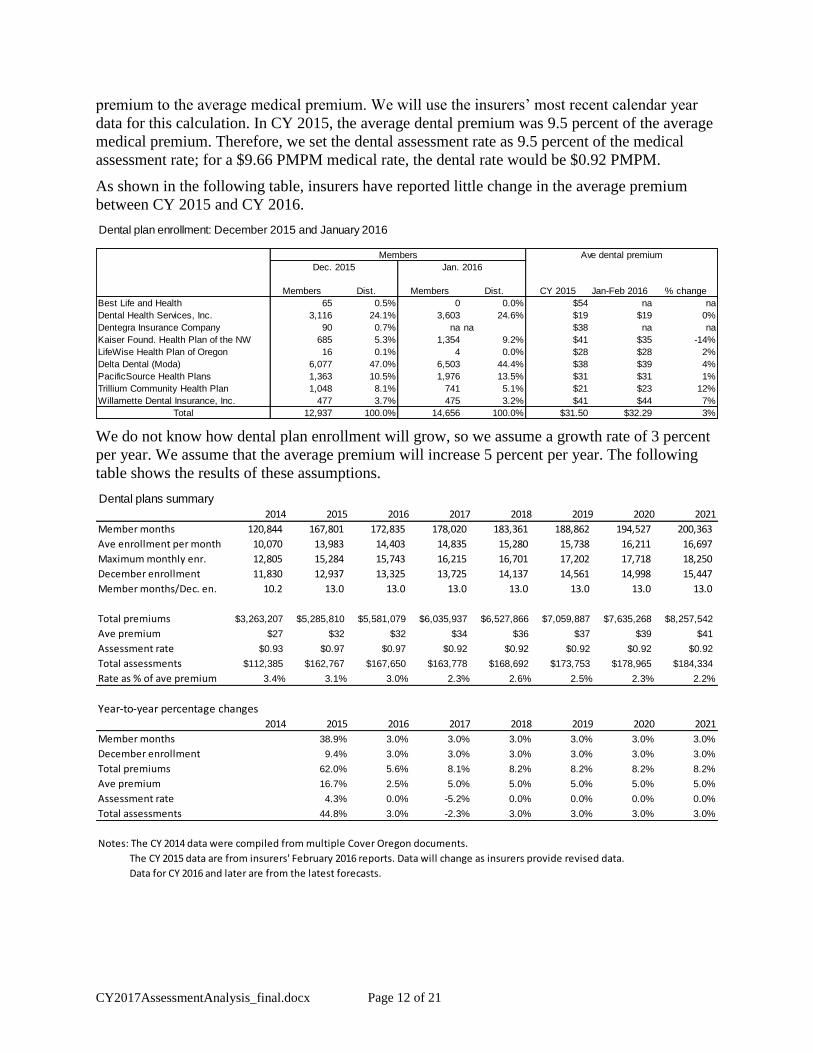
premium to the average medical premium. We will use the insurers’ most recent calendar year
data for this calculation. In CY 2015, the average dental premium was 9.5 percent of the average
medical premium. Therefore, we set the dental assessment rate as 9.5 percent of the medical
assessment rate; for a $9.66 PMPM medical rate, the dental rate would be $0.92 PMPM.
As shown in the following table, insurers have reported little change in the average premium
between CY 2015 and CY 2016.
We do not know how dental plan enrollment will grow, so we assume a growth rate of 3 percent
per year. We assume that the average premium will increase 5 percent per year. The following
table shows the results of these assumptions.
Dental plan enrollment: December 2015 and January 2016
Members Dist. Members Dist. CY 2015 Jan-Feb 2016 % change
Best Life and Health 65 0.5% 0 0.0% $54 na na
Dental Health Services, Inc. 3,116 24.1% 3,603 24.6% $19 $19 0%
Dentegra Insurance Company 90 0.7% na na $38 na na
Kaiser Found. Health Plan of the NW 685 5.3% 1,354 9.2% $41 $35 -14%
LifeWise Health Plan of Oregon 16 0.1% 4 0.0% $28 $28 2%
Delta Dental (Moda) 6,077 47.0% 6,503 44.4% $38 $39 4%
PacificSource Health Plans 1,363 10.5% 1,976 13.5% $31 $31 1%
Trillium Community Health Plan 1,048 8.1% 741 5.1% $21 $23 12%
Willamette Dental Insurance, Inc. 477 3.7% 475 3.2% $41 $44 7%
Total 12,937 100.0% 14,656 100.0% $31.50 $32.29 3%
Members Ave dental premium
Dec. 2015 Jan. 2016
Dental plans summary
2014 2015 2016 2017 2018 2019 2020 2021
Member months 120,844 167,801 172,835 178,020 183,361 188,862 194,527 200,363
Ave enrollment per month 10,070 13,983 14,403 14,835 15,280 15,738 16,211 16,697
Maximum monthly enr. 12,805 15,284 15,743 16,215 16,701 17,202 17,718 18,250
December enrollment 11,830 12,937 13,325 13,725 14,137 14,561 14,998 15,447
Member months/Dec. en. 10.2 13.0 13.0 13.0 13.0 13.0 13.0 13.0
Total premiums $3,263,207 $5,285,810 $5,581,079 $6,035,937 $6,527,866 $7,059,887 $7,635,268 $8,257,542
Ave premium $27 $32 $32 $34 $36 $37 $39 $41
Assessment rate $0.93 $0.97 $0.97 $0.92 $0.92 $0.92 $0.92 $0.92
Total assessments $112,385 $162,767 $167,650 $163,778 $168,692 $173,753 $178,965 $184,334
Rate as % of ave premium 3.4% 3.1% 3.0% 2.3% 2.6% 2.5% 2.3% 2.2%
Year-to-year percentage changes
2014 2015 2016 2017 2018 2019 2020 2021
Member months 38.9% 3.0% 3.0% 3.0% 3.0% 3.0% 3.0%
December enrollment 9.4% 3.0% 3.0% 3.0% 3.0% 3.0% 3.0%
Total premiums 62.0% 5.6% 8.1% 8.2% 8.2% 8.2% 8.2%
Ave premium 16.7% 2.5% 5.0% 5.0% 5.0% 5.0% 5.0%
Assessment rate 4.3% 0.0% -5.2% 0.0% 0.0% 0.0% 0.0%
Total assessments 44.8% 3.0% -2.3% 3.0% 3.0% 3.0% 3.0%
Notes: The CY 2014 data were compiled from multiple Cover Oregon documents.
The CY 2015 data are from insurers' February 2016 reports. Data will change as insurers provide revised data.
Data for CY 2016 and later are from the latest forecasts.

CY2017AssessmentAnalysis_final.docx Page 13 of 21
Comparison of the current enrollment forecasts to the April 2015 forecast
The following table compares this forecast of member months to the forecast done in April 2015
for the setting of the CY 2016 assessment rates. For medical plans, the total member months are
expected to be at least 30 percent higher than in last year’s forecast. For dental plans, the long-
term forecast is about the same as used last year.
OHIM financial outcomes
Initial rate calculations
The following table shows a model for estimating the needed assessment rates. The calculations
are done over several years because DCBS attempts to minimize year-to-year assessment rate
changes.
The model is simplified in that it ignores quarterly enrollment variation and the interest that the
OHIM account earns. These are included in the final analysis.
As shown, the OHIM planned expenditures (not the LAB amounts) are expected to decline from
$15.1 million in FY 2016 to an average of $11.0 million during the three-year period FY 2017-
2019. The OHA transfer is expected to average $1.5 million. Therefore, the assessments need to
collect about $9.5 million per year.
If the enrollment forecasts are accurate, the current assessment rates will generate revenue of
about $15.7 million per year. For FY 2017 – FY 2019, this is about 38 percent more than needed.
This suggests that the medical assessment rate should be about $5.87 PMPM, and the dental
assessment rate should be about $0.56 PMPM.
Comparison of the current forecast with the March 2015 forecast
(member months)
Medical CY 2015 CY 2016 CY 2017 CY 2018 CY 2019
Current forecast 1,092,367 1,483,912 1,587,786 1,635,420 1,684,482
Prior forecast 971,876 1,074,611 1,211,655 1,248,005 1,285,445
% difference 12% 38% 31% 31% 31%
Dental
Current forecast 167,801 172,835 178,020 183,361 188,862
Prior forecast 146,950 161,644 177,809 183,143 188,637
% difference 14% 7% 0% 0% 0%

CY2017AssessmentAnalysis_final.docx Page 14 of 21
This is a large reduction from the current medical assessment rate of $9.66 PMPM for medical
plans. The reduction comes from two sources: a reduction to bring revenue down to the level of
expenditures and the increase in the enrollment forecast. As shown in the January report to the
legislature, the medical assessment was expected to be $35 million during FY 2017-2019, with a
growth in the fund balance of $10.5 million. Therefore, the assessment rate could be lowered by
30 percent so that revenues match planned expenditures. As shown earlier, the enrollment
forecast was increased by about 30 percent over earlier forecasts. Therefore, assessment rates
could be lowered by 25 percent and generate the same revenue. Combined, this suggests the
assessment rate could be reduced by 48 percent. This rough calculation agrees with the result
above.
For this analysis, we model the following pair of potential assessment rates:
Detailed financial outcomes
The following table shows the forecast financial outcomes with the above enrollment model,
planned expenditures, and a medical assessment rate of $6.00 PMPM and a dental assessment
rate of $0.57 PMPM. The impact of the lower assessment rates are first seen in the third quarter
of FY 2017. The fund balance would be expected to peak at $15.4 million at the end of FY 2017.
After that, the forecast revenues nearly match forecast expenditures.
Simplified Rate Calculation Model
FY 2016 FY 2017 FY 2018 FY 2019 FY 2020 FY 2021
Planned expenditures $15,128,376 $10,480,510 $11,329,443 $11,349,248 $11,689,726 $12,040,417
OHA transfer amounts $9,885,311 $2,771,352 $930,342 $855,812 $855,812 $855,812
Assessment revenue
needed $5,243,064 $7,709,158 $10,399,100 $10,493,436 $10,833,914 $11,184,606
Current rates
Medical member months 1,299,194 1,536,493 1,611,898 1,660,255 1,710,063 1,761,364
Current assessment rate $9.66 $9.66 $9.66 $9.66 $9.66 $9.66
Revenue $12,550,217 $14,842,518 $15,570,935 $16,038,063 $16,519,204 $17,014,781
Dental member months 169,117 174,191 179,417 184,799 190,343 196,053
Current assessment rate $0.97 $0.95 $0.92 $0.92 $0.92 $0.92
Revenue $164,044 $164,610 $165,063 $170,015 $175,116 $180,369
Total assessment revenue $12,714,261 $15,007,128 $15,735,998 $16,208,078 $16,694,320 $17,195,150
Excess/(Deficit) $7,471,197 $7,297,970 $5,336,897 $5,714,641 $5,860,406 $6,010,544
% Excess 49% 34% 35% 35% 35%
Test PMPM rates:
Medical $5.87 61%
Dental $0.56 57%
2019 - 20212017 - 20192015 - 2017
% of CY 2016 rates
Modeled PMPM rates:
Medical $6.00
Dental $0.57

CY2017AssessmentAnalysis_final.docx Page 15 of 21
(The final column of the table is labeled “Months.” This provides the fund balance stated in
terms of the number of months of the biennium’s planned expenditures.)
As stated earlier, there is a statutory cap on the budget. The estimated caps are shown in the
following table. The left-hand portion of the table shows the results if the rebate is computed
each December; the right-hand portion assumes the rebate is computed at the end of each
biennium.
As discussed earlier, the December 2015, December 2016, and the June 2017 caps are estimated
from the OHIM LAB; the later caps are taken from planned expenditures.
Period Medical Dental OHA Investment/ Total Total Excess Ending Fund
Ending Assessment Assessment Transfer Misc Revenue Expenses (Deficit) Balance Months
FY 2015 $0 $0 $0 $0 $0 $0 $0 $0 0
09/30/15 2,405,508 63,370 0 5,715 3,530,501 2,148,728 1,381,773 1,381,773 1.3
12/31/15 3,012,249 17,326 4,711,007 6,663 8,642,277 3,861,973 4,780,304 6,162,077 5.8
03/31/16 3,465,461 38,454 3,030,785 9,114 6,543,814 5,131,183 1,412,631 7,574,708 7.1
06/30/16 3,790,603 44,979 3,052,118 12,006 6,899,708 3,986,491 2,913,217 10,487,925 9.8
FY 2016 $12,673,821 $164,130 $10,793,910 $33,498 $25,616,300 $15,128,375 $10,487,925 $10,487,925 9.8
09/30/16 3,643,530 43,051 827,623 8,182 4,522,386 3,437,554 1,084,832 11,572,757 10.8
12/31/16 3,434,999 39,977 827,623 13,810 4,316,409 3,070,363 1,246,046 12,818,803 12.0
03/31/17 2,303,132 23,275 827,623 21,794 3,175,824 2,093,666 1,082,158 13,900,960 13.0
06/30/17 2,519,221 27,224 827,623 32,050 3,406,118 1,878,926 1,527,191 15,428,151 14.5
FY 2017 $11,900,882 $133,527 $3,310,491 $75,835 $15,420,736 $10,480,510 $4,940,226 $15,428,151 14.5
09/30/17 2,421,476 26,057 288,483 46,452 2,782,469 2,832,361 (49,892) 15,378,259 16.3
12/31/17 2,282,888 24,196 213,953 58,279 2,579,316 2,832,361 (253,045) 15,125,215 16.0
03/31/18 2,372,226 23,973 213,953 68,308 2,678,461 2,832,361 (153,900) 14,971,314 15.8
06/30/18 2,594,797 28,041 213,953 78,249 2,915,040 2,832,361 82,679 15,053,994 15.9
FY 2018 $9,671,388 $102,267 $930,342 $251,288 $10,955,285 $11,329,443 ($374,157) $15,053,994 15.9
09/30/18 2,494,121 26,839 213,953 89,084 2,823,997 2,837,312 (13,315) 15,040,678 15.9
12/31/18 2,351,374 24,922 213,953 98,273 2,688,522 2,837,312 (148,790) 14,891,889 15.8
03/31/19 2,443,393 24,692 213,953 102,217 2,784,255 2,837,312 (53,057) 14,838,832 15.7
06/30/19 2,672,641 28,882 213,953 105,906 3,021,383 2,837,312 184,071 15,022,902 15.9
FY 2019 $9,961,530 $105,335 $855,812 $395,480 $11,318,157 $11,349,248 ($31,092) $15,022,902 15.9
09/30/19 2,568,944 27,644 213,953 110,227 2,920,768 2,922,431 (1,664) 15,021,239 15.2
12/31/19 2,421,916 25,670 213,953 112,266 2,773,805 2,922,431 (148,626) 14,872,612 15.0
03/31/20 2,516,695 25,433 213,953 112,427 2,868,507 2,922,431 (53,924) 14,818,688 15.0
06/30/20 2,752,821 29,749 213,953 112,675 3,109,198 2,922,431 186,766 15,005,455 15.2
FY 2020 $10,260,375 $108,495 $855,812 $447,595 $11,672,278 $11,689,726 ($17,448) $15,005,455 15.2
09/30/20 2,646,013 28,473 213,953 114,238 3,002,677 3,010,104 (7,427) 14,998,027 15.2
12/31/20 2,494,573 26,440 213,953 114,182 2,849,148 3,010,104 (160,956) 14,837,071 15.0
03/31/21 2,592,196 26,196 213,953 112,956 2,945,301 3,010,104 (64,803) 14,772,268 14.9
06/30/21 2,835,405 30,641 213,953 112,463 3,192,462 3,010,104 182,358 14,954,626 15.1
FY 2021 $10,568,187 $111,750 $855,812 $453,839 $11,989,588 $12,040,417 ($50,829) $14,954,626 15.1
Oregon Health Insurance Marketplace
Forecast Revenues, Expenses, and Fund Balances, $6.00 PMPM, without regard to the fund balance cap
(actual data through December 2015)

CY2017AssessmentAnalysis_final.docx Page 16 of 21
The results suggest that the fund balance at the end of December 2016 will exceed the cap by
$4.4 million. This means that OHIM expenditures during CY 2016 can be up to $4.4 million
more than planned without affecting the fund’s long-term stability. Instead, the increased
expenditures will reduce the credits.
The table and figure below summarize the forecast financial outcomes for the three scenarios.
The impact of the credits is shown in the reductions in revenue in the years after the credits.
Federal exchange costs
For this analysis, we have assumed that the federal technology charges will be separate from the
assessment, so that the charges affect neither revenue nor expenditures. The following table
shows the estimated charges under two scenarios. In scenario one, the charge is 1.5 percent of
premium in CY 2017 and 3 percent of premium in later years. In scenario two, the charge is 3
percent of premium every year. Depending on the scenario, the CY 2017 costs would be the
equivalent to a charge of $6.20 or $12.40 PMPM on medical plans. (The corresponding charges
for dental plans would be $0.59 PMPM or $1.18 PMPM.)
Forecast of fund balances and insurer credits
Statutory fund
balance cap
Dec. fund
balance
Forecast
credit
Statutory fund
balance cap
June fund
balance
Forecast
credit
December 2015 $8,412,911 $6,162,077 $0 June 2017 $8,412,911 $15,428,151 $7,015,240
December 2016 $8,412,911 $12,818,803 $4,405,891 June 2019 $5,669,673 $10,157,976 $4,488,303
December 2017 $5,669,673 $10,694,930 $5,025,257 June 2021 $6,014,956 $5,106,892 $0
December 2018 $5,669,673 $5,288,748 $0
December 2019 $6,014,956 $5,376,370 $0
December 2020 $6,014,956 $5,697,287 $0
Summary of financial outcomes, by scenario
FY end Expenditures Revenue Fund balance Months Revenue Fund balance Months Revenue Fund balance Months
FY 2016 $15,128,375 $25,616,300 $10,487,925 9.8 $25,616,300 $10,487,925 9.8 $25,616,300 $10,487,925 9.8
FY 2017 $10,480,510 $15,420,736 $15,428,151 14.5 $12,874,291 $12,881,706 12.1 $15,420,736 $15,428,151 14.5
FY 2018 $11,329,443 $10,955,285 $15,053,994 15.9 $6,405,340 $7,957,603 7.5 $6,216,946 $10,315,655 10.9
FY 2019 $11,349,248 $11,318,157 $15,022,902 15.9 $9,057,407 $5,665,762 5.3 $11,191,569 $10,157,976 10.7
FY 2020 $11,689,726 $11,672,278 $15,005,455 15.2 $12,027,225 $6,003,262 5.6 $6,983,737 $5,451,986 5.5
FY 2021 $12,040,417 $11,989,588 $14,954,626 15.1 $10,327,515 $5,938,254 5.6 $11,782,924 $9,110,345 10.7
No fund cap December fund cap Biennium-ending fund cap

CY2017AssessmentAnalysis_final.docx Page 17 of 21
SHOP
When SHOP was originally discussed, it was assumed that SHOP enrollment would be 1 – 2
percent of Oregon’s small group market. That would be an enrollment of 1,600 – 3,200
employers.
It was also assumed that employers would be paying a monthly assessment equal to the costs of
their enrollment. If this is the case, the SHOP costs would be limited to any up-front costs and
any additional DCBS costs for additional personnel, supplies, or chargeback. If another scenario
is adopted, costs will differ.
As noted in earlier, the OHIM fund is forecast to have an account balance at the end of CY 2016
that is $4.4 million above the statutory cap. If money is spent for SHOP during CY 2016, then
the expanding would not have an impact on the fund’s long-term balance.
Summary
The following table provides a summary by calendar year using the enrollment forecast,
expenditures assumptions, the federal technology scenario one (1.5 percent of premium in CY
2017), and an assumed assessment rate of $6.00 PMPM for medical plans and $0.57 PMPM for
dental plans. Given these assumptions, OHIM’s assessment would be about 1.5 percent of the
average premium in CY 2017. Combined with the federal technology charge, the total costs
would be about 3.0 percent of the average medical premium, a little higher than the 2.9 percent
of premium that the assessment collected in CY 2015.
Estimated federal technology costs, at 1.5% and 3% of premiums
CY 2017 CY 2018 CY 2019 CY 2020 CY 2021
Medical premiums $656,546,885 $710,055,456 $767,924,976 $830,510,861 $898,197,497
Medical member months 1,587,786 1,635,420 1,684,482 1,735,017 1,787,067
Dental premiums $6,035,937 $6,527,866 $7,059,887 $7,635,268 $8,257,542
Dental member months 178,020 183,361 188,862 194,527 200,363
Federal charge - scenario 1 1.5% 3.0% 3.0% 3.0% 3.0%
Federal rev. ($ millions) $9,938,742 $21,497,500 $23,249,546 $25,144,384 $27,193,651
Federal charge - medical PMPM $6.20 $13.03 $13.68 $14.36 $15.08
Federal charge - scenario 2 3.0% 3.0% 3.0% 3.0% 3.0%
Federal rev. ($ millions) $19,877,485 $21,497,500 $23,249,546 $25,144,384 $27,193,651
Federal charge - medical PMPM $12.40 $13.03 $13.68 $14.36 $15.08
CY2017AssessmentAnalysis_final.docx Page 18 of 21
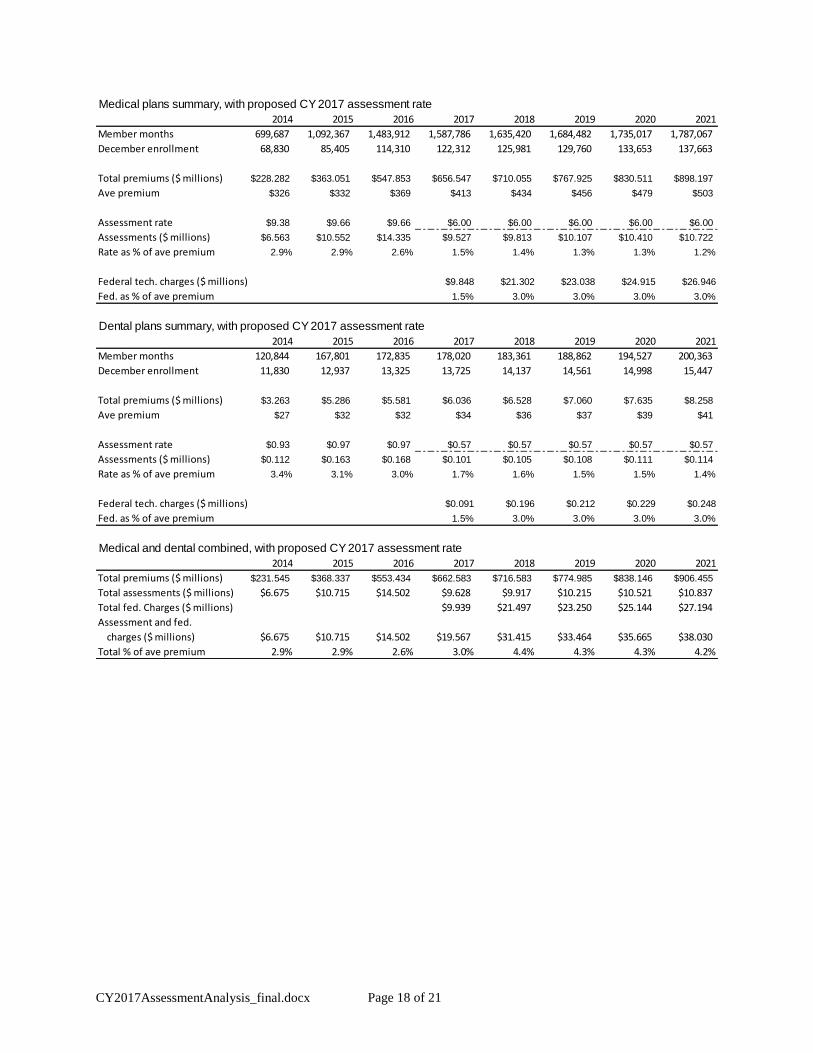
Medical plans summary, with proposed CY 2017 assessment rate
2014 2015 2016 2017 2018 2019 2020 2021
Member months 699,687 1,092,367 1,483,912 1,587,786 1,635,420 1,684,482 1,735,017 1,787,067
December enrollment 68,830 85,405 114,310 122,312 125,981 129,760 133,653 137,663
Total premiums ($ millions) $228.282 $363.051 $547.853 $656.547 $710.055 $767.925 $830.511 $898.197
Ave premium $326 $332 $369 $413 $434 $456 $479 $503
Assessment rate $9.38 $9.66 $9.66 $6.00 $6.00 $6.00 $6.00 $6.00
Assessments ($ millions) $6.563 $10.552 $14.335 $9.527 $9.813 $10.107 $10.410 $10.722
Rate as % of ave premium 2.9% 2.9% 2.6% 1.5% 1.4% 1.3% 1.3% 1.2%
Federal tech. charges ($ millions) $9.848 $21.302 $23.038 $24.915 $26.946
Fed. as % of ave premium 1.5% 3.0% 3.0% 3.0% 3.0%
Dental plans summary, with proposed CY 2017 assessment rate
2014 2015 2016 2017 2018 2019 2020 2021
Member months 120,844 167,801 172,835 178,020 183,361 188,862 194,527 200,363
December enrollment 11,830 12,937 13,325 13,725 14,137 14,561 14,998 15,447
Total premiums ($ millions) $3.263 $5.286 $5.581 $6.036 $6.528 $7.060 $7.635 $8.258
Ave premium $27 $32 $32 $34 $36 $37 $39 $41
Assessment rate $0.93 $0.97 $0.97 $0.57 $0.57 $0.57 $0.57 $0.57
Assessments ($ millions) $0.112 $0.163 $0.168 $0.101 $0.105 $0.108 $0.111 $0.114
Rate as % of ave premium 3.4% 3.1% 3.0% 1.7% 1.6% 1.5% 1.5% 1.4%
Federal tech. charges ($ millions) $0.091 $0.196 $0.212 $0.229 $0.248
Fed. as % of ave premium 1.5% 3.0% 3.0% 3.0% 3.0%
Medical and dental combined, with proposed CY 2017 assessment rate
2014 2015 2016 2017 2018 2019 2020 2021
Total premiums ($ millions) $231.545 $368.337 $553.434 $662.583 $716.583 $774.985 $838.146 $906.455
Total assessments ($ millions) $6.675 $10.715 $14.502 $9.628 $9.917 $10.215 $10.521 $10.837
Total fed. Charges ($ millions) $9.939 $21.497 $23.250 $25.144 $27.194
Assessment and fed.
charges ($ millions) $6.675 $10.715 $14.502 $19.567 $31.415 $33.464 $35.665 $38.030
Total % of ave premium 2.9% 2.9% 2.6% 3.0% 4.4% 4.3% 4.3% 4.2%

CY2017AssessmentAnalysis_final.docx Page 19 of 21
DIVISION 30
ADMINISTRATIVE CHARGE FOR OPERATING EXPENSES
945-030-0010
Purpose
The purpose of division 30 is to establish a process for the adoption of an administrative charge to be paid
by health insurers offering a qualified health plan or stand alone dental plan through the Marketplace to
pay the administrative and operational expenses of the Marketplace, including costs of grants to certified
navigators.
Stat. Auth.: ORS 741.002
Stats. Implemented: ORS 741.105
Hist.: OHIE 1-2013, f. & cert. ef. 3-18-13; Suspended by OHIE 3-2013(Temp), f. & cert. ef. 5-28-13 thru
11-22-13; OHIE 3-2015, f. & cert. ef. 10-15-15; OHIE 4-2015, f. & cert. ef. 11-6-15
945-030-0020
Establishment of Administrative Charge Paid by Insurers
(1) After consulting with the Advisory Committee created by Section 13 of 2015 Senate Bill 1,
Marketplace staff will annually provide a Report on Administrative Charges to the Director of the
Department of Consumer and Business Services (Director).
(2) The report will be posted on the Marketplace’s website for public review and comment.
(3) At a minimum, the report will include
(a) A projection of Marketplace operating expenses (including the Marketplace share of DCBS shared
services expenses, and operating expenses borne by the Marketplace and reimbursed by another agency)
based on DCBS budgets, assuming for this purpose that the operating expenses in any actual or expected
biennial budget are distributed evenly over the biennium;
(b) A projection of Marketplace enrollment for the next calendar year; and
(c) A proposed administrative charge for the next calendar year.
(4) The Department will hold a public hearing on a proposed administrative charge.
(5) No later than the end of the first quarter of a calendar year the Director shall amend or approve an
administrative charge for the next calendar year.
(6) Any administrative charge adopted by the Director shall be established in rule.
(7) The administrative charge shall be expressed as a per member per month figure.
(8) The annual administrative charge assessed by the Marketplace shall not exceed the limits set forth in
ORS 741.105(2) on the premium or other monthly charge, prior to tax credits and cost sharing reductions,
based on the number of enrollees receiving coverage in qualified health plans or stand alone dental plans
through the Marketplace during the month of December preceding the report.
(9) The maximum amount permissible under ORS 741.105 will be calculated by comparing the
Marketplace’s fund balance at the end of each December with the Marketplace’s budgeted operating
expenses for the following six-month period (calculated as one-fourth of the budgeted operating expenses
for the biennium that includes the six-month period). If the fund balance exceeds six months of budgeted
operating expenses, the Department of Consumer and Business Services will return excess funds to
carriers on a pro-rata basis, computed from the December assessments, in the form of a credit applied
against future assessments. The credit will be applied no later than the end of the first quarter of the
calendar year.

CY2017AssessmentAnalysis_final.docx Page 20 of 21
Stat. Auth.: ORS 741.002
Stats. Implemented: ORS 741.105
Hist.: OHIE 1-2013, f. & cert. ef. 3-18-13; OHIE 1-2015(Temp), f. & cert. ef. 3-11-15 thru 9-4-15;
Administrative correction, 9-30-15; OHIE 3-2015, f. & cert. ef. 10-15-15; OHIE 4-2015, f. & cert. ef. 11-
6-15
945-030-0030
2015 Administrative Charge on Insurers
(1) Effective January 1, 2015, each health insurer offering qualified health plans through the Marketplace
shall pay a monthly administrative charge equal to $9.66 times the number of members enrolled through
the Marketplace in that month.
(2) Effective January 1, 2015, each health insurer offering stand alone dental plans through the
Marketplace shall pay a monthly administrative charge equal to $0.97 times the number of members
enrolled through the Marketplace in that month.
Stat. Auth.: ORS 741.002
Stats. Implemented: ORS 741.105
Hist.: OHIE 1-2013, f. & cert. ef. 3-18-13; OHIE 3-2013(Temp), f. & cert. ef. 5-28-13 thru 11-22-13;
OHIE 5-2013, f. & cert. ef. 8-19-13; OHIE 2-2014, f. & cert. ef. 4-15-14; OHIE 1-2015(Temp), f. & cert.
ef. 3-11-15 thru 9-4-15; Administrative correction, 9-30-15; OHIE 3-2015, f. & cert. ef. 10-15-15; OHIE
4-2015, f. & cert. ef. 11-6-15
945-030-0035
2016 Administrative Charge on Insurers
(1) Effective January 1, 2016, each health insurer offering qualified health plans through the Marketplace
shall pay a monthly administrative charge equal to $9.66 times the number of members enrolled through
the Marketplace in that month.
(2) Effective January 1, 2016, each health insurer offering stand alone dental plans through the
Marketplace shall pay a monthly administrative charge equal to $0.97 times the number of members
enrolled through the Marketplace in that month.
Stat. Auth.: ORS 741.002
Stats. Implemented: ORS 741.105
Hist.: OHIE 2-2015, f. 3-17-15, cert. ef. 3-31-15; OHIE 3-2015, f. & cert. ef. 10-15-15; OHIE 4-2015, f.
& cert. ef. 11-6-15
945-030-0040
Assessment and Collection of Administrative Charge on Insurers
(1) By the last Wednesday of each month, an insurer shall report to the Marketplace the insurer’s
effectuated enrollment as of 11:59 PM on the 15th of the month and the anticipated effectuated
enrollment for the following month.
(2) The Marketplace shall assess an insurer an administrative charge on or before the 10th day of each
month based on the number of reasonably anticipated effectuated members enrolled in Marketplace
coverage in that month.
(3) The Marketplace shall adjust the administrative charge when it reasonably believes an insurer has had
changes or has made accurate corrections to enrollment for prior months, as follows:
(a) For report months beginning July of a given year and ending June of the following year, the
Marketplace shall adjust the administrative charge for coverage months beginning January of the given
year through the report month.

CY2017AssessmentAnalysis_final.docx Page 21 of 21
(b) The Marketplace shall not adjust the administrative charge for changes or corrections in enrollment
for coverage months preceding the period described in paragraph (a) of this section.
(4) The administrative charge is due in full to the Marketplace on the 10th day of the month following the
assessment.
(5) For any month in which the insurer does not make full payment within 5 days following the due date
for the administrative charge, the Marketplace may impose a late payment charge of 1 percent of the
amount due, to be paid on the next due date for the administrative charge.
(6) If an insurer fails to pay the administrative charge or any late payment charge or both, the Director
may:
(a) Impose an annual 9% interest charge on the amount due;
(b) Close that insurer’s Marketplace plans to new enrollment until all outstanding charges are paid; and/or
(c) De-certify the insurer’s qualified health plans and/or stand-alone dental plans.
(7) The insurer must maintain data that are sufficient:
(a) To support the assessment reported to the director and any adjustments or corrections; and
(b) For the Director to verify the amount reported, adjusted, or corrected.
(8) Upon request and in the form, manner, and time prescribed by the Director, an insurer must provide to
the Director the data described in paragraph 7 of this rule.
(9) An insurer may contest the amount of the administrative charge assessed under this section through a
contested case hearing under ORS 183.411 to 183.471.
Stat. Auth.: ORS 741.002
Stats. Implemented: ORS 741.105
Hist.: OHIE 1-2013, f. & cert. ef. 3-18-13; OHIE 3-2013(Temp), f. & cert. ef. 5-28-13 thru 11-22-13;
OHIE 5-2013, f. & cert. ef. 8-19-13; OHIE 1-2015(Temp), f. & cert. ef. 3-11-15 thru 9-4-15;
Administrative correction, 9-30-15; OHIE 3-2015, f. & cert. ef. 10-15-15; OHIE 4-2015, f. & cert. ef. 11-
6-15
945-030-0045
Administrative Assessment on State Programs
(1) The administrative assessment on state programs shall be established in an Intergovernmental
Agreement between the Marketplace and the Oregon Health Authority.
(2) The administrative assessment, expressed as a per member per month figure, shall be based on the
number of individuals enrolled in state programs offered through the Marketplace.
(3) The Intergovernmental Agreement shall specify the intervals and manner in which the administrative
assessment is to be paid.
(4) Marketplace staff will annually report to the Director on the assessment on state programs.
Stat. Auth.: ORS 741.002
Stats. Implemented: ORS 741.105
Hist.: OHIE 1-2014, f. & cert. ef. 1-16-14; OHIE 1-2015(Temp), f. & cert. ef. 3-11-15 thru 9-4-15;
Administrative correction, 9-30-15; OHIE 3-2015, f. & cert. ef. 10-15-15; OHIE 4-2015, f. & cert. ef. 11-
6-15


![SD-WANとルータ実装例 - MPLSCisco SD-WAN ソリューション [1] IntelligentWAN [2] IWAN in DNA Arch. (CY2017) [3] Meraki ・ルータ機能:現IOS機能(DMVPN, PfR,AVC等)](https://img.pdfslide.net/doc/110x75/5e3884de3b079648140623ab/sd-wanffe-mpls-cisco-sd-wan-fffff-1-intelligentwan.jpg)