Embed Size (px)
Citation preview

MULTIPLE PROBLEMSKeith J Barrington
CHU Sainte Justine, Montréal

TWINS AND TRIPLETS IN NEONATAL RESEARCH
Neonatal research is unique in often enrolling large numbers of genetically identical or closely related subjects.
Particularly true when entry criteria are not very restrictive, such as by gestational age or birth weight
For some outcomes there is now evidence of a genetic influence, for other outcomes there may well be genetic effects

THERE ARE SITUATIONS IN OTHER FIELDS THAT ARE ANALOGOUS
Enrolment in maternal treatment trials of mothers carrying twins But they are always in the same group Could analyze all data independently, just select
the 1st twins outcomes, randomly select 1, analyze ‘by pregnancy’
Enrolment of individuals with bilateral eye disease Such as retinopathy, very highly correlated, but for
local treatments, can be randomized separately, as a block or into different groups

THE 2 EYE PROBLEM
Statistical techniques for addressing the correlation within blocks of 2 have been developed for the eyes in ophthalmologic research
All eye pairs are ‘monozygotic’ All eye pairs experience near identical
environmental conditions.
ETROP STUDY
Infants with bilateral eye disease (80%) One eye randomized to early treatment Other eye treated conventionally
Equivalent to randomizing twins to opposite groups
No correction for block
2 consents, one for enhanced screening and another for randomization to treatment 40 refusals and 401 randomized

WHAT OUTCOMES MAY BE GENETICALLY INFLUENCED?
Lung disease Hyaline Membrane Disease
Nagourney et al 1996 Bronchopulmonary Dysplasia
Bhutani et al. Lavoie et al.
Brain Injury IVH, less evidence
Bhutani et al not significant.
Retinopathy Bizzarro et al
Patent Ductus Arteriosus Lavoie et al

WHAT OUTCOMES MAY BE CORRELATED?
Other outcomes may be correlated in twins because of shared intra-uterine environment Chorioamnionitis Pre-Eclampsia Diabetes
Could all affect both twins (or all 3 triplets)

HOW DOES THIS AFFECT RESEARCH?
If there is a correlation in an outcome between twins, and the twins are in the same group, how does this affect trial design and analysis?
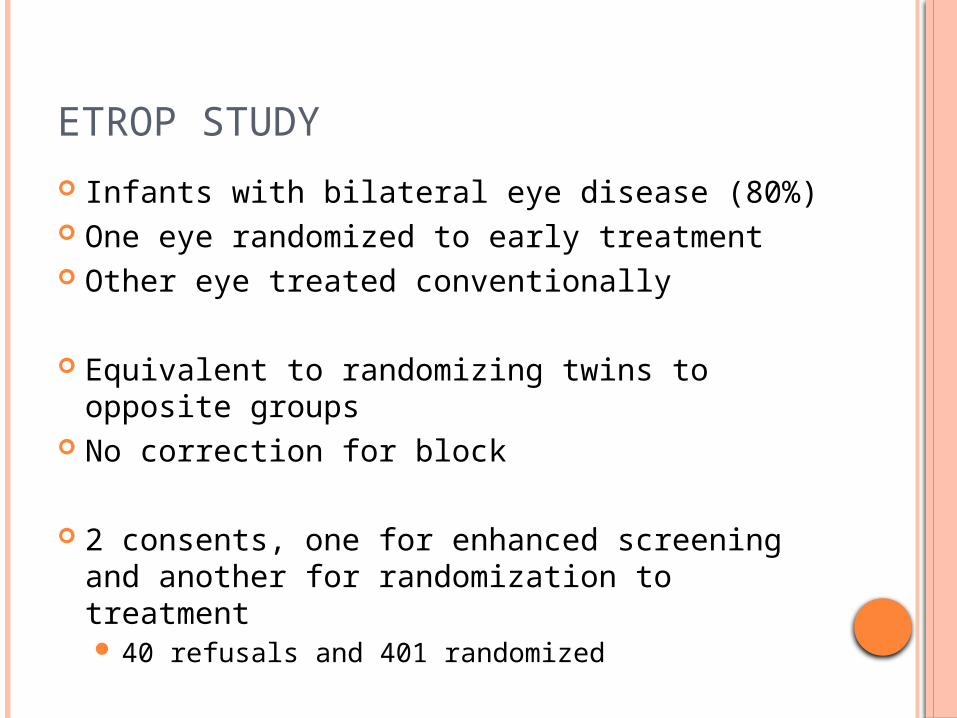
GATES AND BROCKLEHURST BJOG 2004 ‘Inclusion of non-independent data means
that the ‘‘effective sample size’’ of the trial is reduced: there are fewer independent outcomes in the trial than the number of babies that took part in it.
Analysing all babies as if they are independent will therefore overestimate the sample size and give confidence intervals that are too narrow’

FOR EXAMPLE:
If you had a trial with 100 twins, who had perfectly concordant results:
You have in reality only 50 ‘subjects’ in the trial Therefore much less power than you thought
But you have an ‘n’ of 100 for the analyses Therefore artificially narrowing the confidence
intervals

HOW IMPORTANT IS THIS IN REALITY?
In reality: The magnitude of this effect will depend on: The proportion of twins, the degree of
concordance, the method of analysis, and the impact of the intervention being studied Even if the intervention has no overall impact, if
it changes the concordance between twins, may have a major effect on results
And depends on how many twins are in the same group, or opposite groups

DOES INDEPENDENT RANDOMIZATION REALLY DECREASE ENROLMENT?
I have heard individual parents tell me that they only want their babies in the trial if they can get the same treatment.
I have also heard parents say they want their babies in opposite arms, to be sure that at least one gets the better treatment

CONSORT DIAGRAMS IN NEONATAL RESEARCH
Individually randomized versus block randomized multiples
Is there a difference in consent rate?

CONSENT RATE BY METHOD OF MULTIPLE RANDOMIZATION
Problem : often not clear from the publication how twins were enrolled.
Limitation: many other reasons for differential consent rates
Methods: calculated number of refusals of consent as a proportion of those approached for consent
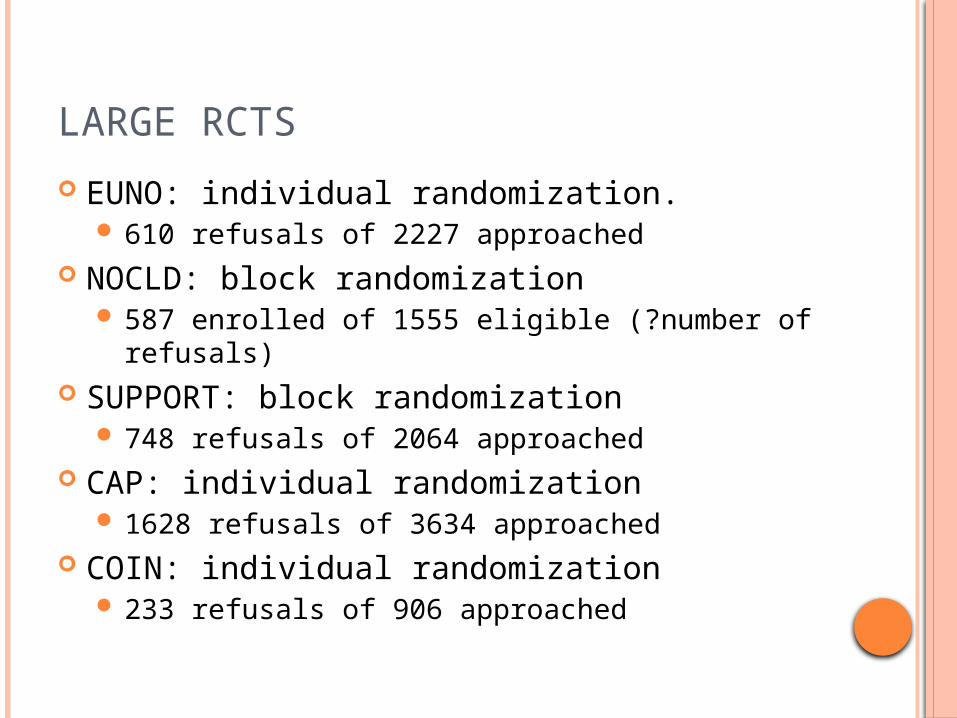
LARGE RCTS
EUNO: individual randomization. 610 refusals of 2227 approached
NOCLD: block randomization 587 enrolled of 1555 eligible (?number of
refusals) SUPPORT: block randomization
748 refusals of 2064 approached CAP: individual randomization
1628 refusals of 3634 approached COIN: individual randomization
233 refusals of 906 approached

RANDOMIZATION MODELS
If infants are randomized to the same group, i.e. as a cluster, then the analysis should take account of that
If there is little correlation between twins (eg severe IVH) then a strict cluster approach, such as the multiple outputation technique will reduce power, and risk type 2 error
If there is strong correlation between twins (eg BPD) then not correcting for clusters will, in general, make confidence intervals more narrow, and risk type 1 error
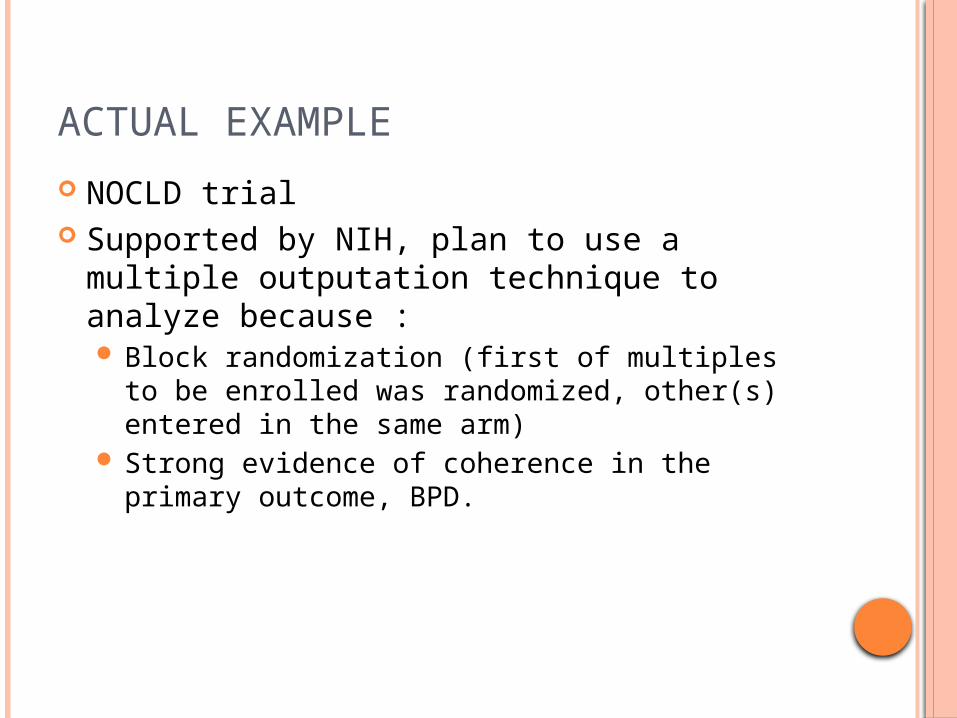
ACTUAL EXAMPLE
NOCLD trial Supported by NIH, plan to use a multiple
outputation technique to analyze because : Block randomization (first of multiples to be
enrolled was randomized, other(s) entered in the same arm)
Strong evidence of coherence in the primary outcome, BPD.

PUBLISHED DATA
Survival without BPD 129/294 with iNO 105/288 infants with placebo
p = 0.03 RR= 1.26; 95% CI, 1.02 to 1.55 Attempted Cochrane meta-analysis
If all the data are analyzed as if they were independent
p=0.08 RR = 1.12
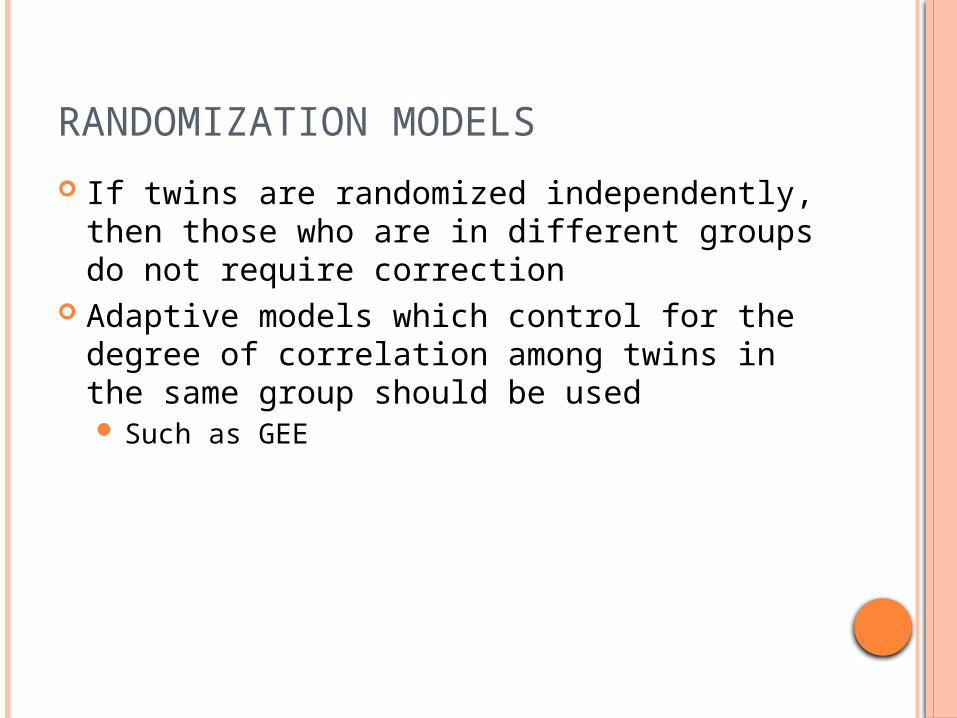
RANDOMIZATION MODELS
If twins are randomized independently, then those who are in different groups do not require correction
Adaptive models which control for the degree of correlation among twins in the same group should be used Such as GEE

ANOTHER EXAMPLE
If twins are individually randomized, then using stringent cluster techniques for all the pairs will decrease power
Schreiber et al iNO 51/105 infants death or BPD Placebo 65/102
(relative risk, 0.76; 95 percent confidence interval, 0.60 to 0.97; P=0.03)
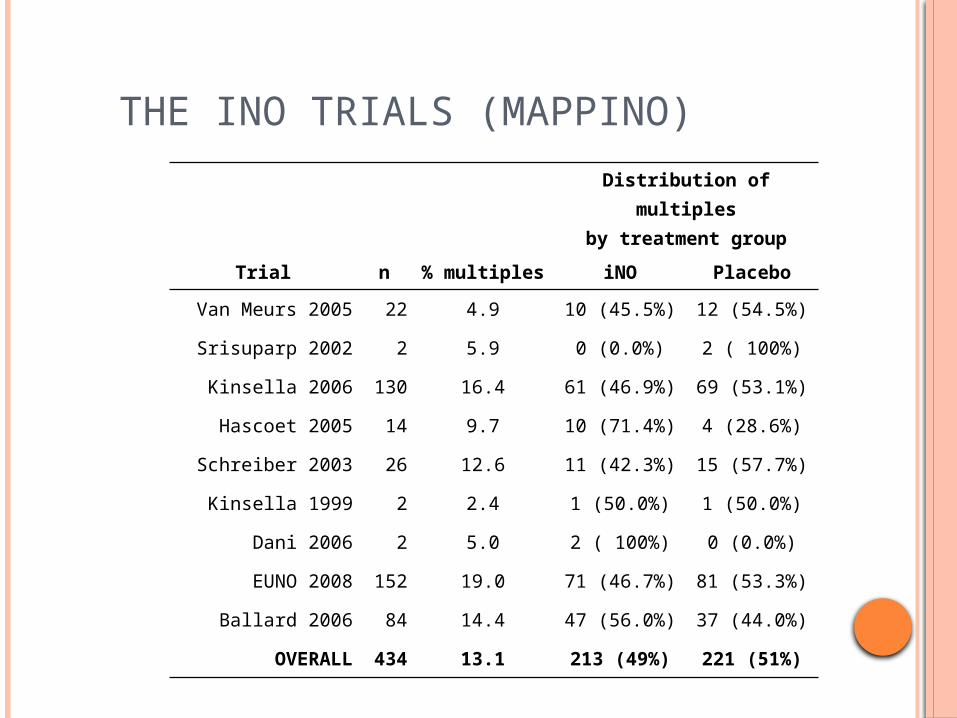
THE INO TRIALS (MAPPINO)
Distribution of multiplesby treatment group
Trial n % multiples iNO Placebo
Van Meurs 2005 22 4.9 10 (45.5%) 12 (54.5%)
Srisuparp 2002 2 5.9 0 (0.0%) 2 ( 100%)
Kinsella 2006 130 16.4 61 (46.9%) 69 (53.1%)
Hascoet 2005 14 9.7 10 (71.4%) 4 (28.6%)
Schreiber 2003 26 12.6 11 (42.3%) 15 (57.7%)
Kinsella 1999 2 2.4 1 (50.0%) 1 (50.0%)
Dani 2006 2 5.0 2 ( 100%) 0 (0.0%)
EUNO 2008 152 19.0 71 (46.7%) 81 (53.3%)
Ballard 2006 84 14.4 47 (56.0%) 37 (44.0%)
OVERALL 434 13.1 213 (49%) 221 (51%)
† Subhedar removed from the analysis as zero cell counts caused model instability.
* χ2 test for heterogeneity p > 0.05
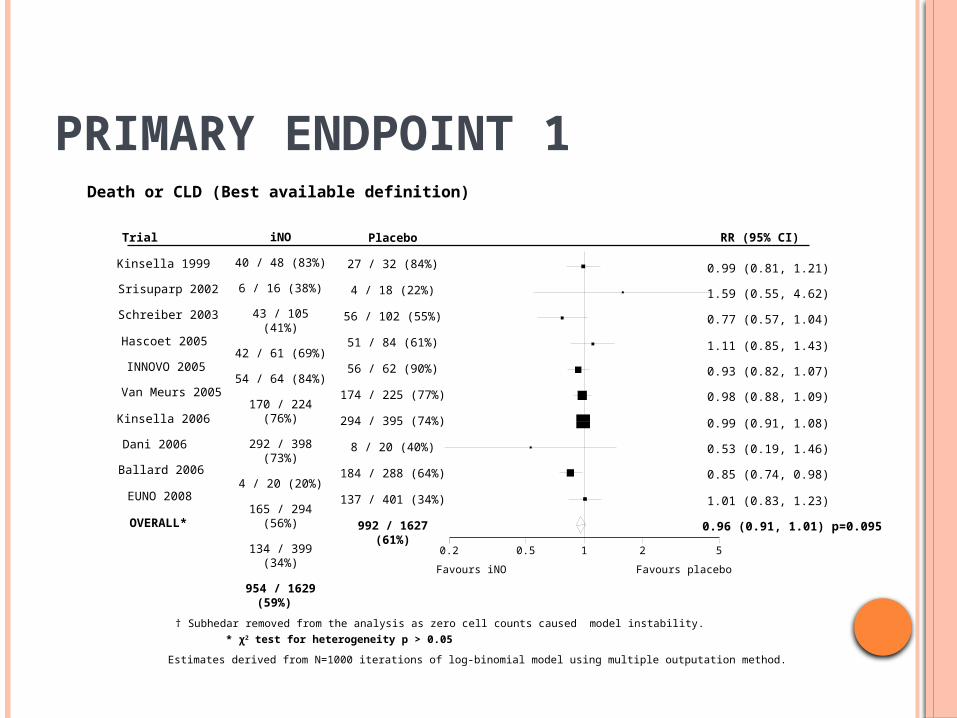
Estimates derived from N=1000 iterations of log-binomial model using multiple outputation method.
Death or CLD (Best available definition)
0.2 0.5 1 2 5
OVERALL*
iNO
40 / 48 (83%)
6 / 16 (38%)
43 / 105 (41%)
42 / 61 (69%)
54 / 64 (84%)
170 / 224 (76%)
292 / 398 (73%)
4 / 20 (20%)
165 / 294 (56%)
134 / 399 (34%)
954 / 1629 (59%)
RR (95% CI)Trial Placebo
27 / 32 (84%)
4 / 18 (22%)
56 / 102 (55%)
51 / 84 (61%)
56 / 62 (90%)
174 / 225 (77%)
294 / 395 (74%)
8 / 20 (40%)
184 / 288 (64%)
137 / 401 (34%)
992 / 1627 (61%)
Favours placeboFavours iNO
EUNO 2008
Ballard 2006
Dani 2006
Kinsella 2006
Van Meurs 2005
INNOVO 2005
Hascoet 2005
Schreiber 2003
Srisuparp 2002
Kinsella 1999
0.96 (0.91, 1.01) p=0.095
1.01 (0.83, 1.23)
0.85 (0.74, 0.98)
0.53 (0.19, 1.46)
0.99 (0.91, 1.08)
0.98 (0.88, 1.09)
0.93 (0.82, 1.07)
1.11 (0.85, 1.43)
0.77 (0.57, 1.04)
1.59 (0.55, 4.62)
0.99 (0.81, 1.21)
PRIMARY ENDPOINT 1
IMPLICATIONS?
Do not use multiple outputation for independently enrolled infants
The impact of analyzing multiples in the same group as if they were independent are dependent on how highly correlated the outcomes are, and what proportion of twins.

GATES AND BROCKLEHURST
Re-analysis of the antenatal TRH trial (20% multiples)
Monte Carlo simulation of trials with 33% multiples

MethodAntenatal TRH trial
TRH group Placebo group OR (95% CI)
Assume independence between babies
34/136 (25.0) 43/139 (30.9) 0.74 [0.42, 1.31]
Analyse by pregnancy 29/112 (25.9) 34/113 (30.1) 0.81 [0.43, 1.51]
Random selection
Expected average result 27/112 (24.1) 32.33/113 (28.6) 0.80 [0.55, 1.52]
Mean of 1000 repetitions 0.83 {0.04}
Cluster trial methods 34/136 (25.0) 43/139 (30.9) 0.74 [0.41, 1.34]

MethodTrial B
Intervention group Placebo group OR (95% CI)
Assume independence between babies
138/680 (20.3) 136/680 (20.0) 1.02 [0.78, 1.33]
Analyse by pregnancy 107/500 (21.4) 128/500 (25.6) 0.79 [0.59, 1.06]
Random selection
Expected average result 83/500 (16.6) 100/500 (20.0) 0.80 [0.58, 1.10]
Mean of 1000 repetitions 0.80 {0.05}
Extremes107/500 (21.4) 75/500 (15.0) 1.54 [1.11, 2.14]
59/500 (11.8) 128/500 (25.6) 0.39 [0.28, 0.55]
Cluster trial methods 138/680 (20.3) 136/680 (20.0) 1.02 [0.78, 1.33]

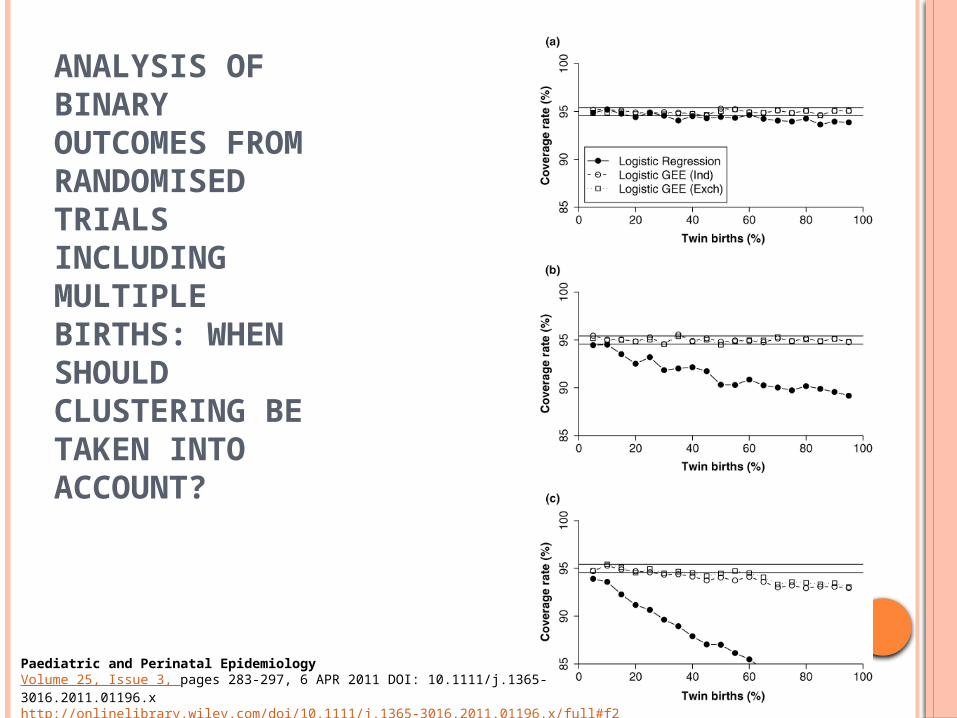
ANALYSIS OF BINARY OUTCOMES FROM RANDOMISED TRIALS INCLUDING MULTIPLE BIRTHS: WHEN SHOULD CLUSTERING BE TAKEN INTO ACCOUNT?YELLAND ET AL 2011
A= INTRAPAIR CORRELATION OF 0.1B=INTRAPAIR CORRELATION OF 0.5C=INTRAPAIR CORRELATION OF 0.9
Paediatric and Perinatal EpidemiologyVolume 25, Issue 3, pages 283-297, 6 APR 2011 DOI: 10.1111/j.1365-3016.2011.01196.xhttp://onlinelibrary.wiley.com/doi/10.1111/j.1365-3016.2011.01196.x/full#f1
ANALYSIS OF BINARY OUTCOMES FROM RANDOMISED TRIALS INCLUDING MULTIPLE BIRTHS: WHEN SHOULD CLUSTERING BE TAKEN INTO ACCOUNT?
Paediatric and Perinatal EpidemiologyVolume 25, Issue 3, pages 283-297, 6 APR 2011 DOI: 10.1111/j.1365-3016.2011.01196.xhttp://onlinelibrary.wiley.com/doi/10.1111/j.1365-3016.2011.01196.x/full#f2
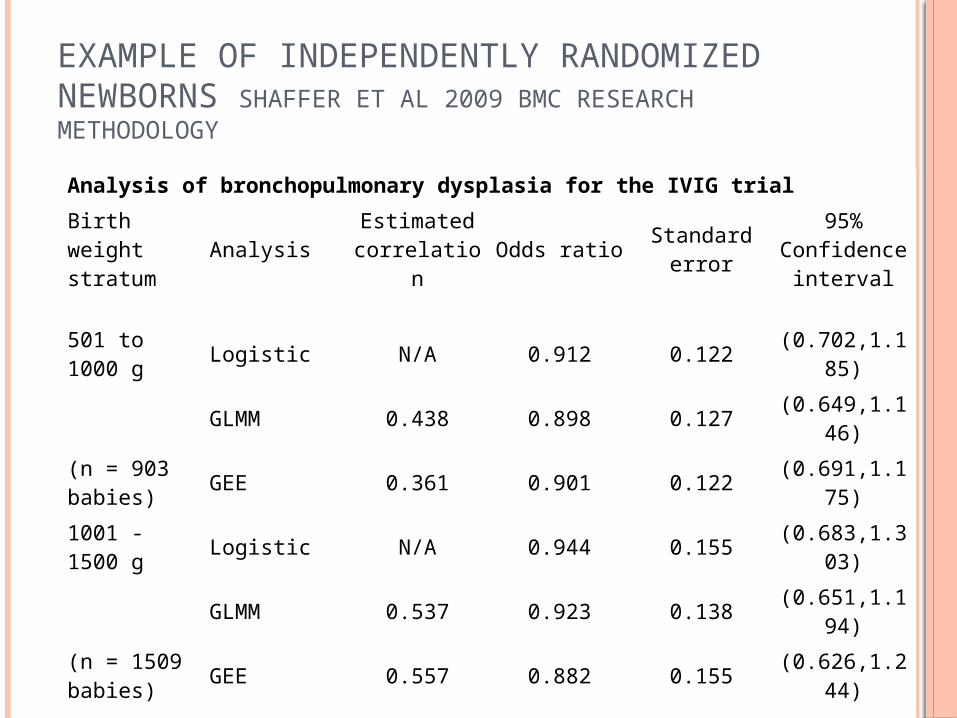
EXAMPLE OF INDEPENDENTLY RANDOMIZED NEWBORNS SHAFFER ET AL 2009 BMC RESEARCH METHODOLOGY
Analysis of bronchopulmonary dysplasia for the IVIG trial
Birth weight stratum Analysis Estimated
correlation Odds ratio Standard error
95% Confidence
interval
501 to 1000 g Logistic N/A 0.912 0.122 (0.702,1.18
5)
GLMM 0.438 0.898 0.127 (0.649,1.146)
(n = 903 babies) GEE 0.361 0.901 0.122 (0.691,1.17
5)
1001 - 1500 g Logistic N/A 0.944 0.155 (0.683,1.30
3)
GLMM 0.537 0.923 0.138 (0.651,1.194)
(n = 1509 babies) GEE 0.557 0.882 0.155 (0.626,1.24
4)
Randomization was done independently for twins. The multiple gestation rates were 15% and 16% for the 501 to 1000 g babies and 1001 to 1500 g babies, respectively.

WHAT SHOULD WE DO?
Because different methods of analysis can give different results it is important to specify the analysis before the data are available, to prevent ‘creative accounting’
Subjects randomized as a cluster should be analyzed as a cluster, some techniques seem more conservative and may inflate the risk of type 2 error

WHAT SHOULD WE DO?
When subjects are randomized independently, subjects that are in the same group should be analyzed by methods that can adapt to the degree of correlation Reasonable to plan from the start that if the
correlation is less than a certain limit, it will not be adjusted for. EG ≤ 0.2
PUBLICATION OF PROTOCOLS
Protocols as designed at the start of a trial may have different primary outcomes to those actually published.
A major reason seems to be that the primary outcome was not significant!

Chen et al CMAJ 2004

WHAT SHOULD WE DO
Develop empirical data concerning the effects of different randomization models on consent rates
Protocols should be published and, in addition to other details such as the primary outcome, should detail analysis methods Including the methods that will be used for twins
During enrolment it should be clearly identified in the data set if siblings are in the trial
Original data should be available, to enable SR and meta-analysis which replicates the original analysis
WHICH RANDOMIZATION METHOD IS BEST?
In terms of the mathematical consequences randomizing the first eligible infant, and entering the second in the alternate group Genetic and other risk factors balanced Maintains or even increases power Questionable acceptability
What about triplets? Multiple group trials?
For some families randomizing 1st eligible infant and entering siblings in the same group may be only acceptable method Don’t know how frequent this is, may ensure good
representation of multiples Effectively discounts the contribution of the
multiples to the analysis

WHICH RANDOMIZATION METHOD IS BEST?
Independent randomization has less effect on power
Examples I showed have good twin representation
Doesn’t completely eliminate the need to adjust the analysis for those multiples which are in the same group
Preserves the value of the contribution of the multiples

HOW DOES THIS AFFECT THE FAMILIES?
Are there consequences of the method of enrollment on the families in the long term?
If one dies or does poorly? If there is an important treatment effect?
Little information of the long term effects of trial participation, particularly for multiples