Embed Size (px)
Citation preview

M-UR- 95-3837
Titie:
Author@):
Submitted to:
N A T I O N A L L A B O R A T O R Y
ISOTOPIC SIGNATURES AN IMPORTANT TOOL IN TODAY'S WORLD
D. J. Rokop, D. W. E f u r d , T. M. Benjamin, J. H. Cappis, J. W. Chamberlin, H. Poths, F. R. Roensch
Isotopic Science Perth, Australia November 6-8, 1995
Los Alamos National Laboratory, an affirmative actionhqual opportunity empldyer, is operated by the University of California for the US. Department of Energy under contract W-7405-ENG-36. By acceptance of this article, the publisher recognizes that the US. Government retains a nonexclusive, royalty-free license to publish or reproduce the published form of this contribution, or to allow others to do so, for US. Government purposes. The Los Alamos National Laboratory requests that the publisher identify this article as work performed under the auspices of the US. Department of
836 R5 9 1m1
WTRIBUTEON OF THIS DOCUMENT IS ~~~~ urJ

Portions of this document xn8y be inegibre in electronic image products. Smages are produced fmm tbe best adable originsl dOCtXIlUlt

ISOTOPIC SIGNATURES, AN IMPORTANT TOOL IN TODAY’S WORLD
Donald J. Rokop, Deward W. Efurd, Timothy M. Benjamin, John H. Cappis,
John W. Chamberlin, Harald Poths, and Fred R. Roensch
Chemical Science and Technology Division, Los Alamos National Laboratory, MS J-5 14
Los Alamos, NM, 87545, USA
ABSTRACT
High-sensitivityfhigh-accuracy actinide measurement techniques developed to support weapons diagnostic capabilities at the
Los Alamos National Laboratory are now being used for environmental monitoring. The measurement techniques used are
Thermal Ionization Mass Spectrometry (TIMS), Alpha SpectromeQy(AS), and High Resolution Gamma
Spectrometry(HRGS). These techniques are used to address a wide variety of actinide inventory issues: environmental
surveillance, site characterizations, food chain member determination, sedimentary records of activities, and treaty
compliance concerns. As little as 10 femtograms of plutonium can be detected in samples and isotopic signatures
determined on samples containing sub-100 femtogram amounts. Uranium, present in all environmental samples, can
generally yield isotopic signatures of anthropogenic origin when present at the 40 picogrdgram level. Solid samples (soils,
sediments, fauna, and tissue) can range from a few particles to several kilograms in size. Water samples can range from a
few milliliters to as much as 200 1.
INTRODUCTION
The moratorium on weapons testing has made it necessary to find new applications for the radiochemical diagnostic
capabilities of the Chemical Science and Technology Division at Los Alamos. Many areas were explored but the three
which seemed to hold the highest potential for doing both good science and having sufficient funds to support them were:
environmental monitoring of actinide elements in support of clean-up efforts, providing tracers for industrial applications,
and supporting the IAEA in its efforts to monitor the Non-Proliferation Treaty (NPT). We are actively involved in the first
and third areas and aggressively pursuing the second.

Environmental actinide monitoring has historically been done with inexpensive survey techniques, principally AS. The
technique, which is fast and relatively simple, suffers one major drawback, it has inadequate resolution to separate
anthropogenic source terms from natural background or fall-out. AS also cannot attribute single versus multiple source
terms. Mass spectrometric isotopic dilution (MSID), a tool long used by isotope geologists and the nuclear industry, had not
been applied in a broad way to environmental problems. Our first effort using this method was to do an actinide inventory
of the Pajarito Plateau, the area surrounding the Los Alamos National Laboratory (LANL). The method quickly illuminated
and expanded the scope of actinides in the environment. Actinide concentrations, previously found to be below health
limits, and therefore not requiring remedial action or attribution, can now be detected with 100 to 1000 times more
sensitivity than historic techniques and can frequently be attributed to a specific source. While this capability is a powerful
new tool for environmental researchers, helping determine transport phenomena and remediation effectiveness, it has also
created a communication problem of enormous magnitude. How do you explain to concerned citizens, with little scientific
background, the tremendous sensitivity of the method, while assuring them of the corresponding negligible health impact?
The nature of any, including nuclear, material processing causes minute amounts of various constituents to be lost during
handling. For example, certain fission products, like Ru, I, and Tc, have very volatile chemical forms which are difficult to
contain. Their detection by sensitive methods can contain significant information about the process. The large volume of the
material potentially handled by proliferants makes actinides and the associated fission products easy to detect. For this
reason, the IAEA has decided to adopt environmental monitoring techniques to assist inspectors in assessing member
countries compliance with the NPT and other applicable treaties. A former LANL staff member is in Vienna to help the
IAEA build a clean laboratory suitable for environmental measurements. An ongoing program is training chemists and
mass spectroscopists from the IAEA in low level environmental measurement techniques. LANL also participated, along
with other laboratories, in field trial experiments which were used to demonstrate the merits of the MSID method. LANL is
anticipating, along with other network laboratories, participation in the forthcoming environmental monitoring program.
%.
This paper will describe the physical requirements necessary to apply the MSID actinide method at environmental levels,
the actinide measurement sensitivities of MSID, and, specific applications in various matrices.
2

CLEAN CHEMISTRY AND MASS SPECTROMETRY
A 1400 m2 Clean Chemistry and Mass Spectrometry facility was built at Los Alamos to accommodate the processing of
samples for weapons diagnostics. This facility permits very small samples of the actinides to be handled such that the
integrity of the field sample can be protected from contamination to very low levels. Plutonium process blanks are <3E-15
grams and uranium blanks <1E-9 grams. This facility has the capacity to handle >2000 actinide samples annually at this
low blank level. Laminar flow “clean” air passed through hepa-filters directly over work surfaces and rigid protocols for
sample content and handling help provide this integrity. A complete description of these techniques can be found in several
publications (Efurd et. al. 1992, Efurd et. al., 1993, Rokop, et. al., 1982).
Because of it’s high crustal abundance, -3E-6 g /g , natural U in the environment diiutes anthropogenic source terms and
makes U a high accuracy measurement. The predominant triggers to anthropogenic source term are slight changes to the
235/238 ratio (natural is 0.007254) and the presence of 236U. Plutonium, on the other hand, is a high-sensitivity
measurement. Almost all surface material now contains fallout plutonium in the 10-50 femtogram range. The 240/239 ratio
for fallout is subject to slight changes from local signature overlay. The area near Denver, CO, with Rocky Flats providing
the local overlay, has a 240/239 fallout ratio of 0.169 +/- 0.005 (Ehrd et. al., 1994) while sediment samples collected from
the Irish Sea has a 240/239 ratio of 0.24+/-0.01 (unpublished work, Efurd, et. al, 1995). The integrated average world-wide
is 0.18 ( k e y , et. al., 1976).
Given “clean” chemistry and mass spectrometric capability, there are two different philosophies for making measurements
if the goal is detecting undeclared or illicit activity, “bulk” and “particle”. The “bulk” method involves total dissolution of
the matrix or leaching the desired material from the matrix followed by chemical purification and TIMS. “Particle”
involves collecting particles on swipes or filters, separating the particles and depositing them on a slide with collodian,
irradiation in contact with Lexan (for recording the fission tracks created by actinide particles) reregistering the slide and
lexan, cutting out the desired particle, and, finally, TIMS. While“partic1e” generates less ambiguous results and has little or
no background from natural or fallout, it is slow and much more expensive (X5) and labor intensive. It also suffers from
Nitpickers disease, trying to sort out the particular or desired indicator of process. In the IAEA field trials it also
3

demonstrated a lower percentage of “hits” than “bulk”. “Bulk” is relatively fast and has a higher percentage of“hits”. A
best situation would utilize “bulk” and if a hit were recorded and less ambiguity is desired, follow with “particle”.
As more data is gathered from environmental samples, the question of how to interpret the results is becoming very
important. LANL uses algorithms developed for weapons diagnostics to separate multiple actinide sources. We plan to
work with the IAEA to refine these models and make them more useful for their specific purposes.
Table 1 lists a selection of some of the different matrices analyzed by CST for determining environmental actinides. While
this list is incomplete, it serves to indicate the wide application of‘bulk” analysis. Particularly effective are filter papers of
swipes taken from non-technical areas of nuclear facilities. They give almost complete indication of process.
Table 2 shows the measurement sensitivities of the MSID “bulk” analysis method. It can be seen that approximately 1000
times more sample is needed for signature than is required for detection. A caveat here is that recent chemical purification
improvements would indicate a lowering of atoms needed for signature by -X10. A general rule is that the more
complicated the matrix is, the more difficult it is to purify the actinide, and, the less sensitive the measurement.
ENVIRONMENTAL SURVEILLANCE, THE PAJARITO PLATEAU
In support of the Environmental Surveillance Group at Los Alamos National Laboratory, an actinide inventory of ground
waters and sediments from the surrounding Pajarito Plateau was performed. Uranium and plutonium were measured in
each sample. Although anthropogenic sources were found for both U and Pu in some samples, no correlation was found
between the two. One interesting fact which emerged from the study was that no modem weapons grade plutonium was
found. Only pre-1960 material was found. A11 known sources of plutonium on the plateau were considered, pre-1960
weapons grade (240/239 -O.Ol), modem weapons grade (240/239 = 0.060 +/- 0.005), and fallout (240/239 = 0.18 +/- 0.02).
Only a few samples looked like they had modem 240/239 ratios, and they were shown, by mixing models, to be a mixture
of old and fallout. No measurement plateau was found indicating that modem weapons grade material was present in the
suit of samples submitted for analysis.
4
Figure 1 shows a uranium report from this study. The isotopic composition is a mixture of natural uranium, found in all
samples as explained above, and depleted uranium. This sample is from a groundwater, which is a good medium in which
to find an anthropogenic uranium source term, as soils and sediments can dilute out unnatural sources very quickly because
of their high natural uranium content. A bar graph representation was chosen comparing natural uranium with the isotopic
composition found in the sample was used to insure that full utilization of the information, by a customer with little
familiarity with isotopic signatures, was possible. With the new customer base we are dealing with, communication has
become a challenge in itself.
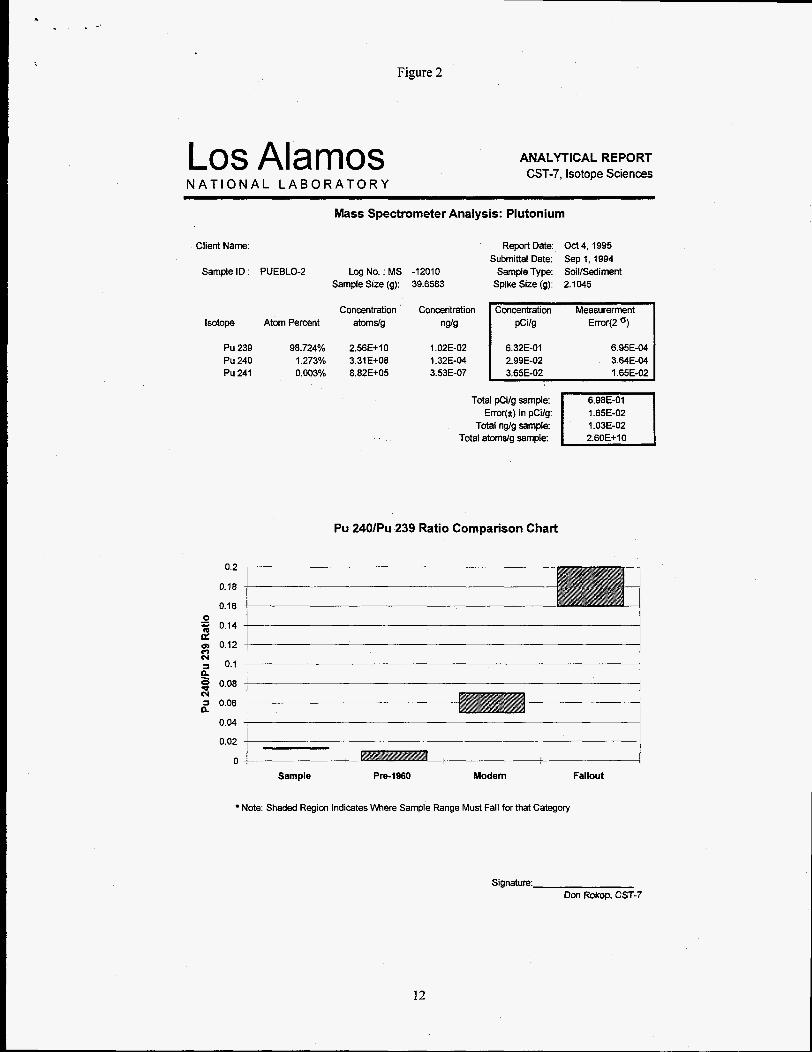
Figure 2 shows a plutonium report from this study. The bar graph shows the three known source terms for the Pajarito
Plateau, old pre-1960’s Pu, modem Pu, and fallout (see above for isotopic details). This sample is from -40 grams of
sediment obtained from a canyon bottom. It clearly represents the old weapons grade material. This sample has a relatively
high concentration of Pu but still shows the effect of mixing with fallout material.
A very accurate history of Los Alamos, at least in its earlier days, could be written from information obtained by
environmental monitoring efforts. Also demonstrated, is the ability to trace a unknown contaminant to its source term.
IAEA 93+2 FIELD TRIAL EXPERIMENTS
The IAEA 93+2 program was started to survey available measurement techniques which couid determine compliance of
signees to the NPT. The 93+2 program seeks support in: a) reliable analytical techniques for the determination of
undeclared activities; b) training of staff in sampling techniques; c) training of staff in selected analytical techniques; d)
search for and obtain access to environmental data bases; and, e) to find network laboratories from member states to help
relieve the heavy analytical load of the Safeguards Analytical Laboratory (SAL). The selected techniques should be easily
implemented into the IAEA structure and partially supported by member states. The first step in the process is the
construction of a “clean” laboratory for the chemical preparation and measurement of environmental samples. The latter
task was accomphhed with the support of US finds.
5

The IAEA, with the support the NN-44, the US DOE Office for International Safeguards, conducted a series of field trial
experiments at twelve facilities around the world. The experiments were designed to demonstrate whether environmental
monitoring could provide evidence of activities conducted within those facilities. These analytical techniques included:
radiometric measurements; isotopic measurements by both bulk and particle; accelerator mass spectrometry; and, elemental
screening. Several Laboratories participated using various analytical techniques. The consensus opinion of the evaluators
was that environmental monitoring could, indeed, do the job. Accordingly, the IAEA board of governors has approved the
implementation of environmental monitoring as one means of strengthening safeguards. Of interest to LANL was the fact
that actinides, removed from the vicinity of nuclear facilities, in any one of several matrices, could show very clearly the
specific activities of that particular facility. Reactors, reprocessing plants, and enrichment plants were monitored.
One item of particular importance emerged, could our QNQC program (Cappis, et. al., 1994) hold up to the scrutiny of the
IAEA if we found evidence of a member states non-compliance with a treaty? We expressed our concern to the IAEA, who
were expressing some of the same doubts. This lead to confirmation that suitable performance based evaluation standards
are not available, so the IAEA initiated a program to produce standards of their own. Our long history of actinide chemistry
and measurement will be utilized in this program along with the participation of laboratories in at least three other countries.
ROCKY FLATS ENVIRONMENTAL MONITORING
The Rocky Flats Plant (RFP) near Denver, CO, built nuclear weapons components for the United States Department of
Energy. While the plant was in operation, inadvertent releases of U and Pu occurred. LANL was commissioned to
investigate the results of very intense remediation and containment efforts. Retention ponds, diversion structures, and
ditches were used for containment. LANL measured the U and Pu content of waters, soils and sediments over a three year
period to determine the success of these efforts.
It should be noted that both inflow and outflow from a creek which passed through the plant boundaries was also monitored.
The creek contained fallout Pu and natural uranium coming in with slightly reduced concentration of U on the outflow. The
outflow did, however, contain an altered isotopic signature from fallout. It should also be noted that the Pu 240/239 ratio
6

characterized for fallout, 0.169 versus 0.18, was slightly different from world integrated average due to local overlay
(Efurd, et. al., 1994, and Krey, et. al., 1976).
Another observation made during this experiment were that, as expected, anthropogenic U was much more visible in surface
waters than in soils or sediments. As pointed out previously, the natural U background in soil quickly dilutes out
anthropogenic source term. Pu, however, was more visible in the sediments. There was approximately 50X more Pu in a
gram of sediment than in one liter of water (Rokop, et. al., 1994). This is explained by the fact that Pu is adsorbed onto clay
particles in the water which settle onto the sediments with time. It is unclear whether the Pu is fured into the sedimentary
layers or if it can move from position to position. Experience with sampling from sedimentary clay cores suggests that it
stays fixed, at least somewhat, as sedimentary layers from pre-nuclear history, before 1935, does not show Pu from fallout
or any other source (Rokop, et. al., unpublished work, 1995).
While the retention ponds and ditches did show the presence of Rocky Flats product, the remediation efforts were, indeed,
very successful. The concentration of RFP actinides, with one exception , were all far below the very low standards set by
the State of Colorado. The one exception, summertime increase in Pu content of one of the retention ponds, turned out to
be due to a near-by volleyball game disturbing soil previously contaminated. This water was retained and remediated until
testing demonstrated the removal of Pu. No excursions above, or even close to, Colorado limits were observed outside the
plant boundaries.
CONCLUSION
Isotopic signatures are a powerful tool that can be utilized for a wide variety of new applications in today’s world.
Environmental, industrial, and political spheres will be strongly influenced by their use. This tool is extremely flexible and
its use is limited only by the imagination of those of us who possess it.
7

The authors would like to dedicate this paper, and the oral presentation it follows, to Professor John de Laeter of Curtin
University of Technology, for his long and distinguished career. Three words come to mind when we think of John,
gentleman, eloquent, and integrity.
8
REFERENCES
Efurd, D.W., Rokop, D.J., Perrin, R.E., 1992, ACTINIDE DETERMINATION AND ANALYTICAL SUPPORT FOR WATER CHARACTERIZATION AND TREATMENT STUDIES AT ROCKY FLATS, LA-UR-93-9 17, Annual Report, LANL, NM
.
Efurd, D.W., Rokop, D.J., Perrin, R.E., 1993, CHARACTERIZATION OF THE RADIOACTIVITY IN SURFACE- WATERS AND SEDIMENTS COLLECTED AT ROCKY FLATS FACILITY, LA-UR-93-4373, Annual Report, LANL, NM
Rokop, D.J., Perrin, R.E., Knobeloch, G.W., Armijo, V. M., Shields, W.R., 1982, THERMAL IONIZATION MASS SPECTROMETRY OF URANIUM WITH ELECTRODEPOSITION AS A LOADING TECHNIQUE, Anal. Chem. 54, (957).
E k d , D.W., Rokop, D.J., and Roensch, F.R., 1994, MEASUREMENT OF 24OPtd239Pu AND 241Pd239Pu ATOM RATIOS IN SOILS REPRESENTATIVE OF GLOBAL FALLOUT IN COLORADO, LA-UR-94-4200, LANL, NM
Efurd, D.W., Poths, H., Rokop, D.J., Roensch, F.R. and Olson, R.L., 1995, ISOTOPIC FINGERPRINTING OF PLUTONIUM IN SURFACE SOIL SAMPLES COLLECTED IN COLORADO, LA-UR-95-336 1.
Krey, P.W., Hardy, E.P., Pachucki, C., Rourke, F., Coluzza, J., and Benson, W.K., 1976, MASS ISOTOPIC COMPOSITION OF GLOBAL FALL-OUT PLUTONIUM IN SOIL, in PROCEEDINGS OF A SYMPOSIUM ON TRANSURANIUM NUCLIDES IN THE ENVIRONMENT, San Francisco, CA November 1975, International Atomic Energy Agency Report STI/PUB/4 10, pp. 1 7-2 1.
Cappis, J.H., Rokop, D.J., Dalton, S.A., 1994, LANL-NWAL-QA, LA-UR-94-1133, PP. 3-40.
Rokop, D.J., Efurd, D.W., Perrin, R.E., 1994, ACTINIDE DETERMINATION AND ANALYTICAL SUPPORT FOR THE CHARACTERIZATION OF ENVIRONMENTAL SAMPLES, IAEA-SM-333199, IAEA Anual Meeting , March, 1 9 9 4 , ~ ~ 475-483.
Rokop, D.J., Efurd, W.D., Roensch, F.R., Poths, H., 1995, Unpublished Work.
9

TABLE 1
Sample Matrices
NTSDebris
Soils
Sediments
Sea Water
Fresh Water
Filter Papers
Vegetation
Soft Tissues
Bones
pine needles
grass
apples
feces (sheep
Vegetation
Fauna
TABLE 2
Measurement Sensitivities
Elemental Concentrations
U 5 x lo6 atoms
Pu 5 x io5 atoms
Am 2 x io5 atoms
NP 2 x io5 atoms
Separation Chemistry
Sample Matrix SamDle Size YO Recovery
Water
Soil
2000 ml >90
100 g >90
whale liver
whale blubber
star fish
salmon
chubs
trout
Isotopic Finaerprints
5 x io9 atoms
5 x 10' atoms
2 x 10' atoms
2 x IO' atoms
Biotissue 100 g >90
10

Los Alamos N A T I O N A L L A B O R A T O R Y
Figure 1
ANALYTICAL REPORT CST-7, Isotope Sciences
Mass Spectrometer Analysis Uranium
Client Name:
Sample ID : ANCHO SPRING Log No. : MS -1 1775 Sample Size (mi): 500
Report Date: Oct 3, 1995 Submittal Date: Apr 20, 1994
Sample Type: Water Spike Size (9): 0.5829
Isotope Atom Percent
U 234 U 235 U 236 U 238
0.010% 0.675% 0.000%
99.315%
Concentration Concentration Concentration atomsl l nglL pCilL
1.69E+ 11 1.12E+ 13 4.31 E+ 09 1.64E+ 15
Measurerment Error(2 ")
4.1 OE-01 8.72E03 9.42 E-0 3 2.1 8 E-05 1.09E-04 3.36 E-05
6.5 8 E-02 4.36E+ 00
6.50E+ 02 1.69E-03
6.38 E-0 1 8.74E-03
6.54E+ 02
Total pCilL sample: Error(* ) in pCilL:
Total nglL sample: Total atomslL sample:
Atom Percent: Sample vs Natural Uranium
U 238
U 236
U 235
U 234
000% 10 00% 2000% 3000% 4000% 5000% 6000% 7000% 8000% 90 00% 100 00%
Atom Percent (%) Expanded View for U 234, U 235, U 236
I I
I I 1 I 1
I U 236 I
U 235
U 234
0.00% 0.10% 0 20% 0 30% 0.40% 0.50% 0.60% 0.70% 0.80%
&Sample tom Per BNafural nt %) Uranium
* * The U 236 concentration indicates a neutron radiation history * * Comparing the U 235 to natural Uranium indicates that this sample contains a depleted component * * The U 234 in this sample is in radioactive disequilibrium
Signature: Don Rokop, CST-7
11
. -
Figure 2
ANALYTICAL REPORT Los Alamos CST-7, Isotope Sciences N A T I O N A L L A B O R A T O R Y
Mass Spectrometer Analysis: Plutonium
Client Name:
Sample ID :
Isotope
Pu 239 Pu 240 Pu 241
PUEBLO-2
Atom Percent
98.724% 1.273% 0.003%
LO^ NO. : MS -12010 Sample Size (g): 39.6583
Report Date: Oct 4, 1995 Submittal Date: Sep 1, 1994
Sample Type: Soil/Sediment Spike Size (9): 2.7045
Concentration atomdg Error(2 O)
2.56E+ 10 3.31E+08 8.82E+05
6.95E-04 6.32E-01 2.99E-02 3.64E-04
1.02E-02 1.32E-04 3.53E-07
1.65E-02 1.03E-02
Total pCi/g sample: Error(+) in pCi/g:
Total nglg sample: Total atomgg sample:
Pu 240/Pu 239 Ratio Comparison Chart
0.2
0.18
0.16 0 i 2 J 0.14 I
0
4 0.08 ,
Sample Pre-1960 Modem Fallout
Note: Shaded Region Indicates Where Sample Range Must Fall for that Category
Signature: DOII Rokop. CST-7
12