Embed Size (px)
Citation preview

Attachment M.27
Attachment M27_ CEG: Extrapolation of the Bloomberg curve to 10 years
19 June, 2015
CEG Asia Pacific Suite 201, 111 Harrington Street
Sydney NSW 2000 Australia
T +61 2 9881 5754 www.ceg-ap.com
1
Memorandum
To: SAPN
From: Dr Tom Hird, CEG – Asia Pacific
Date: 19 June 2015
Subject: Extrapolation of the Bloomberg curve to 10 years
1 Purpose
1. The purpose of this memo is to respond to AER criticism in its JGN final decision1
in relation to using testing procedures to select the best estimate of the cost of debt
in relation to:
how to extrapolate the Bloomberg and/or RBA BBB published yield estimates
to 10 years;
how to determine the weight that should be given to the Bloomberg/RBA BBB
curves in arriving at a best estimate.
2 AER views for JGN
2. CEG was asked by JGN to provide a report2 which, in part, attempted to answer the
above two questions during JGN’s averaging period. CEG’s conclusion was that a
simple average of the Bloomberg and RBA curves was appropriate and that the best
methodology for extrapolating to 10 was the “SAPN methodology”3
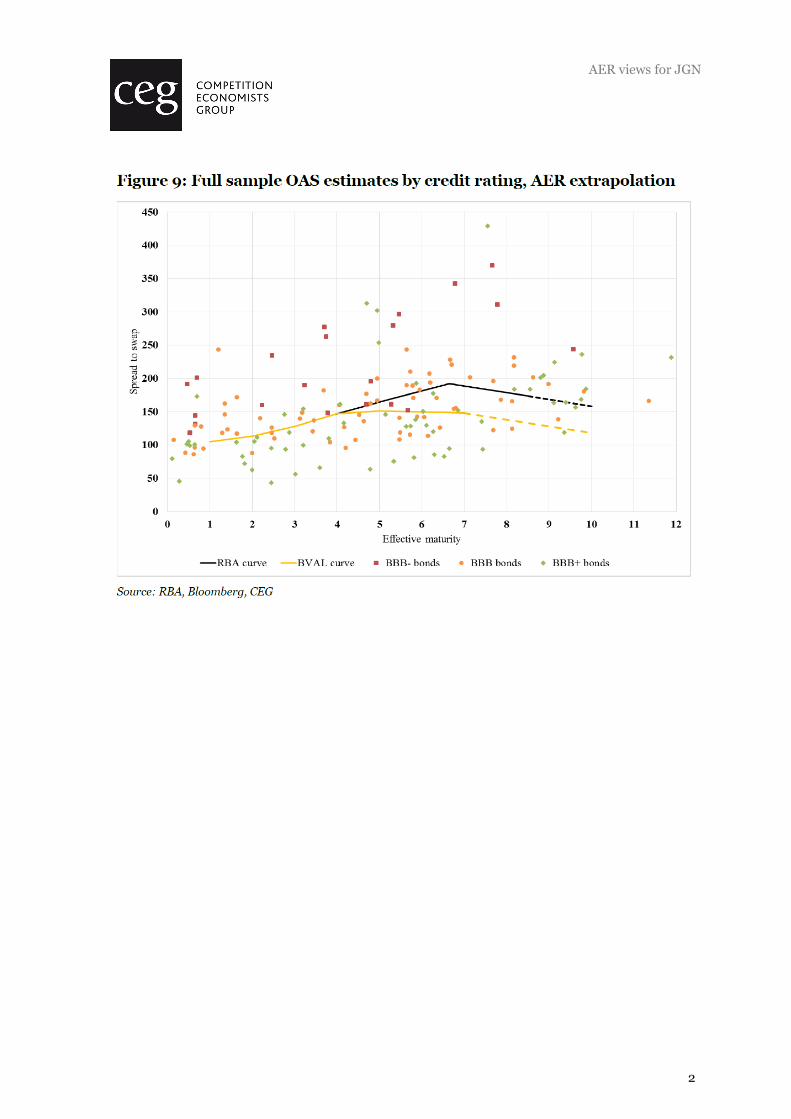
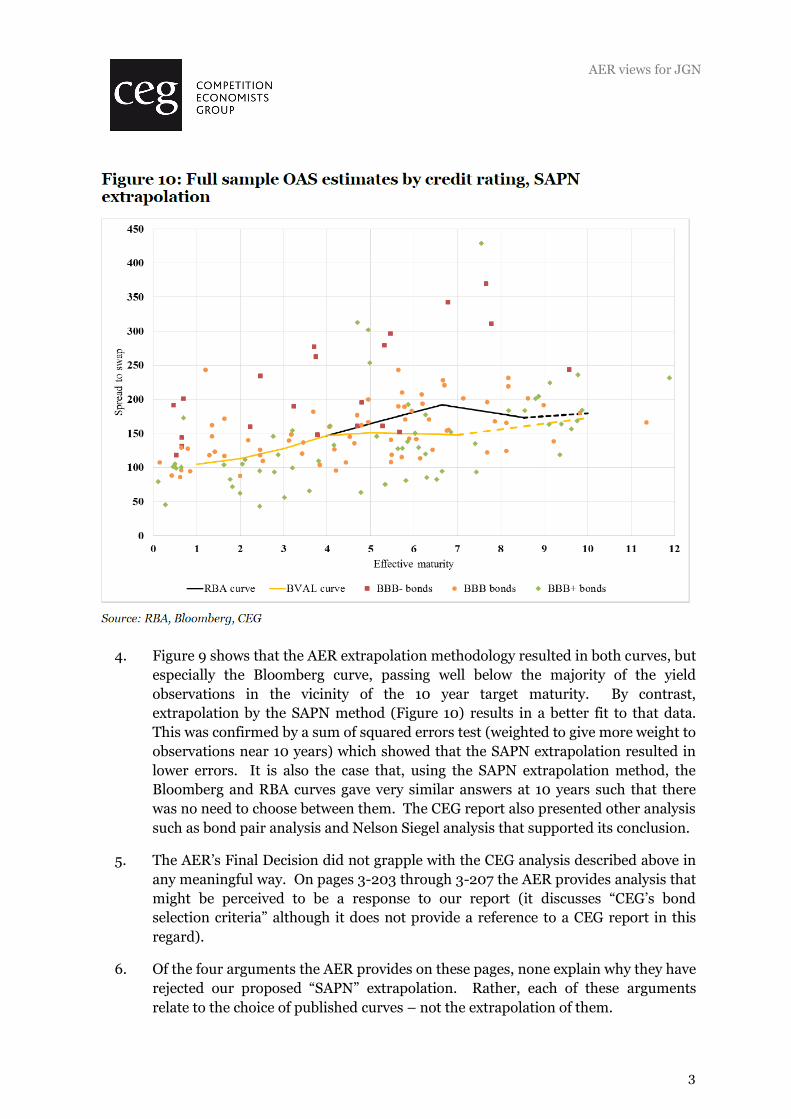
3. In large part, the basis for this conclusion can be seen by casual observation of
Figures 9 and 10 from that report (reproduced below).
1 AER, Final Decision Jemena Gas Networks (NSW) Ltd Access Arrangement 2015–2000.
2 CEG, Critique of the AER’s JGN draft decision on the cost of debt, March 2015. A substantively similar
report was submitted by JEN and other Victorian electricity distributors in April to the AER.
3 Ibid, section 5 and Appendix B.
AER views for JGN
2
AER views for JGN
3
4. Figure 9 shows that the AER extrapolation methodology resulted in both curves, but
especially the Bloomberg curve, passing well below the majority of the yield
observations in the vicinity of the 10 year target maturity. By contrast,
extrapolation by the SAPN method (Figure 10) results in a better fit to that data.
This was confirmed by a sum of squared errors test (weighted to give more weight to
observations near 10 years) which showed that the SAPN extrapolation resulted in
lower errors. It is also the case that, using the SAPN extrapolation method, the
Bloomberg and RBA curves gave very similar answers at 10 years such that there
was no need to choose between them. The CEG report also presented other analysis
such as bond pair analysis and Nelson Siegel analysis that supported its conclusion.
5. The AER’s Final Decision did not grapple with the CEG analysis described above in
any meaningful way. On pages 3-203 through 3-207 the AER provides analysis that
might be perceived to be a response to our report (it discusses “CEG’s bond
selection criteria” although it does not provide a reference to a CEG report in this
regard).
6. Of the four arguments the AER provides on these pages, none explain why they have
rejected our proposed “SAPN” extrapolation. Rather, each of these arguments
relate to the choice of published curves – not the extrapolation of them.
AER views for JGN
4
7. In the “first”,4 “second” 5 and “third” 6 arguments, the AER argues against the use of
“CEG’s bond selection criteria” to choose between Bloomberg and RBA curves.
They essentially amount to a single argument that the AER sees no merit in
attempting to make judgements on the analytical methods of Bloomberg and RBA
and, therefore, the AER considers a simple average of both is appropriate in all
circumstances. The merits of this general position are discussed later in this memo.
However, in the context of our report for JGN these arguments are irrelevant. We
adopted a simple average of the Bloomberg and RBA curves. The testing procedure
was used to choose between the AER’s preferred extrapolation technique and an
alternative.
8. The AER’s “fourth” argument7 is that JGN’s proposed methodology cannot be
formulaically applied. Even if this position was accepted, which we do not consider
is correct, our understanding of the Rules is that its reasoning applies only to
prospective averaging periods – which are the only periods where the Rules requires
a formulaic approach to be applied. Our analysis was of the initial averaging period
prior to the commencement of the regulatory period.
9. The AER’s “further” argument is as follows:8
Further, JGN's test requires the assembly of a sample of data based on
criteria that allow bonds with different features (ie fixed/floating, any
coupon type etc), then the application of econometric tests based on this
data. Our experience is that this sort of analysis is subjective and
contentious. In support of this observation, APIA has warned about
uncritically accepting the results of such tests. 685 We are therefore not
persuaded that it can be repeatedly applied without debate or disagreement.
This is problematic because there is no scope for wide consultation or
analysis within the annual debt update process
10. We do not consider that this is a reasonable argument. Both the AER and JGN
methods are set out in advance and must be applied in the future in a period for
which both RBA and Bloomberg yields are yet to be published and in market
conditions that are not yet known. It is correct that the JGN method is more
involved. However, this does not make it more contentious. In our view, in future
averaging period the JGN method will be much more robust to unusual movements
in, and departures between, the RBA and Bloomberg curves. It is more likely to
4 AER, Final Decision Jemena Gas Networks (NSW) Ltd Access Arrangement 2015–2000, p. 3-204.
5 AER, Final Decision Jemena Gas Networks (NSW) Ltd Access Arrangement 2015–2000, p. 3-204.
6 AER, Final Decision Jemena Gas Networks (NSW) Ltd Access Arrangement 2015–2000, p. 3-205.
7 AER, Final Decision Jemena Gas Networks (NSW) Ltd Access Arrangement 2015–2000, p. 3-206.
8 AER, Final Decision Jemena Gas Networks (NSW) Ltd Access Arrangement 2015–2000, p. 3-207.
AER views in the context of Bloomberg publishing a 10 year
estimate
5
select the more accurate curve and is therefore more likely to be consistent with
Rule 87 than the AER’s approach. The AER’s method will just give both equal
weight – it is this that we would expect to be the most contentious approach and the
most unlikely to be “repeatedly applied without debate or disagreement”.
11. In the last paragraph on page 3-213 the AER Rejects the SAPN form of extrapolation
for reasons explained in its SAPN preliminary decision. However, these reasons
(repeated below) do not constitute a rebuttal of the specific evidence we presented
for why the SAPN method is superior in the actual averaging period.
“the service providers have not demonstrated a basis for giving higher
weight to points on a yield curve that are further away from the term
being estimated;
we are not persuaded that it is reasonable to assume a linear relationship
between all published curve points when extrapolating. This is
inconsistent with the published data by either the RBA or BVAL, which
rarely demonstrates such a linear relationship;
regarding QTC's submission about the volatility of its estimate, we are not
persuaded that a moderately less volatile estimate is necessarily more
reliable”
12. In summary, the AER reaches its conclusion on page 3-214 that they are satisfied
with their extrapolation method without ever discussing our detailed analysis to the
contrary.
3 AER views in the context of Bloomberg publishing a 10
year estimate
13. On April 2014 Bloomberg began reporting its BBB BVAL curve out beyond 7 years.
Specifically, it began reporting the curve out to 30 years. This is despite the fact
that, at the time, the two longest maturity bonds that met the BVAL criteria for
inclusion in its curve construction (recalling that BVAL relies only on AUD issued
bonds) were 6.69 and 6.910 years.
14. When queried by CEG on how Bloomberg could construct a BBB yield curve out
beyond the available BBB bond data Bloomberg responded as follows:11
9 A bond issued by AGL maturing on 5 November 2021.
10 A bond issued by Downer EDI maturing on 11 March 2022.
11 Bloomberg correspondence with CEG dated 14 May 2015.
AER views in the context of Bloomberg publishing a 10 year
estimate
6
On April 14, 2015, BVAL curve methodology has introduced enhancements to
curve construction to enable curve derivation for tenors three months to 30
years. Curve derivation is now using the respective government benchmark
as the underlying reference curve to enable curve construction over the full
maturity spectrum, in the absence of data constituents. That's the reason
why you noticed AUD Corporated BBB BVAL curve has suddenly been
extended from 7 to 30 years starting from April 14, 2015.
15. This is consistent with Bloomberg’s BVAL curve methodology document which
states:12
BVAL utilizes an extensive library of reference curves to help construct term
structure shape through to 30-year point for sparsely populated curves
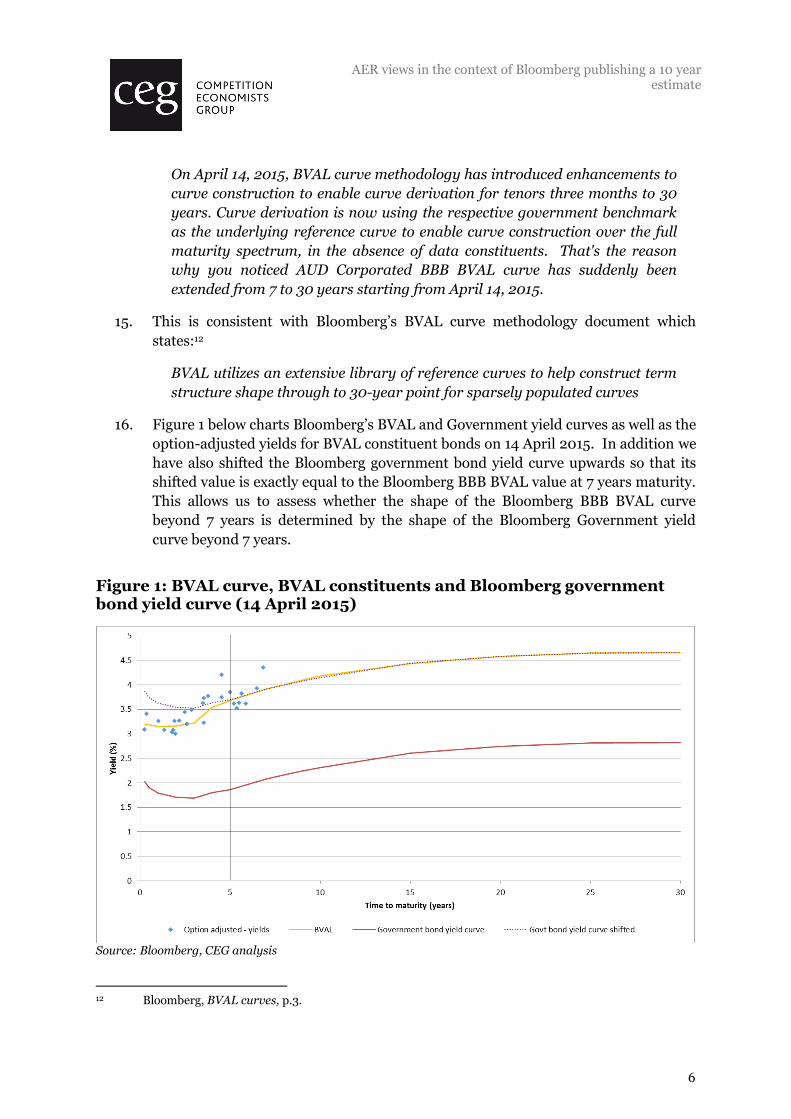
16. Figure 1 below charts Bloomberg’s BVAL and Government yield curves as well as the
option-adjusted yields for BVAL constituent bonds on 14 April 2015. In addition we
have also shifted the Bloomberg government bond yield curve upwards so that its
shifted value is exactly equal to the Bloomberg BBB BVAL value at 7 years maturity.
This allows us to assess whether the shape of the Bloomberg BBB BVAL curve
beyond 7 years is determined by the shape of the Bloomberg Government yield
curve beyond 7 years.
Figure 1: BVAL curve, BVAL constituents and Bloomberg government bond yield curve (14 April 2015)
Source: Bloomberg, CEG analysis
12 Bloomberg, BVAL curves, p.3.
AER views in the context of Bloomberg publishing a 10 year
estimate
7
17. It is clear that Bloomberg has used the shape of the Government yield curve to
extrapolate to 3o years. It is also clear from this figure that, beyond around 5 years,
the Bloomberg BBB BVAL curve has essentially the same shape as the Bloomberg
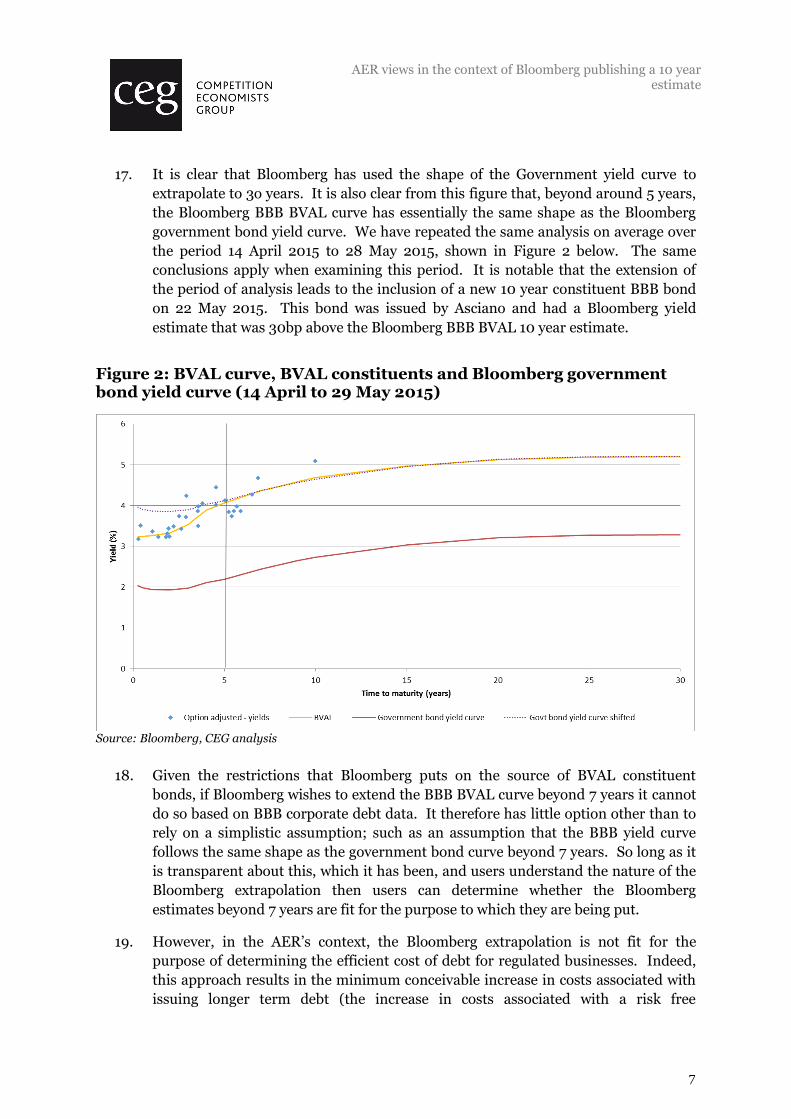
government bond yield curve. We have repeated the same analysis on average over
the period 14 April 2015 to 28 May 2015, shown in Figure 2 below. The same
conclusions apply when examining this period. It is notable that the extension of
the period of analysis leads to the inclusion of a new 10 year constituent BBB bond
on 22 May 2015. This bond was issued by Asciano and had a Bloomberg yield
estimate that was 30bp above the Bloomberg BBB BVAL 10 year estimate.
Figure 2: BVAL curve, BVAL constituents and Bloomberg government bond yield curve (14 April to 29 May 2015)
Source: Bloomberg, CEG analysis
18. Given the restrictions that Bloomberg puts on the source of BVAL constituent
bonds, if Bloomberg wishes to extend the BBB BVAL curve beyond 7 years it cannot
do so based on BBB corporate debt data. It therefore has little option other than to
rely on a simplistic assumption; such as an assumption that the BBB yield curve
follows the same shape as the government bond curve beyond 7 years. So long as it
is transparent about this, which it has been, and users understand the nature of the
Bloomberg extrapolation then users can determine whether the Bloomberg
estimates beyond 7 years are fit for the purpose to which they are being put.
19. However, in the AER’s context, the Bloomberg extrapolation is not fit for the
purpose of determining the efficient cost of debt for regulated businesses. Indeed,
this approach results in the minimum conceivable increase in costs associated with
issuing longer term debt (the increase in costs associated with a risk free
AER views in the context of Bloomberg publishing a 10 year
estimate
8
government issuing longer term debt). In our view this is a biased estimate and the
cost of debt for a BBB issuer would increase by more than this as they increased the
maturity of their debt issue.
20. In addition, the assumption that BBB bond yields follow the same pattern as
government bonds is inconsistent with the evidence from the sample of long term
bonds. Below we show that this is true not just for the Asciano bond mentioned
above but also for the larger number of bonds that are examined, applying the same
approach as in our report for JGN, for the period 14 April 2014 to 29 May 2015.
3.1 Sum of squared errors (SSE) testing of the curves
21. In this section we test the goodness of fit of different measures of the spread to swap
at 10 years to maturity using the method set out in JGN’s return on debt proposal13
applied to the period 14 April 2014 to 29 May 2015 in order to assess the accuracy of
the Bloomberg BVAL curve in the period that Bloomberg publishes yields to 10
years.
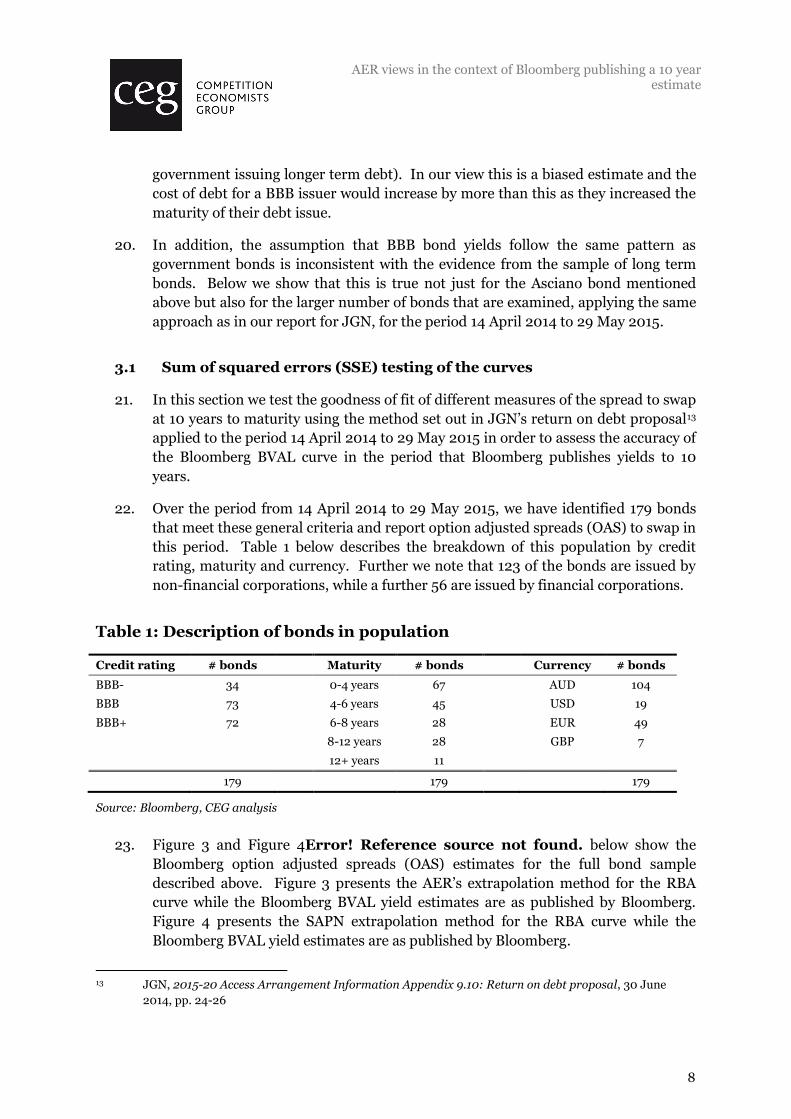
22. Over the period from 14 April 2014 to 29 May 2015, we have identified 179 bonds
that meet these general criteria and report option adjusted spreads (OAS) to swap in
this period. Table 1 below describes the breakdown of this population by credit
rating, maturity and currency. Further we note that 123 of the bonds are issued by
non-financial corporations, while a further 56 are issued by financial corporations.
Table 1: Description of bonds in population
Credit rating # bonds Maturity # bonds Currency # bonds
BBB- 34 0-4 years 67 AUD 104
BBB 73 4-6 years 45 USD 19
BBB+ 72 6-8 years 28 EUR 49
8-12 years 28 GBP 7
12+ years 11
179 179 179
Source: Bloomberg, CEG analysis
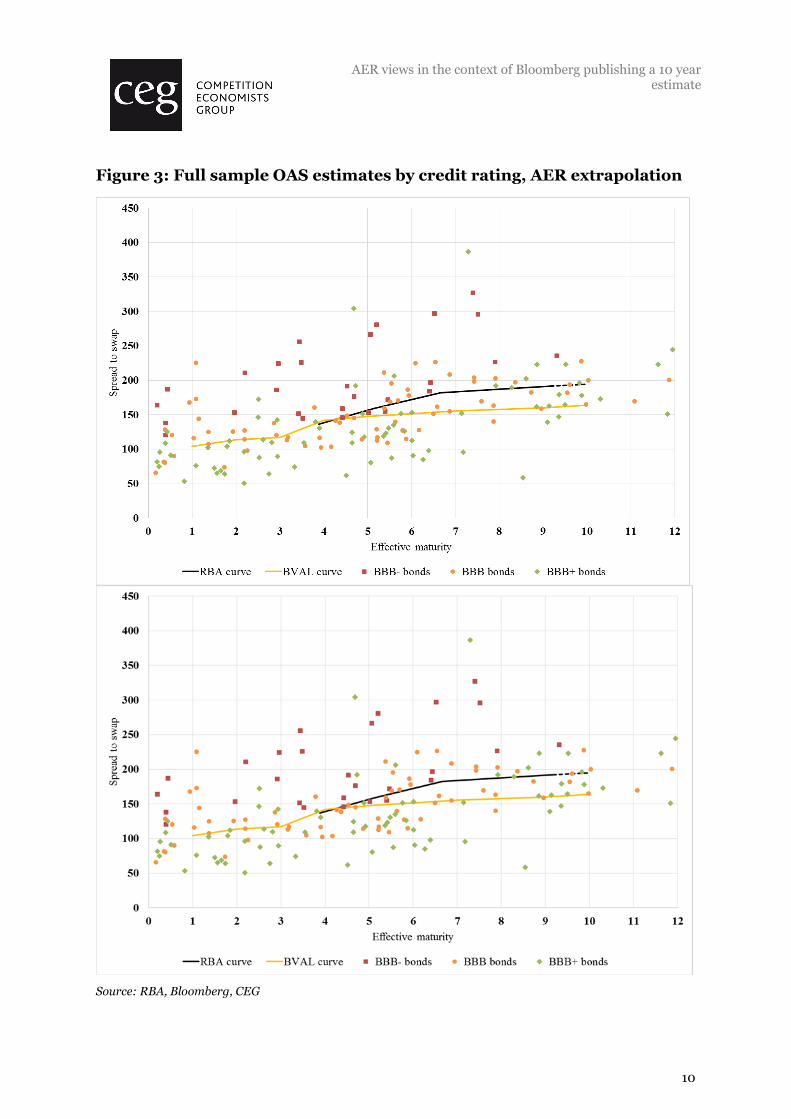
23. Figure 3 and Figure 4Error! Reference source not found. below show the
Bloomberg option adjusted spreads (OAS) estimates for the full bond sample
described above. Figure 3 presents the AER’s extrapolation method for the RBA
curve while the Bloomberg BVAL yield estimates are as published by Bloomberg.
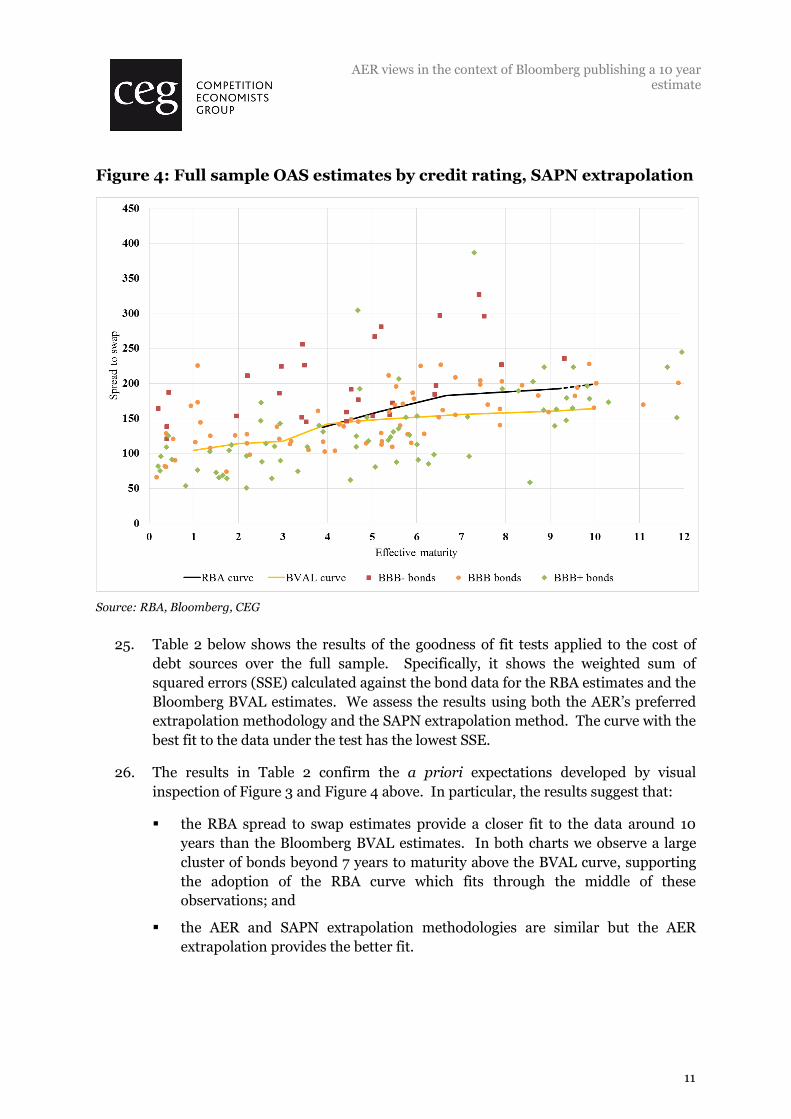
Figure 4 presents the SAPN extrapolation method for the RBA curve while the
Bloomberg BVAL yield estimates are as published by Bloomberg.
13 JGN, 2015-20 Access Arrangement Information Appendix 9.10: Return on debt proposal, 30 June
2014, pp. 24-26

AER views in the context of Bloomberg publishing a 10 year
estimate
9
24. From a visual perspective the SAPN and the AER extrapolation methodology
applied to the RBA curve are very similar over this period and can be regarded as
more or less the same. However, the Bloomberg BBB BVAL curve is very flat
beyond 4 years and fits under the majority of the long term bonds. The RBA curve
fits roughly through the middle of the long term bond data and this is true with both
extrapolation methods applied.
AER views in the context of Bloomberg publishing a 10 year
estimate
10
Figure 3: Full sample OAS estimates by credit rating, AER extrapolation
Source: RBA, Bloomberg, CEG
AER views in the context of Bloomberg publishing a 10 year
estimate
11
Figure 4: Full sample OAS estimates by credit rating, SAPN extrapolation
Source: RBA, Bloomberg, CEG
25. Table 2 below shows the results of the goodness of fit tests applied to the cost of
debt sources over the full sample. Specifically, it shows the weighted sum of
squared errors (SSE) calculated against the bond data for the RBA estimates and the
Bloomberg BVAL estimates. We assess the results using both the AER’s preferred
extrapolation methodology and the SAPN extrapolation method. The curve with the
best fit to the data under the test has the lowest SSE.
26. The results in Table 2 confirm the a priori expectations developed by visual
inspection of Figure 3 and Figure 4 above. In particular, the results suggest that:
the RBA spread to swap estimates provide a closer fit to the data around 10
years than the Bloomberg BVAL estimates. In both charts we observe a large
cluster of bonds beyond 7 years to maturity above the BVAL curve, supporting
the adoption of the RBA curve which fits through the middle of these
observations; and
the AER and SAPN extrapolation methodologies are similar but the AER
extrapolation provides the better fit.

AER views in the context of Bloomberg publishing a 10 year
estimate
12
Table 2: Goodness of fit tests applied to full sample, weighted SSE
AER extrapolation SAPN extrapolation
RBA estimates 1,818 1,881
Bloomberg BVAL estimates 2,367
Source: CEG
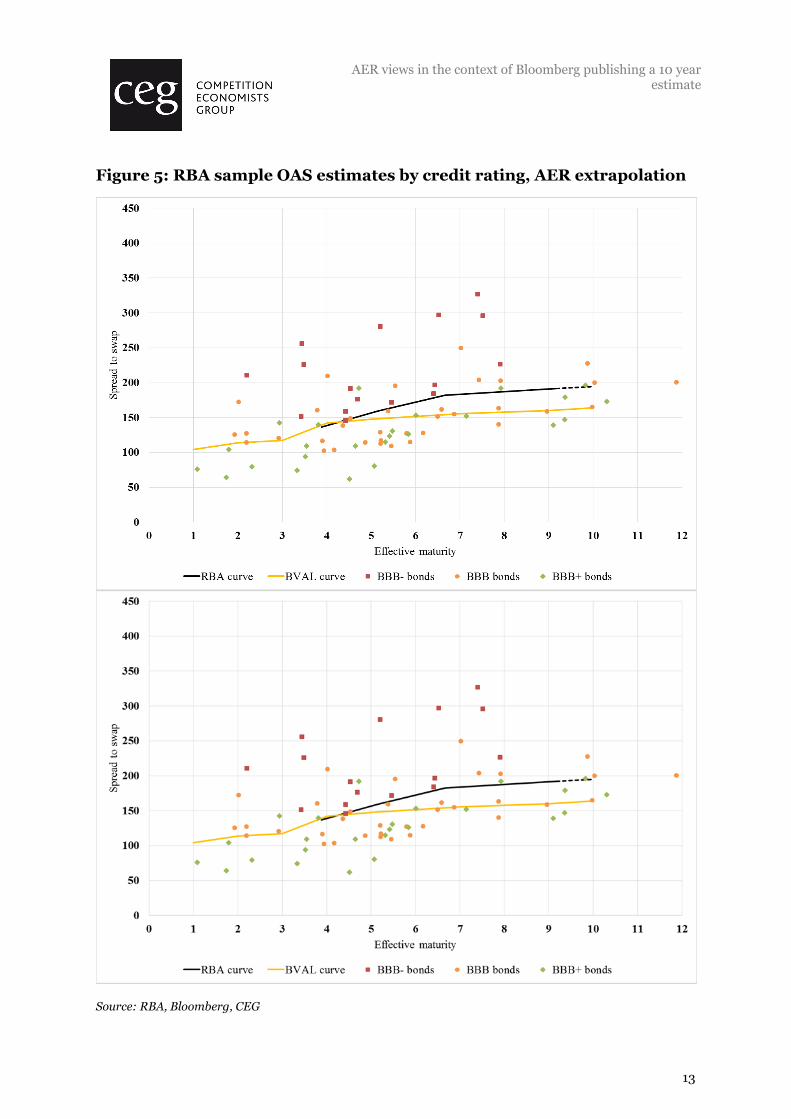
27. Figure 5 below shows the RBA curve and Bloomberg curve (extrapolated using the
AER methodology)14 against the sample of bonds that we obtain by replicating the
RBA’s selection criteria. That is, bonds that:
are issued by businesses that are domiciled in Australia;
are issued in Australian dollars, United States dollars or Euros;
are not issued by businesses in the financial or government sectors;
have a minimum maturity of one year;
have an issue amount of more than A$100 million or the same in foreign
currency equivalent; and
are rated BBB-, BBB or BBB+ with Standard & Poor’s, or the issuer’s credit
rating is in this range if the bond does not have a rating.
14 The AER methodology was found to be the best fit using the wider sample of bonds.
AER views in the context of Bloomberg publishing a 10 year
estimate
13
Figure 5: RBA sample OAS estimates by credit rating, AER extrapolation
Source: RBA, Bloomberg, CEG
AER JGN final decision logic applied to Bloomberg 10 year estimate
14
28. Although the sample of bonds is smaller, the same pattern exists as with the wider
sample. Based on visual inspection, the RBA curve is better fit to the data. This is,
in a sense, to be expected given it is an RBA dataset against which the curves are
being compared.
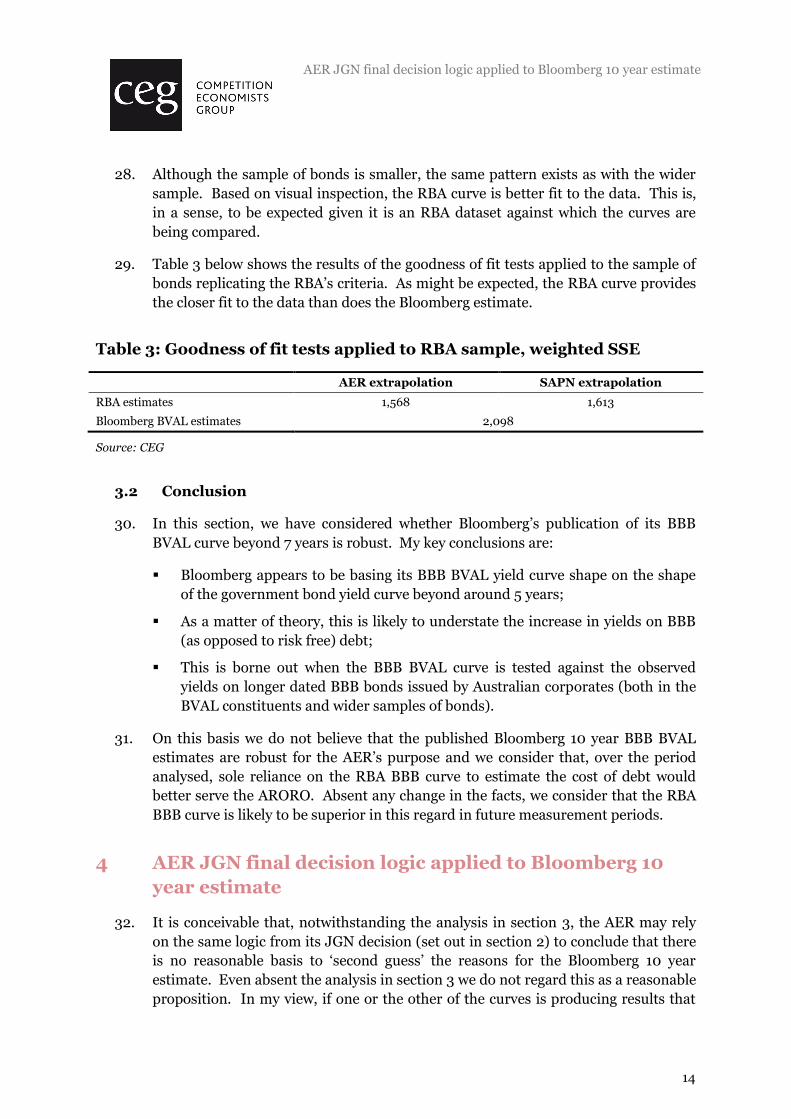
29. Table 3 below shows the results of the goodness of fit tests applied to the sample of
bonds replicating the RBA’s criteria. As might be expected, the RBA curve provides
the closer fit to the data than does the Bloomberg estimate.
Table 3: Goodness of fit tests applied to RBA sample, weighted SSE
AER extrapolation SAPN extrapolation
RBA estimates 1,568 1,613
Bloomberg BVAL estimates 2,098
Source: CEG
3.2 Conclusion
30. In this section, we have considered whether Bloomberg’s publication of its BBB
BVAL curve beyond 7 years is robust. My key conclusions are:
Bloomberg appears to be basing its BBB BVAL yield curve shape on the shape
of the government bond yield curve beyond around 5 years;
As a matter of theory, this is likely to understate the increase in yields on BBB
(as opposed to risk free) debt;
This is borne out when the BBB BVAL curve is tested against the observed
yields on longer dated BBB bonds issued by Australian corporates (both in the
BVAL constituents and wider samples of bonds).
31. On this basis we do not believe that the published Bloomberg 10 year BBB BVAL
estimates are robust for the AER’s purpose and we consider that, over the period
analysed, sole reliance on the RBA BBB curve to estimate the cost of debt would
better serve the ARORO. Absent any change in the facts, we consider that the RBA
BBB curve is likely to be superior in this regard in future measurement periods.
4 AER JGN final decision logic applied to Bloomberg 10
year estimate
32. It is conceivable that, notwithstanding the analysis in section 3, the AER may rely
on the same logic from its JGN decision (set out in section 2) to conclude that there
is no reasonable basis to ‘second guess’ the reasons for the Bloomberg 10 year
estimate. Even absent the analysis in section 3 we do not regard this as a reasonable
proposition. In my view, if one or the other of the curves is producing results that
AER JGN final decision logic applied to Bloomberg 10 year estimate
15
are demonstrably inconsistent with the available market data then that curve should
not be used (or, at a minimum) should be given less weight.
33. However, in my view the analysis in section 3 provides a clear reason for not giving
weight to the Bloomberg 10 year estimate. Namely, Bloomberg has disclosed that,
in the absence of sufficient AUD corporate BBB bonds in excess of 7 years, it
extends its curve out to 10 years (and, indeed, beyond 10 years to 30 years) using
the shape of the Government bond curve. That this is its practice has been
supported by empirical analysis in section 3.
34. This extrapolation procedure was open to the AER to adopt in both the Guideline
process and in the JGN (and other) Final Decisions. The AER, correctly, chose not
to adopt this approach. The fact that Bloomberg has chosen this extrapolation
technique in the absence of sufficient AUD BBB rated bonds with maturity above 7
years should not mean that the AER unquestioningly adopts it. Rather, the AER
should adopt the type of analysis performed in section 3.
35. If it did so it should conclude, at least for the period we have examined, that the
RBA curve is a better estimate.