Embed Size (px)
Citation preview

The world leader in serving science
Shanhua Lin, Ph.D. R&D Manager Bioseparation, Chromatography Consumables
mAb and ADC Analysis
2
Structure of IgG and Typical Forms of Heterogeneity

3
Protein and mAb Separation by HPLC
Ion Exchange Chromatography (IEX)
Size Exclusion Chromatography (SEC)
Reverse Phase Chromatography (RPC)
Size difference?
Charge difference?
Hydrophobicity difference? Hydrophobic Interaction Chromatography (HIC)
Thermo Scientific™ MAbPac™ SEC-1
MAbPac HIC-10 MAbPac HIC-20 MAbPac HIC-Butyl ProPac HIC-10
YES
YES
YES
YES
MAbPac RP
MAbPac SCX-10 CX-1 pH Gradient Buffer Thermo Scientific™ ProPac ™ WCX-10

4
IEC Analysis for Charge Variant
• ProPac WCX-10 and MAbPac SCX-10 columns
• Separate acidic and basic variants
• CX-1 pH Gradient Buffer Kit provides a platform solution

5
Charge Variant Analysis
10 µm Nonporous Polymeric Beads
Polymeric grafts WCX, SCX, WAX, SAX
Boundary (Cross-linked hydrophilic layer) Core (Highly cross-linked EVB-DVB)
Untreated mAb
Lysine Variants
Acidic Variants Basic Variants
Y Y K K
Y Y K
Y Y
Y Y
Acidic Variants Basic Variants
Carboxypeptidase B digested mAb
ProPac WCX-10 Column

6
Next-generation CEX Column
Lysine Variants
Y Y K K
Y Y K
Y Y
Acidic Variants
Basic Variants
ProPac WCX-10 column, 4×250 mm
MAbPac SCX-10 column, 4×250 mm 60 min. total analysis time
Acidic Variants
Basic Variants
Y Y K K
Y Y K
Y Y
Lysine Variants
Improve resolution or sample throughput through column chemistry
0 10
0
22
MAbPac SCX-10 column, 4×150 mm 15 min. total analysis time
5 15 Minutes
mA
U
MAbPac SCX-10 Column

7
Thermo Scientific CX-1 pH Gradient Buffers
• Dilute buffers 10-fold with DI water • A linear pH gradient (pH 5.6 - 10.2)
is generated by running a linear pump gradient from 100% Buffer A to 100% Buffer B
• It is platform, fast, and high-res!
Buffer A Buffer B
pH 5.6 10.2
Form Liquid Liquid
Concentrate 10X 10X
Shipping condition
Room Temp
Room Temp
Storage condition
4 ~ 8 °C 4 ~ 8 °C
US 8921113 B2: Buffer kit and method of generating a linear pH gradient

8
pH Gradient Buffers – How Do They Work?
+
0
–
5 6 7 8 9 10 11 12
Buffer/System pH
Protein net charge vs. pH
Buffer pH typically > pI
Anion-Exchange Chromatography
Buffer pH typically < pI
Cation-Exchange Chromatography
NH2R
COO -
NH3R +
COOH
Isoelectric Point (pI)
NH3R +
COO -
4
Cationic protein binds to
negatively charged cation exchanger
+ ++
++
+ ++
Anionic proteinbinds to
positively chargedanion exchanger
- -- -
-
- - -
Protein Elution Mechanisms on IEX
pH range covered by CX-1 pH gradient buffers

9
Linear pH Gradient by Zwitterionic Buffer Cocktail
y = 0.1577x + 4.9755R² = 0.9996
5.5
6.5
7.5
8.5
9.5
10.5
0 10 20 30 40
Mea
sure
d pH
val
ue
Retention Time [min]
Measured ValueLinear (Measured Value)

10
Protein Standard – CX-1 pH Gradient Buffer
pH trace
0 5 10 15 20 25 30 35 40 -10
20
40
60
90
5
6
7
8
9
10
11
Lectin-1 - 6.11
Lectin-2 - 6.28
Lectin-3 - 6.45 Trypsinogen - 7.75 Ribonuclease A - 8.72
Cytochrome C - 10.15
MAbPac SCX-10 Column, 4 × 250 mm
0
Peak label: protein name – elution pH

11
Protein Standard – Phosphate-based pH Gradient
pH trace
0 5 10 15 20 25 30 35 40 -10
0
10
20
30.
40
50
60
70
5.5
6.0
6.5
7.0
7.5
8.0
8.5
9.0
9.5
10.0 pH
1 2
MAbPac SCX-10 Column, 4 × 250 mm

12
Why pH Gradient Buffers?
• Traditional salt gradient using ion exchange chromatography
• Needs to be tailored for individual charge variants
• Patented pH buffer formulations
• Fast, robust and reproducible pH gradients
• Ready to use with existing CEX columns and systems
• Simple to optimize and easily automated
• Applicable to the majority of mAbs
0.0 5.0 10.0 15.0 20.0 25.0 30.0
0.0
5.0
10.0
15.0
min
%B: 10.0
30.0
Salt gradient
0.0 5.0 10.0 15.0 20.0 25.0 30.0
0.0
5.0
10.0
15.0
min
%B: 25.0
50.0
25.0
pH gradient

13
Benefit of Linear pH Gradient: Platform Approach
• A platform approach for charge variant analysis, covering the pH range 5.6 to 10.2
• The same pH gradients is applicable to majority of mAb charge variants with pI value between 6-10
• pI value of the unknown mAb can be predicted from the correlation curve

14
0.0 5.0 10.0 15.0 20.0 25.0 30.0 35.0 40.0 -20
0
20
40
60
80
100
120
140
160
180
200
5.00
5.50
6.00
6.50
7.00
7.50
8.00
8.50
9.00
9.50
10.00
10.50
pH trace
Abso
rban
ce (
mAU
)
Retention Time (min)
mAb Standards Using Linear pH Gradient

15
Top-selling mAbs Analyzed by pH Gradient Method
15.0 18.0 20.0 22.0 24.0 26.0 28.0 30.0 32.0 35.0-10.0
0.0
12.5
25.0
37.5
50.0
70.0
Retention Time (min)
Rituxan
1
2
3
15.0 18.0 20.0 22.0 24.0 26.0 28.0 30.0 32.0 35.0
-10.0
0.0
12.5
25.0
37.5
50.0
70.0
Retention Time (min)
Herceptin
15.0 18.0 20.0 22.0 24.0 26.0 28.0 30.0 32.0 35.0
-2.0
5.0
10.0
15.0
18.0
Retention Time (min)
Humira
15.0 18.0 20.0 22.0 24.0 26.0 28.0 30.0 32.0 35.0
-2.0
5.0
10.0
15.0
20.0
Retention Time (min)
Avastin
Platform method for mAb charge variant analysis

16
Benefit of Linear pH Gradient: Simple Optimization
• The method can be simply optimized • By running a shallower pH gradient a higher resolution separation is obtained
(e.g. 50-100%, rather than 0-100%B)

17
0 5 10 15 20 25 30 35 40 -5.0
10.0
20.0
30.0
40.0
5.00
6.00
7.00
8.00
9.00
10.50
Abso
rban
ce [
mAU
]
Retention Time [min]
pH trace (a)
100% B 0% B
*The pH trace at elution was obtained with the Thermo Scientific™ Dionex™ UltiMate™ 3000 pH and Conductivity Monitoring Module (PCM-3000)
mAb Charge Variant Separation, 0–100% B

18
0 5 10 15 20 25 30 35 40 -5.0
0.0
10.0
20.0
25.0
5.00
6.00
7.00
8.50
Abso
rban
ce [
mAU
]
Retention Time [min]
(b)
mAb Charge Variant Separation, 0–50% B
pH trace
0% B 50% B

19
mAb Charge Variant Separation, 25–50% B
0 5 10 15 20 25 30 35 40 -2.0
5.0
10.0
16.0
6.60
7.00
7.25
7.50
7.75
8.00
Abso
rban
ce [
mAU
]
Retention Time [min]
(c) pH trace
25% B 50% B

20
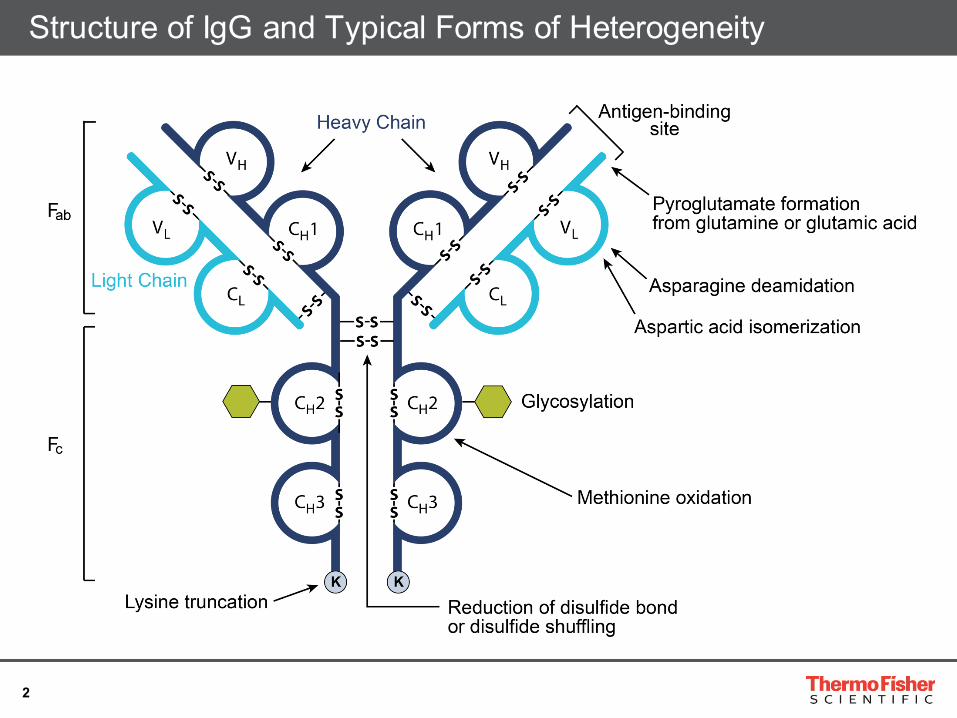
Ultra Fast Method Development
21
0.0 2.5 5.0 7.5 10.0 12.5 15.0 17.5 20.0 -100
-75
-50
-25
0
25
60
5.00
6.00
7.00
8.00
9.00
10.50
Run #300
Run #200
Run #100
Run #5
pH trace
Abso
rban
ce [
mAU
]
Retention Time [min]
Repeat Injections of Ribonuclease A: Over 300 Runs
Retention time reproducibility <0.8% RSD

22
CX-1 pH Gradient Buffer Kit (10X): Lot to Lot Consistency
0.0 5.0 10.0 15.0 20.0 25.0 30.0 35.0 40.0 -10
20
40
60
80
110
Abso
rban
ce (m
AU)
Retention Time (min)
Lot 1 (130523 / 130528) Lot 2 (130524 / 130529) Lot 3 (130531 / 130530)

23
RP LC/MS Analysis for Intact, mAb Fragments, and ADCs
• MAbPac RP column
• Separate mAb, mAb fragments (LC, HC, Fc, Fab, scFc, and F(ab’)2) and ADC DAR forms
• Often coupled with MS instrument for high resolution accurate mass determination

24
What is it?
MAbPac RP columns
Column Chemistry
Phenyl
Substrate Spherical, polymer, wide-pore (1,500 Å)
Particle size
4 µm
Pore size 1,500 Å Formats 100 mm: 3.0 + 2.1mm ID
50 mm: 3.0 + 2.1mm ID 10mm Guard Cartridges: 3.0 + 2.1mm ID

25
SiteClick™ Enzyme-based N-glycan Labeling of Antibody
Azide-Activated Antibody
Antibody •Polyclonal •Monoclonal •Recombinant
Site-Specifically Labeled Antibody
Gal-T(Y289L) UDP-GalNAz β-galactosidase
sDIBO-Val-Cit-pAB-MMAE
N3
N3
N3
N3
O
O
HN
S OOO
O
NH
O
O
O
O
OHN
O
HN
NH
NH2O
NH
O NHN
NO O
NHN
O
OO
O
O
O
O
(CH3CH2)3NH
NN
N
N3 N3
N3
26
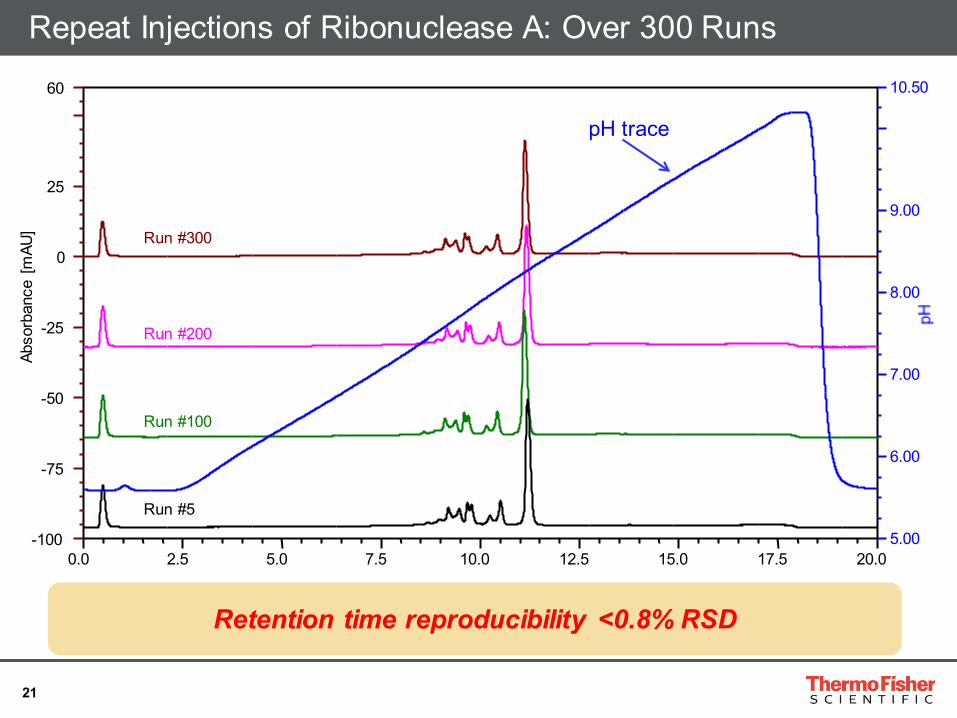
Site-selective Antibody-drug Conjugates (ADCs) DAR Forms
DAR 1
DAR 2
DAR 3
DAR 4

27
LC/UV Analysis of ADC
Column: MAbPac RP, 4 µm Format: 2.1 × 50 mm Mobile phase A: H2O/TFA (99.9 : 0.1 v/v) Mobile phase B: MeCN/ H2O/TFA (90: 9.9 :0.1 v/v/v) Gradient: Time (min) %A %B 0.0 65 35 0.5 65 35 4.5 45 55 5.0 45 55 5.5 65 35 6.0 65 35 Flow rate: 0.6 mL/min Temperature: 80 ºC Inj. volume: 2 µL Detection: UV (280 nm) Sample: a. Trastuzumab b. Trastuzumab-MMAE
-2.0
5.0
12.0
0.50 1.00 2.00 3.00 4.00 4.50 -5.0
10.0
25.0
(a)
(b)
Retention Time (min)

28
LC/MS Analysis of ADC
2950 3000 3050 3100 3150 3200 3250
m/z
0
50
100 0
50
100 0
50
100 0
50
100
Rel
ativ
e Ab
unda
nce
0
50
100 0
50
100 3242.41 3172.00 3104.48 3039.85 2977.80
3175.55 3107.78 2981.16 3043.27
3209.69 3141.27 2953.08 3075.87 3098.20
3013.12 3033.70 3235.89 3165.45
3127.68 3194.17
3002.59 3064.18 3105.03 3170.88 3239.77 3041.58 2977.71
3118.75
3197.87 3131.09
3182.06
3006.21 3069.68 3232.09 3156.83 3021.45
3105.18 2983.64 3169.86 3237.45 3043.16
3027.89
3108.56
2968.60 3090.80 3179.52 3154.48 3221.20 2992.43 3062.25 3122.04 3195.93
3237.30 3169.93 3043.17 2983.59 3105.26
3147.21 3214.04 3021.41 3082.89
3240.81 3173.29
2962.08 2986.74
3139.68
3046.60 3163.88
3115.21 3190.26
3232.52
3067.48
3100.44 2977.99
3146.61 3023.28 3212.12 3083.76 2965.15
3196.41 3131.01
3150.02 3087.05
3008.33 3068.62
3215.53 3026.44
3248.18 2973.83 3042.22 3115.73 3166.15
3224.81
3124.25 3187.95 3063.00 3004.06
3238.48 3172.49 3109.06 2989.49 3191.33
3047.96
3127.33
3222.69 3033.15 3093.96 2975.07 3156.91 3009.77 3069.21
(a) Peak 1, DAR 0
(b) Peak 2, DAR 1
(e) Peak 5, DAR 3
(d) Peak 4, DAR 2
(c) Peak 3, DAR 2
(f) Peak 6, DAR 4

29
Deconvolution of mAb and Intermediate
(a) Trastuzumab
(b) Trastuzumab-azide
4-N3
1-N3
2-N3
3-N3
G0/G0F G2F/G2F
G1F/G1F (G0F/G2F)
G0F/G1F
G0F/G0F G1F/G2F

30
Deconvolution of Multiple DAR Forms
1 x DIBO-Val-Cit-pAB-MMAE
(a) DAR 1
(b) DAR 2
1 x DIBO-Val-Cit-pAB-MMAE
(c) DAR 3
(d) DAR 4 1 x DIBO-Val-Cit-pAB-MMAE

31
SiteClick™ Enzyme-based N-glycan Labeling of Antibody
Azide-Activated mAb Unconjugated mAb ADC, DAR = 2.0
GlycINATOR UDP-GalNAz GalT(Y289L) DIBO-Toxin
N3 N3 Toxin Toxin
Poster number: P-202-TH Presenting: Thursday, January 26 from 7:30am – 8:30am. Title: High Resolution LC/MS Separation and Characterization of Chemoenzymatic Site-specific Engineered Antibody-drug Conjugates (ADCs)

32
• Chris Pohl
• Xiaodong Liu
• Julia Baek
• Yoginder Singh
• Brian Agnew
• Terry Zhang
• Jonathan Josephs
Thank you!