Embed Size (px)
Citation preview

M A B Digest 11

1. Eutrophication management framework for the policy-maker (1989). Walter Rast, Marjorie Holland and Sven-Olof Ryding.
2. Human investment and resource use: a new research orientation at the environment/economics interface (1989). Editors: Michael Young and Natarajan Ishwaran.
3. Contributing to sustained resource use in the humid and sub-humid tropics: some research approaches and insights (1989). Malcolm Hadley and Kathrin Schreckenberg.
4. The role of land/inland water ecotones in landscape management and restoration: a proposal for collaborative research (1989). Editors: Robert J. Naiman, Henri Décamps and Frédéric Fournier.
5. Management and restoration of human-impacted resources: approaches to ecosystem rehabilitation (1990). Editors: Kathrin Schreckenberg, Malcolm Hadley and Melvin I. Dyer.
6. Debt-for-nature exchanges and biosphere reserves: experiences and potential (1990). Peter Dogsé and Bernd von Droste.
7. Carbon, nutrient and water balances of tropical rainforest ecosystems subject to disturbance: management implications and research proposais (1991). Jonathan M. Anderson and Thomas Spencer.
8. Economic and ecological sustainability of tropical rainforest management (1991). Editors: Kathrin Schreckenberg and Malcolm Hadley.
9. Biodiversity: Scientific issues and collaborative research proposals (1991). Otto T. Solbrig.
10. Les systèmes agro-sylvo-pastoraux méditerranéens : Enjeux et réflexions pour une gestion raisonnée (1991). Richard Joffre, Bernard Huber et Michel Meuret.

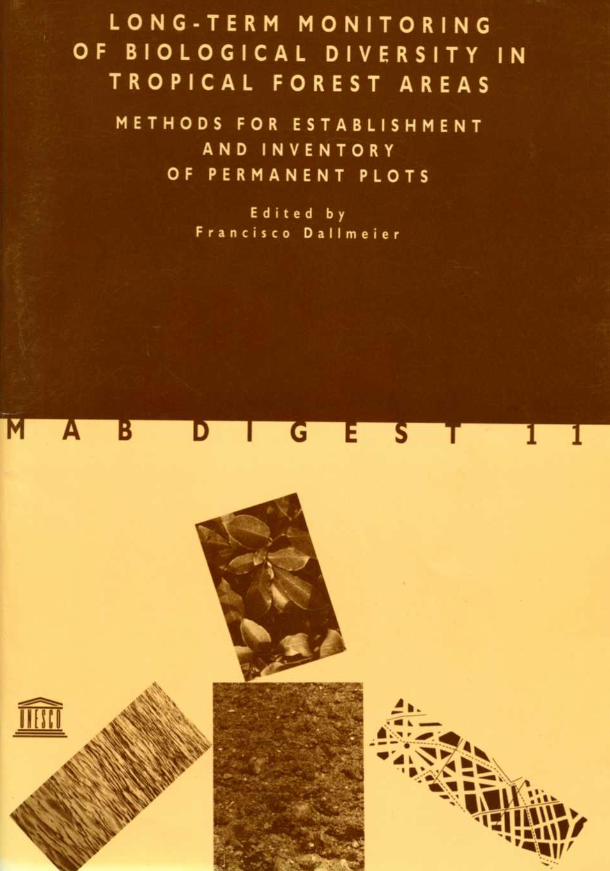
L O N G - T E R M M O N I T O R I N G O F B I O L O G I C A L D I V E R S I T Y IN T R O P I C A L F O R E S T A R E A S
Methods for establishment and inventory of permanent plots
Edited by Francisco Dallmeier

The designations employed and the presentation of material throughout this publication do not imply the expression of any opinion whatsoever on the part of U N E S C O concerning the legal status of any country, territory, city or area of its authorities, or concerning the delimitation of its frontiers or boundaries. The opinions expressed in this digest are those of the authors and not necessarily those of U N E S C O or the authors' employers.
Addresses of the editor and authors of this report:
Francisco Dallmeier S I - M A B Biological Diversity Program Smithsonian Institution, International Center 1100 Jefferson Drive, S W Washington, D . C . 20560 U . S . A .
Margo Kabel Smithsonian Institution Washington, D . C . 20560 U . S . A .
John C . M a y n e University of Florida Gainesville, Florida 32611 U . S . A .
Richard Rice The Wilderness Society 900 17th St. N W Washington, D . C . 20006 U . S . A .
Charlotte M . Taylor Missouri Botanical Garden P . O . Box 299 St Louis, Missouri 63166 U . S . A .
Overall direction: Bernd von Droste Series editor: Malcolm Hadley Computer assisted layout: Ivette Fabbri Cover design: Jean-Francis Cheriez Photographs: Francisco Dallmeier Suggested citation: Dallmeier, F. (Ed.). 1992. Long-term monitoring of biological
diversity in tropical forest areas: methods for establishment and inventory of permanent plots. M A B Digest 11. U N E S C O , Paris.
Published in 1992 by the United Nations Educational, Scientific and Cultural Organization 7, place de Fontenoy, 75700 Paris Printed by U N E S C O
© U N E S C O February 1992 Printed in France
P R E F A C E
About this series...
The M A B Digest Series was launched by U N E S C O in 1989. Several types
of publications are included: distillations of the substantive findings of M A B
activities; overviews of recent, ongoing and planned activities within M A B
in particular subject or problem areas; and proposals for new research acti
vities. The target audience varies from one digest to another. S o m e are de
signed with planners and policy-makers as the main audience in mind.
Others are aimed at collaborators in the M A B Programme. Still others have
technical personnel and research workers as the target, irrespective of
whether or not they are involved in M A B .
...and M A B Digest 11
This digest describes methods for establishing and maintaining perma
nent inventory plots in tropical forests, with emphasis on sites designated
as biosphere reserves. Underlying aims are to facilitate the documented
inventory of plant diversity and to provide long-term data on the growth,
mortality, regeneration, and dynamics of forest trees. A s such, the ap
proach and methods set out in this digest are intended to support the de
velopment of an information base for research and education that will
contribute to the conservation and management of biosphere reserves and
other protected areas throughout the world and to the monitoring of long-
term environmental change.

The digest contains two sections: a description of the methods for establishing long-term biodiversity inventory plots in tropical forests is complemented by a case study of Luquillo Biosphere Reserve in Puerto Rico. T h e intended primary audiences of the digest are researchers and reserve managers w h o are starting work on permanent forest inventory plots, particularly in tropical regions. T h e digest m a y also be useful in training and educational activities based on inventory plots.
The digest is based on methods developed, tested and refined since 1987 within the Smithsonian Institution/MAB Biological Diversity Program, which was set up at the initiative of the Smithsonian Institution (SI). U N E S C O has been pleased to be associated with this venture since 1987, particularly through providing financial and technical support to field training in such countries as Bolivia, Brazil, Ecuador, Guatemala, Panama, and Peru.
The digest has been compiled and written by researchers involved in the S I / M A B Biodiversity Program.
Francisco Dallmeier is the Director of Smithsonian Institution/Man and the Biosphere Biological Diversity Program ( S I / M A B ) , co-ordinating international research and training activities on biodiversity monitoring for the S I / M A B international biodiversity plot network. Margo Kabel is a computer specialist at the Smithsonian Institution and has developed the computer mapping program used to generate the vegetation m a p s for the biodiversity plots. John M a y n e is a graduate student at the University of Florida (Gainesville) and assisted with data analysis and calculations for the data set on the Bisley Biodiversity Plot in Luquillo, Puerto Rico. Richard Rice, a natural resources economist at The Wilderness Society, has conducted field work establishing the international network of biodiversity plots. Charlotte Taylor, a botanist with the Missouri Botanical Garden, conducted field work and species identification for the Bisley Biodiversity Plot in Puerto Rico.
C O N T E N T S
S u m m a r y 9
Methods for long-term biodiversity inventory plots In protected tropical forest
Francisco Dallmeier, Margo Kabel and Richard Rice 11
Introduction 11 Overview 11 Site descriptions 14
Beni Biosphere Reserve 14 M a n u Biosphere Reserve 15 Luquillo Biosphere Reserve 15 Virgin Islands National Park and Biosphere Reserve 16 Great Smoky Mountains National Park 16
Locating and describing the permanent plot 17 Sampling overview and plot design 18 Surveying the plot 20
Slope correction 22 Materials 25
Tree tagging, measurement, and identification 25 Tree conditions 29
Materials 29 Tree mapping 31
Materials 35 Tree mapping software 35
Preparing users' and field guides 38 Data management and quality control 40
Computer equipment 40 Data entry 42 Budget for time and labour 42
Acknowledgements 44 References 45
Case study of SI/MAB biological diversity plot research methodology: effects of Hurricane Hugo on the Blsley Biodiversity Plot, Luqulllo Biosphere Reserve, Puerto Rico
Francisco Dallmeier, Charlotte M . Taylor, John C . M a y n e , Margo Kabel, and Richard Rice 47
Introduction 47 Methods SO
Specific plot location and description 50 Results and discussion 56
Overall changes 56 Damage to individual species 63 Regeneration of the forest 68
Acknowledgements 70 References 71

S U M M A R Y
Forest inventory plots provide one approach to documenting and moni
toring plant diversity and are one means for obtaining long-term data on
the growth, mortality, regeneration, and dynamics of forest trees. Many
forest plots have been set up over the last few decades, but their scien
tific and practical results have not been commensurate with the time and
money invested in their establishment and maintenance. Reasons for
shortfalls between expectation and performance have been several: dif
ficulties in funding long-term studies and research infrastructures; ab
sence of sound scientific problématique; inability to handle large
amounts of data; absence of agreed methodologies for ensuring cross-
site comparability of data; dislocation between functions of research, re
sources management, and building up of local capacities. However, in
the last decade modern computer-based technologies have opened new
possibilities for surveying and establishing forest plots, for inventories
and monitoring of plants present in those plots, and for using the inven
toried plots in research, training, and resource management efforts.
This digest describes methods used by the Smithsonian Institution! M an
and the Biosphere Biological Diversity Program (SI/MAB) and the Biol
ogical Diversity in Latin American Program (BIOLAT) for establishing
and maintaining permanent inventory plots in tropical forests, with em
phasis on sites designated as biosphere reserves . It begins with a brief
1. The S I / M A B Program is part of the overall effort of the Smithsonian Institution and of U N E S C O in inventorying and monitoring biological diversity in tropical forests. B I O L A T is a complementary initiative of the Smithsonian Natural History M u s e u m that provides survey and inventory data for additional taxa in several of the South American research sites.
9

description of the research sites where long-term inventory plots have
been established: Beni Biosphere Reserve (Bolivia), Manu Biosphere
Reserve (Peru), Luquillo Experimental Forest and Biosphere Reserve
(Puerto Rico), Virgin Islands National Park and Biosphere Reserve (US
Virgin Islands) and Great Smoky Mountains in the Southern
Appalachians Biosphere Reserve (USA).
The permanent plot methodology is used to document species diversity
and tree composition in protected forest areas. The plot is designed as a
zone encompassing 25 ha, divided into 25 plots of 1 ha. Each 1-ha plot
is in turn subdivided into 25 quadrats 20 x 20 m in size, with the quad
rats permanently marked. Each tree > 10 cm dbh is mapped in relation
to two adjacent corner stakes, tagged, and identified. The data generated
from each plot are entered, stored, and analyzed in personal computers.
Tree coordinates and preliminary species information are entered in the
field on portable laptop computers and later transferred to desktop com
puters in the office or laboratory. Users' guides and field guides make
available to reserve managers, students, and researchers, all the basic
information gathered in the plots. Loose-leaf folders and flip charts fa
cilitate continuous updating as more information becomes available.
The detailed description of recommended procedures for field work
and data management (including suggestions on ways to improve these
processes) is complemented in the second half of the digest by a case
study of Luquillo Biosphere Reserve and the effects of Hurricane Hugo
in September 1989 on the permanent plot that had been established and
censused in 1988. Two subsequent censuses have provided comparative
information on hurricane effects on standing trees and basal area and
crown damage, while changes in relative density, frequency, and diver
sity give a measure oftheimpact of the hurricane on species composition.
10
M E T H O D S F O R L O N G - T E R M BIODIVERSITY I N V E N T O R Y P L O T S IN P R O T E C T E D T R O P I C A L F O R E S T
Francisco Dallmeier, Margo Kabel and Richard Rice
Introduction
Overview
Scientists estimate that over the next 25 years, more than a million species
of plants and animals will become extinct (Ehrlich and Wilson 1991; M a n n
1991; Myers 1988; Solbrig 1991a, 19916; Soulé 1991; Wilcove 1987,1988;
Wilson 1988). Most of these extinctions will occur in the tropics where the
pressure of poverty and population growth and a lack of technical and scien
tific infrastructure m a k e conservation efforts extremely difficult. Such ef
forts are often further hampered by the absence of basic information on the
biological resources most in need of protection. Long-term forest inven
tories are one means of obtaining such information.
During the period 1987-1991, procedures for establishing permanent forest
inventory plots were tested and refined at field sites in Bolivia, Peru, Puerto
Rico, and the U S Virgin Islands, as well as in Great S m o k y Mountains N a
tional Park, as part of the Smithsonian Institution/MAB Biological Diversity
Program ( S I / M A B ) . S I / M A B researchers visited a number of research plots
established by other institutions in several countries, including Brazil,
Ecuador, Indonesia, Malaysia, Panama, Puerto Rico, and Venezuela. Changes
in protocols for those sites were made to insure flexibility and m a x i m u m use
fulness of the S I / M A B procedures under a variety of research conditions. The
resulting protocol stems from m a n y discussions with a number of researchers
conducting plot work and from our o w n experience.
11

The goals of the S I / M A B Program are to: 1) facilitate a documented in
ventory of plant diversity; 2) provide long-term data on the growth, mor
tality, regeneration, and dynamics of forest trees; and 3) create an informa
tion base for research and education that will contribute to the conservation
and management of biosphere reserves and other protected areas
throughout the world ( S I / M A B Biological Diversity Program 1991).
T o conserve tropical forest diversity and promote sustainable use of
forest resources, it is necessary to understand h o w forests change. The
permanent plot inventory system provides a baseline distribution of tree
species and describes habitats within a particular site. Monitoring
changes, or lack thereof, in these plots over time enables an under
standing of the impact of natural and m a n - m a d e disturbances on species
and communities composition. Data produced through monitoring can
also be used to predict changes, based on our present understanding of
the ecosystems. Small plots up to two ha in size and containing 1200 to
1400 trees (> 10 c m dbh) within a protected area can provide a window
on species diversity and allow relatively quick and accurate characteri
zations of the larger forest.
Long-term forest inventories can provide managers with important infor
mation needed to establish conservation priorities and serve as the base of
future work. Without adequate inventories, managers cannot measure
change over time, identify gaps in existing knowledge, or set priorities to
fill these gaps. They have little idea of what and h o w management activities
should be modified to ensure that conservation objectives are met. Simply
put, good inventory data are key to successful research projects, conserva
tion, and management. Permanent inventory plots can provide data that are
otherwise unobtainable and that, when maintained and measured repeated
ly, become more valuable over time (Curtis 1983).
Long-term inventories can also be used to help integrate management
of protected areas with compatible development on surrounding lands.
Data gathered from permanent inventory plots in temperate forests have
long been used to project future growth and yields on managed timber-
lands (Curtis 1983), information that is critical in planning for sustain
able logging. Similar information is needed to ensure that logging in
tropical forests proceeds in a sustainable fashion.
This paper provides an opportunity for those w h o are starting work on
permanent inventory plots to benefit from the accumulated experience of
past researchers. It is also intended to promote a greater degree of consist
ency in the type of data collected at different locations and elicit a better
12

Good biodiversity inventory data are key to successful research, conservation, and management. W h e n these data are integrated with long-term inventory plots, they can provide data that are otherwise unobtainable and that, when maintained and measured repeatedly, become more valuable over time.
understanding
of what data
are available
for compari
son with other
research plots
in the tropics.
Analyses of
plant diversity
and forest dy
namics within
regions are
badly needed
to advance
conservation
objectives for
large areas.
F e w individual
researchers
have data ade
quate for this purpose, and there is m u c h to be gained by pooling data
through the cooperative efforts of research workers and organizations - par
ticularly in the context of formal, international designations such as bio
sphere reserves (Curtis 1983). This requires compatibility and comparable
reliability in the data collected at different sites (Synnott 1979; Curtis 1983).
In addition, it can be expected that in the future the data generated by
permanent plots will be analysed by m a n y researchers and often for pur
poses not anticipated by the initial investigators. Objectives and proce
dures change with time, and there can be no guarantee that the procedures
and analyses foreseen when the plots were established will be those
deemed appropriate at a later date. Data and procedures in long-term in
ventories should therefore be as complete and general as possible; it is
usually worth the added time and effort to obtain accurate readings on a
wide range of measurements. Shortcuts should be avoided, as they m a y
limit the usefulness and reliability of the data for subsequent researchers.
Portions of the text m a y appear at first to be mere repetitions of the
obvious. Experience has shown, however, that some issues become ob
vious only at the analysis stage - w h e n it is too late to return to the field
and correct mistakes. Although an in-depth treatment of sampling design
13
is beyond the scope of this contribution, s o m e discussion of sampling is
included in the description of plot installation and measurement, with a
view to providing field personnel with a better understanding of w h y cer
tain procedures are recommended and h o w they might be modified to ac
commodate particular circumstances.
Site descriptions
Five sites have been used since 1986 to test the permanent plot methodo
logy in a variety of field situations. Each site is located in a different bio
sphere reserve. Together, the reserves represent a wide variety of forest
types, ranging from moist tropical forest in the A m a z o n Basin of Peru and
Bolivia to deciduous hardwood forest in the eastern United States. Brief de
scriptions of the reserves follow.
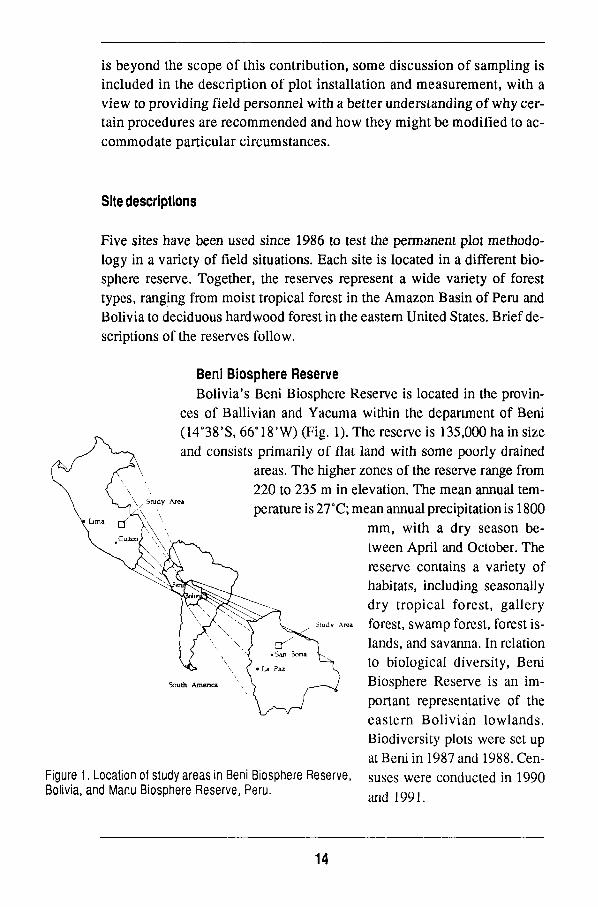
Beni Biosphere Reserve
Bolivia's Beni Biosphere Reserve is located in the provin
ces of Ballivian and Y a c u m a within the department of Beni
(14'38'S, 66° 1 8 ' W ) (Fig. 1). The reserve is 135,000 ha in size
and consists primarily of flat land with some poorly drained
areas. The higher zones of the reserve range from
220 to 235 m in elevation. The mean annual tem
perature is 27°C; m e a n annual precipitation is 1800
m m , with a dry season be
tween April and October. The
reserve contains a variety of
habitats, including seasonally
dry tropical forest, gallery
forest, s w a m p forest, forest is
lands, and savanna. In relation
to biological diversity, Beni
Biosphere Reserve is an im
portant representative of the
eastern Bolivian lowlands.
Biodiversity plots were set up
at Beni in 1987 and 1988. Cen
suses were conducted in 1990
and 1991.
Study Area
South America
Figure 1. Location of study areas in Beni Biosphere Reserve, Bolivia, and Manu Biosphere Reserve, Peru.
14
M a n u Biosphere Reserve
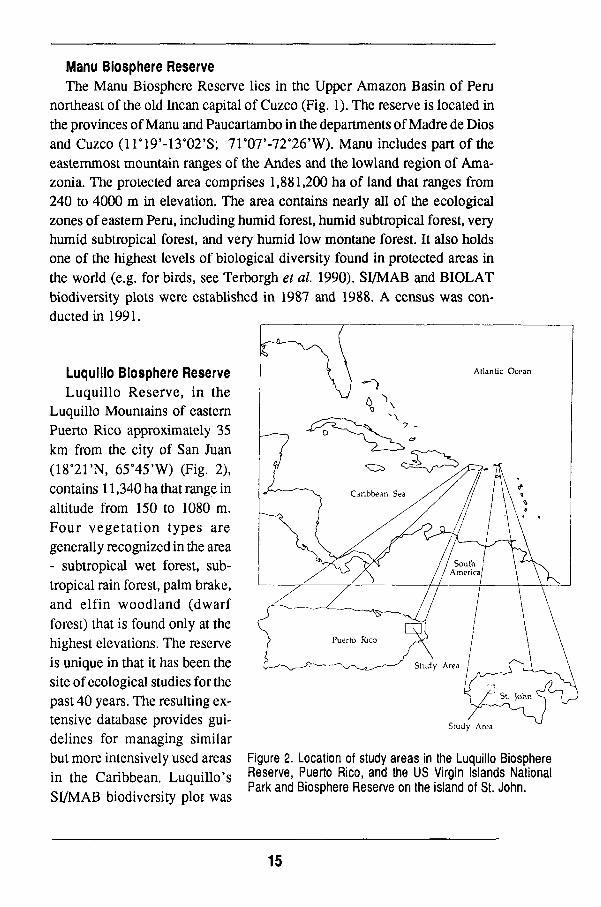
The M a n u Biosphere Reserve lies in the Upper A m a z o n Basin of Peru northeast of the old Incan capital of Cuzco (Fig. 1). The reserve is located in the provinces of M a n u and Paucartambo in the departments of Madre de Dios and Cuzco (llo19'-13°02,S; 71 o 07*-72 o 26'W). M a n u includes part of the easternmost mountain ranges of the Andes and the lowland region of A m a zonia. The protected area comprises 1,881,200 ha of land that ranges from 240 to 4000 m in elevation. The area contains nearly all of the ecological zones of eastern Peru, including humid forest, humid subtropical forest, very humid subtropical forest, and very humid low montane forest. It also holds one of the highest levels of biological diversity found in protected areas in the world (e.g. for birds, see Terborgh et al. 1990). S I / M A B and B I O L A T biodiversity plots were established in 1987 and 1988. A census was conducted in 1991.
Luqulllo Biosphere Reserve
Luquillo Reserve, in the Luquillo Mountains of eastern Puerto Rico approximately 35 k m from the city of San Juan (18g21'N, 65°45 'W) (Fig. 2), contains 11,340 ha that range in altitude from 150 to 1080 m . Four vegetation types are generally recognized in the area - subtropical wet forest, subtropical rain forest, palm brake, and elfin woodland (dwarf forest) that is found only at the highest elevations. The reserve is unique in that it has been the site of ecological studies for the past 40 years. The resulting extensive database provides guidelines for managing similar but more intensively used areas in the Caribbean. Luquillo's S I / M A B biodiversity plot was
Atlantic Ocean
Study Area
Figure 2. Location of study areas in the Luquillo Biosphere Reserve, Puerto Rico, and the U S Virgin Islands National Park and Biosphere Reserve on the island of St. John.
15
established in 1988 and 1989. Censuses are being conducted yearly to assess the effects and damage caused by Hurricane Hugo in 1989.
Virgin Islands National Park and Biosphere Reserve The island of St. John in the U S Virgin Islands (88 k m east of Puerto
Rico) is the h o m e of the U S Virgin Islands Biosphere Reserve (18'21'N, 6 4 ' 4 4 ' W ) (Fig. 2). The reserve contains 6127 ha that vary in altitude from sea level to 389 m . Subtropical dry forest and brush cover 70-85% of the total island, with subtropical moist forest in higher elevations and protected valleys. The dry forest of St. John has regenerated for a period of about 100 years following extensive sugar cane cultivation that ended in the late 1800s. The park is thus an excellent area for observing dry forest regeneration and for planning restoration and management in similar ecosystems throughout the Caribbean region. The S I / M A B biodiversity plot was established in 1991. Mapping of the plot vegetation is scheduled for 1992, and censuses will be conducted in 1995 and 1996.
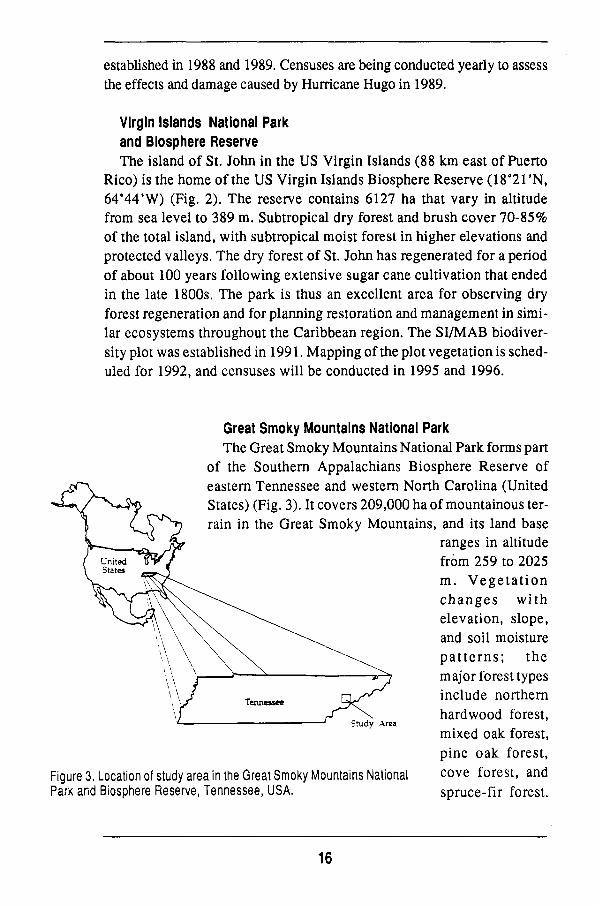
Great Smoky Mountains National Park The Great S m o k y Mountains National Park forms part
of the Southern Appalachians Biosphere Reserve of eastern Tennessee and western North Carolina (United States) (Fig. 3). It covers 209,000 ha of mountainous terrain in the Great S m o k y Mountains, and its land base
ranges in altitude from 259 to 2025 m . Vegetation changes with elevation, slope, and soil moisture patterns; the major forest types include northern hardwood forest, mixed oak forest, pine oak forest, cove forest, and spruce-fir forest.
Study Area
Figure 3. Location of study area in the Great Smoky Mountains National Park and Biosphere Reserve, Tennessee, USA.
16
O n c e a Pleistocene refuge with 30% of its vegetation in primary forest, the area is n o w recognized as one of the most important living laboratories of biodiversity in the United States. A S I / M A B biodiversity plot was set up in the reserve in 1989. Censuses will be conducted in 1992 and 1993.
Locating and describing the permanent plot
Plots are expensive to establish. They are also expected to be permanent. Thus, location is not a decision to be m a d e lightly. It is very helpful for a qualified field ecologist to visit potential sites and define the most representative areas for setting the plots.
Site location should be based on cartographic information, aerial photographs, and field verification. It is important to describe both the site and the plot at the time the plot is being established. At least one permanent geological marker (locateable) for each plot is recommended. Significant elements of the description include: 1) detailed data on the location, access to the plot and h o w the plot was demarkated, to help subsequent researchers find the area; 2) careful recording of slope, aspect, soil types, geology, and local climate (because vegetation growth and productivity are often influenced by local topographic characteristics, it is necessary to describe these characteristics as precisely as possible); 3) a history of past land use in the area; and 4) general information about the site's flora and fauna.
O u r experience in the S I / M A B Biodiversity Program has been that m a n y plots in lushly carpeted tropical forests where undergrowth quickly regenerates are lost to researchers within three to five years because of a lack of precise location data. For this reason, the location of access trails to the plots must be accurately noted on topographic m a p s (if available) and clearly delineated in the field with permanent markers. At the same time, researchers should minimize disturbances that m a y result in making the plot too conspicuous or in altering its species composition. Therefore, whenever possible the information on plot location should refer to conspicuous natural landmarks such as rock formations and creek intersections. In some cases, trees tagged from past studies might serve this purpose.
17
Sampling overview and plot design
01 06
05
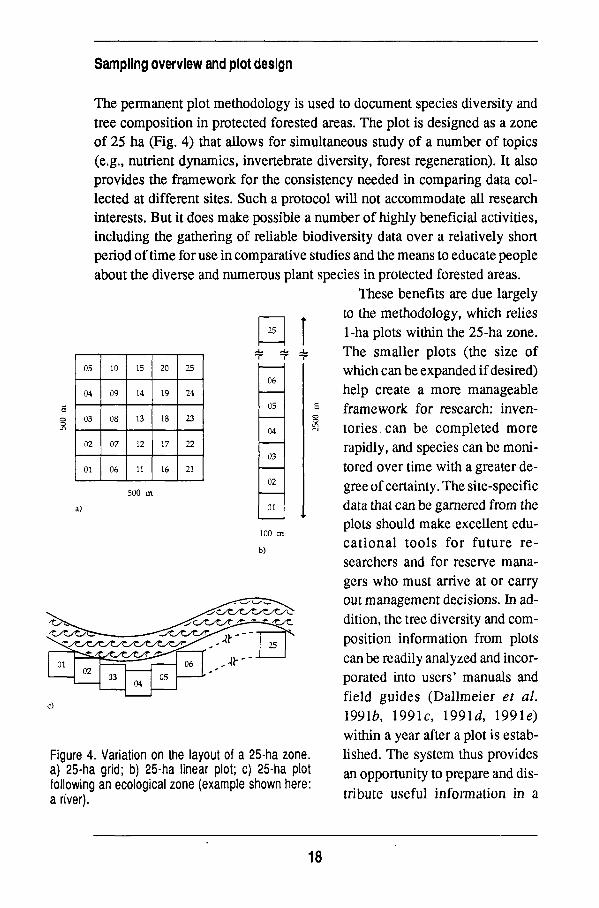
The permanent plot methodology is used to document species diversity and tree composition in protected forested areas. The plot is designed as a zone of 25 ha (Fig. 4) that allows for simultaneous study of a number of topics (e.g., nutrient dynamics, invertebrate diversity, forest regeneration). It also provides the framework for the consistency needed in comparing data collected at different sites. Such a protocol will not accommodate all research interests. But it does m a k e possible a number of highly beneficial activities, including the gathering of reliable biodiversity data over a relatively short period of time for use in comparative studies and the means to educate people about the diverse and numerous plant species in protected forested areas.
These benefits are due largely to the methodology, which relies 1-ha plots within the 25-ha zone. T h e smaller plots (the size of which can be expanded if desired) help create a more manageable framework for research: inventories, can be completed m o r e rapidly, and species can be monitored over time with a greater degree of certainty. The site-specific data that can be garnered from the plots should m a k e excellent educational tools for future researchers and for reserve m a n a gers w h o must arrive at or carry out management decisions. In addition, the tree diversity and c o m position information from plots can be readily analyzed and incorporated into users' manuals and field guides (Dallmeier et al. 1991Ô, 1991c, 1991d, 1991c) within a year after a plot is estab-
Figure 4. Variation on the layout of a 25-ha zone. lished. The system thus provides a) 25-ha grid; b) 25-ha linear plot; c) 25-ha plot m opportunity to prepare and dis-following an ecological zone (example shown here: ., , , . . ariver\ tnbute useful information in a
05
04
03
02
01
10
09
08
07
06
15
14
13
12
11
20
19
18
17
16
25
24
23
22
21
500 m
03
01 •^c^
02 03
04
- ^ • " ^
05
06 -a--
18
timely fashion. Even smaller (and more numerous) plots m a y be set for short
duration experiments in forests where access to a large number of small areas
is relatively easy. In tropical forest ecosystems, however, it is often more ef
ficient to increase the amount of data gathered in each plot and reduce the
total number of plots. High labour costs and logistical problems can m a k e it
impractical to maintain a large number of small plots.
Determining the number of plots required for effective research clearly
hinges on more than access and cost considerations. This decision is best
reached after habitat variability is assessed. For example, four permanent
plots in the Beni Biosphere Reserve represent four discrete managed and
unmanaged habitats. Four years after initial establishment, researchers n o w
estimate an additional 15 plots are needed to represent most of the habitats
or plant communities in the reserve.
In order to help ensure that data gathering, processing, and interpretation
will be comparable a m o n g the network sites, w e recommend the standard
1 -ha size and measurement guidelines described below. This methodology
can be quickly adapted to existing experimental plots in m a n y protected
tropical forest areas or conservation areas. T h e hectare is a standard measure
in international use and is easily converted to other units (e.g. acres).
Selection and surveying of the plot should be done with additions in mind
to accommodate future research objectives. For example, a 50-ha area is
considered the m i n i m u m needed to obtain statistically significant samples
of a large number of species for use in analyses of tropical forest dynamics
and demographic change (Hubbell and Foster 1983; Manokaran etal. 1990).
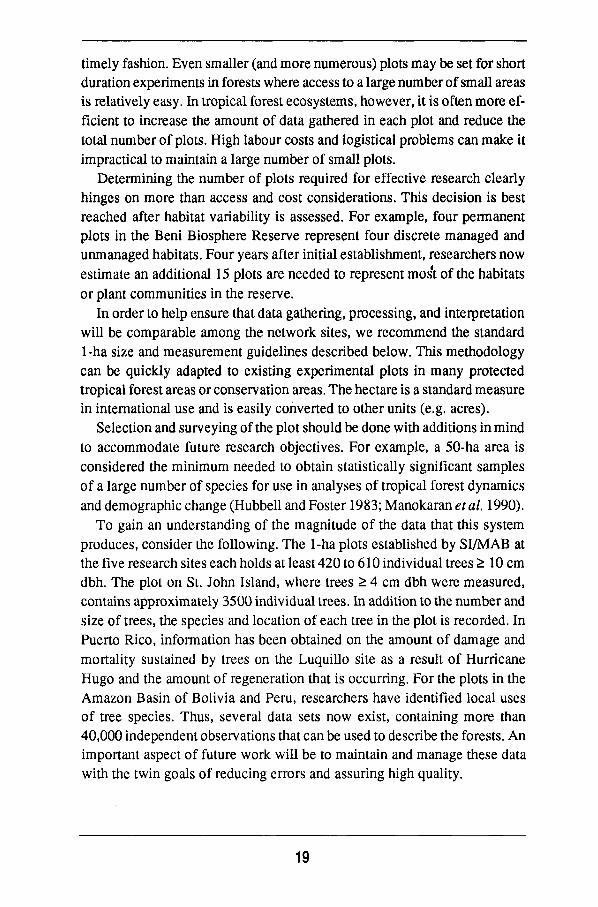
T o gain an understanding of the magnitude of the data that this system
produces, consider the following. The 1-ha plots established by S I / M A B at
the five research sites each holds at least 420 to 610 individual trees > 10 c m
dbh. The plot on St. John Island, where trees > 4 c m dbh were measured,
contains approximately 3500 individual trees. In addition to the number and
size of trees, the species and location of each tree in the plot is recorded. In
Puerto Rico, information has been obtained on the amount of damage and
mortality sustained by trees on the Luquillo site as a result of Hurricane
H u g o and the amount of regeneration that is occurring. For the plots in the
A m a z o n Basin of Bolivia and Peru, researchers have identified local uses
of tree species. Thus, several data sets n o w exist, containing more than
40,000 independent observations that can be used to describe the forests. A n
important aspect of future work will be to maintain and manage these data
with the twin goals of reducing errors and assuring high quality.
19
Surveying the plot
500 m
one 25-ha zone
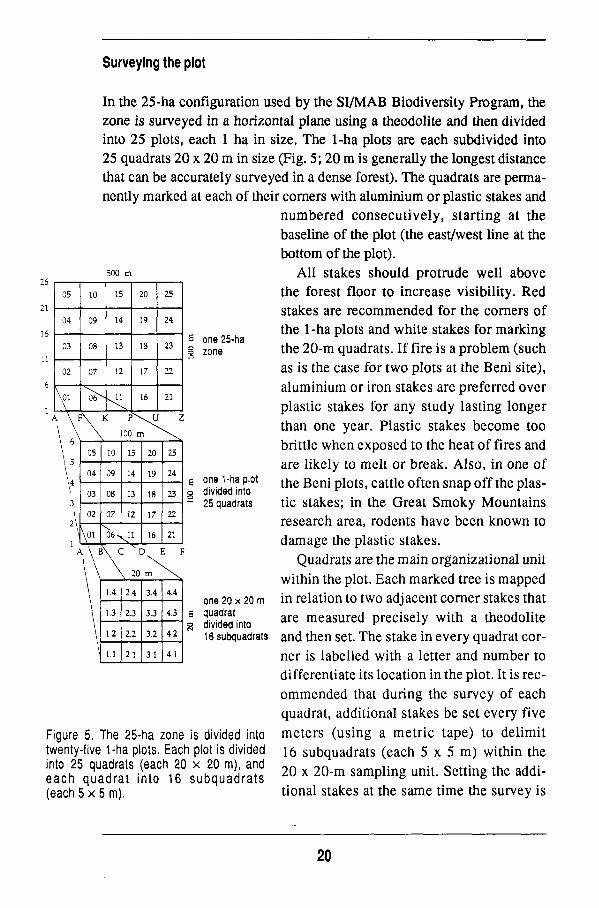
In the 25-ha configuration used by the S I / M A B Biodiversity Program, the zone is surveyed in a horizontal plane using a theodolite and then divided into 25 plots, each 1 ha in size. The 1-ha plots are each subdivided into 25 quadrats 20 x 20 m in size (Fig. 5; 20 m is generally the longest distance that can be accurately surveyed in a dense forest). The quadrats are permanently marked at each of their corners with aluminium or plastic stakes and
numbered consecutively, starting at the baseline of the plot (the east/west line at the bottom of the plot).
All stakes should protrude well above the forest floor to increase visibility. Red stakes are recommended for the corners of the 1-ha plots and white stakes for marking the 2 0 - m quadrats. If fire is a problem (such as is the case for two plots at the Beni site), aluminium or iron stakes are preferred over plastic stakes for any study lasting longer than one year. Plastic stakes become too brittle w h e n exposed to the heat of fires and are likely to melt or break. Also, in one of the Beni plots, cattle often snap off the plastic stakes; in the Great S m o k y Mountains research area, rodents have been k n o w n to damage the plastic stakes.
Quadrats are the main organizational unit within the plot. Each marked tree is mapped in relation to two adjacent corner stakes that are measured precisely with a theodolite and then set. The stake in every quadrat corner is labelled with a letter and number to differentiate its location in the plot. It is reco m m e n d e d that during the survey of each quadrat, additional stakes be set every five
Figure 5. The 25-ha zone ¡s divided into meters (using a metric tape) to delimit twenty-five 1-ha plots. Each plot is divided 16 subquadrats (each 5 x 5 m ) within the
^h 2 5 ni Ua
a H d ; aa t t S i(nt
anCh12R° Î . h ï n S r ï ï Î 2 0 X 2 0 " m S a m P 1 Í n § U n Í t " S e t t Í n g t h e a d d Í "
each quadrat into 16 subquadrats F ° b
(each 5 x 5 m). tional stakes at the same time the survey is
05
04
03
02
V A \
V 3
\ A « i
10
09
08
07
06^
15
14
13
12
-̂ 11
20
19
18
17
16
25
24
23
22
21
\ K P \ U Z
\ 100 m ^ \
05
04
03
02
\oi
M B
\ \
\
\
10
09
08
07
06-
15
14
13
12
s11
20
19
18
17
16
25
24
23
22
21
\ C N D E F
\ 20 m \
1.4
1.3
1.2
1.1
2.4
13
2.2
2.1
3.4
3.3
3.2
3.1
4.4
4.3
4.2
4.1
one 1-ha plot divided into 25 quadrats
one 20 x 20 m quadrat divided into 16 subquadrats
20

a)
conducted eases the task of making necessary corrections for slope (see below). All 16 subquadrats are numbered consecutively, beginning with the number of the quadrat (Fig. 5).
Surveying to establish quadrat corners should proceed from the centre of the plot outward to minimize measurement errors. Quadrat corners should be built along the north-south centre line (Fig. 6); new corners are then added westward to the edge of the plot. The next step is to finish the centre row eastward before moving to other portions of the
20 m
16
11
6
1
' 05
04
i
03
02
01 '
10
09
08
07
06 »
15
14
^ ' > 12
11
20
19
18
17 '
16
25
24
23
22
21
-» 1 »-b)
Figure 6. a) Central quadrat of a 1-ha plot; b) direction of sighting that the surveying team followed in establishing the 1-ha plot.
The plot is surveyed in a horizontal plane using a tripod mounted theodolite which is leveled using a plumb-bob positioned over the center of the first corner stake. O n sloping ground, the 2 0 - m interval between corner stakes must be adjusted by a factor related to the degree of slope.
plot to establish the remaining corners. T o begin the survey, researchers set up a tripod-mounted theodolite and level it using a p l u m b - b o b positioned over the centre of the first stake. This stake serves as the arbitrary centre of the plot and as a c o m m o n point from which all four corners of the first
21

quad can be established. In this way, any error introduced by moving the theodolite in establishing the first four corners is avoided.
After the tripod is in position, the instrument operator sights along a diagonal bearing to establish the first corner. Technician A goes d o w n the line with a tape measure to reach a horizontal distance of 14.124 m -half of the diagonal distance of the 20 x 2 0 - m quadrat (Fig. 6). A surveying rod is held vertically as a target over the 14.124-m mark to facilitate the determination of the true bearing. A n additional person should be available to push aside branches or small stems so that the instrument operator has a clear line of sight and to keep vegetation from deflecting the tape. It is extremely important that the tapes be pulled snug to avoid sagging and, thus, distortions in measurements. Even a few centimetres, of discrepancy in initial measurements can result in m u c h larger errors at the border of the plot. Periodic check measurements to compare n e w and past work are highly recommended; performed as often as possible, they will reduce the risk of accumulated error. In using the theodolite, it is also important to avoid taking measurements in close proximity to metal objects such as belt buckles, jewelry, glasses with metal frames, or wristwatches as they could cause errors in the magnetic readings.
Researchers in the field record (with pencil) the survey data in waterproof notebooks that are later transcribed into a permanent record book. Essential information includes: a) three different bearing measurements - the 'back' measurement (from the n e w set up point back to the previous stake on the same line), the 'check' measurement (to previous established stakes above and below the current line), and the 'new' measurement (to set the next stake on the current line); b) the coordinates of the corner stakes being surveyed and the direction of the survey; c) the angle along which the surveying is proceeding in relation to the horizontal; d) the vertical difference in height between the scope and the stake being surveyed; e) the distance being measured between the scope, the n e w point being surveyed, and the new slope-corrected distance (see below); and f) the elevation of each corner stake.
Slope correction1
O n uneven terrain, the 2 0 - m interval between quadrat corner stakes must be adjusted to account for slope. The purpose of this correction is to ensure that each quadrat contains 400 m regardless of topography. A s
1. While the following discussion focusses on slope corrections in relation to establishing comer stakes, the same procedure is used to obtain slope corrected measurements for tree mapping.
22
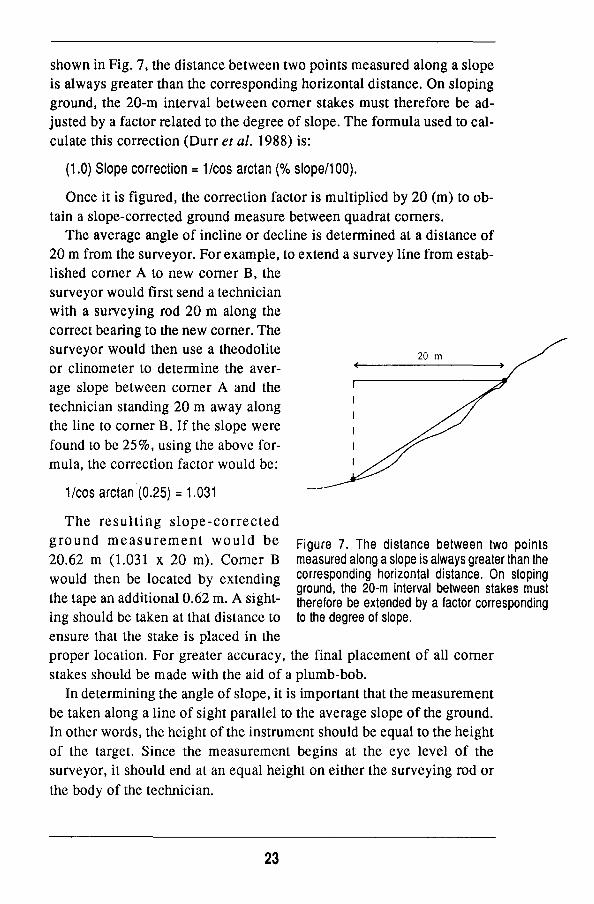
shown in Fig. 7, the distance between two points measured along a slope
is always greater than the corresponding horizontal distance. O n sloping
ground, the 2 0 - m interval between corner stakes must therefore be ad
justed by a factor related to the degree of slope. The formula used to cal
culate this correction (Durr et al. 1988) is:
(1.0) Slope correction = 1/cos arctan (% slope/100).
Once it is figured, the correction factor is multiplied by 20 (m) to ob
tain a slope-corrected ground measure between quadrat corners.
The average angle of incline or decline is determined at a distance of
20 m from the surveyor. For example, to extend a survey line from estab
lished corner A to new corner B , the
surveyor would first send a technician
with a surveying rod 20 m along the
correct bearing to the new corner. The
surveyor would then use a theodolite
or clinometer to determine the aver
age slope between corner A and the
technician standing 20 m away along
the line to corner B . If the slope were
found to be 25%, using the above for
mula, the correction factor would be:
1/cos arctan (0.25) = 1.031
T h e resulting slope-corrected
ground m e a s u r e m e n t w o u l d be
20.62 m (1.031 x 20 m ) . Corner B
would then be located by extending
the tape an additional 0.62 m . A sight
ing should be taken at that distance to
ensure that the stake is placed in the
proper location. For greater accuracy, the final placement of all corner
stakes should be made with the aid of a plumb-bob.
In determining the angle of slope, it is important that the measurement
be taken along a line of sight parallel to the average slope of the ground.
In other words, the height of the instrument should be equal to the height
of the target. Since the measurement begins at the eye level of the
surveyor, it should end at an equal height on either the surveying rod or
the body of the technician.
Figure 7. The distance between two points measured along a slope is always greater than the corresponding horizontal distance. O n sloping ground, the 20-m interval between stakes must therefore be extended by a factor corresponding to the degree of slope.
23

Occasionally, it is necessary to correct for slope using a two-step procedure. For example, if the crest of a steep hill falls along the line between two adjacent corners, it m a y not be possible to correct for slope with a single measurement. In this case, average slope should first be determined between the established comer and the crest of the hill and then used in conjunction with the corresponding taped distance along the slope to determine the planar distance between the two points. This distance should be subtracted from the total desired planar distance of 20 m . T h e residual planar distance, along with the average slope taken from the crest of the hill downward, should be used to establish the sloped distance corresponding to the residual planar distance. The formulae used for this procedure are presented below:
(1 .1 )SaxQa = Pa ( 1 . 2 ) 2 0 m - P a = Pb (1 .3 )QbxPb = Sb (1.4) Sa + Sb + St
where:
Sa = the sloped distance between the established corner and the intermediate point at the crest of the hill. Q a = 1/cos arctan (% slope a/100), from (1.0) above. Pa = planar distance corresponding to the sloped distance between the established corner and the crest of the hill. Pb = 20 m - Pa (i.e., the residual planar distance). Q b = 1/cos arctan (% slope b/100). Sb = the sloped distance between the crest of the hill and the corrected corner location. St = the total sloped distance between the crest of the hill and the corrected corner.
T o facilitate slope correction in the field, a table of correction factors can be constructed using the formula 1/cos arctan (% slope b/100). A s an alternative, a hand-held calculator can be programmed with prompts to accommodate both the one-step and two-step procedures outlined above.To facilitate measurements over steep terrain, it m a y be more practical to block out areas with the theodolite and fill in data using a compass and a hand clinometer. This allows stakes to be set more quickly so that the rest of the project can get started. Later, the team should return to examine the topography in greater detail. Sharp landslips and ravines that m a y fall even within 5 - m blocks should be properly taken into account.
24

Materials
Several types of theodolites have been used in our survey work, including the Lietz T S 2 0 A scale reading theodolite, with a 30x magnification, and a smaller Ushita theodolite model - Tracon S-25. In some tropical forests, the 'high-tech' electronic distance-measuring theodolites do not perform well in high humidity or if handled roughly. In a 25-ha zone, 900 red plastic surveying stakes are necessary to mark the plot corners (Forestry Suppliers catalogue # 39503), and 11,025 white plastic stakes are needed to mark quadrat corners (Forestry Suppliers catalogue # 39501). At least two 3 0 - m steel measurement tapes are needed for corner measurements, and different colours of flagging tape are used to mark the location of plot and quadrat corner stakes. Researchers carry a 2 - m telescoping surveying rod that extends to 4 m , a clinometer, and two heavy rubber mallets to set the stakes in place.
Tree tagging, measurement, and identification
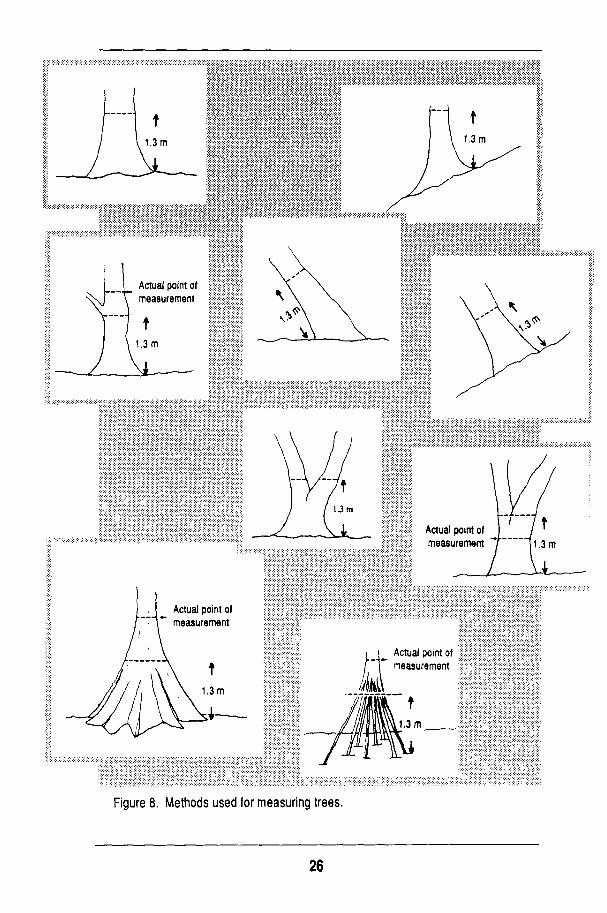
Once each plot has been surveyed, string is tied along the borders of each quadrat to facilitate general orientation during mapping. The string also makes it easier to determine whether individual trees are located within a given quadrat. All string is removed once mapping is completed. Tree tagging and identification can begin as soon as the corner stakes of the quadrats have been set and the strings tied. The process (Fig. 8) includes locating all trees > 10 c m diameter at breast height (dbh; measured with a dbh tape at 1.3 m from the ground), placing a numbered aluminum tag facing outward toward the baseline and located above the 1.3-m level to avoid interference with dbh measurement, measuring dbh, marking the line of dbh measurement with red paint, and identifying the tree species.
T o accomplish these tasks, a team of three individuals walks the quadrat, starting at the left corner baseline in concentric circles of decreasing size to the centre of the plot. O n e person sets the tag in place; another records dbh and paints the trees; the third identifies the trees (Fig. 9). In some cases, subsequent visits by a botanist are required to complete species identification. Smaller
In tagging the trees, the aluminium label should face outward, oriented toward the baseline of the plot and set with a nail a little more than 1.3 m from the ground. Each individual tree is tagged with a different n u m b e r consisting of a sequence of four double digits.
25
t 1.3m
Actual point of measurement
1.3 m
Actual point of measurement
Actual point of measurement
i_ Actual point of measurement
.3 m
Figure 8. Methods used for measuring trees.
26

Fallen and sprouting
¡- 1.3 m - » .
Figure 9 . Classification of irregular trees.
27

trees can be measured with calipers; this has been done only at the St. John plot, where intensive studies are planned. Aluminum nails work best to set the tags, although steel nails m a y be needed for extremely hard wood. The nail should be driven to angle d o w n and just far enough in so that it will not fall out w h e n pulled or if bark should fall off, leaving enough room for the tree to grow before 'eating' the tag. For young, fast-growing trees < 10 c m dbh, grafting tape or c o m m e r cial electrical cable ties should be used to set tags, allowing the tree room to grow. However, these materials melt quickly, and over time m a y become brittle and break. If the possibility of fire exists and the trees are not large enough to hold nails, it is necessary to wire the tag to the base of the tree. A note to that effect should be recorded on the data sheet.
Since 1989, w h e n S I / M A B researchers began painting the point of dbh measurement, the accuracy of the observations has improved considerably. Inconsistent measurements are still found, however, usually because certain trees (such as figs) have highly irregular surfaces or because of vines or other vegetation growing along the bark. W h e n such problems are encountered, a note is m a d e on the data sheets. Other errors when measuring dbh include incorrect determination of the point of measurement, misreading the dbh tape, and faulty recording of information either in the field or later when the data are transferred to a computer. Each individual tree is tagged with a different number consisting of a sequence of four double digits. Using 01-13-24-09 as an example, the first two numbers (01) designate the 25-ha zone, single habitat, or plant community. The second set of numbers ( 13) corresponds to the 1 -ha plot in the zone. The third pair (24)
Diameter at breast height (dbh), should be measured with a dbh tape at 1.3 m from the ground, avoiding any protrusions of the trunk. Smaller trees are measured with calipers.
28

identifies the quadrat, and the last two numbers (09) represent an individual
tree in the quadrat. N o other tree receives this number. The tree numbers start
at 01 in each quadrat and continue until the last tree is labelled. The average
number of trees per quadrat in S I / M A B ' s South American plots ranges from
17 to 39. At the U S Virgin Islands plot, the number of trees ranges from 140
to 160 per quadrat. A s discussed earlier, the large number of trees recorded
for the U S Virgin Islands plot is a result of tagging all trees S 4 c m dbh, rather
than only those trees £ 10 c m dbh.
At the S I / M A B plots, all trees are examined by qualified botanists, and
voucher specimens are collected for herbarium identification and preparation
of high resolution plant photocopies - or 'mini-herbariums' - for inclusion in
users' guides to the plots. O n average, more than 60% of the trees are identi
fied during the first year of field study, increasing to 80% once the sample her
barium specimens are verified and to 96% following a second visit to the plot.
W h e n the set of field and herbarium corrections is finished, near complete
identification is accomplished for all tagged trees, with a final estimated error
of < 2%. C o m m o n errors in identifying trees include selecting the wrong
leaves for study, determining two or more separate species as one, splitting
one species into two or more, having insufficient knowledge of the species'
field characteristics, relying on identifications and c o m m o n names used by
local residents, and making clerical mistakes.
Tree conditions
Several categories of tree conditions have been assigned at the Puerto Rico
plot where damage from Hurricane H u g o is being assessed. The categories are
(a) high damage for trees with no branches remaining after the hurricane, (b)
m e d i u m damage for trees with one to three branches remaining, and (c) low
damage for trees with four or more branches remaining. T o facilitate data m a n
ipulation and analysis, the following categories have also been recognized:
alive standing, alive broken, alive fallen, dead standing, dead broken, dead fal
len, and not located. Researchers at other sites m a y find it helpful to develop
similar categories for use in recensuses or following cataclysmic events such
as Hurricane H u g o .
Materials
The following materials have been used to measure and tag trees at the re
search plots: aluminium and steel nails 7 c m in length; aluminium tree tags
29
Jí'« mi
J
:::jf. á*¥T
3 ^P*% *\
fît «PS
ir .̂ *fe#
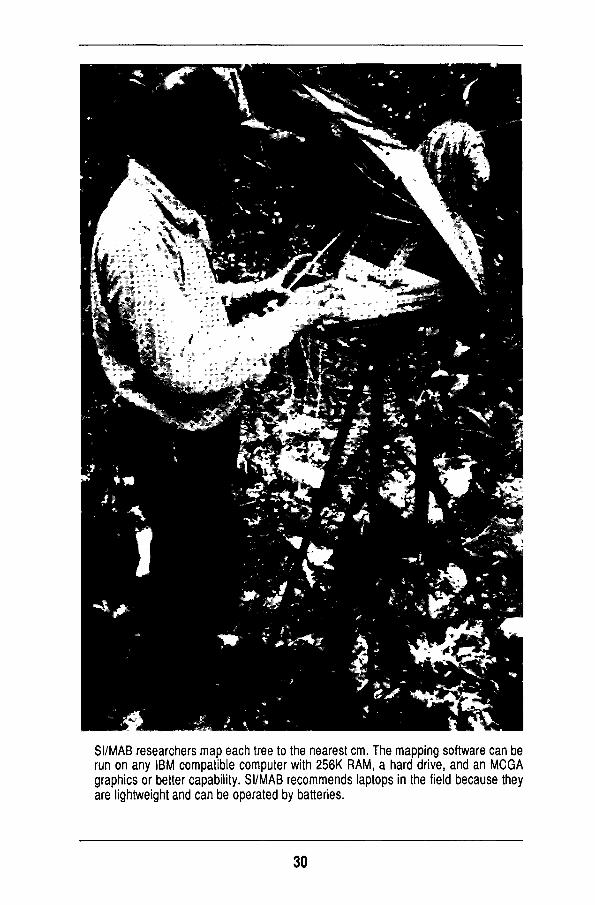
" t̂f̂ Cjfifc SI /MAB researchers m a p each tree to the nearest c m . The mapping software can be run on any IBM compatible computer with 256K R A M , a hard drive, and an M C G A graphics or better capability. S I /MAB recommends laptops in the field because they are lightweight and can be operated by batteries.
30

(67 x 25 x 1 m m ) with a 5 - m m hole at one end (purchased from National Band and Tag C o . , Newport, Kentucky, U S A ) ; three hammers; 3000 cable ties; five rolls of grafting tape; two diameter tapes; two 5 0 - m measuring tapes; clipboards; three calipers; several colours of flagging tape; red paint for the dbh marks; small brushes; field data sheets; pencils; blank tree tags; and hand-stamp steel dies to replace lost tags.
Tree mapping
In addition to measuring and identifying trees in the quadrats, each tree is mapped to the nearest centimeter. A mapping team of four to six people uses two 5 0 - m measuring tapes and a dbh tape to accomplish this task. Each tree
It was necessary to assign several categories of tree conditions to trees at the Puerto Rico plot where damage from Hurricane Hugo is being assessed. The categories are: high damage for trees with no branches remaining after the hurricane, medium damage for trees with one to three branches remaining, and low damage for trees with four or more branches remaining.
31
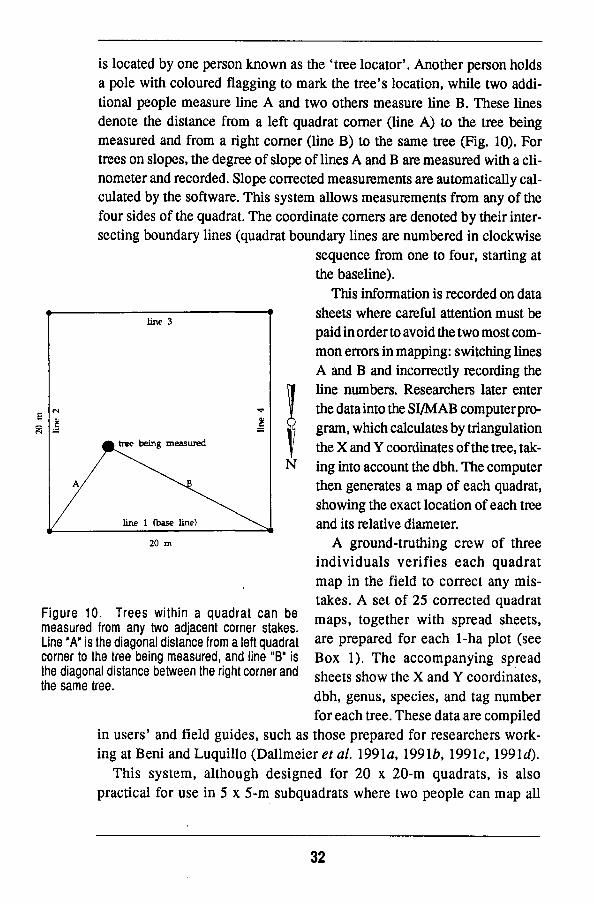
is located by one person k n o w n as the 'tree locator*. Another person holds a pole with coloured flagging to mark the tree's location, while two additional people measure line A and two others measure line B . These lines denote the distance from a left quadrat corner (line A ) to the tree being measured and from a right corner (line B ) to the same tree (Fig. 10). For trees on slopes, the degree of slope of lines A and B are measured with a clinometer and recorded. Slope corrected measurements are automatically calculated by the software. This system allows measurements from any of the four sides of the quadrat. The coordinate corners are denoted by their intersecting boundary lines (quadrat boundary lines are numbered in clockwise
sequence from one to four, starting at the baseline).
This information is recorded on data sheets where careful attention must be paid in order to avoid the two most comm o n errors in mapping: switching lines A and B and incorrectly recording the line numbers. Researchers later enter the data into the S I / M A B computer program, which calculates by triangulation the X and Y coordinates of the tree, taking into account the dbh. The computer then generates a m a p of each quadrat, showing the exact location of each tree and its relative diameter.
A ground-truthing crew of three individuals verifies each quadrat m a p in the field to correct any mistakes. A set of 25 corrected quadrat m a p s , together with spread sheets, are prepared for each 1-ha plot (see B o x 1). T h e accompanying spread sheets show the X and Y coordinates, dbh, genus, species, and tag number for each tree. These data are compiled those prepared for researchers work
ing at Beni and Luquillo (Dallmeier et al. 1991a, 19916, 1991c, \99ld). This system, although designed for 20 x 2 0 - m quadrats, is also
practical for use in 5 x 5 - m subquadrats where two people can m a p all
20 m
Figure 10. Trees within a quadrat can be measured from any two adjacent corner stakes. Line "A" is the diagonal distance from a left quadrat corner to the tree being measured, and line "B" is the diagonal distance between the right corner and the same tree.
in users' and field guides, such as
32

Box 1. Example of a quadrat map and spread sheet from a users' guide
BENI BIODIVERSITY PLOTS
SMITHSONIAN/MAB BIODIVERSITY PROGRAM
PLOT 0113 - QUADRAT 02 - 1990/91 CENSUSES
05
04
03
m 01
10
09
08
07
06
15
14
13
12
11
20
19
18
17
16
25
24
23
22
21
w
t S-« »-N
T
E
\ DIRECTION X OF FALL
'im'
1 1
•
.
-
-
-
-
•
l>" 1
T T
i i i i i i i
.18
.11
21 £ ^ ^ 2 0
.7 »13
• 4*3
- n T ri'i-ri
i i
• 14
10»
• 8
• 2
I I
I
.9
I
I I
• 5
I I
! I I I
• 16
• 17
•
•
1 2 « « 6 •
.
•
•
I I I
1- Pithecellobium latifolium (Leguminosae-Mim) PITLAT 2- Brosimum lactescens (Moraceae) B R O L A C 3- Scheelea princeps (Palmae) SCHPRI 4- Brosimum lactescens (Moraceae) B R O L A C 5- Brosimum lactescens (Moraceae) B R O L A C 6- Scheelea princeps (Palmae) SCHPRJ 7- Brosimum lactescens (Moraceae) B R O L A C 8- Scheelea princeps (Palmae) SCHPRJ 9- Brosimum lactescens (Moraceae) B R O L A C
10- Scheelea princeps (Palmae) SCHPRJ 11- hrosimum lactescens (Moraceae) B R O L A C 12- Heisteria nítida (OLacaceae) HELNIT 13- Brosimum lactescens (Moraceae) B R O L A C 14- Brosimum lactescens (Moraceae) B R O L A C 16- Scheelea princeps (Palmae) SCHPRI 17- Brosimum lactescens íMoraceae) B R O L A C 18- Brosimum lactescens (Moraceae) B R O L A C 19- Cupania cinérea (Sapindaceae) CUPCIN 20- SaJacia -J (Hippocrateaceae) SAL-1 ll'Salacia -1 (Hippocrateaceae) SAL-1
[Source : Dallmeier ef a/. 1991 c © ]
33

Box 1
. (Contd.)
t/l
O DIVERSITY PL
oía
BENI
«j O
Ü
E¿ CU
t B BIODIVERSI /MA NIAN
O
X H
2
c/1
tú
3 C/Î
Y,
[xl U
RAT 02 -1990/9
1
3 1 3 - Q
0 h-
Ü
-J
a.
oo
rN
O<
Nr
^>
oc
N*
rr
-o
a
nv
oo
mo
r-
mo
co
i-
io
Oí
0 r̂
0 0 IN
O
O
(N
tN
m
^ m
0
in
00
V£>
0 0
0 (IN
r»
te
0 00
0 ,j. 0 V©
^ *r
0 r*i r̂
00
CN
1/1
0 ,_, 0 2 r*
cu
0 Ti
m
00
^ <N
O
(N
ÍN
fN
í*">
CU
O
m
H
(N
00
O
O
vO
CN
\D
(N
y»
0 m
0 o\
ÍN
^
O
>«
•*
•H
tú
en
O
en
^H
m
m
«
0 •-t
o>
r—
(N
00
0 \c
"•
•
Ifi
^ CT»
O
l£l
m
t-OJ
•"
•
0 CO
r-0*
CN
1-1
O
1*
VO
CÏ
^ O
O
CO
m
m
m
ín
vo
or
^^
ot^
-o
r^
m
U
U M
u
U
H o
H
U
O
lllîliiïïllllllîl lïi
0 3 0 3
0
>, JZ
u £
£
u
x:
ü -C
o X
U
U«
JO
«J
Ü«
JO
OO
Ü«
JO
On
ía
&i
U©
4J
<O
CJ
-P
0)
4-
>
Uœ
+J
fD
Œ-
Pf
DO
J
™^
u-
_.
03
03
03
.0
33
03
3n
<_
,_
, O
tO
XO
ia
XO
iS
O'
XG
iU
Oi
Oi
XO
iG
iO
IO
U
•H
UÛ
iU
UÛ
tU
Qi
Ua
U
Oo
iQ
ai
no
ao
aO
ai
Rl
a
*H
(D
O0
J(
DO
0Î
U-
" ~
~
•
H+
JC
-U
4J
C-
UC
U
O -H
U
U
U O
i U
U
O<
D*
ag
J0
JO
<D
<D
ia
<Q
Ufl}
QU
(d
L4
<d
tiA
+J +J C
+J 4J
O
U-
UO
O-
HO
OC
a
jaj^
ifljia
-H
—I^H
Ef
lee
me
KJ
En
je-
HE
eiie
e 11)
3 3
Q
) 3
0)
3
3 3 fl
al
m
n<
ua
in
a)
ai(
Dn
a>
<n
aia
in
iD
<i)
aiia
aj«
0
-C
OO
.C
O.
CO
.C
O
OO
J3
00
Û,
r-
lr
H
MU
UM
Uk
4U
UU
M0
ti
^O
I-
il
-i
3<
di
fl
h en
«
ça m
w
-H CN n
r̂ »/i
*o
co o
o
a: m
CD «
en
CN
(*)
-v
vo r*-34
vegetation S 1 c m dbh. In addition, the system can be used to m a p areas along a transect or trail where stakes are located every 20 m . It even allows mapping of irregular areas such as a gallery forest. The areas can be laid out as a series of quadrats in a single or double file or other irregular sequence. For example, in a protected forest in Venezuela, a transect of 20 x 2 0 - m quadrats is planned that covers an estimated 17 ha, starting at sea level and rising in elevation to 2000 m . Eventually, each quadrat can be divided into smaller subquadrats that, when staked and mapped, will provide the bases for more detailed demographic studies.
O n e advantage to setting up 5 x 5 - m subquadrats is that their size provides a practical means for mapping the m u c h larger number of trees in small diameter classes. For example, reducing the diameter limit from 10 c m to 4 c m in the Virgin Islands increased the number of trees mapped by sevenfold. Even greater increases can be expected if the diameter limit is reduced to 1 c m . It is impractical to m a p such a large number of trees using the methodology outlined above. A n alternative method that has proven quite accurate involves locating the trees by eye in a 5 x 5 - m sub-quadrat, pencilling in their location on a m a p , and later entering the data into a computer using a digitizing tablet (see Hubbell and Foster 1986).
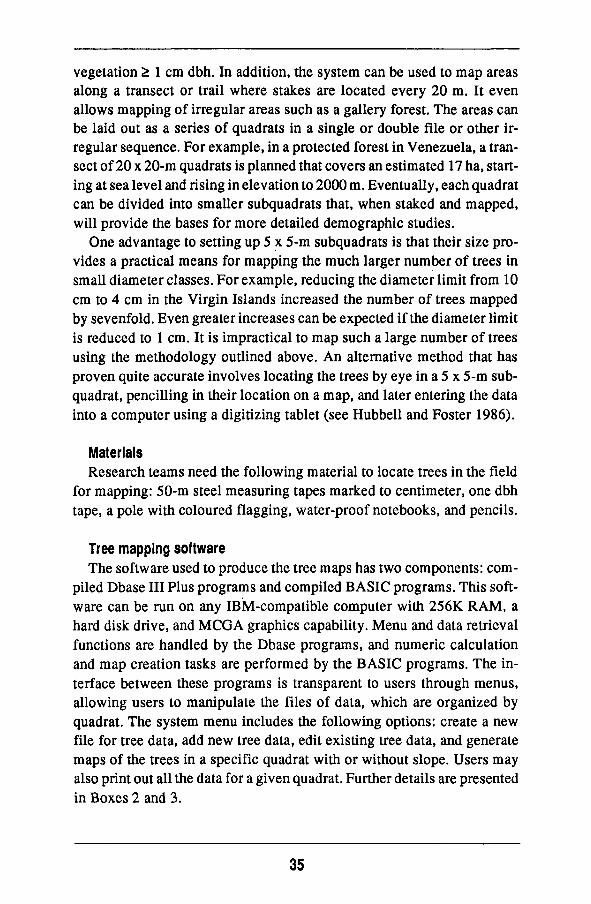
Materials Research teams need the following material to locate trees in the field
for mapping: 5 0 - m steel measuring tapes marked to centimeter, one dbh tape, a pole with coloured flagging, water-proof notebooks, and pencils.
Tree mapping software The software used to produce the tree maps has two components: c o m
piled Dbase III Plus programs and compiled B A S I C programs. This software can be run on any IBM-compatible computer with 2 5 6 K R A M , a hard disk drive, and M C G A graphics capability. M e n u and data retrieval functions are handled by the Dbase programs, and numeric calculation and m a p creation tasks are performed by the B A S I C programs. The interface between these programs is transparent to users through menus, allowing users to manipulate the files of data, which are organized by quadrat. The system m e n u includes the following options: create a new file for tree data, add n e w tree data, edit existing tree data, and generate maps of the trees in a specific quadrat with or without slope. Users m a y also print out all the data for a given quadrat. Further details are presented in Boxes 2 and 3.
35
Box 2. Tree mapping software instructions
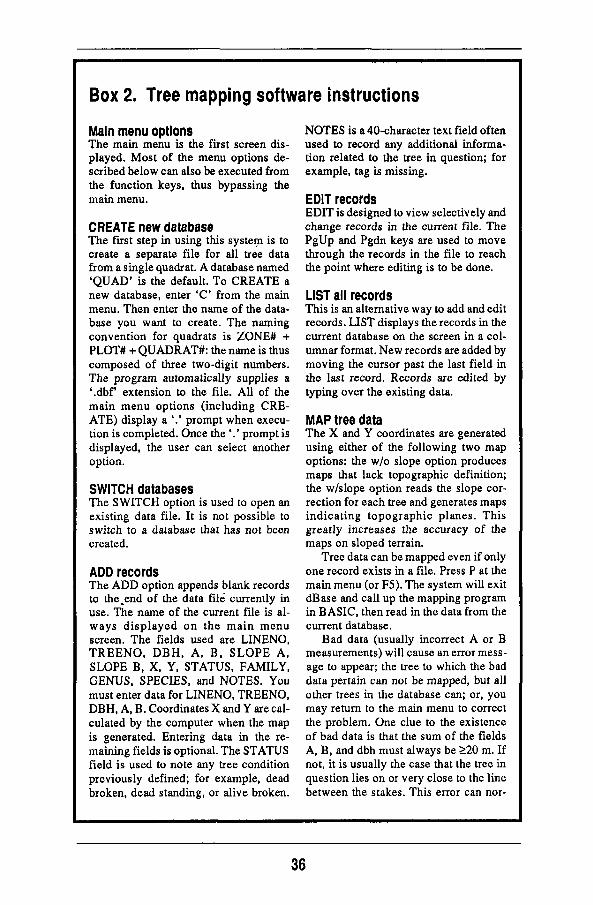
Main menu options The main m e n u is the first screen displayed. Most of the m e n u options described below can also be executed from the function keys, thus bypassing the main m e n u .
C R E A T E new database The first step in using this system is to create a separate file for all tree data from a single quadrat. A database named ' Q U A D ' is the default. T o C R E A T E a new database, enter ' C from the main m e n u . Then enter the name of the database you want to create. The naming convention for quadrats is Z O N E # + P L O T # + Q U A D R A T # : the n a m e is thus composed of three two-digit numbers. The program automatically supplies a '.dbf extension to the file. All of the main m e n u options (including C R E A T E ) display a '.' prompt when execution is completed. Once the '.' prompt is displayed, the user can select another option.
SWITCH databases The S W I T C H option is used to open an existing data file. It is not possible to switch to a database that has not been created.
A D D records The A D D option appends blank records to the^end of the data file currently in use. The name of the current file is always displayed on the main m e n u screen. The fields used are L I N E N O , TREENO, DBH, A, B, SLOPE A, SLOPE B, X, Y, STATUS, FAMILY, GENUS, SPECIES, and NOTES. You must enter data for L I N E N O , T R E E N O , D B H , A , B . Coordinates X and Y are calculated by the computer when the m a p is generated. Entering data in the remaining fields is optional. The S T A T U S field is used to note any tree condition previously defined; for example, dead broken, dead standing, or alive broken.
N O T E S is a 40-character text field often used to record any additional information related to the tree in question; for example, tag is missing.
EDIT records E D I T is designed to view selectively and change records in the current file. The P g U p and Pgdn keys are used to m o v e through the records in the file to reach the point where editing is to be done.
LIST all records This is an alternative way to add and edit records. LIST displays the records in the current database on the screen in a columnar format. N e w records are added by moving the cursor past the last field in the last record. Records are edited by typing over the existing data.
M A P tree data The X and Y coordinates are generated using either of the following two m a p options: the w / o slope option produces maps that lack topographic definition; the w/slope option reads the slope correction for each tree and generates maps indicating topographic planes. This greatly increases the accuracy of the maps on sloped terrain.
Tree data can be mapped even if only one record exists in a file. Press P at the main m e n u (or F5). The system will exit dBase and call up the mapping program in B A S I C , then read in the data from the current database.
Bad data (usually incorrect A or B measurements) will cause an error message to appear; the tree to which the bad data pertain can not be mapped, but all other trees in the database can; or, you m a y return to the main m e n u to correct the problem. O n e clue to the existence of bad data is that the sum of the fields A , B , and dbh must always be >20 m . If not, it is usually the case that the tree in question lies on or very close to the line between the stakes. This error can nor-
36
mally be avoided if the recorder in the field totals the measurements when they are taken.
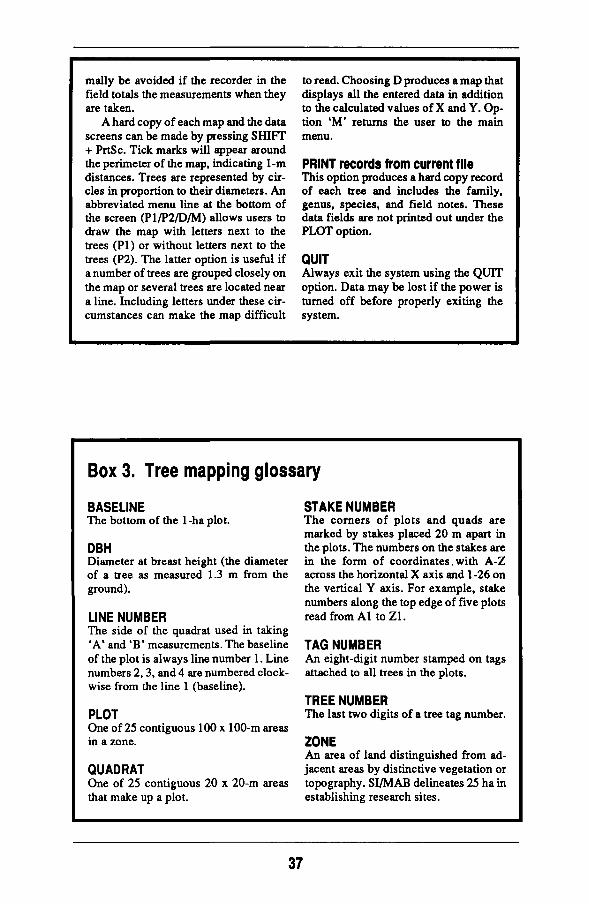
A hard copy of each m a p and the data screens can be m a d e by pressing S H I F T + PrtSc. Tick marks will appear around the perimeter of the m a p , indicating 1 - m distances. Trees are represented by circles in proportion to their diameters. A n abbreviated m e n u line at the bottom of the screen ( P 1 / P 2 / D / M ) allows users to draw the m a p with letters next to the trees (PI) or without letters next to the trees (P2). The latter option is useful if a number of trees are grouped closely on the m a p or several trees are located near a line. Including letters under these circumstances can m a k e the m a p difficult
BASELINE The bottom of the 1 -ha plot.
DBH Diameter at breast height (the diameter of a tree as measured 1.3 m from the ground).
LINE NUMBER The side of the quadrat used in taking ' A ' and ' B ' measurements. The baseline of the plot is always line number 1. Line numbers 2, 3, and 4 are numbered clockwise from the line 1 (baseline).
PLOT O n e of 25 contiguous 100 x 100-m areas in a zone.
QUADRAT O n e of 25 contiguous 20 x 2 0 - m areas that m a k e up a plot.
to read. Choosing D produces a m a p that displays all the entered data in addition to the calculated values of X and Y . O p tion ' M ' returns the user to the main m e n u .
PRINT records from current file This option produces a hard copy record of each tree and includes the family, genus, species, and field notes. These data fields are not printed out under the P L O T option.
QUIT Always exit the system using the Q U I T option. Data m a y be lost if the power is turned off before properly exiting the system.
STAKE NUMBER T h e corners of plots and quads are marked by stakes placed 20 m apart in the plots. The numbers on the stakes are in the form of coordinates. with A - Z across the horizontal X axis and 1-26 on the vertical Y axis. For example, stake numbers along the top edge of five plots read from A l to Zl .
TAG NUMBER A n eight-digit number stamped on tags attached to all trees in the plots.
TREE NUMBER The last two digits of a tree tag number.
ZONE A n area of land distinguished from adjacent areas by distinctive vegetation or topography. S I / M A B delineates 25 ha in establishing research sites.
Box 3. Tree mapping glossary
37
The maps represent a planar view of the forest from above, with the trees indicated in cross section. T h e relative diameters of the trees are shown o n the maps . Tick marks around the perimeter of the m a p mark 1 -m distances. For quick reference, data about the trees in the mapped quadrat are printed on the same sheet. T o accommodate steep slopes, the program allows the user to correct field measurements for topographic relief. The default setting calculates the X and Y coordinates with no degree of slope, but if the slope, expressed in percent, is entered, the software will adjust the coordinates accordingly. This feature greatly increases the accuracy of the maps on sites with topographic relief.
(1ÍMTSÍ1\ plolS c o m m i s e ilouhl
Preparing users' and field guides
Users' guides contain basic biological information about permanent plots at long-term research sites. The purpose is to assist in conducting more effective research and training. Studies over the period 1987-1991 have yielded sufficient information not only to produce the guides but also to begin in-depth analysis of forest diversity and dynamics. Each users' guide is accompanied by a complementary field guide containing a condensed version of information from the users' guide for use in the field (Box 4). Together, the two documents m a k e available to students and researchers all the basic information gathered in the plots. They are designed for loose leaf holders to accommodate continuous updating as m o r e information becomes available.
A consistent format has been followed in producing the users' guides. The first section provides a detailed explanation of the site ecology and gives a brief overview of the area's climate, topography, soils, vegetation, fauna and history. The second section details the methodology for establishing a permanent plot, presented in a readily understandable manner for researchers planning to use the same methodology in other areas. Section three consists of the
< )iio field "il¡tic is
l5i(>di\Clsit\
Kilt h "iiitlf
plots , iin
a site description
38

specific information gathered at the plot, providing a foundation for comparative analysis of the plot's vegetation. The users' guides include a complete set of m a p s for each 20 x 2 0 - m quadrat in the plot, along with data sheets and a full size m a p of the plot. Whenever possible, the guides also include a "mini-herbarium" of three specimens, designed to help in identification (Box 5).
Data management and quality control
Because the data set generated by each plot can be quite large, quality control and data management are extremely important considerations. Data collection and c o m puter entries are carried out by a number of people, followed by manipulation and cleaning of the data by yet more people in the office or laboratory. For these reasons, it is critical to devise uniform, detailed methods to handle and manipulate the plot data set and to give explicit instructions for recensus exercises (Box 6).
Computer equipment
The data generated from each plot are entered, stored, and analyzed in IBM-compatible personal computers. Tree coordinates and preliminary species information are entered in the field on portable laptop computers. Later, the information on the laptop diskettes is transferred to desktop computers in the office of laboratory. At least three backup copies of the data should be kept. S I / M A B recommends the use of laptops in the field because they are lightweight and can be operated with batteries. Diskettes and internal hard drives are prone to failure in the field; therefore, several backup copies of the data should be prepared daily to prevent major disappointments.
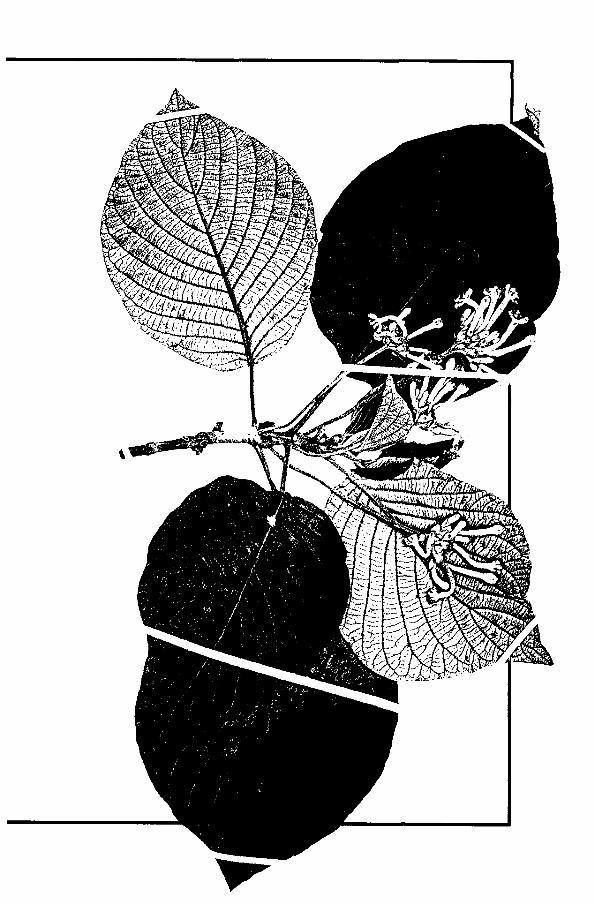
Box 5. Mini-herbarium of tree specimens
T h e Mini-herbarium is designed to help in identification.
It consists of high-resolution photocopies of dried pressed m u s e u m specimens and suffer the resulting limitations.
All photocopies are to the same scale. Species are arranged in alphabetical order by genus and species n a m e .
Right is one specimen (Guettarda viburnoides) featured in the users' guide to Beni (Dallmeier et al. 1990c).
40
Data entry
While in the field, information from each field data sheet should be transferred to laptop computer files every night so that maps can be produced for ground truthing the following day. This procedure helps ensure that errors in measurement and data entry are discovered while researchers are still on site.
Budget for time and labour
Establishing and maintaining long-term biological inventory plots can be costly and labour intensive. The costs will vary from country to country and in relation to the level of professional expertise of the people involved in the process. The rough estimates that follow are based on S I / M A B ' s experiences in setting 1-ha plots. In surveying the plot, an experienced forest survey team can usually place 10 to 15 corner stakes per day. (At Beni Biosphere Reserve, the teams averaged 15; at the Bisley Biodiversity plot where the slopes are m u c h steeper, the average was seven.) Thus, it takes approximately one week for a team of three people to set a 1-ha plot, or about 168 work-hours. Tagging trees and measuring their dbh with a team of three people should result in the completion of five 20 x 2 0 - m quadrats per day. A plot with 25 quadrats should be finished in five days, requiring about 120 work-hours. In difficult terrain, it m a y possible to set only three quadrats per day.
A six-person mapping team should be able to m a p at least two quadrats a day and also complete ground truthing of the previous day's quadrats. The total plot can therefore be mapped in 13 days. Three extra days should be allocated for checking all maps in the field: mapping would then total 16 days per plot, or 768 work-hours.
S I / M A B estimates that an experienced botanist requires about 60 days, or 480 work-hours, to complete tree identification and prepare a mini-herbarium. Data entry and generation of the quadrat maps in the field takes 16 days at five hours a day for a team of two people, or 160 work-hours. Data maintenance and the final preparation of data sheets, maps , and final users' and field guides requires the time of two people over the course of six months per 2 ha or 1920 work hours. A rough total labour budget for setting a 1-ha plot (including data gathering, entry, species identification, and production of users' and field guides) is approximately 832 work-days, or 6832 work-hours. These general estimates do not incorporate associated costs of transportation, c a m p building and maintenance, worker training,
42
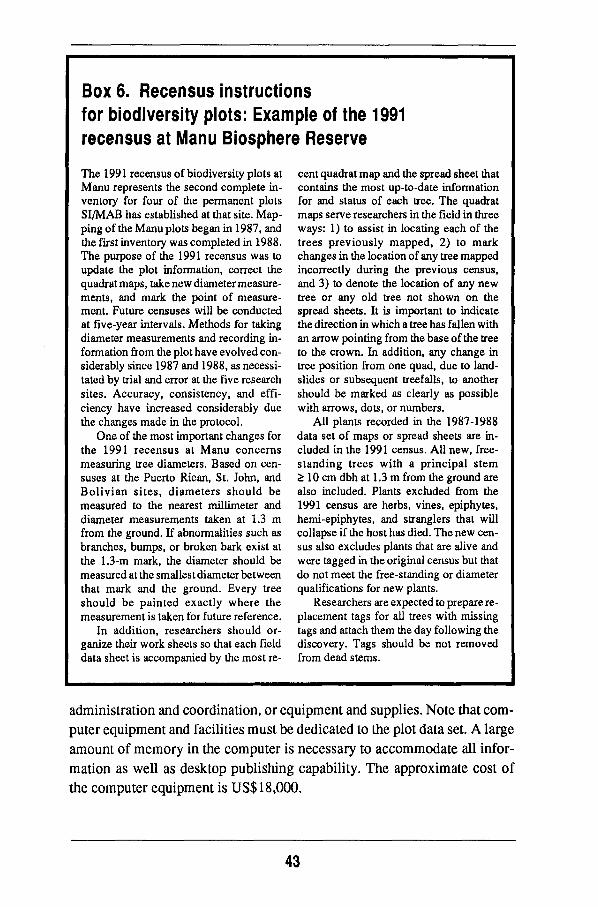
Box 6. Recensus instructions for biodiversity plots: Example of the 1991 recensus at Manu Biosphere Reserve
The 1991 recensus of biodiversity plots at M a n u represents the second complete inventory for four of the permanent plots S I / M A B has established at that site. M a p ping of the M a n u plots began in 1987, and the first inventory was completed in 1988. The purpose of the 1991 recensus was to update the plot information, correct the quadrat maps , take n e w diameter measurements, and mark the point of measurement. Future censuses will be conducted at five-year intervals. Methods for taking diameter measurements and recording information from the plot have evolved considerably since 1987 and 1988, as necessitated by trial and error at the five research sites. Accuracy, consistency, and efficiency have increased considerably due the changes m a d e in the protocol.
O n e of the most important changes for the 1991 recensus at M a n u concerns measuring tree diameters. Based on censuses at the Puerto Rican, St. John, and Bolivian sites, diameters should be measured to the nearest millimeter and diameter measurements taken at 1.3 m from the ground. If abnormalities such as branches, bumps , or broken bark exist at the 1.3-m mark, the diameter should be measured at the smallest diameter between that mark and the ground. Every tree should be painted exactly where the measurement is taken for future reference.
In addition, researchers should organize their work sheets so that each field data sheet is accompanied by the most re
cent quadrat m a p and the spread sheet that contains the most up-to-date information for and status of each tree. The quadrat maps serve researchers in the field in three ways: 1) to assist in locating each of the trees previously m a p p e d , 2) to m a r k changes in the location of any tree mapped incorrectly during the previous census, and 3) to denote the location of any n e w tree or any old tree not shown on the spread sheets. It is important to indicate the direction in which a tree has fallen with an arrow pointing from the base of the tree to the crown. In addition, any change in tree position from one quad, due to landslides or subsequent treefalls, to another should be marked as clearly as possible with arrows, dots, or numbers.
A U plants recorded in the 1987-1988 data set of maps or spread sheets are included in the 1991 census. All new, freestanding trees with a principal stem > 10 c m dbh at 1.3 m from the ground are also included. Plants excluded from the 1991 census are herbs, vines, epiphytes, hemi-epiphytes, and stranglers that will collapse if the host has died. The n e w census also excludes plants that are alive and were tagged in the original census but that do not meet the free-standing or diameter qualifications for n e w plants.
Researchers are expected to prepare replacement tags for all trees with missing tags and attach them the day following the discovery. Tags should be not removed from dead stems.
administration and coordination, or equipment and supplies. Note that c o m puter equipment and facilities must be dedicated to the plot data set. A large amount of m e m o r y in the computer is necessary to accommodate all information as well as desktop publishing capability. The approximate cost of the computer equipment is US$18,000.
43

Acknowledgements
The biological diversity monitoring project is an on-going initiative of the Smithsonian Institution/Man and the Biosphere Biological Diversity Program based in Washington, D . C . S I / M A B gratefully acknowledges the following organizations that supplied supplemental funding during the 1987-1991 period to set up the initial network of biodiversity plots: U S Agency for International D e velopment (Bureau for Latin America and the Caribbean), U S M a n and the Biosphere Program, U N E S C O , World Wildlife Fund U S , U S National Park Service, and the B I O L A T Program. The funding provided by these organizations and programmes led to this present 16th contribution to the S I / M A B series and the 36th contribution to the B I O L A T series.
Several organizations provided necessary administrative and logistical support, making the field work possible. A m o n g them are: Academia de Ciencias de Bolivia, Instituto de Ecología Universidad Mayor de San Andrés, La Paz, Bolivia; Liga para la Defenza del Medio Ambiente, Bolivia; U S Agency for International Development, Bolivia Mission; Fundación para la Conservación de la Naturaleza, Peru; Asociación Peruana para la Conservación, Peru; Ministerio de Agricultura, Peru; Institute of Tropical Forestry and the University of Puerto Rico in Río Piedras; Center for Energy and Environmental Research, Puerto Rico; and the U S National Park Service.
The following people provided valuable information and suggestions during the process of improving and changing the methodology over the past three years: James LaFrankie, Robin Foster, Steven Hubbell, Paul Durr, Frederick Scatena, and Charlotte Taylor, along with participants at the brainstorming workshop in the Great Smoky Mountains National Park (John Peine, Charles Parker, Paul Hamel, Paul Somers, Lee Reynolds, George Francis, Dennis Grossm a n , Robert Emmott , Linda M a n n , Diana Debinski, Stephanie Gebauer, David Graber, Mark Harmon, T o m Smith, Peter White, and Dan Tomlin). It is not possible to recognize here all of the many individuals w h o worked in field logistics and coordination, plot establishment, tree identification, and data entry and management. Representative of those talented and dedicated people are Terry Erwin, Carmen Miranda, Mario Baudoin, Carlos Reynel, Richard Busta-mante, Abelardo Sandoval, George Venable, Gary Ray, and Claudia R o m a n o , as well as more than one hundred participants in field courses conducted in Bolivia, Peru, and Puerto Rico. W e extend our deep gratitude to Laura Neal whose efforts made possible the logistics and coordination between the field sites and Washington, D . C .
The manuscript was much improved thanks to the editorial assistance of Deanne Kloepfer. The graphics were prepared by Ralph Walker.
44
References
Curtis, O . 1983. Procedures for Establishing and Maintaining Permanent Plots for Silvicultural and Yield Research. General Technical Report P N W - 1 5 5 . Forest Service, Pacific Northwest Forest and Range Station, Olympia, Washington.
Dallmeier, F. 1991. Biological diversity conservation in Latin America: A n uncertain perspective for the 1990s. Paper presented at First Venezuelan Congress of Ecology. Caracas (Venezuela), 15-19 April 1991.
Dallmeier, F., M . Kabel, C . Taylor, C . R o m a n o & R . Rice. 1991a. User's Guide to the Bisley Biodiversity Plots, Luquillo Biosphere Reserve, Puerto Rico. Smithsonian Institution, Washington, D . C .
Dallmeier, F., M . Kabel, C . Taylor, C . R o m a n o & R . Rice. 1991b. Field Guide to the Bisley Biodiversity Plots, Luquillo Biosphere Reserve, Puerto Rico. Smithsonian Institution, Washington, D . C .
Dallmeier, F., R . Foster, C . R o m a n o , R . Rice & M . Kabel. 1991c. User's Guide to the Beni Biosphere Reserve Biodiversity Plots. Vol. I and II. Smithsonian Institution, Washington, D . C .
Dallmeier, F., R . Foster, C . R o m a n o , R . Rice & M . Kabel. 199Id. Field Guide to the Beni Biosphere Reserve Biodiversity Plots. Vol. I, II, III, IV. Smithsonian Institution, Washington, D . C .
Durr, P . C . , L . Richmond & C . Eagar. 1988. Site Classification and Field Measurements. Methods Manual. Science Division, Great Smoky M o u n tains National Park, Gatlinburg, Tennessee.
Ehrlich, P. R . , & E . O . Wilson. 1991. Biodiversity studies: science and policy. Science. 253:758-762.
Hubbell, S.P. & R . Foster. 1986. Commonness and rarity in a neotropical forest: Implications for tropical tree conservation. In: M . Soulé (Ed.), Conservation Biology, the Science of Scarcity and Diversity, 205-234. Sinauer Associates, Sunderland, Massachusetts.
M a n n , C . C . 1991. Extinction: are ecologists crying wolf?. Science 253:736-738.
Manokaran, N . , J.V. LaFrankie, K . M . K o c h u m m e n , E . S . Quah, J.E. Klahn, P.S . Ashton & S.P. Hubbell. 1990. Methodology for the Fifty Hectare Research Plot at Pasoh Forest Reserve. Research Pamphlet N o . 104. Forest Research Institute of Malaysia, Kepong.
Myers, N . 1988. Tropical forests and their species: Going, going,...? In: E . O . Wilson (Ed.), Biodiversity, 28-35. National Academy Press, Washington, D . C .
S I / M A B (Smithsonian Institution/Man and the Biosphere) Biological Diversity Program. 1991. SI/MAB Biodiversity News Number 1 (Summer 1991). Smithsonian Institution, Washington, D . C .
45
Solbrig, 0 . T . 1991a. Biodiversity: Scientific Issues and Collaborative Research Proposals. M A B Digest 9. U N E S C O , Paris.
Solbrig, O . T . (Ed.) 19916. From Genes to Ecosystems: A Research Agenda for Biodiversity. International Union for Biological Sciences, Paris.
Soulé, M . E . 1991. Conservation: tactics for a constant crisis. Science 253:744-750.
Synnott, T.J. 1979. A Manual of Permanent Plot Procedures for Tropical Rain Forest. Tropical Forestry Papers N o . 14. Commonwealth Forestry Institute, University of Oxford, Oxford.
Terborgh, J.; Robinson, S .K . ; Parker, T . A . Ill; M u n n , C . A . ; Pierpont, N . 1990. Structure and organization of an Amazonia forest bird community. Ecological Monographs 60(2): 213-238.
Wilcove, D . S . 1987. From fragmentation to extinction. Natural Areas Journal 7: 23-29.
Wilcove, D . S . 1988. National Forests: Policies for the Future. Vol. 2. Protecting Biological Diversity. The Wilderness Society, Washington, D . C .
Wilson, E . O . (Ed.). 1988. Biodiversity. National Academy Press, Washington, D . C .
46

C A S E S T U D Y OF S I / M A B B I O L O G I C A L DIVERSITY P L O T R E S E A R C H M E T H O D O L O G Y :
Effects of Hurricane H u g o on the Bisley Biodiversity Plot, Luquillo Biosphere Reserve, Puerto Rico
Francisco Dallmeier, Charlotte M . Taylor, John C . Mayne, Margo Kabel and Richard Rice
Introduction
The Puerto Rico permanent biodiversity plot is a cooperative project
among the Smithsonian Institution/Man and the Biosphere Biological
Diversity Program ( S I / M A B ) , the Institute of Tropical Forestry (ITF),
and the Department of Biology of the University of Puerto Rico, Río Pie
dras Campus (UPR) . The plot is situated within the drainage basin of the
Bisley Experimental Watersheds of the Luquillo Experimental Forest,
also known as the Caribbean National Forest, in Puerto Rico (Fig. 1).
The permanent 25-ha research zone contains 25 one-hectare plots,
which are further divided into 25 quadrats (20 x 20 m each) in a continu
ous grid. A s of late 1991, only plot 13 had been established (Fig. 2). It
was set up in 1988 by a cooperative team under the direction of the
S I / M A B staff. Establishing the plot served to demonstrate the plot meth
odology and as a starting point for research. All trees in the plot have
been mapped, marked, and identified. T w o censuses have been conducted
since Hurricane Hugo passed over the site in September 1989.
The plot area is not primary forest. The site was subject to selective
logging and some agriculture until 1934 when it was purchased by the
U S Forest Service (Scatena 1989). Selective logging for valuable timber
species was apparently not thorough, however, because some large, c o m
mercially valuable trees remain.
It is likely that charcoal-making had the greatest impact on the forest.
Workers in this cottage industry selectively cut certain species; the
downed trees were then burned in situ. O n e result was a significant
47
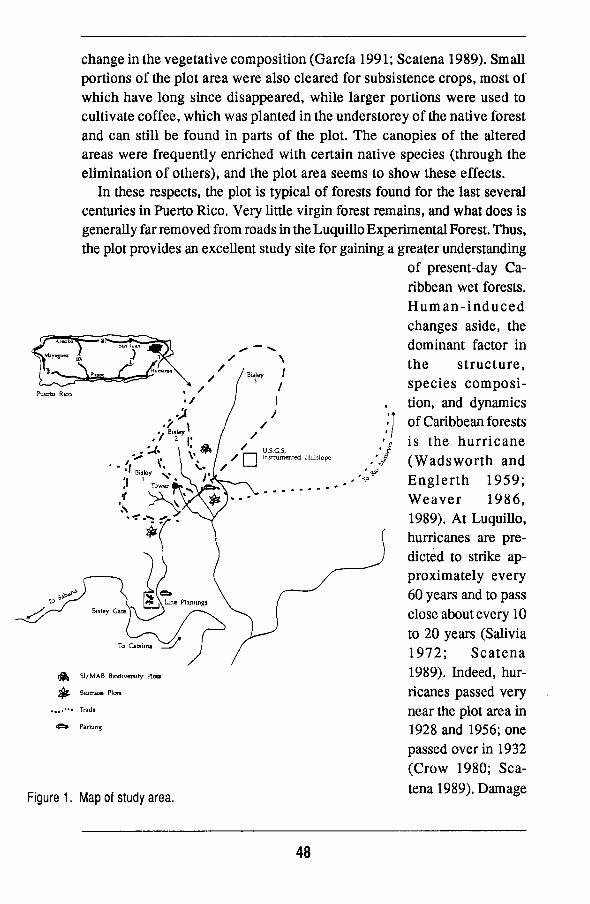
change in the vegetative composition (Garcia 1991; Scatena 1989). Small
portions of the plot area were also cleared for subsistence crops, most of
which have long since disappeared, while larger portions were used to
cultivate coffee, which was planted in the understorey of the native forest
and can still be found in parts of the plot. The canopies of the altered
areas were frequently enriched with certain native species (through the
elimination of others), and the plot area seems to show these effects.
In these respects, the plot is typical of forests found for the last several
centuries in Puerto Rico. Very little virgin forest remains, and what does is
generally far removed from roads in the Luquillo Experimental Forest. Thus,
the plot provides an excellent study site for gaining a greater understanding
of present-day C a
ribbean wet forests.
H u m a n - i n d u c e d
changes aside, the
dominant factor in
the structure,
species composi
tion, and dynamics
of Caribbean forests
is the hurricane
(Wadsworth and
Englerth 1959;
W e a v e r 1986,
1989). At Luquillo,
hurricanes are pre
dicted to strike ap
proximately every
60 years and to pass
close about every 10
to 20 years (Salivia
1972; Scatena
1989). Indeed, hur
ricanes passed very
near the plot area in
1928 and 1956; one
passed over in 1932
(Crow 1980; Sca
tena 1989). D a m a g e
•U . S . C . S . Instrumented Hillslope
Biotnaa Plots
Parking
Figure 1. M a p of study area.
48

done by these storms and subsequent regeneration greatly influence the vegetation that exists there today.
Data available from the spatial and long-term studies for which the plot was designed are augmented by the intensive monitoring of physical factors on the site as part of the ITF Experimental Watersheds project. For most tropical areas, long-term monitoring of a few environmental factors is available only under ideal conditions, while broad regional generalizations usually consist of only climate descriptions. But at Luquillo, 50 years of intensive study has occurred (Brown et al. 1983, Lugo 1986), and detailed data dating back several years are available. In addition, the Bisley project is directed at accurate measurements of temperature, rainfall, stream flow, erosion, and nutrient movements within the plot.
The research value of the biodiversity plot increased further - and quickly - due to the strike by Hurricane H u g o (a Class IV hurricane) on 19 September 1989. The eye of H u g o passed within 10 k m of the plot. The hurricane carried sustained winds estimated at more than 120 miles (192 k m ) per hour with gusts as high as 200 miles (320 k m ) per hour. H u g o passed to the east and northeast of the Luquillo massif, the aspect on which the plot is located. The strongest winds of the hurricane struck from the north and northwest, and the mostly northwest-facing slopes of the plot thus received the full force of the storm.
Although m a n y areas in the Luquillo forest have been studied and enumerated, the S I / M A B permanent plot is the only area in which all trees > 10 c m in diameter at breast height (dbh) were marked adequately for relocation. The data from the plot represent a complete enumeration of hurricane effects and will serve as the basis for determining an estimate of error (through a count of trees completely missing or located only by inference under debris piles) for post-hurricane survey studies at other sites.
El Verde Field Station, administered by the Center for Energy and E n vironment Research ( C E E R ) , is also located in the Luquillo Experimental Forest. This field station was established in the early 1960s and has been the site of m a n y intensive and long-term studies (Brown etal. 1983). El Verde sits on the western, somewhat drier side of the Luquillo massif. Long-term study areas have been established there, and n e w ones are being set up using methodology similar to that of the Hubbell and Foster Barro Colorado Island plot (Hubbell and Foster 1983). Comparisons between the S I / M A B plot and the El Verde study sites will offer a further dimension to forest research in Puerto Rico.
49

Methods
The methods used in establishing and censusing S I / M A B plots are described in the first part of this digest (Dallmeier et al. 1992). W e refer the reader to that section for details about plot design and survey; tree tagging, measurement, identification, and mapping; computer software and data management and control; preparation of users' and field guides; and estimates of time and labour. The description of the methods below are limited to factors specific to the Bisley plot.
Specific plot location and description
The Bisley Biodiversity plot in Puerto Rico is located at approximately 18'18'N 6 5 ' 5 0 ' W , ranging in elevation from 285 to 326 m (Fig. 1). It was set up in M a y 1988. Tree identification and m a p detail were checked in the field in January 1989. N o voucher specimens were m a d e because the tree flora of the Luquillo Forest is well known. Identifications were made by C M . Taylor (UPR) and checked in the field for confirmation by I. Pérez (ITF) and C . Rivera (ITF). A mini-herbarium was prepared as
Figure 2 . M a p of Bisley Biodiversity Plot 0113, showing location of trees after Hurricane Hugo as censused in 1991. Circles mark standing tree trunk positions and are proportional to dbh. Arrows indicate direction in which trees fell and are not proportional to tree size.
f
• •
• : s
•*
• u
• t
* « — • »
• •
,«©
\
•*•
*a
k
•1
—
• i
• J
M
• 2
.a
"•
• n.«
• •
.i
«%M
• u
/ i * • 1
l4
• ' \
\
• -
.J
• I
• a
• i
• •*
/
.»
*4
*
• «
1
50

í
—
L - " " •' -• H
• " '" . M
l
.ï
\
„
• t
. , • »
• \ ^
• *
-*
/ '
J v Í 1
/ -• 1
1
r \-1 1 ' \ .
- / ••
• r
i
1 •<
•si - ••
• .
• t
• t
1
j%
• •
\ • >
• 1*
~ \ . . v 1
• <• «Il
• .1
• H . •
• *
.,4-\ . -
. /
! "
** u
* * 1
.Ï'
— !r • »
•* i
• t
\ . .
• J
\
**
• M
• M
-
^
\
** •i «.
• « • -
*
• *
. • • > « • — • <
-~-r
1
• il • to
. M
•" '" /
•* 1 *
•s
,
•
/
\ ^
.1
• • ii
' » •
• • • •
• 1 . r •
«t
••
• o.u .,
• 4 »
\
• •
• . "" •-
/ - /
/ • l
• < «la u
\
*• • *
•* x - \
x - ' . . . \ . \
51

part of the Bisley users' and field guides (Dallmeier et al. 1991a, 19916). The plot was censused again in February 1990 and March 1991.
Data were recorded for each tree in the original (1988) census. In the 1990 and 1991 censuses, after Hurricane H u g o had passed over the site, diameters were measured again, and descriptions of the trees were made according to the following conditions: missing or located; in the same position or
m o v e d significantly; dead or alive; standing, leaning, or fallen; coppicing (showing regeneration from the trunk or base, including sprouting); and amount of damage to the crown, categorized as broken (the entire crown broken off at the trunk), heavy damage (most or all branches removed), medium d a m a g e (one to three major branches remaining), or low damage (four or more branches remaining). In the 1990 census, the degree of slope and aspect were recorded for each quadrat in the plot.
The Bisley plot is located in the subtropical wet forest zone (Holdridge 1971), or wet pre-montane forest zone (Ewel and Whitmore 1973). The climate is tropical, with an average annual temperature of 18 to 25 " C and an average annual fluctuation of 5°C (Scatena 1989). Average yearly rainfall is approximately 3000 to 4000 m m (Brown et al. 1983, Scatena 1989). The site is drained by a stream that passes
The eye of Hurricane Hugo passed within 10 km of the plot ta, . northeastern comer on September 19,1989. The hurricane carried sustained t n r o u g t l m e n o r m e a s t e m c o r n e r
winds estimated at more than 120 miles per hour with gusts of the plot. Land near the stream as high as 200 miles per hour. Here we can see the effects ¡s relatively flat, rising as one of the hurricane five months later in February 1990.
52
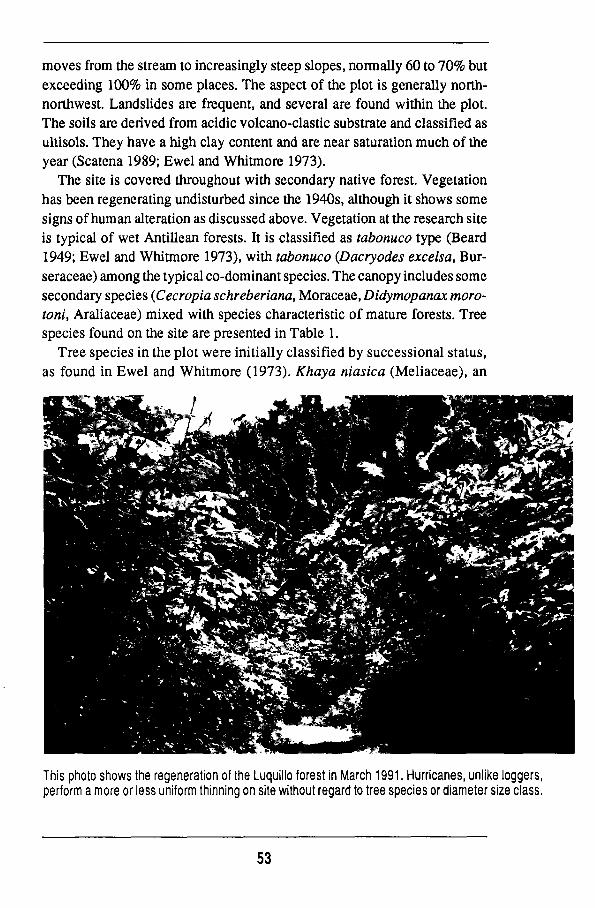
moves from the stream to increasingly steep slopes, normally 60 to 70% but exceeding 100% in some places. The aspect of the plot is generally north-northwest. Landslides are frequent, and several are found within the plot. The soils are derived from acidic volcano-clastic substrate and classified as ultisols. They have a high clay content and are near saturation m u c h of the year (Scatena 1989; Ewel and Whitmore 1973).
The site is covered throughout with secondary native forest. Vegetation has been regenerating undisturbed since the 1940s, although it shows some signs of h u m a n alteration as discussed above. Vegetation at the research site is typical of wet Antillean forests. It is classified as tabonuco type (Beard 1949; Ewel and Whitmore 1973), with tabonuco (Dacryodes excelsa, Bur-seraceae) among the typical co-dominant species. The canopy includes some secondary species (Cecropia schreberiana, Moraceae, Didymopanax moro-toni, Araliaceae) mixed with species characteristic of mature forests. Tree species found on the site are presented in Table 1.
Tree species in the plot were initially classified by successional status, as found in Ewel and Whitmore (1973). Khaya niasica (Meliaceae), an
This photo shows the regeneration of the Luquillo forest in March 1991. Hurricanes, unlike loggers, perform a more or less uniform thinning on site without regard to tree species or diameter size class.
53
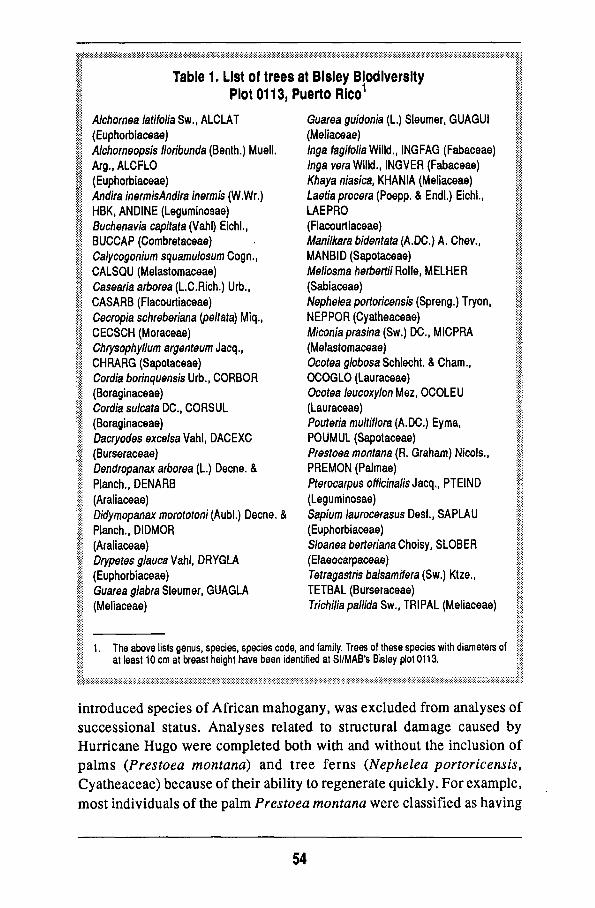
Table 1. List of trees at Blsley Biodiversity Plot 0113, Puerto Rico
Alchomea latifolia S w . , A L C L A T (Euphorbiaceae) Alchorneopsis floribunda (Benth.) Muell. Arg., A L C F L O (Euphorbiaceae) Andira inermisAndira ¡nermis (W.Wr.) H B K , A N D I N E (Leguminosae) Buchenavia capitata (Vahl) Eichl., B U C C A P (Combretaceae) Calycogonlum squamulosum Cogn. , C A L S Q U (Melastomaceae) Casearia arbórea (L.C.Rich.) Urb., C A S A R B (Flacourtiaceae) Cecropia schreberiana (pe/fara) Miq., C E C S C H (Moraceae) Chrysophyllum argenteum Jacq., C H R A R G (Sapotaceae) Cordia borinquensis Urb., C O R B O R (Boraginaceae) Cordia sulcata D C . , C O R S U L (Boraginaceae) Dacryodes excelsa Vahl, D A C E X C (Burseraceae) Dendropanax arbórea (L.) Decne. & Planch., D E N A R B (Araliaceae) Didymopanax morototoni (Aubl.) Decne. & Planch.. D I D M O R (Araliaceae) Drypefesg/aucaVahl, D R Y G L A (Euphorbiaceae) Guarea glabra Sleumer, G U A G L A (Meliaceae)
Guarea guidonia (L.) Sleumer, G U A G U I (Meliaceae) Inga fagifoliaW\\\d., INGFAG (Fabaceae) Inga vera Willd., INGVER (Fabaceae) Khaya niasica, KHANIA (Meliaceae) Laetia procera (Poepp. & Endl.) Eichl., L A E P R O (Flacourtiaceae) Manilkara bidentata (A.DC.) A . Chev., M A N B I D (Sapotaceae) Meliosma herbertii Rolle, M E L H E R (Sabiaceae) Nephelea portoricensis (Spreng.) Tryon, N E P P O R (Cyatheaceae) Miconiaprasina (Sw.) D C , M I C P R A (Melastomaceae) Ocotea globosa Schlecht. & C h a m . , O C O G L O (Lauraceae) Ocotea leucoxylon Mez , O C O L E U (Lauraceae) Pouteria multiflora (A.DC.) E y m a , P O U M U L (Sapotaceae) Prestoea montana (R. Graham) Niçois., P R E M O N (Palmae) Pterocarpus officinalis Jacq., PTEIND (Leguminosae) Sapium laurocerasus Desf., S A P L A U (Euphorbiaceae) Sloanea berteriana Choisy, S L O B E R (Elaeocarpaceae) Tetragastris balsamlfera (Sw.) Ktze., T E T B A L (Burseraceae) Trichilia pallida S w . , TRIPAL (Meliaceae)
1. The above lists genus, species, species code, and family. Trees of these species with diameters of at least 10 cm at breast height have been Identified at SI/MAB's Bisley plot 0113.
introduced species of African mahogany, was excluded from analyses of successional status. Analyses related to structural damage caused by Hurricane H u g o were completed both with and without the inclusion of palms (Prestoea montana) and tree ferns (Nephelea portoricensis, Cyatheaceae) because of their ability to regenerate quickly. For example, most individuals of the palm Prestoea montana were classified as having
54

sustained low damage, even though in the majority of cases their fronds had been stripped from the stems by the.force of the hurricane's winds. Nearly all of these plants refoliated soon after H u g o ; classifying them in the high crown damage category would have been misleading.
Formulas used to calculate the basal area, relative density, relative dominance, frequency, relative frequency, relative diversity, and the im-portant value index (IVI) are as follows (Balslev et al., 1987):
Basal area (b.a.) = area occupied at breast height
Relative density • # individuals of a species X 1 0 0
total # individuals of all species.
D „ i n ( ; , „ ^ : n , B , n combined b.a. of a single species v .nr i Relative dominance = 5 — c X 100 total b.a. of all species
Frequency = number of quadrats in which a species is found
Relative frequency = frequency of one species X 1 0 0
s u m of all frequencies
Relative diversity = » of species in one family X 1 0 Q
total # of species
Importance Value = sum of relative density, Index (IVI) relative dominance, and relative frequency
The relatively small amount of damage suffered by the palm Prestoea montana compared to dicotyledonous tree species is most likely due to its growth form. These palm trees have a single unbranched stem, with the two to six leaves produced in a group at the top. The leaves of most surviving palms were all damaged and m a n y of the stems were completely defoliated, but new leaves quickly appeared. Most of the palms censused were relatively short, reaching only the tall understory or lower sub-canopy. The response of these palms to Hugo's wind damage m a y provide a clue to the origin of the large pure stands of palms that characterize the wetter, more exposed forest zones in Puerto Rico. Basal area = the basal area (m ) of individuals of a particular species as a proportion
of the total basal areas of all species. Relative density = number of individuals of a particular species as a proportion of
the total number of individuals of all species. Relative dominance = the combined basal area of a single species as a proportion of
the total basal area of all species. Relative frequency = the frequency of a given species as a proportion of the sum of
frequencies for all species. Relative diversity = number of species in one family as a proportion of the total
number of species. Importance Value Index (IVI) = the sum of relative density, relative dominance,
and relative frequency.
55
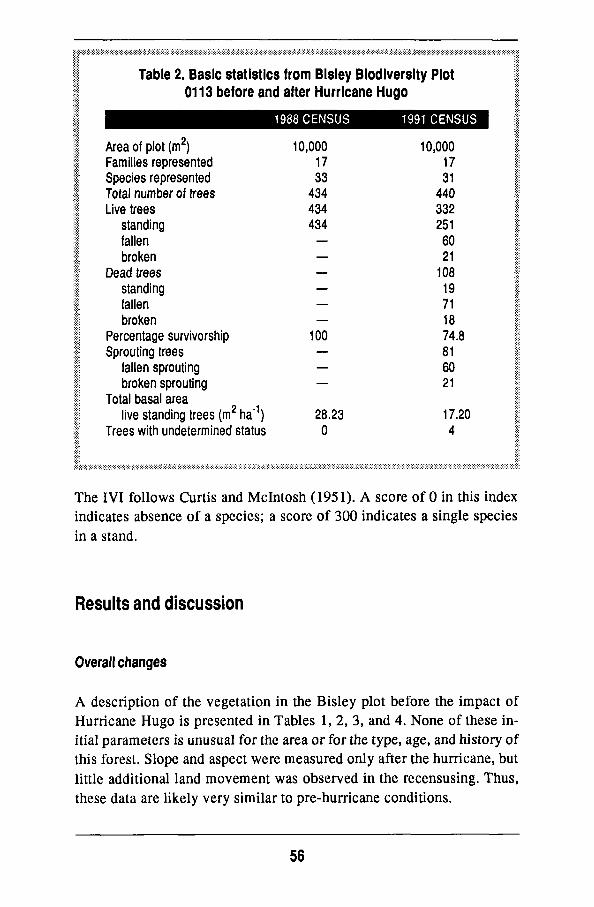
Table 2. Basic statistics from Blsley Biodiversity Plot 0113 before and after Hurricane Hugo
Area of plot (m2) Families represented Species represented Total number of trees Live trees
standing fallen broken
Dead trees standing fallen broken
Percentage survivorship Sprouting trees
fallen sprouting broken sprouting
Total basal area live standing trees (m2 ha"1)
Trees with undetermined status
1988 CENSUS
10,000
17 33
434 434 434
— — — — — —
100 — — —
28.23
0
1991 CENSUS
10,000 17 31
440 332 251 60 21
108 19 71 18 74.8
81 60 21
17.20
4
The IVI follows Curtis and Mcintosh (1951). A score of O in this index indicates absence of a species; a score of 300 indicates a single species in a stand.
Results and discussion
Overall changes
A description of the vegetation in the Bisley plot before the impact of Hurricane H u g o is presented in Tables 1, 2 , 3, and 4. N o n e of these initial parameters is unusual for the area or for the type, age, and history of this forest. Slope and aspect were measured only after the hurricane, but little additional land movement was observed in the recensusing. Thus, these data are likely very similar to pre-hurricane conditions.
56

Species
Table 3.1988 pre-Hurrlcane Hugo data, by tree species, from Bisiey Biodiversity Plot 0113
Number Average Basal Relative Relative Relative IVI of stems dbh (m) area density dominance frequency
Alchomea latifoüa Alchomeopsis
floribunda Andira inermis Buchenavia capitata Calycogonium
squamulosum Casearia arbórea Cecropia schreberiana Chrysophyllum
argenteum Cordia borinquensis Cordia sulcata Dacryodes excelsa Dendropanax arbórea Didymopanax
morototonl Drypetes glauca Guarea glabra Guarea guidonia Inga fagifolia Inga vera Khaya niasica Laetia procera Manilkara bidentata Meliosma herbertii Nephelea portoricensis Miconia prasina Ocotea globosa Ocotea leucoxylon Prestoea montana Pouteria multiflora Sapium laurocerasus Sloanea berteriana Tetragastris balsamilera Trichilia pallida Pterocarpus officinalis
3
11 2 1
1 2 8
9 1 1
39 2
16 1 3
19 42
5 4 2
13 2 4 1 1 3
135 2
17 80
2 1 1
0.22
0.40 0.17 0.86
0.13 0.16 0.36
0.20 0.10 0.19 0.42 0.17
0.28 0.20 0.15 0.41 0.23 0.21 0.14 0.22 0.34 0.20 0.13 0.14 0.20 0.14 0.17 0.11 0.30 0.19 0.10 0.11 0.70
0.16
1.97 0.05 0.58
0.01 0.04 0.94
0.36 0.01 0.03 6.93 0.03
1.20 0.03 0.06 3.25 2.35 0.21 0.06 0.09 1.48 0.08 0.06 0.02 0.03 0.05 3.83 0.02 1.34 2.93 0.02 0.01 0.38
0.69
2.53 0.46 0.23
0.23 0.46 1.84
2.07 0.23 0.23 8.99 0.46
3.69 0.23 0.69 4.38 9.68 1.15 0.92 0.46 3.00 0.46 0.92 0.23 0.23 0.69
31.11 0.46 3.92
18.43 0.46 0.23 0.23
0.57
6.98 0.18 2.05
0.04 0.14 3.33
1.28 0.04 0.11
24.55 0.11
4.25 0.11 0.21
11.51 8.32 0.74 0.21 0.32 5.24 0.28 0.21 0.07 0.11 0.18
13.57 0.07 4.75
10.38 0.07 0.04 1.35
1.59
4.23 1.06 0.53
0.53 1.06 3.17
3.17 0.53 0.53 9.52 1.06
5.29 0.53 1.59 5.82
10.58 2.65 1.59 0.53 4.76 1.06 1.59 0.53 0.53 1.59
13.23 1.06 5.82
12.17 1.06 0.53 0.53
2.85
13.75 1.70 2.81
0.79 1.66 8.35
6.52 0.79 0.87
43.06 1.63
13.23 0.87 2.49
21.71 28.58
4.54 2.72 1.31
13.00 1.80 2.72 0.83 0.87 2.46
57.90 1.59
14.48 40.98
1.59 0.79 2.11
The total number of trees in the 1988 census > 10 c m dbh was 434
(Table 2). Only live standing trees were measured in this first census. The
total number of trees in the 1991 census was 444. It appears that ten trees
57

Table 4.1990-91 post-Hurricane Hugo data, by tree species, from Bisley Biodiversity Plot 0113
Species
Alchnorneopsis floribunda
Alchomea latifolla Andira ¡nermis Buchenavia
capitata Calycogonlum
squamulosu Casearia arbórea Cecropia
schreberiana Chrysophyllum
argenteum Cordia borinquensis Cordia sulcata Dacryodes excelsa Dendropanax
arbórea Dldymopanax
morototoni Drypetes glauca Guarea glabra Guarea guldonia Inga fagifolia Inga vera Khaya niasica Laetla procera Manllkara
bldentata Meliosma herbertil Miconia praslna Nephelea
portorlcensis Ocotea globosa Ocotea leucoxylon Pouteria multi flora Prestoea montana Pterocarpus
officinalis Saplum
laurocerasus Sloanea berteriana Tetragastris
balsamifer Trichilia pallida
N u m b e r of live stems
7 1 2
1
0 1
1
3 0 0
33
1
6 1 1
12 17 1 2 0
7 0 1
2 0 1 1
99
1
7 38
3 1
Average dbh(m)
0.479 0.095 0.161
0.825
0.000 0.145
0.583
0.160 0.000 0.000 0.413
0.096
0.336 0.129 0.119 0.450 0.215 0.168 0.152 0.000
0.267 0.000 0.141
0.107 0.000 0.122 0.111 0.150
0.617
0.334 0.217
0.204 0.115
Basal area
1.403 0.007 0.041
0.535
0.000 0.017
0.267
0.070 0.000 0.000 5.396
0.007
0.649 0.013 0.011 2.561 0.824 0.022 0.041 0.000
0.444 0.000 0.016
0.018 0.000 0.012 0.010 1.800
0.299
0.661 1.923
0.147 0.010
Relative density
2.789 0.398 0.797
0.398
0.000 0.398
0.398
1.195 0.000 0.000
13.147
0.398
2.390 0.398 0.398 4.781 6.773 0.398 0.797 0.000
2.789 0.000 0.398
0.797 0.000 0.398 0.398
39.442
0.398
2.789 15.139
1.195 0.398
Relative dominance
8.155 0.041 0.238
3.110
0.000 0.099
1.552
0.407 0.000 0.000
31.365
0.041
3.772 0.076 0.064
14.886 4.790 0.128 0.238 0.000
2.581 0.000 0.093
0.105 0.000 0.070 0.058
10.463
1.738
3.842 11.178
0.854 0.058
Relative frequency
5.469 0.781 1.563
0.781
0.000 0.781
0.781
2.344 0.000 0.000
14.063
0.781
3.906 0.781 0.781 7.031 8.594 0.781 1.563 0.000
3.906 0.000 0.781
1.563 0.000 0.781 0.781
19.531
0.781
4.688 13.281
2.344 0.781
IVI
16.413 1.220 2.598
4.289
0.000 1.278
2.732
3.946 0.000 0.000
58.575
1.220
10.069 1.255 1.244
26.698 20.156
1.308 2.598 0.000
9.276 0.000 1.273
2.464 0.000 1.249 1.238
69.436
2.918
11.318 39.598
4.393 1.238
Frequency
7 1 2
1
0 1
1
3 0 0
18
1
5 1 1 9
11 1 2 0
5 0 1
2 0 1 1
25
1
6 17
3 1
58

< 10 cm dbh grew to measurable size by the time of the 1991 census. (Sca-tena [pers. c o m m . ] suggests these 10 trees may have been missed in the first measurement because the average increase in dbh per year is approximately 0.35 c m ) .
The number of plant families represented on the plot both before and after the hurricane was 17, but the number of species found on the site decreased from 33 before the hurricane to 31 afterward (Table 2). Each of the lost species - Cordia sulcata (Boraginaceae) and Ocotea globosa (Lauraceae) - was represented by only one individual in the 1988 census; both trees were killed by the hurricane.
In 1988, the total basal area occupied by all trees on the site > 10 c m dbh was 28.2 m . Due primarily to mortality directly attributable to Hur-ricane Hugo, the occupied basal area decreased to 17.2 m in 1991 (Table 2), or 60.9% of the occupied basal area in 1988.
The five species that represented the largest basal area in 1988 were Dacryodes excelsa (6.9 m ), Prestoea montana (3.8 m ), Guarea guido-
1 2 2 nia (3.3 m ), Sloanea berteriana (2.9 m ), and Inga fagifolia (2.4 m ) (Table 3). Together, these five species represented 68.3% of the occupied basal area of the plot. After Hurricane Hugo, the basal areas of these five species dropped, respectively, to 5.4 m (22% loss), 1.8 m (53% loss), 2.6 m 2 (21% loss), 1.9 m 2 (35% loss), and 0.8 m 2 (65% loss). Together they occupied a total of 72.7% of the 1991 basal area (Table 4).
In the 1991 census, 251 live trees were standing, representing a decrease of 43% in live standing stems (Fig. 3). Seventy-eight fallen trees were alive and sprouting, 18 of which had broken trunks. However, none of the sprouts had grown to a stage where they could be assumed to have survived; m o r e time must pass to assess their survival rate. Of a total of 108 dead trees found in the post-hurricane census, 19 were standing in March 1991, while 18 were broken and
Live standing
57%
Dead fallen 16%
Dead broken 4 %
Dead standing 4%
Live fallen 14%
Live broken 5%
Figure 3. Status of trees in Bisley Biodiversity Plot 0113 after Hurricane Hugo, 1990 and 1991 censuses.
59
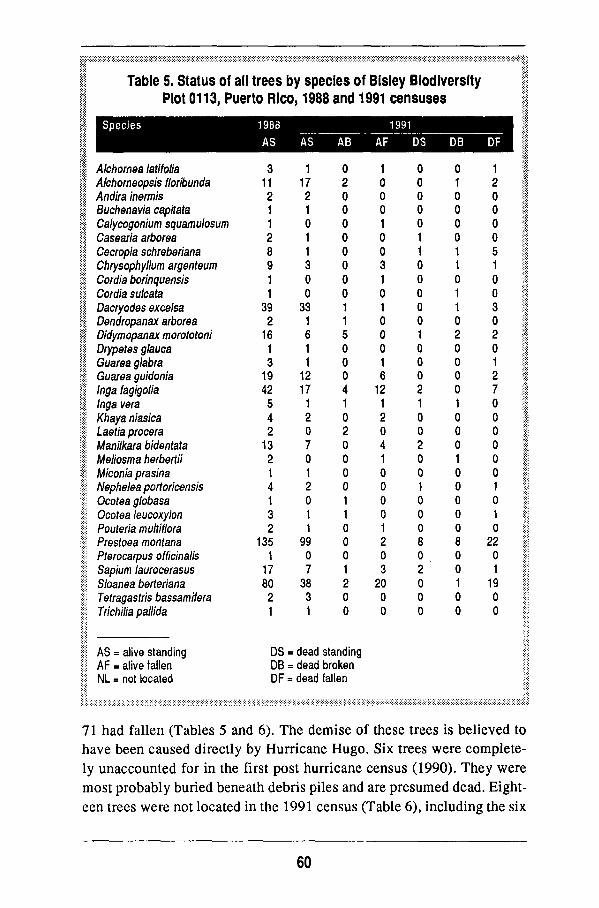
Table 5. Status of all trees by species of Bisley Biodiversity Plot 0113, Puerto Rico, 1988 and 1991 censuses
Alchomea latifolia Alchomeopsis floribunda Analta inermis Buchenavia capltata Calycogonium squamulosum Casearia arbórea Cecropia schreberiana Chrysophyllum argenteum Cordia borinquensis Cordia sulcata Dacryodes excelsa Dendropanax arbórea Dldymopanax morototoni Drypetes glauca Guarea glabra Guasea guidonia Inga faglgolia Inga vera Khaya niasica Laetia procera ManHkara bidentata Mellosma herbertu Miconia prasina Nephelea portoricensis Ocotea globasa Ocotea leucoxylon Pouterla multlflora Prestoea montana Pterocarpus officinalis Sapium laurocerasus Sloanea berteriana Tetragastris bassamlfera Trichllia pallida
A S = alive standing A F = alive fallen N L = not located
3 11 2 1 1 2 8 9 1 1
39 2
16 1 3
19 42 5 4 2
13 2 1 4 1 3 2
135 1
17 80 2 1
D S = D B = DF =
1 17 2 1 0 1 1 3 0 0
33 1 6 1 1
12 17 1 2 0 7 0 1 2 0 1 1
99 0 7
38 3
0 2 0 0 0 0 0 0 0 0 1 1 5 0 0 0 4 1 0 2 0 0 0 0 1 1 0 0 0 1 2 0
1 0
= dead standing = dead broken = dead fallen
1 0 0 0 1 0 0 3 1 0 1 0 0 0 1 6
12 1 2 0 4 1 0 0 0 0 1 2 0 3
20 0 0
0 0 0 0 0 1 1 0 0 0 0 0 1 0 0 0 2 1 0 0 2 0 0 1 0 0 0 8 0 2 0 0 0
0 1 0 0 0 0 1 1 0 1 1 0 2 0 0 0 0 1 0 0 0 1 0 0 0 0 0 8 0 0 1 0 0
1 2 0 0 0 0 5 1 0 0 3 0 2 0 1 2 7 0 0 0 0 0 0 1 0 1 0
22 0 1
19 0 0
71 had fallen (Tables 5 and 6). The demise of these trees is believed to have been caused directly by Hurricane H u g o . Six trees were completely unaccounted for in the first post hurricane census (1990). They were most probably buried beneath debris piles and are presumed dead. Eighteen trees were not located in the 1991 census (Table 6), including the six
60
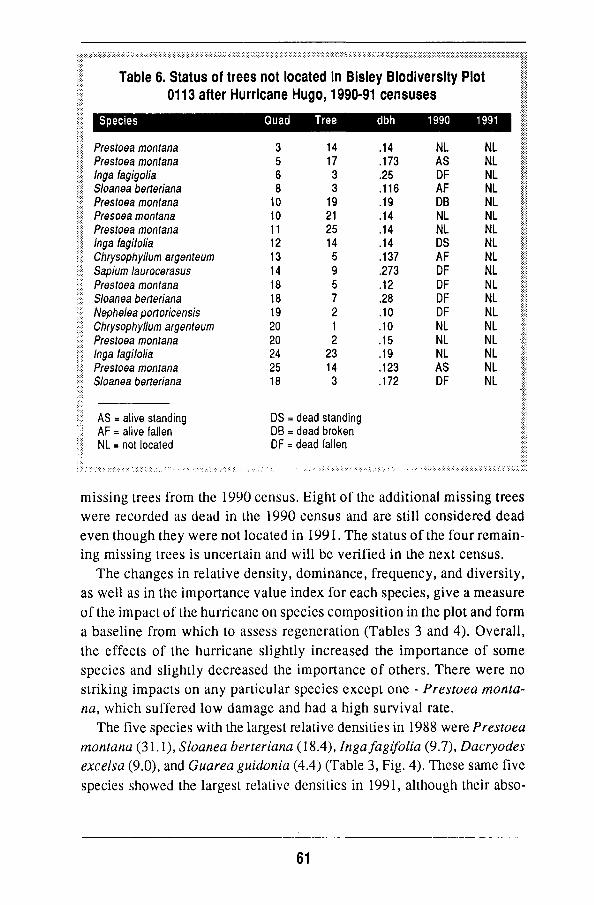
Table 6. Status of trees not located in Blsley Biodiversity Plot 0113 after Hurricane Hugo, 1990-91 censuses
Species
Prestoea montana Prestoea montana Inga íagigolla Sloanea bertehana Prestoea montana Presoea montana Prestoea montana Inga íagiíolia Chrysophyllum argenteum Sapium ¡aurocerasus Prestoea montana Sloanea berteriana Nephelea portoricensis Chrysophyllum argenteum Prestoea montana Inga íagiíolia Prestoea montana Sloanea berteriana
A S = alive standing AF = alive fallen NL = not located
Quad
3 5 6 8
10 10 11 12 13 14 18 18 19 20 20 24 25 18
D S = DB = DF =
Tree
14 17 3 3
19 21 25 14 5 9 5 7 2 1 2
23 14 3
: dead standing : dead broken dead fallen
dbh
.14
.173
.25
.116
.19
.14
.14
.14
.137
.273
.12
.28
.10
.10
.15
.19
.123
.172
1990
NL AS DF AF DB NL NL DS AF DF DF DF DF NL NL NL AS DF
1991
NL NL NL NL NL NL NL NL NL NL NL NL NL NL NL NL NL NL
missing trees from the 1990 census. Eight of the additional missing trees
were recorded as dead in the 1990 census and are still considered dead
even though they were not located in 1991. The status of the four remain
ing missing trees is uncertain and will be verified in the next census.
The changes in relative density, dominance, frequency, and diversity,
as well as in the importance value index for each species, give a measure
of the impact of the hurricane on species composition in the plot and form
a baseline from which to assess regeneration (Tables 3 and 4). Overall,
the effects of the hurricane slightly increased the importance of some
species and slightly decreased the importance of others. There were no
striking impacts on any particular species except one - Prestoea monta
na, which suffered low damage and had a high survival rate.
The five species with the largest relative densities in 1988 were Prestoea
montana (31.1), Sloanea berteriana (18.4), ¡ngafagifolia (9.7), Dacryodes
excelsa (9.0), and Guarea guidonia (4.4) (Table 3, Fig. 4). These same five
species showed the largest relative densities in 1991, although their abso-
61

lute densities and relative
ranking had changed: Pres
toea montana (39.4), Slo-
nea berteriana (15.1), Dac-
ryodes excelsa (13.2), Inga
fagifolia (6.8), and Guarea
guidonia (4.8) (Table 4).
The five species with the
largest relative dominance
in 1988 were Dacryodes ex
celsa (24.6), Prestoea mon
tana (13.6), Guarea guido
nia (11.5), Slonea berteria
na (10.4) , and Inga
fagifolia (8.3) (Table 3).
The five species with the
largest relative dominance
in 1991 were Dacryodes ex
celsa (31.4), Guarea guido
nia (14.9), Sloanea berte
riana (11.2) , Prestoea
montana (10.5) and Inga
fagifolia (4.8) (Table 4).
Again, the most dominant species remained the same after the hurricane, al
though their order of dominance was altered.
The five species with the largest relative frequency in 1988 were Prestoea
montana (13.2), Sloanea berteriana (12.2), Ingafagifolia (10.6), Dacryodes
excelsa (9.5), and Guarea guidonia (5.8) (Table 3); the order of these species
is the same as for relative density, although this is not necessarily always the
case. In 1991, after Hurricane Hugo, the five species with the largest relative
frequency were Prestoea montana (19.5), Dacryodes excelsa (14.1), Sloanea
berteriana (13.3), Ingafagifolia (8.6), and Guarea guidonia (7.0) (Table 4).
1. T h e order of these species is the same as those for basal area, which is not surprising because calculation of relative dominance depends on basal area figures. These are the same five species that show the highest relative density, although their order differs due to differences in the diameters of the trees. If all trees of all species had the same dbh, then relative density would equal relative dominance. W h e n the relative dominance of one species is greater than that of another species with a larger relative density, this indicates that the species with the greater relative dominance has fewer trees but more total basal area; i.e., fewer but larger trees.
a) Prestoea montana a) Prestoea montana
b) Sloanea berteriana b) Sloanea berteriana
Figure 4 . M a p s showing distribution, before (left side) and after (right side) Hurricane H u g o , of the five species with the highest relative density in Bisley Biodiversity Plot 0113.
62
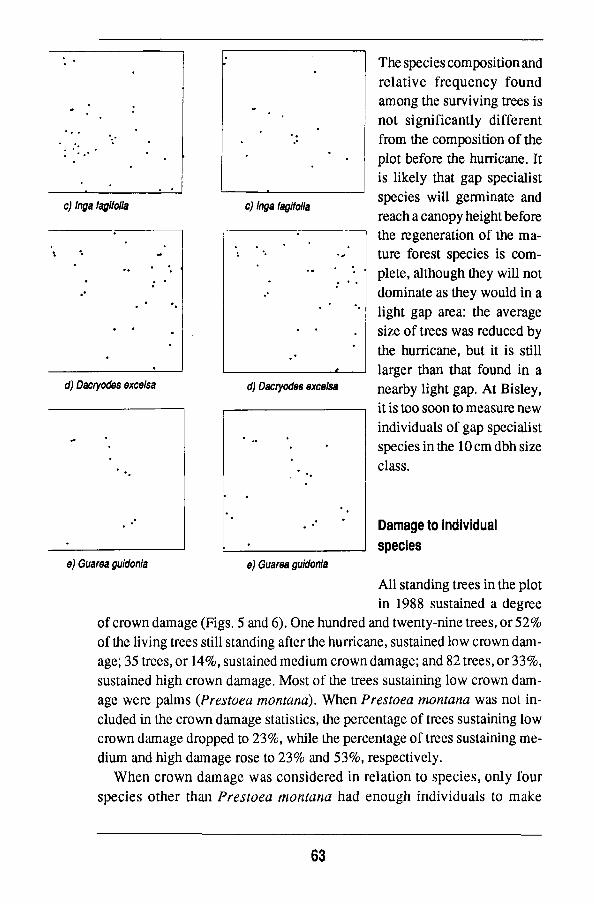
c) Inga tagifolia c) Inga fagi folla
d) Dacryodes excelsa d) Dacryodes excelsa
The species composition and
relative frequency found
among the surviving trees is
not significantly different
from the composition of the
plot before the hurricane. It
is likely that gap specialist
species will germinate and
reach a canopy height before
the regeneration of the m a
ture forest species is c o m
plete, although they will not
dominate as they would in a
light gap area: the average
size of trees was reduced by
the hurricane, but it is still
larger than that found in a
nearby light gap. At Bisley,
it is too soon to measure n e w
individuals of gap specialist
species in the 10 c m dbh size
class.
Damage to Individual
species e) Guarea guidonia e) Guatea guidonia
All standing trees in the plot
in 1988 sustained a degree
of crown damage (Figs. 5 and 6). O n e hundred and twenty-nine trees, or 52%
of the living trees still standing after the hurricane, sustained low crown d a m
age; 35 trees, or 14%, sustained medium crown damage; and 82 trees, or 33%,
sustained high crown damage. Most of the trees sustaining low crown d a m
age were palms (Prestoea montana). W h e n Prestoea montana was not in
cluded in the crown damage statistics, the percentage of trees sustaining low
crown damage dropped to 23%, while the percentage of trees sustaining m e
dium and high damage rose to 23% and 53%, respectively.
W h e n crown damage was considered in relation to species, only four
species other than Prestoea montana had enough individuals to m a k e
63
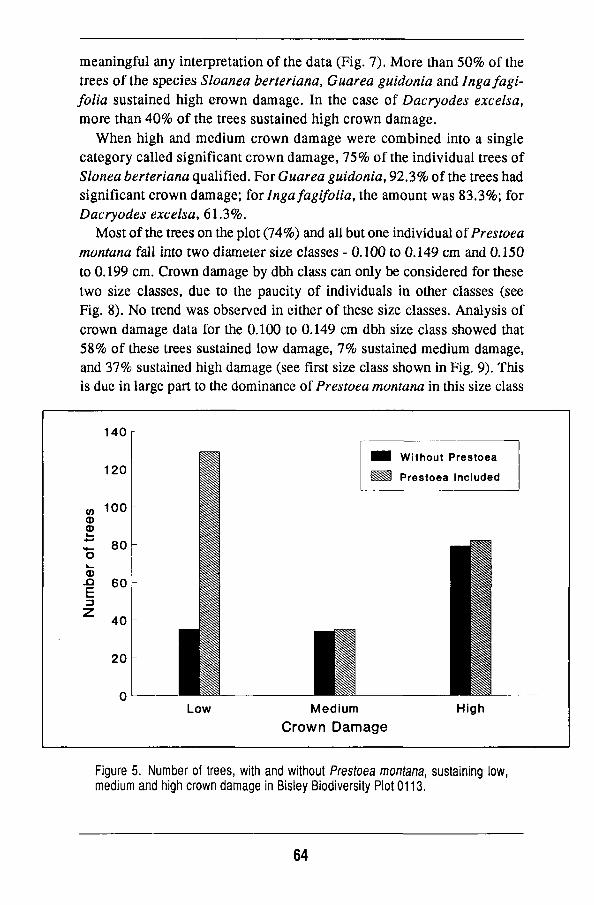
meaningful any interpretation of the data (Fig. 7). More than 50% of the
trees of the species Sloanea berteriana, Guarea guidonia and Ingafagi-
folia sustained high erown damage. In the case of Dacryodes excelsa,
more than 40% of the trees sustained high crown damage.
W h e n high and medium crown damage were combined into a single
category called significant crown damage, 75% of the individual trees of
Slonea berteriana qualified. For Guarea guidonia, 92.3% of the trees had
significant crown damage; for Inga fagifolia, the amount was 83.3%; for
Dacryodes excelsa, 61.3%.
Most of the trees on the plot (74%) and all but one individual of Prestoea
montana fall into two diameter size classes - 0.100 to 0.149 c m and 0.150
to 0.199 c m . Crown damage by dbh class can only be considered for these
two size classes, due to the paucity of individuals in other classes (see
Fig. 8). N o trend was observed in either of these size classes. Analysis of
crown damage data for the 0.100 to 0.149 cm dbh size class showed that
58% of these trees sustained low damage, 7% sustained medium damage,
and 37% sustained high damage (see first size class shown in Fig. 9). This
is due in large part to the dominance of Prestoea montana in this size class
Figure 5. Number of trees, with and without Prestoea montana, sustaining low, medium and high crown damage in Bisley Biodiversity Plot 0113.
64
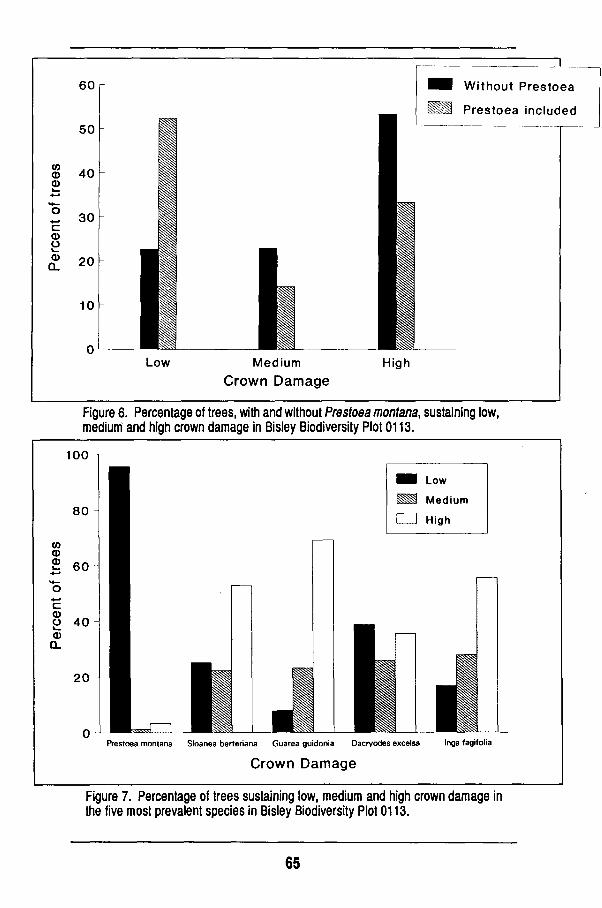
60
50
<D 40 CD
Z. 30 C CD
o S. 20
10
Without Prestoea
Prestoea included
Mm
Low Medium
Crown Damage High
Figure 6. Percentage of trees, with and without Prestoea montana, sustaining low, medium and high crown damage in Bisley Biodiversity Plot 0113.
100
80 -
to CD
£ 60
c: CD
o 40 CD
0 _
20
^ H Low
E H Medium
CZH High
Prestoea montana Sloanea berteriana Guarea guidonia Dacryodes excelsa Inga fagifolia
Crown Damage
Figure 7. Percentage of trees sustaining low, medium and high crown d a m a g e in the five most prevalent species in Bisley Biodiversity Plot 0113.
65
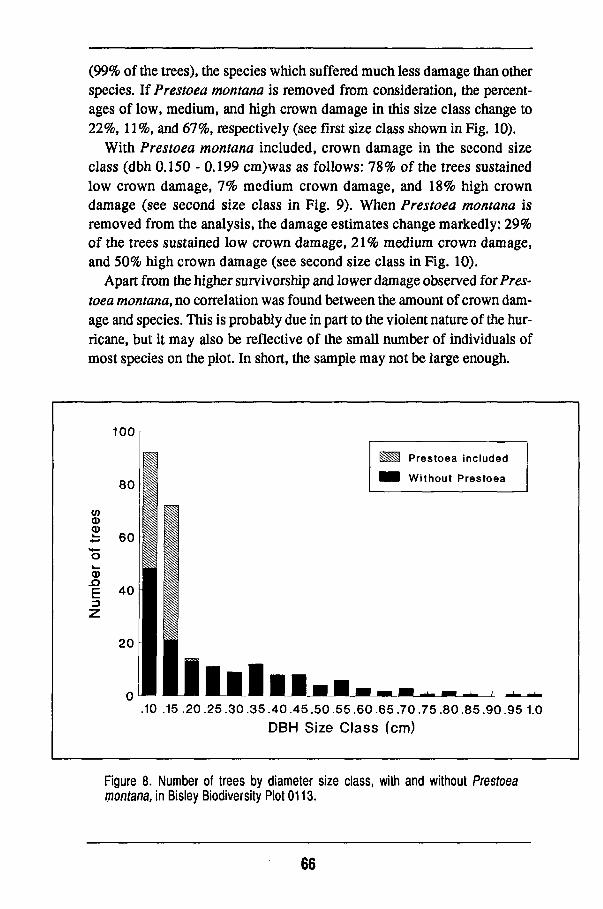
(99% of the trees), the species which suffered much less damage than other species. If Prestoea montana is removed from consideration, the percentages of low, medium, and high crown damage in this size class change to 22%, 11%, and 67%, respectively (see first size class shown in Fig. 10).
With Prestoea montana included, crown damage in the second size class (dbh 0.150 - 0.199 cm)was as follows: 78% of the trees sustained low crown damage, 7% medium crown damage, and 18% high crown damage (see second size class in Fig. 9). W h e n Prestoea montana is removed from the analysis, the damage estimates change markedly: 29% of the trees sustained low crown damage, 21% medium crown damage, and 50% high crown damage (see second size class in Fig. 10).
Apart from the higher survivorship and lower damage observed for Prestoea montana, no correlation was found between the amount of crown damage and species. This is probably due in part to the violent nature of the hurricane, but it m a y also be reflective of the small number of individuals of most species on the plot. In short, the sample m a y not be large enough.
Figure 8. Number of trees by diameter size class, with and without Prestoea montana, in Bisley Biodiversity Plot 0113.
66
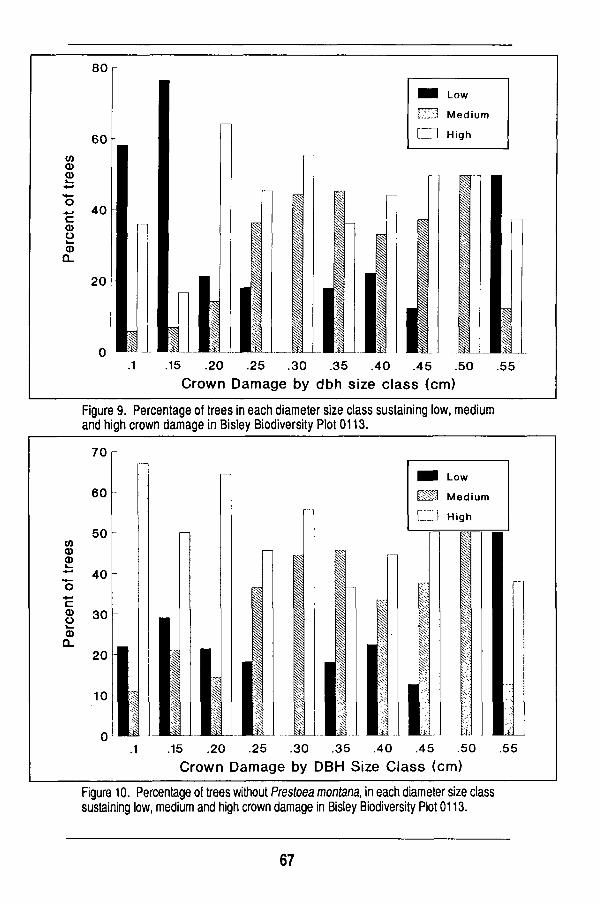
80
60 CO CD CD
^ 40 c CD o © a.
20
MJ .1
•i íO
mi
Low
Medium
High
m
p
M .15 .20 .25 .30 .35 .40 .45
Crown Damage by dbh size class (cm) 50 .55
Figure 9. Percentage of trees in each diameter size class sustaining low, medium and high crown damage in Bisley Biodiversity Plot 0113.
70
co CD CD
c CD U \— CD 0_
60
50
40
Low
Medium
High
.15 .20 .25 .30 .35 .40 .45
Crown Damage by DBH Size Class (c
Mi-
SO
Lfei
55
m)
Figure 10. Percentage of trees without Prestoea montana, in each diameter size class sustaining low, medium and high crown damage in Bisley Biodiversity Plot 0113.
67

Regeneration of the forest
Regeneration of damaged trees, in the form of sprouting, began before
the plot was censused in February 1990. This initial growth will greatly
influence the long-term regeneration and composition of the forest. T h e
data gathered thus far are therefore considered preliminary and will form
a baseline for future studies.
Coppicing is characteristic of m a n y species on the plot. Palms (Pres-
toea) and tree ferns (Nephelea), however, are structurally different from
dicotyledonous trees and, with only one terminal meristem, are not ca
pable of sprouting.
The survival of m a n y fallen and broken trees and their subsequent re
generation through sprouting distinguishes the disturbance effects of the
hurricane from those related to other causes. Although severely damaged,
m a n y individual trees of species that are characteristic of mature tabonu-
co forest did survive, are n o w sprouting, or are already developing n e w
crowns. Most previous studies of regeneration - even those conducted
after hurricane disturbance - do not help predict the path of succession.
The post-hurricane work of the past was restricted to the later stages of
recovery and addressed the initial impact only through inference (not
ably, C r o w 1980). Thus, the establishment of S I / M A B ' s Bisley plot be
fore Hugo' s strike provides an exceptional opportunity for long-term
study of a successional pattern - from the beginning onward.
The post-hurricane forest setting in which the Bisley plot is located
cannot be compared to a 'natural' forest gap. Nor can it be realistically
compared to a forest where selective logging has allowed some trees to
survive. Hurricane damage is a unique phenomenon that creates larger
canopy openings than does selective logging. Hurricanes, unlike loggers,
perform a more or less uniform thinning on site without regard to the tree
species or diameter size class. In addition, there is no cleared portion after
a hurricane - only a sparser forest that m a y or m a y not provide sites for
seedlings of n e w species. Buried seed banks provide a large reservoir that
is genetically and taxonomically diverse; it is from this reservoir that
m u c h of the regeneration in a cleared area arises. However , the survival
and root-sprouting of trees after hurricanes m a y block the growth of m a n y
n e w seedlings from a buried storehouse and, thus, channel regeneration
to existing plants.
The regenerative capacity of the Bisley plot and surrounding forest ap
pears to lie with the large number of fallen, sprouting trees. M a n y of these
68

trees have vigorous, multiple sprouts. A s time goes on, one or two sprouts will likely become dominant on each surviving tree and m a y ultimately reach the canopy. This strong advantage m a y diminish in importance, if these species are overtaken at least initially by the faster growing Cecropia, a short-lived secondary species that invaded the site after the hurricane with an estimated 66,000 seedlings per hectare (Scatena, pers. c o m m . ) .
It is too early in the regeneration of the forest to be able to predict which species will prevail on the site in the future. Still, it seems safe to say - in view of the fact that all species lost similar percentages of individuals - that the species composition in the years to come will be similar to that of the forest before Hurricane H u g o .
• • •
In conclusion, the impact of hurricanes has long been credited with controlling the dynamics of the tabonuco forest (Beard 1947, Wadsworth and Englerth 1959). Long-term studies established at the time of Hurricane H u g o in an area as well-studied as the Luquillo Forest will allow documentation of the effects in finer detail than has been done to date. This information will be augmented by the permanent biodiversity plot, where the trees were fully enumerated before the advent of the hurricane.
69

Acknowledgements
The authors thank the following people w h o provided assistance and support during the course of our work in Puerto Rico. Manuel Vêlez, from the University of Puerto Rico, spearheaded the initial project to establish the plot in 1988, coordinated a one-week training workshop, and added enthusiasm and an "esprit de corps" to the effort. The project team, which dedicated considerable time and energy, consisted of Sara Acosta, Suzette Delgado, Dennis Fernandez, Diana Garcia, Miguel Garcia, Kate Heaton, Tina Hubbard, Julio de Jesús, Al Letourneau, José Maldonado , Luis Migenis, Carlos Rodriguez, Javier Rodriguez, Yolanda Salva, and Patricia Tovar. Other participants were N e d Fetcher and Janice Voltzow. Ivette Pérez and Carlos Rodriguez of ITF shared valuable information on species identification with the team. Ariel Lugo's continuous advice and foresight stimulated the work. Robert Waide provided support and access to the El Verde Station, without which the work would have been extremely difficult to complete. Frederick Scatena devoted m a n y long hours to field work and provided helpful tips to improve field techniques and organization. Alejo Estrada successfully orchestrated the logistical support in the field station. Special thanks must go to Miguel A . García (Toño), w h o overcame the various and often unexpected difficulties of field work in tricky terrain over the entire three-year period of the project, and to Terry Erwin for his advice in setting the plot.
Roger Soles, Executive Director of the U S M a n and the Biosphere Program, sustained our initiative and spirits with encouragement, cheer, and financial resources to finish the work.
The support provided by all the organizations and programs mentioned led to this, the 17th contribution of S I / M A B .
The manuscript was m u c h improved thanks to the editorial assistance of Deanne Kloepfer.
W e extend our deep gratitude to Claudia R o m a n o , whose persistence and investigative skills permitted the distillation of mountains of information from three data sets. Finally, Laura Neal and Yvonne Bentle must be recognized for their dedication, organizational k n o w - h o w , and perseverance throughout the entire project.
70

References
Balslev, H . , J. Luteyn, B . Ollgaard & L . B . Holm-Nielsen. 1987. Composition and structure of adjacent unflooded and floodplain forest in Amazonian Ecuador. Opera Botánica 92:37-57.
Beard, J.S. 1949. The Natural Vegetation of the Windward and Leeward Islands. Clarendon Press, Oxford.
Brown, S. , A . E . Lugo, S. Silander & L . Liegel. 1983. Research History and Opportunities in the Luquillo Experimental Forest. Institute of Tropical Forestry Publication. General Technical Report, SO-44 . U S D A Forest Service, Southern Forest Experiment Station, N e w Orleans.
Crow, T . R . 1980. A rain forest: a 30 year record of change in structure and composition. El Verde, Puerto Rico. Biotropica 12:42-55.
Curtis, J.T. & R . P . Mcintosh. 1951. A n upland forest continuum in the prairie-forest border region of Wisconsin. Ecology 32:476-496.
Dallmeier, F.; Kabel, M . ; Taylor, C ; Rice, R . ; Mayne , J. & Romano, C . 1991a. User's Guide to the Bisley Biodiversity Plots, Luquillo Biosphere Reserve, Puerto Rico. Smithsonian Institution, Washington, D . C .
Dallmeier, F.; Kabel, M . ; Taylor, C ; Rice, R . ; Mayne, J. & Romano , C . 1991b. Field Guide to the Bisley Biodiversity Plots, Luquillo Biosphere Reserve, Puerto Rico. Smithsonian Institution, Washington, D . C .
Dallmeier, F.; Kabel, M . ; Rice, R . 1992. Methods for long-term biodiversity inventory plots in protected tropical forest. In F. Dallmeier (Ed.), Long-Term Monitoring of Biological Diversity in Tropical Forest Areas: Methods for Establishment and Inventory of Permanent Plots, 11-46. M A B Digest 11. U N E S C O , Paris.
Ewel, J.J. & J.L. Whitmore. 1973. The Ecological Life Zones of Puerto Rico and the U.S. Virgin Islands. Forest Service Research Paper ITF-18. Institute of Tropical Forestry. U S D A Forest Service, Southern Forest Experimental Station, Rio Piedras.
García, D . 1991. Effect of Charcoal Making in the 1940's on the Species Composition of the Present-day Forest of the Bisley Experimental Watersheds. Masters Thesis. University of Puerto Rico, Rio Piedras.
Holdridge, L . R . , W . C . Grenke, W . H . T . Liang & J.A. Tosi Jr. 1971. Forest Environments in Tropical Life Zones: A Pilot Study. Pergamon Press, N e w York.
Hubbell, S.P. & R . B . Foster. 1983. Diversity of canopy trees in a neotropical forest and implications for conservation. In: S.L. Sutton, T . C . Whitmore & A . C . Chadwick (Eds). Tropical Rain Forest: Ecology and Management, 24-41. Blackwell Scientific Publications, Oxford.
Lugo, A . E . 1986. Water and the Ecosystems of the Luquillo Experimental Forest. Forest Service General Technical Report 50-63. U S D A Forest Service, Southern Forest Experiment Station, N e w Orleans.
71
Salivia, L . A . 1972. Historia de los temporales de Puerto Rico y las Antillas, 1492-1970. Editorial Edil, Inc. University of Puerto Rico, Rio Piedras.
Scatena, F. N . 1989. An Introduction to the Physiography and History of the Bisley Experimental Watersheds, Luquillo Mountains, Puerto Rico. Institute of Tropical Forestry Report. U S D A Forest Service, Southern Forest Experiment Station, Rio Piedras.
Taylor, C M . & R . B . Waide. 1990. New El Verde Plant Name Codes. Terrestrial Ecology Division, Center for Energy and Environmental Research. University of Puerto Rico, San Juan.
Wadsworth, F . H . & G . H . Englerth. 1959. Effects of the 1956 hurricane on forests in Puerto Rico. Caribbean Forester 20(1):38-51.
Weaver, P . L . 1986. Hurricane damage and recovery in the montane forests of the Luquillo Mountains of Puerto Rico. Caribbean Journal of Science 22(1-2):53-70.
Weaver, P. L . 1989. Forest changes after hurricanes in Puerto Rico's Luquillo Mountains. Interciencia 14(4): 181-192.
72