Embed Size (px)
Citation preview

Machine Learning and Genetic Microarrays
Jude Shavlik & David PageUniversity of Wisconsin-Madison
Copyrighted © 2003 by Jude Shavlik and David Page
2
Goals
Learn about microarray technologySee some ML problem formulationsin the computational-biology literatureA little on experimental pitfalls to avoidOverviews of newest “high-throughput” molecular-level data being gatheredVery little on the details of machine learning algorithms

3
Outline
Molecular Biology and MicrotechnologyMachine Learning Applications
Technological: Designing MicroarraysMedical: Predicting Disease (Diagnosis,
Prognosis, & Treatment)Biological: Constructing Pathway Models
Looking Ahead: Related Technologies
4
Outline
Molecular Biology and NanotechnologyMachine Learning Applications
Technological: Designing MicroarraysMedical: Predicting Disease (Diagnosis,
Prognosis, & Treatment)Biological: Constructing Pathway Models
Looking Ahead: Related Technologies

5
Combining Three “Hot” Technologies
Information Technology
Biotechnology
“Nanotechnology”
6
image from the DOE Human Genome Programhttp://www.ornl.gov/hgmis

7
The “Central Dogma” of Mol Bio
8
The Big Picture
We’d like to know which proteins are present in a given type of cell, under some conditions, etc
eg, cancerous vs. non-cancerous cells
However, currently can only measure RNA well

9
probes
surface
Microarrays (“Gene Chips”)
Specific probes synthesized atknown spot on chip’s surface
Probes complementary to RNA of genes to be measured
Typical gene (1kb+) MUCH longer than typical probe (24 bases)
10
Microarray Technologies
Alternate technologies exist(eg, “spotted arrays”)
We won’t cover them all
We’ll focus on the “market leader”(Affymetrix)

11
Probes (DNA)
Gene Chip Surface
Hybridization
Labeled Sample (RNA)
How Microarrays Work
12
UVlight
DNA nucleotide
Photolabile protectinggroup
DNA Synthesis can be Controlled by Light

13
UVlight
DNA Synthesis can be Controlled by Light (cont.)
14
UVlight
DNA Synthesis can be Controlled by Light (cont.)

15
DNA Synthesis can be Controlled by Light (concluded)
16
Example: NimbleGen, Inc
Maskless Array Synthesizer
DNA Chip beingwritten
Digital LightProcessor
Light (UV) SourceFilter
e:\illustrations\dna_chip_mirrors.fh8
From DNASynthesizer

17
Springtip
Micro Mirrors from TI
18
From Probes Back to Genes
Need algorithm for converting measured probe intensities into gene-expression levels
Could simply use average probe value
More (too?) complicated approaches exist (eg, Affymetrix’)

19
Cleaning Up the Data –“Controlling Variance”
Often look at relative expression levelsMeasurement(cancerCell) / Measurement(normalCell)
Often correct for small valuesMeasurementToUse(Gene1)
= ActualMeasurement(Gene1) + Constant
Often use a mismatch (“near miss”) probeMeasurementToUse(Probe1)
= ActualMeasurement(Probe1) – ActualMeasurement(MismatchProbe1)
20
Outline
Molecular Biology and MicrotechnologyMachine Learning Applications
Technological: Designing MicroarraysMedical: Predicting Disease (Diagnosis,
Prognosis, & Treatment)Biological: Constructing Pathway Models
Looking Ahead: Related Technologies

21
The Probe-Selection Task
Need to pick 5-15 probes for each gene we want to monitor
Recall, genes about 1000 “bases” longCan only create probes about 24-bases long
Gene
Probes . . .
22
Goals
Probes should bind tightly to target
Probes should not bind well to othermRNAs … cross-hybridizationshould be rare

23
Probes: Good vs. Bad
good probe bad probe
Blue = ProbeRed = Sample
24
Supervised Learning Task 1
Given: probes as examples
DNA sequence features describe each example; class is good or bad
Probe is good if it binds tightly to target and bad otherwise
Do: learn model that accurately predictsprobe-quality class of new probes

25
The Data
Gene Sequence: GTAGCTAGCATTAGCATGGCCAGTCATG…
Complement: CATCGATCGTAATCGTACCGGTCAGTAC…
Probe 1: CATCGATCGTAATCGTACCGGTCA
Probe 2: ATCGATCGTAATCGTACCGGTCAG
Probe 3: TCGATCGTAATCGTACCGGTCAGT
… …
Tilings of 8 genes (from E. coli & B. subtilus)Every possible probe (~10,000 probes)Genes known to be “expressed” in sample
26
Microarray that Created Examples

27
The Features (Tobler et al., ISMB 2002)Feature Name Description
fracA, fracC, fracG, fracT The fraction of A, C, G, or T in the 24-mer
fracAA, fracAC, fracAG, fracAT, fracCA, fracCC, fracCG, fracCT, fracGA, fracGC, fracGG, fracGT,fracTA, fracTC, fracTG, fracTT
The fraction of each of these dimersin the 24-mer
n1, n2, …., n24 The particular nucleotide (A, C, G, or T) at the specified position in the 24-mer
d1, d2, …, d23 The particular dimer (AA, AC,…TT) at the specified position in the 24-mer
28
Information Gain per Feature
CG
CC
C
A G
T
AA
AC
AG
ATCA
CTGA GG
TC
GC TAGT TT
TG0.0
1.0
22 2324 1 2 3 4 5 6 78
9 10 11 1213 1415 16 1718 19 20
21 22232119 2017181614 151311 12
9 108764 51 2 3
0.0
1.0
Probe Composition Features
No
rmal
ized
Info
rmat
ion
Gai
n
Base Position Features
Base Position Dimer Position

29
0 99
Defining Categories
Normalized Probe Intensity
Low Intensity = BAD Probes
(45%)
High Intensity = GOOD Probes
(32%)
Mid-Intensity = Not Used in Training Set
(23%)
Freq
uenc
y
0 .05 .15 1.0
30
The Machine Learning Techniques
Naïve Bayes (Mitchell 1997)
Neural Networks (Rumelhart et al. 1995)
Decision Trees (Quinlan 1996)
Can interpret predictions of each learner probabilistically

31
Leave-One-Gene-Out X-Validation
Leave-one-gene-out testing:For each gene (of the 8)
Train on all but this geneTest on this geneRecord resultForget what was learned
Average results across 8 test genes
In mol bio tasks, be carefully how you split into train and test sets!
32
Typical Probe-Intensity Prediction Across Short Region
0
0.1
0.2
0.3
0.4
0.5
0.6
0.7
0.8
0.9
1
650 655 660 665 670 675 680 685 690 695 700
Actual
Nor
mal
ized
Pro
be I
nten
sity
Starting Nucleotide Position for 24-mer Probe

33
Typical Probe-Intensity Prediction Across Short Region
0
0.1
0.2
0.3
0.4
0.5
0.6
0.7
0.8
0.9
1
650 655 660 665 670 675 680 685 690 695 700
Naïve Bayes Decision
Tree
Neural Network
Actual
Nor
mal
ized
Pro
be I
nten
sity
Starting Nucleotide Position for 24-mer Probe
34
Probe-Picking Results
0
2
4
6
8
10
12
14
16
18
20
0 2 4 6 8 10 12 14 16 18 20
Num
ber
of p
robe
s se
lect
ed w
ith
inte
nsity
>=
90t
hpe
rcen
tile
Number of probes selected
Perfect Selector

35
Probe-Picking Results
0
2
4
6
8
10
12
14
16
18
20
0 2 4 6 8 10 12 14 16 18 20
Num
ber
of p
robe
s se
lect
ed w
ith
inte
nsity
>=
90t
hpe
rcen
tile
Number of probes selected
Naïve Bayes
Neural Network
Decision Tree
Primer Melting Point
Perfect Selector
36
Outline
Molecular Biology and MicrotechnologyMachine Learning Applications
Technological: Designing MicroarraysMedical: Predicting Disease (Diagnosis,
Prognosis, & Treatment)Biological: Constructing Pathway Models
Looking Ahead: Related Technologies

37
Two Views of Microarray Data
Data points are genesRepresented by expression levels across different samples (ie, features=samples)Goal: categorize new genes
Data points are samples (eg, patients)Represented by expression levels of different genes (ie, features=genes)Goal: categorize new samples
38
Two Ways to View The Data
Person Gene A28202_ac AB00014_at AB00015_at . . . Person 1 1142.0 321.0 2567.2 . . . Person 2 586.3 586.1 759.0 . . . Person 3 105.2 559.3 3210.7 . . . Person 4 42.8 692.1 812.0 . . . . . . . . . . . . . . . . . . . . . . . . . . . . . .

39
Data Points are Genes
Person Gene A28202_ac AB00014_at AB00015_at . . . Person 1 1142.0 321.0 2567.2 . . . Person 2 586.3 586.1 759.0 . . . Person 3 105.2 559.3 3210.7 . . . Person 4 42.8 692.1 812.0 . . . . . . . . . . . . . . . . . . . . . . . . . . . . . .
40
Data Points are Samples
Person Gene A28202_ac AB00014_at AB00015_at . . . Person 1 1142.0 321.0 2567.2 . . . Person 2 586.3 586.1 759.0 . . . Person 3 105.2 559.3 3210.7 . . . Person 4 42.8 692.1 812.0 . . . . . . . . . . . . . . . . . . . . . . . . . . . . . .

41
Supervision: Add Class Values
Person Gene A28202_ac AB00014_at AB00015_at . . . Class Person 1 1142.0 321.0 2567.2 . . . normal Person 2 586.3 586.1 759.0 . . . cancer Person 3 105.2 559.3 3210.7 . . . normal Person 4 42.8 692.1 812.0 . . . cancer . . . . . . . . . . . . . . . . . . . . . . . . . . .
42
Supervised Learning Task 2
Given: a set of microarray experiments, each done with mRNA from a different patient(same cell type from every patient)
Patient’s expression values for each geneconstitute the features, and patient’s diseaseconstitutes the class
Do: Learn a model that accurately predictsclass based on features

43
Data Points are: Genes Samples
Clustering Supervised Data Mining
Predict the class value for a patient
based on the expression levels for his/her genes
Location in Task Space
44
Leukemia (Golub et al., 1999)
ClassesAcute Lymphoblastic Leukemia (ALL)and Acute Myeloid Leukemia (AML)
ApproachWeighted voting (essentially naïve Bayes)
Cross-Validated AccuracyOf 34 samples, declined to predict 5,correct on other 29

45
Cancer vs. Normal
Relatively easy to predict accurately, because so much goes “haywire” in cancer cells
Primary barrier is noise in the data… impure RNA, cross-hybridization, etc
Studies include breast, colon, prostate, lymphoma, and multiple myeloma
46
X-Val Accuracies for Multiple Myeloma (74 MM vs. 31 Normal)
Trees
Boosted Trees
SVMs
Vote
Bayes Nets
98.1
99.0
100.0
97.0
100.0

47
Prognosis and Treatment
Features same as for diagnosis
Rather than disease state, class valuebecomes life expectancy with a given treatment (or positive response vs. no response to given treatment)
48
Breast Cancer Prognosis(Van’t Veer et al., 2002)
Classesgood prognosis (no metastasis withinfive years of initial diagnosis) vs. poor prognosis
AlgorithmEnsemble of voters
Results83% cross-validated accuracy on 78 cases

49
A Lesson
Previous work selected features to use in ensemble by looking at the entire data setShould have repeated feature selection on each cross-val foldAuthors also chose ensemble size by seeing which size gave highest cross-val resultAuthors corrected this in web supplement;accuracy went from 83% to 73%Remember to “tune parameters” separately for each cross-val fold!
50
Prognosis with Specific Therapy (Rosenwald et al., 2002)
Data set contains gene-expression patterns for 160 patients with diffuse large B-cell lymphoma, receiving anthracycline chemotherapyClass label is five-year survivalOne test-train split 80/80True positive rate: 60% False negative rate: 39%

51
Some Future Directions
Using gene-chip data to select therapyPredict which therapy gives best prognosis for patient
Comparing cancer with related benign conditions, rather than with normal
Tougher, but may give more insight
52
Unsupervised Learning Task 1
Given: a set of microarray experiments under different conditions
Do: cluster the genes, where a gene described by its expression levels in different experiments

53
Data Points are: Genes Samples
Clustering Supervised Data Mining
Group genes into clusters, where all
members of a cluster tend to go
up or down together
Location in Task Space
54
Example(Green = up-regulated, Red = down-regulated)
Gen
es
Experiments (Samples)

55
Visualizing Gene Clusters (eg, Sharan and Shamir, 2000)
Time (10-minute intervals)
No
rmal
ized
exp
ress
ion
Gene Cluster 1, size=20 Gene Cluster 2, size=43
56
Unsupervised Learning Task 2
Given: a set of microarray experiments (samples) corresponding to different conditions or patients
Do: cluster the experiments

57
Data Points are: Genes Samples
Clustering Supervised Data Mining
Group samples by gene expression
profile
Location in Task Space
58
Examples
Cluster samples from mice subjected to a variety of toxic compounds (Thomas et al., 2001)
Cluster samples from cancer patients, potentially to discover different subtypes of a cancerCluster samples taken at different time points

59
Outline
Molecular Biology and MicrotechnologyMachine Learning Applications
Technological: Designing MicroarraysMedical: Predicting Disease (Diagnosis,
Prognosis, & Treatment)Biological: Constructing Pathway Models
Looking Ahead: Related Technologies
60
Some Biological Pathways
Regulatory pathwaysNodes are labeled by genesArcs denote influence on transcriptionG1 codes for P1, P1 inhibits G2’s transcription
Metabolic pathwaysNodes are metabolites, large biomolecules (eg, sugars, lipids, proteins and modified proteins)Arcs from biochemical reaction inputs to outputsArcs labeled by enzymes (themselves proteins)

61
Metabolic Pathway Example
Fumarate
Malate
Oxaloacetate
Citrate cis-Aconitate
Isocitrate
α-Ketoglutarate
Succinyl-CoASuccinate
fumarase
succinate thikinase
MDH
citrate synthase aconitase
IDH
α-KDGH
FAD
FADH2
H20
NAD+
NADH
Acetyl CoAHSCoA
H20
H20
NAD+
NADH + CO2
NAD+ + HSCoA
NADH + CO2
GDP + PiGTP+ HSCoA
(Krebs Cycle,
TCA Cycle,
Citric Acid Cycle)
62
Regulatory Pathway (KEGG)

63
Using Microarray Data Only
Regulatory pathwaysNodes are labeled by genesArcs denote influence on transcriptionG1 codes for P1, P1 inhibits G2’s transcription
Metabolic pathwaysNodes are metabolites, large biomolecules (eg, sugars, lipids, proteins, and modified proteins)Arcs from biochemical reaction inputs to outputsArcs labeled by enzymes (themselves proteins)
64
Supervised Learning Task 3
Given: a set of microarray experiments for same organism under different conditions
Do: Learn graphical model that accurately predicts expression of some genes in terms of others

65
Some Approaches to Learning Regulatory Networks
Bayes Net Learning (Friedman & Halpern, 1999)
Boolean Networks (Akutsu, Kuhara, Maruyama & Miyano, 1998; Ideker, Thorsson & Karp, 2002)
Related Graphical Approaches (Tanay & Shamir, 2001; Chrisman, Langley, Baay & Pohorille, 2003)
66
Note: direction of arrowindicates dependencenot causality
P(geneA)
P(geneB)
P(ge
neA)
parent node
child node
parent node
child node
geneA
geneB
Bayesian Network (BN)
1.0 0.0
DatageneBgeneA
Expt1Expt2Expt3Expt4
0.5 0.5
0.5 0.5

67
Problem: Not Causality
A B
A is a good predictor of B. But is A regulating B??
Ground truth might be:
B A A C B
B C A
B
C
A Or a more complicated variant
68
Approaches to Get Causality
Use “knock-outs” (Pe’er, Regev, Elidan and Friedman, 2001). But not available in most organisms.Use time-series data and Dynamic Bayesian Networks (Ong, Glasner and Page, 2002). But even less data typically.Use other data sources, eg sequences upstream of genes, where transcription regulators may bind. (Segal, Barash, Simon, Friedman and Koller, 2002).

69
R
Transcription Regulation
DNA
geneA geneB geneCP TO
Operon
geneRP O T
Operon OperonOperon
R
mRNAmRNA
70
Another Way Around Limitations
Identify smaller part of the task that is a step toward a full regulatory pathway
Part of a pathwayClasses or groups of genes
Example: Predicting the operons in E. coli

71
The E. Coli Genome
72
Finding Operons in E. coli(Craven, Page, Shavlik, Bockhorst and Glasner, 2000)
Given: known operons and other E. coli data
Do: predict all operons in E. coli
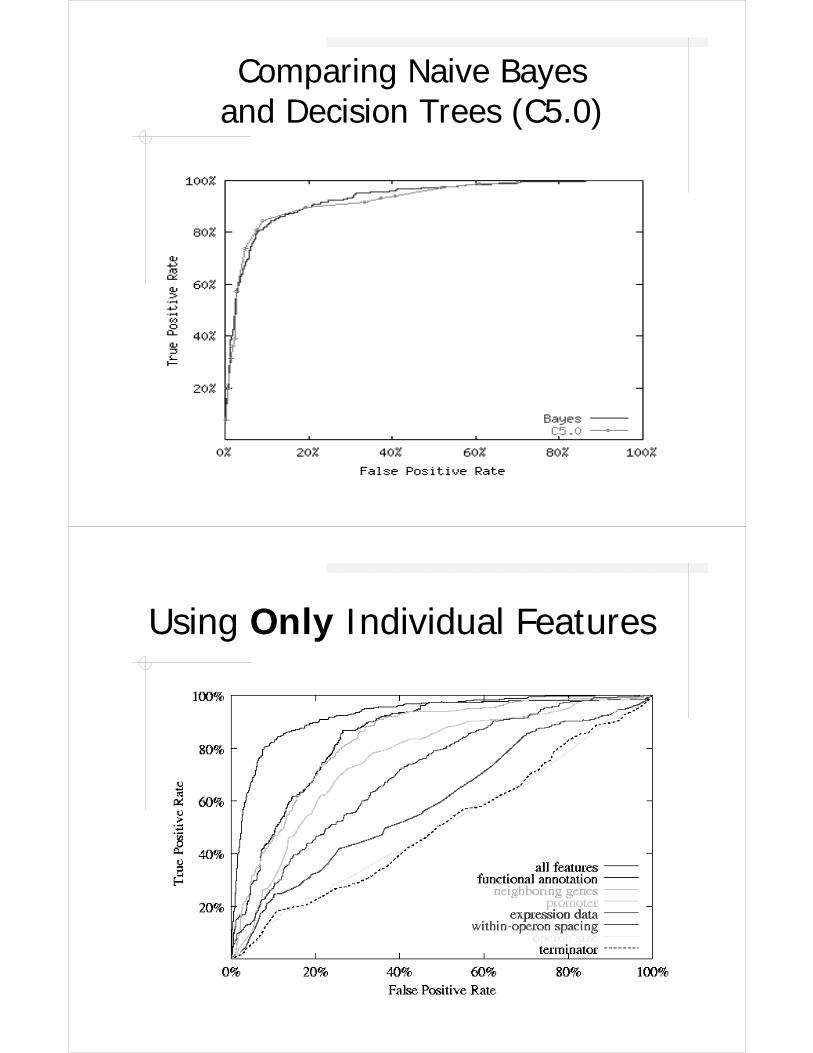
Additional Sources of Informationgene-expression datafunctional annotation
g1
g2 g3g5
g4
promoter terminator
73
Comparing Naive Bayes and Decision Trees (C5.0)
74
Using Only Individual Features

75
Outline
Molecular Biology and MicrotechnologyMachine Learning Applications
Technological: Designing MicroarraysMedical: Predicting Disease (Diagnosis,
Prognosis, & Treatment)Biological: Constructing Pathway Models
Looking Ahead: Related Technologies
76
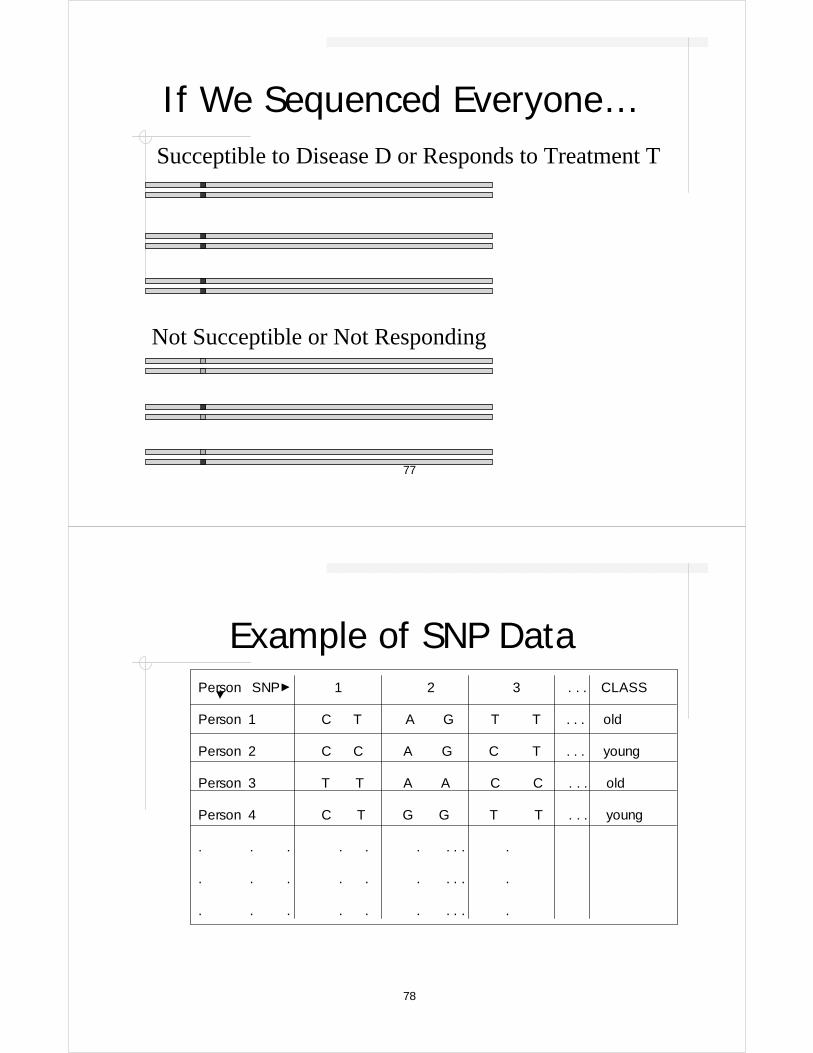
Single-Nucleotide Polymorphisms
SNPs: Individual positions in DNA wherevariation is common
Now 1.8 million known SNPs in humans
Easier/faster/cheaper to measure SNPsthan to completely sequence everyone
Motivation …
77
Not Succeptible or Not Responding
Succeptible to Disease D or Responds to Treatment T
If We Sequenced Everyone…
78
Example of SNP Data
Person SNP 1 2 3 . . . CLASS Person 1 C T A G T T . . . old Person 2 C C A G C T . . . young Person 3 T T A A C C . . . old Person 4 C T G G T T . . . young . . . . . . . . . . . . . . . . . . . . . . . . . . . . . .

79
Phasing (Haplotyping)
80
Advantages of SNP Data
Person’s SNP pattern does not change with time or disease, so it can give more insight into susceptibility
Easier to collect samples (can simply use blood rather than affected tissue)

81
Challenges of SNP Data
UnphasedAlgorithms exist for phasing (haplotyping), but they make errors and typically need related individuals, dense coverage
Missing values are more common than in microarray dataMore expensive than microarray data if we want similar level of completeness
82
Example
Multiple Myeloma, 3000 SNPs, Young (susceptible) vs. Old (less susceptible)SVMlight with feature selection (repeated on every fold of cross-validation)Result significantly better than chance
Old
Young
Old Young
Actual31 9
14 26

83
Proteomics
Microarrays are useful primarily because mRNA concentrations serve as surrogate for protein concentrationsLike to measure protein concentrations directly, but at present cannot do so insame high-throughput mannerProteins do not have obvious direct complementsCould build molecules that bind, but binding greatly affected by protein structure
84
Time-of-Flight (TOF) Mass Spectrometry
Laser
+VSample
Measures the time for an ionized particle, starting from the sample plate, to hit the detector
Detector
85
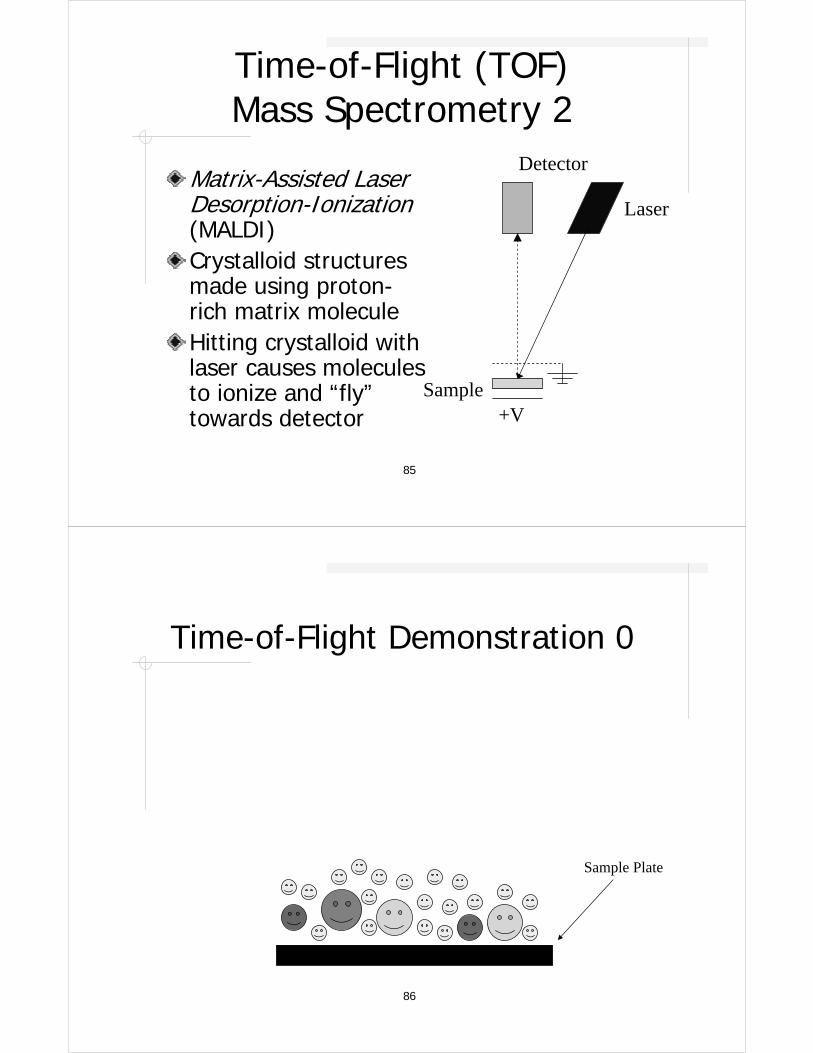
Time-of-Flight (TOF) Mass Spectrometry 2
Laser
+VSample
Matrix-Assisted Laser Desorption-Ionization(MALDI) Crystalloid structures made using proton-rich matrix moleculeHitting crystalloid with laser causes molecules to ionize and “fly” towards detector
Detector
86
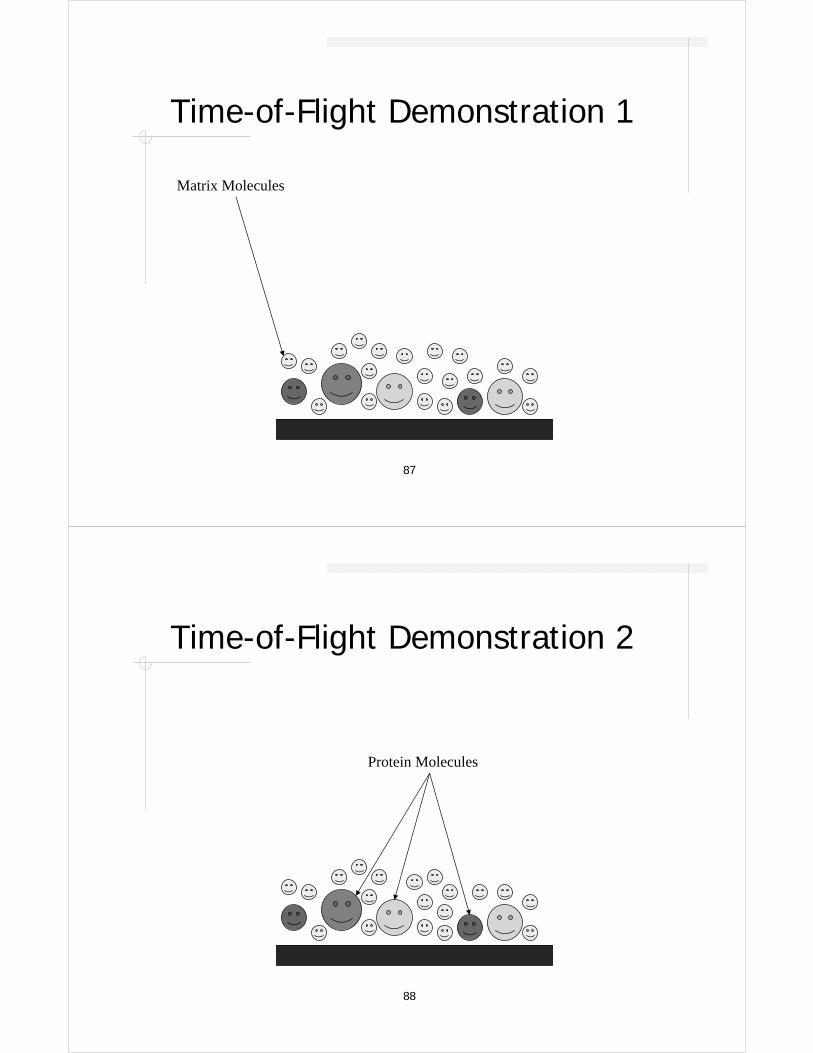
Time-of-Flight Demonstration 0
Sample Plate
87
Time-of-Flight Demonstration 1
Matrix Molecules
88
Time-of-Flight Demonstration 2
Protein Molecules

89
Time-of-Flight Demonstration 3
LaserDetector
+10KVPositive Charge
90
Time-of-Flight Demonstration 4
+10KV
+
Proton kicked off matrix molecule onto another molecule
Laser pulsed directly onto sample
91
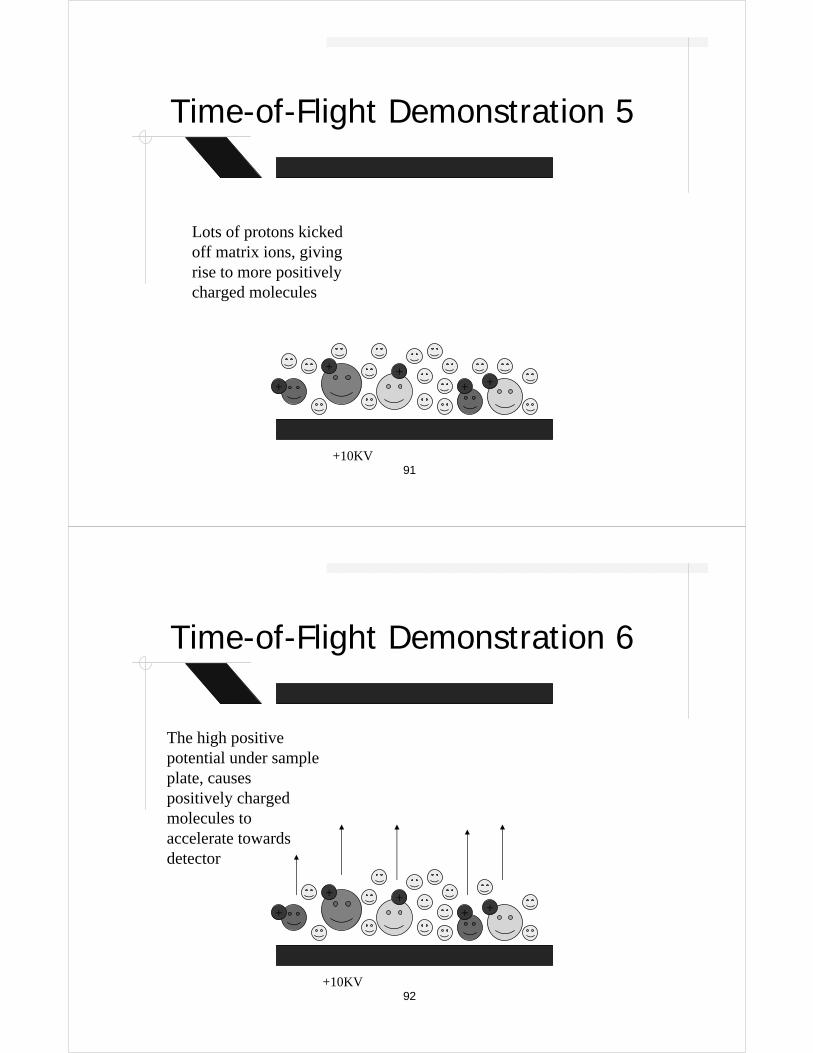
Time-of-Flight Demonstration 5
+10KV
++
+
+ +
Lots of protons kicked off matrix ions, giving rise to more positively charged molecules
92
Time-of-Flight Demonstration 6
+10KV
++
+
+ +
The high positive potential under sample plate, causes positively charged molecules to accelerate towards detector

93
Time-of-Flight Demonstration 7
+10Kv
+
+
+
+
+
+
Smaller mass molecules hit detector first, while heavier ones detected later
94
Time-of-Flight Demonstration 8
+10KV
+
+
+
+
+
+
The incident timemeasured from when laser is pulsed until molecule hits detector

95
Time-of-Flight Demonstration 9
+10KV
++ + + ++
Experiment repeated a number of times, counting frequencies of “flight-times”
96
Example Spectra from Duke
These are different fractions from the same sample.
M/Z
Inte
nsi
ty

97
Trypsin-Treated Spectra
M/Z
Fre
qu
ency
98
Challenges of Proteomics Data
NoiseM/Z values may not align exactly across spectra (resolution ~0.1%)Intensities not calibrated across spectra
Must identify proteins from “signatures” … best results if proteins broken downCannot get all proteins… typically several hundred

99
Peak Picking
Want to pick peaks that are statistically significant from the noise signal
• Fortunately, data from Duke had peaks picked from spectra already
• Page Group working on a peak-picking algorithm
• Want sensitivity to peaks, while filtering out peaks tdue to noise
Want to use these as features in our learning algorithms.
100
Metabolomics
Measures concentration of each low-molecular weight molecule in sample
These typically are “metabolites,” or small molecules produced or consumed by reactions in biochemical pathways
These reactions typically catalyzed by proteins (specifically, enzymes)
101
Lipomics
Analogous to metabolomics, but measuring concentrations of lipidsrather than metabolites
Potentially help induce biochemical pathway information or to help disease diagnosis or treatment choice
102
Final Wrapup
Molecular biology collecting lots and lots of data in post-genome era
Opportunity to “connect” molecular-level information to diseases and treatment
Need analysis tools to interpret
Machine learning opportunities abound
Hopefully this tutorial provided solid start toward applying ML to biological data

103
Some Additional Readings
Molla, Waddell, Page & Shavlik, Using Machine Learning to Design and Interpret Gene-Expression Microarrays(to appear in the AI Magazine special issue on Bioinformatics)
Special issue of Machine Learningjournal (Volume 52:1/2, 2003) on Machine Learning in the Genomics Era
104
Thanks To
Mark CravenMichael MollaMichael WaddellSean McIlwainIrene OngRoland GreenJohn Tobler

105
Some Useful Datasets Brief Descriptionwww.ebi.ac.uk/arrayexpress/ EBI microarray data repository
www.ncbi.nlm.nih.gov/geo/ NCBI microarray data repository
genome-www5.stanford.edu/MicroArray/SMD/ Stanford microarray database
rana.lbl.gov/EisenData.htm Eisen-lab’s yeast data, (Spellman et al. 1998)
www.genome.wisc.edu/functional/microarray.htm University of Wisconsin E. coli Genome Project
llmpp.nih.gov/lymphoma/data.shtml Diffuse large B-cell lymphoma (Alizadeh et al. 2000)
llmpp.nih.gov/DLBCL/ Molecular profiling (Rosenwald et al. 2002)
www.rii.com/publications/2002/vantveer.htm Breast cancer prognosis (Van't Veer et al. 2002)
www-genome.wi.mit.edu/cgi-bin/cancer/datasets.cgi MIT Whitehead Center for GenomeResearch, including data in Golub et al. (1999)
lambertlab.uams.edu/publicdata.htm Lambert Laboratory data for multiple myeloma
www.cs.wisc.edu/~dpage/kddcup2001/ KDD Cup 2001 data; Task 2 includes correlationsin genes’ expression levels
clinicalproteomics.steem.com/ Proteomics data (mass spectrometry of proteins)
snp.cshl.org/ Single nucleotide polymorphism (SNP) data
106
Bibliography from AI Mag ArticleAlizadeh, A.; Eisen, M.; Davis, R.; Ma, C.; Lossos, I. , Rosenwald, A.; Boldrick, J.; Hajeer, S.;Tran, T.; Yu, X.; Powell, J.; Yang, L.; Marti, G.; Moore, T.; Hudson, J. Jr; Lu, L.; Lewis, D.; Tibshirani, R.; Sherlock, G; Chan, W.; Greiner, T.; Weisenburger, D.; Armitage, J.; Warnke, R.; Levy, R.; Wyndham Wilson, W.; Grever, M.; Byrd, J.; Botstein, D.; Brown, P.; and Staudt, L. 2000. Distinct Types of Diffuse Large B-cell Lymphoma Identified by Gene Expression Profiling. Nature 403:503-511.Bairoch, A. and Apweiler, R. 2000. The SWISS-PROT Protein Sequence Database and its Supplement TrEMBL in 2000. Nucleic Acids Research 28:45-48.Breslauer, K.; Frank, R.; Blocker, H.; and Marky, L. 1986. Predicting DNA Duplex Stability from the Base Sequence. Proceedings of the National Academy of Science USA 83:3746-3750.Brown, M.; Grundy, W.; Lin, D.; Cristianini, N.; Sugnet, C.; Furey, T.; Ares M. Jr.; and Haussler, D. 2000. Knowledge-based Analysis of Microarray Gene Expression Data by using Support Vector Machines. Proceedings of the National Academy of Science USA 97(1):262-267.Cheng, J.; Hatzis, C.; Hayashi, H.; Krogel, M.; Morishita, S.; Page, D. and Sese, J. 2002. Report on KDD Cup 2001. SIGKDD Explorations 3(2):47-64.Craven, M.; Page, D.; Shavlik, J.; Bockhorst J.; and Glasner J. 2000. Using Multiple Levels of Learning and Diverse Evidence Sources to Uncover Coordinately Controlled Genes. Proceedings of the 17th International Conference on Machine Learning, Morgan Kaufmann, Palo Alto, CA.Davidson, E.; Rast, J.; Oliveri, P.; Ransik, A.; Calestani, C.; Yuh, C.; Amore, G.; Minokawa, T.; Hynman, V.,; Arenas-Mena, C.; Otim, O.; Brown, C.; Livi, C.; Lee, P.; Revilla, R.; Alistair R.; Pan Z.; Schilstra M.; Clarke, P.; Arnone, M.; Rowen, L.; Cameron, R.; McClay, D.; Hood, L. and Bolouri, H. 2002. A Genomic Regulatory Network for Development. Science 295:1669-1678.Eisen M.; Spellman P.; Brown P.; and Botstein D. 1998. Cluster Analysis and Display of Genome-Wide Expression Patterns. Proceedings of the National Academy of Science USA 95:14863-14868.Friedman, N. and Halpern J. 1999. Modeling Beliefs in Dynamic Systems. Part II: Revision and Update. Journal of AI Research10:117-167.Golub T.; Slonim D.; Tamayo, P.; Huard, C.; Gaasenbeek, M.; Mesirov, J.; Coller, H.; Loh, M.; Downing, J.; Caligiuri, M.; Bloomfield, C; and Lander, E. 1999. Molecular Classification of Cancer: Class Discovery and Class Prediction by Gene Expression Monitoring. Science 286:531-537.Hanisch, D.; Zien, A.; Zimmer, R.; and Lengauer, T. 2002. Co-Clustering of Biological Networks and Gene Expression Data. Bioinformatics 18:S145-S1554.Hood, L. and Galas, D. 2003. The Digital Code of DNA. Nature 421:444-448.Hunter, L. 2003. An Introduction to Molecular Biology for Computer Scientists. AI Magazine, this issue.Khodursky, A.; Peter, B.; Cozzarelli, N.; Botstein, D.; Brown, P. and Yanofsky, C. 2000. DNA Microarray Analysis of Gene Expression in Response to Physiological and Genetic Changes that Affect Tryptophan in Escheria Coli. Proceedings of the National Academy of Science USA 97:12170-12175. Lazarou, J.; Pomeranz, B. and Corey, P. 1998. Incidence of Adverse Drug Reactions in Hospitalized Patients. Journal of the American Medical Association 279(15):1200-1205.

107
More BibliographyLi, C. and Wong, W. 2001. Model-based Analysis of Oligonucleotide Arrays: Expression Index Computation and Outlier Detection. Proceedings of the National Academy of Science USA 98(1):31-36.Mancinelli, L.; Cronin, M. and Sadee W. 2000. Pharmacogenomics: The Promise of Personalized Medicine. AAPS PharmSci 2(1): article 4.Molla, M; Andrae, P; Glasner, J; Blattner, F. and Shavlik, J. 2002. Interpreting Microarray Expression Data Using Text Annotating the Genes. Information Sciences 146:75-88.Mitchell, T. 1997. Machine Learning. McGraw-Hill, Boston, MA.Oliver, S.; Winson, M.; Kell, D. and Baganz, F. 1998. Systematic Functional Analysis of the Yeast Genome. Trends in Biotechnology 16(9):373-378.Ong, I.; Glassner, J. and Page, D. 2002. Modelling Regulatory Pathways in E.coli from Time Series Expression Profiles. Bioinformatics 18:241S-248S. Newton, M.; Kendziorski C.; Richmond, C.; Blattner, F. and Tsui, K. 2001. On Differential Variability of Expression Ratios: Improving Statistical Inference about Gene Expression Changes from Microarray Data. Journal of Computational Biology 8:37-52. Nuwaysir, E. F.;Huang, W.; Albert, T.; Singh, J.; Nuwaysir, K.; Pitas, A.; Richmond, T.; Gorski, T.; Berg, J.; Ballin, J.; McCormick, M.; Norton, J.; Pollock, T.; Sumwalt, T.; Butcher, L.; Porter, D.; Molla, M.; Hall, C.; Blattner, F.; Sussman, M.; Wallace, R.; Cerrina, F. and Green, R. 2002. Gene Expression Analysis Using Oligonucleotide Arrays Produced by Maskless Lithography. Genome Research 12(11):1749-1755.Pe'er, D.; Regev, A.; Elidan, G. and Friedman, N. 2001. Inferring Subnetworks from Perturbed Expression Profiles. Bioinformatics17:S215-S224Rosenwald, A.; Wright, G.; Chan, W.; Connors, J.; Campo, E.; Fisher, R.; Gascoyne, R.; Muller-Hermelink, H.; Smeland, E. and Staudt, L. 2002. The Use of Molecular Profiling to Predict Survival after Chemotherapy for Diffuse Large-B-Cell Lymphoma. New England Journal of Medicine 346(25):1937-1947.Segal, E.; Taskar, B.; Gasch, A.; Friedman, N. and Koller, D. 2001. Rich Probabilistic Models for Gene Expression. Bioinformatics1(1):1-10.Shrager, J.; Langley, P.; and Pohorille, A. 2002. Guiding Revision of Regulatory Models with Expression Data. Proceedings of the Pacific Symposium on Biocomputing, 486-497, World Scientific, Lihue, Hawaii. Spellman, P.; Sherlock, G.; Zhang, M.; Iyer, V.; Anders, K.; Eisen, M.; Brown, P.; Botstein, D. and Futcher. B. 1998. Comprehensive Identification of Cell Cycle-Regulated Genes of the Yeast Saccharomyces Cerevisiae by Microarray Hybridization. Molecular Biology of the Cell 9:3273-3297.Thomas, R.; Rank, D.; Penn, S.; Zastrow, G.; Hayes, K.; Pande, K.; Glover, E.; Silander, T.; Craven, M.; Reddy, J.; Jovanovich, S. and Bradfield, C. 2001. Identification of Toxicologically Predictive Gene Sets using cDNA Microarrays. Molecular Pharmacology60:1189-1194.Tobler J.; Molla M.; Nuwaysir, E.; Green R. and Shavlik J. 2002. Evaluating Machine Learning Approaches for Aiding Probe Selection for Gene-Expression Arrays. Bioinformatics, 18:S164-S171.Van ‘t Veer, L.; Dai, H.; van de Vijver, M.; He, Y.; Hart, A.; Mao, M.; Peterse, H.; van der Kooy, K.; Marton, M.; Witteveen, A.; Schreiber, G.; Kerkhoven, R.; Roberts, C.; Linsley, P.; Bernards, R. and Friend, S. 2002. Gene Expression Profiling Predicts Clinical Outcome of Breast Cancer. Nature 415:530-536.
108
Additional CitationsAkutsu, T.; Kuhara, S.; Maruyama, O. and Miyano, S. 1998. Identification of Gene Regulatory Networks by Strategic Gene Disruptions and Gene Overexpressions. ACM-SIAM Symposium on Discrete Algorithms (SODA), pp. 695-702Chrisman, L.; Langley, P.; Bay, S. and Pohorille, A. 2003. Incorporating Biological Knowledge into Evaluation of Causal Regulatory Hypotheses. Pacific Symposium on Biocomputing, pp. 128-139.Ideker, T.; Thorsson, V. and Karp, R. 2000. Discovery of Regulatory Interactions Through Perturbation: Inference and Experimental Design. Pacific Symposium on Biocomputing, pp. 302-313. Segal, E.; Taskar, B.; Gasch, A.; Friedman, N. and Koller, D. 2002. Rich Probabilistic Models for Gene Expression. Proc. Ninth International Conference on Intelligent Systems for Molecular Biology (ISMB), Bioinformatics, 17 (Suppl 1), pp. 243--252.Shamir, R. and Sharan, R. 2000. CLICK: A Clustering Algorithm with Applications to Gene Expression Analysis. Currents in Computational Molecular Biology, pages 6--7, S. Miyano, R. Shamir and T. Takagi (editors) Universal Academy Press, 2000). Proc. ISMB '00, pp., 307--316, AAAI Press, Menlo Park, CA.Tanay, A. and Shamir, R. 2001. Computational Expansion of Genetic Networks. Proc. Ninth International Conference on Intelligent Systems for Molecular Biology (ISMB), pp. 270-278.