Embed Size (px)
Citation preview

Machine Learning Dielectric Screening for the Simulationof Excited State Properties of Molecules and Materials
Sijia S. Dong1,2,3, Marco Govoni1,2,*, and Giulia Galli2,1,†
1Materials Science Division and Center for Molecular Engineering, Argonne National Laboratory,Lemont, IL 60439, USA
2Pritzker School of Molecular Engineering, the University of Chicago, Chicago, IL 60637, USA3Current Address: Department of Chemistry and Chemical Biology, Northeastern University, Boston,
MA 02115, USA*[email protected]
AbstractAccurate and efficient calculations of absorption spectra of molecules and materials are essential for the understanding
and rational design of broad classes of systems. Solving the Bethe-Salpeter equation (BSE) for electron-hole pairs usuallyyields accurate predictions of absorption spectra, but it is computationally expensive, especially if thermal averages ofspectra computed for multiple configurations are required. We present a method based on machine learning to evaluatea key quantity entering the definition of absorption spectra: the dielectric screening. We show that our approach yieldsa model for the screening that is transferable between multiple configurations sampled during first principles moleculardynamics simulations; hence it leads to a substantial improvement in the efficiency of calculations of finite temperaturespectra. We obtained computational gains of one to two orders of magnitude for systems with 50 to 500 atoms, includingliquids, solids, nanostructures, and solid/liquid interfaces. Importantly, the models of dielectric screening derived heremay be used not only in the solution of the BSE but also in developing functionals for time-dependent density functionaltheory (TDDFT) calculations of homogeneous and heterogeneous systems. Overall, our work provides a strategy tocombine machine learning with electronic structure calculations to accelerate first principles simulations of excited-stateproperties.
IntroductionCharacterization of materials often involves investigatingtheir interaction with light. Optical absorption spectroscopyis one of the key experimental techniques for such character-ization, and the simulation of optical absorption spectra isessential for interpreting experimental observations and pre-dicting design rules for materials with desired properties. Inrecent years, absorption spectra of condensed systems havebeen successfully predicted by solving the Bethe-Salpeterequation (BSE)1–11 in the framework of many-body pertur-bation theory (MBPT).12–17 However, for large and com-plex systems, the use of MBPT is computationally demand-ing.18–26 It is thus desirable to develop methods that canimprove the efficiency of optical spectra calculations, espe-cially if results at finite temperature (T) are desired.Simulation of absorption spectra at finite T can be
achieved by performing, e.g., first principles molecular dy-namics (FPMD)27 and by solving the BSE for uncorrelatedsnapshots extracted from FPMD trajectories. A spectrumcan then be obtained by averaging over the results obtainedfor each snapshot.28–31
Several schemes have been proposed in the literature toreduce the computational cost of solving the BSE,32–34 in-cluding an algorithm that avoids the explicit calculationof virtual single particle electronic states, as well as thestorage and inversion of large dielectric matrices.35,36 Re-cently, a so-called finite-field (FF) approach31,37 has beenproposed, where the calculation of dielectric matrices isbypassed; rather the key quantities to be evaluated arescreened Coulomb integrals, which are obtained by solvingthe Kohn-Sham (KS) equations38,39 for the electrons in afinite electric field. The ability to describe dielectric screen-ing through finite field calculations also led to the formula-tion of GW37,40 and BSE31 calculations beyond the randomphase approximation (RPA), and of a quantum embeddingapproach41,42 scalable to large systems.
From a computational standpoint, one important aspectof solving the Kohn-Sham equations in finite field is that thecalculations can be straightforwardly combined with the re-cursive bisection algorithm43 and thus, by harnessing orbitallocalization, one may greatly reduce the number of screenedCoulomb integrals that need to be evaluated. Importantly,
1
arX
iv:2
012.
1224
4v2
[co
nd-m
at.m
trl-
sci]
17
Feb
2021

the workload to compute those integrals is of O(N4), ir-respective of whether semilocal or hybrid functionals areused.31 In spite of the improvement brought about by theFF algorithm and the use of the bisection algorithm, thesolution of the BSE remains a demanding task. One of thequantities particularly challenging to evaluate is the dielec-tric matrix of the system, that describes many-body screen-ing effects between the interacting electrons. Intuitively wecan understand a dielectric matrix as a complex filter thatconnects the bare (i.e., unscreened) Coulomb interaction be-tween the electrons to an effective, screened Coulomb inter-action. Such screened interaction is used in MBPT to ap-proximately account for electronic correlation effects, whensolving the Dyson equation (GW) and the BSE. Here weturn to machine learning (ML), in order to tackle the chal-lenge of evaluating the dielectric matrix.Specifically, for a chosen atomic configuration of a solid
or a molecule, we use ML techniques to derive a mappingfrom the unscreened to the screened Coulomb interaction,thus deriving a model of the dielectric screening. Once sucha model is available, it can be re-used for multiple configu-rations sampled in a FPMD at finite temperature, withoutthe need to recompute a complex dielectric matrix for eachsnapshot. Hence the use of a ML-derived model may greatlyimprove the efficiency of the calculation of finite T absorp-tion spectra, provided the dielectric screening is weakly de-pendent on atomic configurations explored as a function ofsimulation time. We will show below that this assumptionis indeed verified for several disordered systems, includingliquid water and Si/water interfaces at ambient conditionsand silicon clusters. Importantly, the use of ML-derivedmodels leads to a reduction of 1 to 2 orders of magnitudein the computational workload required to obtain the di-electric screening for the simulation of optical absorptionspectra at finite temperature. Another important advan-tage of the ML-derived dielectric screening is that it providesinsight into the approximate screening parameters used inthe derivation of hybrid functionals for time-dependent DFT(TDDFT) calculations, including dielectric-dependent hy-brid (DDH) functionals.44–48We emphasize that the strategy adopted here is differ-
ent in spirit from strategies that use ML to infer structure-property relationships49–57 or relationships between compu-tational and experimental data58. We do not seek to relatestructural properties of a molecule or a solid to its absorptionspectrum. Rather, either we consider a known microscopicstructure of the system or we determine the structure bycarrying out first principles MD (e.g., in the case of liquidwater or a solid/liquid interface). Then, for a given atom-istic configuration we use ML techniques to obtain the modelbetween the unscreened and the screened Coulomb interac-tion, and we use such a model in the solution of the BSE formultiple configurations.Hence the method proposed here is conceptually different
from the approaches previously adopted to predict the ab-sorption spectra of molecules or materials using ML.58–63.For example, Ghosh et al.61 predicted molecular excitation
spectra from the knowledge of molecular structures at zeroT, by using neural networks trained with a dataset of 132531small organic molecules. Carbone et al.62 mapped molec-ular structures to X-ray absorption spectra using message-passing neural networks, and a dataset of ∼134000 smallorganic molecules. Xue et al.63 focused on two specificmolecules and used a kernel ridge regression model trainedwith a minimum of several hundred molecular geometriesand their corresponding excitation energies and oscillatorstrengths computed at the TDDFT64 level; they then usedthe results to predict the excitation energies and oscillatorstrengths of an ensemble of geometries and absorption spec-tra.
All of these methods seek to relate structure to function(absorption spectra). The method presented here uses in-stead ML to replace a computationally expensive step infirst principles simulations, and as we show below, leads tophysically interpretable results. The rest of the paper is or-ganized as follows. In the next section, we briefly summarizeour computational strategy. We then discuss homogeneoussystems, including liquid water and periodic solids, followedby results for heterogeneous and finite systems. We con-clude by highlighting the innovation and key results of ourwork.
MethodsWe first briefly summarize the technique used here to solvethe BSE, including the use of bisection techniques to im-prove the efficiency of the method. We then describe themethod based on ML to obtain the dielectric screening en-tering the BSE, including the description of the training setof integrals. These integrals are computed for a chosen con-figuration of a molecule or a solid.
Using the linearized Liouville equation31,35,36,65 and theTamm-Dancoff approximation66, the absorption spectrumof a solid or molecule can be computed from DFT38,39 singleparticles eigenfunctions as:
S(ω)∝3∑
i=1
nocc∑
v=1〈ψv|ri|ai
v(ω)〉+ c.c. (1)
where ω is the absorption energy, ri are the Cartesian com-ponents of the dipole operator, nocc is the total number ofoccupied orbitals, and | ψv〉 is the v-th occupied orbital ofthe unperturbed KS Hamiltonian, H0, corresponding to theeigenvalue εv. The functions | ai
v〉 are obtained from thesolution of the following equation:31,35,36
nocc∑
v′=1(ωδvv′ −Dvv′ −K1e
vv′ +K1dvv′) | ai
v′〉= Pcri | ψv〉 (2)
whereDvv′ | ai
v′〉= Pc(H0− εv)δvv′ | aiv′〉, (3)
K1evv′ | ai
v′〉= 2Pc
(∫dr′Vc(r,r′)ψ∗v′(r′)ai
v′(r′))ψv(r), (4)
2

K1dvv′ | ai
v′〉= Pcτvv′(r)aiv′(r), (5)
Pc = 1−∑noccv=1 | ψv〉〈ψv | is the projector on the unoccupied
manifold, and Vc = e2
|r−r′| is the unscreened Coulomb poten-tial. Following the derivation reported by Nguyen et al.,31we defined screened Coulomb integrals, τvv′ , entering Eq. 5,as:
τvv′(r) =∫W (r,r′)ψv(r′)ψ∗v′(r′)dr′ (6)
= τuvv′(r) + ∆τvv′(r), (7)
where the screened Coulomb interaction W is given byW = ε−1Vc, and ε−1 is the inverse of the dielectric matrix(dielectric screening). Analogously, unscreened Coulomb in-tegrals, τu
vv′ , are defined as:
τuvv′(r) =
∫Vc(r,r′)ψv(r′)ψ∗v′(r′)dr′. (8)
By carrying out finite field calculations31,37,40, one can ob-tain screened Coulomb integrals without an explicit evalu-ation of the dielectric matrix (Eq. 6), but rather by addingto the unscreened Coulomb integrals the second term on theright hand side of Eq. 7, which is computed as:
∆τvv′(r) =∫Vc(r,r′)
ρ+vv′(r′)−ρ−vv′(r′)
2 dr′. (9)
The densities ρ±vv′ are obtained by solving the KS equationswith the perturbed Hamiltonian H ± τu
vv′ ; both indexes vand v′ run over all occupied orbitals. While all potentialterms of H may be computed self-consistently31, in thiswork the exchange-correlation potential was evaluated forthe initial unperturbed electronic density and kept fixed dur-ing the self-consistent iterations. This amounts to evaluat-ing the dielectric screening within the RPA. The FF-BSEapproach has been implemented by coupling the WEST18
and Qbox67 codes in client-server mode.31,37,68The maximum number of integrals, nint = nocc(nocc +
1)/2, is determined by the total number of pairs of occu-pied orbitals. The actual number of integrals to be evalu-ated can be greatly reduced by using the recursive bisectionmethod,43 which allows one to localize orbitals and consideronly integrals generated by pairs of overlapping orbitals31.The systems studied in this work contain tens to hundredsof atoms, with hundreds to thousands of electrons. For ex-ample, for one of the Si/water interfaces discussed below, weconsidered a slab with 420 atoms, 1176 electrons and eachsingle particle state is doubly occupied. Hence, nocc=588,and nint = 173166. Using the recursive bisection methodthe total number of vv′ pairs is reduced to nint = 5574 (areduction factor slightly larger than 30) without compro-mising accuracy, when a bisection threshold of 0.05 and fivebisection levels in each Cartesian direction are adopted43.We note that the Liouville formalism used in this work
(Eq. 1) only involves summations over occupied states. Suchformalism was shown to yield absorption spectra equivalent
to solving the BSE with explicit and converged summationsover empty states.31,35,36 The same formalism may also beused to describe absorption spectra within TDDFT64, al-beit employing a different definition of the K1e and K1d
terms.15,31,65,69–72The key point of our work is the use of ML to generate
a model for the calculation of screened Coulomb integrals(Eq. 7) that is transferable to multiple atomic configura-tions; the goal is to reduce the computational cost in thesolution of Eq. 1. In particular, we consider the mappingbetween unscreened Coulomb integrals, τu
vv′, and screenedCoulomb integrals, ∆τvv′. Such transformation is mappingnint pairs of a 3D array, i.e., F : τu
vv′ → ∆τvv′ , ∀v,v′ ∈[1, · · · ,nocc] and is similar to 3D image processing. Ourobjective is to learn the mapping functions and hence it isnatural here to use convolutional neural networks (CNN), awidely used technique in image classification. CNNs are ar-tificial neural networks with spatial-invariant features. Thescreened and unscreened Coulomb integrals are related bythe dielectric matrix, which describes a linear response func-tion of the system to an external perturbation. Therefore,the mapping we aim to obtain should follow a linear re-lationship for physical reasons, and one convolutional layerwithout nonlinear activation functions should be considered.Here, the surrogate model F , used to bypass the explicitcalculation of Eq. 9, is represented by a single convolutionallayer K:
∆τvv′(x,y,z) = (K ∗ τuvv′)(x,y,z) (10)
where K is the convolutional filter of size (nx,ny,nz) (seethe Electronic Supplementary Information (ESI) for details).
The filter, K, is determined through an optimization pro-cedure that utilizes nint pairs of τu
vv′ and ∆τvv′ as thedataset, obtained for one configuration (i.e., one set ofatomic positions) using Eq. 8 and Eq. 9, respectively. There-fore this filter captures features in the dielectric screeningthat are translationally invariant. When the filter size isreduced to (1,1,1), the training procedure is effectively alinear regression and Eq. 10 amounts to applying a globalscaling factor to τu
vv′ , which we label fML.In our calculations, the mapping F corresponds to eval-
uating the dielectric screening arising from the short-wavelength part (i.e., the body) of the dielectric matrix.The long-wavelength part (i.e., the head of the dielectricmatrix) corresponds to the macroscopic dielectric constantε∞. The definitions of the head and body of the dielectricmatrix are given in Eq. S1 of the ESI.
One of the main advantages of a ML-based model for thescreening is that it may be reused for multiple configura-tions sampled during a FPMD simulation, thus avoiding thecalculations of dielectric matrices for each snapshot, as illus-trated in Figure 1.The validity of such an approach and itsrobustness are discussed below for several systems. In ourcalculations, we carried out FPMD with the Qbox67 codeand MBPT theory calculations with the WEST18 code, cou-pled in client server mode with Qbox in order to evaluate thescreened integrals (Eq.s 7-9), which constitute our trainingdataset. We implemented an interface between Tensorflow73
3

and WEST, including a periodic padding of the data for theconvolution in Eq. 10, in order to satisfy periodic bound-ary conditions. The computational details of each systeminvestigated here are reported in the ESI.
First Principles Molecular Dynamics
Tem
pera
ture
(T)
#1 #2 #3
Time Step
Dielectric Response CalculationF: Unscreened → Screened Coulomb
From Machine Learning
Thermal Average
Abso
rptio
n In
tens
ity
Energy
BSE Solution
t
Figure 1 Illustration of the strategy to predict absorption spec-tra at finite temperature based on the solution of the Bethe-Salpeter equation (BSE) and machine learning techniques. F isthe mapping obtained by machine learning.
ResultsWe now turn to present our results for several systems, start-ing from liquid water.
LiquidsTo establish baseline results with small computational cost,we first considered a water supercell containing 16 watermolecules. We tested the accuracy of a single convolutionallayer with different filter sizes, from (1,1,1) to (20,20,20).We find that a convolutional model (Eq. 10) can be used tobypass the calculation of ∆τ in Eq. 9, yielding absorption
spectra in good agreement with the FF-BSE method. Inparticular, we find that a filter size of (1,1,1), i.e., a globalscaling factor, is sufficient to accurately yield the positionsof the lower-energy peaks of the absorption spectra, with anerror of only -0.03 eV (see the ESI for a detailed quantifica-tion of the error).
We then turned to interpret the meaning of the globalscaling factor fML, and we computed the quantity εML
f =(1 +fML)−1. For 20 independent snapshots extracted froma FPMD trajectory of the 16-H2O system, we find thatεMLf (1.84± 0.02 is the same, within statistical error bars,as that of the PBE74 macroscopic static dielectric constantcomputed using the polarizability tensor (as implemented inthe Qbox code67): εPT∞ = 1.83±0.01. Therefore, the globalscaling factor that we learned is closely related to the long-wavelength dielectric constant of the system. Interestingly,we obtained similar scaling factors for a simulation using alarger cell, with 64-molecules, e.g., εML
f = 1.83 for a given,selected snapshot, for which εPT∞ = 1.86. To further inter-pret the factor fML obtained by ML, we computed the aver-age of ∆τvv′/τu
vv′ over all vv′. Specifically, we define fAvg =1Ω∫fAvg(r)dr, where fAvg(r) = 1
Nvv′∑
v,v′ ∆τvv′(r)/τuvv′(r),
Ω is the volume of the simulation cell, and Nvv′ is thetotal number of vv′ in the summation. Using one snap-shot of the 16-H2O system as an example, we find thatεAvgf = (1 + fAvg)−1 = 1.79, similar to εML
f = 1.86 for thesame snapshot.
To evaluate how sensitive the peak positions in the absorp-tion spectra of water are to the value of the global scalingfactor, we varied εf from 1.67 to 1.92. We find that theposition of the lowest-energy peak varies approximately in alinear fashion, from 8.69 eV to 8.76 eV. This analysis showsthat a global scaling factor is sufficient to represent the av-erage effect of the body (i.e., short-wavelength part) of thedielectric matrix and that this factor is approximately equalto the head of the matrix (related to the long-wavelength di-electric constant). Hence, our results show that a diagonaldielectric matrix is a sufficiently good approximation to rep-resent the screening of liquid water and to obtain its opticalspectrum by solving the BSE. This simple finding is in factan important result, leading to a substantial reduction inthe computational time necessary to obtain the absorptionspectrum of water at the BSE level of theory.
In order to understand how the screening varies over aFPMD trajectory, we applied the global scaling factor fML
obtained from one snapshot of the 16-H2O system to 10different snapshots of a 64-H2O system,75 at the same T,400 K, and we computed an average spectrum. As shownin Figure 2, we can accurately reproduce the average spec-trum computed with FF-BSE. The RMSE between the twospectra is 0.027. These results show that the global scal-ing factor is transferable from the 16 to the 64 water celland that the dependence of the global scaling factor on theatomic positions may be neglected, for the thermodynamicconditions considered here. While it was recognized that thedielectric constant of water is weakly dependent on the cell
4

size, it was not known that the average effect of the bodyof the dielectric matrix is also weakly dependent on the cellsize. In addition, our results show that the dielectric screen-ing can be considered independent from atomic positions forwater at ambient conditions. This property of the dielectricscreening was not previously recognized; it is not only animportant recognition from a physical standpoint, but alsofrom an efficiency standpoint, to improve the efficiency ofBSE calculations.
0 5 10 15 20 25 (eV)
0.0
0.2
0.4
0.6
0.8
1.0
Inte
nsity
(arb
. uni
t)
FF-BSEML-BSE
Figure 2 Averaged spectra of liquid water obtained by solvingthe Bethe-Salpeter equation (BSE) in finite field (FF) and usingmachine learning techniques (ML). Results have been averagedover 10 snapshots obtained from first principles simulations at400K, using supercells with 64 water molecules. The variabilityof the FF-BSE spectra within the 10 snapshots is shown in theinset. See also Figure S4 of the ESI for the same variability whenusing ML-BSE.
The timing acceleration of ML-BSE compared to FF-BSEis a function of the size of the system (characterized by thenumber of screened integrals nint and the number of planewaves (PWs) npw). We denote by td the total number ofcore hours required to compute the net screening ∆τ forall pairs of orbitals. We do not include in td the trainingtime, which usually takes only several minutes on one GPUfor the systems studied here. Since we perform the trainingprocedure once, we consider the training time to be negligi-ble. We define the acceleration to compute the net effect ofthe screening as αd = tFF-BSEd /tML-BSE
d , and we find that αd
increases as nint and npw increase. See the ESI for details.
For the 64-H2O system discussed above, we used a bi-section threshold equal to 0.05, and a bisection level of2 for each of the Cartesian direction. This reduces nintfrom 256(256 + 1)/2 = 32896 to 3303. In this case, the gainachieved with our machine learning technique is close to twoorders of magnitude: αd = 87.
SolidsWe now turn to discussing the accuracy of ML-BSE for sev-eral solids, including LiF, MgO, Si, SiC, and C (diamond),for which we found again remarkable efficiency gains, rang-ing from 13 to 43 times for supercells with 64 atoms. In allcases, we used the experimental lattice constants.76 Simi-lar to water, we found that a convolutional model (Eq. 10)can reproduce the absorption spectra of solids at the FF-BSE level, and that global scaling factors, either from linearregression or from averaging ∆τ/τu yield similar accuracy(Figures S6,S7 of the ESI). As shown in Figure 3, wherewe have defined fPT = (εPT∞ )−1− 1, we found that fML isagain numerically close to fPT, for εPT∞ computed using thepolarizability tensor,67 and the same level of theory and k-point sampling. These results show that, for ordered solids,the average effect of the body (short-wavelength part) of thedielectric matrix, εML
f , is similar to that of the head (long-wavelength limit) of the matrix and hence a diagonal screen-ing is sufficient to describe the absorption spectra, similar tothe case of water. This is an interesting result that supportsthe validity of the approximation chosen to derive the DDHfunctional.44–46,77–82
1.00 0.75 0.50 0.25 0.00fML
1.00.80.60.40.20.0
fPT LiFMgO
SiSiCC
Figure 3 Relationship between the scaling factor obtained bymachine learning (fML) and that obtained by computing thedielectric constant at the same level of theory (fPT) (see text).
We note that the FF-BSE algorithm uses the Γ point andis efficient and appropriate for large systems. In order to ver-ify that a diagonal dielectric matrix is an accurate approxi-mation also when using unit cells and fine grids of k-points,we computed the absorption spectrum of Si with a 2-atomcell and a 12× 12× 12 k-point grid, using the Yambo83,84code. We then compared the results with those obtained us-ing a diagonal approximation of the dielectric matrix, andelements derived from the long-wavelength dielectric con-stant computed with the same cell and k-point grid. Fig. 4shows that we found an excellent agreement between the twocalculations, of the same quality as that obtained for waterin the previous section.
5

2.0 2.5 3.0 3.5 4.0 4.5 5.0 5.5 6.0 (eV)
0.0
0.2
0.4
0.6
0.8
1.0In
tens
ity (a
rb. u
nit)
BSEModel-BSEExp
Figure 4 Absorption spectrum of crystalline Si computed bysolving the Bethe-Salpeter equation (BSE) starting from PBE74
wavefunctions, using a 2-atom cell and 12×12×12 k-point sam-pling (blue line). The orange dashed line (Model-BSE) shows thesame spectrum computed using a diagonal dielectric matrix withdiagonal elements equal to ε∞ = 12.21 (see text). Experimentalresults85 are shown by the green dotted line.
It is important to note that the method presented hereto learn the filter between unscreened and screened inte-grals represents a way of obtaining a model dielectric func-tion with ML techniques, and without the need of using adhoc empirical parameters. Several model dielectric functionshave been proposed to speed-up the solution of the BSE forsolids over the years.48,86–92 Recently, Sun et al.48 proposeda simplified BSE method that utilizes a model dielectricfunction (m-BSE). The authors used the model of Cappelliniet al.90 with an empirical parameter, which they determinedby averaging the values minimizing the RMSE between amodel dielectric function and that obtained within the RPAfor Si, Ge, GaAs, and ZnSe.93 This simplified BSE methodyields good agreement with the results of the full BSE so-lution. For example, in the case of LiF, the shift betweenthe first peak obtained with m-BSE and BSE is 0.12 eV,to be compared to the shift of 0.04 eV found here, betweenML-BSE and FF-BSE. A model dielectric function has beenproposed also for 2D semiconductors94 and silicon nanopar-ticles95,96. However, the important difference between ourwork and the models just described is that the latter re-quires empirical parameterization. One of the advantages ofthe ML approach adopted here is that it does not requirethe definition of empirical parameters and, importantly, itmay also be applied to nanostructures and heterogeneoussystems, such as solid/liquid interfaces, as discussed next.
InterfacesWe have shown that for solids and liquids, the use of MLleads to the definition of a global scaling factor that, whenutilized to model the screened Coulomb interaction, yields
results for absorption spectra in very good agreement withthose of the full FF-BSE calculations, at a much lower com-putational cost. We now discuss solid/liquid interfaces asprototypical heterogeneous systems.
We considered two silicon/water interfaces modeled by pe-riodically repeated slabs. One is the H-Si/water interface,a hydrophobic interface with 420 atoms (72 Si atoms and108 water molecules; Si surface capped by 24 H atoms); theother is a COOH-Si/water interface, a hydrophilic interfacewith 492 atoms (72 Si atoms and 108 water molecules; Sisurface capped by 24 -COOH groups).97 Not unexpectedly,we found that neither a global scaling factor nor a convolu-tional model is sufficiently accurate to reproduce the spec-tra obtained with FF-BSE, as shown in Figure S10 of theESI. Therefore, we have developed a position-dependent MLmodel to describe the variation of the dielectric propertiesin the Si, water and interfacial regions. We divided the gridof τvv′ into slices, each spanning one xy plane parallel tothe interface; we then trained for a model on each slice. Inthis way we describe translationally invariant features alongthe x and y directions, and we obtain a z-dependent convo-lutional filter K(z) or z-dependent scaling factors fML(z).We found that a position-dependent filter, K(z), or a scalingfactor for each slice, fML(z), yield a comparable accuracy,and therefore we focus on the fML(z) model, which is sim-pler.
We found that the z-dependent ML model fML(z) is ac-curate to represent the screening of the Si/water interfaceswhen computing absorption spectra (Figure 5). Togetherwith Figure S10 in the ESI, our finding show that a blockdiagonal dielectric matrix, where all the diagonal elements inthe dielectric matrix have the same value, is not a good rep-resentation of the screening, unlike the case of water and or-dered, periodic solids; instead taking into account the bodyof the dielectric matrix as in the fML(z) model is critical inthe case of an interface.
Depending on how the grid of τvv′ are divided, we obtaindifferent fML(z) profiles for Si/water interfaces. Figure 5shows the spectra in the case of fML(z) defined by two pa-rameters (a constant value in the Si region, and a differentconstant value in the water region); we name this profilefML
p2 (z). In Figure S11(a) of the ESI, we present the spec-tra obtained using fML(z) in the case of 108 slices evenlyspaced in the z direction, which we call fML
p108(z). The func-tion εML
f (z) corresponding to fMLp108(z) presents maxima at
the interfaces, and minima at the points furthest away fromthe interface, in the Si and the water regions (Figure S11(b)of the ESI).
In order to interpret our findings, we express ∆τ in termsof projective dielectric eigenpotentials, (PDEP)98,99 and wedecompose fAvg(r) into contributions from each individualPDEP,100 i.e., fAvg =
∑i f
Avgi , where
fAvgi (r) = 1Nv,v′
∑
v,v′
φi(r)(λi/(1−λi))∫φ∗i (r′′)τu
vv′(r′′)dr′′τu
vv′(r)(11)
6

Figure 5 Comparison of absorption spectra obtained by solving the Bethe-Salpeter equation (BSE) in finite field (FF) and usingmachine learning (ML) techniques for (a) a H-Si/water interface shown in the lower left panel and (b) a COOH-Si/water interface(shown in the lower right panel). Blue, red and white spheres represent Si, oxygen and hydrogen respectively. C is represented bybrown spheres. (See the ESI for results from using a kinetic energy cutoff of 60 Ry for wavefunctions.)
and φi is the i-th eigenpotential of the static dielectric ma-trix corresponding to the eigenvalue λi. We find that thelargest contribution to fAvg(r) comes from the eigenvectorscorresponding to the most negative PDEP eigenvalue. ThisPDEP component has its maximum near the interfaces, withthe square modulus of the corresponding PDEP eigenpoten-tial being localized at the interfaces (Figure S12 of the ESI).This shows that the maximum of εML
f (z) at the interfacesstem from the contribution of the PDEP eigenpotential withthe most negative eigenvalue.Interestingly, fML
p2 (z) and fMLp108(z) yield absorption spec-
tra of similar quality. This suggests that the absorptionspectrum is not sensitive to the details of the profile at theinterface, at least in the case of the H-Si/water interface(Figure 5(a) and Figure S11 of the ESI) and the COOH-Si/water interface (Figure 5(b) and Figure S15 of the ESI)studied here. However, knowing the functional form offML
p108(z) is useful to determine the location of the interfaces,and it can be used to define where the discontinuities infML
p2 (z) are located.
We further developed a 3D grid model, fML(r). This is asimple extension of the z-dependent model, where instead ofslicing τvv′ in only one direction, we equally divided τvv′ intosub-domains in all three Cartesian directions. We testedcubic sub-domains of side lengths from 0.6 Å to 2.6 Å,and we found that the accuracy of the resulting spectrumis similar to that obtained with the z-dependent model, asshown in Figure S13 of the ESI.
In order to verify the transferability of the position-dependent model derived for one snapshot extracted fromFPMD to other snapshots, we computed absorption spectraby using the same fML(z) for different snapshots generatedat ambient conditions and we found that the screening isweakly dependent on the atomic positions, at these con-ditions, similar to the case of water discussed above (Fig-ure S14 of the ESI).
In summary, by obtaining εMLf (z) from machine learn-
ing, we have provided a way to define a position-dependentdielectric function for heterogeneous systems. For theSi/water interfaces, the acceleration to compute the netscreening effect is αd = 86 for H-Si/water if bisection tech-niques are used (nint = 5574), and αd = 224 for COOH-Si/water, again if bisection techniques are used (nint =8919).
NanoparticlesAs our last example we consider nanoparticles, i.e., 0Dsystems. We focus on silicon clusters Si35H36 andSi87H76 18,80,101 but we start from a small cluster Si10H16first, to test the methodology. As shown in Figure 6(b),we found that a global scaling factor is not an appropriateapproximation of the screening, e.g., for the spectrum ofSi10H16 computed using PW basis set in a simulation cellwith a large vacuum (cell length over 25 Å). This findingpoints at an important qualitative difference with respect tothe case of solids and liquids (condensed systems). Interest-ingly, we found that convolutional models are instead robust
7

to different sizes of vacuum, and give absorption spectrain good agreement with FF-BSE calculations (Figure 6(a)).The inaccuracy of a global scaling factor stems from tworeasons. One is related to the fact that when the volumeof the vacuum surrounding the cluster becomes large, thedata of the training set is dominated by small matrix ele-ments representing the vacuum region. Because the numer-ical noise is not translationally invariant, the use of Eq. 10overcomes this issue, as the noise from vacuum matrix ele-ments is canceled out in the convolution process. We notethat the presence of nonzero elements in the vacuum regionis due to the choice of the PW basis set, which requires pe-riodic boundary conditions. In the case of isolated clusters,the use of periodic boundary conditions could be avoided bychoosing localized basis set. However, there are several sys-tems of interest where using PW basis set is preferable andvacuum regions are present, such as nanoparticles depositedon surfaces. The second reason responsible for the inaccu-racy of a global scaling factor, even if the noise arising fromvacuum is eliminated, (see Figure S17 of the ESI) is thatthe mapping between τu and ∆τ being is simply more com-plex in nanoparticles than in homogeneous systems. Such acomplexity can be accounted for when using Eq. 10.In order to investigate the dependence of the screening of
nanoparticles on temperature, we transferedthe ML modeltrained for one specific snapshot of the Si35H36 cluster, todifferent snapshots extracted from a FPMD simulation, inorder to predict absorption spectra at finite temperature.We applied the convolutional model with filter size (7,7,7)obtained from the 0 K Si35H36 cluster to 10 snapshots ofSi35H36 from an FPMD trajectory equilibrated at 500 K.As shown in Figure 7, the average ML-BSE spectrum canaccurately reproduce the FF-BSE absorption spectrum at500 K, with a small peak position shift of 0.08 eV. The ML-BSE spectra of individual snapshots is also in good agree-ment with the corresponding spectra computed with FF-BSE, shown in Figure S21 of the ESI. These results showthat for nanoclusters, as for water, the screening is weaklydependent on atomic positions over a 500 K FPMD trajec-tory; note however that the 0 K spectrum (Figure S19 of theESI) has different spectral features than the one collected at500 K (Figure 7).We also found that the convolutional model trained for
Si35H36 can be applied to Si87H76 with an error within 0.07eV for peak positions (Figure 8). The accuracy is compara-ble to the convolutional model from Si87H76 itself, as shownin Figure S23 of the ESI. This shows that the convolutionalmodel captures the nonlocality of the dielectric screeningcommon to Si clusters of different sizes and is transfer-able from a smaller to a larger nanocluster (Si87H76) withinthe size range considered here. The FF-BSE calculation ofSi87H76 is about 6 times more expensive in terms of corehours than that of Si35H36; hence, being able to circumventthe FF-BSE calculation of Si87H76 by using the model Kcomputed for Si35H36 is certainly an advantage.
Conceptually, the convolutional model yields filters thatcapture the translational invariant features of the dataset,
Figure 6 Comparison of absorption spectra of Si10H16 (40Å cell) obtained by solving the Bethe-Salpeter equation (BSE)in finite field (FF) and using machine learning (ML) techniquesfor (a) convolutional layer with filter size (7,7,7) from a cell of 30Å, and (b) a global scaling factor. The RMSE value between theFF-BSE and ML-BSE spectra is 0.067 for (a) and 0.141 for (b),respectively. The accuracy of using a convolutional layer withfilter size (7,7,7) from the 40 Å cell itself is similar to that of (a):RMSE=0.067.
8

0 5 10 15 20 25 (eV)
0.0
0.2
0.4
0.6
0.8
1.0
Inte
nsity
(arb
. uni
t)
FF-BSEML-BSE
Figure 7 Average spectra of Si35H36 obtained by solving theBethe-Salpeter equation (BSE) in finite field (FF) and using ma-chine learning techniques (ML). Results have been averaged over10 snapshots obtained from first principles simulations at 500 K.The variability of the FF-BSE spectra within the 10 snapshots isshown in the inset. See also Figure S20 of the ESI for the samevariability when using ML-BSE.
0 5 10 15 20 25 (eV)
0.0
0.2
0.4
0.6
0.8
1.0
1.2
1.4
1.6
Inte
nsity
(arb
. uni
t)
FF-BSEML-BSE
4 6 8 10
=0.07 eV
=-0.03 eV
Figure 8 Accuracy of the Si87H76 spectrum obtained from ML-BSE by applying a convolutional model with filter size (7,7,7),trained from Si35H36. The RMSE value between the FF-BSEand ML-BSE spectra is 0.033.
and in our case they capture the nonlocality of the screening.In other words, the convolutional filters represent featuresin the mapping from τu
vv′ to ∆τvv′ that are invariant acrossthe simulation cell. For Si clusters, we found that the RMSEvalues between ML-BSE and FF-BSE spectra converges asthe size of the filter increases. For example, for Si35H36,convergence is achieved at the filter size (7,7,7), which cor-responds to a cube with side length (2.24 Å), correspondingapproximately to the Si-Si bond length in the cluster (2.35Å). This result suggests that the screening of the Si clusterhas features of the length of a nearest-neighbor bond thatare translationally invariant.
The timing acceleration αd for calculations of the absorp-tion spectra of the Si35H36 cluster in a cubic cell of 20, 25,or 30 Å in length, is 24, 47, or 90 times, respectively, whenusing bisection techniques (threshold 0.03, 4 levels in eachCartesian direction), as shown in Figure S24 of the ESI. Inthe case of Si87H76 cluster, αd ' 160.
ConclusionsWe presented a method based on machine learning (ML) todetermine a key quantity entering many body perturbationtheory calculations, the dielectric screening; this quantitydetermines the strength of the electron-hole interaction en-tering the BSE. In our ML model, the screening is viewed asa convolutional (linear) filter that transforms the unscreenedinto the screened Coulomb interaction. Our results showthat such a model can be obtained for a chosen atomic con-figuration and then re-used to represent the screening ofmultiple configurations sampled in a FPMD at finite tem-perature for several systems, including water, solid/waterinterfaces, and silicon clusters.
In particular, we found that in the case of homogeneoussystems, e.g. liquid water and several insulating and semi-conducting solids, absorption spectra can be accurately pre-dicted by using a diagonal dielectric matrix. When usingsuch a diagonal form, we found excellent agreement withspectra computed by the full solution of the BSE in finitefield. In addition, our results showed that for liquid waterthe same diagonal approximation can be used to accuratelycompute spectra for different configurations from FPMD atambient conditions, thus easily obtaining a thermal averagerepresenting a finite temperature spectrum.
In the case of nanostructures and heterogeneous systems,such as solid/liquid interfaces, we found that the use ofdiagonal matrices or block-diagonal dielectric matrices todescribe the two portions of the system (Si and water, inthe example chosen here) does not yield accurate spectra;through machine learning of the screening we could definesimple models yielding accurate absorption spectra and asimple way of computing thermal averages. For nanostruc-tures, it is necessary to use a convolutional model to properlyrepresent the nonlocality of the dielectric screening. Similarto water and the Si/water interfaces, we found that the func-tion describing the screening for hydrogenated Si-clustersof about 1 nm does not depend in any substantial way onthe atomic coordinates of the snapshots sampled during our
9

FPMD simulations, up to the maximum temperature testedhere, 500 K.The time savings in the calculations of the screening using
ML are remarkable, ranging from a factor of 13 to 87 for thesolids and liquids studied here, with cells varying from 64 to192 atoms. For the clusters and the interface, we obtainedtime savings ranging from 30 to 224 times, with cells varyingfrom 26 to 492 atoms.Finally, we note that the ML-based procedure presented
here, in addition to substantially speeding up the calcula-tion of spectra, especially at finite T, represents a generalapproach to derive model dielectric functions, which are keyquantities in electronic structure calculations, utilized notonly in the solution of the BSE. For example, our approachprovides a strategy to develop dielectric-dependent hybridfunctionals (DDH)45,79 for TDDFT calculations, as well asan interpretation of the parameters entering model dielectricfunctions.48,86–88,90,92,95,96 In particular, for homogeneoussystems, our findings points at TDDFT with DDH function-als as an accurate method to obtain absorption spectra, con-sistent with the results of Sun et al.48, which were howeverderived semi-empirically. Work is in progress to further de-velop a strategy to develop parameters entering hybrid DFTfunctionals using machine learning.102
Conflicts of interestThere are no conflicts to declare.
AcknowledgementsThe authors thank Bethany Lusch, He Ma, Misha Salim,and Huihuo Zheng for helpful discussions. The work wassupported by Advanced Materials for Energy-Water Sys-tems (AMEWS) Center, an Energy Frontier Research Cen-ter funded by the U.S. Department of Energy, Office ofScience, Basic Energy Sciences (DOE-BES), and MidwestIntegrated Center for Computational Materials (MICCoM)as part of the Computational Materials Science Programfunded by DOE-BES. This research used resources of theArgonne Leadership Computing Facility, which is a DOEOffice of Science User Facility supported under ContractDE-AC02-06CH11357, and resources of the University ofChicago Research Computing Center (RCC). The GM4 clus-ter at RCC is supported by the National Science Founda-tion’s Division of Materials Research under the Major Re-search Instrumentation (MRI) program award no. 1828629.
References[1] E. E. Salpeter and H. A. Bethe, Physical Review, 1951,
84, 1232–1242.
[2] L. Hedin, Physical Review, 1965, 139, A796.
[3] W. Hanke and L. Sham, Physical Review B, 1980, 21,4656.
[4] G. Onida, L. Reining, R. Godby, R. Del Sole andW. Andreoni, Physical Review Letters, 1995, 75, 818.
[5] S. Albrecht, G. Onida and L. Reining, Physical ReviewB, 1997, 55, 10278.
[6] S. Albrecht, L. Reining, R. Del Sole and G. Onida,Physical Review Letters, 1998, 80, 4510.
[7] S. Albrecht, L. Reining, R. Del Sole and G. Onida,physica status solidi (a), 1998, 170, 189–197.
[8] L. X. Benedict, E. L. Shirley and R. B. Bohn, PhysicalReview Letters, 1998, 80, 4514.
[9] M. Rohlfing and S. G. Louie, Physical Review Letters,1998, 81, 2312.
[10] M. Rohlfing and S. G. Louie, Physical Review B, 2000,62, 4927.
[11] X. Blase, I. Duchemin and D. Jacquemin, ChemicalSociety Reviews, 2018, 47, 1022–1043.
[12] G. Strinati, La Rivista del Nuovo Cimento (1978-1999), 1988, 11, 1–86.
[13] G. Onida, L. Reining and A. Rubio, Reviews of Mod-ern Physics, 2002, 74, 601–659.
[14] R. M. Martin, L. Reining and D. M. Ceperley, Inter-acting electrons, Cambridge University Press, 2016.
[15] Y. Ping, D. Rocca and G. Galli, Chemical Society Re-views, 2013, 42, 2437–2469.
[16] M. Govoni and G. Galli, Journal of Chemical Theoryand Computation, 2018, 14, 1895–1909.
[17] D. Golze, M. Dvorak and P. Rinke, Frontiers in Chem-istry, 2019, 7, 377.
[18] M. Govoni and G. Galli, Journal of Chemical Theoryand Computation, 2015, 11, 2680–2696.
[19] H. Seo, M. Govoni and G. Galli, Scientific Reports,2016, 6, 1–10.
[20] A. P. Gaiduk, M. Govoni, R. Seidel, J. H. Skone,B. Winter and G. Galli, Journal of the AmericanChemical Society, 2016, 138, 6912–6915.
[21] P. Scherpelz, M. Govoni, I. Hamada and G. Galli,Journal of Chemical Theory and Computation, 2016,12, 3523–3544.
[22] H. Seo, H. Ma, M. Govoni and G. Galli, Physical Re-view Materials, 2017, 1, 075002.
[23] R. L. McAvoy, M. Govoni and G. Galli, Journal ofChemical Theory and Computation, 2018, 14, 6269–6275.
[24] T. J. Smart, F. Wu, M. Govoni and Y. Ping, Phys.Rev. Materials, 2018, 2, 124002.
[25] A. P. Gaiduk, T. A. Pham, M. Govoni, F. Paesani andG. Galli, Nature Communications, 2018, 9, 1–6.
10

[26] M. Gerosa, F. Gygi, M. Govoni and G. Galli, NatureMaterials, 2018, 17, 1122–1127.
[27] R. Car and M. Parrinello, Physical Review Letters,1985, 55, 2471.
[28] V. Garbuio, M. Cascella, L. Reining, R. Del Sole andO. Pulci, Physical Review Letters, 2006, 97, 137402.
[29] D. Lu, F. Gygi and G. Galli, Physical Review Letters,2008, 100, 147601.
[30] L. Bernasconi, The Journal of Chemical Physics, 2010,132, 184513.
[31] N. L. Nguyen, H. Ma, M. Govoni, F. Gygi andG. Galli, Physical Review Letters, 2019, 122, 237402.
[32] M. Marsili, E. Mosconi, F. De Angelis and P. Umari,Physical Review B, 2017, 95, 075415.
[33] J. D. Elliott, N. Colonna, M. Marsili, N. Marzari andP. Umari, Journal of Chemical Theory and Computa-tion, 2019, 15, 3710–3720.
[34] F. Henneke, L. Lin, C. Vorwerk, C. Draxl, R. Kleinand C. Yang, Communications in Applied Mathemat-ics and Computational Science, 2020, 15, 89–113.
[35] D. Rocca, D. Lu and G. Galli, The Journal of Chem-ical Physics, 2010, 133, 164109.
[36] D. Rocca, Y. Ping, R. Gebauer and G. Galli, PhysicalReview B, 2012, 85, 045116.
[37] H. Ma, M. Govoni, F. Gygi and G. Galli, Journal ofChemical Theory and Computation, 2019, 15, 154–164.
[38] P. Hohenberg and W. Kohn, Physical Review, 1964,136, B864.
[39] W. Kohn and L. J. Sham, Physical Review, 1965, 140,A1133.
[40] H. Ma, M. Govoni, F. Gygi and G. Galli, Journal ofChemical Theory and Computation, 2020, 16, 2877–2879.
[41] H. Ma, M. Govoni and G. Galli, npj ComputationalMaterials, 2020, 6, 1–8.
[42] H. Ma, N. Sheng, M. Govoni and G. Galli, PhysicalChemistry Chemical Physics, 2020.
[43] F. Gygi, Physical Review Letters, 2009, 102, 166406.
[44] T. Shimazaki and Y. Asai, The Journal of ChemicalPhysics, 2009, 130, 164702.
[45] J. H. Skone, M. Govoni and G. Galli, Physical ReviewB, 2014, 89, 195112.
[46] M. Gerosa, C. Bottani, C. Di Valentin, G. Onida andG. Pacchioni, Journal of Physics: Condensed Matter,2017, 30, 044003.
[47] W. Chen, G. Miceli, G.-M. Rignanese andA. Pasquarello, Physical Review Materials, 2018,2, 073803.
[48] J. Sun, J. Yang and C. A. Ullrich, Physical ReviewResearch, 2020, 2, 013091.
[49] G. Montavon, M. Rupp, V. Gobre, A. Vazquez-Mayagoitia, K. Hansen, A. Tkatchenko, K.-R. Müllerand O. A. Von Lilienfeld, New Journal of Physics,2013, 15, 095003.
[50] F. Brockherde, L. Vogt, L. Li, M. E. Tuckerman,K. Burke and K.-R. Müller, Nature Communications,2017, 8, 1–10.
[51] M. Welborn, L. Cheng and T. F. Miller III, Journal ofChemical Theory and Computation, 2018, 14, 4772–4779.
[52] G. R. Schleder, A. C. M. Padilha, C. M. Acosta,M. Costa and A. Fazzio, Journal of Physics: Mate-rials, 2019, 2, 032001.
[53] K. Ryczko, D. A. Strubbe and I. Tamblyn, PhysicalReview A, 2019, 100, 022512.
[54] F. Noé, A. Tkatchenko, K.-R. Müller and C. Clementi,Annual Review of Physical Chemistry, 2020, 71, 361–390.
[55] F. Häse, L. M. Roch, P. Friederich and A. Aspuru-Guzik, Nature Communications, 2020, 11, 1–11.
[56] C. Sutton, M. Boley, L. M. Ghiringhelli, M. Rupp,J. Vreeken and M. Scheffler, Nature Communications,2020, 11, 1–9.
[57] M. Bogojeski, L. Vogt-Maranto, M. E. Tuckerman,K.-R. Müller and K. Burke, Nature Communications,2020, 11, 1–11.
[58] H. S. Stein, D. Guevarra, P. F. Newhouse, E. Soedar-madji and J. M. Gregoire, Chemical Science, 2018, 10,47–55.
[59] M. Gastegger, J. Behler and P. Marquetand, ChemicalScience, 2017, 8, 6924–6935.
[60] S. Ye, W. Hu, X. Li, J. Zhang, K. Zhong, G. Zhang,Y. Luo, S. Mukamel and J. Jiang, Proceedings ofthe National Academy of Sciences, 2019, 116, 11612–11617.
[61] K. Ghosh, A. Stuke, M. Todorović, P. B. Jørgensen,M. N. Schmidt, A. Vehtari and P. Rinke, AdvancedScience, 2019, 0, 1801367.
11

[62] M. R. Carbone, M. Topsakal, D. Lu and S. Yoo, Phys-ical Review Letters, 2020, 124, 156401.
[63] B.-X. Xue, M. Barbatti and P. O. Dral, The Journalof Physical Chemistry A, 2020, 124, 7199–7210.
[64] E. Runge and E. K. U. Gross, Physical Review Letters,1984, 52, 997–1000.
[65] B. Walker, A. M. Saitta, R. Gebauer and S. Baroni,Physical Review Letters, 2006, 96, 113001.
[66] S. Hirata and M. Head-Gordon, Chemical Physics Let-ters, 1999, 314, 291–299.
[67] F. Gygi, IBM Journal of Research and Development,2008, 52, 137–144.
[68] M. Govoni, J. Whitmer, J. de Pablo, F. Gygi andG. Galli, npj Computational Materials, 2021.
[69] J. Hutter, The Journal of Chemical Physics, 2003,118, 3928–3934.
[70] D. Rocca, R. Gebauer, Y. Saad and S. Baroni, TheJournal of Chemical Physics, 2008, 128, 154105.
[71] O. B. Malcıoğlu, R. Gebauer, D. Rocca and S. Baroni,Computer Physics Communications, 2011, 182, 1744–1754.
[72] X. Ge, S. J. Binnie, D. Rocca, R. Gebauer and S. Ba-roni, Computer Physics Communications, 2014, 185,2080–2089.
[73] M. Abadi, A. Agarwal, P. Barham, E. Brevdo,Z. Chen, C. Citro, G. S. Corrado, A. Davis, J. Dean,M. Devin, S. Ghemawat, I. Goodfellow, A. Harp,G. Irving, M. Isard, Y. Jia, R. Jozefowicz, L. Kaiser,M. Kudlur, J. Levenberg, D. Mané, R. Monga,S. Moore, D. Murray, C. Olah, M. Schuster, J. Shlens,B. Steiner, I. Sutskever, K. Talwar, P. Tucker,V. Vanhoucke, V. Vasudevan, F. Viégas, O. Vinyals,P. Warden, M. Wattenberg, M. Wicke, Y. Yu andX. Zheng, TensorFlow: Large-Scale Machine Learn-ing on Heterogeneous Systems, 2015, https://www.tensorflow.org/, Software available from tensor-flow.org.
[74] J. P. Perdew, K. Burke and M. Ernzerhof, PhysicalReview Letters, 1996, 77, 3865–3868.
[75] W. Dawson and F. Gygi, The Journal of ChemicalPhysics, 2018, 148, 124501.
[76] P. Haas, F. Tran and P. Blaha, Physical Review B,2009, 79, 085104.
[77] M. A. Marques, J. Vidal, M. J. Oliveira, L. Reiningand S. Botti, Physical Review B, 2011, 83, 035119.
[78] S. Refaely-Abramson, S. Sharifzadeh, M. Jain,R. Baer, J. B. Neaton and L. Kronik, Physical ReviewB, 2013, 88, 081204.
[79] J. H. Skone, M. Govoni and G. Galli, Physical ReviewB, 2016, 93, 235106.
[80] N. P. Brawand, M. Vörös, M. Govoni and G. Galli,Physical Review X, 2016, 6, 041002.
[81] N. P. Brawand, M. Govoni, M. Vörös and G. Galli,Journal of Chemical Theory and Computation, 2017,13, 3318–3325.
[82] T. A. Pham, M. Govoni, R. Seidel, S. E. Bradforth,E. Schwegler and G. Galli, Science advances, 2017, 3,e1603210.
[83] A. Marini, C. Hogan, M. Grüning and D. Varsano,Computer Physics Communications, 2009, 180, 1392–1403.
[84] D. Sangalli, A. Ferretti, H. Miranda, C. Attaccalite,I. Marri, E. Cannuccia, P. Melo, M. Marsili, F. Paleari,A. Marrazzo et al., Journal of Physics: CondensedMatter, 2019, 31, 325902.
[85] D. E. Aspnes and A. Studna, Physical Review B, 1983,27, 985.
[86] D. R. Penn, Physical Review, 1962, 128, 2093.
[87] Z. H. Levine and S. G. Louie, Physical Review B, 1982,25, 6310–6316.
[88] M. S. Hybertsen and S. G. Louie, Physical Review B,1988, 37, 2733–2736.
[89] S. Baroni and R. Resta, Physical Review B, 1986, 33,7017–7021.
[90] G. Cappellini, R. Del Sole, L. Reining and F. Bechst-edt, Physical Review B, 1993, 47, 9892–9895.
[91] A. B. Djurišić and E. H. Li, Journal of AppliedPhysics, 2001, 89, 273–282.
[92] M. Bokdam, T. Sander, A. Stroppa, S. Picozzi, D. D.Sarma, C. Franchini and G. Kresse, Scientific Reports,2016, 6, 28618.
[93] J. P. Walter and M. L. Cohen, Physical Review B,1970, 2, 1821.
[94] M. L. Trolle, T. G. Pedersen and V. Véniard, ScientificReports, 2017, 7, 39844.
[95] L.-W. Wang and A. Zunger, Physical Review Letters,1994, 73, 1039.
[96] R. Tsu, D. Babić and L. Ioriatti Jr, Journal of AppliedPhysics, 1997, 82, 1327–1329.
[97] T. A. Pham, D. Lee, E. Schwegler and G. Galli, Jour-nal of the American Chemical Society, 2014, 136,17071–17077.
12

[98] H. F. Wilson, F. Gygi and G. Galli, Physical ReviewB, 2008, 78, 113303.
[99] H. F. Wilson, D. Lu, F. Gygi and G. Galli, PhysicalReview B, 2009, 79, 245106.
[100] H. Zheng, M. Govoni and G. Galli, Physical ReviewMaterials, 2019, 3, 073803.
[101] M. Govoni, I. Marri and S. Ossicini, Nature Photonics,2012, 6, 672–679.
[102] S. Dick and M. Fernandez-Serra, Nature Communica-tions, 2020, 11, 1–10.
13

Supplementary Information
Machine Learning Dielectric Screening for the Simulationof Excited State Properties of Molecules and Materials
Sijia S. Dong1,2,3, Marco Govoni1,2,†, and Giulia Galli2,1,*
1Materials Science Division and Center for Molecular Engineering, Argonne NationalLaboratory, Lemont, IL 60439, USA
2Pritzker School of Molecular Engineering, the University of Chicago, Chicago, IL 60637,USA
3Current Address: Department of Chemistry and Chemical Biology, NortheasternUniversity, Boston, MA 02115, USA
†[email protected]*[email protected]
February 12, 2021
S1 Computational detailsIn the following sections we report the computational details used in this work.
S1.1 SystemsWe considered the systems reported in Table S1. The electronic structure of each system was computed at thedensity functional theory (DFT) level of theory using plane wave basis sets and the ONCV pseudopotentials,1with the Perdew–Burke–Ernzerhof (PBE)2 exchange and correlation functional. Quantum Espresso3 (version6.1.0) and the Qbox4 (version 1.66.2) codes were used. For each system the macroscopic dielectric constant,ε∞, was calculated by averaging the diagonal elements of the polarizability tensor computed using the Qboxcode, and was labeled εPT
∞ . The electronic dipole used to compute the polarizability tensor is defined fromusing the center of charge of maximally localized Wannier functions (MLWF) with the refinement correctionby Stengel and Spaldin.5
S1.2 First principles molecular dynamics simulationsFirst principles molecular dynamics (FPMD) simulations were carried out using the Qbox4 code (version1.66.2).
For liquid water, we considered unit cells with 16 or 64 water molecules. For 64-water samples, weconsidered snapshots from each of 10 independent FPMD trajectories (samples s0022-s0031) of the PBE400dataset.6 For 16-water samples, we generated 20 independent MD trajectories starting from 20 independentsnapshots of 16 water molecules initiated randomly with the same atomic density as the PBE400 dataset(1.11 g/cm3 D2O). The initiation method is the same as the method used to generate the PBE400 dataset.6FPMD simulations were carried out using the Bussi-Donadio-Parrinello (BDP) thermostat7 at 400 K witha thermostat time constant of 10000 a.u. and a time step of 10 a.u. (∼0.24 fs).
arX
iv:2
012.
1224
4v2
[co
nd-m
at.m
trl-
sci]
17
Feb
2021

Table S1: Systems considered in this work.System Number of atoms Size of the cell (Å) εPT
∞16-H2O 48 a = 7.82 1.83±0.0164-H2O 192 a = 12.41 1.87±0.004Si 64 a = 5.43 10.01SiC 64 a = 4.36 6.12C 64 a = 3.57 5.29MgO 64 a = 4.21 3.16LiF 64 a = 4.03 2.04Si10H16 26 a = 20.00 to 50.00 -Si35H36 71 a = 25.00 -Si87H76 163 a = 25.00 -H-Si/water 420 a = 11.62, b = 13.42, c = 33.43 3.34COOH-Si/water 492 a = 11.62, b = 13.42, c = 35.73 3.84
We modeled a hydrophobic Si/water interface with a slab containing 72 Si atoms, 24 H atoms terminatingSi, and 108 water molecules. We modeled a hydrophilic Si/water interface with a slab containing 72 Si atoms,24 -COOH groups terminating Si, and 108 water molecules. The geometrical configurations were taken fromPham et al.8
The FPMD simulations of the Si35H36 cluster were carried out using the BDP thermostat at 500 K. Thethermostat time constant was 5000 a.u., and the time step was 20 a.u. (∼0.48 fs). Equilibration was reachedwithin the first 20000 time steps (∼9.7 ps). The finite temperature absorption spectrum was obtained byaveraging the spectra obtained for ten snapshots extracted every 5000 time steps from the FPMD trajectory,and starting after 10.16 ps.
S1.3 Calculations of absorption spectraAbsorption spectra calculations were carried out with the WEST9-Qbox4 coupled codes using the FF-BSEscheme reported by Nguyen et al.10.
For exited-state energies, a scissor operator was applied to the ground-state PBE energy levels to obtain aband gap corresponding to the value obtained at the G0W0@PBE level. Band gaps at the G0W0@PBE levelwere taken from the literature8,9,11,12 except for 16-H2O systems and the Si10H16 clusters, which we computedin this work. The values used are summarized in Table S2. For 16-H2O snapshots, the G0W0@PBE bandgap was computed using 640 PDEP eigenpotentials. For Si10H16, the G0W0@PBE band gap was computedusing 1024 PDEP eigenpotentials and a cubic unit cell with a side length of 50 Å.
FF-BSE calculations were done at the Γ point. Parameters used in FF-BSE simulations are in Table S2.The screening in FF-BSE10 in the reciprocal space is expressed as follows:
∆τvv′(G) =
(ε−1∞ − 1)τuvv′(G = 0), G = 0
4πe2
|G|2ρ+vv′ (G)−ρ−
vv′ (G)
2 , G 6= 0(S1)
where G is the reciprocal space lattice vector, and ρ±vv′(G) is the Fourier component of ρ±vv′(r). As describedin the main text, we focus on getting a surrogate model corresponding to the G 6= 0 terms; the termcorresponding to G = 0, the long-wavelength limit, is added separately.
For bulk Si, we used the Yambo13,14 code (version 4.4.0) to compute BSE spectra at the Γ point andwith k-point samplings. The Lanczos-Haydock solver was used, with scissor operators reported in Table S3.Details of the calculations with Yambo are reported in Table S3. For Model-BSE, the screened Coulombpotential W = ε−1Vc was computed using ε defined as:
ε−1G,G′ =
ε−1∞ , G = G′ = 0
1 + f, G = G′,G 6= 0
0, G 6= G′(S2)
2

Table S2: Parameters used to obtain the FF-BSE spectra.System G0W0@PBE
band gap (eV)Scissor operator(eV)
Bisectionlevels ineachCartesiandirection
Bisectionthreshold
Kineticenergycutoff(Ry)
16-H2O 10.41 - 2 0.02 6064-H2O 8.1Ref. 12 3.99±0.16 2 0.05 60Si 1.37
(X1c-point)Ref. 90.70 3 0.02 40
SiC 2.28(X1c-point)Ref. 9
0.95 2 0.04 70
C 5.50Ref. 11 1.04 2 0.02 80MgO 7.25Ref. 11 2.48 2 0.01 60LiF 13.27Ref. 11 4.13 2 0.02 60Si10H16 8.50 3.80 4 0.03 20Si35H36 6.29Ref. 9 2.80 (0 K);
3.58±0.17 (500 K)4 0.03 25
Si87H76 4.77Ref. 9 2.21 4 0.03 25H-Si/water 1.34Ref. 8 0.33 5 0.05 25a
COOH-Si/water 1.34Ref. 8 0.27 5 0.05 25aaComments on this choice is discussed in Section S2.3.
where ε∞ is the dielectric constant computed by Yambo, and f is the scaling factor defined in the maintext. f is an input value and is specified in the caption of each Model-BSE spectrum reported in this article.
Table S3: Parameters of bulk Si for BSE calculations with the Yambo code.System Number
of atomsk-point Size of dielec-
tric matrix (inno. PWs)
Size of ex-change termin the BSEkernel (in no.PWs)
Numberof bands
Scissoroperator(eV)
Si 64 Γ 1000 295667 320 0.70Si 2 12× 12× 12 80 9185 20 0.85
S1.4 Machine learningWe carried out ML-BSE calculations by implementing an interface between WEST9 and Tensorflow15 (ver-sion 1.13). The convolutional model used in Eq. 10 of the main text is defined as:
∆τvv′(x, y, z) =
nx−1∑
i=0
ny−1∑
j=0
nz−1∑
k=0
Ki,j,kτuvv′ [x+ (il −mx)∆x, y + (jl −my)∆y, z + (kl −mz)∆z] (S3)
where K is the convolutional filter of size (nx, ny, nz), and ∆x, ∆y, ∆z are the spacings of the uniform3D-mesh used to represent periodic functions in real-space. mi, i = x, y, z is the size of padding in eachof the x, y, z directions, and mi = bpi2 c where pi = ni + (ni − 1)(l − 1) − 1, and l is the dilation rate.We performed a hyperparameter search to determine the parameters in the training procedure. In theoptimization procedure, we used the Adam optimizer16 with a learning rate of 0.001. The loss was evaluatedby mean squared error (MSE). Early stopping was used to stop training based on validation loss after25 epochs without an improvement. Periodic boundary conditions are satisfied using padded arrays; weconsidered the same size for input and output arrays in Eq. 10. In order to save memory and training time,we have trained parameters for convolutional models skipping every other element of the τuvv′ and ∆τvv′
3

arrays in each Cartesian direction (except for 16-H2O samples, where the size of the system allows us toconsider all elements). In this way the arrays entering the training procedure have an 8 fold smaller memoryfootprint when the coarse grid is used. When the trained models are applied, we reconcile the fact thattraining was done on coarse grids, by applying a dilation rate of 2 in Eq. 10. In this way, the convolutionalfilter can be applied, after training, to τuvv′ arrays that are defined on the original FFT grid. Therefore, weused l = 2 in Eq. S3 except for the 16-H2O system, for which we chose l = 1.
For each system considered here, the training and validation data come from one snapshot, and we usedata from snapshots different from the training snapshot as the test set. We have trained ML models witheither a global scaling factor or a convolutional model with filter size (n, n, n) with n = 3, 5, 7, 9, 12, 15, 20.To study the effect of the training/validation split, we considered a given snapshot (which we call s00001)of the 16-H2O system as an example, where there are 735 pairs of τu and ∆τ arrays. Three differenttraining/validation splits of the data set were considered: (1) all pairs used for training and validation, (2)80% pairs used for training and 20% pairs used for validation, and (3) 60% pairs used for training and 40%pairs used for validation. Note that case (1) does not give the same training and validation loss becauseminibatches of size 35 were used in training but all data were used in each validation. To evaluate theaccuracy of the models, we trained for the models using snapshot s00001, and we used two other snapshots(i.e. s00003 and s00007) as test sets. None of these models have significant differences in the accuracy ofreproducing the peak positions of the FF-BSE spectra. For all three split schemes, the average ∆ω of thelowest-energy peak over different model architectures is -0.03 eV for s00001, -0.01 eV for s00003, and 0.00eV for s00007. For the spectrum RMSE from ML-BSE using each split scheme, s00003 is 0.009 greaterthan s00001, and s00007 is 0.019 greater than s00001. These results suggest that the training/validationsplit within the range tested here does not significantly impact the accuracy or transferability of the MLmodels for predicting the absorption spectra. A subset of the dataset (τuvv′ and ∆τvv′ pairs) can be randomlyselected and used as the training set in ML. The size of the subset does have an effect on the accuracy ofthe prediction. At least 10% of data are needed in this subset to have a converged fML value.
When computing fAvg, we note that numerical errors may cause the absolute value of some elements in∆τvv′(r)/τuvv′(r) to be extremely large, and these outliers need to be discarded before computing fAvg. Nooutliers in data need to be eliminated to carry out ML to obtain fML.
S1.5 Protocol to compute absorption spectra at finite temperatureBelow we present the protocol to obtain absorption spectra at finite temperature:
1. Obtain representative snapshots of the target system at a finite temperature T using FPMD.
2. For one snapshot among those selected in Step 1, perform a FF-BSE calculation to obtain τuvv′ and∆τvv′ . Note that the selected snapshot may come, in some cases, from a smaller system of similarnature as the target system (see, e.g., the example of water presented in the main text).
3. Use the τuvv′ and ∆τvv′ saved in Step 2 as the training/validation sets to machine learn the mappingbetween unscreened and screened Coulomb integrals.
4. For all snapshots determined in Step 1, except for the one already evaluated in Step 2-3, computethe ML-BSE spectrum using the ML model trained in the previous step as a surrogate model for thecalculation of screened Coulomb integrals.
5. Obtain the optical absorption spectrum at the finite temperature T by computing the average of theabsorption spectra obtained in Step 4.
S2 Comparison between FF-BSE and ML-BSE absorption spectra
S2.1 Liquid waterTo quantify the accuracy of the ML-BSE spectrum, we compare it with the FF-BSE spectrum and computethe change of the energy of individual peaks (∆ω = ωML-BSE −ωFF-BSE, where ω is the position of the peakin energy) and the root mean square error (RMSE) of the whole spectrum in a given energy range (the range
4

is 0.0-27.2 eV for all systems except for the interfaces, which is 0.0-13.6 eV). For a representative snapshot ofthe 16-H2O cell, when using a simple scaling factor model or a convolutional model of filter size (7, 7, 7), wefind that for the lowest-energy peak, ∆ω = −0.03 eV in both cases, and RMSE is 0.021 or 0.018 when thescaling factor or the convolutional model is used, respectively (Figure S1).This shows that, for the 16-H2Osystem, the difference introduced by using different ML models (a convolutional model versus a global scalingfactor) is negligible.
Figure S2 shows the sensitivity of the position of the first peak of the spectrum to the value of the globalscaling factor. We used the 16-H2O case as an example.
Figure S3(a) shows a comparison of the experimentally measured absorption spectrum of liquid waterwith the one computed for the 64-H2O system using either FF-BSE or ML-BSE. Figure S3(b) shows thesensitivity of the spectrum to different choices of the scissor operator.
Figure S4 shows the variations of individual snapshots used to calculate the averaged spectrum of liquidwater (64-H2O system) in Figure 2. The same comparison for each individual snapshot is reported inFigure S5. The model used in ML-BSE is the global scaling factor from 16-H2O.
(a)
0 5 10 15 20 25 (eV)
0.0
0.2
0.4
0.6
0.8
1.0
Inte
nsity
(arb
. uni
t)
FF-BSEML-BSE
6 7 8 9 10
=-0.03 eV
(b)
0 5 10 15 20 25 (eV)
0.0
0.2
0.4
0.6
0.8
1.0
Inte
nsity
(arb
. uni
t)
FF-BSEML-BSE
6 7 8 9 10
=-0.03 eV
Figure S1: Accuracy of ML-BSE spectra of liquid water (16-H2O) obtained using (a) a convolutional modelwith filter size (7, 7, 7), (b) a global scaling factor model. RMSE of the spectra is 0.018 for (a) and 0.021 for(b).
0.8 0.6 0.4 0.2 0.0Global scaling factor f
7.75
8.00
8.25
8.50
8.75
1 (eV
)
5.00 2.50 1.67 1.25 1.00f
Figure S2: Sensitivity of the position of the lowest-energy peak (ω1) of the computed absorption spectrumof water, obtained for a snapshot with 16 H2O molecules), to the global scaling factor (f). εf = (1 + f)−1.
5

(a)
0 5 10 15 20 25 (eV)
0.0
0.2
0.4
0.6
0.8
1.0
Inte
nsity
(arb
. uni
t)FF-BSEML-BSEHeller et al.Hayashi et al.
(b)
5 6 7 8 9 10 (eV)
0.0
0.2
0.4
0.6
0.8
1.0
Inte
nsity
(arb
. uni
t)
8.1eV8.7eV9.3eV
Figure S3: Absorption spectrum of liquid water (64-H2O). (a) FF-BSE and ML-BSE are obtained computingand averaging the spectra of 10 snapshots. The position of the first peak of the experimental spectra fromHeller et al.17 and from Hayashi et al.18 is located at 8.18 eV and 7.98 eV, respectively. The position ofthe first peak of the ML-BSE and FF-BSE spectra is located at 7.40 eV. (b) Sensitivity of the FF-BSEabsorption spectrum of a chosen snapshot to the fundamental gap of the system. In (b), the values of thefundamental gap, obtained applying a scissor operator to the computed PBE band gap, were chosen basedon the values of the experimental gap of water of 8.7±0.6 eV,19 and the G0W0@PBE band gap of 8.1 eV.12For this particular snapshot, the energy of the first peak is 7.14 eV, 7.85 eV, and 8.47 eV, when the bandgaps of the system is equal to 8.1 eV, 8.7 eV, and 9.3 eV, respectively.
(a)
0 5 10 15 20 25 (eV)
0.0
0.2
0.4
0.6
0.8
1.0
Inte
nsity
(arb
. uni
t)
FF-BSE(b)
0 5 10 15 20 25 (eV)
0.0
0.2
0.4
0.6
0.8
1.0
Inte
nsity
(arb
. uni
t)
ML-BSE
Figure S4: The absorption spectra of 10 individual snapshots of 64-H2O systems (dotted lines) and theiraveraged spectrum (solid line) from (a) FF-BSE and (b) ML-BSE calculations. The model used in ML-BSEis a global scaling factor obtained from simulations of a 16-water-molecule cell.
6

0 5 10 15 20 25 (eV)
0.0
0.2
0.4
0.6
0.8
1.0In
tens
ity (a
rb. u
nit)
s0022FF-BSEML-BSE
6 8 10
=-0.01 eV
0 5 10 15 20 25 (eV)
0.0
0.2
0.4
0.6
0.8
1.0
Inte
nsity
(arb
. uni
t)
s0023FF-BSEML-BSE
6 8 10
=-0.07 eV
0 5 10 15 20 25 (eV)
0.0
0.2
0.4
0.6
0.8
1.0
Inte
nsity
(arb
. uni
t)
s0024FF-BSEML-BSE
6 8 10
=0.01 eV
0 5 10 15 20 25 (eV)
0.0
0.2
0.4
0.6
0.8
1.0
Inte
nsity
(arb
. uni
t)
s0025FF-BSEML-BSE
6 8 10
=-0.08 eV
0 5 10 15 20 25 (eV)
0.0
0.2
0.4
0.6
0.8
1.0
Inte
nsity
(arb
. uni
t)
s0026FF-BSEML-BSE
6 8 10
=-0.03 eV
0 5 10 15 20 25 (eV)
0.0
0.2
0.4
0.6
0.8
1.0
Inte
nsity
(arb
. uni
t)
s0027FF-BSEML-BSE
6 8 10
=0.00 eV
Figure S5: ML-BSE and FF-BSE spectra of 10 snapshots of the 64-H2O system from FPMD trajectories at400 K. The model used in ML-BSE is a global scaling factor obtained from simulations of a 16-water-moleculecell. The labels on the snapshots on top of each panel follows the labeling of snapshots of the PBE400 set(http://quantum-simulation.org/reference/h2o/pbe400/s32/index.htm).6
7

0 5 10 15 20 25 (eV)
0.0
0.2
0.4
0.6
0.8
1.0In
tens
ity (a
rb. u
nit)
s0028FF-BSEML-BSE
6 8 10
=-0.01 eV
0 5 10 15 20 25 (eV)
0.0
0.2
0.4
0.6
0.8
1.0
Inte
nsity
(arb
. uni
t)
s0029FF-BSEML-BSE
6 8 10
=-0.01 eV
0 5 10 15 20 25 (eV)
0.0
0.2
0.4
0.6
0.8
1.0
Inte
nsity
(arb
. uni
t)
s0030FF-BSEML-BSE
6 8 10
=-0.01 eV
0 5 10 15 20 25 (eV)
0.0
0.2
0.4
0.6
0.8
1.0
Inte
nsity
(arb
. uni
t)
s0031FF-BSEML-BSE
6 8 10
=-0.01 eV
Figure S5: (Continued from the previous page) ML-BSE and FF-BSE spectra of 10 snapshots of the 64-H2Osystem. The model used in ML-BSE is a global scaling factor obtained from simulations of a 16-water-molecule cell. The labels on the snapshots on top of each panel follows the labeling of snapshots of thePBE400 set (http://quantum-simulation.org/reference/h2o/pbe400/s32/index.htm).6
S2.2 SolidsFigures S6 and S7 show that a convolutional model has similar accuracy as a global scaling factor for Siand LiF. The comparisons between FF-BSE and ML-BSE spectrum for C (diamond), SiC, and MgO arereported in Figure S8.
8

(a)
2.0 2.5 3.0 3.5 4.0 4.5 5.0 5.5 6.0 (eV)
0.0
0.2
0.4
0.6
0.8
1.0
Inte
nsity
(arb
. uni
t)FF-BSEML-BSEAvg-BSE
(b)
2.0 2.5 3.0 3.5 4.0 4.5 5.0 5.5 6.0 (eV)
0.0
0.2
0.4
0.6
0.8
1.0
Inte
nsity
(arb
. uni
t)
FF-BSEML-BSE
Figure S6: Accuracy of ML-BSE spectra of Si obtained using (a) a global scaling factor model and (b) aconvolutional model (filter size (7, 7, 7)). Panel (a) also shows the BSE spectrum obtained by using a scalingfactor computed from averaging ∆τ/τu, labeled "Avg-BSE". The peak shifts of the ML-BSE spectrum fromthe FF-BSE spectrum are within 0.01 eV for all cases. The RMSE values between the ML-BSE and FF-BSEspectra are 0.019 for (a) and 0.015 for (b).
(a)
0 5 10 15 20 25 (eV)
0.0
0.2
0.4
0.6
0.8
1.0
Inte
nsity
(arb
. uni
t)
FF-BSEML-BSE
10 11 12
=-0.04 eV
(b)
0 5 10 15 20 25 (eV)
0.0
0.2
0.4
0.6
0.8
1.0
Inte
nsity
(arb
. uni
t)FF-BSEML-BSE
10 11 12
=-0.03 eV
Figure S7: Accuracy of ML-BSE spectra of LiF obtained using (a) a global scaling factor model and (b) aconvolutional model (filter size (7, 7, 7)). The RMSE values between the ML-BSE and FF-BSE spectra are0.052 for (a) and 0.058 for (b).
9

(a)
0 5 10 15 20 25 (eV)
0.0
0.2
0.4
0.6
0.8
1.0
Inte
nsity
(arb
. uni
t)C
FF-BSEML-BSE
4 5 6 7
=0.01 eV
(b)
0 5 10 15 20 25 (eV)
0.0
0.2
0.4
0.6
0.8
1.0
Inte
nsity
(arb
. uni
t)
SiCFF-BSEML-BSE
4.0 4.5 5.0 5.5
=0.00 eV
(c)
0 5 10 15 20 25 (eV)
0.0
0.2
0.4
0.6
0.8
1.0
Inte
nsity
(arb
. uni
t)
MgOFF-BSEML-BSE
5 6 7
=-0.04 eV
Figure S8: Comparison between FF-BSE and ML-BSE spectrum of (a) diamond, (b) SiC, and (c)MgO. ML-BSE results are obtained from a global scaling factor of the respective system. The RMSE values betweenthe ML-BSE and FF-BSE spectra are 0.005 for (a), 0.027 for (b), and 0.044 for (c).
Figure S9 shows the comparison between the absorption spectrum of Si computed with Yambo and WESTat the Γ point.
10

2.0 2.5 3.0 3.5 4.0 4.5 5.0 5.5 6.0 (eV)
0.0
0.2
0.4
0.6
0.8
1.0
Inte
nsity
(arb
. uni
t)
FF-BSEML-BSEBSEModel-BSE
Figure S9: FF-BSE (WEST), ML-BSE (WEST) with a global scaling factor fML = −0.81, BSE (Yambo),and Model-BSE (Yambo) with f = −0.81 for Si with a 64-atom supercell at the Γ point. The head of thedielectric matrix used in this figure is ε∞ = 22.11, and was obtained for the same cell at the Γ point inYambo.
S2.3 H-Si/water interface (hydrophobic interface)Comments on the kinetic energy cutoff
For the H-Si/water interface, we tested two different kinetic energy cutoff values for wavefunctions: 25 Ryand 60 Ry. From Figure S10(a), we conclude that 25 Ry is sufficient to obtain the low-energy peaks of theSi/water interface FF-BSE spectrum. Comparing Figure 5(a) and Figure S10(b), we conclude that using 25Ry or 60 Ry will not change our conclusions for the Si/water interface. The fML
p2 (z) models for the 25 Rycase and the 60 Ry case are very similar, with εML
f (z) being 2.28 and 2.95 for z in the respective regions ofSi and water for the 25 Ry case, and 2.25 and 2.99 for z in the respective regions of Si and water for the 60Ry case. Therefore, we used 25 Ry for all Si/water interfaces in this work.
(a)
0 2 4 6 8 10 12 14 (eV)
0.0
0.2
0.4
0.6
0.8
1.0
Inte
nsity
(arb
. uni
t)
25 Ry60 Ry
=0.05 eV =0.00 eV
(b)
0 2 4 6 8 10 12 14 (eV)
0.0
0.2
0.4
0.6
0.8
1.0
Inte
nsity
(arb
. uni
t)
FF-BSEML-BSE
=-0.05 eV =-0.07 eV
Figure S10: (a) FF-BSE spectrum from using a kinetic energy cutoff of 25 Ry or 60 Ry for wavefunctions.(b) Accuracy of ML-BSE using a fML
p2 (z) model and a kinetic energy cutoff of 60 Ry for wavefunctions.
A position-dependent model f(r) is necessary
From Figure S11, we can see that when using a model which treats Si and water on the same footing, usingaverage scaling factors, results for the absorption spectrum are not accurate.
11

(a)
0 2 4 6 8 10 12 14 (eV)
0.0
0.2
0.4
0.6
0.8
1.0
Inte
nsity
(arb
. uni
t)FF-BSEML-BSE
=-0.29 eV =-0.37 eV
(b)
0 2 4 6 8 10 12 14 (eV)
0.0
0.2
0.4
0.6
0.8
1.0
Inte
nsity
(arb
. uni
t)
FF-BSEML-BSE
=-0.31 eV =-0.15 eV
Figure S11: Accuracy of ML-BSE using (a) a global scaling factor model, and (b) a convolutional model(filter size (7, 7, 7)) for a snapshot representing a H-Si/water interface (see text). The RMSE values betweenthe ML-BSE and FF-BSE spectra are 0.078 for (a) and 0.072 for (b).
Comparing Figure S11 and Figure S12, we find that a position-dependent model is necessary to obtainsufficiently accurate absorption spectra for the H-Si/water interface.
(a)
0 2 4 6 8 10 12 14 (eV)
0.0
0.2
0.4
0.6
0.8
1.0
Inte
nsity
(arb
. uni
t)
FF-BSEML-BSE
=-0.08 eV =-0.19 eV
(b)
Figure S12: Accuracy of ML-BSE using (a) a position-dependent model with 108 parameters (fMLp108(z)), and
(b) εMLf (z) corresponding to the fML(z) profile used to compute (a), for a snapshot representing a H-Si/water
interface (see text). The RMSE value between the ML-BSE and FF-BSE spectra is 0.059.
Interpretation of the f(r) profile
In Figure S13 we show the charge density (a), fAvg(r) (defined in the main text) (b), PDEP eigenpotentialcorresponding to the most negative eigenvalue (c), and the component of fAvg(r) that corresponds to themost negative PDEP eigenvalue (fAvg
1 (r), defined in Eq. 11 of the main text) (d) for the H-Si/water interface.This shows that the maxima of εML
f (z) (Figure S12(b)) at the interfaces stem from the contribution of thePDEP eigenpotential with the most negative eigenvalue.
12

(a) (b) (c) (d)
Figure S13: (a) Charge density, isovalue 0.050; (b) fAvg(r) from averaging using a moving window of 8×8×8,isovalue -0.644; (c) PDEP eigenpotential corresponding to the most negative eigenvalue, isovalue 3.64; (d)fAvg1 (r) from averaging using a moving window of 8× 8× 8, isovalue -0.370. The isosurface at the isovalue(i.e. value that has the greatest absolute value) is in yellow. The 3D visualization was rendered in VESTA(version 3.4.0).20
3D grid model from ML
In Figure S14 we show that a 3D grid model fML(r) yields an accurate ML-BSE spectrum for the H-Si/waterinterface. The 3D grid model has the same RMSE as the z-dependent model, and for the lowest-energy peak∆ω = −0.11 eV, close to the −0.08 eV for the z-dependent model. The peak position from 3D grid model isslightly less accurate than the z-dependent model largely because the 3D grid model is more susceptible tothe local variation in the training data.
0 2 4 6 8 10 12 14 (eV)
0.0
0.2
0.4
0.6
0.8
1.0
Inte
nsity
(arb
. uni
t)
FF-BSEML-BSE
=-0.11 eV
=-0.20 eV
Figure S14: Accuracy of ML-BSE using the 3D grid model of the H-Si/water interface. Each sub-domain isa cube, and the side length of each sub-domain is 2.6 Å. The RMSE value between the ML-BSE and FF-BSEspectra is 0.059.
13

Transferability of position-dependent models
To test the transferrability of the fML(z) model across different snapshots, we consider a fML(z) model,fMLp216(z), more fine-grained than fML
p2 (z) and fMLp108(z). The use of this more fine-grained model is to test
whether overfitted fML(z) models can still be transferrable across different snapshots. As shown in Fig-ure S15, the z-dependent model for the Si/water interface is transferable between different snapshots of theSi/water interface.
(a) (b)
Figure S15: Accuracy of ML-BSE using the z-dependent model fMLp216(z) for the H-Si/water interface trained
from a given snapshot (bottom of panel (b)) applied on a different snapshot (bottom of panel (a)). Thespectrum corresponding to each snapshot is above its structural representation. The RMSE values is 0.064for (a) and 0.059 for (b).
S2.4 COOH-Si/water interface (hydrophilic interface)For the hydrophilic interface COOH-Si/water, we have found that the performance of the fML
p108(z) model isalso similar to fML
p2 (z) (Figure 5(b) of the main text), consistent with our results for the H-Si/water interface.
14

(a)
0 2 4 6 8 10 12 14 (eV)
0.0
0.2
0.4
0.6
0.8
1.0
Inte
nsity
(arb
. uni
t)FF-BSEML-BSE
=-0.12 eV =-0.31 eV
(b)
Figure S16: Accuracy of ML-BSE using (a) a position-dependent model with 108 parameters (fMLp108(z)), and
(b) εMLf (z) corresponding to the fML(z) profile used to compute (a), for a slab representing a COOH-Si
terminated surface interfaced with water. The RMSE value between the ML-BSE and FF-BSE spectra is0.078.
S2.5 Si clustersFor Si clusters, we were able to obtain a linear regression model (that results in a global scaling factorfML = −0.28) and convolutional models in the same way as for homogeneous systems. However, the globalscaling factor we obtained from linear regression does not yield accurate spectra, as shown in Figure 6 of themain article. In addition, a global scaling factor derived from averaging ∆τ/τu, fAvg = −0.54, is differentfrom from fML and yields an even worse spectrum , as shown in Figure S17. The value of the scaling factormay be different for simulation cells of different sizes , even if the absorption spectra have converged withrespect to the size of the simulation cell. For a cubic simulation cell 30 (40) Å in length, fML = −0.28(−0.22).
(a)
0 5 10 15 20 25 (eV)
0.0
0.2
0.4
0.6
0.8
1.0
Inte
nsity
(arb
. uni
t)
FF-BSEML-BSEAvg-BSE
(b)
4 5 6 7 8 9 (eV)
0.0
0.2
0.4
0.6
0.8
1.0
Inte
nsity
(arb
. uni
t)
FF-BSEML-BSEAvg-BSE
Figure S17: Comparison of ML-BSE and Avg-BSE to FF-BSE for Si10H16 (30 Å cell). ML-BSE spectra areobtained using fML = −0.28, and Avg-BSE is from using fAvg = −0.54. In (b) we show the same data as in(a) on a smaller energy interval (4 to 9 eV).
The reason behind this behavior is that, although the charge density of the Si cluster decays rapidly asa function of the distance from the cluster, the ratio ∆τ/τu does not. To have an ML model robust to thesize of the simulation cell, we impose a threshold to the Si cluster data so that small elements (e.g. elementssmaller than a chosen threshold) in τuvv′ are set to 0. Then we use this data to obtain our ML models.
15

The spectra obtained from various models are shown in Figures S18. Comparing Figures S18 and Fig-ure 6 of the main article, it is clear that imposing a threshold on the data improves the accuracy of thespectra. However, a global scaling factor model still performs poorly compared to convolutional models.The convolutional models give highly accurate absorption spectra regardless of whether the data are treatedwith a threshold. This suggests that convolutional models are robust to sparse data.
In the previous two paragraphs, we applied the threshold on the training data, and applied the resultingML models without imposing a threshold. Another way to consider the effect of the vacuum is to use theoriginal data in training, but use a threshold on τuvv′ when the model is applied. Figure S19(a) and Figure 6(a)show that, for convolutional models obtained using the original, un-thresholded data, imposing a thresholdwhen applying the model can improve the accuracy of the spectrum. Figure S19(b)(c) show that this willnot improve much for the model based on scaling factors, even if a position-dependent model is used. Thisconfirms that convolutional models are superior to models based on scaling factors.
(a)
0 5 10 15 20 25 (eV)
0.0
0.2
0.4
0.6
0.8
1.0
1.2
1.4
1.6
Inte
nsity
(arb
. uni
t)
FF-BSEML-BSE
4 6 8
=-0.11 eV
=-0.33 eV
(b)
0 5 10 15 20 25 (eV)
0.0
0.2
0.4
0.6
0.8
1.0
1.2
1.4
1.6
Inte
nsity
(arb
. uni
t)
FF-BSEML-BSE
4 6 8
=-0.03 eV
=-0.08 eV
Figure S18: Accuracy of ML-BSE spectra of Si10H16 (40 Å cell) obtained using (a) a global scaling factor,and (b) a convolutional model (filter size (7, 7, 7)) from a smaller cell (30 Å cell). The models are obtainedby considering only regions of τuvv′ above a charge density threshold (10−5 times the largest charge density).The RMSE value between the FF-BSE and ML-BSE spectra are 0.119 for (a) and 0.061 for (b).
16

(a)
0 5 10 15 20 25 (eV)
0.0
0.2
0.4
0.6
0.8
1.0
1.2
1.4
1.6In
tens
ity (a
rb. u
nit)
FF-BSEML-BSE
4 6 8
=-0.12 eV
=-0.01 eV
(b)
0 5 10 15 20 25 (eV)
0.0
0.2
0.4
0.6
0.8
1.0
1.2
1.4
1.6
Inte
nsity
(arb
. uni
t)
FF-BSEML-BSE
4 6 8
=0.11 eV
=-0.20 eV
(c)
4 5 6 7 8 9 (eV)
0.0
0.2
0.4
0.6
0.8
1.0
Inte
nsity
(arb
. uni
t)
ML-BSE (no cutoff)ML-BSE (with cutoff)
Figure S19: Accuracy of ML-BSE spectra of Si10H16 (40 Å cell) obtained from (a) a convolutional model(filter size (7, 7, 7)), and (b) a 3D grid model fML(r). When the models are applied to obtain ML-BSEspectra in (a) and (b), only regions of τuvv′ above a charge density threshold (10−5 times the largest chargedensity) are considered. The RMSE value between the FF-BSE and ML-BSE spectra are 0.107 for (a) and0.044 for (b). In (c) we compare ML-BSE spectra from the 3D grid model when the charge density thresholdis applied (with cutoff) or not applied (no cutoff).
Spectrum of Si35H36 at zero temperature
The 0 K spectrum of Si35H36 differs from the 500 K spectra, as shown in Figure S20 and Figure 7.
17

0 5 10 15 20 25 (eV)
0.0
0.2
0.4
0.6
0.8
1.0
1.2
1.4
1.6
Inte
nsity
(arb
. uni
t)
FF-BSEML-BSE
4 6 8 10
=0.04 eV =0.10 eV
Figure S20: Accuracy of ML-BSE spectra obtained from a convolutional model (filter size (7, 7, 7)) for the0 K geometrical configuration of Si35H36. The RMSE value between the ML-BSE and FF-BSE spectra is0.029.
Finite temperature spectra of Si35H36
The variations of individual spectra used to calculate the averaged spectrum of Si35H36 are shown in Fig-ure S21. The comparison between FF-BSE and ML-BSE spectra of each snapshot is in Figure S22. Themodel used in ML-BSE uses a convolutional model (7, 7, 7) trained on data obtained for the 0 K snapshot,the same model used in Figure S20.
(a)
0 5 10 15 20 25 (eV)
0.0
0.2
0.4
0.6
0.8
1.0
Inte
nsity
(arb
. uni
t)
FF-BSE(b)
0 5 10 15 20 25 (eV)
0.0
0.2
0.4
0.6
0.8
1.0
Inte
nsity
(arb
. uni
t)
ML-BSE
Figure S21: The absorption spectra of 10 individual snapshots of Si35H36 (dotted lines) and their averagedspectrum (solid line) from (a) FF-BSE and (b) ML-BSE calculations.
18

0 5 10 15 20 25 (eV)
0.0
0.2
0.4
0.6
0.8
1.0
1.2
1.4
1.6In
tens
ity (a
rb. u
nit)
s021000FF-BSEML-BSE
5 10
=0.10 eV
0 5 10 15 20 25 (eV)
0.0
0.2
0.4
0.6
0.8
1.0
1.2
1.4
1.6
Inte
nsity
(arb
. uni
t)
s026000FF-BSEML-BSE
5 10
=-0.08 eV
0 5 10 15 20 25 (eV)
0.0
0.2
0.4
0.6
0.8
1.0
1.2
1.4
1.6
Inte
nsity
(arb
. uni
t)
s031000FF-BSEML-BSE
5 10
=0.07 eV
0 5 10 15 20 25 (eV)
0.0
0.2
0.4
0.6
0.8
1.0
1.2
1.4
1.6
Inte
nsity
(arb
. uni
t)
s036000FF-BSEML-BSE
5 10
=0.07 eV
0 5 10 15 20 25 (eV)
0.0
0.2
0.4
0.6
0.8
1.0
1.2
1.4
1.6
Inte
nsity
(arb
. uni
t)
s041000FF-BSEML-BSE
5 10
=0.03 eV
0 5 10 15 20 25 (eV)
0.0
0.2
0.4
0.6
0.8
1.0
1.2
1.4
1.6
Inte
nsity
(arb
. uni
t)
s046000FF-BSEML-BSE
5 10
=0.07 eV
Figure S22: ML-BSE and FF-BSE spectra of 10 snapshots of Si35H36 snapshots extracted from FPMDtrajectories at 500 K. The model used in ML-BSE obtained using a convolutional model (7, 7, 7) trainedwith data obtained for the 0 K snapshot, the same model used in Figure S20. The 10 snapshots wereextracted every 5000 time steps from the FPMD trajectory, starting from the 21000th time step (10.16 psonwards). We label these snapshots from s021000 to s066000.
19

0 5 10 15 20 25 (eV)
0.0
0.2
0.4
0.6
0.8
1.0
1.2
1.4
1.6In
tens
ity (a
rb. u
nit)
s051000FF-BSEML-BSE
5 10
=0.05 eV
0 5 10 15 20 25 (eV)
0.0
0.2
0.4
0.6
0.8
1.0
1.2
1.4
1.6
Inte
nsity
(arb
. uni
t)
s056000FF-BSEML-BSE
5 10
=0.07 eV
0 5 10 15 20 25 (eV)
0.0
0.2
0.4
0.6
0.8
1.0
1.2
1.4
1.6
Inte
nsity
(arb
. uni
t)
s061000FF-BSEML-BSE
5 10
=0.10 eV
0 5 10 15 20 25 (eV)
0.0
0.2
0.4
0.6
0.8
1.0
1.2
1.4
1.6
Inte
nsity
(arb
. uni
t)
s066000FF-BSEML-BSE
5 10
=0.18 eV
Figure S22: (Continued from the previous page) ML-BSE and FF-BSE spectra of 10 snapshots of Si35H36
snapshots extracted from FPMD trajectories at 500 K. The model used in ML-BSE obtained using a convo-lutional model (7, 7, 7) trained with data obtained for the 0 K snapshot, the same model used in Figure S20.The 10 snapshots were extracted every 5000 time steps from the FPMD trajectory, starting from the 21000thtime step (10.16 ps onwards). We label these snapshots from s021000 to s066000.
Transferability of ML models for Si35H36
As shown in Figure S22 (snapshot s041000) and Figure S23, the accuracy of the convolutional model derivedfrom data for the 0 K and 500 K snapshots is similar in predicting the absorption spectrum of the 500 Ksnapshot. This suggests that the convolutional model is indeed transferable from the 0 K geometry to 500K geometries for this Si cluster.
20

0 5 10 15 20 25 (eV)
0.0
0.2
0.4
0.6
0.8
1.0
1.2
1.4
1.6
Inte
nsity
(arb
. uni
t)
s041000FF-BSEML-BSE
5 10
=0.03 eV
Figure S23: Accuracy of the ML-BSE spectrum of Si35H36 (a 500 K snapshot s041000) obtained by using aconvolutional model (7, 7, 7) derived from the data for snapshot 041000. The RMSE value between the ML-BSE and FF-BSE spectra in this figure is 0.019, to be compared with RMSE=0.020 for the same snapshot’sspectrum in Figure S22.
Si87H76
The ML-BSE spectrum of Si87H76 obtained by applying various models obtained from Si87H76 is similar tothe one obtained by applying the convolutional model obtained from Si35H36, as shown in Figure S24 andFigure 8.
21
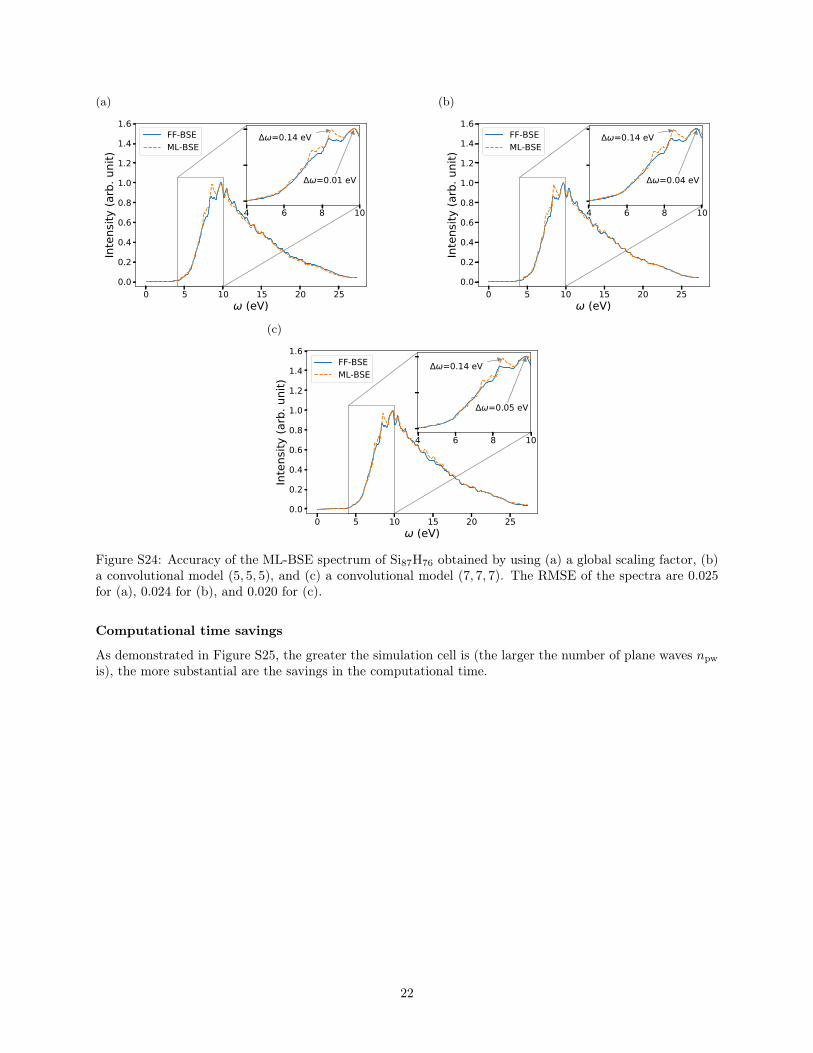
(a)
0 5 10 15 20 25 (eV)
0.0
0.2
0.4
0.6
0.8
1.0
1.2
1.4
1.6In
tens
ity (a
rb. u
nit)
FF-BSEML-BSE
4 6 8 10
=0.14 eV
=0.01 eV
(b)
0 5 10 15 20 25 (eV)
0.0
0.2
0.4
0.6
0.8
1.0
1.2
1.4
1.6
Inte
nsity
(arb
. uni
t)
FF-BSEML-BSE
4 6 8 10
=0.14 eV
=0.04 eV
(c)
0 5 10 15 20 25 (eV)
0.0
0.2
0.4
0.6
0.8
1.0
1.2
1.4
1.6
Inte
nsity
(arb
. uni
t)
FF-BSEML-BSE
4 6 8 10
=0.14 eV
=0.05 eV
Figure S24: Accuracy of the ML-BSE spectrum of Si87H76 obtained by using (a) a global scaling factor, (b)a convolutional model (5, 5, 5), and (c) a convolutional model (7, 7, 7). The RMSE of the spectra are 0.025for (a), 0.024 for (b), and 0.020 for (c).
Computational time savings
As demonstrated in Figure S25, the greater the simulation cell is (the larger the number of plane waves npwis), the more substantial are the savings in the computational time.
22

20 30 40 50Cell Length (Å)
0
200
400
600
800
1000
1200#
of C
ore
Hour
s Sav
ed
10 835
31
42
Si10H16
15 20 25 30 35Cell Length (Å)
0
500
1000
1500
2000
2500
3000
3500
# of
Cor
e Ho
urs S
aved
24
47
90Si35H36
Figure S25: Number of core hours saved for the Si10H16 and Si35H36 clusters as a function of the size of thesimulation cell when using ML-BSE instead of FF-BSE. The numerical values beside each data point is thecorresponding αd. Because of the relatively small computational cost of ML-BSE for Si10H16, its αd is moresensitive to the machine status than that of Si35H36 and is not necessarily monotonic as a function of thesize of the simulation cell.
S3 Timing and scaling of ML-BSEThe calculation of absorption spectra can be decomposed into the following three steps:
1. Calculation of unscreened integrals using Eq. 8;
2. Calculation of screened integrals using Eq. 9 (in FF-BSE) or Eq.10 (in ML-BSE);
3. Calculation of the frequency-dependent spectrum using Eq. 1.
Here we have replaced Step 2 with a machine learning model. For the largest system considered in thiswork (COOH-Si/water interface), at least ∼50% of the total computational time is spent in Step 2. Wedefine the speed-up αd = tFF-BSE
d /tML-BSEd as the ratio of the core hours needed to carry out Step 2 with
FF-BSE or ML-BSE. We found that αd increases as nint and the number of plane waves npw increase.
References[1] M. Schlipf and F. Gygi, Computer Physics Communications, 2015, 196, 36–44.
[2] J. P. Perdew, K. Burke and M. Ernzerhof, Physical Review Letters, 1996, 77, 3865–3868.
[3] P. Giannozzi, S. Baroni, N. Bonini, M. Calandra, R. Car, C. Cavazzoni, D. Ceresoli, G. L. Chiarotti,M. Cococcioni, I. Dabo, A. D. Corso, S. d. Gironcoli, S. Fabris, G. Fratesi, R. Gebauer, U. Gerstmann,C. Gougoussis, A. Kokalj, M. Lazzeri, L. Martin-Samos, N. Marzari, F. Mauri, R. Mazzarello, S. Paolini,A. Pasquarello, L. Paulatto, C. Sbraccia, S. Scandolo, G. Sclauzero, A. P. Seitsonen, A. Smogunov,P. Umari and R. M. Wentzcovitch, Journal of Physics: Condensed Matter, 2009, 21, 395502.
[4] F. Gygi, IBM Journal of Research and Development, 2008, 52, 137–144.
[5] M. Stengel and N. A. Spaldin, Physical Review B, 2006, 73, 075121.
[6] W. Dawson and F. Gygi, The Journal of Chemical Physics, 2018, 148, 124501.
[7] G. Bussi, D. Donadio and M. Parrinello, The Journal of Chemical Physics, 2007, 126, 014101.
[8] T. A. Pham, D. Lee, E. Schwegler and G. Galli, Journal of the American Chemical Society, 2014, 136,17071–17077.
23

[9] M. Govoni and G. Galli, Journal of Chemical Theory and Computation, 2015, 11, 2680–2696.
[10] N. L. Nguyen, H. Ma, M. Govoni, F. Gygi and G. Galli, Physical Review Letters, 2019, 122, 237402.
[11] M. Shishkin and G. Kresse, Physical Review B, 2007, 75, 235102.
[12] T. A. Pham, C. Zhang, E. Schwegler and G. Galli, Physical Review B, 2014, 89, 060202.
[13] A. Marini, C. Hogan, M. Grüning and D. Varsano, Computer Physics Communications, 2009, 180,1392–1403.
[14] D. Sangalli, A. Ferretti, H. Miranda, C. Attaccalite, I. Marri, E. Cannuccia, P. Melo, M. Marsili,F. Paleari, A. Marrazzo et al., Journal of Physics: Condensed Matter, 2019, 31, 325902.
[15] M. Abadi, A. Agarwal, P. Barham, E. Brevdo, Z. Chen, C. Citro, G. S. Corrado, A. Davis, J. Dean,M. Devin, S. Ghemawat, I. Goodfellow, A. Harp, G. Irving, M. Isard, Y. Jia, R. Jozefowicz, L. Kaiser,M. Kudlur, J. Levenberg, D. Mané, R. Monga, S. Moore, D. Murray, C. Olah, M. Schuster, J. Shlens,B. Steiner, I. Sutskever, K. Talwar, P. Tucker, V. Vanhoucke, V. Vasudevan, F. Viégas, O. Vinyals,P. Warden, M. Wattenberg, M. Wicke, Y. Yu and X. Zheng, TensorFlow: Large-Scale Machine Learn-ing on Heterogeneous Systems, 2015, https://www.tensorflow.org/, Software available from tensor-flow.org.
[16] D. P. Kingma and J. Ba, arXiv preprint arXiv:1412.6980, 2014.
[17] J. M. Heller, R. N. Hamm, R. D. Birkhoff and L. R. Painter, The Journal of Chemical Physics, 1974,60, 3483–3486.
[18] H. Hayashi, N. Watanabe, Y. Udagawa and C.-C. Kao, Proceedings of the National Academy of Sciences,2000, 97, 6264–6266.
[19] A. Bernas, C. Ferradini and J.-P. Jay-Gerin, Chemical physics, 1997, 222, 151–160.
[20] K. Momma and F. Izumi, Journal of Applied Crystallography, 2011, 44, 1272–1276.
24