Embed Size (px)
Citation preview

This article was downloaded by: [New York University]On: 16 October 2014, At: 16:33Publisher: Taylor & FrancisInforma Ltd Registered in England and Wales Registered Number: 1072954 Registered office: MortimerHouse, 37-41 Mortimer Street, London W1T 3JH, UK
International Journal of Computational IntelligenceSystemsPublication details, including instructions for authors and subscription information:http://www.tandfonline.com/loi/tcis20
Machine Vision Based Production ConditionClassification and Recognition for Mineral FlotationProcess MonitoringJinping Liu a , Weihua Gui a , Zhaohui Tang a , Huosheng Hu b & Jianyong Zhu aa School of Information Science & Engineering , Central South University , Changsha ,Hunan , 410083 , P.R. Chinab School of Computer Science & Electronic Engineering , University of Essex ,Colchester , Essex , CO4 3SQ , United KingdomPublished online: 08 Jun 2013.
To cite this article: Jinping Liu , Weihua Gui , Zhaohui Tang , Huosheng Hu & Jianyong Zhu (2013) Machine Vision BasedProduction Condition Classification and Recognition for Mineral Flotation Process Monitoring, International Journal ofComputational Intelligence Systems, 6:5, 969-986, DOI: 10.1080/18756891.2013.809938
To link to this article: http://dx.doi.org/10.1080/18756891.2013.809938
PLEASE SCROLL DOWN FOR ARTICLE
Taylor & Francis makes every effort to ensure the accuracy of all the information (the “Content”) containedin the publications on our platform. However, Taylor & Francis, our agents, and our licensors make norepresentations or warranties whatsoever as to the accuracy, completeness, or suitability for any purpose ofthe Content. Any opinions and views expressed in this publication are the opinions and views of the authors,and are not the views of or endorsed by Taylor & Francis. The accuracy of the Content should not be reliedupon and should be independently verified with primary sources of information. Taylor and Francis shallnot be liable for any losses, actions, claims, proceedings, demands, costs, expenses, damages, and otherliabilities whatsoever or howsoever caused arising directly or indirectly in connection with, in relation to orarising out of the use of the Content.
This article may be used for research, teaching, and private study purposes. Any substantial or systematicreproduction, redistribution, reselling, loan, sub-licensing, systematic supply, or distribution in anyform to anyone is expressly forbidden. Terms & Conditions of access and use can be found at http://www.tandfonline.com/page/terms-and-conditions
Machine Vision Based Production Condition Classification and Recognition for Mineral Flotation Process Monitoring
Jinping Liu School of Information Science & Engineering, Central South University
Changsha, Hunan, 410083, P.R. China E-mail: [email protected]
Weihua Gui School of Information Science & Engineering, Central South University
Changsha, Hunan, 410083, P.R. China
Zhaohui Tang* School of Information Science & Engineering, Central South University
Changsha, Hunan, 410083, P.R. China
Huosheng Hu School of Computer Science & Electronic Engineering, University of Essex
Colchester, Essex, CO4 3SQ, United Kingdom E-mail: [email protected]
Jianyong Zhu School of Information Science & Engineering, Central South University
Changsha, Hunan, 410083, P.R. China
Abstract
A novel froth image analysis based production condition recognition method is presented to identify the froth phases under various production conditions. Gabor wavelet transformation is employed to froth image processing firstly due to the ability of Gabor functions in simulating the response of the simple cells in the visual cortex. Successively, the statistical distribution profiles based feature parameters of the Gabor filter responses rather than the conventional mean and variance are extracted to delineate the essential statistical information of the froth images. The amplitude and phase representations of the Gabor filter responses are both taken into account by empirical marginal and joint statistical modeling. At last, a simple learning vector quantization (LVQ) neural network model is used to learn an effective classifier to recognize the froth production conditions. The effectiveness of this method is validated by the real production data on industrial scale from a bauxite dressing plant.
Keywords: Foth flotation process, froth image, production condition classification and recognition, Gabor wavelet transform, marginal distribution, joint distribution.
* Corresponding author, Zhaohui Tang, Prof. Dr., phone:+86-731-88877316; fax:+86-731-88877316; E-mail: [email protected]
1. Introduction
Froth flotation is a worldwide used ore dressing method by utilizing air bubbles to separate different mineral materials based on their relative affinity to water. In
terms of daily tonnages of ores that are treated by this method globally, froth flotation is the most important method with a history of one hundred years. However, part of its essential technological mechanism is still unknown and consequently it is still a difficult problem
International Journal of Computational Intelligence Systems, Vol. 6, No. 5 (September, 2013), 969-986
Co-published by Atlantis Press and Taylor & Francis Copyright: the authors 969
Dow
nloa
ded
by [
New
Yor
k U
nive
rsity
] at
16:
33 1
6 O
ctob
er 2
014
J. Liu et al.
to control the flotation process robustly and optimally through building concise mathematic model due to its inherent chaos and upsets 1.
It’s worth noticing that flotation production conditions vary widely with the input disturbance (e.g. Fluctuation of the feeding grade) and the change of operational conditions, which produce different yields of flotation products with distinct product quality. Modern process control of complex industrial processes should aim at not only ensuring the control variables well follow the simple set point, but also requiring proper control strategies to set effective set-points for the control variables to achieve satisfactory production indexes, which is usually treated discriminatingly in accordance with the different process production statuses2. Hence, automatic classification and recognition of the production conditions is an important issue for flotation performance evaluation and process optimization.
The flotation production condition is comprised of the current flotation operation mode, the metallurgical parameters in the flotation process and the instantaneous froth surface appearance with the corresponding flotation performance, which is difficult to be classified and recognized by the naked-eye observation or the traditional process parameter monitoring methods. The main reasons are that the whole flotation process consists of several sub-processes, each of which has a large amount of process variables coupled seriously with each other, even more, some key production indexes and process variables can not be detected in real time.
It has been long proved that the visual features of the froth surface involve the pivotal information of the flotation operation modes (the aeration, the reagent addition, pulp level, mass pull and so on) and also is an effective indicator to the performance indexes(the concentrate grade and the mineral recovery)3. The state-of-art process control of flotation circuit dominantly depends on the naked-eye observation of the appearance of the froth upper surface by the experienced operators. This kind of operation style has many drawbacks. Firstly, it’s unable to settle for the continuous observation of the whole flotation process. The interpretation of visual information is further complicated by the time lag between the occurrence of the froth phenomena and the results of the flotation performance4. Furthermore, it would get distinct
operation results (even opposite to the expectation) from the same froth phase for the human perception of the froth upper surface varies from one to another, and so on.
In order to improve the automatic control level and decrease the casualness of human operation to ultimately decrease the fluctuations of the flotation production indexes, researchers adopt the machine vision to the flotation process monitoring and control. Some satisfactory tentative reports can be found in the literatures since the 90s’ of last century5-10. A more recent elaborate summary of the existed physical and dynamic froth feature extraction was reported by Aldrich 11, which pointed out that the machine vision based flotation processing monitoring and control attracts increasing inertest since its introduction in the late 1980s, however, linking the visual froth features and the flotation performance remained challenging and demands further researches. What’s more, it is also reported that a fully automatic control of the flotation system remained a long way to improve12.
Machine vision based flotation process monitoring and control system utilizes the computer vision technology to extract the visual features of the optical signals of the upper froth surface. Consequently, an on-line flotation monitoring and close-loop control strategy to flotation process control can be put into practice after building the dynamic models of flotation process based on the relation analysis between the visual features and the flotation process variables5. In the machine vision based flotation process monitoring and control, how to delineate the froth surface appearance and extract the distinctive visual features to characterize the flotation production conditions is significantly important. The froth image has its own special characteristics in comparison with the other natural images, which is difficult to be depicted by the conventional image processing technologies.
The upper froth surface represents special visual textures in flotation process, which is fully occupied by tightly contacted bubbles of various sizes and irregular shapes, accompanying with bubble bursting, collapsing, merging, and new bubble generation during the froth flows to the cell lips (plate of the scrapper). The morphological structures of the bubbles, the surface light intensity of the froth and the uneven degrees of the froth surface change delicately with the varieties of flotation operation modes and the disturbance of the
Co-published by Atlantis Press and Taylor & Francis Copyright: the authors 970
Dow
nloa
ded
by [
New
Yor
k U
nive
rsity
] at
16:
33 1
6 O
ctob
er 2
014

Production Condition Classification & Recognition
feeding ores. All of these variations lead to a special flotation production condition and appear on the froth surface in return.
Hence, the texture features of the froth surface appearance can be utilized as the indicators of the variation of the flotation production conditions or as a latent indicator of flotation production indexes. Several different froth surface texture extraction and delineation methods can be found in the reports. Bartolacci13 summarized the conventional froth texture feature extraction methods and extracted the froth surface texture parameters by MIA (Multivariate Image Analysis), GLCM (Gray-level Co-occurrence Matrices) and Wavelet texture analysis respectively. Taking a zinc flotation circuit as the real application object, the relationship between froth surface texture parameters and production indexes was studied by utilizing PLS (Partial Least Square) regression and PCA (Principal Component Analysis) method. The feasibility of the flotation process control strategy based on froth visual features is also discussed in the literature 13. By combining the multi-resolution analysis (MRA) and multivariate image analysis (MIA), Liu14 used the MR-MIA of the RGB froth image to characterize the froth phase or production health statuses in a zinc recovery section of Agnico-Eagle's Laronde plant in Quebec. The relation between the froth texture and the production performance has also been studied. Some statistical texture analysis techniques such as gray-level co-occurrence matrix (GLCM)15 and its variants (e.g., texture spectrum and neighbouring gray-level difference matrix (NGLDM), spatial gray level dependence matrix (SGLDM))4 based froth image texture extraction methods have been used to classify froth phases into pre-defined classes that correspond to different production statuses. Hargrave16 adopted the fractal analysis to extract the froth characteristics. A PCA based froth image representation method was implemented by Kaartinen17. There are also some other visual features of froth images can be extracted18, 19, such as morphological bubble features (bubble size with distribution, bubble shape) extracted by froth segmentation3, but current froth image segmentation algorithms are insufficient to process the various size occupied froth image, especially to the images full filled both large bubbles and tiny bubbles. In summary, the geometric structures of froth bubbles are time consuming and difficult to be characterized accurately.
These aforementioned reports generally focus on the heavy metals (e.g. copper ore, Au ore, Pb-Zn ore) flotation or non-metal ore dressing (e.g. coal dressing), where the mineralized bubbles exhibit some regular properties, which can be distinguished from the froth surface apparently. However, in the light metal mineral flotation (e.g. bauxite flotation), the shapes of froth bubbles are relatively more irregular, which cannot be distinguished clearly. The explicitly perceptible froth features are the surface texture (e.g. roughness, coarseness, evenness). Hence, it’s even harder to identify the flotation production conditions by the naked-eye observation or the traditional froth image processing techniques. Consequently, the stable optimal control of light metallic ore flotation is even harder to be executed, resulting in much more susceptible production indexes and greater waste of mineral resource and reagents.
However, it’s well acknowledged that the surface texture of the forth image is an important feature for vision processing in the real application20-25. Though human beings can distinguish complex texture perfectly, they cannot focus on inspecting the forth surface for a long time, what’s more, the individual perception of the froth image is objective, which is unsuitable for the flotation production performance estimation and the stable process control. In terms of the froth image texture extraction, the micro-heterogeneity, complexity and the uncertainty of the froth texture appearance lead to a great challenge to visual feature extraction of the froth images. Consequently, it is hard to describe and distinguish the froth phases in different production phenomena automatically by the conventional digital image processing methods. GLCM and PCA based froth texture feature extraction methods are studied extensively in the surface texture analysis of the froth images. However, it’s hard to describe texture precisely by GLCM or PCA for these methods are nothing to do with the visual perception of the human beings, which cannot delineate the multi-resolution and multi-orientation features of the froth images. Motivated by the perceptual mechanism of the biological vision, the distinctive froth visual texture features of multi-channels and multi-directions should be considered to delineate the varieties of the production conditions in order to distinguish the flotation production conditions accurately by froth image analysis. Daugman26 discovered that the simple cells in the visual cortex of
Co-published by Atlantis Press and Taylor & Francis Copyright: the authors 971
Dow
nloa
ded
by [
New
Yor
k U
nive
rsity
] at
16:
33 1
6 O
ctob
er 2
014

J. Liu et al.
mammalian brains can be modeled very well by the profile of Gabor functions. Hence, image analysis by the Gabor filtering is similar to perception in the human visual system. Since the Gabor filters27 can simulate the visual perception property of mammalian froth images, the Gabor wavelet features of froth images in different scales and orientations can be extracted in advance in order to get the distinctive froth visual feature for production condition recognition, which can get the best resolution in both spatial domain and frequency domain. What’s more, since the froth image is comprised of a great number of mineralized bubbles, the characteristic parameters based on the statistical distribution profiles of the Gabor filter responses are effective to represent the visual change occurrence under the different flotation production conditions.
Since the accurate classification and recognition of the flotation production conditions in real time is the foundation for the flotation process optimization, this work mainly focuses on developing an effective method for flotation production conditions classification and recognition by obtaining distinctive visual features of the froth image without time-consuming and inaccurate image segmentation and other complex image processing method. Firstly in order to extract the effective statistical features of froth images to delineate the delicate froth surface for production condition identification, this work adopts Gabor wavelet transform to froth image processing in advance. Then, the statistical distributions of the Gabor amplitude response representation (GARR) and the Gabor phase response representation (GPRR) of the froth images are analyzed by the marginal statistical distribution and joint statistical distribution modeling respectively. The corresponding statistical distribution characteristic parameters of GARR and GPRR are modeled statistically and extracted to delineate the froth image appearance. At last, the mineral flotation production conditions can be classified and recognized by using the unsupervised clustering analysis (e.g. fuzzy clustering analysis) and supervised learning methods (e.g. LVQ neural network). A knowledge based flotation process control system can be constructed from the combination of historical flotation performance data and the classification results and image from the vision system in future.
This paper is organized as follows. In the second section, a brief overview of the flotation process and the
machine vision based process monitoring system are presented. Statistical modeling and visual features extraction of the froth images based on the GARR and GPRR are described in section 3. In section 4, the relationship between the visual features of the froth and the flotation production conditions is analyzed, and then the flotation production conditions classification and recognition method and the corresponding experiment results are discussed; finally. Section 5 concludes the whole investigation with possible future extensive research of the project.
2. Machine Vision based Flotation Process Monitoring
Froth flotation is a complex physicochemical process to separate valuable minerals from raw ores according to their surface properties (hydrophobic and hydrophilic). It is a continuous process with complex physical and chemical reactions, where mineral particles in slurry suspension are collected through their preferential attachment to air bubbles6,7. Before the froth flotation process, the raw ores are crushed and ground to the powder of desired sizes. Then, the powder is mixed with water and chemical reagents and the resulting pulp are fed to a series of flotation cells, with the impeller stirring and aeration.
The mineral particles, depending on their physical characteristic of the mineral contents, tend either to float (stick to the bubbles) or sink in the liquid. Usually, some special reagents are added to adjust the surface hydrophobic property of ores particles in order to strengthen the mineral separation. Both the froth and pulp still contain ore particles with various mineral contents. Hence, the separated particles in the froth and in the remaining pulp are usually fed to the next flotation cells to continue the separation process. The main parts of a typical flotation circuit used in mineral dressing industry can be seen from Fig.1 (a).
Fig.1(a) illustrates a concise schematic of a bauxite flotation circuit in northern China, which is comprised of rougher bank, scavenger banks and cleaning bank. Each bank includes dozens of flotation cells. It takes one or two hours from ore feeding to concentrate production or tailing. One of the flotation machine (flotation cell) used in this plant is displayed in Fig.1 (b), whose effective volume is about 16 3m with cross section area of 2.80*2.80 2m and height of 2.4 m . The froth phases are difficult to be distinguished by the
Co-published by Atlantis Press and Taylor & Francis Copyright: the authors 972
Dow
nloa
ded
by [
New
Yor
k U
nive
rsity
] at
16:
33 1
6 O
ctob
er 2
014

Production Condition Classification & Recognition
naked-eye observation, consequently the mineral separation is far from ideal. The rapid progress in computer technology makes the use of machine vision in the automatic process monitoring and control of the flotation operations possible. A typical flotation froth image monitoring system is sketched out in Fig.2 (a).
Conditioner
Rougher bank
Reagents addition
Ore feed pulp
Tailing
Concentrate
Image acquisition device Froth Collection
Tailing
Scavenger bank
Cleaning II bank Cleaning I bank Scavenger bank
Fluid of Feed pulp/Reagent
(a) Flow chart of the flotation process
Air
Feeding
Concentrate
Motor
Tailing
(b) Schematic of a flotation cell
Fig.1 Flotation process and flotation equipment
The machine vision based flotation process monitoring system is comprised of industrial computer connected with the froth image acquisition device, which consist of industrial RGB camera, high frequent light source, cover hook to protect the camera from dust and ambient light, optical fiber with length over 200 m for signal communication to industrial PC computer in the operating room. The vision system is set up to monitor the flotation production conditions automatically by inspecting the froth visual information
automatically, so as to adjust the flotation operation in time and make the flotation production stable and optimized. Take the abovementioned industrial scale monitoring system mounted in the bauxite flotation plant in northern China as an example. The industrial camera with 49 mm lens placed about 110 cm above the surface of flotation froth layer. Froth image sequences, derived from videos captured at the rate of 15 frames/s, are collected from several individual flotation cells. The window size of each froth image in a cell is 12*9.6
2cm . The light is also right above the surface of the froth layer and parallel to the RGB colour camera.
3. Visual Features Extraction of Flotation Froth Images
In the machine vision based flotation process monitoring, the industrial control computer acquires the froth image signals and then analyzes them automatically. Fig.2(b) is a snapshot of a typical froth image from the above mentioned bauxite flotation process. As can be seen from Fig.2(b), the froth image is full filled with convex bubbles of various sizes and shapes, without void space and background between each bubble. The dark regions represent the collapsed bubbles, and the highlight spots are the top lips of the bubble film in the froth image. The chromatic information (RGB color space) of froth image is highly correlated. As can be seen from Fig.2(c), the intensities in different color channels of the same pixels (RGB) cluster to a straight line, which means that the RGB color channels of the image pixels have the same intensity trend. It reveals that the froth image just needs to be processed in any one of its color space, or in achromatic value space. The froth color information reflects the hint of the valuable mineral particles adhered on the bubbles, for example the chalcopyrite flotation froth appears as golden color. As to a special flotation plant, the desired ores are generally fixed and hence the color information is relatively less important to a special flotation plant. Especially in the light metallic ore flotation, as can be seen from Fig.2(c), different color channels generally have the same value of the same pixel, so the froth image mainly displays the achromatic behavior. Hence, the froth image can be processed in the gray channel without loss of the essential chromatic information of the froth surface.
Co-published by Atlantis Press and Taylor & Francis Copyright: the authors 973
Dow
nloa
ded
by [
New
Yor
k U
nive
rsity
] at
16:
33 1
6 O
ctob
er 2
014

J. Liu et al.
3.1. Gabor wavelets
Gabor filters are biologically motivated convolution kernels due to they can model the receptive fields and orientation selective characteristics of human visual cortical cells 28, whose primitive theory can be found in the works of Gabor. Daugman extended it and constructed the 2D Gabor filtering, which can get minimum uncertainty in spatial domain and frequency domain simultaneously29. Manjunath30 compared the performance of various methods of wavelet transform systematically, whose experimental results show that Gabor filter can describe the visual features of images excellently for its multi-directional selectivity. A
complex Gabor filter is defined as the product of a Gaussian kernel times a complex sinusoid, i.e.
),(),(),( yxwyxsyxg r= (1) ),( yxs is also called the carrier, that is
)))(2(exp(),( 00 pyvxujyxs ++= π (2) where ),( 00 vu and p define the spatial frequency and
the phase of the sine function respectively. ),( yxwr is a 2-D Gaussian-shaped function, known as the Gaussian envelope, which is
)))(
)((exp(),(2
02
20
2max
r
rr
yyb
xxakyxw−
+−−= π (3)
Fig. 2 Machine vision based flotation froth monitoring system
Where maxk represents the scales of the magnitude of
the Gaussian envelop, ),( 00 yx is the peak of the
function, a and b are the scaling parameters of the Gaussian, and the subscript r denotes a rotation
operation, and rxx )( 0− and ryy )( 0− are as follows
θθ sin)(cos)()( 000 yyxxxx r −+−=− (4) θθ sin)(cos)()( 000 yyxxyy r −+−−=− (5)
Gabor function is a complete but non-orthogonal basis set which can be expanded when any specific function ),( yxf is given. This kind of method to describe local frequency has been applied in many fields. However, local frequency analysis requires a fixed
Co-published by Atlantis Press and Taylor & Francis Copyright: the authors 974
Dow
nloa
ded
by [
New
Yor
k U
nive
rsity
] at
16:
33 1
6 O
ctob
er 2
014

Production Condition Classification & Recognition
function window width and the frequency wideband is linear and constant. For the sake of optimizing the function of detection and location at various scales, multi-supported filter banks are necessary, which means Gabor filtering can be carried out through the way of parallel to wavelet decomposition, while the basis function of wavelets is Gabor function24.
Gabor wavelet is also sealed wavelet, which is enveloped by Gaussian function in a complex planar wave. Different Gabor wavelets have different scale coefficients and directions. Gabor wavelet is generated by the next equation
( )
( )( ) ( )[ ]2/expexp
2exp),(
2,
2
222
,
2
2
,
,
σ
σσψ
−−+⋅
⋅⎟⎟⎟
⎠
⎞
⎜⎜⎜
⎝
⎛ +−=
yxKi
yxKKyx
vu
vuvu
vu (6)
where ( )vuvu if
KK φexpmax, = (7)
In Eqn. (7), 8/vv πφ = , maxK is the maximum
frequency and f is the frequency ratio, u represents the scale factor ]1,0[ −∈ Uu ,and v is the orientation factor ],1[ Vv∈ . U and V are the numbers of scales and direction aspects respectively. σ is the standard deviation, which determines the effective size of the surrounding of a pixel in which weighted summation takes place. It reported that the effect of DC component can be eliminated31 to avoid the unwanted dependence of the filter responses on the absolute intensity of the froth images for a sufficiently high values of σ .
3.2. Gabor Wavelets Transform of Froth Image
The output of the Gabor wavelet transformation of the froth image can be described by computing the convolution between the froth image and a set of Gabor wavelets of different scales and orientations. Suppose
),( yxI is the gray level representation of froth image, then the Gabor filter response of froth image can be computed as follows.
( ) ( ) ( )yxyxIyxO vuvu ,,, *,),( ψ∗= (8)
where ∗ represents the operation of convolution, ( )yx,*ψ denotes the complex conjugate of ),( yxψ ,
( )yxO vu ,),( means the convolution result of the froth image with the Gabor wavelet sub-band at ( u , v ), whose scale is u and the direction is v . The Gabor amplitude response representation (GARR) and the
Gabor phase response representation (GPRR) of the froth image filtered by Gabor wavelets at the sub-band( u ,v) can be found as follows.
( ) 2 2, ( , )( , )(Re( ( , ))) (Im( ( , )))M x y u vu vO x y x yO= + (9)
⎟⎟
⎠
⎞
⎜⎜
⎝
⎛= −
)),(Re(
)),(Im(),(
),(
),(1tan yx
yxyxP
oo
vu
vu (10)
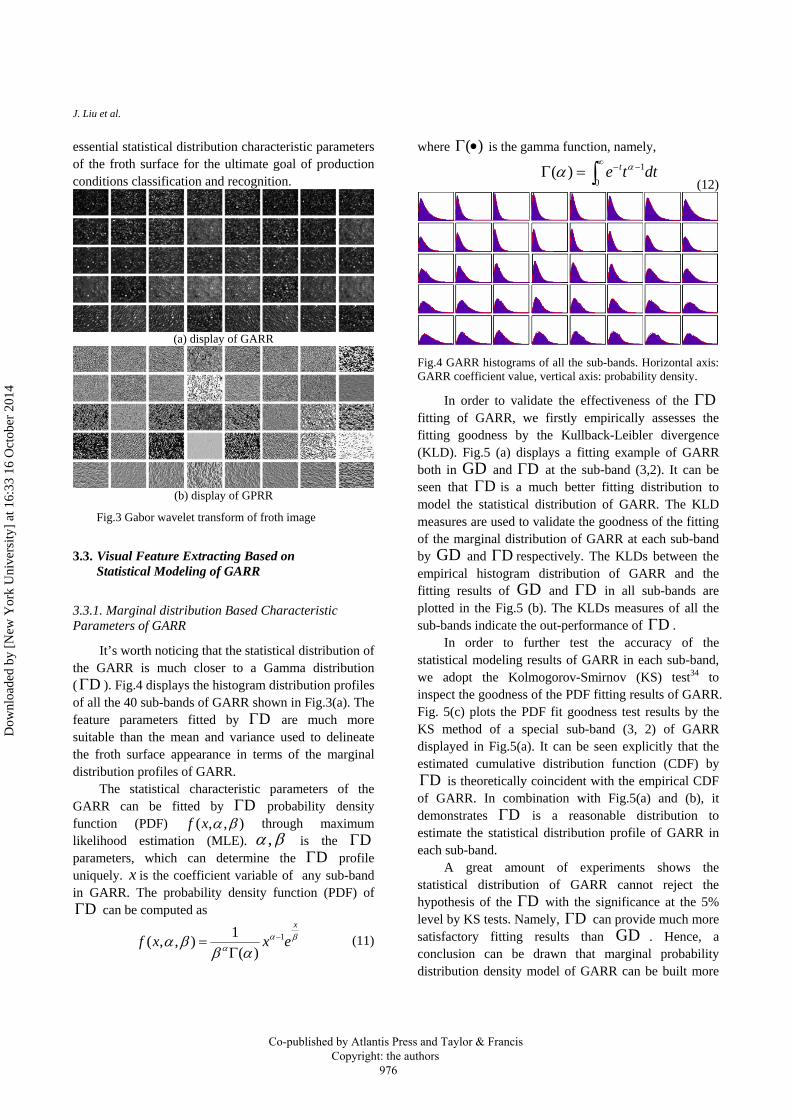
where ( , )P x yπ π− < < . Fig.3 (a) and (b) display the GARR and GPRR of
of a froth image respectively, which is processed with a set of Gabor wavelets with 5 scales and 8 orientations. The original froth image is shown in Fig.2 (b).
However, the uninstructed convolution results of GARR and GPRR can not be used as texture characteristic directly. Since there existed 80 Gabor feature images after convolution in 40 sub-bands of each image, they are too large to be used to classify and distinguish industry production conditions directly. To solve the curse of the dimensionality due to the multi-channel Gabor filter response features, the Gabor filter responses need some post-processing to reduce to a representative feature vector before they become efficient texture features. The conventional features extracted from Gabor filter response are the energy based features (statistical mean and variance of the GARR), which has been generally used in many works. Take the statistic mean and variance as the statistical features of GARR, which is thus equivalent to characterize the latent marginal distribution of GARR by Gaussian distribution ( GD ). However, according to thousands of experiments and deeper investigation, the distribution of the GARR generally subjects to Gamma distribution ( DΓ ) rather than GD . Hence, the simple mean and variance based statistical features from GARR cannot characterize the special distribution shape of the GARR. What’s more, GPRR is not worthless though the GPRR rotated with the magnitude in some rate27. Due to this rotation with somewhat absurd change, the GPRR has very important structural information of the froth image. Hence, GPRR is also nontrivial in the image texture analysis. There can be found some successful phase features based biological feature authentication in the literatures32,33.
In order to obtain the distinctive features of GARR and GPRR in accordance with their special statistical distribution profiles, the marginal statistical and joint statistical distribution features of GARR and GPRR are analyzed subsequently for the purpose of obtaining the
Co-published by Atlantis Press and Taylor & Francis Copyright: the authors 975
Dow
nloa
ded
by [
New
Yor
k U
nive
rsity
] at
16:
33 1
6 O
ctob
er 2
014
J. Liu et al.
essential statistical distribution characteristic parameters of the froth surface for the ultimate goal of production conditions classification and recognition.
(a) display of GARR
(b) display of GPRR
Fig.3 Gabor wavelet transform of froth image
3.3. Visual Feature Extracting Based on Statistical Modeling of GARR
3.3.1. Marginal distribution Based Characteristic Parameters of GARR
It’s worth noticing that the statistical distribution of the GARR is much closer to a Gamma distribution ( DΓ ). Fig.4 displays the histogram distribution profiles of all the 40 sub-bands of GARR shown in Fig.3(a). The feature parameters fitted by DΓ are much more suitable than the mean and variance used to delineate the froth surface appearance in terms of the marginal distribution profiles of GARR.
The statistical characteristic parameters of the GARR can be fitted by DΓ probability density function (PDF) ),,( βαxf through maximum likelihood estimation (MLE). βα , is the DΓ parameters, which can determine the DΓ profile uniquely. x is the coefficient variable of any sub-band in GARR. The probability density function (PDF) of
DΓ can be computed as
βαα αβ
βαx
exxf 1
)(1),,( −
Γ= (11)
where )(•Γ is the gamma function, namely,
∫∞ −−=Γ
0
1)( dtte t αα (12)
Fig.4 GARR histograms of all the sub-bands. Horizontal axis: GARR coefficient value, vertical axis: probability density.
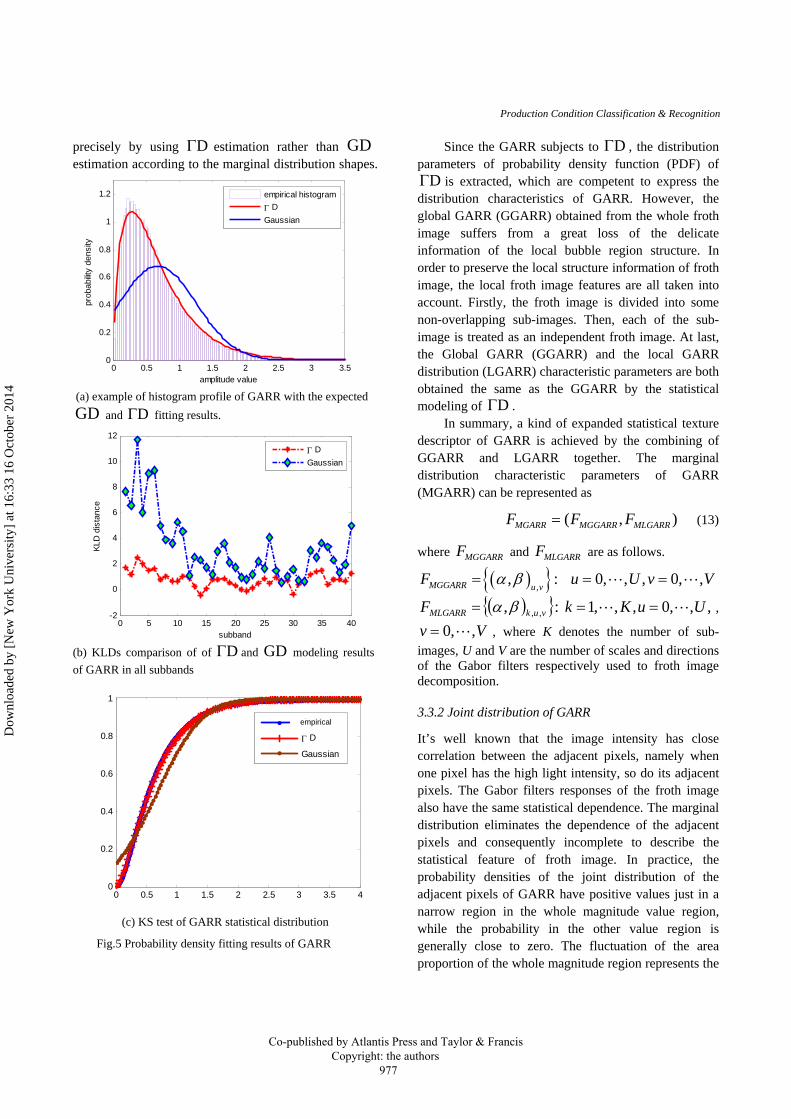
In order to validate the effectiveness of the DΓ fitting of GARR, we firstly empirically assesses the fitting goodness by the Kullback-Leibler divergence (KLD). Fig.5 (a) displays a fitting example of GARR both in GD and DΓ at the sub-band (3,2). It can be seen that DΓ is a much better fitting distribution to model the statistical distribution of GARR. The KLD measures are used to validate the goodness of the fitting of the marginal distribution of GARR at each sub-band by GD and DΓ respectively. The KLDs between the empirical histogram distribution of GARR and the fitting results of GD and DΓ in all sub-bands are plotted in the Fig.5 (b). The KLDs measures of all the sub-bands indicate the out-performance of DΓ .
In order to further test the accuracy of the statistical modeling results of GARR in each sub-band, we adopt the Kolmogorov-Smirnov (KS) test34 to inspect the goodness of the PDF fitting results of GARR. Fig. 5(c) plots the PDF fit goodness test results by the KS method of a special sub-band (3, 2) of GARR displayed in Fig.5(a). It can be seen explicitly that the estimated cumulative distribution function (CDF) by
DΓ is theoretically coincident with the empirical CDF of GARR. In combination with Fig.5(a) and (b), it demonstrates DΓ is a reasonable distribution to estimate the statistical distribution profile of GARR in each sub-band.
A great amount of experiments shows the statistical distribution of GARR cannot reject the hypothesis of the DΓ with the significance at the 5% level by KS tests. Namely, DΓ can provide much more satisfactory fitting results than GD . Hence, a conclusion can be drawn that marginal probability distribution density model of GARR can be built more
Co-published by Atlantis Press and Taylor & Francis Copyright: the authors 976
Dow
nloa
ded
by [
New
Yor
k U
nive
rsity
] at
16:
33 1
6 O
ctob
er 2
014
Production Condition Classification & Recognition
precisely by using DΓ estimation rather than GD estimation according to the marginal distribution shapes.
0 0.5 1 1.5 2 2.5 3 3.50
0.2
0.4
0.6
0.8
1
1.2
amplitude value
prob
abilit
y de
nsity
empirical histogramΓ DGaussian
(a) example of histogram profile of GARR with the expected GD and DΓ fitting results.
0 5 10 15 20 25 30 35 40-2
0
2
4
6
8
10
12
subband
KLD
dis
tanc
e
Γ DGaussian
(b) KLDs comparison of of DΓ and GD modeling results of GARR in all subbands
0 0.5 1 1.5 2 2.5 3 3.5 40
0.2
0.4
0.6
0.8
1
data1
Γ D
Gaussian
empirical
(c) KS test of GARR statistical distribution
Fig.5 Probability density fitting results of GARR
Since the GARR subjects to DΓ , the distribution parameters of probability density function (PDF) of
DΓ is extracted, which are competent to express the distribution characteristics of GARR. However, the global GARR (GGARR) obtained from the whole froth image suffers from a great loss of the delicate information of the local bubble region structure. In order to preserve the local structure information of froth image, the local froth image features are all taken into account. Firstly, the froth image is divided into some non-overlapping sub-images. Then, each of the sub-image is treated as an independent froth image. At last, the Global GARR (GGARR) and the local GARR distribution (LGARR) characteristic parameters are both obtained the same as the GGARR by the statistical modeling of DΓ .
In summary, a kind of expanded statistical texture descriptor of GARR is achieved by the combining of GGARR and LGARR together. The marginal distribution characteristic parameters of GARR (MGARR) can be represented as
),( MLGARRMGGARRMGARR FFF = (13)
where MGGARRF and MLGARRF are as follows.
( ){ },, :MGGARR u v
F α β= VvUu ,,0,,,0 ==
( ){ }:, ,, vukMLGARRF βα= ,,,0,,,1 UuKk == ,
Vv ,,0= , where K denotes the number of sub-images, U and V are the number of scales and directions of the Gabor filters respectively used to froth image decomposition.
3.3.2 Joint distribution of GARR
It’s well known that the image intensity has close correlation between the adjacent pixels, namely when one pixel has the high light intensity, so do its adjacent pixels. The Gabor filters responses of the froth image also have the same statistical dependence. The marginal distribution eliminates the dependence of the adjacent pixels and consequently incomplete to describe the statistical feature of froth image. In practice, the probability densities of the joint distribution of the adjacent pixels of GARR have positive values just in a narrow region in the whole magnitude value region, while the probability in the other value region is generally close to zero. The fluctuation of the area proportion of the whole magnitude region represents the
Co-published by Atlantis Press and Taylor & Francis Copyright: the authors 977
Dow
nloa
ded
by [
New
Yor
k U
nive
rsity
] at
16:
33 1
6 O
ctob
er 2
014
J. Liu et al.
varieties of the froth structure and indicates the change of the flotation production conditions implicitly.
Hence, in order to get the higher order of statistical features of the GARR to delineate the statistical dependence of the adjacent pixels, the joint distribution
),( yxH of direct neighboring coefficients of each sub-band representation in the GARR is computed and the area proportion of the 90% cumulative probability is extracted as the joint distribution parameters, which can obtain the concentration area of the joint distribution feature of GARR. In terms of the froth surface appearance, the joint distribution features can be used to describe the coarseness of the froth surface, which significantly correlate to the loading of the mineral particles in the froth bubbles and consequently with tightly effect on the concentrate grade and the recovery of the valuable ores.
According to the Bayesian inference, the joint distribution of GARR can be described as follows.
)|()(),( | xyHxHyxH XY= (17)
where )(xH means the marginal distribution of the
GARR and )|(| xyH XY means the condition
distribution of the adjacent pixels value of GARR. Since )(xH generally subjects to Gamma distribution and is
positive, we mainly consider the condition distribution )|(| xyH XY in the practical application. Fig.6 displays
the joint probability density of the GARR with its 90% cumulative probability density of its contour. As can be seen from Fig.6 that the GARR is highly correlated and the area proportion of the magnitude region of
)|(| xyH XY of GARR is distinct in the different sub-
bands. In order to preserve the local structure information
of the froth image, the image is also divided into some non-overlapping sub-images in advance the same as the marginal statistical distribution feature extraction. All of the sub-images are processed as an independent froth image. The local joint statistical distribution of GARR (LJGARR) is also treated by computing the area proportion of the 90% cumulative probability to the whole probability density area of the joint distribution. Hence, the joint distribution description of GARR is achieved by the combining of the joint distribution of global GARR (GJGARR) and local joint distribution of GARR (LJGARR) together.
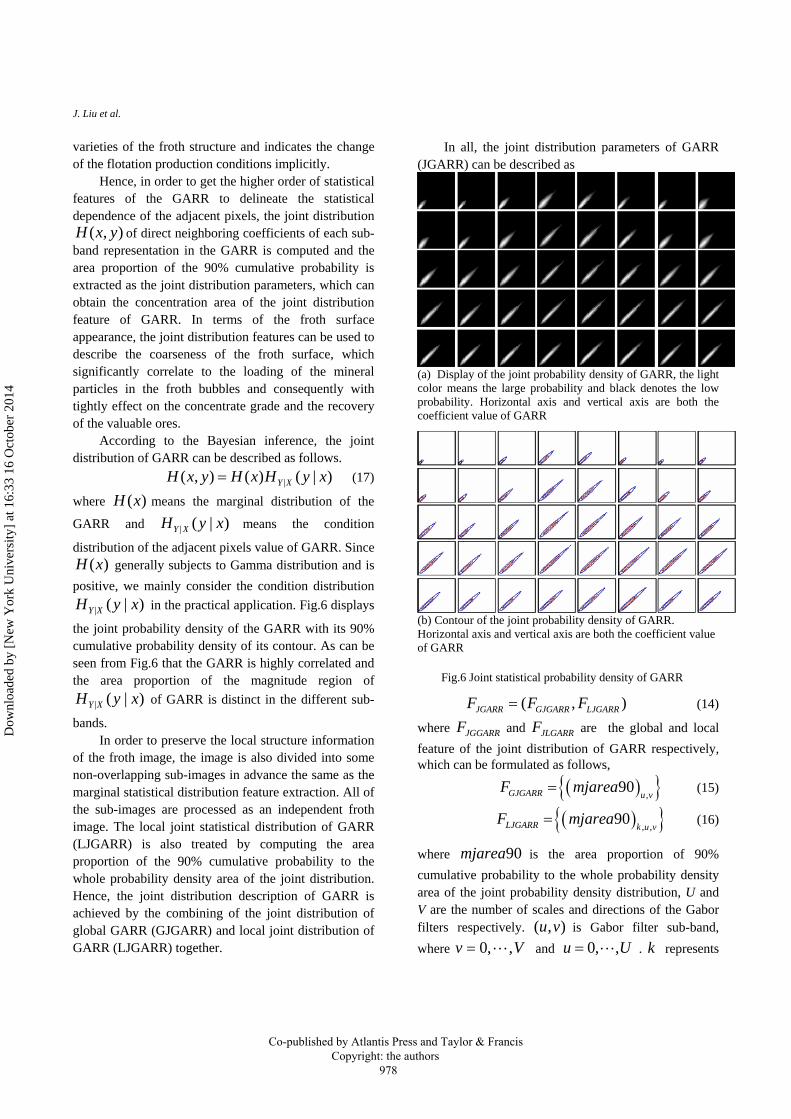
In all, the joint distribution parameters of GARR (JGARR) can be described as
(a) Display of the joint probability density of GARR, the light color means the large probability and black denotes the low probability. Horizontal axis and vertical axis are both the coefficient value of GARR
(b) Contour of the joint probability density of GARR. Horizontal axis and vertical axis are both the coefficient value of GARR
Fig.6 Joint statistical probability density of GARR
( , )JGARR GJGARR LJGARRF F F= (14)
where JGGARRF and JLGARRF are the global and local feature of the joint distribution of GARR respectively, which can be formulated as follows,
( ){ },90GJGARR u v
F mjarea= (15)
( ){ }, ,90LJGARR k u v
F mjarea= (16)
where 90mjarea is the area proportion of 90% cumulative probability to the whole probability density area of the joint probability density distribution, U and V are the number of scales and directions of the Gabor filters respectively. ),( vu is Gabor filter sub-band, where Vv ,,0= and Uu ,,0= . k represents
Co-published by Atlantis Press and Taylor & Francis Copyright: the authors 978
Dow
nloa
ded
by [
New
Yor
k U
nive
rsity
] at
16:
33 1
6 O
ctob
er 2
014
Production Condition Classification & Recognition
the kth sub-image in the froth image and Kk ,,1= , K is the number of sub-images.
3.4. Visual Feature Extracting Based on Statistical Distribution of GPRR
3.4.1 Marginal distribution of GPRR
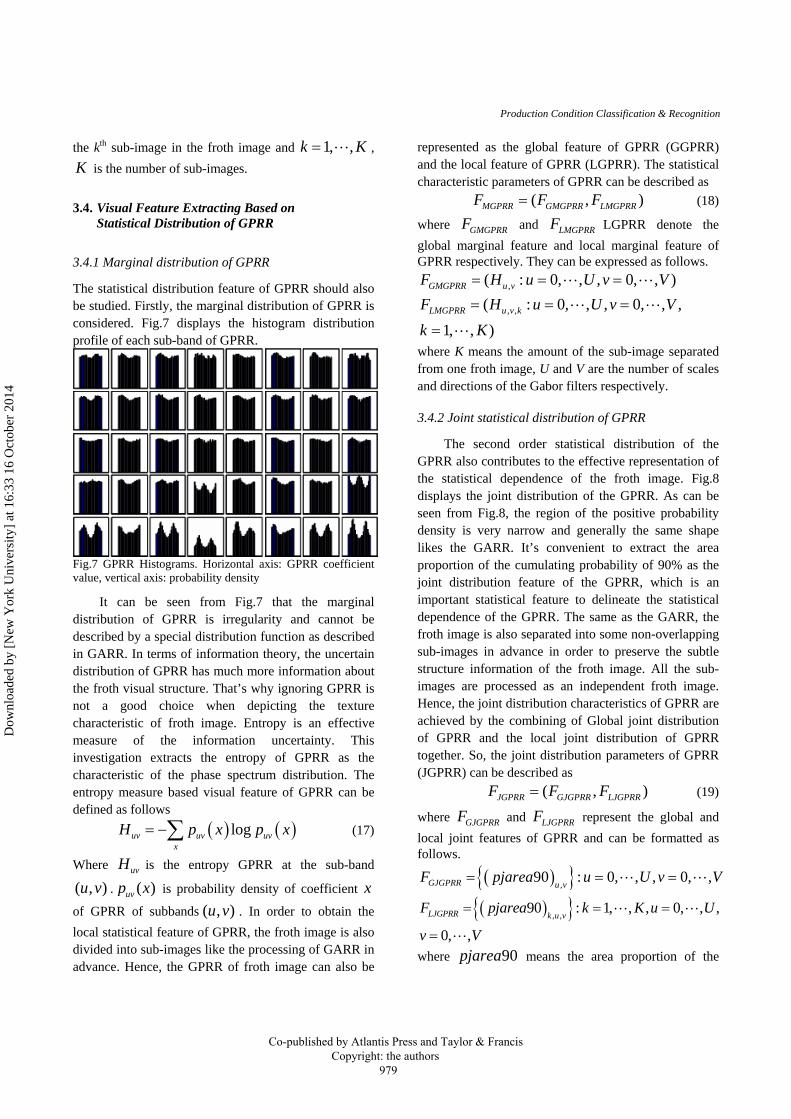
The statistical distribution feature of GPRR should also be studied. Firstly, the marginal distribution of GPRR is considered. Fig.7 displays the histogram distribution profile of each sub-band of GPRR.
Fig.7 GPRR Histograms. Horizontal axis: GPRR coefficient value, vertical axis: probability density
It can be seen from Fig.7 that the marginal distribution of GPRR is irregularity and cannot be described by a special distribution function as described in GARR. In terms of information theory, the uncertain distribution of GPRR has much more information about the froth visual structure. That’s why ignoring GPRR is not a good choice when depicting the texture characteristic of froth image. Entropy is an effective measure of the information uncertainty. This investigation extracts the entropy of GPRR as the characteristic of the phase spectrum distribution. The entropy measure based visual feature of GPRR can be defined as follows
( ) ( )loguv uv uvx
H p x p x= −∑ (17)
Where uvH is the entropy GPRR at the sub-band
( , )u v . ( )uvp x is probability density of coefficient x
of GPRR of subbands ( , )u v . In order to obtain the local statistical feature of GPRR, the froth image is also divided into sub-images like the processing of GARR in advance. Hence, the GPRR of froth image can also be
represented as the global feature of GPRR (GGPRR) and the local feature of GPRR (LGPRR). The statistical characteristic parameters of GPRR can be described as
( , )MGPRR GMGPRR LMGPRRF F F= (18)
where GMGPRRF and LMGPRRF LGPRR denote the global marginal feature and local marginal feature of GPRR respectively. They can be expressed as follows.
,( : 0, , , 0, , )GMGPRR u vF H u U v V= = =
, ,( : 0, , , 0, , ,1, , )
LMGPRR u v kF H u U v Vk K
= = =
=
where K means the amount of the sub-image separated from one froth image, U and V are the number of scales and directions of the Gabor filters respectively.
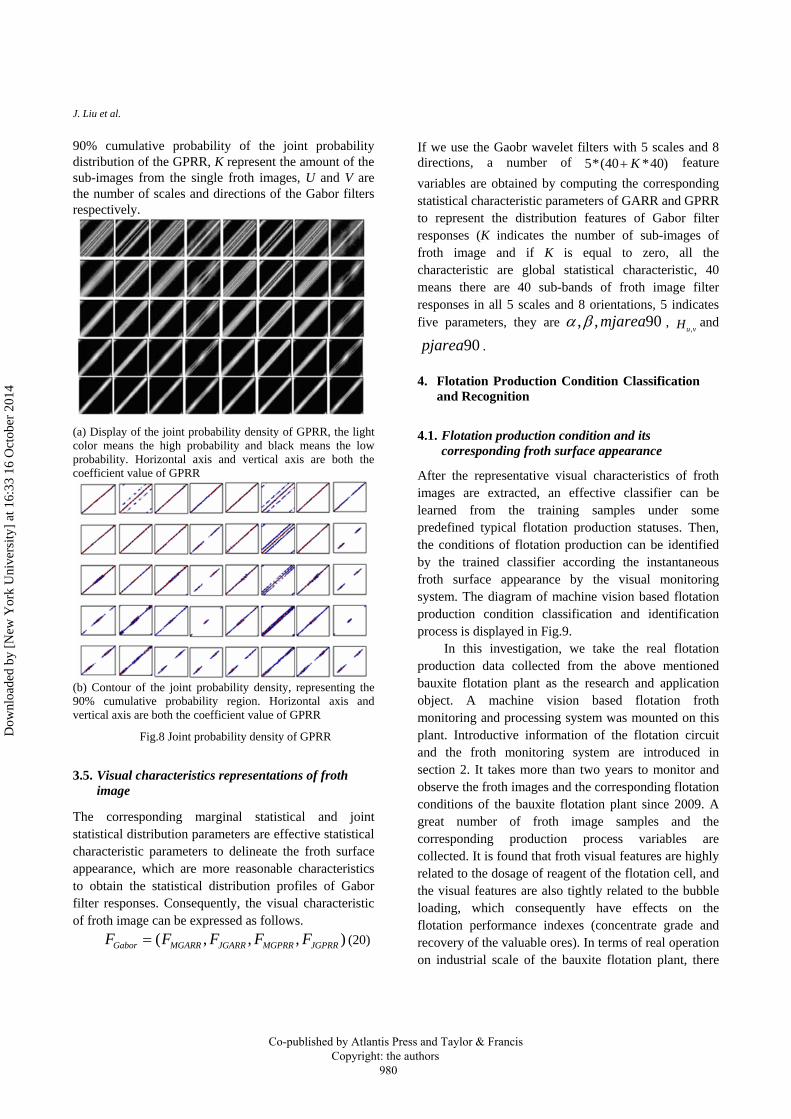
3.4.2 Joint statistical distribution of GPRR
The second order statistical distribution of the GPRR also contributes to the effective representation of the statistical dependence of the froth image. Fig.8 displays the joint distribution of the GPRR. As can be seen from Fig.8, the region of the positive probability density is very narrow and generally the same shape likes the GARR. It’s convenient to extract the area proportion of the cumulating probability of 90% as the joint distribution feature of the GPRR, which is an important statistical feature to delineate the statistical dependence of the GPRR. The same as the GARR, the froth image is also separated into some non-overlapping sub-images in advance in order to preserve the subtle structure information of the froth image. All the sub-images are processed as an independent froth image. Hence, the joint distribution characteristics of GPRR are achieved by the combining of Global joint distribution of GPRR and the local joint distribution of GPRR together. So, the joint distribution parameters of GPRR (JGPRR) can be described as
( , )JGPRR GJGPRR LJGPRRF F F= (19)
where GJGPRRF and LJGPRRF represent the global and local joint features of GPRR and can be formatted as follows.
( ){ },90 : 0, , , 0, ,GJGPRR u v
F pjarea u U v V= = =
( ){ }, ,90 : 1, , , 0, , ,
0, ,LJGPRR k u v
F pjarea k K u U
v V
= = =
=where 90pjarea means the area proportion of the
Co-published by Atlantis Press and Taylor & Francis Copyright: the authors 979
Dow
nloa
ded
by [
New
Yor
k U
nive
rsity
] at
16:
33 1
6 O
ctob
er 2
014
J. Liu et al.
90% cumulative probability of the joint probability distribution of the GPRR, K represent the amount of the sub-images from the single froth images, U and V are the number of scales and directions of the Gabor filters respectively.
(a) Display of the joint probability density of GPRR, the light color means the high probability and black means the low probability. Horizontal axis and vertical axis are both the coefficient value of GPRR
(b) Contour of the joint probability density, representing the 90% cumulative probability region. Horizontal axis and vertical axis are both the coefficient value of GPRR
Fig.8 Joint probability density of GPRR
3.5. Visual characteristics representations of froth image
The corresponding marginal statistical and joint statistical distribution parameters are effective statistical characteristic parameters to delineate the froth surface appearance, which are more reasonable characteristics to obtain the statistical distribution profiles of Gabor filter responses. Consequently, the visual characteristic of froth image can be expressed as follows.
( , , , )Gabor MGARR JGARR MGPRR JGPRRF F F F F= (20)
If we use the Gaobr wavelet filters with 5 scales and 8 directions, a number of )40*40(*5 K+ feature variables are obtained by computing the corresponding statistical characteristic parameters of GARR and GPRR to represent the distribution features of Gabor filter responses (K indicates the number of sub-images of froth image and if K is equal to zero, all the characteristic are global statistical characteristic, 40 means there are 40 sub-bands of froth image filter responses in all 5 scales and 8 orientations, 5 indicates five parameters, they are 90,, mjareaβα ,
vuH ,and
90pjarea .
4. Flotation Production Condition Classification and Recognition
4.1. Flotation production condition and its corresponding froth surface appearance
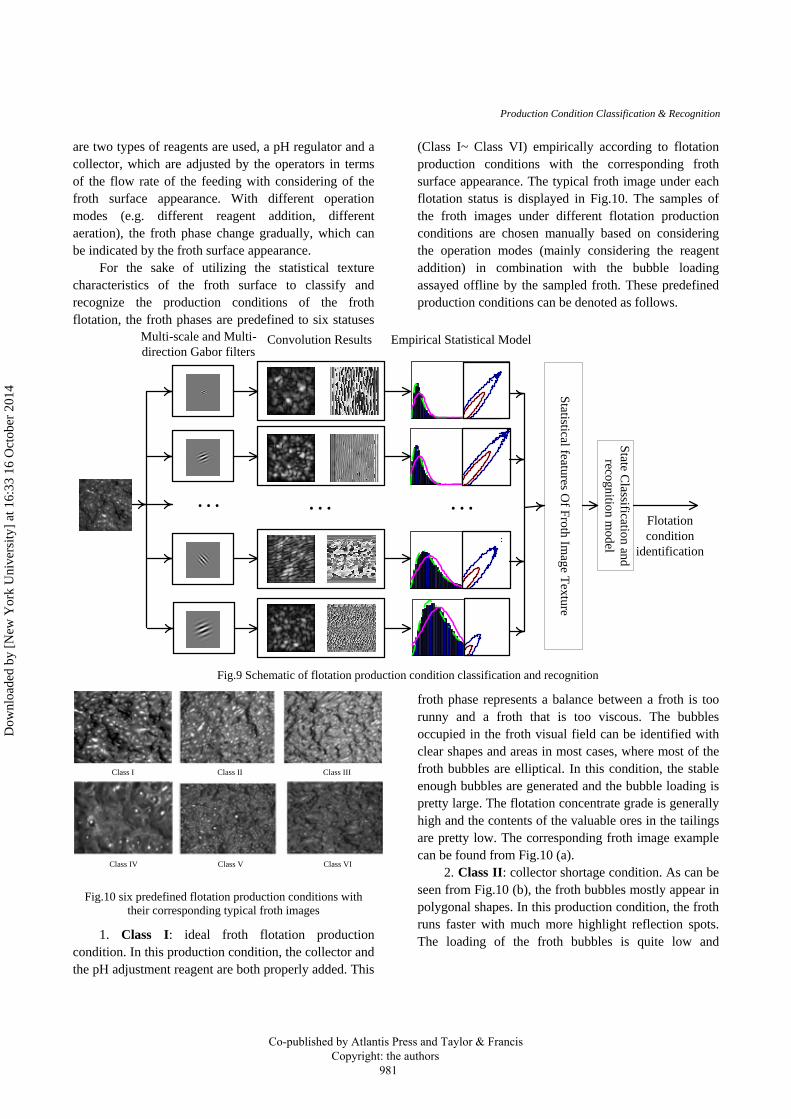
After the representative visual characteristics of froth images are extracted, an effective classifier can be learned from the training samples under some predefined typical flotation production statuses. Then, the conditions of flotation production can be identified by the trained classifier according the instantaneous froth surface appearance by the visual monitoring system. The diagram of machine vision based flotation production condition classification and identification process is displayed in Fig.9.
In this investigation, we take the real flotation production data collected from the above mentioned bauxite flotation plant as the research and application object. A machine vision based flotation froth monitoring and processing system was mounted on this plant. Introductive information of the flotation circuit and the froth monitoring system are introduced in section 2. It takes more than two years to monitor and observe the froth images and the corresponding flotation conditions of the bauxite flotation plant since 2009. A great number of froth image samples and the corresponding production process variables are collected. It is found that froth visual features are highly related to the dosage of reagent of the flotation cell, and the visual features are also tightly related to the bubble loading, which consequently have effects on the flotation performance indexes (concentrate grade and recovery of the valuable ores). In terms of real operation on industrial scale of the bauxite flotation plant, there
Co-published by Atlantis Press and Taylor & Francis Copyright: the authors 980
Dow
nloa
ded
by [
New
Yor
k U
nive
rsity
] at
16:
33 1
6 O
ctob
er 2
014
Production Condition Classification & Recognition
are two types of reagents are used, a pH regulator and a collector, which are adjusted by the operators in terms of the flow rate of the feeding with considering of the froth surface appearance. With different operation modes (e.g. different reagent addition, different aeration), the froth phase change gradually, which can be indicated by the froth surface appearance.
For the sake of utilizing the statistical texture characteristics of the froth surface to classify and recognize the production conditions of the froth flotation, the froth phases are predefined to six statuses
(Class I~ Class VI) empirically according to flotation production conditions with the corresponding froth surface appearance. The typical froth image under each flotation status is displayed in Fig.10. The samples of the froth images under different flotation production conditions are chosen manually based on considering the operation modes (mainly considering the reagent addition) in combination with the bubble loading assayed offline by the sampled froth. These predefined production conditions can be denoted as follows.
State Classification and
recognition model
Statistical features Of Froth Im
age Texture
Multi-scale and Multi-direction Gabor filters
Convolution Results Empirical Statistical Model
Flotation condition
identification
Fig.9 Schematic of flotation production condition classification and recognition
Class I Class II Class III
Class IV Class V Class VI
Fig.10 six predefined flotation production conditions with
their corresponding typical froth images
1. Class I: ideal froth flotation production condition. In this production condition, the collector and the pH adjustment reagent are both properly added. This
froth phase represents a balance between a froth is too runny and a froth that is too viscous. The bubbles occupied in the froth visual field can be identified with clear shapes and areas in most cases, where most of the froth bubbles are elliptical. In this condition, the stable enough bubbles are generated and the bubble loading is pretty large. The flotation concentrate grade is generally high and the contents of the valuable ores in the tailings are pretty low. The corresponding froth image example can be found from Fig.10 (a).
2. Class II: collector shortage condition. As can be seen from Fig.10 (b), the froth bubbles mostly appear in polygonal shapes. In this production condition, the froth runs faster with much more highlight reflection spots. The loading of the froth bubbles is quite low and
Co-published by Atlantis Press and Taylor & Francis Copyright: the authors 981
Dow
nloa
ded
by [
New
Yor
k U
nive
rsity
] at
16:
33 1
6 O
ctob
er 2
014
J. Liu et al.
consequently the recovery of the valuable ores is generally low.
3. Class III: collector over-dosage condition. The froth images are comprised of overloading bubbles. The appearance of the froth of this type is apparently distinctive to the appearance of the froth image of Class II, with much fewer highlight reflection. In this froth condition, the froth usually runs slowly with mudding bubbles. The recovery of the valuable ores is also quite high, but the concentrate grade may be lower. The typical froth image can be seen from Fig.10 (c).
4. Class IV: the “poisoned” condition. In this condition, the PH adjustment reagent is added too much, and the froth bubbles are generally too big. The froth runs slowly without loading much valuable ores. A great number of valuable particles are discarded, and consequently the recovery is the lowest. Both the valuable mineral resource and the reagent additive are wasted a lot, but the output grade is quite low. That is to say, the froth is failed to separate the mineral ores with the gangue, which is the most reluctant production condition to be faced. The typically froth image is displayed as Fig.10 (d).
5. Class V: the low pH production condition. In this production condition, the froth image is running and with much more tinny bubbles. In this condition, the bubble loading is uncertain, the recovery of the ores may be low, but the concentrate grade is relatively high. The overflow of the flotation cell may occur frequently. This condition is also expected to be avoided. The typical froth image can be seen from Fig.10 (e).
6. Class VI: the overloading status. In this production status, the froth bubble's load too much mineral particles, the bubble burst and collapse heavily. There are few highlight spots in the froth surface and the froth surface is darker than the froth image of other statuses, the bubbles cannot be distinguished apparently. In this condition, the flotation recovery is generally high, but the concentrate grade is lower, for the gangues and other non-desired particles may be scrapped to the concentrator in the froth layer. The typical froth image can be seen from the Fig.10 (f).
4.2. Flotation production conditions clustering analysis
Aiming at classifying the different production conditions with the froth visual features extracted in this
work, the conventional unsupervised clustering method, fuzzy c-means clustering method is employed for the froth phase classification in advance. As aforementioned, the dimension of the visual feature is quite large, especially with the increasing amount of the sub-images. The distribution of the sub-image has statistical dependence to its Global statistical distribution and also has statistical similarity to the statistical distribution of its adjacent sub-images. Hence, a dimension reduction processing is necessary and economic to feature storage, processing and the successive froth condition clustering. In order to evaluate the clustering capability of the statistical features of gaborF visually, the unsupervised clustering description based on principal component analysis (PCA) is implemented by selecting the first two principal components on 2D coordinate plane. As to a feature matrix X , the decomposition function of PCA is
∑=
+=D
i
Tii EptX
1
(20)
where D indicates the number of principal component selected, E denotes residual, p represents the principal component coefficients also known as loadings, t is the principal component scores.
Two groups of clustering experiments are conducted on a series of flotation images randomly selected from the six flotation conditions (class I~ class VI). In experiment 1, there are 19 samples of Class I, 18 samples of Class II, 19 samples of Class III, 14 samples of Class IV ,16 samples of Class V, 22 samples of Class VI; in experiment 2, there are 25 samples of Class I, 20 samples of Class II, 15 samples of Class III, 19 samples of Class IV ,18 samples of Class V, 20 samples of Class VI. Fig.11 displays the cluster results of the two experiments of scatting plots after flotation froth image samples are clustered based on PCA and fuzzy C-means clustering. The first two main components are selected in this experiment to process fuzzy clustering analysis. In Fig.11, 1t and 2t are the mean of the in PCA decomposition respectively. Fig.11 reveals that the six froth conditions can be classified well while only a few overlaps in the adjacent of the classes. The classifying result also indicates that the froth condition of class I in normal status can be separated with the froth image in poisoned production condition (class IV) excellently. These two experiments indicate that the industrial
Co-published by Atlantis Press and Taylor & Francis Copyright: the authors 982
Dow
nloa
ded
by [
New
Yor
k U
nive
rsity
] at
16:
33 1
6 O
ctob
er 2
014
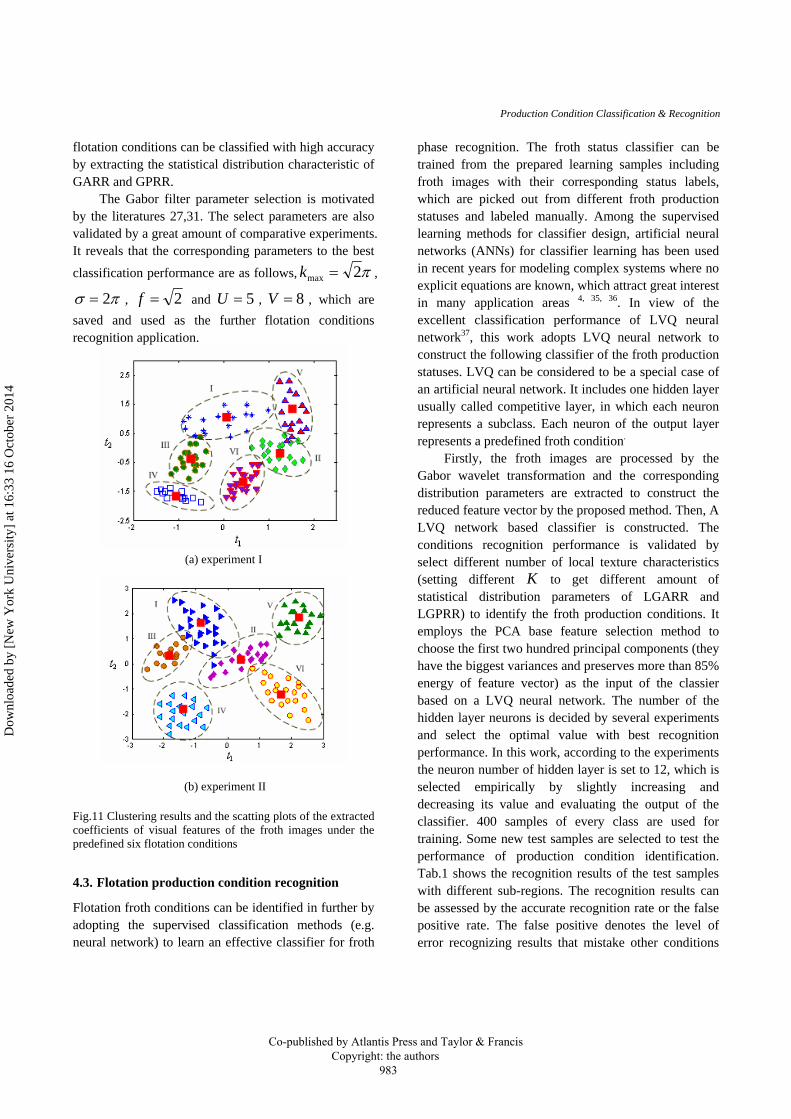
Production Condition Classification & Recognition
flotation conditions can be classified with high accuracy by extracting the statistical distribution characteristic of GARR and GPRR.
The Gabor filter parameter selection is motivated by the literatures 27,31. The select parameters are also validated by a great amount of comparative experiments. It reveals that the corresponding parameters to the best
classification performance are as follows, π2max =k ,
πσ 2= , 2=f and 5=U , 8=V , which are saved and used as the further flotation conditions recognition application.
(a) experiment I
(b) experiment II
Fig.11 Clustering results and the scatting plots of the extracted coefficients of visual features of the froth images under the predefined six flotation conditions
4.3. Flotation production condition recognition
Flotation froth conditions can be identified in further by adopting the supervised classification methods (e.g. neural network) to learn an effective classifier for froth
phase recognition. The froth status classifier can be trained from the prepared learning samples including froth images with their corresponding status labels, which are picked out from different froth production statuses and labeled manually. Among the supervised learning methods for classifier design, artificial neural networks (ANNs) for classifier learning has been used in recent years for modeling complex systems where no explicit equations are known, which attract great interest in many application areas 4, 35, 36. In view of the excellent classification performance of LVQ neural network37, this work adopts LVQ neural network to construct the following classifier of the froth production statuses. LVQ can be considered to be a special case of an artificial neural network. It includes one hidden layer usually called competitive layer, in which each neuron represents a subclass. Each neuron of the output layer represents a predefined froth condition.
Firstly, the froth images are processed by the Gabor wavelet transformation and the corresponding distribution parameters are extracted to construct the reduced feature vector by the proposed method. Then, A LVQ network based classifier is constructed. The conditions recognition performance is validated by select different number of local texture characteristics (setting different K to get different amount of statistical distribution parameters of LGARR and LGPRR) to identify the froth production conditions. It employs the PCA base feature selection method to choose the first two hundred principal components (they have the biggest variances and preserves more than 85% energy of feature vector) as the input of the classier based on a LVQ neural network. The number of the hidden layer neurons is decided by several experiments and select the optimal value with best recognition performance. In this work, according to the experiments the neuron number of hidden layer is set to 12, which is selected empirically by slightly increasing and decreasing its value and evaluating the output of the classifier. 400 samples of every class are used for training. Some new test samples are selected to test the performance of production condition identification. Tab.1 shows the recognition results of the test samples with different sub-regions. The recognition results can be assessed by the accurate recognition rate or the false positive rate. The false positive denotes the level of error recognizing results that mistake other conditions
Co-published by Atlantis Press and Taylor & Francis Copyright: the authors 983
Dow
nloa
ded
by [
New
Yor
k U
nive
rsity
] at
16:
33 1
6 O
ctob
er 2
014
J. Liu et al.
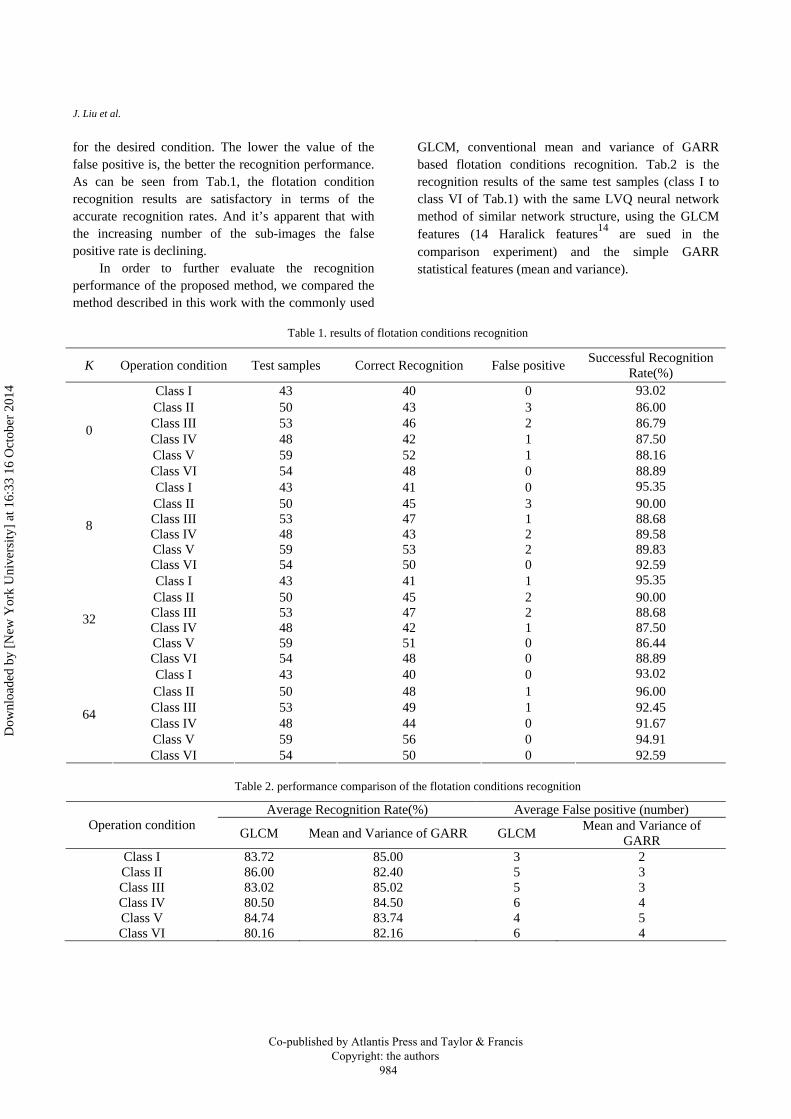
for the desired condition. The lower the value of the false positive is, the better the recognition performance. As can be seen from Tab.1, the flotation condition recognition results are satisfactory in terms of the accurate recognition rates. And it’s apparent that with the increasing number of the sub-images the false positive rate is declining.
In order to further evaluate the recognition performance of the proposed method, we compared the method described in this work with the commonly used
GLCM, conventional mean and variance of GARR based flotation conditions recognition. Tab.2 is the recognition results of the same test samples (class I to class VI of Tab.1) with the same LVQ neural network method of similar network structure, using the GLCM features (14 Haralick features14 are sued in the comparison experiment) and the simple GARR statistical features (mean and variance).
Table 1. results of flotation conditions recognition
K Operation condition Test samples Correct Recognition False positive Successful Recognition Rate(%)
Class I 43 40 0 93.02 Class II 50 43 3 86.00 Class III 53 46 2 86.79 Class IV 48 42 1 87.50 Class V 59 52 1 88.16
0
Class VI 54 48 0 88.89 Class I 43 41 0 95.35 Class II 50 45 3 90.00 Class III 53 47 1 88.68 Class IV 48 43 2 89.58 Class V 59 53 2 89.83
8
Class VI 54 50 0 92.59 Class I 43 41 1 95.35 Class II 50 45 2 90.00 Class III 53 47 2 88.68 Class IV 48 42 1 87.50 Class V 59 51 0 86.44
32
Class VI 54 48 0 88.89 Class I 43 40 0 93.02 Class II 50 48 1 96.00 Class III 53 49 1 92.45 Class IV 48 44 0 91.67 Class V 59 56 0 94.91
64
Class VI 54 50 0 92.59
Table 2. performance comparison of the flotation conditions recognition
Average Recognition Rate(%) Average False positive (number) Operation condition GLCM Mean and Variance of GARR GLCM Mean and Variance of
GARR Class I 83.72 85.00 3 2 Class II 86.00 82.40 5 3 Class III 83.02 85.02 5 3 Class IV 80.50 84.50 6 4 Class V 84.74 83.74 4 5 Class VI 80.16 82.16 6 4
Co-published by Atlantis Press and Taylor & Francis Copyright: the authors 984
Dow
nloa
ded
by [
New
Yor
k U
nive
rsity
] at
16:
33 1
6 O
ctob
er 2
014

Production Condition Classification & Recognition
In combination with Tab.1 and Tab.2 it can be concluded that the statistical distribution features of GARR and GPRR can achieve much better flotation production condition classification and recognition performance. The condition identification results can will in further provide guidelines for automatic flotation process control and operation adjustment..
5. Conclusions
A Gabor wavelet transform based statistical distribution feature extraction of froth images to production condition recognition is presented in this work. It’s essentially different to the conventional energy based feature extraction methods (extracting statistical mean and variance) of the Gaobr filter responses, the marginal distribution and the joint distribution of the magnitude spectra and phase spectra of the convolution image of Gabor wavelet transformation are statistically modeled and analyzed. The statistical distribution features of GARR and GPRR of all sub-bands are computed and extracted as the froth image visual characteristics.
The real production data collected from a bauxite flotation plant is used as the concrete research and application object. The froth image characteristics variables clustering results turn out that the method described in this work is promising and the ideal flotation condition with high production indexes and proper reagent addition is essentially distinct to the poisoned condition with low flotation production performance and great resource waste. The ultimate flotation production conditions recognition results based on these statistical features of GARR and GPRR is satisfactory with relative high recognition rates. The extensive comparison results turn out this froth image feature extraction method can obtain the effective production condition information and it apparently outperforms the commonly used froth condition identification method.
In all, the method described is effective and economical to the flotation process monitoring and production conditions evaluation, which paves the way for the optimal control of the flotation process according to the production conditions classification and recognition results. This method of extraction of the froth surface visual features instructs a good direction to the multi-resolution and multi-orientation analysis of froth texture. The further task is to get the optimal parameters
setting of Gabor filters theoretically for froth image feature extraction and to develop a machine vision based flotation optimization control system according to the production conditions recognition results for the ultimate purpose of improving the flotation performance.
Acknowledgements
This work is fully supported by the key program of National Nature Science Foundation of China under grant 61134006 and partially supported by Nation Nature Science Foundation of China no. 61071176, 61171192 and 61272337.
References 1 M. Suichies, D. Leroux, C. Dechert, et al, An
implementation of generalized predictive control in a flotation plant, Control Eng. Pract., 8(3) (2000), pp. 319-325.
2 T. Y. Chai, Optimal operation control for complex industrial processes, in the 8th IFAC Symposium on Advance Control of Chemical Processes, eds. V. Kariwala, L. Samavedham and R.D. Braatz,(Furama Riverfont, Sigapore, 2012), pp.722-731.
3 D. W. Moolman, C. Aldrich and G. P. J. Schmitz, The interrelationship between surface froth characteristics and industrial flotation performance, Miner. Eng., 9(8) (1996), pp.837-854.
4 D. W. Moolman,C. Aldrich, J.S.J van-Deventer, W.W. Stange, The classification of froth structures in a copper flotation plant by means of a neural net, Int. J. Miner. Process, 43(3-4) (1995), pp. 193-208.
5 J. Kaartinen, J. Hatonen and H. Hyotyniemi, et al, Machine-vision-based control of zinc flotation-a case study, Control Eng. Pract., 14(12) (2006), pp.1455-1466.
6 C. Citir, Z. Aktas and R. Berber, Off-line image analysis for froth flotation of coal, Comput. & Chem. Eng., 28(5) (2004), pp. 625-632.
7 P. N. Holtham and K. K. Nguyen, On-line analysis of froth surface in coal and mineral flotation using JKFrothCam, Int. J. Miner. Process., 64(2-3) (2002), pp.163-180.
8 E. C. Cilek, Application of neural networks to predict locked cycle flotation test results, Miner. Eng., 15(12) (2002), pp.1095 – 1104.
9 J. M. Harrave and S. T. Hall, Diagnosis of concentrate grade and mass flowrate in tin flotation from color and surface texture analysis, Miner. Eng., 10(6) (1997), pp. 6-13.
10 A. E. Ventura-Medin and J. J. Cilliers, Calculation of the specific surface area in flotation, Miner. Eng., 13(3) (2000), pp.265-275.
11 C. Aldrich, C. Marais, B. J. Shean, J.J. Cilliers, Online monitoring and control of froth flotation systems with
Co-published by Atlantis Press and Taylor & Francis Copyright: the authors 985
Dow
nloa
ded
by [
New
Yor
k U
nive
rsity
] at
16:
33 1
6 O
ctob
er 2
014

J. Liu et al.
machine vision: A review, Int. J. Miner. Process., 96(1-4) (2010), pp.1-13.
12 L.G. Bergh; J. B.Yianatos, The long way toward multivariate predictive control of flotation processes, J. Process Contr., 21(2) (2011), pp.226-234.
13 G. Bartolacci, P. J. Pelletier and J. J. Tessier, et al, Application of numerical image analysis to process diagnosis and physical parameter measurement in mineral processes—part I: flotation control based on froth textural characteristics, Miner. Eng., 19(6-8) (2006), pp.734-747.
14 J. Liu, J. F. Macgregor and C. Duchesne. et al, Flotation froth monitoring using multiresolutional multivariate image analysis, Miner. Eng., 18(1) (2005), pp.65~76.
15 D. W. Moolman, C. Aldrich and J. S. J. Van Deventer, et al, Digital image processing as a tool for on-line monitoring of froth in flotation plants, Miner. Eng., 7(9) (1994), pp.1149-1164.
16 J. M. Hargrave, G. J. Brown and S. T. Hall, A fractal characterization of the structure of coal froths, Coal Prep., 19(1-2) (1998), pp.69-82.
17 J. Kaartinen, J. Hätönen and H. Hyötyniemi, et al, Machine-vision-based control of zinc flotation—A case study, Control Eng. Pract., 14(12) (2006), no.12, pp.1455-1466.
18 X.M. Mu, J.P. Liu, W.H. Gui, et al., Machine vision based flotation froth mobility analysis, In the 29th Chinese Control Conference(CCC2010), eds. J. Chen, (Beijing, China, 2010), pp.3012-3017.
19 S. H. Morar, M. C. Harris, D. J. Bradshaw, The use of machine vision to predict flotation performance, Miner. Eng., (36-38) (2012), pp.31-36.
20 E. V. Kurmyshev, M. Poterasu and J. T. Guillen-Bonilla, The efficiency of texture image classification is certainly influenced by image scale when a feature space or a classification method is not scale invariant. An alternative approach, Appl. Opt., 46(9) (2007), pp.1467-1476.
21 C. Cheong, G. Bowman and T. D. Han, Unsupervised clustering approaches to color classification for color-based image code recognition, Appl. Opt., 47(13) (2008), pp.2326-2345.
22 J. Zhang, T. Tan, Brief review of invariant texture analysis methods, Pattern Recog., 35(3) (2002), pp.735-747.
23 L. Velisavljevic, J. H. Elder, Texture properties affecting the accuracy of surface attitude judgments, Vision Research, 46(14) (2006), pp.2166-2191.
24 S.E. Grigorescu, N. Petkov and P. Kruizinga, Comparison of texture features based on Gabor filters, IEEE T. on Image Process., 11(10) (2002), pp.1160-1167.
25 W. Su, C. Zhang, J. Yang, et al., Analysis of wavelet packet and statistical textures for object-oriented classification of forest-agiculture ecotones using SPOT 5 imagery, Int J Remote Sens, 33(11) (2012), pp.3557-3579.
26 J. G. Daugman. Uncertainty relation for resolution in space, spatial frequency, and orientation optimized by two-dimensional visual cortical filters. Journal of the Optical Society of America A, 2(7) (1985), pp.1160–1169.
27 L. Yu, Z. S. He, Q. Cao, Gabor texture representation method for face recognition using the Gamma and generalized Gaussian models, Image Vision Comput., 28(1) (2010), pp.177-187.
28 L.Wiskott, J.M. Fellous, N. Kruger, C von der. Malsburg, Face recognition by elastic bunch graph matching, IEEE Trans. Pattern Anal. Mach. Intell., 19(4) (1997), pp.775-779.
29 S. Arivazhagan, L. Ganesan and S. Padam-Priyal, Texture classification using Gabor wavelets based rotation invariant features, Pattern Recog. Lett., 27(16) (2007), pp.1976-1982.
30 B. S. Manjunath and W. Y. Ma, Texture feature for browsing and retrieval of image data, IEEE Trans. Pattern Analysis and Machine Intel., 18(8) (1996), pp.837-842.
31 M. Lades, J.C. Vorbrüggen, J. Buhmann, J. Lange, et al, Distortion invariant object recognition in the dynamic link architecture, IEEE Trans. Comput., 42(3) (1993), pp. 300–311.
32 J. G. Daugman, High confidence visual recognition of persons by a test of statistical independence, IEEE T Pattern Anal, 15(11) (1993), pp. 1148-1161.
33 B. Zhang. Histogram of Gabor phase patterns(HGPP): A novel object representation approach for face recognition. IEEE T Image Process, 16(1) (2007), pp.57-68.
34 H. W. Lilliefors, On the Kolmogorov-Sminov test for normality with mean and variance unknown, J. Am. Stat. Assoc., 62(318) (1967), pp. 399-402.
35 E. Jorjani, H. Asadollahi Poorali and A. Sam, et al, Prediction of coal response to froth flotation based on coal analysis using regression and artificial neural network, Miner. Eng., 22(11) (2009), pp. 970-976.
36 E. Jorjani, H. Asadollahi Poorali and A. Sam, et al, Prediction of coal response to froth flotation based on coal analysis using regression and artificial neural network, Miner. Eng., 22(11) (2009), pp. 970-976.
37 T. Kohonen, Self-Organizing Maps. Springer, (Berlin, 1997).
Co-published by Atlantis Press and Taylor & Francis Copyright: the authors 986
Dow
nloa
ded
by [
New
Yor
k U
nive
rsity
] at
16:
33 1
6 O
ctob
er 2
014