Embed Size (px)
Citation preview

Machinery in the United States, Sweden, and Germany -- An Assessment
of Changes in Comparative Advantage
By
Frank Weiss and Frank Wolter
C o n t e n t s : I . I n t r o d u c t i o n . - - I I . T h e P a t t e r n o f D e v e l o p m e n t . - - I I I . T h e D e t e r m i n a n t s o f L o c a t i o n : I. I n n o v a t i v e n e s s a n d R & D I n t e n s i t y ; 2. H u m a n C a p i t a l ; 3. P h y s i c a l C a p i t a l ; 4. I n v e s t m e n t B e h a v i o u r a n d F a c t o r R e w a r d s ; 5. E c o n o m i e s o f S ca l e ; 6. N a t i o n a l I d i o s y n c r a s i e s . - - IV . T h e S t r u c - t u r e o f C o m p a r a t i v e A d v a n t a g e .
I. Introduction
(I) Since its very beginnings machinery had been the domain of the old established industrial nations. Almost unchallenged in their domestic markets, the traditional machinery suppliers such as the United States or Germany shared the rest of the world marke t among themselves for decades. I t was in the af te rmath of World War I I tha t this picture was to change. Essentially, this change can be characterized as a succession of three waves. Beginning with the removal of trade barriers in the I95OS, increasing market inter-penetration among the industrial countries marked the first wave of adjustment pressure. The I96OS saw the emergence of several recently industrialized nations - - Japan, I taly, and Canada - - as vigorous competitors in the world marke t for machinery, init iat ing a second wave of adjustment pressure. In the I97OS, a new wave of adjust- ment pressure is originating from developing countries. Under the impetus of "self-reliance," which in developing nations enjoys an increasing appeal, efforts at import-substi tut ion are far from having ended. Also, in a number
Remark: This paper reports research under taken in the "Sonderforschungsbereich 86, Weltwirtschaft und internationale Wirtschaftsbeziehungen (Kiel/Hamburg)"j with financial support provided by the Deutsche Forschungsgemeinschaft . The paper is a contribution to project "Anpassungsprozesse in Industrieltindern als Folge der Industrialisierung der Ent - wicklungslttnder" (Project Director: Prof. Dr. Gerhard Fels). The authors would like to thank an anonymous referee for valuable comments. Thanks are also due to Christel Har tz for doing the calculations.

Machinery in the United States, Sweden, and Germany 283
of semi-industrialized developing countries industrialization has reached a stage where these countries are apt to be competitive in world markets for more sophisticated goods. In both fields, import-substituting as well as export-promoting activities, machinery products have a r61e to play.
(2) Regarding these developments, the question of the future pro- spects for the highly advanced economies' machinery becomes relevant. As a matter of fact, there exists no global answer to this question. Being very heterogenous, machinery subbranches' fortunes may largely differ. Thus, for high-income countries it is of particular interest to know in which machinery activities they are most likely to maintain their compet- itive edge and in which lines of production they are most likely to meet increasing competitive pressure. In order to analyze this problem empir- ically, we shall focus on the recent development of machinery in the United States, Sweden, and the Federal Republic of Germany. These countries have been selected for investigation because they belong to the most advanced economies in the world but differ in the size of their domestic market and in their structure of production. Analyzing these countries, the purpose of this paper is firstly, to specify determinants of location for the machinery industry as a whole, and secondly to identify individual branches of machinery, if any, in which these highest-income countries are tending to lose their competitiveness. In Chapter II a multi-country cross-section analysis is undertaken to determine a "normal pattern" of development for the machinery industry. For the United States, Sweden, and Germany deviations from this normal pattern are used to diagnose country-specific idiosyncrasies. Chapter III discusses some determinants of location. Changes in relative factor absorption, as well as economies of scale and national idiosyncrasies are examined for their implications on the high-income countries as advantageous locations for the machinery industry. Chapter IV applies the concept of revealed comparative advan- tage to 22 sub-industries of machinery and seeks to explain the revealed specialization structure by relative factor-intensities and scale factors.
H. The Pattern of Development
(3) Mechanical engineering seems to constitute one of the dynamic sectors of the world economy. According to recent estimates of the Verein Deutscher Maschinenbauanstalten (VDMA), between 1966 and 1971 world real production of mechanical engineering products increased by 7.0 per- cent annually compared to a 4.5 percent increase in manufacturing pro- duction 1. A systematic insight into the development of mechanical engi-
1 See Verein Deutscher Maschinenbauanstalten (VDMA), Weltmaschinenproduktion, Wirtschaflsbild, Frankfurt]M, x973, p. i .
Weltwirtschaftliches Archiv Bd. CXI. x 9

284 F r a n k W e i s s and F r a n k W o l t e r
neering can be derived from an international cross-section analysis, which may also serve as an international standard development pattern ("normal pattern") of mechanical engineering, against which the expansion path of machinery in the United States, Sweden, and Germany can be checked. The hypothesis to be tested has been intensively discussed elsewhere and needs no deeper elaboration here 1. In short, the main idea is that the structure of production of a country systematically changes over the course of development. Hence, a functional relationship between an indus- t ry 's contribution to GDP (or to manufacturing) and per capita income (as a proxy for the stage of development) is presumed. In addition to per capita income, population is introduced as an exogenous variable to ac- count for possible scale effects s. The sample consists of 48 countries; this was the maximum available in the United Nations' Growth of World Industry statistics 3. Out of six different types of functions tested the following fitted best:
(I) VAME = - - 13.613 + 2.465 In y + 0.905 In P R ~ ----- o.68 (4- 0.263) (4- O.191 )
where "VAME" is the share of value added of machinery (ISIC 382) in manufacturing (ISIC 3) in percent; y is gross domestic product per capita in purchaser values (US $); p is population size in millions. Both coeffi- cients are significant at the 99 percent level and show the expected sign. Equation (I) implies
- - a relatively rapid expansion of mechanical engineering during the early phase of industrialization, which slows down during later phases; relative to manufacturing the machinery sector expands throughout the range of per capita income levels observable in the world economy;
1 See Hollis B. Chenery, "Patterns of Industrial Growth", The American Economic Review, Vol. 5o, Menasha, Wise., x96o, pp. 624sqq. - - United Nations, A Study o/ Industrial Growth, New York, x963. - - Hollis B. Chenery and Lance Taylor, "Development Patterns: Among Countries and over Time", The Review of Economics and Statistics, Vol. 5o, Cambridge, Mass., i968, pp. 39x sqq. - - G. Fels, K.-W. Schatz und F. Wolter, "Der Zusammenhang zwischen Produktionsstruktur und Entwicklungsniveau, Versuch einer Strukturprognose fiir die west- deutsche Wirtschaft", Weltwirtschaflliches Archly, Bd. xo6, x97I I, pp. 24o sqq.
t In the regression analysis a third variable, the relative degree of industrialization, as catch-all for country specific advantages in industrial production independent of the stage of economic development and the size of the domestic market was tested, but its explanatory power turned out to be small or insignificant.
, For the list of 48 sample countries, data sources and methods of computation see Frank Weiss and Frank Wolter, Machinery in the United States, Sweden, and Germany An Assessment o! Changes in Comparative Advantage, Kiel Working Paper, No. 23, x974.

Machinery in the United States, Sweden, and Germany 285
- - a distinct influence of market size which decreases relatively with increasing population and increasing per capita income.
The increasing share of machinery in manufacturing does not mean, however, that at advanced stages of economic development mechanical engineering remains a growth industry. As has been found elsewhere, starting with a per capita income of about 2ooo US $ (I965 prices and exchange rates) the share of value added by manufacturing in gross domestic product tends to decline x. Hence in terms of contribution to GDP machinery ceases expanding when its increasing weight in manu- facturing is countered by the decreasing weight of manufacturing in gross domestic product.
(4) A hypothesis analogous to that for the production structure can be advanced for the employment structure. This implicitly assumes that factor price relations systematically change with the level of development, and that production functions of machinery for countries at the same level of development are identical. Requiring a 99 percent level of signif- icance for the coefficients of the exogenous variables, the regressions testing the above hypothesis yielded the following best fits:
(2) EME = - - I2.2II -~ 2.405 In y + O.666 In P R ~ = 0.64 (• 0.308) (:!: 0.223)
The notation of the exogenous variables is ideritical to that used in equation (I). EME is the percentage share of machinery employment in manufacturing.
A comparison of the two parameters of equations (I) and (2) reveals that the elasticities of EME with respect to both per capita income and to population size for given values of the variable in question are some- what lower than is true for VAME. This indicates that ceteris paribus labour productivity in machinery relative to the manufacturing average increases the more advanced an economy and the larger its domestic market. The first phenomenon points to a relatively rapid increase in capital input per job in machinery, which may be both the result of an above average increase in capital intensity at the given structure of pro- duction and a relatively rapid switch to capital intensive branches within machinery as the economy develops. The second phenomenon seems to indicate relatively large productivity gains from specialization.
(5) Equations (I) and (2) can be used to compute the machinery share of value added and employment in manufacturing which would be ex-
l See Fels, Schatz und Wolter, op. r pp. 249sqq.
t The sample had to be reduced to 39 countries for lack of data.
19.

286 F r a n k W e i s s and F r a n k W o l t e r
pected at the given values of the exogenous variables for these countries. Deviations from the patterns described by equations (i) and (2) can be attributed to country-specific idiosyncrasies independent of the stage of economic development and the market size. Actual and hypothetical shares of machinery in manufacturing for the period 1955--1971 (for Germany to 1969) are plotted in the Chart. As judged from value added shares, the results may be summarized as follows 1.
The most remarkable deviations can be observed in the case of Sweden. The machinery industry in that country possesses a much stronger position than would be expected by international standards. In 1955 , the actual share of machinery was almost double the hypothetical share. Although this difference has been diminishing over time, in 1971 the actual share still remained more than four percentage points above normal.
A pattern similar to Sweden's emerges in the case of Germany. The deviations, however, are much less marked and the gap is closing more quickly. In 1969 , the actual share exceeded the hypothetical share by about one percentage point only.
- - In contrast to Germany and Sweden, the actual share of the U.S. machinery industry falls short of its normal values as of 1958 ~. Through 1966 the actual shares were gradually approaching the standard values; since that time the gap has been widening somewhat. In 1971, the deviation amounted to about two percentage points.
The above observations clearly indicate that national idiosyncrasies have played and still play a more prominent r61e in Sweden than in the other countries.
A similar diagnosis results from an examination of employment shares. There are, however, slight differences between the two. Firstly, the devel- opment of the actual employment shares is more smooth than the devel- opment of value added shares; the reason presumably is the relatively large fluctuation of profits in machinery over the business cycle. Secondly, and more important, actual employment shares almost parallel the in- creasing normal shares whereas increasing normal value added shares coincide with by and large stagnant actual shares in the case of Germany and Sweden; in contrast, in the case of the United States these shares developed almost in parallel fashion. This implies that the relative income
1 I t should be noted that the U.S. da ta before x958 are not comparable to later years. For these and other shortcomings see Weiss and Wolter, op. cir.
s For earlier years see preceding footnote.

Machinery in the United States, Sweden, and Germany 287
Actual and Normal Share o[ Mechanical Engineering in Manu[acturing, Value Added and Employees in the United States, in Sweden, and Germany,
1955--1971 (percent) a
P'c-UNITED STATES
: vo,~176 ~ d I I _ _ ~ Normal I I
"t , . - ' - - - _ - - t I f . . . . • / i 0 1 ~ ? ~, I I ~ " ~ * * ~ - - - I - - ~ - ~ - - - - I ~- " ~ I j~"~ A c t u a t / ~' I
:I " - - - + . . . . - - " I I '~I~_~ Employees I ~ 11 ~ Normal
10 ~.I~%
SWEDEN
151 Value added ~ . ~ J ]
L s +. ....
GERMANY
12 Value added | ~ i ~ - - , ~ , ~ . I Actual 11 ~ "r:~ ~ ~ ~ "' ~ ~-~--'2~ ~--
I Normo[ I
I 7
Emptoyees I L ...... ~,7o;
"" ....... t ~ ~ - , ~
- [ ' , - 5 1 - I ~ , I - I S' ~o 161 I - 1 63 1 s` ~s I - I , , 1 6. I "
a Normal shares computed according to equations (x) and (~).
70 I 71
position of the German and Swedish machinery industries has deteriorated, possibly due to a relative increase in labour intensity or to a relative de- cline in factor rewards.

288 F r a n k W e i s s and F r a n k W o l t e r
HI. The Determinants o f Location
(6) In the following we shall focus on these and other decisive factors in determining present and future locational conditions for machinery in the countries investigated. The above analysis suggests four items for deeper investigation 1, namely an inquiry into
- - innovativeness in machinery relative to manufacturing 2,
m the development of relative factor absorption in machinery,
- - the relevance of economies of scale in machinery relative to manufac- turing, and
- - the relevance of national idiosyncrasies which are indicated by the observed deviations between normal and actual shares and which may be due to a relatively rich (poor) endowment with branch-specific factors of production namely engineers, the presence (absence) of ex- ternal economies stemming from an industrial complex (linkages), or favourable (unfavourable) protective policies.
Information on factor rewards and investment behaviour can be used to corroborate tendencies observed in factor intensities.
I. I n n o v a t i v e n e s s and R&D I n t e n s i t y
(7) Gruber, Metha, and Vernon pointed out that innovativeness, as measurable by R&D intensity, is an important determinant of industry location 8. Resources required for innovations are presumably relatively
t Raw material intensity, which has proved to be an important cause for trade flows, was excluded from the analysis. Raw material intensity is particularly low in machinery e v e n
compared to manufacturing. The percentage of primary inputs out of gross output is L89 in machinery and 5.37 in manufacturing in Germany (x966). Respective figures for the United States (x967) are o.o3 and 7.95; for indirect requirements see page 297, footnote x.
s Of course manufacturing is not the ideal reference system. Its choice was dictated by considerations of data availability. The years for which industrial data for machinery as a whole are presented were chosen with the following rationale: All three countries were to have a common beginning, middle, and end year, and the most recent year available was also to be presented. The time span was to be as long as the data allowed. The year x958 was chosen as a beginning year because the United States switched to a new industrial classification then; x967 was chosen as a middle year because Sweden switched industrial classifications in that year; x97x was the last year available for all three countries. Certain I972 data were available for Germany.
William Gruber, Dileep Metha, and Raymond Vernon, "The R&D Factor in Inter- national Trade and International Investment of United States Industries", The Journal o/ Political Economy, Vol. 75, Chicago, Ill., x967, pp. 20 sqq. - - William H. Grnber and Raymond Vernon, "The Technology Factor in a World Trade Matrix", in: The Technology Factor in I~ernallon~l Trade, Universities-National Bureau, Conference Series, 22, New York, London,

Machinery in the United States, Sweden, and G~many 289
�9 ~ - ~ ~ ~
~-~
0
0 ~ 0
0
0
~ oo ,~- 0 o ~ . ~ ~" ~ ~ 0
~" O~ O~ 0
',0
0 O0 0 r~ ~
~ '~E
s~ ~ ~
�9 . ~ �9 ~
~ 0 8~
o ' ~
0 0
~~ ~
15
~J
I<_. i ~ l l ~
!'!

29 ~ F r a n k W e i s s and F r a n k W o l t e r
abundant in the high-income countries. Our findings, presented in Table I, reveal that machinery seems to be quite R & D intensive and further reveal an element of instability in it:
- - In the United States, R & D intensity is declining by all three mea- sures for the period shown as a whole is unstable, and in I97I still above average.
- - In Sweden, R & D intensity was below average in I967 by two mea- sures, and according to these measures increased to i97 I, but by one measure remained below average.
- - In Germany, R&D intensity is barely on the manufacturing average in I97i.
To the extent that significant externalities can be gained from physical proximity of production process and R & D activities, such activities con- stitute a greater advantage vis-a-vis new entrants than the above indi- cators suggest. Given the heterogeneity of machinery, some sub-branches will especially benefit from these complementarities.
2. H u m a n C a p i t a l
(8) Human capital intensity has been found to be powerful in ex- plaining trade flows, especially when trade is regionalized between devel- oping and industrialized countries 1. Since the three countries included in this s tudy are presumably those where human capital is relatively most abundant ~, it would be particularly relevant to the r6te these countries will play in the international division of labour. The relative human
I97o, pp. 233 sqq. - - Donald B. Keesing states this conclusion somewhat emphatically in his "The Impact of Research and Development on United States Trade", The Journal o! Political Economy, Vol. 75, x967, pp. 38 sqq.
1 See Seev Hirsch, The Product Cycle Model o/ Interna2ional Trade - - A Multi-Country Cross-Section Analysis, The Israel Institute of Business Economics, Tel Aviv, I974 (mimeo.) - - Gerhard Fels, "The Choice of Industry Mix in the Division of Labour between Developed and Developing Countries", Weltwirtscha]tliches Archly, Vol. xoS, 1973, pP. 7I sqq.
2 See Karl W. Roskamp and Gordon C. McMeekin, "Factor Proportions, Human Capital and Foreign Trade: The Case of West Germany Reconsidered", The Quarterly Journal o/ Economics, VoL 82, Cambridge, Mass., x968, pp. x52 sqq., for the case of Germany. - - See also Donald B. Keesing "Labor Skills and the Structure of Trade in Manufactures", in: The Open Economy, Essays on International Trade and Finance, Ed. by Peter B. Kenen and Robert Lawrence, New York, London, I968, pp. 3 sqq., for evidence on several countries; Stern concludes that the abundance of human capital in the United States is well established. See Robert Stern, Testing Trade Theories, Michigan, x975 (mimeo.).

Machinery in the United States, Sweden, and Germany 291
capital intensity 1 of the machinery industry and its development over time is also presented in Table I. It reveals:
- - above average but declining relative human capital intensity in U.S. machinery according to the stock concept, with no distinct change as measured by the Lary conceptS;
- - a b o v e average but declining human capital intensity for Swedish machinery according to the Lary concept;
- - above average but declining relative human capital intensity in Ger- man machinery according to the stock concept, with no distinct change as measured by the Lary concept.
(9) To double-check the above developments skill data can be used, at least for the United States, where direct skill data are available. The possibility for a double-check is given by the high correlation among various indicators of human capital intensity 3. Table 2 presents four rel- ative skill indices for U.S. machinery in 196o and 197o , the most recent years in which Censuses of Polpulation were taken. All indices appeared
Table 2 - - Skill Intensity in Machinery Relative to Manu/act~,ring in the United States, 196o and 197o (index numbers)
Skill in tens i ty a, b 196o 197o
Hufbaue r concept Keesing concept A Keesing concept B Waehre r concept
124.5 I74 . I 224.6 I58.2
134.3 I5O.4 195.4 141.6
a For definitions and sources see Weiss and Wolter, op. cir. - - b The indices are listed in increasing order of comprehensiveness and decreasing order of weight given to "scientists and engineers" alone.
i Human capital intensity is measured here by two concepts, the Lary concept and the stock concept. For definitions and relative advantages, see: Peter B. Kenen, "Nature, Capital and Trade", The Journal of Political Economy, Vol. 73, x965, p. 456. - - Hal B. Lary, Imports o! Manufaaures /tom Less Developed Countries, National Bureau of Economic Research, Studies in International Relations, 4, New York, 1968, p. 22. - - Fels, op. cir.
s This is explained by the faster increase of an unskilled labourer's wage than the average wage in machinery compared to manufacturing.
Kenen has observed the high correlation among all variables indicating high skill levels, which are presumably required in the production of new goods. Since more general human capital estimates must reflect skill differences, this would apply to the more general measures as well. See Peter B. Kenen, "Skills, Human Capital and Comparative Advantage", in: Education, Income and Human Capital, Studies in Income and Wealth, Vol. 35, New York, London, I97O, pp. 204 sq. - - Anne Krueger, "Comment on Kenen", ibid., p. 231.

2 9 2 F r a n k W e i s s and F r a n k W o l t e r
in the literature previously and are named after their initiators in the table. It reveals: - - the highest skilled personnel are being used increasingly more inten-
sively than in manufacturing; this is shown by the Hufbauer concept; - - skill levels are increasing more slowly in machinery than in manufac-
turing but are still above average; this result is obtained from all three more comprehensive indicators.
The change in the more comprehensive skill indices indeed corroborates the change in human capital intensity in machinery. But as the Hufbauer concept shows there is a change in skill structure: Those skill groups which are likely to be particularly abundant in high-income countries, like the United States, are being absorbed more intensively.
3. P h y s i c a l Cap i t a l
(IO) Physical capital intensity is a crucial variable in the context of locational advantages of high income countries for a reason opposite to that for human capital. Recent studies have shown that it is at least questionable whether physical capital lends high-income countries a com- parative advautage 1. Whereas high-income countries are uniquely well endowed with human capital, physical capital is internationally the most mobile production factor. Calculations for physical capital intensity, as presented in Table I, reveal
- - below average, and declining physical capital intensity in U.S. machi- nery, according to both the Lary and stock concepts;
- - below average and relatively declining physical capital intensity in Sweden over the period I958--I967, and rising physical capital inten- sity from I967 to I97I. The rise during the latter period is probably due to the severe I967 recession2;
- - distinctly below average and relatively declining physical capital in- tensity in Germany as measured by both concepts for the period as a whole.
These results reveal that the high-income countries' comparative advan- tage in machinery has been a result of this industry's R&D intensity and human capital intensity but not physical capital intensity.
1 See William H. Branson and Helen B. Junz, "Trends in U. S. Trade and Comparative Advantage", B~ookings Papers on Economic Activity, Vol. 2, Washington, D. C., x97x, pp. 285 sqq.
s The x968 relative intensity is 83.5, and so indicates rather stable development to x97x.

Machinery in the United States, Sweden, and Germany 2 9 3
tt
t~
ee~
~. ,q. ,q. t , .
t e
0 o .,r ,,r O~ e . - ',D
A
,g
t ~
t t~
u ~
e~
t~. ,,,r
o. ,,~ . o . d .
�9 4- t t~
o ~. "~
t - , tT. 0.
M
'9. 0'. �9 . . 0 t ~
t t~ t '~
. 0
_oo~
o
o
o
,,-r
0
0
0
1 ~ !o
t t~
m
294 F r a n k W e i s s and F r a n k W o l t e r
4. I n v e s t m e n t B e h a v i o u r a n d F a c t o r R e w a r d s
(iI) The nature and success of the investment strategy, i .e . the "strategy" of factor absorption, can be tested by examining rates of re- turn on fixed capital, investment motives, and productivi ty data. Such a test is important because though the emerging pat tern of factor ab- sorption may have been bet ter than other alternatives, it need not have been successful. The data, though only part ly available in each case for each country, suggest the following general trends in machinery relative to manufacturing {Table 3):
- - declining returns on fixed capital,
- - declining labour productivity,
- - declining capital productivity,
- - increasing female employment, except in the United States, where it remained stablO, and
- - consistently above average replacement and rationalization, as opposed to expansion investment over time.
These indicators cast some doubt upon the success of the machinery industry's past investment strategy for the countries for which data were available. Indeed, taking the emerging pat tern of factor absorption on the one hand, together with the development of factor rewards and invest- ment behaviour on the other hand, suggests that insufficient resources have moved within machinery to those sub-branches in which the high- income countries can enjoy long-term competitiveness.
5. E c o n o m i e s of S ca l e
(I2) The presence of scale economies in an industry makes it more difficult for newcomers to enter, and makes traditional locations of an industry more immune to changes in competitiveness. To assess the impor- tance of scale economies, we have regressed in an international cross- section 2 value added per employee in machinery relative to manufacturing (RVAPEM) on value added per establishment in machinery relative to manufacturing (RVAPES). The endogenous variable is a measure of re- lative productivity; the exogenous variable is a proxy for total factor
This phenomenon may very well be due to an as yet unexploited industr ial reserve army of racial minorities in the United States.
l The data were taken from United Nations, The Growtk of World Indus t ry , x97r , Vol. x, New York, x973. The sample consists of 37 countries, the maximum available.

Machinery in the United States, Sweden, and Germany 295
input in an establishment 1. Several functional forms were tested; the best fit yielded the following result:
(3) R V A P E M = 1 -339 + 0 . 8 8 3 In R V A P E S - - 0 . 0 0 8 R V A P E S (q- O.117) (4 - O.O02)
R* = 0.68
All coefficients are significant at the 99 percent level. This function shows that scale economies are present to a greater degree in machinery than in manufacturing until a relative establishment size of IiO is attained. Beyond this maximum, manufacturing exhibits a more favourable devel- opment of productivity with increasing establishment size than does machinery*.
(13) According to equation (3) scale economies seem to play an im- portant r61e in productivity increases, especially at the low end of estab- lishment sizes. Therefore, considerations of factor quality, and not so much considerations of optimal plant size construe the crucial barrier to newcomers (para's. 7 to 9) and constitute the advantage for traditional locations 8. In turn, the large differences in relative average plant size observed in the United States on the one hand and Sweden and Germany on the other hand (Table A I) would not suggest particular advantages or disadvantages.
6. N a t i o n a l I d i o s y n c r a s i e s
(14) Besides general factor intensities and internal economies of scale studied till now, the determinants of location include country-specific idiosyncrasies. These account for deviations between normal and actual development patterns, and inter alia can be sought among special factors
a All variables are expressed as index numbers.
m Regressions of these variables for machinery and manufacturing separately show that scale economies are present in both industries.
We are aware of possible objections to the proxies, which were chosen for reasons of data availability. Examination of German time series data showed that developments of labour and total factor productivity across establishment sizes do not conflict with each other. Also, little substitution among factors with increasing establishment size was indicated by an examination of U.S. Census of Manufactures data.
8 The precise specification of the optimal plant size by the above equation should not be taken too seriously for three reasons. First the equation had to be estimated from a limited sample. Second, because of the heterogeneity of the sample, in both the machinery and manufacturing industries product mix effects must be expected. Third, as is true for every international cross section, any single country will show national idiosyncrasies.
296 F r a n k W e i s s and F r a n k W o l t e r
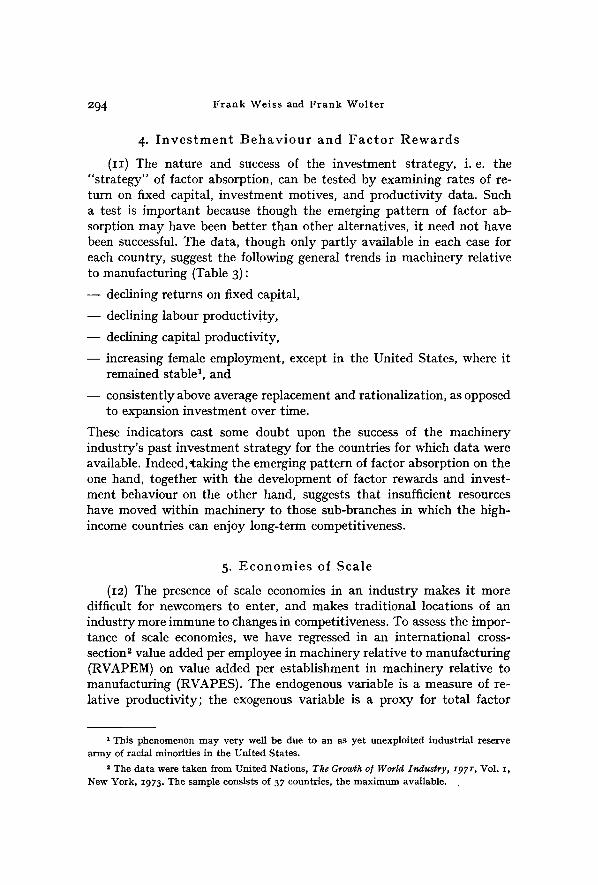
of production which machinery uses relatively intensively. Evidence gathered for the mechanical engineering industry in the United States and Germany (occupation-by-industry data for Sweden are not available) indicates that machinery operates very "engineer intensively" relative to the manufacturing average (Table 4). This is observable not only in re- lation to total employment, but even in relation to high-skill employ- ment. Then, if Germany and Sweden had an ample supply of engineers compared to other industrialized countries, machinery would be particu- larly favoured (and vice versa for the United States).
Table 4 - - Employees in Selected occupations in Machinery and Man.- /acturing in the United Stales and Germany, selected years a
(percent of total respective industry employment)
~ Branch
Occupa t ion ~ ~ Machinery Manufac tu r ing
I I
Uni ted S ta te s x 960 x 97 ~ x 960
Engineers 4.2 5.2 2.7 Technic ians o.8 ; 3. i L 2 Scient is ts 0.2 o.I I ~
G e r m a n y I95o I96X , I95o _ll
Eng ineers 8.2 8.6 3.6 Technic ians 1.8 2.5 1.2 Scient is ts o.o I o. i o.2
a Years in which a Census of Population was conducted.
t x97o
3.3 2 . [
f o.4
x96I
4.8 I. 3 0.2
Source: U.S. Bureau of the Census, U.S. Census o/ Population, Washington, D.C. , various years. - - Institut ftir Arbeitsmarkt und Berufsforschung, Mitteilungen, Erlangen, No. 4, x968. - - Own calculations.
(I5) Though only a limited number of countries could be compared and though the available figures date far back, the facts tend to support this hypothesis (Table A 2) 1. For Sweden, the evidence is particularly striking. Sweden has the largest deviation from the normal pattern and has the highest ratio of engineers to both total high-skilled employees and to total employees of all the countries for which data were available.
I Care should be taken in comparing the skill data among countries because of differences in training i n t e n s i t y a n d duration.

Machinery in the United States, Sweden, and Germany 297
(I6) An additional explanation for the above normal share of Sweden's machinery industry can be found in the concept of the "industrial com- plex," in this case the strong linkage between machinery and the steel industry. As an examination of input-output tables of the United States and Germany reveals, next to value added and machinery itself, the steel industry is the most important direct input sector of machinery (Table 5) 1.
Table 5 - - Machinery in an Industrial Complex, in the United States, z967, and in Germany, ~c966
Contr ibut ion to gross o u t p u t of machinery (%)
Value added Machinery I ron and steel a Electrical mach inery Fabr ica ted metal I m p o r t s
United States x967
42.4 I5.2 9.I 6.3
4.4 2.5
Ge r many x966
1 42.3 i x5.7 1
7.I 4.5
, 2. 3 J 6.9
a Casting has been added to Iron and Steel for Germany to attain greater com- parability to U.S. data.
Source: Sthglin und Wessels, op. cir., pp. 2r5 sqq. - - "The Input-Output Structure of the U.S. Economy: x967", U.S. Department of Commerce, Survey o/Current Business, Vol. 54, x974, No. 4. - - Own calculations.
Indeed, all three of these highly industrialized countries enjoy the benefits of an industrial complex relevant to the machinery industry; a difference among the three countries, however, lies in the nature of output of their respective steel industries. Based upon high quali ty iron ore deposits but suffering from a lack of coal resources, the Swedish Steel industry from the very beginning of industrial production has concentrated its efforts in producing high quality, high value steel. In Sweden there would seem to be a relative abundance of the kind of steel heavily used as an input in machinery 2.
To the extent that machinery benefits from a national steel industry, and the efficiency of the steel industry depends upon the availability of iron ore and coal, machinery is indirectly natural resource intensive. For example, in the United States (i967) indirect natural resource requirements in machinery sub-industries ranged from 2.5 to 4.I percent, which is much higher than the corresponding direct requirements.
i See Skandinaviska Enskilda Banken, Some Data about Sweden x974--75, V~ixj6, x974, p. 23.

298 F r a n k W e i s s and F r a n k W o l t e r
I t also follows from Table 5 that machinery depends upon the whole engineering sector for the bulk of its inputs. This suggests that success in specialization in any one engineering sector, including machinery, requires success in the whole engineering sector. Indeed, those countries which have entered this market successfully, have done so in a number of engi- neering sectors 1. Given the currently prevailing domestic production struc- tures in developing countries, this in turn suggests that entry into the bulk of machine producing activities is restricted to the already semi- industrialized countries, and that the possibilities for a broader inter- national division of labour in machinery are limited.
(17) Government structural policy, or actions taken in lieu of structur- al policy, can also be construed as a national idiosyncrasy. Machinery, being among the most successful export industries in the three industri- alized countries included here, has apparently never felt the need to press very strenuously for protection from foreign competition. Effective rates of protection are below the manufacturing or industrial average in all cases, i .e. the machinery industry is being discriminated against z. Of course, protection policy constitutes a national idiosyncrasy only in so far as it deviates from the protective structure "usual" in those countries included in the cross-section. Whether this is true for the countries in- vestigated is an open question. What can be said, is that further across- the-board liberalization of trade in industrial products by any of these countries would tend to improve the machinery industries' competitive position there.
IV. The Structure of Comparative Advantage
(I8) To gain an understanding of the structure of competitiveness within these countries' machinery industries, the concept of "Revealed Comparative Advantage (RCA)" was applied 8. The RCA of the United
1 See Hollis B. Chenery and Helen Hughes, " Indust r ia l iza t ion and Trade Trends: Some Issues for the x97os", in: Prospects /or Partnership, Industrialization and Trade Policies in the x97os , A Seminar Held at the Internat ional Bank for Reconstruction and Development, 5th and 6th October x972, Baltimore, London, i973, p. 25.
t For a summary of published nominal and effective rates of protection, see Weiss and Wolter, op. c/t.
s See H. H. Liesner, "The European Common Market and Brit ish Indus t ry" , The Economic Journal, Vol. 68, London, x958, pp. 3o2sqq. - - Studies in Trade Liberalization - - Problems and Prospects /or the Industrial Countrics, Ed. by Bela Balassa, in Collab. with M. E. Kreinin a al., Baltimore, 1967. - - For a discussion of some of the restrictions behind the concept see Weiss and Wolter, op. c/t.

Machinery in the United States, Sweden, and Germany 299
States, Sweden, and Germany within machinery were computed accord- ing to:
X Xij RCA -- Xij : i
Mij Z Mij i
where X is exports, M is imports, i is the commodity subscript, Z is SITC-groups 5--8 and j is the country subscript, i
Hence a comparative advantage in activity i is indicated if the export- import ratio for this activity surpasses the respective value for all manu- facturing activities in trading with the countries of reference (RCA > 1). In order to smoothen short-term influences, the computations were car- ried out for averages of the years I964/65 and I971/72, allowing an inter- temporal comparison as well. Since we are especially interested in the division of labour between industrialized and developing countries, the relative trade performance was computed both against the world and against total developing countries. The results of the calculations are pre- sented in Table A 31.
Table 6 - - The Diversification o~ Revealed Comparative Advantage in the United States', Sweden's, and Germany's Machinery Industries, 1964/65
and 1971/72 (percent a)
Count ry
1964]65
United States
1971/72
World 95.5 Developing countr ies b . 95.5
Sweden
I964/65
G e r m a n y
86. 4 54.6 95.5 IOO.O
1971/72
72.7 ioo.o
I964/65
81.8
95.5
1971]72
86. 4
95.5
a Number of branches of revealed comparative advantage in percent of all 22 ma- chinery sub-branches. - - b Definition as in Table A 3.
Source: Table A 3.
(19) One systematization of the results is given in Table 6. I t offers an insight into the (unweighted) degree of diversification of revealed com- parative advantage for each country and each period of investigation. The results may be summarized as follows:
x An attempt was made to carry through the analysis at four-digit SITC groups. Several, however, bad to be combined and several had to be omitted. This procedure was dictated by the need to establish a correspondence between the SITC and the U.S. SIC (para. 22 sq.), leaving 22 machinery sub-branches out of the 36 original four-digit SITC groups.
Weltwirtschaftlie..hes KteJliv Bd. CXI. 20
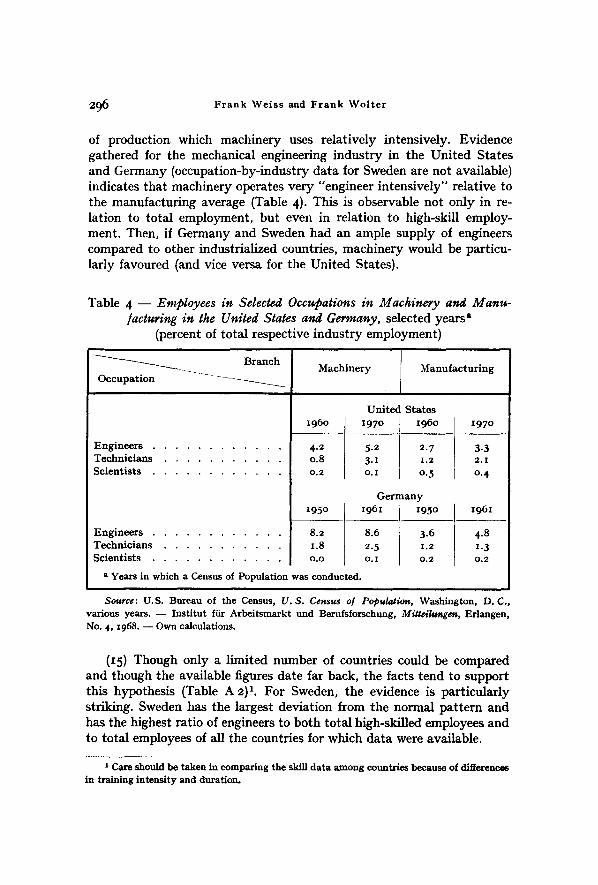
3 0 0 F r a n k W e i s s and F r a n k W o l t e r
Vis-A-vis the world, for Sweden and Germany the number of compet- itive machinery sub-branches increased over time, whereas for the United States it decreased slightly.
- - In comparing the degree of diversification according to region, the high-income countries do equally well or better vis-A-vis developing countries than vis-A-vis the world.
These observations seem to indicate a bright future for the bulk of the high-income countries' machinery sub-branches.
(20) Yet, this conclusion is premature, since from the point of view of structural adjustment requirements the change in comparative advantage rather than crossing the dividing line between comparative advantage and disadvantage is relevant. Indeed, based upon this test, the outcome is far less favourable to the countries in question. Those sub-branches, the comparative position of which has deteriorated over time, can be found in Table A 3 ~. As is evident from this table, vis-a-vis the world (the developing countries) 15 (22) U.S. machinery sub-branches, IO (13) Swedish machinery sub-branches, and 9 (20) German machinery sub- branches suffered from decreasing competitiveness. Steam engines and turbines, gas turbines and engines n.e.s, and paper mill and pulp mill machines were particularly hit, as these sub-branches showed declining competitiveness for all countries vis-A-vis both regions. Also, except for Germany vis-A-vis the world (RCA-value unchanged) RCA-values for total machinery decreased over time, matching with the observed trends in factor absorption. Based on these observations one would be more cautious in certifying the high-income countries' machinery industries a future totally without mentionable adjustment needs.
(21) Given a relatively similar factor endowment in the countries in- vestigated and assuming identical production functions in each country for every branch of the four-digit SITC level one should expect a uniform pattern of comparative advantage to emerge in these countries. However, the picture is rather unsystematic when ranking the industries for each country and each period according to their RCA-values (Table 7):
- - Vis-A-vis the world the structure of comparative advantage within each country over time is fairly stable, whereas the coefficients of
1 Obviously, this procedure suffers from being unable to distinguish between supply and demand effects: Apart from changes in comparative cost at a given structure of protection, the relative trade performance of a country in a commodity is also determined by inter- national differences in a commodity's income elasticity relative to the reference system. However, since changes in such relationships also cause structural adjustment pressure, their inclusion is not such a serious flaw.

Machinery in the United States, Sweden, and Germany 3Ol
Table 7 - - Spearman Coe]ficients o/Rank Correlation among the Structures o[ Revealed Comparative Advantage [or the Machinery Industries o[ the
United States, Sweden, and Germany a
Countries of invest igat ion
United States i964/65 I97I[72
Sweden i964/65 I971/72
Germany 1964/65 I971[72
0.90 o.18 O.I 5 0 . 2 0
O. IO
United States Sweden Germany
1964/65 197I[72 I964/65 I97I/72 I964/65 1971]72
vis-k-vis world
o.94 - - o . o 6 - - o . 2 2 - - o . o 9 - - 0 . 2 9 - - o . 1 8 - - o . 2 8 - - o . o 1 - - o . 1 5
0.33 ""-.~--0.04 --0.19 0.27 0.38 o.oi 0.05 0 . 2 8 0 . 6 I 0.73 ~ o . 8 4
o.I8 0.43 0.70 o.91
vis-A-vis total deveIoping countr ies
a The rank correlations were computed by ranking the maximum amount of identical SITC four-digit groups for each pair of countries and periods.
Source: Table A 3.
rank correlation between each pair of countries fail to be convincing, neither positively nor negatively.
- - Vis-A-vis the developing countries the pattern of comparative advan- tage within each country over time is fairly stable for the United States and Germany, but not for Sweden. Moreover, only the German and Swedish patterns are similar.
Based on the performance vis-A-vis the world, the general impression from this analysis is that there exists a considerable intrabranch specialization in machinery among the advanced economies. This seems to be predomi- nantly caused and maintained by dynamic economies of scale stemming from the structure of domestic demand (e.g. United States' aircraft en- gines, Sweden's paper mill and pulp mill machines, or Germany's internal combustion engines; see Table A 3)- Another lesson to be drawn from the above analysis is that the industrialized countries studied here still possess a strong competitive position in almost all machinery sub-branches vis- A-vis the developing countries. While these countries have gained some export capability in a range of engineering products, it is not very likely that they can overcome their present r61e as marginal suppliers in the foreseeable future a.
x See also Frank Wolter, Engineering Exports o] Less Developed Countries, Kiel Working Paper, No. 29, x975.
20*

3o2 F r a n k W e i s s a n d F r a n k W o l t e r
(22) To complete the analysis, a limited test of some hypotheses ex- plaining the structure of trade performance can be undertaken. Data suf- ficiently detailed for a test of explanatory hypotheses of foreign trade performance within the machinery industry exist for the United States. Both Heckscher-Ohlin-Samuelson as well as neo-technology variables could be calculated 1. Again trade performance was tested both vis-A-vis the developing countries and vis-A-vis the world.
(23) Table 8 shows the results for the first two of the three sets of regressions which were run: all variables, neo-technology variables, and Heckscher-Ohlin-Samuelson variables. The following conclusions are sug- gested:
- - As measured by R 2, the included variables explain more of the vari- ation in U.S. machinery RCA-values (and their changes) in trade with the LDC's than for trade with the world; all equations for trade with the developing countries are significant (equations (2), (4), (6), and (8)) whereas only one is for trade with the world (equation (3)).
- - None of the equations containing Heckscher-Ohlin-Samuelson vari- ables alone were significant (results not presented); in those equations containing both types of variables, a Heckscher-Ohlin-Samuelson vari- able, physical capital intensity, is significant only once, but in that case the equation as a whole is not significant (equation (5)).
- - The observed negative correlation between U.S. machinery competi- tiveness vis-A-vis the LDC's and dynamic scale economies is indeed puzzling. A likely explanation lies in the inadequateness of the proxy.
- - Contrary to a priori expectations, static scale economies have a nega- tive effect on U.S. competitiveness in this industry vis-A-vis the world (equations (I) and (3)). The competitive edge of U.S. machinery pro- ducers evidently stems in part from highly individualized production on a small scale. The observed positive correlation between scale econ- omies and competitiveness vis-a-vis the developing countries, at least as far as their changes are concerned (equations (6) and (8)) does not contradict this hypothesis, since it can be expected that machinery demand in LDC's is more oriented toward standardized products, which can indeed be produced most efficiently in large operations.
The general impression given by this analysis is that machinery sub- branches' factor absorption is not so varied as to be able to explain intra- industrial specialization. Rather, the pat tern of specialization would seem to be determined by "technological" factors. Furthermore, among indus- trialized countries, even the technological environment for machinery
1 F o r va r i ab l e s a n d def in i t ions see T a b l e 8.

Machinery in the United States, Sweden, and Germany 3Ol
Table 7 - - Spearman Coe]ficients o/Rank Correlation among the Structures o[ Revealed Comparative Advantage [or the Machinery Industries o[ the
United States, Sweden, and Germany a
Countries of invest igat ion
United States i964/65 I97I[72
Sweden i964/65 I971/72
Germany 1964/65 I971[72
0.90 o.18 O.I 5 0 . 2 0
O. IO
United States Sweden Germany
1964/65 197I[72 I964/65 I97I/72 I964/65 1971]72
vis-k-vis world
o.94 - - o . o 6 - - o . 2 2 - - o . o 9 - - 0 . 2 9 - - o . 1 8 - - o . 2 8 - - o . o 1 - - o . 1 5
0.33 ""-.~--0.04 --0.19 0.27 0.38 o.oi 0.05 0 . 2 8 0 . 6 I 0.73 ~ o . 8 4
o.I8 0.43 0.70 o.91
vis-A-vis total deveIoping countr ies
a The rank correlations were computed by ranking the maximum amount of identical SITC four-digit groups for each pair of countries and periods.
Source: Table A 3.
rank correlation between each pair of countries fail to be convincing, neither positively nor negatively.
- - Vis-A-vis the developing countries the pattern of comparative advan- tage within each country over time is fairly stable for the United States and Germany, but not for Sweden. Moreover, only the German and Swedish patterns are similar.
Based on the performance vis-A-vis the world, the general impression from this analysis is that there exists a considerable intrabranch specialization in machinery among the advanced economies. This seems to be predomi- nantly caused and maintained by dynamic economies of scale stemming from the structure of domestic demand (e.g. United States' aircraft en- gines, Sweden's paper mill and pulp mill machines, or Germany's internal combustion engines; see Table A 3)- Another lesson to be drawn from the above analysis is that the industrialized countries studied here still possess a strong competitive position in almost all machinery sub-branches vis- A-vis the developing countries. While these countries have gained some export capability in a range of engineering products, it is not very likely that they can overcome their present r61e as marginal suppliers in the foreseeable future a.
x See also Frank Wolter, Engineering Exports o] Less Developed Countries, Kiel Working Paper, No. 29, x975.
20*

304 Frank Weiss and Frank Wolter
production is so similar that competitiveness in any one sub-branch de- pends upon the capacity to produce highly specialized commodities. In machinery trade between developing and industrialized countries, how- ever, the latter group is most competitive in both R&D intensive product lines and product lines benefitting from large scale economies.
(24) The results presented in this paper can only be interpreted as a first step toward explaining specialization within machinery. A particular limitation is the lack of adequate disaggregated data, especially for ex- planatory variables. To fill this gap an enterprise survey is being con- ducted by the Kiel Institute of World Economics. From an analysis of such data more definite results can be expected for a variety of hypotheses. Of particular interest will be the increasing importance of software activi- ties, such as turnkey projects, as well as their complementarities with hardware production. Indeed this area of activity may lend the high- income countries' machinery industries vigorous dynamic impulses.

Machinery in the United States, Sweden, and Germany 305
~-~ c~
I
I::l
d
ID-. ~0
0 ,
o
o
0", '.0 0",
0",
~O
o ~ o o O
m.
o. ~ , o 0 ~ ' . 0 tr~
0 0 ~ 0
�9 d- u '3 ~
~ N
~ ~ o ~ o o ~ ~ o . ~
~ o ~'~ o
t~
= 8
e~
o
m

306 F r a n k W e i s s a n d F r a n k W o l t e r
3
P~
d
.~ ~
e ~ d
~ ~ o
m o ~J
~ § ~ ~ ~ '~ ~ _ _ ~ �9 . . . . . . . ~__ ,~__ ~ , ~ ~ __
d 6 6 ~ G 6 6 d d
t~ e~ e~ t~ e~ ~ ~ ~ ~ 0 u'~ ~ 0 0 0 0 0 0
m tN
~ ~ o~ ~ ~, ~ ~ ? o~ ~. .
" oj I o o o ~ o o o 6 d d
~ ~ ~ ~ ~ 0 0 ~ 0 ~ ~ 0 H 0 0 ()
1 ~ ~ ~" ~ ~ 0 0 ~ 0 e~ ~ 0 ~ 0 0 0 ()
0
~ ' ~ ~ .~ ~ 8
0~
I
"r.
~J
.-o ~
I
m
o d W
E o~ o ~ ~

Machinery in the United States, Sweden, and Germany 3Ol
Table 7 - - Spearman Coe]ficients o/Rank Correlation among the Structures o[ Revealed Comparative Advantage [or the Machinery Industries o[ the
United States, Sweden, and Germany a
Countries of invest igat ion
United States i964/65 I97I[72
Sweden i964/65 I971/72
Germany 1964/65 I971[72
0.90 o.18 O.I 5 0 . 2 0
O. IO
United States Sweden Germany
1964/65 197I[72 I964/65 I97I/72 I964/65 1971]72
vis-k-vis world
o.94 - - o . o 6 - - o . 2 2 - - o . o 9 - - 0 . 2 9 - - o . 1 8 - - o . 2 8 - - o . o 1 - - o . 1 5
0.33 ""-.~--0.04 --0.19 0.27 0.38 o.oi 0.05 0 . 2 8 0 . 6 I 0.73 ~ o . 8 4
o.I8 0.43 0.70 o.91
vis-A-vis total deveIoping countr ies
a The rank correlations were computed by ranking the maximum amount of identical SITC four-digit groups for each pair of countries and periods.
Source: Table A 3.
rank correlation between each pair of countries fail to be convincing, neither positively nor negatively.
- - Vis-A-vis the developing countries the pattern of comparative advan- tage within each country over time is fairly stable for the United States and Germany, but not for Sweden. Moreover, only the German and Swedish patterns are similar.
Based on the performance vis-A-vis the world, the general impression from this analysis is that there exists a considerable intrabranch specialization in machinery among the advanced economies. This seems to be predomi- nantly caused and maintained by dynamic economies of scale stemming from the structure of domestic demand (e.g. United States' aircraft en- gines, Sweden's paper mill and pulp mill machines, or Germany's internal combustion engines; see Table A 3)- Another lesson to be drawn from the above analysis is that the industrialized countries studied here still possess a strong competitive position in almost all machinery sub-branches vis- A-vis the developing countries. While these countries have gained some export capability in a range of engineering products, it is not very likely that they can overcome their present r61e as marginal suppliers in the foreseeable future a.
x See also Frank Wolter, Engineering Exports o] Less Developed Countries, Kiel Working Paper, No. 29, x975.
20*
308 F r a n k Weiss and F r a n k Wol t e r
Z u s a m m e n f a s s u n g : Maschinenbau in den Vereinigten Staaten, Schweden und der Bundesrepublik Deutschland - - Eine Untersuchung fiber /~nderungen in den komparativen Kostenvorteilen. - - In diesem Artikel werden der Entwicklungspfad und die Standortbedingungen des Maschinenbaus, soweit sic durch die relative Faktorabsorption, Skalenertr~ige und nationale Besonderheiten gegeben sind, in den Vereinigten Staaten, Schweden und der Bundesrepublik Deutschland untersucht. Ftir diese L/inder wird anschlieBend die internationale Wettbewerbsf~higkeit von 22 Produktionszweigen dieser Branche gegenfiber der Welt und gegenQber Ent- wicklungsl~ndern ermittelt. Zus/itzlich wird der Versuch unternommen, die Speziali- sierungsstruktur des amerikanischen Maschinenbaus mit Hilfe des Faktorpropor- tionen-Theorems und technologischer Hypothesen zu erkl~iren.
Es zeigt sich, dab der Maschinenbau in den Untersuchungsl~ndern immer noch Standortvorteile genieBt, die sich allerdings im Zeitablauf etwas verringert haben. Dies ergibt sich aus der Qberdurchschnittlichen, aber trendm'~l]ig abnehmenden Ausbildungskapitalintensit~it und der Forschungs- und ~-ntwicklungsintensit~.t des Maschinenbaus, und schl~igt sich in seiner starken, aber sich fast durchweg ver- schlechternden Wettbewerbsposit ion nieder. Auf disaggregiertem Niveau wird das Bild allerdings erheblich differenzierter. Bei sehr unterschiedlicher intra-industrieller Spezialisierungsstruktur der drei L~nder gibt es gegenfiber der Welt jeweils eine Reihe yon Produktionszweigen, die ihre Wettbewerbsposit ion verbesseru konnten; gegentiber Entwicklungsl~ndern trifft dies nut ira Falle Schwedens und der Bundes- republik zu. Hinsichtlich der intra-industriellen Spezialisierungsstruktur im Maschi- nenbau kommt es anscheinend, soweit sich dies aus den amerikanischen Verh~iltnissen ableiten l~.Bt, vor allem auf technologische Faktoren an. Um dieses Ergebnis abzu- sichern, sind abet noch umfassendere Untersuchungen nStig.
R d s u m d : La construction mdcanique aux Etats-Unis, duns la Suede et en Allemagne - - Une dtude sur les changements des cotlts comparatifs, m Dans l'article, la voie de ddveloppement et les conditions locales de la construction mdca- nique aux Etats-Unis, dans la Suede et en Allemagne sont examindes en tan t qu'elles sont ddtermindes par l 'absorption relative des facteurs, les rendements d'dchelle et les particularitds nationales. Ensuite, on a calculd la capacitd concur- rentielle des 22 branches de production de ces trois pays vis-k-vis du monde et des pays en voie de ddveloppement. De plus, il est essayd d'expliquer la s t ructure de la spdcialisation de la construction mdcanique aux Etats-Unis ~. l 'aide du thdorbme des proportions des facteurs et k celui des hypothAses technologiques.
II est montrd que la construction mdcanique jouit dans les pays examinds encore des avantages de l 'emplacement, qui se sont diminuds en effet un pen au cours du temps. Cela rdsulte de l ' intensitd de recherche et de ddveloppement duns la con- struction mdcanique ainsi que de celui du capital de formation qui est au-dessus de la moyenne, mais dont la tendance est en baisse. Par consdquent, la capacitd concurrentielle est forte, mais se ddtdriore k peu pros en gdndral. Sur le plan ddsagrdgd, les rdsultats sont en effet beaucoup plus diffdrencids. La structure de la spdcialisation intra-industrielle bien diffdrente dans ces trois pays, il y a des branches qui ont amdliord la position concurrentielle vis-k-vis des autres pays; ce sont seulement la Suede et l 'Allemagne qui out pu amdliorer leur position vis-k-vis des pays sous- ddveloppds. A l'dgard de la structure de la spdcialisation intra-industrielle dans la

Machinery in the United States, Sweden, and Germany 309
c o n s t r u c t i o n mdcan ique , il s emble que les f a c t eu r s t e c h n o l o g i q u e s j ouen t , se lon l ' ana ly se du cas am~r ica in , u n r61e d~cisif. Afin d ' a s s u r e r ce r~su l t a t , il f a u t fa i re encore des d tudes p l u s ~ tendues .
R e s u m e n : Cons t rucc i6n de m a q u i n a r i a en los E s t a d o s Unidos , Suec ia y la Repf ib l ica Federa l A l e m a n a . - - U n anfi.lisis sobre c a m b i o s en las v e n t a j a s de cos te c o m p a r a t i v a s . - - Los au t o r e s e s tud i an , p a r a los t r e s pa i ses m e n c i o n a d o s , el p a t r 6 n de desarrol lo y las condic iones de local izaci6n de la i n d u s t r i a c o n s t r u c t u r a de m a - qu ina r ia , cons ide rando como d e t e r m i n a n t e s la absorc i6n r e l a t i va de fac tores de producc i6n , las e conoml as de esca la y pecu l i a r idades nac iona les . A d e m ~ s e s t i m a n p a r a c a d a u n o de los t r e s pa lses la c o m p e t i v i d a d i n t e r n a c i o n a l de 22 subsec to r e s en re lac i6n con el m u n d o en te ro y con los pa ises en desarrol lo . F i n a l m e n t e , los a u t o r e s i n t e n t a n expl icar la e s t r u c t u r a de especia l izac i6n en la i n d u s t r i a de m a q u i - na r i a n o r t e a m e r i c a n a en t d r m i n o s del t e o r e m a de p roporc iones de fac to res y de h ip6 tes i s tecnol6gicas .
Los r e su l t ados r eve lan que la cons t rucc i 6n de m a q u i n a r i a t o d a v i a goza de ven - t a j a s a loca t ivas en los pa ises cons iderados , si b ien h a n ido d i s m i n u y e n d o algo en el t i empo . E s t o r e su l t a de u n a i n t e n s i d a d t a n t o de cap i t a l h u m a n o c o m o de inves t i - gac i6n por e n c i m a del p r o m e d i o pero con t e n d e n c i a a la b a j a en e s t a i n d u s t r i a , y sale a re luc i r en u n a l to pero decrec ien te g rado de c o m p e t i v i d a d . A n ive l d e s a g r e g a d o se aprecia , s in embargo , u n a s i t uac i6n m~s d i fe renc iada . D a d a s u n a s e s t r u c t u r a s de especia l izaci6n i n t r a i n d u s t r i a l m u y d i spa r e s en t r e los t res paises , e x i s t e n en c a d a caso a lgunos sectores que h a n pod ido m e j o r a r su c o m p e t i v i d a d f r en t e al m u n d o y, en el caso de Suecia y A l e m a n i a , f r en te a los pa t ses en desarrol lo . E n c u a n t o a los d e t e r m i n a n t e s de la e s t r u c t u r a de espec ia l izac i6n i n t r a i n d u s t r i a l en la i n d u s t r i a m a q u i n a r i a , la ev idenc ia n o r t e a m e r i c a n a s u b r a y a la i m p o r t a n c i a de fac to res tech- nol6gicos, r e su l t ado que , p a r a poder der genera l izado, r equer i r s t o d a v i a e s tud ios m s ampl ios .
![Introduction - uni-wuppertal.deorlik/preprints/proetale...2 SASCHA ORLIK machinery developed in [O] for describing global sections of equivariant vector bundles on X:The advantage](https://img.pdfslide.net/doc/110x75/613aa1130051793c8c012677/introduction-uni-orlikpreprintsproetale-2-sascha-orlik-machinery-developed.jpg)