Embed Size (px)
Citation preview
*Correspondence to: Professor Kai Cheng, School of Engineering, Leeds Metropolitan University, Calverley Street, Leeds LS1 3HE, UK TEL: 0113 283 6731 FAX: 0113 283 3110 E-mail: K. [email protected]
1
Post PrintThis article is a version after peer-review, with revisions having been made. In terms of appearance only this might not be the same as the published article.
International Journal of Advanced Manufacturing Technology, Vol. 25, 2005, pp.1089-1097.
The effects of machining process variables and tooling characterisation on the
surface generation: modelling, simulation and application promise
Xichun LUO, Kai CHENG* and Robert WARD
School of Engineering, Leeds Metropolitan University
Calverley Street, Leeds LS1 3HE, UK
Abstract
The paper presents a novel approach for modelling and simulation of the surface generation in
the machining process. The approach, by integrating dynamic cutting force model,
regenerative vibration model, machining system response model and tool profile model,
models the complex surface generation process. Matlab Simulink is used to interactively
perform the simulation in a user-friendly, effective and efficient manner. The effects of
machining variables and tooling characteristics on the surface generation are investigated
through simulations. CNC turning trials have been carried out to evaluate and validate the
approach and simulations presented. The proposed approach contributes to comprehensive and
better understanding of the machining system, and is promising for industrial applications with

*Correspondence to: Professor Kai Cheng, School of Engineering, Leeds Metropolitan University, Calverley Street, Leeds LS1 3HE, UK TEL: 0113 283 6731 FAX: 0113 283 3110 E-mail: K. [email protected]
2
particular reference to the optimisation of the machining process based on the
product/component surface functionality requirements.
Key Words: Machining processes, surface generation, modelling and simulation
Nomenclature
Cta damping coefficient of the tooling system
Cwa damping coefficient of the workpiece system
dc depth of cut
D workpiece diameter
f feed rate
Fx(t) dynamic cutting force in the X direction
Fy(t) dynamic cutting force in the Y direction
Fz(t) dynamic cutting force in the Z direction
Gtab the corresponding response of the tooling structure in the a-th direction due to
the force acting in the b-th direction
Gwab the corresponding response of the workpiece in a-th direction due to the force
acting in the b-th direction
i, j sampling points index on the workpiece along the X and Z directions
respectively
Kab structural stiffness
Kfc cutting force constant contributed by shear action in the feed direction
Kfe edge cutting force constant in the feed direction
Kff1, Kff2 flank face cutting force constants in the feed direction
Krc cutting force constant contributed by shear action in the radial direction

Kre edge cutting force constant in the radial direction
kta structural stiffness of the tooling system
Ktc cutting force constant contributed by shear action in the tangential direction
Kte edge cutting force constant in the tangential direction
Ktf1, Ktf2 flank face cutting force constants in the tangential direction
kwa structural stiffness of the workpiece system
mta mass of the tooling system
mwa mass of the workpiece system
M, N number of the sampling points in the X and Z directions respectively
r tool nose radius
Sku kurtosis of the surfaces height distribution
Sq surface root-mean-square deviation
T one spindle revolution period
β side clearance angle
μ friction coefficient
θr intersection angle for two continuous tool path
ωmab structural natural frequency
ζab structural damping ratio
3

4
1 Introduction
Machining process variables and tooling characteristics are important factors affecting the
machining quality and efficiency. The primary method used by the industry to select process
parameters and tooling geometry often involves costly, time-consuming and trial-and-error
process [1]. Because the performance of a product/component depends on its surface quality, a
scientific approach is much needed to get better and scientific understanding of the effects of
machining process variables and tooling characteristics and their intrinsic relation with the
surface generation.
In principle, the surface roughness model can be deduced from the geometry of the tool profile
and cutting feed rate and used to predict the ideal surface roughness [2]. The model should
ideally provide useful insight into the generation of machined surfaces and the principal
controlling factors. Some numerical simulation methods, such as Finite Element Analysis, are
used to calculate the thermo-mechanical variables including temperature, pressure, chip speed
and to predict the cutting forces [3]. The response surface method [4] and Neural Network
method [5] have been utilized to optimise the machining process variables. However, the
generation of a machined surface is a dynamic process in which the machining dynamics and
structural dynamics should be fully taken into account so as to ensure the modelling and
simulation precise and realistic. There are only few researchers studying the effects of
machining process variables and tooling characteristic in the dynamic environment [6] [7].
In this paper, an integrated model is proposed to model the generation of machined surfaces in
relation with process variables and tooling characteristics. The modelling is further
investigated by simulation and machining trials on a CNC turning machine tool. The paper
concludes with a discussion on the potential and applications of this method for the control
and optimization of the machining process in particular.
5
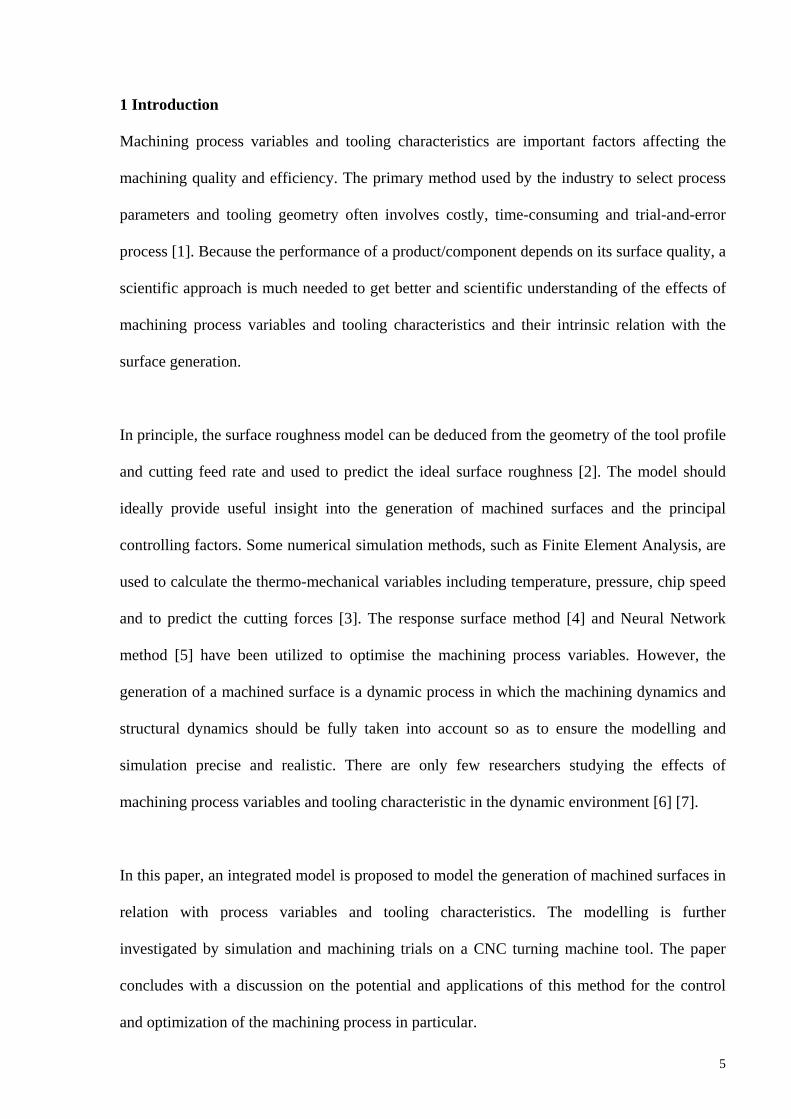
2 Integrated modelling approach
Fig. 1 illustrates the integrated modelling approach which includes dynamic cutting force
modelling, regenerative vibration modelling, machining system response modelling and
surface topography modelling. The machining variables and tooling characteristics, such as
tool rake angle and clearance angle, are inputs to the dynamic cutting force model. The three
dimensional cutting forces are generated in the light of the interactions between the cutting
tool and workpiece in the cutting zone, which will act on the machine tool and tool structure
and make the real tool path away from the ideal tool path. The real tool path can be calculated
by the machine tool response model and tooling structural response model. Based on the real
tool path, the machined surface can be generated by calculating the intersection points of the
tool path sequence. The effects of machining variables and tooling characteristics can
therefore be analytically studied on the surface generation to the extent of surface texture,
topography and roughness.
Machining inputs (Machining variables, tooling characteristics, machine
tool structural parameters, workpiece material properties)
Dynamic cutting force model
Machine tool response model (Transfer function Gw)
K
Tooling response model (Transfer function Gt)
Delay e-Ts
Delay e-Ts
-
++ -
Dynamic cutting forces
Regenerative displacement
Present workpiece dynamic displacement
Present cutting tool dynamic displacement Previous dynamic displacement
of cutting tool
Fig.1 Integrated modelling approach for modelling the surface generation.
Previous workpiece dynamic displacement
Surface topography model
Machined surface
6
Fig. 2 shows the machining dynamics model. The workpiece and cutting tool are simplified as
a second-order spring-damper vibratory system in the X, Y and Z directions. The
cutting forces excite the dynamic displacements of the cutting tool and the workpiece in the X,
Y and Z directions respectively. The whole cutting system can be described as:
D
Z
X
Y
αf
αp
Fx
Fz
Fy
Feed direction
Fig. 2 Machining system diagram.
Cutting tool
Workpiece
⎪⎪⎪⎪⎪
⎩
⎪⎪⎪⎪⎪
⎨
⎧
−=++
−=++
−=++
=++
=++
=++
⋅⋅⋅
⋅⋅⋅
⋅⋅⋅
⋅⋅⋅
⋅
)()()()(
)()()()(
)()()()(
)()()()(
)()()()(
)()()()(..
...
tFtzwktzwctzwm
tFtywktywctywm
tFtxwktxwctxwm
tFtztktztctztm
tFtytktytctytm
tFtxtktxtctxtm
zzwzwzw
yywywyw
xxwxwxw
zztztzt
yytytyt
xxtxtxt
(1)
where mat, cat, kat, maw, caw, kaw (a = x, y, z) are the mass, damping and stiffness of the tooling
system and workpiece system in the X, Y and Z directions. It is assumed that mxt, myt, mzt, mxw,
myw and mzw equal to the mass of the tooling system and workpiece system. Fx(t), Fy(t), Fz(t)
are the dynamic cutting forces in the X, Y and Z directions. In the cutting zone, the cutting
forces will act on the tool rake face, cutting edge and flank face. Fig. 3 shows the side view
and top view of the
7
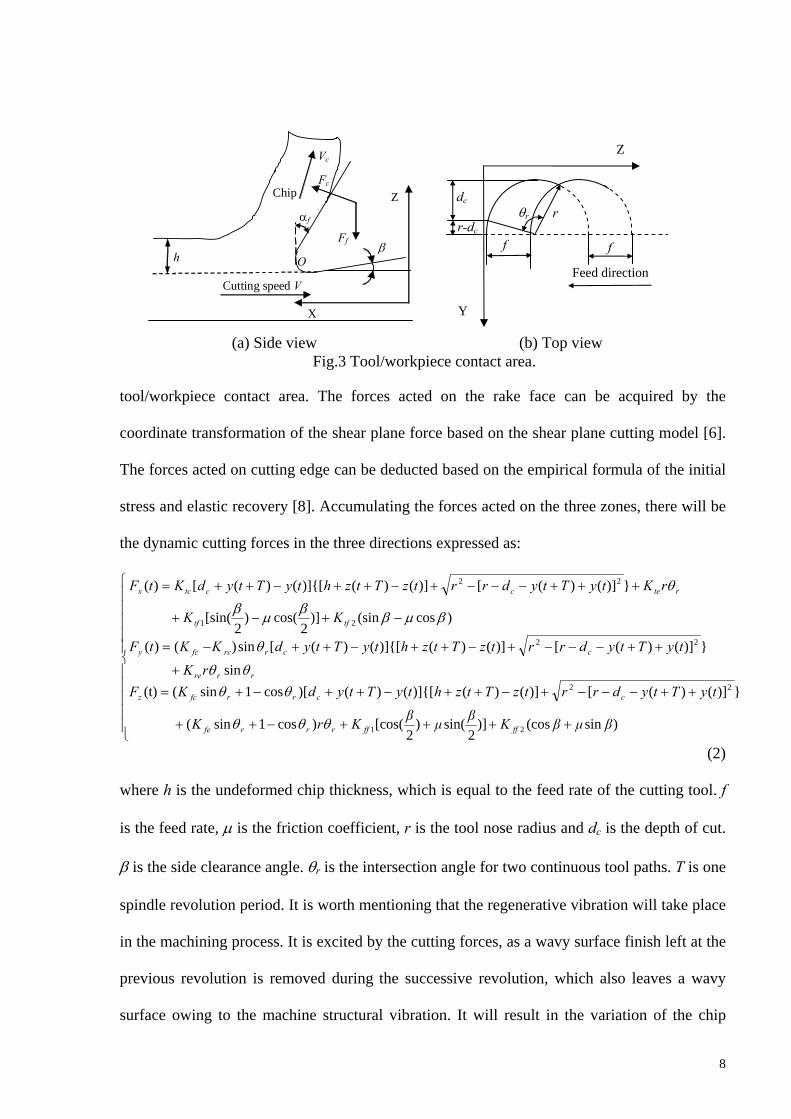
Ff
Fc Chip
Vc
Cutting speed V
O
αf
β
X
Z
h
dc
r-dc
θr
f
r
Y
Z
Feed direction
(a) Side view (b) Top view Fig.3 Tool/workpiece contact area.
f
tool/workpiece contact area. The forces acted on the rake face can be acquired by the
coordinate transformation of the shear plane force based on the shear plane cutting model [6].
The forces acted on cutting edge can be deducted based on the empirical formula of the initial
stress and elastic recovery [8]. Accumulating the forces acted on the three zones, there will be
the dynamic cutting forces in the three directions expressed as:
⎪⎪⎪⎪⎪
⎩
⎪⎪⎪⎪⎪
⎨
⎧
++++−++
++−−−+−++−++−+=+
++−−−+−++−++−=
−+−+
+++−−−+−++−++=
)sin(cos)]2
sin()2
[cos()cos1sin(
})]()([)]()()]{[()()[cos1sin((t)sin
})]()([)]()()]{[()([sin)()(
)cos(sin)]2
cos()2
[sin(
})]()([)]()()]{[()([)(
21
22
22
21
22
βμβKβμβKrK
tyTtydrrtzTtzhtyTtydKFrK
tyTtydrrtzTtzhtyTtydKKtF
KK
rKtyTtydrrtzTtzhtyTtydKtF
ffffrrrfe
ccrrfcz
rrre
ccrrcfcy
tftf
rtecctcx
θθθ
θθθθ
θ
βμββμβθ
(2)
where h is the undeformed chip thickness, which is equal to the feed rate of the cutting tool. f
is the feed rate, μ is the friction coefficient, r is the tool nose radius and dc is the depth of cut.
β is the side clearance angle. θr is the intersection angle for two continuous tool paths. T is one
spindle revolution period. It is worth mentioning that the regenerative vibration will take place
in the machining process. It is excited by the cutting forces, as a wavy surface finish left at the
previous revolution is removed during the successive revolution, which also leaves a wavy
surface owing to the machine structural vibration. It will result in the variation of the chip
8
thickness and width and excite the variations of the cutting forces vice versa. Hence, the
resulting dynamic chip thickness and depth of cut is no longer constants but vary as a function
of vibration frequency and the rotational speed of the workpiece. Ktc, Krc, Kfc, Kte, Kre, Kfe, Ktf1,
Ktf2, Kff1 and Kff2 are the cutting constants at rake face, cutting edge and flank face in the X and
Y and Z directions. They can be acquired by the transformation from the orthogonal cutting
experiments and an empirical tool force model [6] [9].
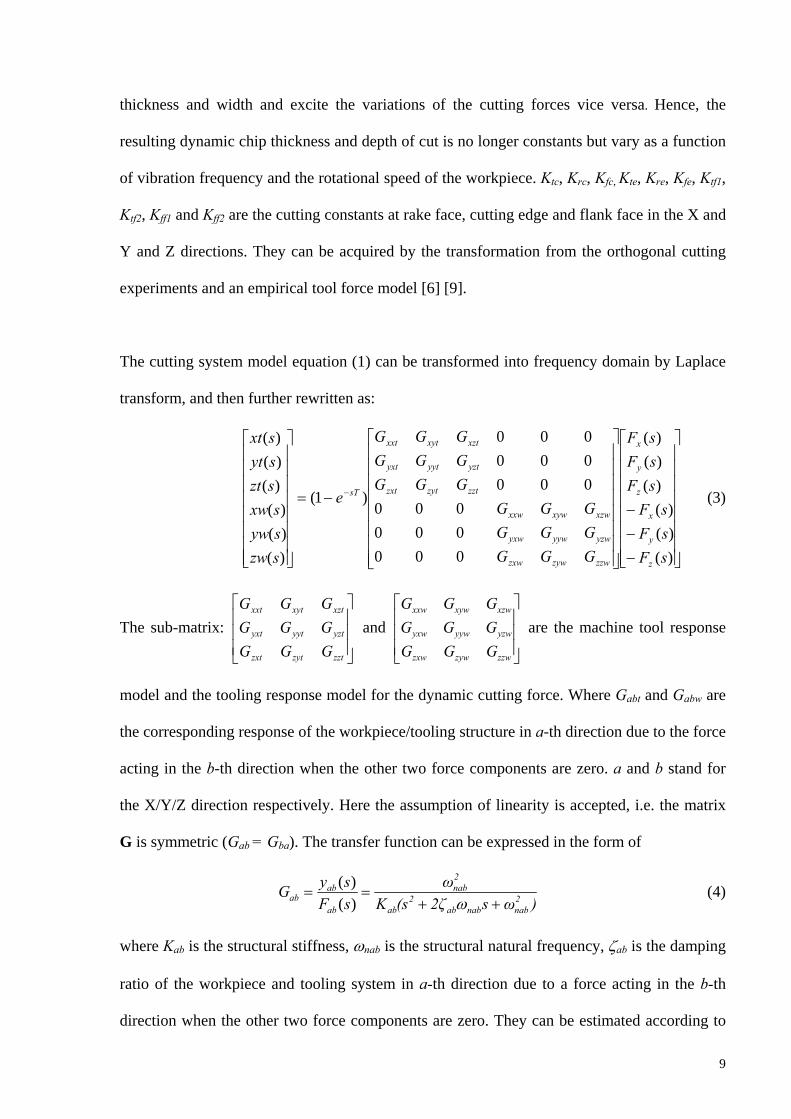
The cutting system model equation (1) can be transformed into frequency domain by Laplace
transform, and then further rewritten as:
⎥⎥⎥⎥⎥⎥⎥⎥
⎦
⎤
⎢⎢⎢⎢⎢⎢⎢⎢
⎣
⎡
−−−
⎥⎥⎥⎥⎥⎥⎥⎥
⎦
⎤
⎢⎢⎢⎢⎢⎢⎢⎢
⎣
⎡
−=
⎥⎥⎥⎥⎥⎥⎥⎥
⎦
⎤
⎢⎢⎢⎢⎢⎢⎢⎢
⎣
⎡
−
)()()(
)()()(
000000000
000000000
)1(
)()()(
)()()(
sFsFsF
sFsFsF
GGGGGGGGG
GGGGGGGGG
e
szwsywsxw
sztsytsxt
z
y
x
z
y
x
zzwzywzxw
yzwyywyxw
xzwxywxxw
zztzytzxt
yztyytyxt
xztxytxxt
sT (3)
The sub-matrix: and are the machine tool response
model and the tooling response model for the dynamic cutting force. Where G
⎥⎥⎥
⎦
⎤
⎢⎢⎢
⎣
⎡
zztzytzxt
yztyytyxt
xztxytxxt
GGGGGGGGG
⎥⎥⎥
⎦
⎤
⎢⎢⎢
⎣
⎡
zzwzywzxw
yzwyywyxw
xzwxywxxw
GGGGGGGGG
abt and Gabw are
the corresponding response of the workpiece/tooling structure in a-th direction due to the force
acting in the b-th direction when the other two force components are zero. a and b stand for
the X/Y/Z direction respectively. Here the assumption of linearity is accepted, i.e. the matrix
G is symmetric (Gab = Gba). The transfer function can be expressed in the form of
)ωs2ζ(sKω
sFsyG 2
nabnabab2
ab
2nab
ab
abab ++
==ω)(
)( (4)
where Kab is the structural stiffness, ωnab is the structural natural frequency, ζab is the damping
ratio of the workpiece and tooling system in a-th direction due to a force acting in the b-th
direction when the other two force components are zero. They can be estimated according to
9
the tooling/workpiece system structural dimensions and the components specifications
provided by the manufacturer.
The relative dynamic displacements between the tool and the workpiece can be determined as:
⎪⎩
⎪⎨
⎧
−=Δ−=Δ−=Δ
zwztzywytyxwxtx
(5)
Superposition of the dynamic displacements with the ideal tool position will be the real tool
position onto the workpiece. They can be expressed as:
⎪⎪⎪
⎩
⎪⎪⎪
⎨
⎧
Δ+−+−−=
Δ+−=
Δ+−=
jiji
jicji
jiji
ziMfTjfz
yiM
dDy
xiMDTx
,,
,,
.,
)1()1(
)2cos()(
)1(
π
π
(i = 1, 2 … M, j = 1, 2, … N) (6)
where i and j are the sample points on the workpiece along the X and Z directions. M and N
are the number of sample points in the X and Z directions respectively. D is the workpiece
diameter.
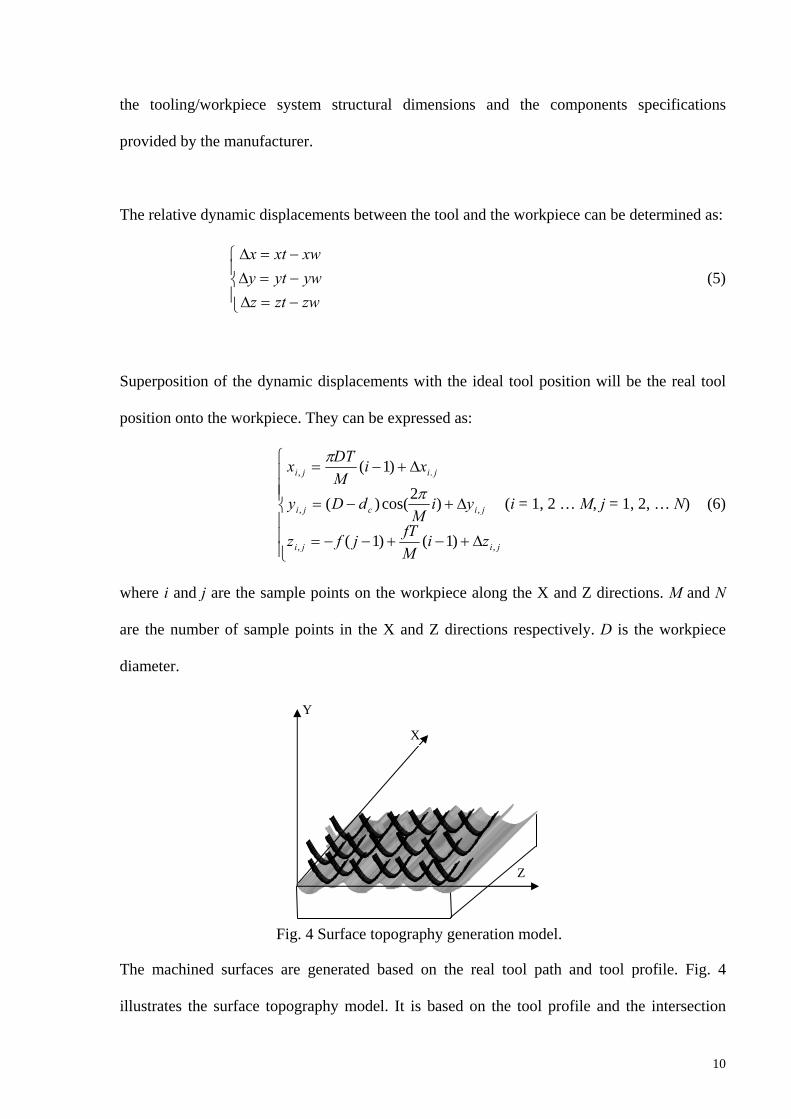
X
Z
Y
Fig. 4 Surface topography generation model.
The machined surfaces are generated based on the real tool path and tool profile. Fig. 4
illustrates the surface topography model. It is based on the tool profile and the intersection
10
points of the tool path. The intersection points of the tool path can be calculated by the
following equations:
⎪⎪⎪
⎩
⎪⎪⎪
⎨
⎧
−
−+−=
−+=
+=
+
++
++
+
)(2)(2
2)(
2
1
2,1
2,,1,
,
2,1,
,1,
,1,,
ii
jijijijiji
jijijiji
jijiji
zzxxyyr
Z
rzz
yY
xxX
(i= 1, 2, …, M; j = 1, 2, …, N) (7)
Trimming the line above the intersection points, there will be the machined surface.
3 Simulation of the generation of machined surface and experimental validation
The whole machining dynamics model is implemented in a MATLAB simulink environment.
It includes the cutting force module and machining system response module. In the simulation,
an intervally repeated ramp function is used to emulate the variation of effective rake angle
due to the generation of build-up edge and its removal at the tool’s rake surface. The
frequency of the function is about 5.25 Hz. A delay function is used to represent regenerative
vibration effects on the variation of the depth of cut and the feed rate.
Machining trials are carried out on a CNC lathe to validate the model and simulation. The
experimental configuration is shown in Fig. 5. The dynamic cutting forces are measured by a
Kistler dynamometer, 9257BA, on which the carbide tool insert is mounted. The machined
surfaces are measured by the Zygo Newview 5000 optical microscope. The aluminium alloy
and steel sample components are machined in the experiments. The machining conditions are
listed in Table 1.
11
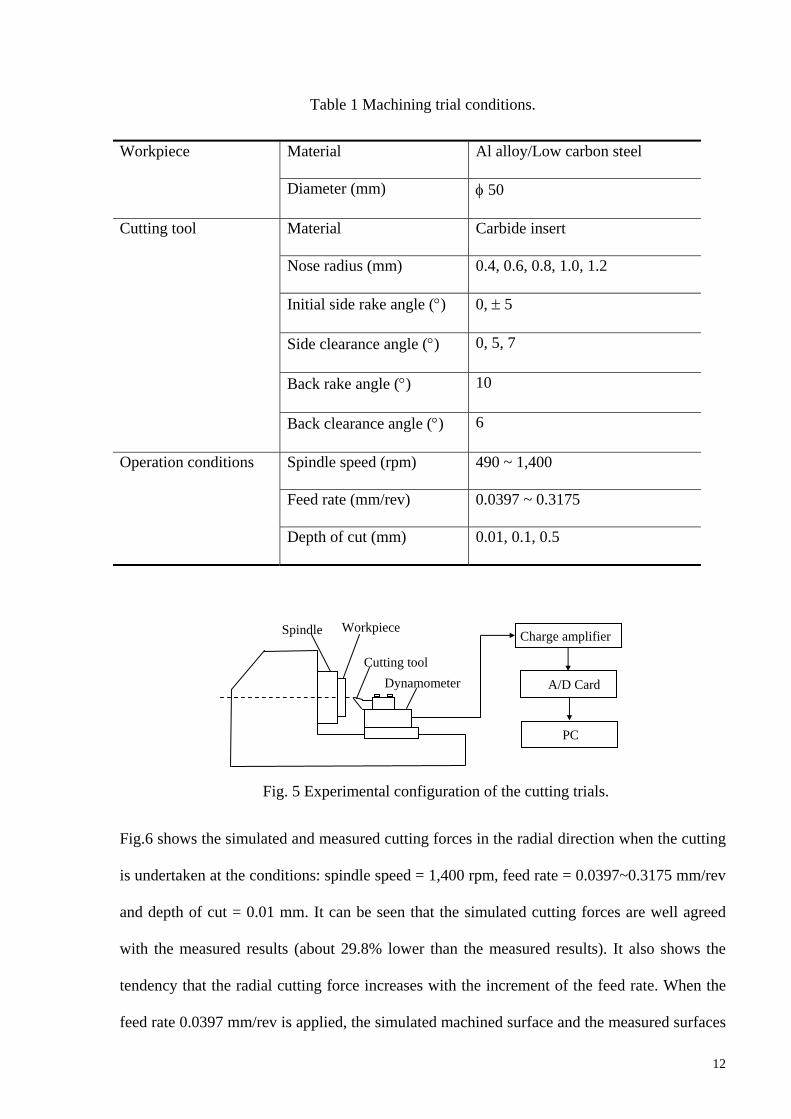
Table 1 Machining trial conditions.
Material Al alloy/Low carbon steel Workpiece
Diameter (mm) φ 50
Material Carbide insert
Nose radius (mm) 0.4, 0.6, 0.8, 1.0, 1.2
Initial side rake angle (°) 0, ± 5
Side clearance angle (°) 0, 5, 7
Back rake angle (°) 10
Cutting tool
Back clearance angle (°) 6
Spindle speed (rpm) 490 ~ 1,400
Feed rate (mm/rev) 0.0397 ~ 0.3175
Operation conditions
Depth of cut (mm) 0.01, 0.1, 0.5
Cutting tool Dynamometer
Fig. 5 Experimental configuration of the cutting trials.
PC
A/D Card
Charge amplifier Workpiece Spindle
Fig.6 shows the simulated and measured cutting forces in the radial direction when the cutting
is undertaken at the conditions: spindle speed = 1,400 rpm, feed rate = 0.0397~0.3175 mm/rev
and depth of cut = 0.01 mm. It can be seen that the simulated cutting forces are well agreed
with the measured results (about 29.8% lower than the measured results). It also shows the
tendency that the radial cutting force increases with the increment of the feed rate. When the
feed rate 0.0397 mm/rev is applied, the simulated machined surface and the measured surfaces
12
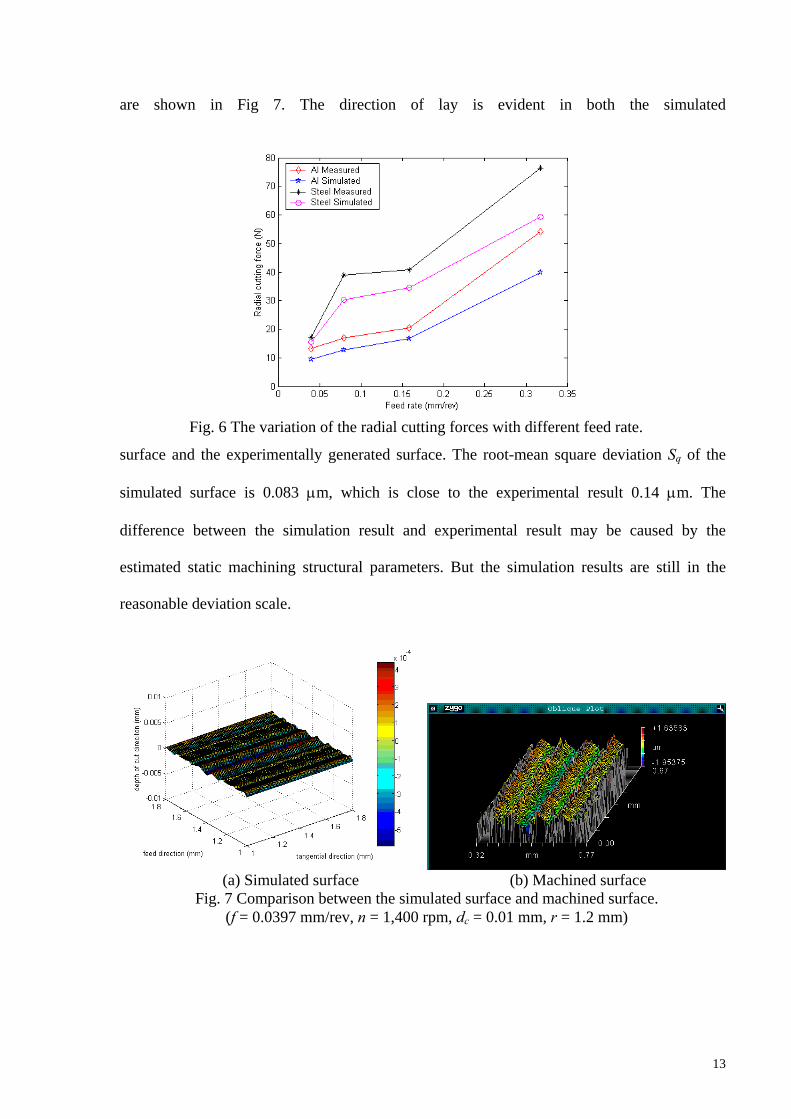
are shown in Fig 7. The direction of lay is evident in both the simulated
surface and the experimentally generated surface. The root-mean square deviation Sq of the
simulated surface is 0.083 μm, which is close to the experimental result 0.14 μm. The
difference between the simulation result and experimental result may be caused by the
estimated static machining structural parameters. But the simulation results are still in the
reasonable deviation scale.
Fig. 6 The variation of the radial cutting forces with different feed rate.
(a) Simulated surface (b) Machined surface
Fig. 7 Comparison between the simulated surface and machined surface. (f = 0.0397 mm/rev, n = 1,400 rpm, dc = 0.01 mm, r = 1.2 mm)
13
4 Discussions
4.1 The effects of the process variables on the machined surfaces
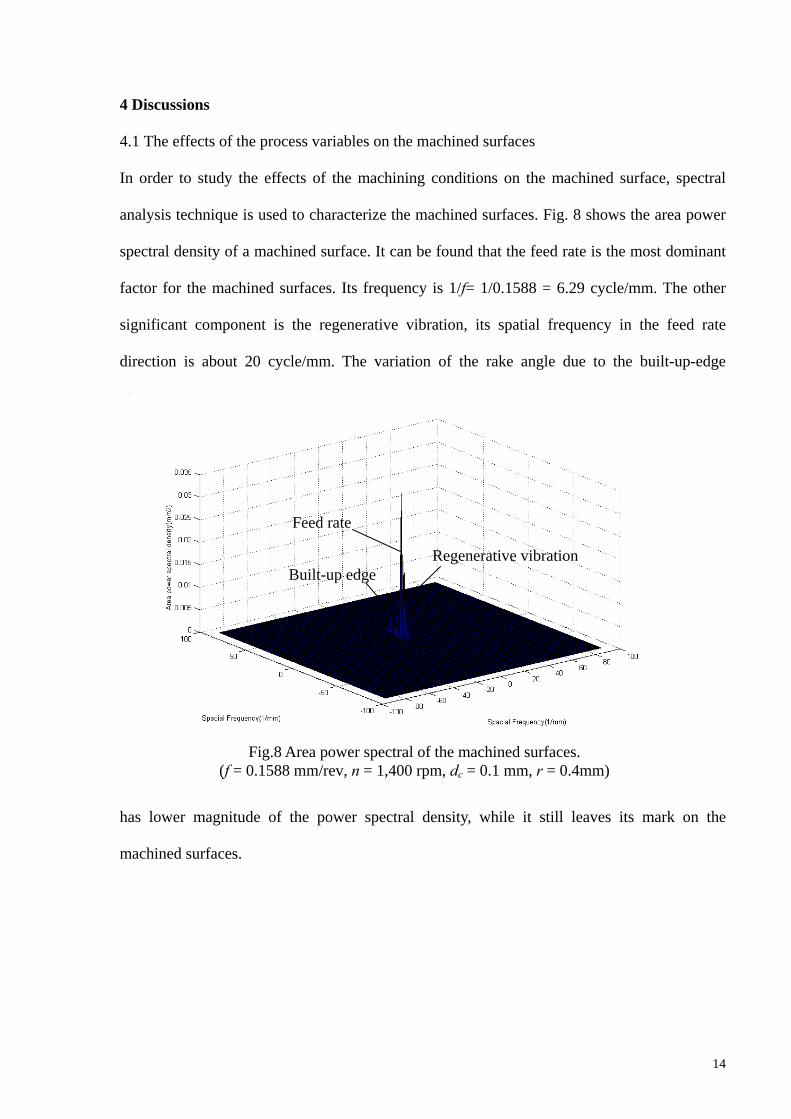
In order to study the effects of the machining conditions on the machined surface, spectral
analysis technique is used to characterize the machined surfaces. Fig. 8 shows the area power
spectral density of a machined surface. It can be found that the feed rate is the most dominant
factor for the machined surfaces. Its frequency is 1/f= 1/0.1588 = 6.29 cycle/mm. The other
significant component is the regenerative vibration, its spatial frequency in the feed rate
direction is about 20 cycle/mm. The variation of the rake angle due to the built-up-edge
has lower magnitude of the power spectral density, while it still leaves its mark on the
machined surfaces.
Feed rate
Built-up edge Regenerative vibration
Fig.8 Area power spectral of the machined surfaces.
(f = 0.1588 mm/rev, n = 1,400 rpm, dc = 0.1 mm, r = 0.4mm)
14
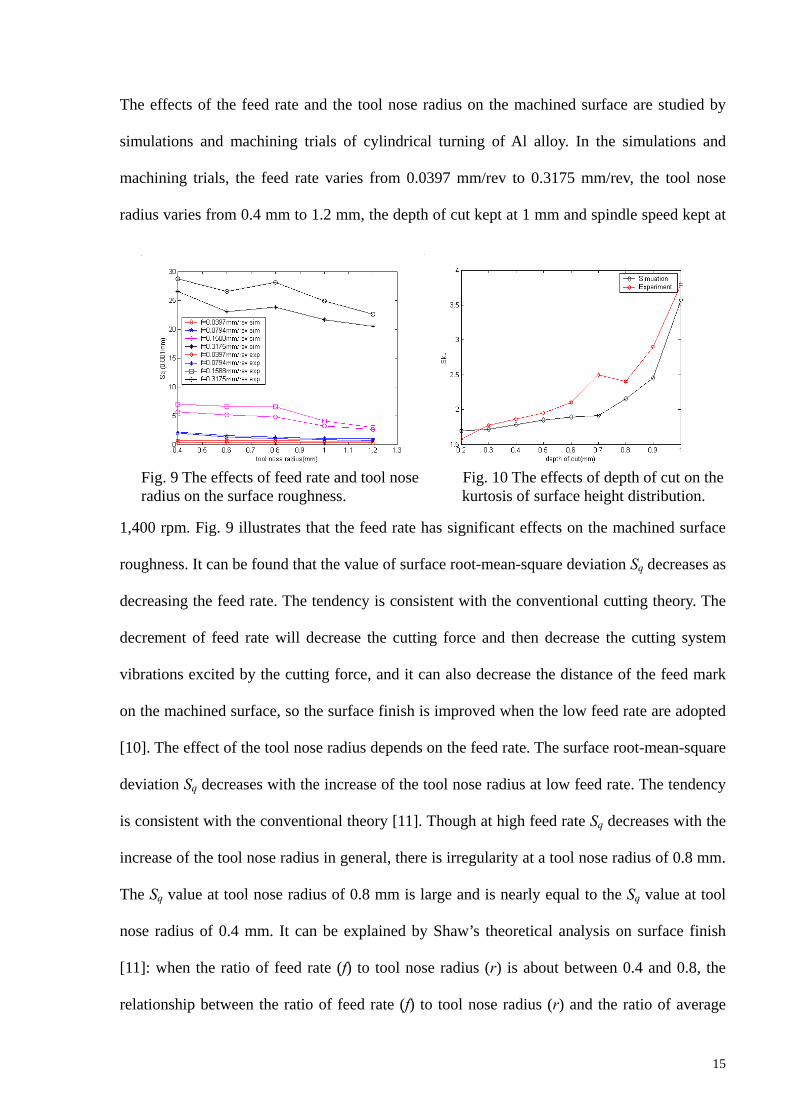
The effects of the feed rate and the tool nose radius on the machined surface are studied by
simulations and machining trials of cylindrical turning of Al alloy. In the simulations and
machining trials, the feed rate varies from 0.0397 mm/rev to 0.3175 mm/rev, the tool nose
radius varies from 0.4 mm to 1.2 mm, the depth of cut kept at 1 mm and spindle speed kept at
1,400 rpm. Fig. 9 illustrates that the feed rate has significant effects on the machined surface
roughness. It can be found that the value of surface root-mean-square deviation Sq decreases as
decreasing the feed rate. The tendency is consistent with the conventional cutting theory. The
decrement of feed rate will decrease the cutting force and then decrease the cutting system
vibrations excited by the cutting force, and it can also decrease the distance of the feed mark
on the machined surface, so the surface finish is improved when the low feed rate are adopted
[10]. The effect of the tool nose radius depends on the feed rate. The surface root-mean-square
deviation Sq decreases with the increase of the tool nose radius at low feed rate. The tendency
is consistent with the conventional theory [11]. Though at high feed rate Sq decreases with the
increase of the tool nose radius in general, there is irregularity at a tool nose radius of 0.8 mm.
The Sq value at tool nose radius of 0.8 mm is large and is nearly equal to the Sq value at tool
nose radius of 0.4 mm. It can be explained by Shaw’s theoretical analysis on surface finish
[11]: when the ratio of feed rate (f) to tool nose radius (r) is about between 0.4 and 0.8, the
relationship between the ratio of feed rate (f) to tool nose radius (r) and the ratio of average
Fig. 9 The effects of feed rate and tool nose Fig. 10 The effects of depth of cut on the radius on the surface roughness. kurtosis of surface height distribution.
15
surface roughness (Ra) to tool nose radius (r) is nearly linear. It is just the case when the tool
nose radius of 0.8 mm and 0.4 mm with feed rate 0.3175 mm/rev are used, in which the ratio
f/r is 0.39 and 0.794 respectively. Although the ratio Ra/r value of the former is nearly half that
of the latter, because its tool nose radius is two times bigger than that of the former, its surface
roughness values is nearly equal to that of the latter.
The effects of the depth of cut on the surface height distribution are studied under the same
cutting speed, whereas the tool nose radius = 1.2 mm and feed rate = 0.0397 mm/rev
respectively. The depth of cut varies from 0.2 to 1.0 mm. Fig. 10 shows the kurtosis of the
surface height distribution Sku is very sensitive to the variation of the depth of cut. It can be
found that the Sku increases with increasing the depth of cut. It means decreasing the depth of
cut will greatly benefit the achievement of the machined surfaces with well spread height
distribution.
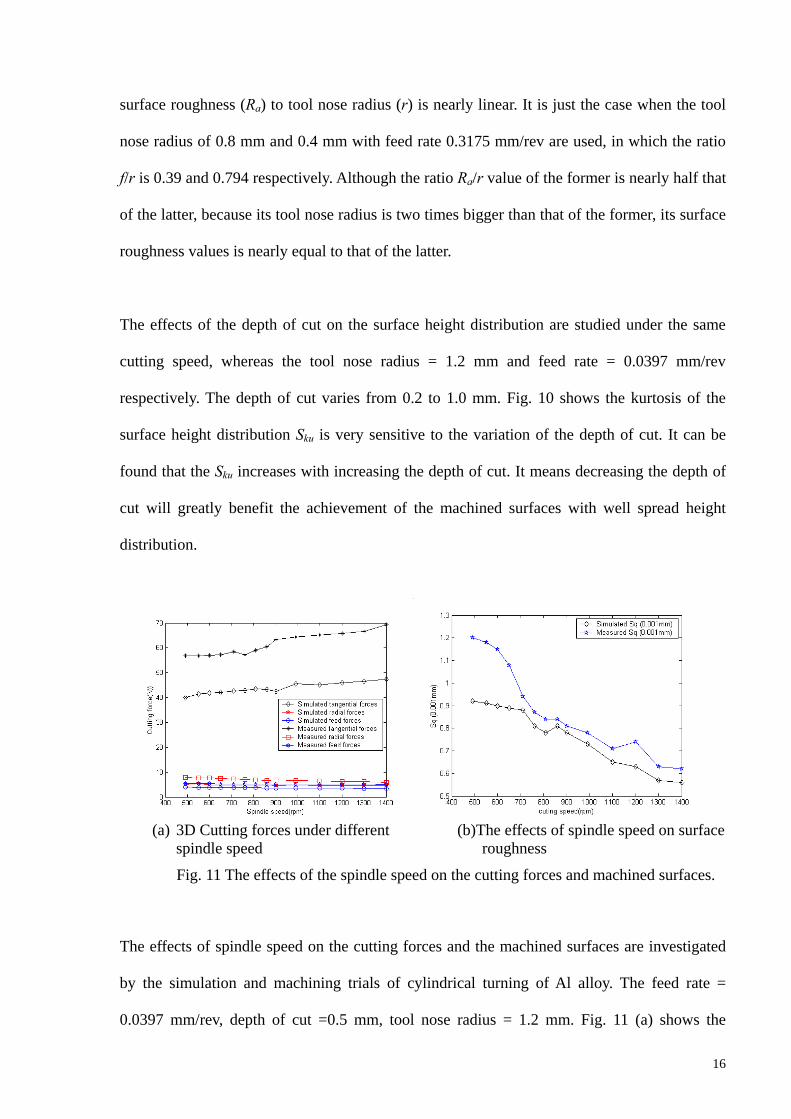
(a) 3D Cutting forces under different (b)The effects of spindle speed on surface spindle speed roughness
Fig. 11 The effects of the spindle speed on the cutting forces and machined surfaces.
The effects of spindle speed on the cutting forces and the machined surfaces are investigated
by the simulation and machining trials of cylindrical turning of Al alloy. The feed rate =
0.0397 mm/rev, depth of cut =0.5 mm, tool nose radius = 1.2 mm. Fig. 11 (a) shows the
16
tangential cutting force increases with the increase of the spindle speed, whereas the radial and
feed cutting forces decrease with the increase of the spindle speed. Fig. 11 (b) shows the
surface roughness decreases with the increase of the spindle speed. The trends are consistent
with the conventional theory [11]. The radial force is the most dominant force component
contributing to the generation of machined surfaces. Therefore, the surface roughness
decreases with the increases of the spindle speed.
4.2 The effects of the tooling characteristics
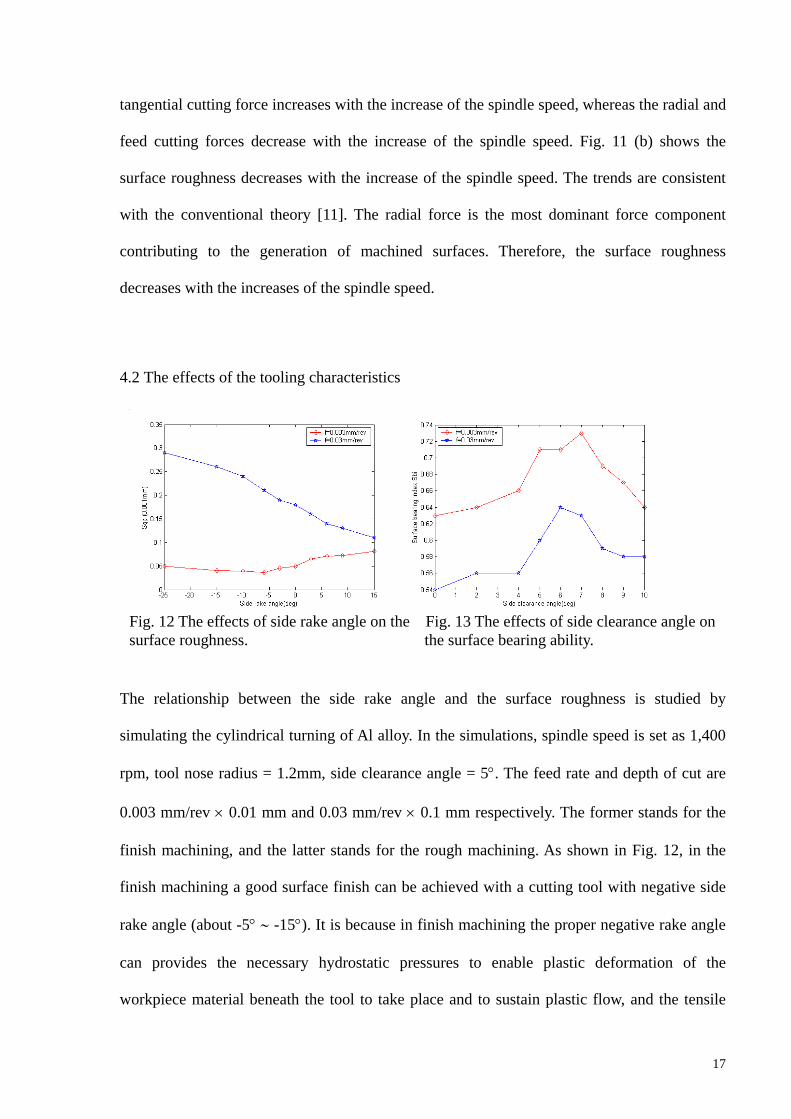
Fig. 12 The effects of side rake angle on the Fig. 13 The effects of side clearance angle on surface roughness. the surface bearing ability.
The relationship between the side rake angle and the surface roughness is studied by
simulating the cylindrical turning of Al alloy. In the simulations, spindle speed is set as 1,400
rpm, tool nose radius = 1.2mm, side clearance angle = 5°. The feed rate and depth of cut are
0.003 mm/rev × 0.01 mm and 0.03 mm/rev × 0.1 mm respectively. The former stands for the
finish machining, and the latter stands for the rough machining. As shown in Fig. 12, in the
finish machining a good surface finish can be achieved with a cutting tool with negative side
rake angle (about -5° ∼ -15°). It is because in finish machining the proper negative rake angle
can provides the necessary hydrostatic pressures to enable plastic deformation of the
workpiece material beneath the tool to take place and to sustain plastic flow, and the tensile
17
stress is smaller than that of using a cutting tool with positive rake angle [12]. In the rough
machining, a cutting tool with positive side rake angle will be helpful to decrease the surface
roughness. It is because in rough machining positive rake angle makes the cutting force
smaller than that of using a cutting tool with negative rake angle, the small cutting force will
decrease the cutting system vibrations [11].
The effect of the clearance angle on the surface bearing ability is studied by simulating the
cylindrical turning of Al alloy. The similar machining conditions which stand for the finish
and rough machining are adopted except the side clearance angle varies from 0° to 10°. Fig.
13 shows when the side clearance angle is about 5° ∼ 7° the machined surface with good
surface bearing ability can be achieved in both finish and rough machining. Therefore, the 5°
∼ 7° side clearance angle enables the elastic recovery and can improve the surface bearing
ability of the machined surface.
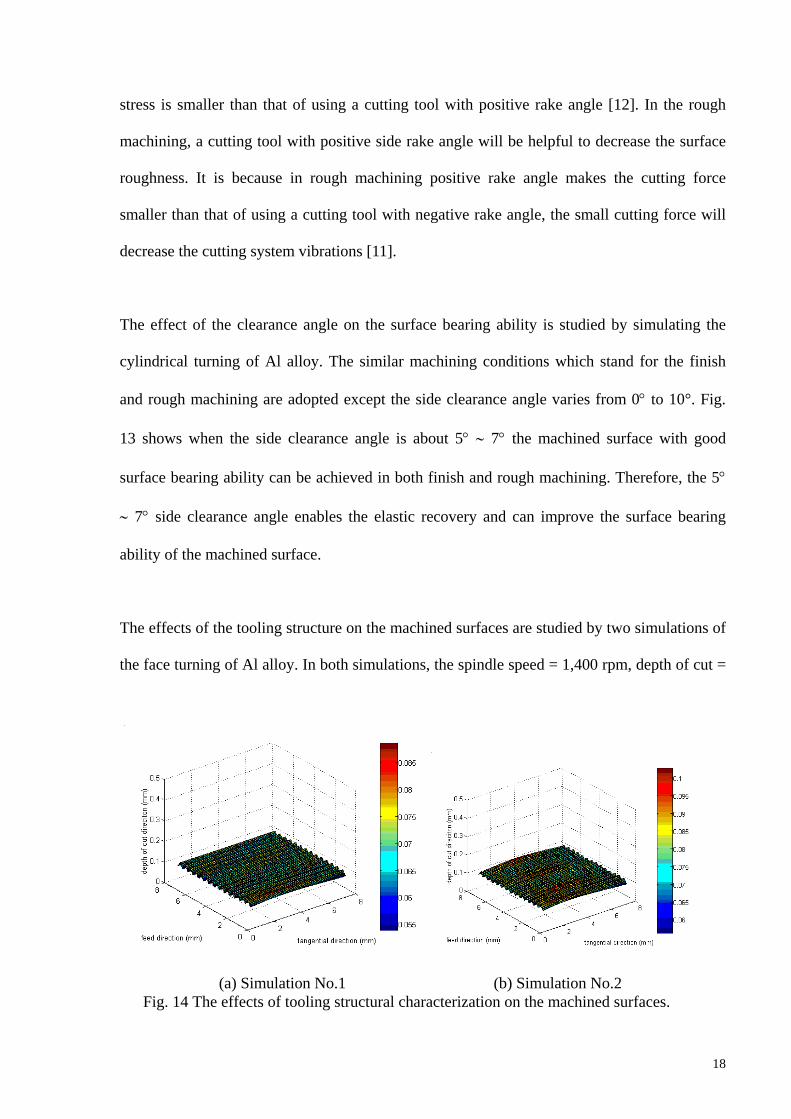
The effects of the tooling structure on the machined surfaces are studied by two simulations of
the face turning of Al alloy. In both simulations, the spindle speed = 1,400 rpm, depth of cut =
(a) Simulation No.1 (b) Simulation No.2 Fig. 14 The effects of tooling structural characterization on the machined surfaces.
18

2.0 mm, feed rate = 0.5mm/rev. But in the latter simulation the result of tooling structural
stiffness multiplying the damping ratio is one tenth of that of the former. The comparison of
the simulated surfaces is shown in Fig. 14. The root-mean square deviations Sq of the
machined surfaces are 5.8 μm and 11.6 μm respectively. It can be found that the surface
roughness will be degraded because of the bad tooling structural characteristics.
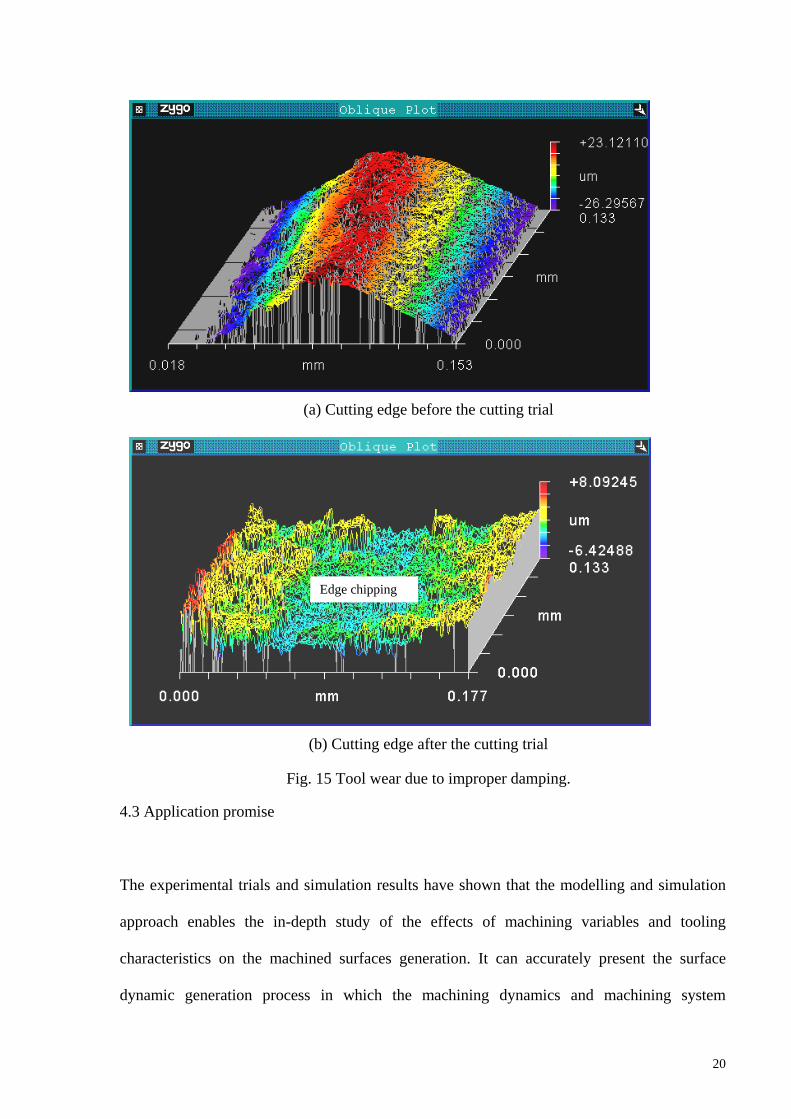
The cylindrical turning trial is carried out with the low preload force on the bolt of the
toolholder. The tool insert is observed using the Zygo microscope as shown in Fig. 15, before
and after four machining cycles (spindle speed = 1,400 rpm, depth of cut =2 mm, feed rate
=0.1588 mm/rev, cutting distance =20mm). Obvious edge chipping can be observed on the
tool inserts in Fig. 15 (b), which indicates the bad tooling structural characteristics can result
in tool wear.
19
(a) Cutting edge before the cutting trial
Edge chipping
(b) Cutting edge after the cutting trial
Fig. 15 Tool wear due to improper damping.
4.3 Application promise
The experimental trials and simulation results have shown that the modelling and simulation
approach enables the in-depth study of the effects of machining variables and tooling
characteristics on the machined surfaces generation. It can accurately present the surface
dynamic generation process in which the machining dynamics and machining system
20
structural dynamics are involved. The additional advantage of the technique which
distinguishes it from conventional modelling approach is that it is built in an opening
interactive programming environment, so some machining factors such as the environmental
vibrations and the machine tool errors can be easily added into the model in the form of linear
or nonlinear functions with respect to their physical characters. Therefore, the modeling
approach and associated simulations developed have the following potentials [13] [14]:
• To be built into the CNC controller as a ‘soft gauge’ to monitor the machining process
instability (chatters)
• To optimise the machining process conditions against the component surface
functionality as required
• To design the surface (digitally) against its functional performance
• To be used as a generic research tool for the investigation of machining dynamics and
machined surfaces generation (turning, milling and grinding processes).
5 Conclusions
An integrated model has been proposed to simulate the surface generation in turning
processes. The machined trials show the modelling approach can accurately present the
dynamic cutting process and the effects of machining process variables and tooling
characteristics. It is found that the feed rate plays the most significant role on the machined
surfaces. The decreasing of the depth of cut will greatly benefit the achievement of the
machined surfaces with well spread of height distribution. The negative rake angle (about -5°)
will be significant for the achievement of good surface finish in finish machining. A proper
clearance angle (about 5° ∼ 7°) enables the elastic recovery of machined surfaces and can
improve the surface bearing ability of the machined surfaces. The tooling structural
characteristics are significant for the machined surface accuracy. Bad tooling structure can
21
result in the tool wear and degrade the machined surface accuracy. The approach and
simulations are very promising for industrial applications with particular reference to the
optimisation of the machining process based on the product/component surface functionality
requirements.
Acknowledgments
The authors would like to thank Kistler (UK) Ltd for their support and assistance of this
research.
References:
[1] K. Taraman and B. Lambert, “A surface roughness model for a turning operation”,
International Journal of Production Research, 12(6), pp. 691-703, 1974.
[2] D. J. Whitehouse, Handbook of Surface Metrology, Institute of Physics Publishing,
Bristol, 1994.
[3] T. Moriwaki, N. Sugimura and S. Luan, “Combined stress, material flow and analysis of
orthogonal micromachining of Copper”, Annals of the CIRP, 42(1), pp. 75-78, 1993.
[4] J. S. Baras and N. S. Patel, “Designing response surface model-based run-by-run
controllers: a worst case approach”, IEEE Transactions on Components, Packaging &
Manufacturing Technology, Part C Manufacturing, 19(2), pp. 98-104, 1996.
[5] R. K. Iain and V. K. Jain, “Optimum selection of machining conditions in abrasive flow
machining using neural network”, Journal of Materials Processing Technology, 108 (1), pp.
62-67, 2000.
[6] Y. Altintas, Manufacturing Automation: Metal Cutting Mechanics, Machine Tool
Vibrations, and CNC Design, Cambridge University Press, Cambridge, 2000.
[7] C. F. Cheung and W. B. Lee, “Characterisation of nanosurface generation in single-point
diamond turning”, International Journal of Machine Tools & Manufacture, 41, pp. 851-875,
22
2001.
[8] C. Arcona and T. A. Dow, “An empirical tool force model for precision machining”,
Transactions of the ASME: Journal of Manufacturing Science and Engineering, 120, pp. 700-
707, 1998.
[9] X. Fan and M. H. Miller, “The application of an empirical tool force model on vibration
cutting”, Proceedings, 17th ASPE Annual Meeting, St. Louis, USA, pp. 484-489, 20-25
October, 2002.
[10] E. J. A. Armarego and R. H. Brown, The Machining of Metals, Prentice-Hall, Englewood
Cliff, NJ, 1969.
[11] M. C. Shaw, Metal Cutting Principles, Oxford University Press, Oxford, 1984.
[12] R. Komanduri, N. Chandrasekaran and L. M. Raff, “Effect of tool geometry in
nanometric cutting: a molecular dynamics simulation approach”, Wear, 219, pp. 84-97, 1998.
[13] X. K. Luo, K. Cheng and X. C. Luo, “A simulated investigation on machining instability
and non-linear aspects in CNC tuning processes”, The International Journal for Manufacturing
Science & Production, 5(1-2), pp. 45-50, 2003.
[14] K. Cheng, X. C. Luo and X. K. Luo, “A simulated investigation on the surface
functionalities in precision machining processes”, Proceedings, 18th International Conference
on Computer-Aided Production Engineering (CAPE 2003), Edinburgh, UK, pp. 385-394, 18-
19 March, 2003.
23