Embed Size (px)
Citation preview
Investor Profiles
MACQUARIE CONNECTIONS MACQUARIE SECURITIES (AUSTRALIA) LIMITED=
Australia / New Zealand Corporate Day
Singapore
2 September 2011

=
MACQUARIE CONNECTIONS Australia / New Zealand Corporate Day

Aberdeen Asset Management (Asia) Ltd. Detail
Style ValueTurnover N/ADistribution Style Large CapInvestor Type Mutual Fund ManagerEquity Assets (MM) 28,045Equity Positions 542Total Positions 545Price Momentum 94%Report Date Jul−31−11
Investment ApproachAAMA is an active, GARP−oriented asset manager which invests inequities in the Asian−Pacific region, favoring mid−cap companies andalso investing in private capital, fixed−income and real estate. Theyfollow a research−led, long−term investment approach, sharingresearch and management with other Aberdeen divisions. The firmperforms in−house research, meeting regularly with companymanagement. They target low−valuation companies that are likely todeliver long−term above−average earnings and dividend growth. Inmature markets, AAMA uses thematic and sector filters to arrive atstock choices, employing a bottom−up approach, and tends todisregard indexes, market capitalization and relative return.
Contacts
Hugh YoungChief Investment Officer − 65.6395.2700Chou Chong, CFADirector of Investments − 65.6395.2700Adrian Lim, CFAPortfolio Manager−Equities − 65.6395.2700Andrew GillanPortfolio Manager−Equities − 65.6395.2700
Portfolio CharacteristicsS&P Institution
Avg. P/E 15.18x 16.40xAvg. P/B 3.18x 4.51xDividend Yield 2.37% 2.85%Beta 1.00 0.40
Company Information21 Church Street #01−01 Capital Square Two Phone: 65.6395.2700Singapore, SG 049480 Fax: 65.6438.0743
Aberdeen Asset Management (Asia) Ltd. (AAMA) is the Singapore−based asset management subsidiary of Aberdeen AssetManagement plc (LSE: AND) in the UK. The firm was established in 1992. In addition to the SIngapore office, they have officesin Hong Kong, Thailand, Malaysia, Australia, Japan and Taiwan, as well as a representative office in China. AAMA provides arange of locally−run, single−country, regional and international funds to institutions, other asset managers and retail investors.
Largest Holdings
Name PositionPositionChange
Mkt Val.(MM)
Mkt. ValChg(MM)
%Out
%Port.
Pt Astra International Ord 216,941,802 2,658,000 1,720.6 21.1 5.4 6.0PetroChina Co. Ltd. 1,043,499,163 1,043,499,163 1,249.6 1,249.6 4.9 4.4Ayala Land Inc Ord 2,495,274,971 3,283,700 910.3 1.2 19.2 3.2Hero Motocorp (HERO Honda) Ord 20,293,418 1,944,802 891.4 85.4 10.2 3.1QBE Insurance Group Ltd. 54,523,464 −75,008,700 753.3 −1,036.4 5.0 2.6Housing Development Fin (HDFC) Ord 52,936,403 451,470 745.4 6.4 3.6 2.6Pt Unilever Indonesia Tbk Ord 381,164,098 −788,000 742.9 −1.5 5.0 2.6Jardine Strategic Holdings Ltd. 24,445,244 −595,252 703.0 −17.1 2.2 2.5
Largest Buys
Name PositionPositionChange
Mkt Val.(MM)
Mkt. ValChg(MM)
%Out
%Port.
PetroChina Co. Ltd. 1,043,499,163 1,043,499,163 1,249.6 1,249.6 4.9 4.4E−mart Co. Ltd. 2,500,538 2,500,538 671.4 671.4 9.0 2.4Hero Motocorp (HERO Honda) Ord 20,293,418 1,944,802 891.4 85.4 10.2 3.1BS Financial Group Inc. 25,946,733 6,024,213 318.4 73.9 13.4 1.1SP Setia Bhd 47,910,900 47,910,900 60.7 60.7 2.7 0.2
Largest Sells
Name PositionPositionChange
Mkt Val.(MM)
Mkt. ValChg(MM)
%Out
%Port.
QBE Insurance Group Ltd. 54,523,464 −75,008,700 753.3 −1,036.4 5.0 2.6Singapore Technologies Engineering Ltd. 8,775,727 −356,873,582 21.0 −853.6 0.3 0.1Oversea−Chinese Banking Corp. Ltd. 6,972,006 −118,717,076 50.0 −851.8 0.2 0.2Venture Corp. Ltd. 675,765 −37,165,965 3.9 −213.2 0.2 0.0Public Bank Bhd 45,894,914 −16,071,521 199.4 −69.8 1.3 0.7
Contribution Analysis by IndustryLargest Industry Holdings in
Industry MV(MM) %Port Chg(MM)Regional Banks 3,032 10.6 18Motor Vehicles 2,743 9.6 123Real Estate Development 2,384 8.4 34Household/Personal Care 1,340 4.7 13Industrial Conglomerates 1,329 4.7 −24Integrated Oil 1,250 4.4 1,249Construction Materials 1,078 3.8 −5Wireless Telecommunications 1,054 3.7 −0Information Technology Services 892 3.1 23Finance/Rental/Leasing 869 3.0 8
Portfolio Distribution
Top Sector Holdings
Finance − (28.6%)Consumer Durables − (11.9%)Consumer Non−Durables − (7.8%)Retail Trade − (7.3%)Non−Energy Minerals − (6.4%)Remaining Sectors − (38.0%)
Portfolio Distribution
DistributionsMkt. Val
(MM)Mkt. Val
Chg(MM)%
Port.Mega 2,575 35 9.0Large 12,966 −655 45.4Mid 8,525 169 29.9Small 3,661 −178 12.8Micro 218 −6 0.8N/C 1 1 0.0
2011 FactSet Research Systems Inc. All rights reserved. − Currency: USD
Absolute Asia Asset Management Ltd. Detail
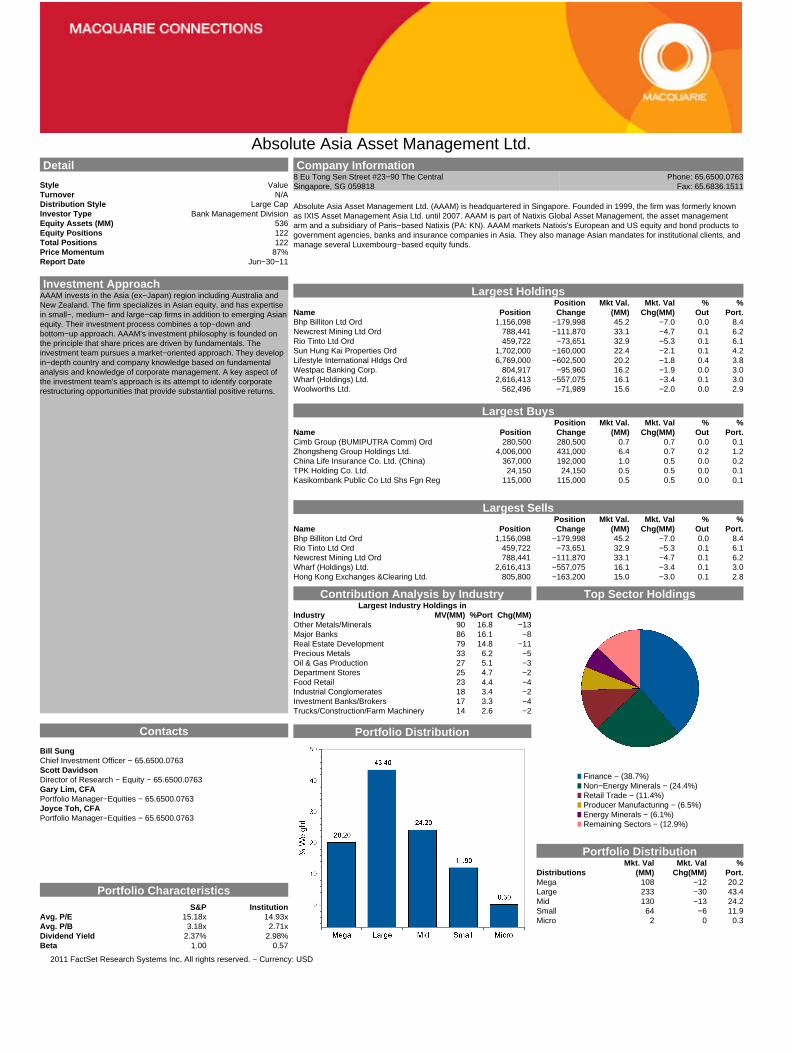
Style ValueTurnover N/ADistribution Style Large CapInvestor Type Bank Management DivisionEquity Assets (MM) 536Equity Positions 122Total Positions 122Price Momentum 87%Report Date Jun−30−11
Investment ApproachAAAM invests in the Asia (ex−Japan) region including Australia andNew Zealand. The firm specializes in Asian equity, and has expertisein small−, medium− and large−cap firms in addition to emerging Asianequity. Their investment process combines a top−down andbottom−up approach. AAAM's investment philosophy is founded onthe principle that share prices are driven by fundamentals. Theinvestment team pursues a market−oriented approach. They developin−depth country and company knowledge based on fundamentalanalysis and knowledge of corporate management. A key aspect ofthe investment team's approach is its attempt to identify corporaterestructuring opportunities that provide substantial positive returns.
Contacts
Bill SungChief Investment Officer − 65.6500.0763Scott DavidsonDirector of Research − Equity − 65.6500.0763Gary Lim, CFAPortfolio Manager−Equities − 65.6500.0763Joyce Toh, CFAPortfolio Manager−Equities − 65.6500.0763
Portfolio CharacteristicsS&P Institution
Avg. P/E 15.18x 14.93xAvg. P/B 3.18x 2.71xDividend Yield 2.37% 2.98%Beta 1.00 0.57
Company Information8 Eu Tong Sen Street #23−90 The Central Phone: 65.6500.0763Singapore, SG 059818 Fax: 65.6836.1511
Absolute Asia Asset Management Ltd. (AAAM) is headquartered in Singapore. Founded in 1999, the firm was formerly knownas IXIS Asset Management Asia Ltd. until 2007. AAAM is part of Natixis Global Asset Management, the asset managementarm and a subsidiary of Paris−based Natixis (PA: KN). AAAM markets Natixis's European and US equity and bond products togovernment agencies, banks and insurance companies in Asia. They also manage Asian mandates for institutional clients, andmanage several Luxembourg−based equity funds.
Largest Holdings
Name PositionPositionChange
Mkt Val.(MM)
Mkt. ValChg(MM)
%Out
%Port.
Bhp Billiton Ltd Ord 1,156,098 −179,998 45.2 −7.0 0.0 8.4Newcrest Mining Ltd Ord 788,441 −111,870 33.1 −4.7 0.1 6.2Rio Tinto Ltd Ord 459,722 −73,651 32.9 −5.3 0.1 6.1Sun Hung Kai Properties Ord 1,702,000 −160,000 22.4 −2.1 0.1 4.2Lifestyle International Hldgs Ord 6,769,000 −602,500 20.2 −1.8 0.4 3.8Westpac Banking Corp. 804,917 −95,960 16.2 −1.9 0.0 3.0Wharf (Holdings) Ltd. 2,616,413 −557,075 16.1 −3.4 0.1 3.0Woolworths Ltd. 562,496 −71,989 15.6 −2.0 0.0 2.9
Largest Buys
Name PositionPositionChange
Mkt Val.(MM)
Mkt. ValChg(MM)
%Out
%Port.
Cimb Group (BUMIPUTRA Comm) Ord 280,500 280,500 0.7 0.7 0.0 0.1Zhongsheng Group Holdings Ltd. 4,006,000 431,000 6.4 0.7 0.2 1.2China Life Insurance Co. Ltd. (China) 367,000 192,000 1.0 0.5 0.0 0.2TPK Holding Co. Ltd. 24,150 24,150 0.5 0.5 0.0 0.1Kasikornbank Public Co Ltd Shs Fgn Reg 115,000 115,000 0.5 0.5 0.0 0.1
Largest Sells
Name PositionPositionChange
Mkt Val.(MM)
Mkt. ValChg(MM)
%Out
%Port.
Bhp Billiton Ltd Ord 1,156,098 −179,998 45.2 −7.0 0.0 8.4Rio Tinto Ltd Ord 459,722 −73,651 32.9 −5.3 0.1 6.1Newcrest Mining Ltd Ord 788,441 −111,870 33.1 −4.7 0.1 6.2Wharf (Holdings) Ltd. 2,616,413 −557,075 16.1 −3.4 0.1 3.0Hong Kong Exchanges &Clearing Ltd. 805,800 −163,200 15.0 −3.0 0.1 2.8
Contribution Analysis by IndustryLargest Industry Holdings in
Industry MV(MM) %Port Chg(MM)Other Metals/Minerals 90 16.8 −13Major Banks 86 16.1 −8Real Estate Development 79 14.8 −11Precious Metals 33 6.2 −5Oil & Gas Production 27 5.1 −3Department Stores 25 4.7 −2Food Retail 23 4.4 −4Industrial Conglomerates 18 3.4 −2Investment Banks/Brokers 17 3.3 −4Trucks/Construction/Farm Machinery 14 2.6 −2
Portfolio Distribution
Top Sector Holdings
Finance − (38.7%)Non−Energy Minerals − (24.4%)Retail Trade − (11.4%)Producer Manufacturing − (6.5%)Energy Minerals − (6.1%)Remaining Sectors − (12.9%)
Portfolio Distribution
DistributionsMkt. Val
(MM)Mkt. Val
Chg(MM)%
Port.Mega 108 −12 20.2Large 233 −30 43.4Mid 130 −13 24.2Small 64 −6 11.9Micro 2 0 0.3
2011 FactSet Research Systems Inc. All rights reserved. − Currency: USD
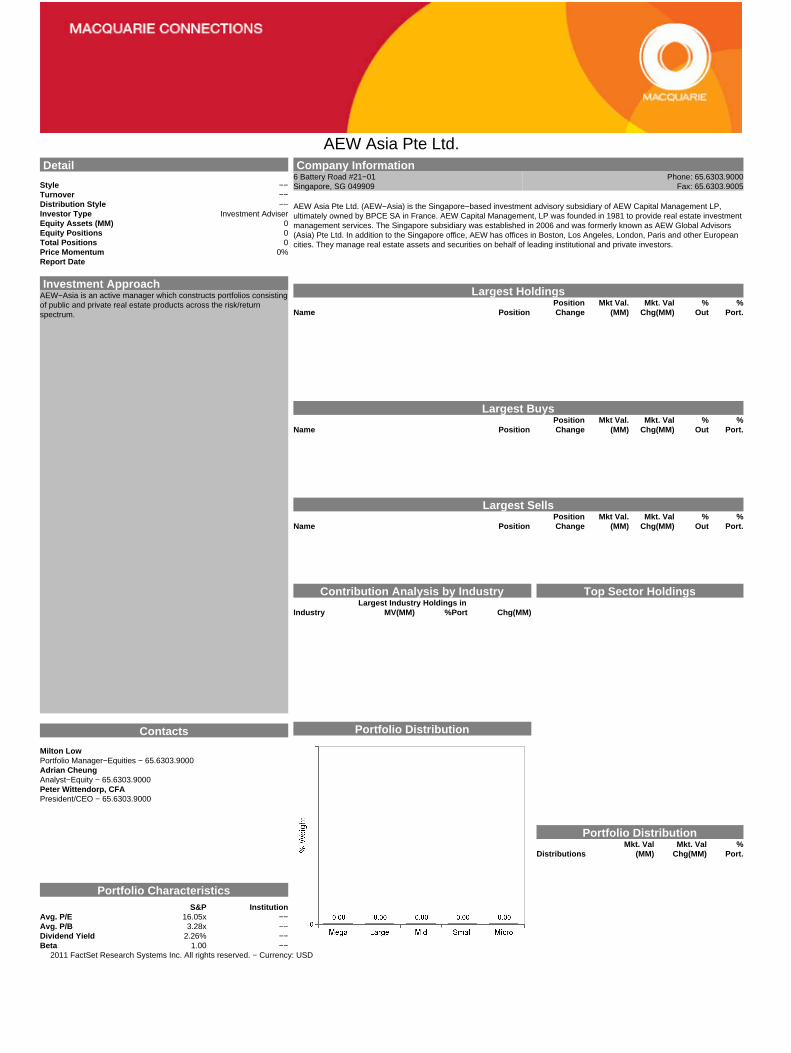
AEW Asia Pte Ltd. Detail
Style −−Turnover −−Distribution Style −−Investor Type Investment AdviserEquity Assets (MM) 0Equity Positions 0Total Positions 0Price Momentum 0%Report Date
Investment ApproachAEW−Asia is an active manager which constructs portfolios consistingof public and private real estate products across the risk/returnspectrum.
Contacts
Milton LowPortfolio Manager−Equities − 65.6303.9000Adrian CheungAnalyst−Equity − 65.6303.9000Peter Wittendorp, CFAPresident/CEO − 65.6303.9000
Portfolio CharacteristicsS&P Institution
Avg. P/E 16.05x −−Avg. P/B 3.28x −−Dividend Yield 2.26% −−Beta 1.00 −−
Company Information6 Battery Road #21−01 Phone: 65.6303.9000Singapore, SG 049909 Fax: 65.6303.9005
AEW Asia Pte Ltd. (AEW−Asia) is the Singapore−based investment advisory subsidiary of AEW Capital Management LP,ultimately owned by BPCE SA in France. AEW Capital Management, LP was founded in 1981 to provide real estate investmentmanagement services. The Singapore subsidiary was established in 2006 and was formerly known as AEW Global Advisors(Asia) Pte Ltd. In addition to the Singapore office, AEW has offices in Boston, Los Angeles, London, Paris and other Europeancities. They manage real estate assets and securities on behalf of leading institutional and private investors.
Largest Holdings
Name PositionPositionChange
Mkt Val.(MM)
Mkt. ValChg(MM)
%Out
%Port.
Largest Buys
Name PositionPositionChange
Mkt Val.(MM)
Mkt. ValChg(MM)
%Out
%Port.
Largest Sells
Name PositionPositionChange
Mkt Val.(MM)
Mkt. ValChg(MM)
%Out
%Port.
Contribution Analysis by IndustryLargest Industry Holdings in
Industry MV(MM) %Port Chg(MM)
Portfolio Distribution
Top Sector Holdings
Portfolio Distribution
DistributionsMkt. Val
(MM)Mkt. Val
Chg(MM)%
Port.
2011 FactSet Research Systems Inc. All rights reserved. − Currency: USD
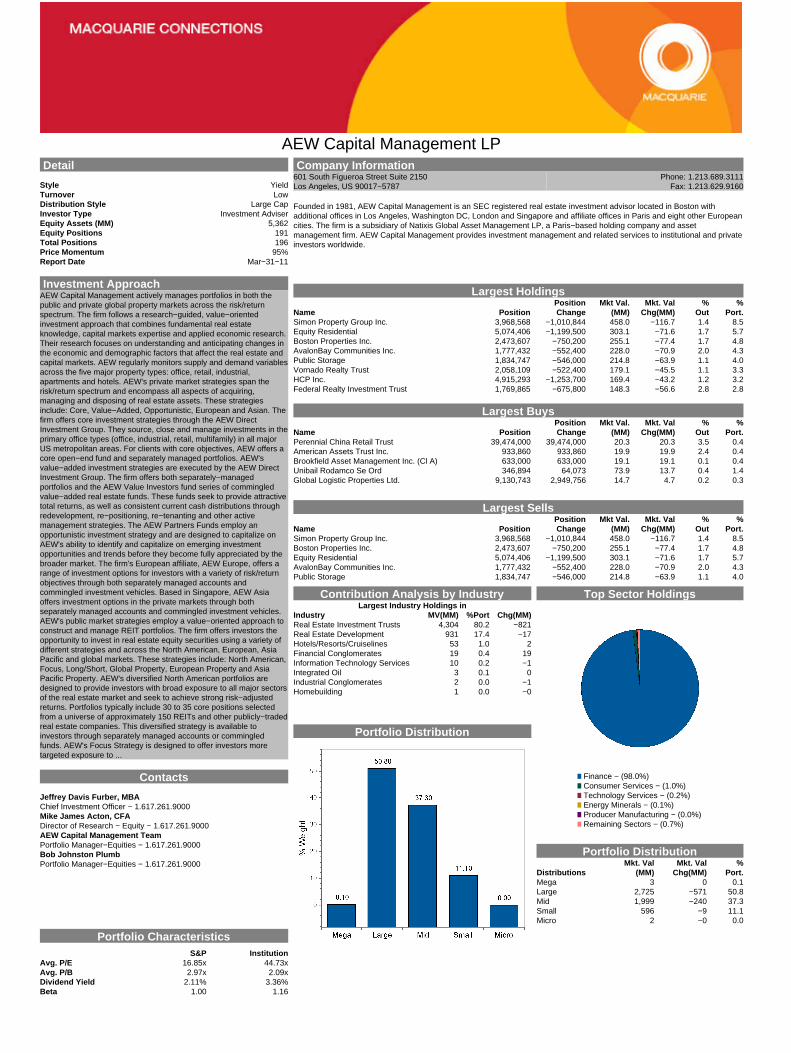
AEW Capital Management LP Detail
Style YieldTurnover LowDistribution Style Large CapInvestor Type Investment AdviserEquity Assets (MM) 5,362Equity Positions 191Total Positions 196Price Momentum 95%Report Date Mar−31−11
Investment ApproachAEW Capital Management actively manages portfolios in both thepublic and private global property markets across the risk/returnspectrum. The firm follows a research−guided, value−orientedinvestment approach that combines fundamental real estateknowledge, capital markets expertise and applied economic research.Their research focuses on understanding and anticipating changes inthe economic and demographic factors that affect the real estate andcapital markets. AEW regularly monitors supply and demand variablesacross the five major property types: office, retail, industrial,apartments and hotels. AEW's private market strategies span therisk/return spectrum and encompass all aspects of acquiring,managing and disposing of real estate assets. These strategiesinclude: Core, Value−Added, Opportunistic, European and Asian. Thefirm offers core investment strategies through the AEW DirectInvestment Group. They source, close and manage investments in theprimary office types (office, industrial, retail, multifamily) in all majorUS metropolitan areas. For clients with core objectives, AEW offers acore open−end fund and separately managed portfolios. AEW'svalue−added investment strategies are executed by the AEW DirectInvestment Group. The firm offers both separately−managedportfolios and the AEW Value Investors fund series of commingledvalue−added real estate funds. These funds seek to provide attractivetotal returns, as well as consistent current cash distributions throughredevelopment, re−positioning, re−tenanting and other activemanagement strategies. The AEW Partners Funds employ anopportunistic investment strategy and are designed to capitalize onAEW's ability to identify and capitalize on emerging investmentopportunities and trends before they become fully appreciated by thebroader market. The firm's European affiliate, AEW Europe, offers arange of investment options for investors with a variety of risk/returnobjectives through both separately managed accounts andcommingled investment vehicles. Based in Singapore, AEW Asiaoffers investment options in the private markets through bothseparately managed accounts and commingled investment vehicles.AEW's public market strategies employ a value−oriented approach toconstruct and manage REIT portfolios. The firm offers investors theopportunity to invest in real estate equity securities using a variety ofdifferent strategies and across the North American, European, AsiaPacific and global markets. These strategies include: North American,Focus, Long/Short, Global Property, European Property and AsiaPacific Property. AEW's diversified North American portfolios aredesigned to provide investors with broad exposure to all major sectorsof the real estate market and seek to achieve strong risk−adjustedreturns. Portfolios typically include 30 to 35 core positions selectedfrom a universe of approximately 150 REITs and other publicly−tradedreal estate companies. This diversified strategy is available toinvestors through separately managed accounts or commingledfunds. AEW's Focus Strategy is designed to offer investors moretargeted exposure to ...
Contacts
Jeffrey Davis Furber, MBAChief Investment Officer − 1.617.261.9000Mike James Acton, CFADirector of Research − Equity − 1.617.261.9000AEW Capital Management TeamPortfolio Manager−Equities − 1.617.261.9000Bob Johnston PlumbPortfolio Manager−Equities − 1.617.261.9000
Portfolio CharacteristicsS&P Institution
Avg. P/E 16.85x 44.73xAvg. P/B 2.97x 2.09xDividend Yield 2.11% 3.36%Beta 1.00 1.16
Company Information601 South Figueroa Street Suite 2150 Phone: 1.213.689.3111Los Angeles, US 90017−5787 Fax: 1.213.629.9160
Founded in 1981, AEW Capital Management is an SEC registered real estate investment advisor located in Boston withadditional offices in Los Angeles, Washington DC, London and Singapore and affiliate offices in Paris and eight other Europeancities. The firm is a subsidiary of Natixis Global Asset Management LP, a Paris−based holding company and assetmanagement firm. AEW Capital Management provides investment management and related services to institutional and privateinvestors worldwide.
Largest Holdings
Name PositionPositionChange
Mkt Val.(MM)
Mkt. ValChg(MM)
%Out
%Port.
Simon Property Group Inc. 3,968,568 −1,010,844 458.0 −116.7 1.4 8.5Equity Residential 5,074,406 −1,199,500 303.1 −71.6 1.7 5.7Boston Properties Inc. 2,473,607 −750,200 255.1 −77.4 1.7 4.8AvalonBay Communities Inc. 1,777,432 −552,400 228.0 −70.9 2.0 4.3Public Storage 1,834,747 −546,000 214.8 −63.9 1.1 4.0Vornado Realty Trust 2,058,109 −522,400 179.1 −45.5 1.1 3.3HCP Inc. 4,915,293 −1,253,700 169.4 −43.2 1.2 3.2Federal Realty Investment Trust 1,769,865 −675,800 148.3 −56.6 2.8 2.8
Largest Buys
Name PositionPositionChange
Mkt Val.(MM)
Mkt. ValChg(MM)
%Out
%Port.
Perennial China Retail Trust 39,474,000 39,474,000 20.3 20.3 3.5 0.4American Assets Trust Inc. 933,860 933,860 19.9 19.9 2.4 0.4Brookfield Asset Management Inc. (Cl A) 633,000 633,000 19.1 19.1 0.1 0.4Unibail Rodamco Se Ord 346,894 64,073 73.9 13.7 0.4 1.4Global Logistic Properties Ltd. 9,130,743 2,949,756 14.7 4.7 0.2 0.3
Largest Sells
Name PositionPositionChange
Mkt Val.(MM)
Mkt. ValChg(MM)
%Out
%Port.
Simon Property Group Inc. 3,968,568 −1,010,844 458.0 −116.7 1.4 8.5Boston Properties Inc. 2,473,607 −750,200 255.1 −77.4 1.7 4.8Equity Residential 5,074,406 −1,199,500 303.1 −71.6 1.7 5.7AvalonBay Communities Inc. 1,777,432 −552,400 228.0 −70.9 2.0 4.3Public Storage 1,834,747 −546,000 214.8 −63.9 1.1 4.0
Contribution Analysis by IndustryLargest Industry Holdings in
Industry MV(MM) %Port Chg(MM)Real Estate Investment Trusts 4,304 80.2 −821Real Estate Development 931 17.4 −17Hotels/Resorts/Cruiselines 53 1.0 2Financial Conglomerates 19 0.4 19Information Technology Services 10 0.2 −1Integrated Oil 3 0.1 0Industrial Conglomerates 2 0.0 −1Homebuilding 1 0.0 −0
Portfolio Distribution
Top Sector Holdings
Finance − (98.0%)Consumer Services − (1.0%)Technology Services − (0.2%)Energy Minerals − (0.1%)Producer Manufacturing − (0.0%)Remaining Sectors − (0.7%)
Portfolio Distribution
DistributionsMkt. Val
(MM)Mkt. Val
Chg(MM)%
Port.Mega 3 0 0.1Large 2,725 −571 50.8Mid 1,999 −240 37.3Small 596 −9 11.1Micro 2 −0 0.0

Alcor Investment Management Pte Ltd. Detail
Style −−Turnover −−Distribution Style −−Investor Type Investment AdviserEquity Assets (MM) 0Equity Positions 0Total Positions 0Price Momentum 0%Report Date
Investment ApproachAlcor is an active manager which aims to achieve absolute returns byinvesting in long and short−term equities in Asia. The firm employs abottom−up stock picking approach based on fundamental research,including company meetings and robust valuation methodology tomake investments. They utilize strong risk control, aiming to ensurecapital preservation and low volatility.
Contacts
James ColeChief Investment Officer − 65.6512.2300
Portfolio CharacteristicsS&P Institution
Avg. P/E 17.60x −−Avg. P/B 3.10x −−Dividend Yield 2.03% −−Beta 1.00 −−
Company Information80 Raffles Place Phone: 65.6512.2300Singapore, SG 048624 Fax:
Alcor Investment Management Pte Ltd. (Alcor) is the Singapore−based alternative investment management subsidiary of CLSACapital Partners, the alternative asset management subsidiary of CLSA Asia−Pacific Markets, ultimately owned by CreditAgricole SA (ACA) in France. Established in 2004, the firm manages long and short−term Asian equity investments.
Largest Holdings
Name PositionPositionChange
Mkt Val.(MM)
Mkt. ValChg(MM)
%Out
%Port.
Largest Buys
Name PositionPositionChange
Mkt Val.(MM)
Mkt. ValChg(MM)
%Out
%Port.
Largest Sells
Name PositionPositionChange
Mkt Val.(MM)
Mkt. ValChg(MM)
%Out
%Port.
Contribution Analysis by IndustryLargest Industry Holdings in
Industry MV(MM) %Port Chg(MM)
Portfolio Distribution
Top Sector Holdings
Portfolio Distribution
DistributionsMkt. Val
(MM)Mkt. Val
Chg(MM)%
Port.
2011 FactSet Research Systems Inc. All rights reserved. − Currency: USD

Athenaeum Ltd. Detail
Style −−Turnover −−Distribution Style −−Investor Type Hedge Fund CompanyEquity Assets (MM) 0Equity Positions 0Total Positions 0Price Momentum 0%Report Date
Investment ApproachAthenaeum is an active manager which adopts a long−only equitystrategy with bottom−up stock selection and a top−down macrooverlay as the basis for their investments. The firm invests throughtheir Athenaeum Asian Equities Fund in a concentrated portfolio ofstocks with a horizon of about three to five years. When they selectholdings for the fund, they seek to maintain a balance of value andgrowth parameters. Athenaeum's core philosophy is to findwell−managed companies in Asia with strong and improving return onequity parameters. This focuses them on both the underlying assetvalue of the companies, as well as the companies' utilization of theseassets (and leverage) to secure a strong stream of future cashearnings.
Contacts
Madeleine LeeChief Investment Officer − 65.6327.7595Ena SuPortfolio Manager−Equities − 65.6327.7595Lay Keong Tan, CFAPortfolio Manager−Equities − 65.6327.7595
Portfolio CharacteristicsS&P Institution
Avg. P/E 15.18x −−Avg. P/B 3.18x −−Dividend Yield 2.37% −−Beta 1.00 −−
Company Information50 Raffles Place #33−06 Singapore Land Tower Phone: 65.6327.7595Singapore, SG 048623 Fax: 65.6327.7596
Athenaeum Ltd. (Athenaeum) is the Singapore alternative investment management subsidiary of US−based Athenaeum CapitalPartners. Founded by Madeleine Lee in 1999, the firm provides advising services for a range of clients including family offices,endowments, foundations and high−net worth individuals. Due to increased interest in total return investment vehicles focusingon Asia, the firm decided to create an investment trust structure and commingled segregated high−net worth advisory accountspreviously managed by Athenaeum Pte Ltd into the Athenaeum Asian Equities Fund, a Singapore−registered Designated UnitTrust focused on Asia.
Largest Holdings
Name PositionPositionChange
Mkt Val.(MM)
Mkt. ValChg(MM)
%Out
%Port.
Largest Buys
Name PositionPositionChange
Mkt Val.(MM)
Mkt. ValChg(MM)
%Out
%Port.
Largest Sells
Name PositionPositionChange
Mkt Val.(MM)
Mkt. ValChg(MM)
%Out
%Port.
Contribution Analysis by IndustryLargest Industry Holdings in
Industry MV(MM) %Port Chg(MM)
Portfolio Distribution
Top Sector Holdings
Portfolio Distribution
DistributionsMkt. Val
(MM)Mkt. Val
Chg(MM)%
Port.
2011 FactSet Research Systems Inc. All rights reserved. − Currency: USD
Aviva Investors Global Services Ltd. Detail
Style GARPTurnover LowDistribution Style Large CapInvestor Type Insurance Management DivisionEquity Assets (MM) 34,385Equity Positions 3,407Total Positions 3,495Price Momentum 98%Report Date Mar−31−11
Investment ApproachAIGSL is an active, research−oriented manager which invests in allmajor asset classes including equity, fixed−income and cash. Theyalso have expertise in SRI and alternative investments. The firmmanages equity funds and fixed−income funds, following long−onlyand hedged strategies. They specialize in UK−related markets, and asthe head office of AIGS coordinate asset management activitiesworldwide. AIGSL shares research globally throughout AIGSdivisions. They employ a bottom−up investment process based onfundamental financial analysis and valuation, and informed bytop−down macro−economic research. They select stock by focusingon favorable industry sectors and utilize a dividend discount model.Determinant criteria include return on assets, price−to−book ratio anda low historical price−to−earnings ratio.
Contacts
Adrian JarvisChief Investment Officer − 44.20.7809.6000Andrew C. AppleyardHead−Equity Investments − 44.20.7809.6000David G. LisHead−Equity Investments − 44.20.7809.6000John BothamHead−Equity Investments − 44.20.7809.6000
Portfolio CharacteristicsS&P Institution
Avg. P/E 16.85x 16.23xAvg. P/B 2.97x 2.95xDividend Yield 2.11% 2.94%Beta 1.00 0.64
Company Information1 Poultry Phone: 44.20.7809.6000London, GB EC2R 8EJ Fax: 44.20.7489.7940
Aviva Investors Global Services Ltd. (AIGSL) is the wholly−owned asset management subsidiary of Aviva plc (LSE: AV) inGreat Britain. Previously known as Morley Fund Management Ltd., the firm was established in 1971, merged with NorwichUnion Investment Management Ltd. in 2000 and underwent restructuring in 2008. AIGSL is the main office of AIGS−AvivaInvestors Global Services. Other offices are located worldwide in Luxembourg, France, Germany, Ireland, Italy, Spain, Poland,Romania, the US, Canada, Singapore, China and Australia. The firm manages an extensive range of institutional and retailfunds, which are distributed within the UK under the Norwich Union brand and throughout Europe under the Aviva Investorsname.
Largest Holdings
Name PositionPositionChange
Mkt Val.(MM)
Mkt. ValChg(MM)
%Out
%Port.
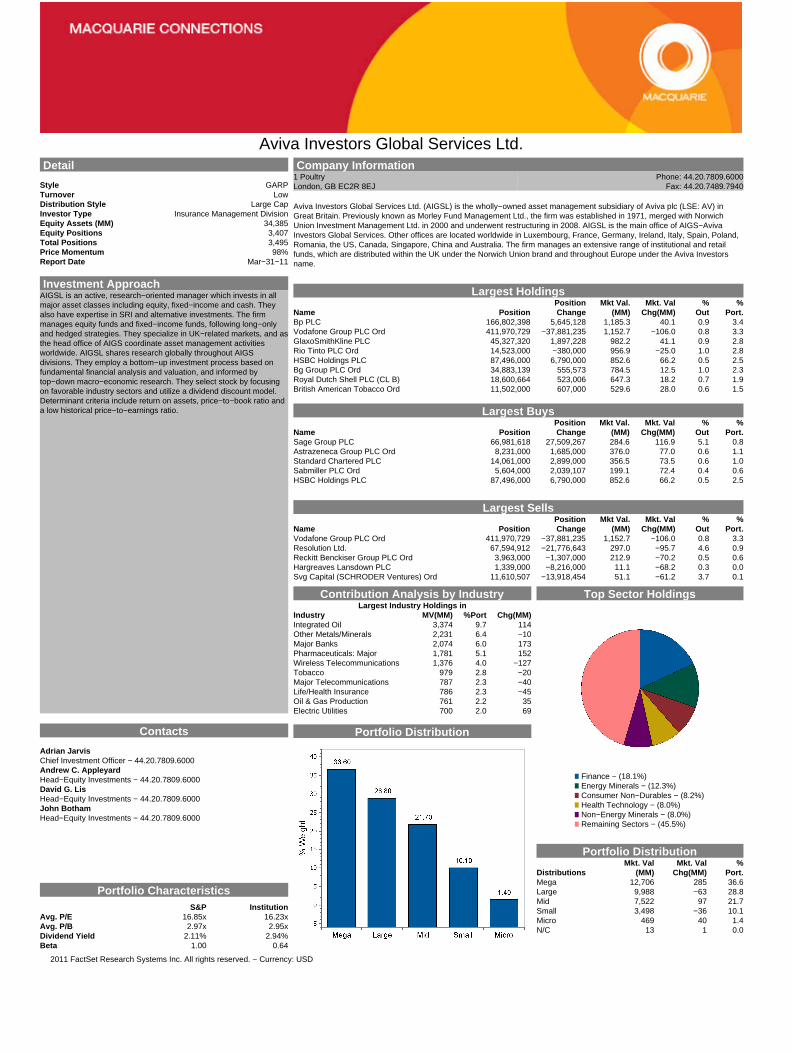
Bp PLC 166,802,398 5,645,128 1,185.3 40.1 0.9 3.4Vodafone Group PLC Ord 411,970,729 −37,881,235 1,152.7 −106.0 0.8 3.3GlaxoSmithKline PLC 45,327,320 1,897,228 982.2 41.1 0.9 2.8Rio Tinto PLC Ord 14,523,000 −380,000 956.9 −25.0 1.0 2.8HSBC Holdings PLC 87,496,000 6,790,000 852.6 66.2 0.5 2.5Bg Group PLC Ord 34,883,139 555,573 784.5 12.5 1.0 2.3Royal Dutch Shell PLC (CL B) 18,600,664 523,006 647.3 18.2 0.7 1.9British American Tobacco Ord 11,502,000 607,000 529.6 28.0 0.6 1.5
Largest Buys
Name PositionPositionChange
Mkt Val.(MM)
Mkt. ValChg(MM)
%Out
%Port.
Sage Group PLC 66,981,618 27,509,267 284.6 116.9 5.1 0.8Astrazeneca Group PLC Ord 8,231,000 1,685,000 376.0 77.0 0.6 1.1Standard Chartered PLC 14,061,000 2,899,000 356.5 73.5 0.6 1.0Sabmiller PLC Ord 5,604,000 2,039,107 199.1 72.4 0.4 0.6HSBC Holdings PLC 87,496,000 6,790,000 852.6 66.2 0.5 2.5
Largest Sells
Name PositionPositionChange
Mkt Val.(MM)
Mkt. ValChg(MM)
%Out
%Port.
Vodafone Group PLC Ord 411,970,729 −37,881,235 1,152.7 −106.0 0.8 3.3Resolution Ltd. 67,594,912 −21,776,643 297.0 −95.7 4.6 0.9Reckitt Benckiser Group PLC Ord 3,963,000 −1,307,000 212.9 −70.2 0.5 0.6Hargreaves Lansdown PLC 1,339,000 −8,216,000 11.1 −68.2 0.3 0.0Svg Capital (SCHRODER Ventures) Ord 11,610,507 −13,918,454 51.1 −61.2 3.7 0.1
Contribution Analysis by IndustryLargest Industry Holdings in
Industry MV(MM) %Port Chg(MM)Integrated Oil 3,374 9.7 114Other Metals/Minerals 2,231 6.4 −10Major Banks 2,074 6.0 173Pharmaceuticals: Major 1,781 5.1 152Wireless Telecommunications 1,376 4.0 −127Tobacco 979 2.8 −20Major Telecommunications 787 2.3 −40Life/Health Insurance 786 2.3 −45Oil & Gas Production 761 2.2 35Electric Utilities 700 2.0 69
Portfolio Distribution
Top Sector Holdings
Finance − (18.1%)Energy Minerals − (12.3%)Consumer Non−Durables − (8.2%)Health Technology − (8.0%)Non−Energy Minerals − (8.0%)Remaining Sectors − (45.5%)
Portfolio Distribution
DistributionsMkt. Val
(MM)Mkt. Val
Chg(MM)%
Port.Mega 12,706 285 36.6Large 9,988 −63 28.8Mid 7,522 97 21.7Small 3,498 −36 10.1Micro 469 40 1.4N/C 13 1 0.0
2011 FactSet Research Systems Inc. All rights reserved. − Currency: USD
Detail Company InformationLevel 1, 160 Mount Pleasant Road Phone: 65.6651.8294
Style -- Singapore 298351 Fax: 65.6236.4399Turnover --Distribution Stule --Investor TypeEquity Assets ($MM) 0Equity Positions 0Total Positions 0Price Momentum 0%Report Date
Investment ApproachLargest Holdings
Position Mkt Val. Pos Chg % %Name Position Change ($MM) MV($MM) Out Port.
Largest BuysPosition Mkt Val. Pos Chg % %
Name Position Change ($MM) MV($MM) Out Port.
Largest SellsPosition Mkt Val. Pos Chg % %
Name Position Change ($MM) MV($MM) Out Port.
Contribution Analysis by Industry Top Sector HoldingsLargest Industry Holdings
Industry MV ($MM) % Port $ Chg
Contacts Portfolio Distribution
Portfolio Characteristics
S&P InstitutionAvg. P/EAvg. P/BDividend YieldBeta
Barrenjoey Capital is a capacity constrained, highly concentrated, high conviction fund focusing on the emerging resources sector. The investment objective of the fund is to deliver significant capital appreciation through an actively managed portfolio of companies with an asymmetric risk profile. The fund is based in Singapore and has an investment horizon is 12-24mths.
Barrenjoey Capital
0.0
0.2
0.4
0.6
0.8
1.0
1.2
© 2006-2007 FactSet Research Systems Inc. All rights reserved.
Blackrock (Singapore) Ltd. Detail
Style Aggressive GrowthTurnover N/ADistribution Style Large CapInvestor Type Investment AdviserEquity Assets (MM) 782Equity Positions 88Total Positions 88Price Momentum 95%Report Date Jun−30−11
Investment ApproachBlackRock−Singapore aligns their investment approach with thegroup. They seek to combine their market insights along with theirworldwide presence and scale to deliver a wide range of investmentsolutions. They draw on their proprietary technology, informationsharing and focus on risk management to shape their investmentstrategies. The firm employs a disciplined process and analytical toolsto construct portfolios from a variety of investment products acrossasset classes, capitalizations, styles and geographies. Portfolios aredesigned to be neutral in terms of investment style with no unintendedbias to value or growth factors. Market risk management is central totheir investment management process.
Contacts
Clarence ChanPortfolio Manager−Equities − 65.6411.3000Alasdair RiachPresident/CEO − 65.6411.3000
Portfolio CharacteristicsS&P Institution
Avg. P/E 17.60x 19.26xAvg. P/B 3.10x 4.20xDividend Yield 2.03% 1.40%Beta 1.00 0.75
Company Information20 Anson Road #18−01 Twenty Anson Phone: 65.6411.3000Singapore, SG 079912 Fax: 65.6411.3051
Blackrock (Singapore) Ltd. (BlackRock−Singapore) is the Singapore investment management subsidiary of US−basedBlackRock, Inc. (NYSE: BLK), which merged with Barclays Global Investors (BGI) in 2009. The combined firm operates underthe BlackRock name. BlackRock−Singapore offers investment management services in every major asset class includingequity, property, fixed−income and alternative investments. Their clients include private and institutional investors, retail clientsand financial institutions.
Largest Holdings
Name PositionPositionChange
Mkt Val.(MM)
Mkt. ValChg(MM)
%Out
%Port.
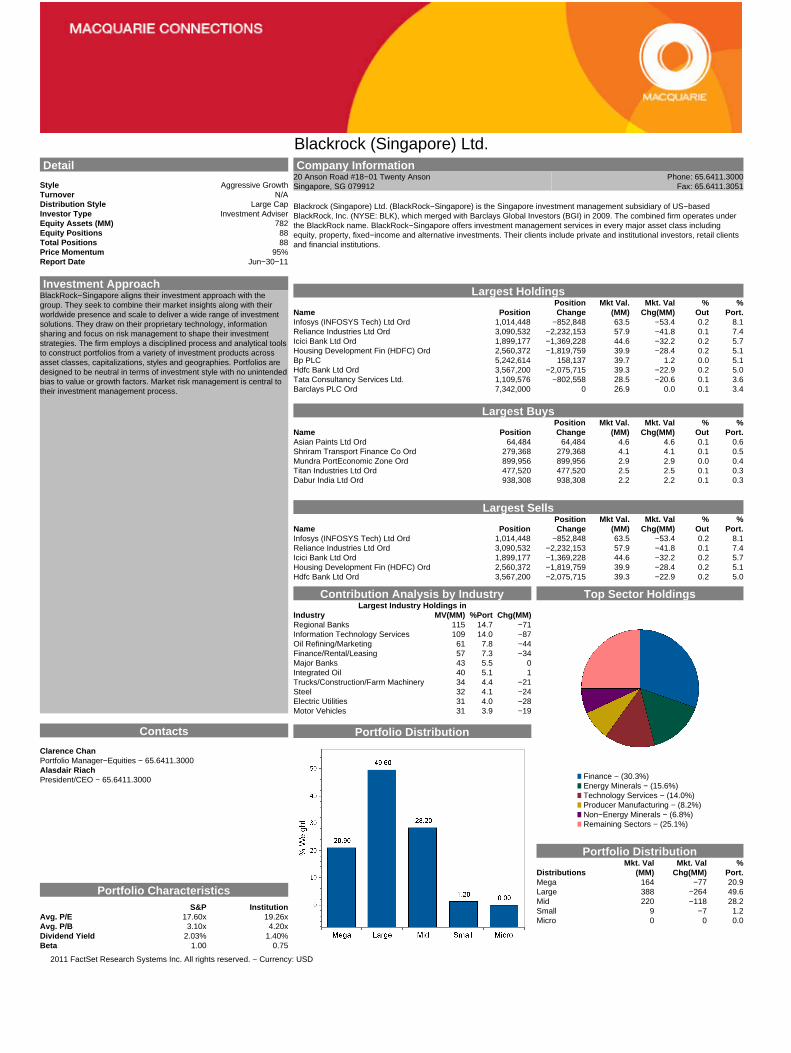
Infosys (INFOSYS Tech) Ltd Ord 1,014,448 −852,848 63.5 −53.4 0.2 8.1Reliance Industries Ltd Ord 3,090,532 −2,232,153 57.9 −41.8 0.1 7.4Icici Bank Ltd Ord 1,899,177 −1,369,228 44.6 −32.2 0.2 5.7Housing Development Fin (HDFC) Ord 2,560,372 −1,819,759 39.9 −28.4 0.2 5.1Bp PLC 5,242,614 158,137 39.7 1.2 0.0 5.1Hdfc Bank Ltd Ord 3,567,200 −2,075,715 39.3 −22.9 0.2 5.0Tata Consultancy Services Ltd. 1,109,576 −802,558 28.5 −20.6 0.1 3.6Barclays PLC Ord 7,342,000 0 26.9 0.0 0.1 3.4
Largest Buys
Name PositionPositionChange
Mkt Val.(MM)
Mkt. ValChg(MM)
%Out
%Port.
Asian Paints Ltd Ord 64,484 64,484 4.6 4.6 0.1 0.6Shriram Transport Finance Co Ord 279,368 279,368 4.1 4.1 0.1 0.5Mundra PortEconomic Zone Ord 899,956 899,956 2.9 2.9 0.0 0.4Titan Industries Ltd Ord 477,520 477,520 2.5 2.5 0.1 0.3Dabur India Ltd Ord 938,308 938,308 2.2 2.2 0.1 0.3
Largest Sells
Name PositionPositionChange
Mkt Val.(MM)
Mkt. ValChg(MM)
%Out
%Port.
Infosys (INFOSYS Tech) Ltd Ord 1,014,448 −852,848 63.5 −53.4 0.2 8.1Reliance Industries Ltd Ord 3,090,532 −2,232,153 57.9 −41.8 0.1 7.4Icici Bank Ltd Ord 1,899,177 −1,369,228 44.6 −32.2 0.2 5.7Housing Development Fin (HDFC) Ord 2,560,372 −1,819,759 39.9 −28.4 0.2 5.1Hdfc Bank Ltd Ord 3,567,200 −2,075,715 39.3 −22.9 0.2 5.0
Contribution Analysis by IndustryLargest Industry Holdings in
Industry MV(MM) %Port Chg(MM)Regional Banks 115 14.7 −71Information Technology Services 109 14.0 −87Oil Refining/Marketing 61 7.8 −44Finance/Rental/Leasing 57 7.3 −34Major Banks 43 5.5 0Integrated Oil 40 5.1 1Trucks/Construction/Farm Machinery 34 4.4 −21Steel 32 4.1 −24Electric Utilities 31 4.0 −28Motor Vehicles 31 3.9 −19
Portfolio Distribution
Top Sector Holdings
Finance − (30.3%)Energy Minerals − (15.6%)Technology Services − (14.0%)Producer Manufacturing − (8.2%)Non−Energy Minerals − (6.8%)Remaining Sectors − (25.1%)
Portfolio Distribution
DistributionsMkt. Val
(MM)Mkt. Val
Chg(MM)%
Port.Mega 164 −77 20.9Large 388 −264 49.6Mid 220 −118 28.2Small 9 −7 1.2Micro 0 0 0.0
2011 FactSet Research Systems Inc. All rights reserved. − Currency: USD

Broad Peak Investment Advisers Pte Ltd. Detail
Style Deep ValueTurnover N/ADistribution Style Small CapInvestor Type Hedge Fund CompanyEquity Assets (MM) 23Equity Positions 1Total Positions 1Price Momentum 88%Report Date Jun−30−10
Investment ApproachBroad Peak is an active, long−term, value−oriented manager whichutilizes fundamental analysis to invest through their fund in aconcentrated portfolio of value−focused investments. The firmemploys a multi−strategy, event−driven approach. Their geographicfocus is pan−Asia including Japan.
Contacts
Hyder AhmadChief Investment Officer − 65.6372.5505Chetan ShettyPortfolio Manager−Equities − 65.6372.5505Mike WyrillPortfolio Manager−Equities − 65.6372.5505Nitin SibalPortfolio Manager−Equities − 65.6372.5505
Portfolio CharacteristicsS&P Institution
Avg. P/E 17.60x 6.77xAvg. P/B 3.10x 0.62xDividend Yield 2.03% 0.00%Beta 1.00 1.00
Company Information3 Temasek Avenue #26−02 Centennial Tower Phone: 65.6372.5505Singapore, SG 039190 Fax: 65.6372.5502
Broad Peak Investment Advisers Pte Ltd. (Broad Peak) is an independent Singapore−based alternative investmentmanagement firm which founded by Hyder Ahmad in 2007. The firm manages the Broad Peak Master Fund which focuses onvalue investments in Asia.
Largest Holdings
Name PositionPositionChange
Mkt Val.(MM)
Mkt. ValChg(MM)
%Out
%Port.
Housing Development &Infrastructure Ltd. 7,268,199 7,268,199 23.4 23.4 1.8 100.0
Largest Buys
Name PositionPositionChange
Mkt Val.(MM)
Mkt. ValChg(MM)
%Out
%Port.
Housing Development &Infrastructure Ltd. 7,268,199 7,268,199 23.4 23.4 1.8 100.0
Largest Sells
Name PositionPositionChange
Mkt Val.(MM)
Mkt. ValChg(MM)
%Out
%Port.
Contribution Analysis by IndustryLargest Industry Holdings in
Industry MV(MM) %Port Chg(MM)Real Estate Development 23 100.0 23
Portfolio Distribution
Top Sector Holdings
Finance − (100.0%)
Portfolio Distribution
DistributionsMkt. Val
(MM)Mkt. Val
Chg(MM)%
Port.Small 23 23 100.0
2011 FactSet Research Systems Inc. All rights reserved. − Currency: USD
Capital International Research & Management, Inc. (Singapore) Detail
Style ValueTurnover N/ADistribution Style Large CapInvestor Type Investment AdviserEquity Assets (MM) 289Equity Positions 427Total Positions 429Price Momentum 87%Report Date Dec−31−10
Investment ApproachCIRM−SG is an active manager which follows a bottom−upinvestment approach based on fundamental research primarilyperformed in−house, with regular contacts with senior companymanagement as the cornerstone. Their investment style isGARP−oriented with a long−term outlook. They accommodate thespecific socially responsible investment preferences of their clients.The firm focuses on emerging economies in the Asia Pacific region,and pays specific attentions to countries such as Vietnam, China andThailand. They have particular expertise in the non−renewable energysector. They aim to build diversified portfolios and emphasizeindividual stock selection as the most critical factor in their investmentprocess. Investment ideas are subjected to strong devil's advocacy.CIRM−SG analyzes company's stock prices relative to the underlyingvalue and expected earnings growth. Their time frame for valuation isthree to five years. Aggregate portfolio structure results from individualstock selection by autonomous portfolio managers rather thanpredetermined orientation, however macroeconomic and currencyfactors are taken into account.
Contacts
Christopher Choe, CPAPortfolio Manager−Equities − 65.6535.3777Claire Cui, MBAPortfolio Manager−Equities − 65.6535.3777Corrina LimPortfolio Manager−Equities − 65.6535.3777
Portfolio CharacteristicsS&P Institution
Avg. P/E 15.18x 16.68xAvg. P/B 3.18x 2.48xDividend Yield 2.37% 2.48%Beta 1.00 0.60
Company Information1 Raffles Quay #33−00 North Tower Phone: 65.6535.3777Singapore, SG 048583 Fax: 65.6533.2180
Capital International Research & Management, Inc. (Singapore) (CIRM−SG) is the wholly−owned Singapore subsidiary ofUS−based The Capital Group Cos., Inc., a privately−owned holding company based in California which was established in1931 by Jonathan Bell Lovelace. The Capital Group Cos., Inc. specializes in global investment management for corporations,private individuals and institutions including foundations and endowments. In addition to SIngapore, they have offices in the US,Canada, Geneva, London, Tokyo, Hong Kong and Mumbai. CIRM−SG was established in 1989. They are an autonomousregional investment team which shares research with the Capital Group's affiliates through centralized databases.
Largest Holdings
Name PositionPositionChange
Mkt Val.(MM)
Mkt. ValChg(MM)
%Out
%Port.
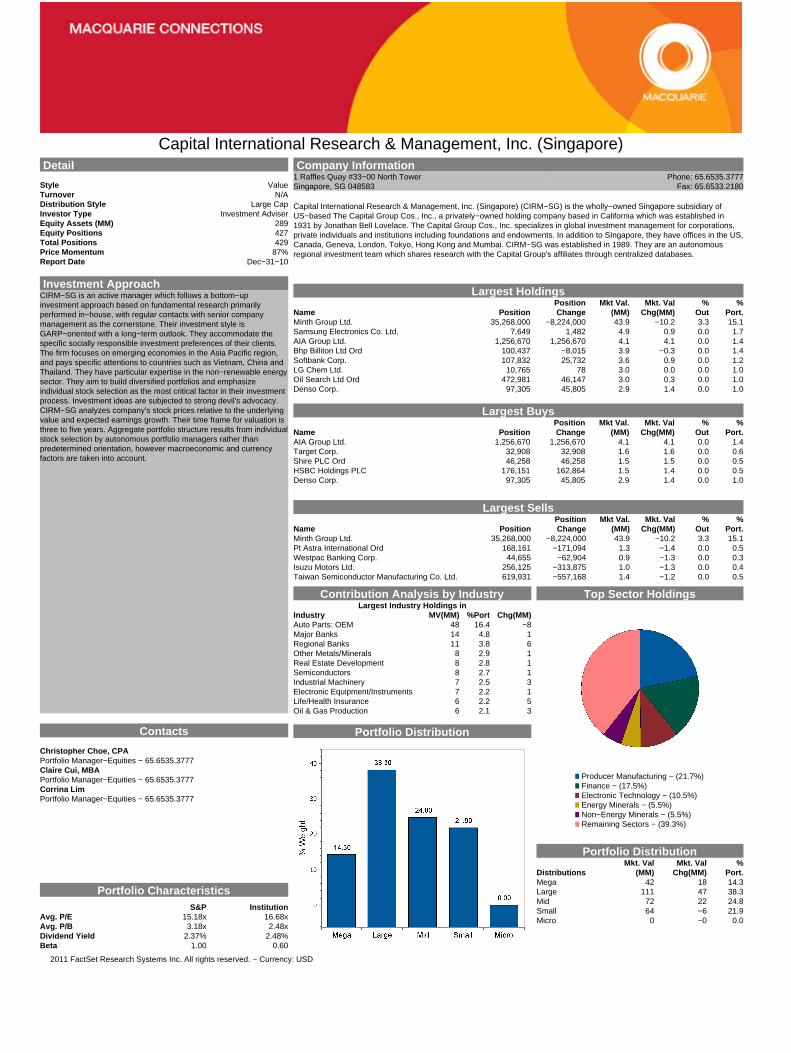
Minth Group Ltd. 35,268,000 −8,224,000 43.9 −10.2 3.3 15.1Samsung Electronics Co. Ltd. 7,649 1,482 4.9 0.9 0.0 1.7AIA Group Ltd. 1,256,670 1,256,670 4.1 4.1 0.0 1.4Bhp Billiton Ltd Ord 100,437 −8,015 3.9 −0.3 0.0 1.4Softbank Corp. 107,832 25,732 3.6 0.9 0.0 1.2LG Chem Ltd. 10,765 78 3.0 0.0 0.0 1.0Oil Search Ltd Ord 472,981 46,147 3.0 0.3 0.0 1.0Denso Corp. 97,305 45,805 2.9 1.4 0.0 1.0
Largest Buys
Name PositionPositionChange
Mkt Val.(MM)
Mkt. ValChg(MM)
%Out
%Port.
AIA Group Ltd. 1,256,670 1,256,670 4.1 4.1 0.0 1.4Target Corp. 32,908 32,908 1.6 1.6 0.0 0.6Shire PLC Ord 46,258 46,258 1.5 1.5 0.0 0.5HSBC Holdings PLC 176,151 162,864 1.5 1.4 0.0 0.5Denso Corp. 97,305 45,805 2.9 1.4 0.0 1.0
Largest Sells
Name PositionPositionChange
Mkt Val.(MM)
Mkt. ValChg(MM)
%Out
%Port.
Minth Group Ltd. 35,268,000 −8,224,000 43.9 −10.2 3.3 15.1Pt Astra International Ord 168,161 −171,094 1.3 −1.4 0.0 0.5Westpac Banking Corp. 44,655 −62,904 0.9 −1.3 0.0 0.3Isuzu Motors Ltd. 256,125 −313,875 1.0 −1.3 0.0 0.4Taiwan Semiconductor Manufacturing Co. Ltd. 619,931 −557,168 1.4 −1.2 0.0 0.5
Contribution Analysis by IndustryLargest Industry Holdings in
Industry MV(MM) %Port Chg(MM)Auto Parts: OEM 48 16.4 −8Major Banks 14 4.8 1Regional Banks 11 3.8 6Other Metals/Minerals 8 2.9 1Real Estate Development 8 2.8 1Semiconductors 8 2.7 1Industrial Machinery 7 2.5 3Electronic Equipment/Instruments 7 2.2 1Life/Health Insurance 6 2.2 5Oil & Gas Production 6 2.1 3
Portfolio Distribution
Top Sector Holdings
Producer Manufacturing − (21.7%)Finance − (17.5%)Electronic Technology − (10.5%)Energy Minerals − (5.5%)Non−Energy Minerals − (5.5%)Remaining Sectors − (39.3%)
Portfolio Distribution
DistributionsMkt. Val
(MM)Mkt. Val
Chg(MM)%
Port.Mega 42 18 14.3Large 111 47 38.3Mid 72 22 24.8Small 64 −6 21.9Micro 0 −0 0.0
2011 FactSet Research Systems Inc. All rights reserved. − Currency: USD

Coupland Cardiff Asset Management LLP Detail
Style −−Turnover −−Distribution Style −−Investor Type Hedge Fund CompanyEquity Assets (MM) 0Equity Positions 0Total Positions 0Price Momentum 0%Report Date
Investment ApproachCCAM follows an investment approach tailored for Asian markets,based on a disciplined bottom−up fundamental research drivenprocess. They follow primarily an equity long/short strategy. The firminvests throughout Asia with a specific focus on Japan where theyfollow a high−conviction investment approach while retainingdownside protection. CCAM aims to manage style− and marketcap−agnostic portfolios. They diversify their investments acrossseveral themes including long/short large cap companies with along−term industry advantage or a monopolistic position, shorter−termcatalyst−driven opportunities, and under−researched small tomid−cap companies in which they invest long only. Investment ideasare generated through quantitative screening, companyannouncements and proprietary regional research complemented byfrequent company contacts. Risk management includes settingliquidity limits for new positions, setting country limits, position sizingbased on volatility and liquidity, checking information accuracythoroughly, and using index futures only to hedge large−cap risk.
Contacts
Angus H. CouplandChief Investment Officer − 44.20.7321.3489Charles DuttonPortfolio Manager−Equities − 44.20.7321.3489Jonathan S. DobsonPortfolio Manager−Equities − 44.20.7321.3489Richard CardiffPresident/CEO − 44.20.7321.3489
Portfolio CharacteristicsS&P Institution
Avg. P/E 17.60x −−Avg. P/B 3.10x −−Dividend Yield 2.03% −−Beta 1.00 −−
Company Information31−32 St. James's Place Phone: 44.20.7321.3489London, GB SW1A 1HD Fax: 44.20.7321.3471
Coupland Cardiff Asset Management LLP (CCAM) is an independent alternative investment firm specialized in Asian fundmanagement. Established in 2004 and based in London, the firm provides investment management services to institutions,family offices and private banks across the Asia Pacific region. CCAM manages hedge funds focused on Asia, includingIreland−listed funds and country−specific portfolios.
Largest Holdings
Name PositionPositionChange
Mkt Val.(MM)
Mkt. ValChg(MM)
%Out
%Port.
Largest Buys
Name PositionPositionChange
Mkt Val.(MM)
Mkt. ValChg(MM)
%Out
%Port.
Largest Sells
Name PositionPositionChange
Mkt Val.(MM)
Mkt. ValChg(MM)
%Out
%Port.
Contribution Analysis by IndustryLargest Industry Holdings in
Industry MV(MM) %Port Chg(MM)
Portfolio Distribution
Top Sector Holdings
Portfolio Distribution
DistributionsMkt. Val
(MM)Mkt. Val
Chg(MM)%
Port.
2011 FactSet Research Systems Inc. All rights reserved. − Currency: USD
CIMB Research Pte Ltd. Detail
Style −−Turnover −−Distribution Style −−Investor Type BrokerEquity Assets (MM) 0Equity Positions 0Total Positions 0Price Momentum 0%Report Date
Investment ApproachCIMB−Research provides fundamental research supporting theinvestment activities of the parent group, a bottom−up investmentspecialist. Equity research covers sectors and listed companies inMalaysia, Singapore, Indonesia, Thailand and Hong Kong. Economicresearch covers China as well, and encompasses micro−, sectoral−and macro−level issues. Fixed−income research covers bonds inMalaysia and Indonesia as well as Singapore and Hong−Kong, andprovides commentaries on US−treasuries and Asian debtdenominated in US dollars. The firm's analysis teams research majorindustry sectors on a Pan−Asian basis, particularly the technology,consumer, transportation, telceommunications and gaming sectors.They maintain in−depth fundamental knowledge of the stocks of largeestablished companies, while researching innovative growth andspecial situations investment opportunities through an active companyvisitation program.
Contacts
Seng Wun SongDirector of Research − Equity − 65.6225.1228Choon Seng Ho, CFAAnalyst−Equity − 65.6225.1228Daniel LauAnalyst−Equity − 65.6225.1228Donald ChuaAnalyst−Equity − 65.6225.1228
Portfolio CharacteristicsS&P Institution
Avg. P/E 17.60x −−Avg. P/B 3.10x −−Dividend Yield 2.03% −−Beta 1.00 −−
Company Information50 Raffles Place #19−00 Singapore Land Tower Phone: 65.6225.1228Singapore, SG 048623 Fax: 65.6224.6906
CIMB Research Pte Ltd. (CIMB−Research) is the Singapore−based research subsidiary of CIMB Bank Bhd., ultimately ownedby CIMB Group Holdings Bhd. (KL: 1023) in Malaysia. The firm was formerly known as G. K. Goh Research, established inSingapore in the 1980s. The CIMB−GK group consists of several firms (including CIMB−Research) operating in closerelationship to provide investment research, brokerage service, corporate finance services, private wealth management, andonline trading. Products and services are distributed within the parent group throughout the region. The CIMB−GK group hasoffices in London, Hong Kong, Indonesia, Thailand and the US. CIMB−Research is primarily a research and analysis operationfocused on equity, fixed−income and economic trends in South−East Asia, in particular as they affect companies, industriesand currencies. The firm specializes in regional ...
Largest Holdings
Name PositionPositionChange
Mkt Val.(MM)
Mkt. ValChg(MM)
%Out
%Port.
Largest Buys
Name PositionPositionChange
Mkt Val.(MM)
Mkt. ValChg(MM)
%Out
%Port.
Largest Sells
Name PositionPositionChange
Mkt Val.(MM)
Mkt. ValChg(MM)
%Out
%Port.
Contribution Analysis by IndustryLargest Industry Holdings in
Industry MV(MM) %Port Chg(MM)
Portfolio Distribution
Top Sector Holdings
Portfolio Distribution
DistributionsMkt. Val
(MM)Mkt. Val
Chg(MM)%
Port.
2011 FactSet Research Systems Inc. All rights reserved. − Currency: USD
Daiwa Asset Management (Singapore) Ltd. Detail
Style GARPTurnover N/ADistribution Style Large CapInvestor Type Investment AdviserEquity Assets (MM) 671Equity Positions 326Total Positions 326Price Momentum 92%Report Date May−24−11
Investment ApproachProfile unavailable.
Contacts
Steven TanPortfolio Manager−Equities − 65.6223.6712Yoshinori OkadaPresident/CEO − 65.6223.6712Osamu YamashitaDirector/Board Member − 65.6223.6712
Portfolio CharacteristicsS&P Institution
Avg. P/E 15.18x 15.25xAvg. P/B 3.18x 3.30xDividend Yield 2.37% 1.84%Beta 1.00 0.52
Company Information6 Shenton Way #25−10 DBS Building Tower 2 Phone: 65.6223.6712Singapore, SG 068809 Fax: 65.6223.8629
Daiwa Asset Management (Singapore) Ltd. (DAMSL) is an investment advisory firm located in Singapore. They are awholly−owned subsidiary of Japan−based Daiwa Asset Management Co. Ltd. which is part of the Daiwa Securities Group (TK:8601). Established in 1994, DAMSL is involved in fund management activities, including managing funds and providinginvestment advisory services for funds domiciled in Japan. In 2008, they launched a Shariah−compliant ETF.
Largest Holdings
Name PositionPositionChange
Mkt Val.(MM)
Mkt. ValChg(MM)
%Out
%Port.
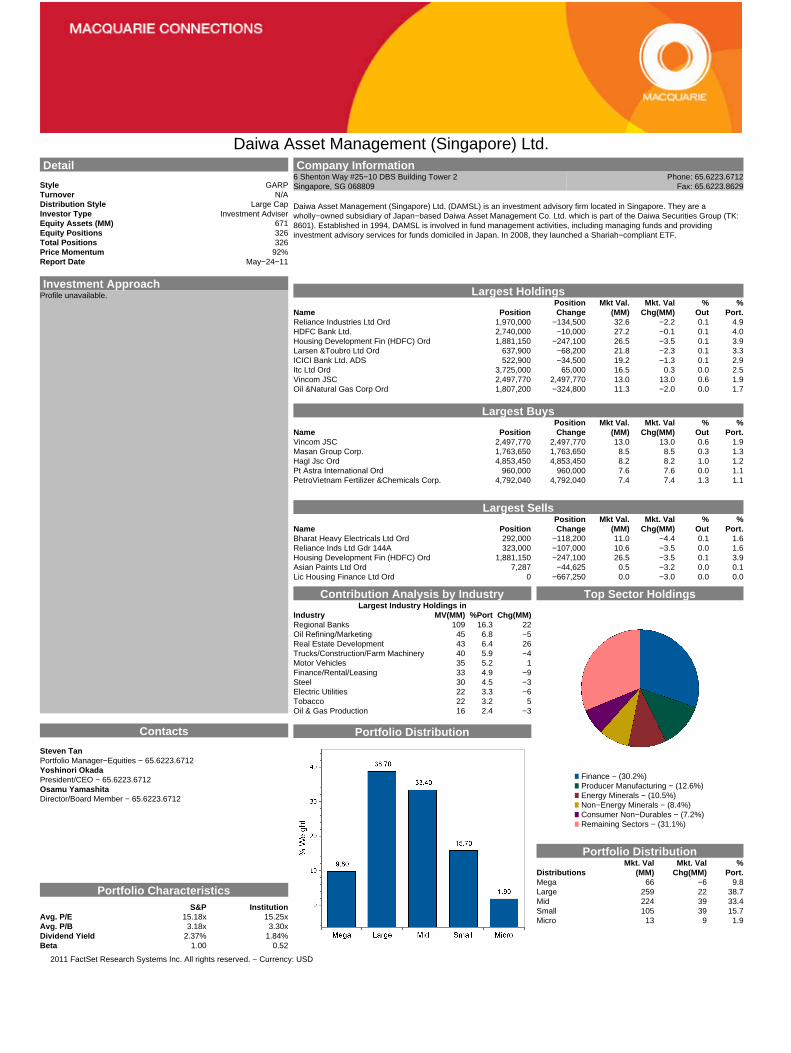
Reliance Industries Ltd Ord 1,970,000 −134,500 32.6 −2.2 0.1 4.9HDFC Bank Ltd. 2,740,000 −10,000 27.2 −0.1 0.1 4.0Housing Development Fin (HDFC) Ord 1,881,150 −247,100 26.5 −3.5 0.1 3.9Larsen &Toubro Ltd Ord 637,900 −68,200 21.8 −2.3 0.1 3.3ICICI Bank Ltd. ADS 522,900 −34,500 19.2 −1.3 0.1 2.9Itc Ltd Ord 3,725,000 65,000 16.5 0.3 0.0 2.5Vincom JSC 2,497,770 2,497,770 13.0 13.0 0.6 1.9Oil &Natural Gas Corp Ord 1,807,200 −324,800 11.3 −2.0 0.0 1.7
Largest Buys
Name PositionPositionChange
Mkt Val.(MM)
Mkt. ValChg(MM)
%Out
%Port.
Vincom JSC 2,497,770 2,497,770 13.0 13.0 0.6 1.9Masan Group Corp. 1,763,650 1,763,650 8.5 8.5 0.3 1.3Hagl Jsc Ord 4,853,450 4,853,450 8.2 8.2 1.0 1.2Pt Astra International Ord 960,000 960,000 7.6 7.6 0.0 1.1PetroVietnam Fertilizer &Chemicals Corp. 4,792,040 4,792,040 7.4 7.4 1.3 1.1
Largest Sells
Name PositionPositionChange
Mkt Val.(MM)
Mkt. ValChg(MM)
%Out
%Port.
Bharat Heavy Electricals Ltd Ord 292,000 −118,200 11.0 −4.4 0.1 1.6Reliance Inds Ltd Gdr 144A 323,000 −107,000 10.6 −3.5 0.0 1.6Housing Development Fin (HDFC) Ord 1,881,150 −247,100 26.5 −3.5 0.1 3.9Asian Paints Ltd Ord 7,287 −44,625 0.5 −3.2 0.0 0.1Lic Housing Finance Ltd Ord 0 −667,250 0.0 −3.0 0.0 0.0
Contribution Analysis by IndustryLargest Industry Holdings in
Industry MV(MM) %Port Chg(MM)Regional Banks 109 16.3 22Oil Refining/Marketing 45 6.8 −5Real Estate Development 43 6.4 26Trucks/Construction/Farm Machinery 40 5.9 −4Motor Vehicles 35 5.2 1Finance/Rental/Leasing 33 4.9 −9Steel 30 4.5 −3Electric Utilities 22 3.3 −6Tobacco 22 3.2 5Oil & Gas Production 16 2.4 −3
Portfolio Distribution
Top Sector Holdings
Finance − (30.2%)Producer Manufacturing − (12.6%)Energy Minerals − (10.5%)Non−Energy Minerals − (8.4%)Consumer Non−Durables − (7.2%)Remaining Sectors − (31.1%)
Portfolio Distribution
DistributionsMkt. Val
(MM)Mkt. Val
Chg(MM)%
Port.Mega 66 −6 9.8Large 259 22 38.7Mid 224 39 33.4Small 105 39 15.7Micro 13 9 1.9
2011 FactSet Research Systems Inc. All rights reserved. − Currency: USD
DBS Asset Management Ltd. Detail
Style ValueTurnover N/ADistribution Style Large CapInvestor Type Investment AdviserEquity Assets (MM) 763Equity Positions 561Total Positions 565Price Momentum 99%Report Date Apr−30−11
Investment ApproachDBSAM's equity investment plans are formulated and executedthrough a systematic process using top−down and bottom−upresearch to generate ideas which are qualitatively and quantitativelyscreened. Model portfolios are built using benchmark andnon−benchmark stocks and reviewed regularly. Multi−level risk controlis used to ensure compliance with mandates and portfolioperformance is tracked and attributed. The firm's fixed−incomeinvestment plans follow a defined process that includes theinvestment overview formulation, portfolio construction, monitoringand control and performance analysis. The DBSAM Family of Fundsinvests in unit trusts covering return−guaranteed, capital−protectedfunds, fixed−income, global equity, regional equity, country equity andfund of hedged funds.
Contacts
Deborah HoChief Investment Officer − 65.6535.8025Yeu Huan Lai, CFADirector of Research − Equity − 65.6535.8025Kum Kong Chan, CFAPortfolio Manager−Equities − 65.6535.8025
Portfolio CharacteristicsS&P Institution
Avg. P/E 17.60x 17.33xAvg. P/B 3.10x 2.62xDividend Yield 2.03% 2.56%Beta 1.00 0.45
Company Information8 Cross Street #08−01 PWC Building Phone: 65.6535.8025Singapore, SG 048424 Fax: 65.6534.5183
DBS Asset Management Ltd. (DBSAM) is the Singapore−based asset management subsidiary of Nikko Asset Management Co.Ltd., itself a subsidiary of Sumitomo Trust & Banking Co. Ltd. (PK: STBUY) in Japan. Established in 1982, the firm formed astrategic alliance in 2010 with The Sumitomo Trust & Banking Co. and Nikko Asset Management Co., Ltd. to combine DBSAsset Management Ltd. and Nikko AM. The combined asset manager will be one of the largest asset management franchisesin Asia. In addition to the Singapore office, the firm has an office in Hong Kong and associated companies in Malaysia, Chinaand India. Their clients include institutional, private and retail investors across Asia.
Largest Holdings
Name PositionPositionChange
Mkt Val.(MM)
Mkt. ValChg(MM)
%Out
%Port.
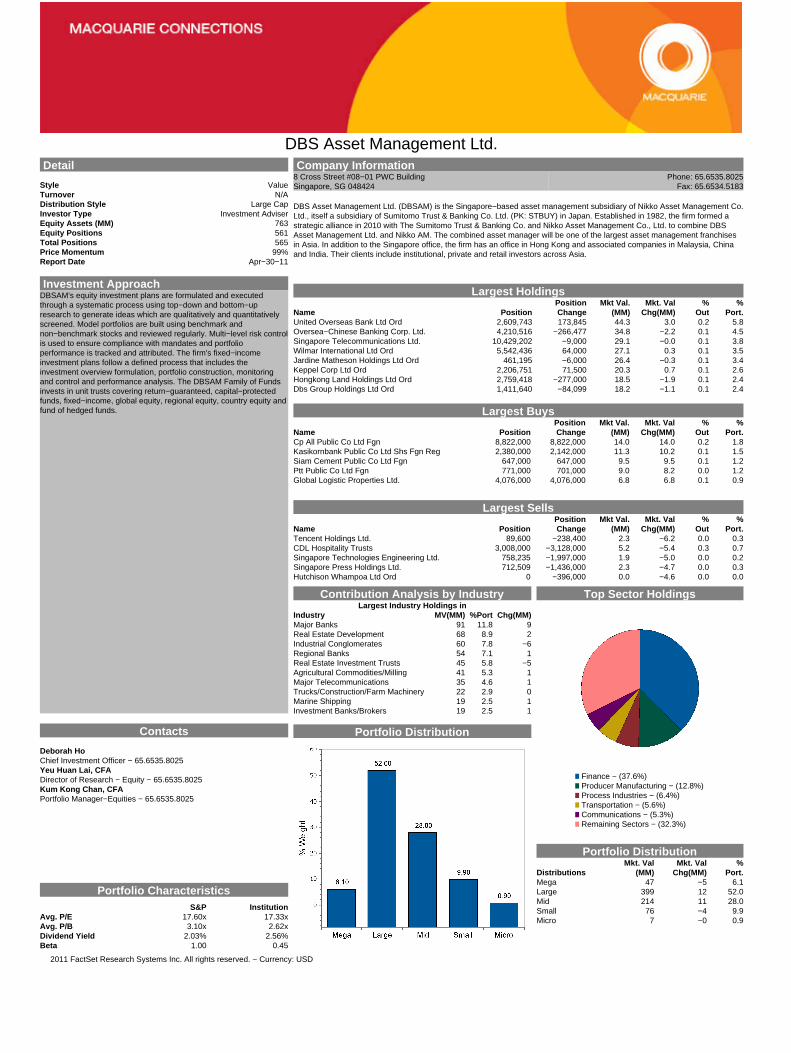
United Overseas Bank Ltd Ord 2,609,743 173,845 44.3 3.0 0.2 5.8Oversea−Chinese Banking Corp. Ltd. 4,210,516 −266,477 34.8 −2.2 0.1 4.5Singapore Telecommunications Ltd. 10,429,202 −9,000 29.1 −0.0 0.1 3.8Wilmar International Ltd Ord 5,542,436 64,000 27.1 0.3 0.1 3.5Jardine Matheson Holdings Ltd Ord 461,195 −6,000 26.4 −0.3 0.1 3.4Keppel Corp Ltd Ord 2,206,751 71,500 20.3 0.7 0.1 2.6Hongkong Land Holdings Ltd Ord 2,759,418 −277,000 18.5 −1.9 0.1 2.4Dbs Group Holdings Ltd Ord 1,411,640 −84,099 18.2 −1.1 0.1 2.4
Largest Buys
Name PositionPositionChange
Mkt Val.(MM)
Mkt. ValChg(MM)
%Out
%Port.
Cp All Public Co Ltd Fgn 8,822,000 8,822,000 14.0 14.0 0.2 1.8Kasikornbank Public Co Ltd Shs Fgn Reg 2,380,000 2,142,000 11.3 10.2 0.1 1.5Siam Cement Public Co Ltd Fgn 647,000 647,000 9.5 9.5 0.1 1.2Ptt Public Co Ltd Fgn 771,000 701,000 9.0 8.2 0.0 1.2Global Logistic Properties Ltd. 4,076,000 4,076,000 6.8 6.8 0.1 0.9
Largest Sells
Name PositionPositionChange
Mkt Val.(MM)
Mkt. ValChg(MM)
%Out
%Port.
Tencent Holdings Ltd. 89,600 −238,400 2.3 −6.2 0.0 0.3CDL Hospitality Trusts 3,008,000 −3,128,000 5.2 −5.4 0.3 0.7Singapore Technologies Engineering Ltd. 758,235 −1,997,000 1.9 −5.0 0.0 0.2Singapore Press Holdings Ltd. 712,509 −1,436,000 2.3 −4.7 0.0 0.3Hutchison Whampoa Ltd Ord 0 −396,000 0.0 −4.6 0.0 0.0
Contribution Analysis by IndustryLargest Industry Holdings in
Industry MV(MM) %Port Chg(MM)Major Banks 91 11.8 9Real Estate Development 68 8.9 2Industrial Conglomerates 60 7.8 −6Regional Banks 54 7.1 1Real Estate Investment Trusts 45 5.8 −5Agricultural Commodities/Milling 41 5.3 1Major Telecommunications 35 4.6 1Trucks/Construction/Farm Machinery 22 2.9 0Marine Shipping 19 2.5 1Investment Banks/Brokers 19 2.5 1
Portfolio Distribution
Top Sector Holdings
Finance − (37.6%)Producer Manufacturing − (12.8%)Process Industries − (6.4%)Transportation − (5.6%)Communications − (5.3%)Remaining Sectors − (32.3%)
Portfolio Distribution
DistributionsMkt. Val
(MM)Mkt. Val
Chg(MM)%
Port.Mega 47 −5 6.1Large 399 12 52.0Mid 214 11 28.0Small 76 −4 9.9Micro 7 −0 0.9
2011 FactSet Research Systems Inc. All rights reserved. − Currency: USD
European Investors (Singapore) Pte Ltd. Detail
Style −−Turnover −−Distribution Style −−Investor Type Investment AdviserEquity Assets (MM) 0Equity Positions 0Total Positions 0Price Momentum 0%Report Date
Investment ApproachEI−Singapore is an active manager which works directly with theirclients to provide customized solutions to their long−term needs. Theirinvestment process employs a combination of top−downmacroeconomic analysis with bottom−up fundamental securities andreal estate research and analysis on individual companies. The firmseeks to construct portfolios generally consisting of income−producingreal estate securities (including equity, preferred stock and hybridReal Estate Investment Trusts); real estate operating companies;securities convertible into common stocks (including convertiblepreferred stocks, rights and warrants) of real estate companies; andreal estate−related fixed−income securities (such as convertibledebentures and unsecured debentures). EI−Singapore invests in themajor global property markets (including those in emerging marketcountries), seeking to benefit from the cyclical nature of the real estateindustry, the expanding role of securitization in global propertymarkets and broad exposure to investing in different marketsworldwide. The firm seeks to maximize risk−adjusted returns andevaluates the relative risks of each investment in the context of overallportfolio risk. They closely monitor the exposure to markets andcountries with the highest levels of risk (as measured by standarddeviation of returns).
Contacts
Suang Eng Tsan, MBAChief Investment Officer − 65.6603.0870
Portfolio CharacteristicsS&P Institution
Avg. P/E 17.60x −−Avg. P/B 3.10x −−Dividend Yield 2.03% −−Beta 1.00 −−
Company Information80 Raffles Place #44−03 UOB Plaza 1 Phone: 65.6603.0870Singapore, SG 048624 Fax:
European Investors Singapore Pte Ltd. (EI−Singapore) is the Singapore−based asset management subsidiary of EuropeanInvestors, Inc. in the US, founded by Christian A. Lange and Richard J. Adler to provide portfolio management in real estatesecurities, US equities, fixed−income advice, advisory services in acquisition and ownership of direct real estate for Europeanand US families, corporations, public funds, endowments and foundations. The Singapore office was established in 2000. Inaddition to the Singapore office, European Investors, Inc. has offices in Amsterdam and Munich. Real estate is their primarybusiness and accounts for the majority of their assets under management. The firm has dedicated funds domiciled both in theUS and offshore and also manages separate accounts.
Largest Holdings
Name PositionPositionChange
Mkt Val.(MM)
Mkt. ValChg(MM)
%Out
%Port.
Largest Buys
Name PositionPositionChange
Mkt Val.(MM)
Mkt. ValChg(MM)
%Out
%Port.
Largest Sells
Name PositionPositionChange
Mkt Val.(MM)
Mkt. ValChg(MM)
%Out
%Port.
Contribution Analysis by IndustryLargest Industry Holdings in
Industry MV(MM) %Port Chg(MM)
Portfolio Distribution
Top Sector Holdings
Portfolio Distribution
DistributionsMkt. Val
(MM)Mkt. Val
Chg(MM)%
Port.
2011 FactSet Research Systems Inc. All rights reserved. − Currency: USD

Everest Capital Pte Ltd. Detail
Style −−Turnover −−Distribution Style −−Investor Type Hedge Fund CompanyEquity Assets (MM) 0Equity Positions 0Total Positions 0Price Momentum 0%Report Date
Investment ApproachEverest Capital−Singapore is an active manager which employsspecialized global and regional strategies combining top−downinvestment theme development with fundamental bottom−up securityselection across geographical regions and asset classes.
Contacts
Ming Lei Shi, CFAChief Investment Officer − 65.6238.8000
Portfolio CharacteristicsS&P Institution
Avg. P/E 17.60x −−Avg. P/B 3.10x −−Dividend Yield 2.03% −−Beta 1.00 −−
Company Information61 Robinson Road #11−01A Robinson Centre Phone: 65.6238.8000Singapore, SG 068893 Fax: 65.6238.8610
Everest Capital Pte Ltd. (Everest Capital−Singapore) is the Singapore−based alternative investment subsidiary of EverestCapital, Inc. in the US, an investment fund advisory firm founded in 1990 by Marko Dimitrijevic dedicated to pursuingtheme−driven investments that incorporate a top−down global perspective with rigorous bottom−up fundamental research.Established in 2003, Everest Capital−Singapore's investor base primarily consists of large institutions, including corporate andpublic pension funds and university endowments, as well as family offices and high−net worth individuals. In addition toSingapore, Everest Capital, Inc. has offices in Miami, Shanghai, Bermuda and Geneva.
Largest Holdings
Name PositionPositionChange
Mkt Val.(MM)
Mkt. ValChg(MM)
%Out
%Port.
Largest Buys
Name PositionPositionChange
Mkt Val.(MM)
Mkt. ValChg(MM)
%Out
%Port.
Largest Sells
Name PositionPositionChange
Mkt Val.(MM)
Mkt. ValChg(MM)
%Out
%Port.
Contribution Analysis by IndustryLargest Industry Holdings in
Industry MV(MM) %Port Chg(MM)
Portfolio Distribution
Top Sector Holdings
Portfolio Distribution
DistributionsMkt. Val
(MM)Mkt. Val
Chg(MM)%
Port.
2011 FactSet Research Systems Inc. All rights reserved. − Currency: USD

First State Investments (Singapore) Detail
Style ValueTurnover N/ADistribution Style Large CapInvestor Type Bank Management DivisionEquity Assets (MM) 1,850Equity Positions 147Total Positions 147Price Momentum 100%Report Date Mar−31−11
Investment ApproachAlthough First State uses an aggressive growth strategy theirinvestment style can be described as conservative. They seek bothcapital preservation and capital growth. In line with the group, theiroverall investment strategy concentrates on niche and specialist areasof the market such as property, infrastructure and emerging markets.They manage investments across a range of long−only equity andalternative asset classes, including Asia Pacific and global emergingmarket equities, property securities, infrastructure and global naturalresources. First State uses an investment process that focuses onabsolute return and relative return. They favor a bottom−up stockselection process and concentrate on long−term performance.Although they eschew benchmarks, the firm maintains awareness ofcountry, sector and major company weightings in the benchmarkindexes. They do not apply minimum portfolio weightings in anycountry, sector or firm. They draw on proprietary research and directcontact with their portfolio firms.
Contacts
Alistair J. ThompsonHead−Equity Investments − 65.6538.0008First State Investments TeamPortfolio Manager−Equities − 65.6538.0008Hsiu Mei Ho, MBAPortfolio Manager−Equities − 65.6538.0008
Portfolio CharacteristicsS&P Institution
Avg. P/E 17.60x 16.74xAvg. P/B 3.10x 3.22xDividend Yield 2.03% 2.56%Beta 1.00 0.56
Company Information1 Temasek Avenue #17−01 Millenia Tower Phone: 65.6538.0008Singapore, SG 039192 Fax: 65.6538.0800
First State Investments (Singapore) is part of Colonial First State Global Asset Management, founded in Australia in 1988,which is the consolidated asset management division of the Commonwealth Bank of Australia (ASX: CBA). The parent firm wasestablished in 1911 and is headquartered in Sidney, Australia. In Singapore, First State offers a range of product structuresacross categories such as Asia Pacific and global emerging markets, global equities and global resources, infrastructure andproperty securities. The firm manages segregated mandates for clients worldwide and also has pooled investment vehiclesavailable in a number of countries. In addition to the Singapore offices, First State is present in Sydney, London, Edinburgh,Hong Kong and Indonesia. The First State group has signed the United Nations Principles for Responsible Investment(UNPRI).
Largest Holdings
Name PositionPositionChange
Mkt Val.(MM)
Mkt. ValChg(MM)
%Out
%Port.
Newcrest Mining Ltd Ord 3,541,008 23,225 153.8 1.0 0.5 8.3Oversea−Chinese Banking Corp. Ltd. 13,157,374 −180,869 108.8 −1.5 0.4 5.9Cheung Kong (Holdings) Ltd. 5,940,000 58,000 90.8 0.9 0.3 4.9Taiwan Semiconductor Manufacturing Co. Ltd. 34,477,736 −1,352,998 86.1 −3.4 0.1 4.7Singapore Telecommunications Ltd. 25,916,923 654,028 72.3 1.8 0.2 3.9Hong Kong &China Gas Ltd Ord 28,148,822 776,600 68.9 1.9 0.4 3.7CNOOC Ltd. 22,110,000 −303,000 49.4 −0.7 0.0 2.7Bharti Airtel Ltd. 4,487,307 −230,559 44.4 −2.3 0.1 2.4
Largest Buys
Name PositionPositionChange
Mkt Val.(MM)
Mkt. ValChg(MM)
%Out
%Port.
Ptt Public Co Ltd Fgn 2,283,500 2,283,500 26.6 26.6 0.1 1.4Kasikornbank Public Co Ltd Shs Fgn Reg 5,575,400 5,575,400 26.5 26.5 0.2 1.4Dbs Group Holdings Ltd Ord 3,011,775 2,024,774 38.9 26.1 0.1 2.1Amorepacific Corp. (New) 16,762 16,762 19.1 19.1 0.3 1.0Henderson Land Development Co. Ltd. 5,287,639 2,919,413 33.5 18.5 0.2 1.8
Largest Sells
Name PositionPositionChange
Mkt Val.(MM)
Mkt. ValChg(MM)
%Out
%Port.
Kasikornbank PCL 2,373,300 −5,772,900 11.2 −27.3 0.1 0.6Ptt PCL 1,052,700 −2,320,900 12.2 −27.0 0.0 0.7Siam Commercial Bank PCL 103,400 −4,091,900 0.4 −17.4 0.0 0.0Oil Search Ltd Ord 19,875 −1,673,042 0.1 −12.6 0.0 0.0Woodside Petroleum Ltd Ord 6,990 −188,659 0.3 −7.9 0.0 0.0
Contribution Analysis by IndustryLargest Industry Holdings in
Industry MV(MM) %Port Chg(MM)Major Banks 185 10.0 24Real Estate Development 162 8.7 25Precious Metals 154 8.3 1Semiconductors 133 7.2 −10Industrial Conglomerates 131 7.1 −9Major Telecommunications 128 6.9 3Wireless Telecommunications 76 4.1 −5Gas Distributors 70 3.8 −0Property/Casualty Insurance 67 3.6 −0Regional Banks 67 3.6 −2
Portfolio Distribution
Top Sector Holdings
Finance − (29.6%)Communications − (11.4%)Electronic Technology − (9.8%)Non−Energy Minerals − (8.5%)Producer Manufacturing − (7.6%)Remaining Sectors − (33.1%)
Portfolio Distribution
DistributionsMkt. Val
(MM)Mkt. Val
Chg(MM)%
Port.Mega 179 −10 9.7Large 1,201 34 64.9Mid 392 49 21.2Small 69 −6 3.7Micro 5 0 0.3
2011 FactSet Research Systems Inc. All rights reserved. − Currency: USD
Fullerton Fund Management Co. Ltd. Detail
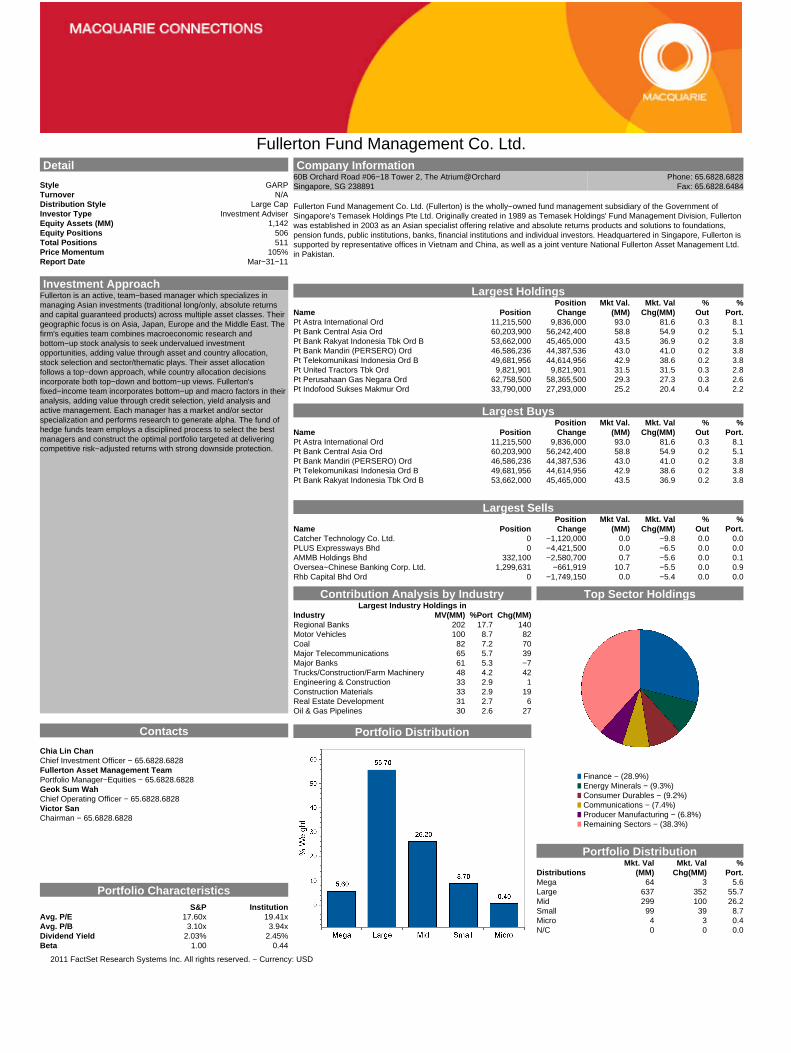
Style GARPTurnover N/ADistribution Style Large CapInvestor Type Investment AdviserEquity Assets (MM) 1,142Equity Positions 506Total Positions 511Price Momentum 105%Report Date Mar−31−11
Investment ApproachFullerton is an active, team−based manager which specializes inmanaging Asian investments (traditional long/only, absolute returnsand capital guaranteed products) across multiple asset classes. Theirgeographic focus is on Asia, Japan, Europe and the Middle East. Thefirm's equities team combines macroeconomic research andbottom−up stock analysis to seek undervalued investmentopportunities, adding value through asset and country allocation,stock selection and sector/thematic plays. Their asset allocationfollows a top−down approach, while country allocation decisionsincorporate both top−down and bottom−up views. Fullerton'sfixed−income team incorporates bottom−up and macro factors in theiranalysis, adding value through credit selection, yield analysis andactive management. Each manager has a market and/or sectorspecialization and performs research to generate alpha. The fund ofhedge funds team employs a disciplined process to select the bestmanagers and construct the optimal portfolio targeted at deliveringcompetitive risk−adjusted returns with strong downside protection.
Contacts
Chia Lin ChanChief Investment Officer − 65.6828.6828Fullerton Asset Management TeamPortfolio Manager−Equities − 65.6828.6828Geok Sum WahChief Operating Officer − 65.6828.6828Victor SanChairman − 65.6828.6828
Portfolio CharacteristicsS&P Institution
Avg. P/E 17.60x 19.41xAvg. P/B 3.10x 3.94xDividend Yield 2.03% 2.45%Beta 1.00 0.44
Company Information60B Orchard Road #06−18 Tower 2, The Atrium@Orchard Phone: 65.6828.6828Singapore, SG 238891 Fax: 65.6828.6484
Fullerton Fund Management Co. Ltd. (Fullerton) is the wholly−owned fund management subsidiary of the Government ofSingapore's Temasek Holdings Pte Ltd. Originally created in 1989 as Temasek Holdings' Fund Management Division, Fullertonwas established in 2003 as an Asian specialist offering relative and absolute returns products and solutions to foundations,pension funds, public institutions, banks, financial institutions and individual investors. Headquartered in Singapore, Fullerton issupported by representative offices in Vietnam and China, as well as a joint venture National Fullerton Asset Management Ltd.in Pakistan.
Largest Holdings
Name PositionPositionChange
Mkt Val.(MM)
Mkt. ValChg(MM)
%Out
%Port.
Pt Astra International Ord 11,215,500 9,836,000 93.0 81.6 0.3 8.1Pt Bank Central Asia Ord 60,203,900 56,242,400 58.8 54.9 0.2 5.1Pt Bank Rakyat Indonesia Tbk Ord B 53,662,000 45,465,000 43.5 36.9 0.2 3.8Pt Bank Mandiri (PERSERO) Ord 46,586,236 44,387,536 43.0 41.0 0.2 3.8Pt Telekomunikasi Indonesia Ord B 49,681,956 44,614,956 42.9 38.6 0.2 3.8Pt United Tractors Tbk Ord 9,821,901 9,821,901 31.5 31.5 0.3 2.8Pt Perusahaan Gas Negara Ord 62,758,500 58,365,500 29.3 27.3 0.3 2.6Pt Indofood Sukses Makmur Ord 33,790,000 27,293,000 25.2 20.4 0.4 2.2
Largest Buys
Name PositionPositionChange
Mkt Val.(MM)
Mkt. ValChg(MM)
%Out
%Port.
Pt Astra International Ord 11,215,500 9,836,000 93.0 81.6 0.3 8.1Pt Bank Central Asia Ord 60,203,900 56,242,400 58.8 54.9 0.2 5.1Pt Bank Mandiri (PERSERO) Ord 46,586,236 44,387,536 43.0 41.0 0.2 3.8Pt Telekomunikasi Indonesia Ord B 49,681,956 44,614,956 42.9 38.6 0.2 3.8Pt Bank Rakyat Indonesia Tbk Ord B 53,662,000 45,465,000 43.5 36.9 0.2 3.8
Largest Sells
Name PositionPositionChange
Mkt Val.(MM)
Mkt. ValChg(MM)
%Out
%Port.
Catcher Technology Co. Ltd. 0 −1,120,000 0.0 −9.8 0.0 0.0PLUS Expressways Bhd 0 −4,421,500 0.0 −6.5 0.0 0.0AMMB Holdings Bhd 332,100 −2,580,700 0.7 −5.6 0.0 0.1Oversea−Chinese Banking Corp. Ltd. 1,299,631 −661,919 10.7 −5.5 0.0 0.9Rhb Capital Bhd Ord 0 −1,749,150 0.0 −5.4 0.0 0.0
Contribution Analysis by IndustryLargest Industry Holdings in
Industry MV(MM) %Port Chg(MM)Regional Banks 202 17.7 140Motor Vehicles 100 8.7 82Coal 82 7.2 70Major Telecommunications 65 5.7 39Major Banks 61 5.3 −7Trucks/Construction/Farm Machinery 48 4.2 42Engineering & Construction 33 2.9 1Construction Materials 33 2.9 19Real Estate Development 31 2.7 6Oil & Gas Pipelines 30 2.6 27
Portfolio Distribution
Top Sector Holdings
Finance − (28.9%)Energy Minerals − (9.3%)Consumer Durables − (9.2%)Communications − (7.4%)Producer Manufacturing − (6.8%)Remaining Sectors − (38.3%)
Portfolio Distribution
DistributionsMkt. Val
(MM)Mkt. Val
Chg(MM)%
Port.Mega 64 3 5.6Large 637 352 55.7Mid 299 100 26.2Small 99 39 8.7Micro 4 3 0.4N/C 0 0 0.0
2011 FactSet Research Systems Inc. All rights reserved. − Currency: USD
Government of Singapore Investment Corp. Pte Ltd. (Invt Mgmt) Detail
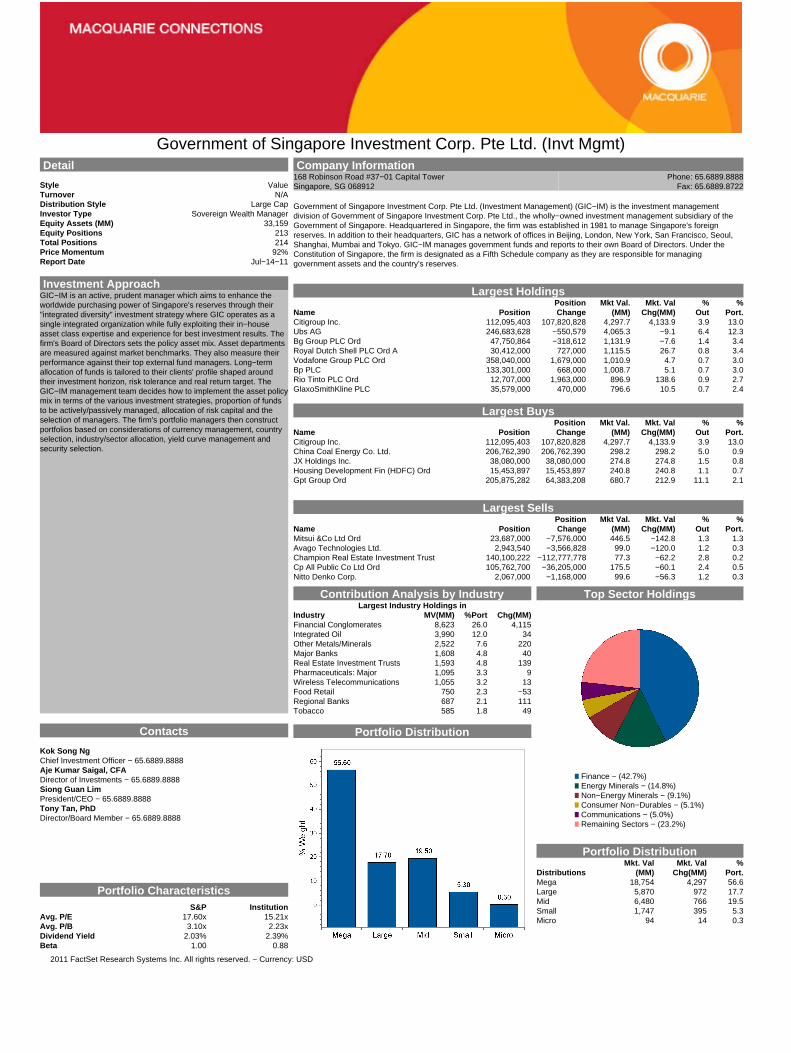
Style ValueTurnover N/ADistribution Style Large CapInvestor Type Sovereign Wealth ManagerEquity Assets (MM) 33,159Equity Positions 213Total Positions 214Price Momentum 92%Report Date Jul−14−11
Investment ApproachGIC−IM is an active, prudent manager which aims to enhance theworldwide purchasing power of Singapore's reserves through their"integrated diversity" investment strategy where GIC operates as asingle integrated organization while fully exploiting their in−houseasset class expertise and experience for best investment results. Thefirm's Board of Directors sets the policy asset mix. Asset departmentsare measured against market benchmarks. They also measure theirperformance against their top external fund managers. Long−termallocation of funds is tailored to their clients' profile shaped aroundtheir investment horizon, risk tolerance and real return target. TheGIC−IM management team decides how to implement the asset policymix in terms of the various investment strategies, proportion of fundsto be actively/passively managed, allocation of risk capital and theselection of managers. The firm's portfolio managers then constructportfolios based on considerations of currency management, countryselection, industry/sector allocation, yield curve management andsecurity selection.
Contacts
Kok Song NgChief Investment Officer − 65.6889.8888Aje Kumar Saigal, CFADirector of Investments − 65.6889.8888Siong Guan LimPresident/CEO − 65.6889.8888Tony Tan, PhDDirector/Board Member − 65.6889.8888
Portfolio CharacteristicsS&P Institution
Avg. P/E 17.60x 15.21xAvg. P/B 3.10x 2.23xDividend Yield 2.03% 2.39%Beta 1.00 0.88
Company Information168 Robinson Road #37−01 Capital Tower Phone: 65.6889.8888Singapore, SG 068912 Fax: 65.6889.8722
Government of Singapore Investment Corp. Pte Ltd. (Investment Management) (GIC−IM) is the investment managementdivision of Government of Singapore Investment Corp. Pte Ltd., the wholly−owned investment management subsidiary of theGovernment of Singapore. Headquartered in Singapore, the firm was established in 1981 to manage Singapore's foreignreserves. In addition to their headquarters, GIC has a network of offices in Beijing, London, New York, San Francisco, Seoul,Shanghai, Mumbai and Tokyo. GIC−IM manages government funds and reports to their own Board of Directors. Under theConstitution of Singapore, the firm is designated as a Fifth Schedule company as they are responsible for managinggovernment assets and the country's reserves.
Largest Holdings
Name PositionPositionChange
Mkt Val.(MM)
Mkt. ValChg(MM)
%Out
%Port.
Citigroup Inc. 112,095,403 107,820,828 4,297.7 4,133.9 3.9 13.0Ubs AG 246,683,628 −550,579 4,065.3 −9.1 6.4 12.3Bg Group PLC Ord 47,750,864 −318,612 1,131.9 −7.6 1.4 3.4Royal Dutch Shell PLC Ord A 30,412,000 727,000 1,115.5 26.7 0.8 3.4Vodafone Group PLC Ord 358,040,000 1,679,000 1,010.9 4.7 0.7 3.0Bp PLC 133,301,000 668,000 1,008.7 5.1 0.7 3.0Rio Tinto PLC Ord 12,707,000 1,963,000 896.9 138.6 0.9 2.7GlaxoSmithKline PLC 35,579,000 470,000 796.6 10.5 0.7 2.4
Largest Buys
Name PositionPositionChange
Mkt Val.(MM)
Mkt. ValChg(MM)
%Out
%Port.
Citigroup Inc. 112,095,403 107,820,828 4,297.7 4,133.9 3.9 13.0China Coal Energy Co. Ltd. 206,762,390 206,762,390 298.2 298.2 5.0 0.9JX Holdings Inc. 38,080,000 38,080,000 274.8 274.8 1.5 0.8Housing Development Fin (HDFC) Ord 15,453,897 15,453,897 240.8 240.8 1.1 0.7Gpt Group Ord 205,875,282 64,383,208 680.7 212.9 11.1 2.1
Largest Sells
Name PositionPositionChange
Mkt Val.(MM)
Mkt. ValChg(MM)
%Out
%Port.
Mitsui &Co Ltd Ord 23,687,000 −7,576,000 446.5 −142.8 1.3 1.3Avago Technologies Ltd. 2,943,540 −3,566,828 99.0 −120.0 1.2 0.3Champion Real Estate Investment Trust 140,100,222 −112,777,778 77.3 −62.2 2.8 0.2Cp All Public Co Ltd Ord 105,762,700 −36,205,000 175.5 −60.1 2.4 0.5Nitto Denko Corp. 2,067,000 −1,168,000 99.6 −56.3 1.2 0.3
Contribution Analysis by IndustryLargest Industry Holdings in
Industry MV(MM) %Port Chg(MM)Financial Conglomerates 8,623 26.0 4,115Integrated Oil 3,990 12.0 34Other Metals/Minerals 2,522 7.6 220Major Banks 1,608 4.8 40Real Estate Investment Trusts 1,593 4.8 139Pharmaceuticals: Major 1,095 3.3 9Wireless Telecommunications 1,055 3.2 13Food Retail 750 2.3 −53Regional Banks 687 2.1 111Tobacco 585 1.8 49
Portfolio Distribution
Top Sector Holdings
Finance − (42.7%)Energy Minerals − (14.8%)Non−Energy Minerals − (9.1%)Consumer Non−Durables − (5.1%)Communications − (5.0%)Remaining Sectors − (23.2%)
Portfolio Distribution
DistributionsMkt. Val
(MM)Mkt. Val
Chg(MM)%
Port.Mega 18,754 4,297 56.6Large 5,870 972 17.7Mid 6,480 766 19.5Small 1,747 395 5.3Micro 94 14 0.3
2011 FactSet Research Systems Inc. All rights reserved. − Currency: USD

Havenport Asset Management Pte Ltd. Detail
Style ValueTurnover N/ADistribution Style Small CapInvestor Type Investment AdviserEquity Assets (MM) 634Equity Positions 127Total Positions 127Price Momentum 101%Report Date Sep−30−10
Investment Approach
Contacts
Patrick TanChief Investment Officer − 65.6590.9090Joseph TernPortfolio Manager−Equities − 65.6590.9090
Portfolio CharacteristicsS&P Institution
Avg. P/E 17.60x 19.08xAvg. P/B 3.10x 3.09xDividend Yield 2.03% 1.68%Beta 1.00 0.60
Company Information8 Eu Tong Sen Street #21−96/97, Office 1, The Central Phone: 65.6590.9090Singapore, SG 059818 Fax: 65.6225.3521
Largest Holdings
Name PositionPositionChange
Mkt Val.(MM)
Mkt. ValChg(MM)
%Out
%Port.
Ezion Holdings Ltd. 47,924,000 47,924,000 27.3 27.3 6.7 4.3Pt Astra International Ord 2,644,000 −1,504,000 21.9 −12.5 0.1 3.5Pt Indofood Sukses Makmur Ord 28,563,500 28,563,500 21.3 21.3 0.3 3.4Biosensors International Group Ltd. 17,488,000 17,488,000 19.8 19.8 1.3 3.1Bumi Serpong Damai 140,057,320 0 16.8 0.0 0.8 2.7Genting Singapore (GENTING Int) Ord 10,565,000 10,565,000 16.7 16.7 0.1 2.6Samsung Electronics Co. Ltd. 17,347 1,395 13.9 1.1 0.0 2.2Bangkok Bank PCL Ord 2,331,000 2,331,000 13.6 13.6 0.1 2.1
Largest Buys
Name PositionPositionChange
Mkt Val.(MM)
Mkt. ValChg(MM)
%Out
%Port.
Ezion Holdings Ltd. 47,924,000 47,924,000 27.3 27.3 6.7 4.3Pt Indofood Sukses Makmur Ord 28,563,500 28,563,500 21.3 21.3 0.3 3.4Biosensors International Group Ltd. 17,488,000 17,488,000 19.8 19.8 1.3 3.1Genting Singapore (GENTING Int) Ord 10,565,000 10,565,000 16.7 16.7 0.1 2.6Bangkok Bank PCL Ord 2,331,000 2,331,000 13.6 13.6 0.1 2.1
Largest Sells
Name PositionPositionChange
Mkt Val.(MM)
Mkt. ValChg(MM)
%Out
%Port.
Genting Hong Kong Ltd. 0 −46,747,000 0.0 −20.4 0.0 0.0Straits Asia Resources Ltd. 0 −5,795,000 0.0 −14.6 0.0 0.0Keppel Land Ltd. 471,000 −4,159,000 1.5 −13.2 0.0 0.2Pt Astra International Ord 2,644,000 −1,504,000 21.9 −12.5 0.1 3.5Tata Motors Ltd Ord 400,164 −579,503 8.6 −12.4 0.1 1.4
Contribution Analysis by IndustryLargest Industry Holdings in
Industry MV(MM) %Port Chg(MM)Regional Banks 68 10.7 −10Real Estate Development 67 10.6 −1Oilfield Services/Equipment 38 6.1 1Trucks/Construction/Farm Machinery 37 5.8 6Engineering & Construction 34 5.4 16Casinos/Gaming 30 4.7 29Food: Specialty/Candy 24 3.8 24Motor Vehicles 22 3.5 −16Medical Specialties 20 3.1 20Investment Banks/Brokers 17 2.7 8
Portfolio Distribution
Top Sector Holdings
Finance − (29.0%)Industrial Services − (11.5%)Producer Manufacturing − (8.2%)Consumer Non−Durables − (7.1%)Consumer Services − (6.9%)Remaining Sectors − (37.3%)
Portfolio Distribution
DistributionsMkt. Val
(MM)Mkt. Val
Chg(MM)%
Port.Mega 33 0 5.2Large 135 −42 21.3Mid 192 17 30.4Small 258 40 40.7Micro 16 −15 2.5
2011 FactSet Research Systems Inc. All rights reserved. − Currency: USD

HDH Capital Management Pte Ltd. Detail
Style −−Turnover −−Distribution Style −−Investor Type Mutual Fund ManagerEquity Assets (MM) 0Equity Positions 0Total Positions 0Price Momentum 0%Report Date
Investment ApproachHDH Capital is an active, special situations−focused manager whichinvests in a range of instruments including equities, convertibles andfixed−income in the Asia Pacific region, including Japan. The firmseeks to achieve absolute returns by investing long and short insecurities undergoing M&As, financial and business restructuring andin securities of companies operating in out−of−favor industries. Theyalso pursue investing in event−driven investments includingrecapitalizations, special dividends, stock repurchases, credit ratingchange and corporate governance−related issues.
Contacts
Huy HoangChief Investment Officer − 65.6557.6030Gabriel TanAnalyst−Equity − 65.6557.6030
Portfolio CharacteristicsS&P Institution
Avg. P/E 15.18x −−Avg. P/B 3.18x −−Dividend Yield 2.37% −−Beta 1.00 −−
Company Information250 North Bridge Road #38−01 Raffles City Tower Phone: 65.6557.6030Singapore, SG 179101 Fax:
HDH Capital Management Pte Ltd. (HDH Capital) is an independent Singapore−based fund management firm which wasfounded in 2006 by Huy Hoang to manage the HDH Master Fund.
Largest Holdings
Name PositionPositionChange
Mkt Val.(MM)
Mkt. ValChg(MM)
%Out
%Port.
Largest Buys
Name PositionPositionChange
Mkt Val.(MM)
Mkt. ValChg(MM)
%Out
%Port.
Largest Sells
Name PositionPositionChange
Mkt Val.(MM)
Mkt. ValChg(MM)
%Out
%Port.
Contribution Analysis by IndustryLargest Industry Holdings in
Industry MV(MM) %Port Chg(MM)
Portfolio Distribution
Top Sector Holdings
Portfolio Distribution
DistributionsMkt. Val
(MM)Mkt. Val
Chg(MM)%
Port.
2011 FactSet Research Systems Inc. All rights reserved. − Currency: USD

IMC Investments Pte Ltd. Detail
Style −−Turnover −−Distribution Style −−Investor Type Investment AdviserEquity Assets (MM) 0Equity Positions 0Total Positions 0Price Momentum 0%Report Date
Investment ApproachIMCI−Singapore is an active manager which provides directinvestment, fund management and private equity−type transactionservices. The firm manages the IMC Group's in−house funds across avariety of asset classes including alternative investments. They alsomake direct investments, focusing on core sectors such as mining &minerals, oil & gas and renewables & plantations. The firm may alsotake minority holdings in private equity−type investment opportunitieswith strong fundamentals and clear exit strategies.
Contacts
Edmund HohDirector/Board Member − 65.6411.9800
Portfolio CharacteristicsS&P Institution
Avg. P/E 15.18x −−Avg. P/B 3.18x −−Dividend Yield 2.37% −−Beta 1.00 −−
Company Information7 Temasek Boulevard #37−00 Suntec Tower One Phone: 65.6411.9800Singapore, SG 038987 Fax: 65.6411.9848
IMC Investments Pte Ltd. (IMCI−Singapore) is the investment advisory subsidiary of Singapore−based The IMC Group,founded by Frank Tsao in 1966. IMC Group is a diversified Asia−focused group with business interests in maritime shipping,logistics, oil & gas assets and services, lifestyle/real estate and fund management. Established in 1997, the firm isheadquartered in Singapore and is the non−marine investment arm of the IMC Group which manages diversified investmentportfolios in equity, fixed−income and hedge funds.
Largest Holdings
Name PositionPositionChange
Mkt Val.(MM)
Mkt. ValChg(MM)
%Out
%Port.
Largest Buys
Name PositionPositionChange
Mkt Val.(MM)
Mkt. ValChg(MM)
%Out
%Port.
Largest Sells
Name PositionPositionChange
Mkt Val.(MM)
Mkt. ValChg(MM)
%Out
%Port.
Contribution Analysis by IndustryLargest Industry Holdings in
Industry MV(MM) %Port Chg(MM)
Portfolio Distribution
Top Sector Holdings
Portfolio Distribution
DistributionsMkt. Val
(MM)Mkt. Val
Chg(MM)%
Port.
2011 FactSet Research Systems Inc. All rights reserved. − Currency: USD
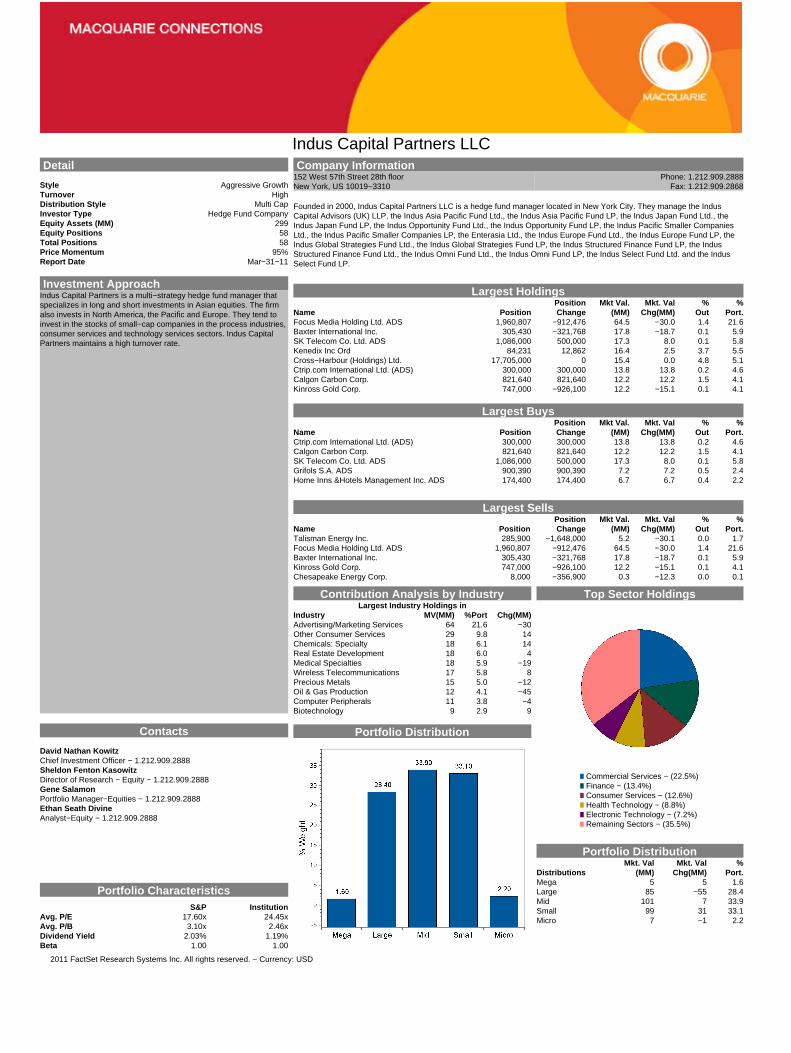
Indus Capital Partners LLC Detail
Style Aggressive GrowthTurnover HighDistribution Style Multi CapInvestor Type Hedge Fund CompanyEquity Assets (MM) 299Equity Positions 58Total Positions 58Price Momentum 95%Report Date Mar−31−11
Investment ApproachIndus Capital Partners is a multi−strategy hedge fund manager thatspecializes in long and short investments in Asian equities. The firmalso invests in North America, the Pacific and Europe. They tend toinvest in the stocks of small−cap companies in the process industries,consumer services and technology services sectors. Indus CapitalPartners maintains a high turnover rate.
Contacts
David Nathan KowitzChief Investment Officer − 1.212.909.2888Sheldon Fenton KasowitzDirector of Research − Equity − 1.212.909.2888Gene SalamonPortfolio Manager−Equities − 1.212.909.2888Ethan Seath DivineAnalyst−Equity − 1.212.909.2888
Portfolio CharacteristicsS&P Institution
Avg. P/E 17.60x 24.45xAvg. P/B 3.10x 2.46xDividend Yield 2.03% 1.19%Beta 1.00 1.00
Company Information152 West 57th Street 28th floor Phone: 1.212.909.2888New York, US 10019−3310 Fax: 1.212.909.2868
Founded in 2000, Indus Capital Partners LLC is a hedge fund manager located in New York City. They manage the IndusCapital Advisors (UK) LLP, the Indus Asia Pacific Fund Ltd., the Indus Asia Pacific Fund LP, the Indus Japan Fund Ltd., theIndus Japan Fund LP, the Indus Opportunity Fund Ltd., the Indus Opportunity Fund LP, the Indus Pacific Smaller CompaniesLtd., the Indus Pacific Smaller Companies LP, the Enterasia Ltd., the Indus Europe Fund Ltd., the Indus Europe Fund LP, theIndus Global Strategies Fund Ltd., the Indus Global Strategies Fund LP, the Indus Structured Finance Fund LP, the IndusStructured Finance Fund Ltd., the Indus Omni Fund Ltd., the Indus Omni Fund LP, the Indus Select Fund Ltd. and the IndusSelect Fund LP.
Largest Holdings
Name PositionPositionChange
Mkt Val.(MM)
Mkt. ValChg(MM)
%Out
%Port.
Focus Media Holding Ltd. ADS 1,960,807 −912,476 64.5 −30.0 1.4 21.6Baxter International Inc. 305,430 −321,768 17.8 −18.7 0.1 5.9SK Telecom Co. Ltd. ADS 1,086,000 500,000 17.3 8.0 0.1 5.8Kenedix Inc Ord 84,231 12,862 16.4 2.5 3.7 5.5Cross−Harbour (Holdings) Ltd. 17,705,000 0 15.4 0.0 4.8 5.1Ctrip.com International Ltd. (ADS) 300,000 300,000 13.8 13.8 0.2 4.6Calgon Carbon Corp. 821,640 821,640 12.2 12.2 1.5 4.1Kinross Gold Corp. 747,000 −926,100 12.2 −15.1 0.1 4.1
Largest Buys
Name PositionPositionChange
Mkt Val.(MM)
Mkt. ValChg(MM)
%Out
%Port.
Ctrip.com International Ltd. (ADS) 300,000 300,000 13.8 13.8 0.2 4.6Calgon Carbon Corp. 821,640 821,640 12.2 12.2 1.5 4.1SK Telecom Co. Ltd. ADS 1,086,000 500,000 17.3 8.0 0.1 5.8Grifols S.A. ADS 900,390 900,390 7.2 7.2 0.5 2.4Home Inns &Hotels Management Inc. ADS 174,400 174,400 6.7 6.7 0.4 2.2
Largest Sells
Name PositionPositionChange
Mkt Val.(MM)
Mkt. ValChg(MM)
%Out
%Port.
Talisman Energy Inc. 285,900 −1,648,000 5.2 −30.1 0.0 1.7Focus Media Holding Ltd. ADS 1,960,807 −912,476 64.5 −30.0 1.4 21.6Baxter International Inc. 305,430 −321,768 17.8 −18.7 0.1 5.9Kinross Gold Corp. 747,000 −926,100 12.2 −15.1 0.1 4.1Chesapeake Energy Corp. 8,000 −356,900 0.3 −12.3 0.0 0.1
Contribution Analysis by IndustryLargest Industry Holdings in
Industry MV(MM) %Port Chg(MM)Advertising/Marketing Services 64 21.6 −30Other Consumer Services 29 9.8 14Chemicals: Specialty 18 6.1 14Real Estate Development 18 6.0 4Medical Specialties 18 5.9 −19Wireless Telecommunications 17 5.8 8Precious Metals 15 5.0 −12Oil & Gas Production 12 4.1 −45Computer Peripherals 11 3.8 −4Biotechnology 9 2.9 9
Portfolio Distribution
Top Sector Holdings
Commercial Services − (22.5%)Finance − (13.4%)Consumer Services − (12.6%)Health Technology − (8.8%)Electronic Technology − (7.2%)Remaining Sectors − (35.5%)
Portfolio Distribution
DistributionsMkt. Val
(MM)Mkt. Val
Chg(MM)%
Port.Mega 5 5 1.6Large 85 −55 28.4Mid 101 7 33.9Small 99 31 33.1Micro 7 −1 2.2
2011 FactSet Research Systems Inc. All rights reserved. − Currency: USD
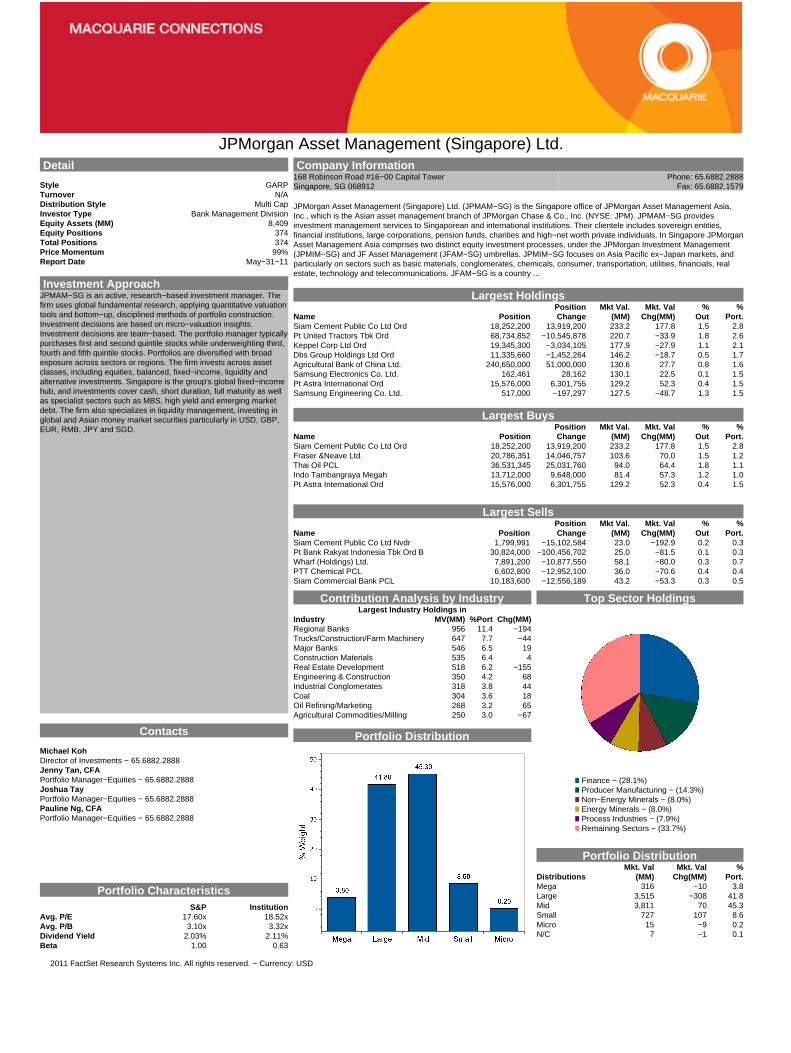
JPMorgan Asset Management (Singapore) Ltd. Detail
Style GARPTurnover N/ADistribution Style Multi CapInvestor Type Bank Management DivisionEquity Assets (MM) 8,409Equity Positions 374Total Positions 374Price Momentum 99%Report Date May−31−11
Investment ApproachJPMAM−SG is an active, research−based investment manager. Thefirm uses global fundamental research, applying quantitative valuationtools and bottom−up, disciplined methods of portfolio construction.Investment decisions are based on micro−valuation insights.Investment decisions are team−based. The portfolio manager typicallypurchases first and second quintile stocks while underweighting third,fourth and fifth quintile stocks. Portfolios are diversified with broadexposure across sectors or regions. The firm invests across assetclasses, including equities, balanced, fixed−income, liquidity andalternative investments. Singapore is the group's global fixed−incomehub, and investments cover cash, short duration, full maturity as wellas specialist sectors such as MBS, high yield and emerging marketdebt. The firm also specializes in liquidity management, investing inglobal and Asian money market securities particularly in USD, GBP,EUR, RMB, JPY and SGD.
Contacts
Michael KohDirector of Investments − 65.6882.2888Jenny Tan, CFAPortfolio Manager−Equities − 65.6882.2888Joshua TayPortfolio Manager−Equities − 65.6882.2888Pauline Ng, CFAPortfolio Manager−Equities − 65.6882.2888
Portfolio CharacteristicsS&P Institution
Avg. P/E 17.60x 18.52xAvg. P/B 3.10x 3.32xDividend Yield 2.03% 2.11%Beta 1.00 0.63
Company Information168 Robinson Road #16−00 Capital Tower Phone: 65.6882.2888Singapore, SG 068912 Fax: 65.6882.1579
JPMorgan Asset Management (Singapore) Ltd. (JPMAM−SG) is the Singapore office of JPMorgan Asset Management Asia,Inc., which is the Asian asset management branch of JPMorgan Chase & Co., Inc. (NYSE: JPM). JPMAM−SG providesinvestment management services to Singaporean and international institutions. Their clientele includes sovereign entities,financial institutions, large corporations, pension funds, charities and high−net worth private individuals. In Singapore JPMorganAsset Management Asia comprises two distinct equity investment processes, under the JPMorgan Investment Management(JPMIM−SG) and JF Asset Management (JFAM−SG) umbrellas. JPMIM−SG focuses on Asia Pacific ex−Japan markets, andparticularly on sectors such as basic materials, conglomerates, chemicals, consumer, transportation, utilities, financials, realestate, technology and telecommunications. JFAM−SG is a country ...
Largest Holdings
Name PositionPositionChange
Mkt Val.(MM)
Mkt. ValChg(MM)
%Out
%Port.
Siam Cement Public Co Ltd Ord 18,252,200 13,919,200 233.2 177.8 1.5 2.8Pt United Tractors Tbk Ord 68,734,852 −10,545,878 220.7 −33.9 1.8 2.6Keppel Corp Ltd Ord 19,345,300 −3,034,105 177.9 −27.9 1.1 2.1Dbs Group Holdings Ltd Ord 11,335,660 −1,452,264 146.2 −18.7 0.5 1.7Agricultural Bank of China Ltd. 240,650,000 51,000,000 130.6 27.7 0.8 1.6Samsung Electronics Co. Ltd. 162,461 28,162 130.1 22.5 0.1 1.5Pt Astra International Ord 15,576,000 6,301,755 129.2 52.3 0.4 1.5Samsung Engineering Co. Ltd. 517,000 −197,297 127.5 −48.7 1.3 1.5
Largest Buys
Name PositionPositionChange
Mkt Val.(MM)
Mkt. ValChg(MM)
%Out
%Port.
Siam Cement Public Co Ltd Ord 18,252,200 13,919,200 233.2 177.8 1.5 2.8Fraser &Neave Ltd. 20,786,351 14,046,757 103.6 70.0 1.5 1.2Thai Oil PCL 36,531,345 25,031,760 94.0 64.4 1.8 1.1Indo Tambangraya Megah 13,712,000 9,648,000 81.4 57.3 1.2 1.0Pt Astra International Ord 15,576,000 6,301,755 129.2 52.3 0.4 1.5
Largest Sells
Name PositionPositionChange
Mkt Val.(MM)
Mkt. ValChg(MM)
%Out
%Port.
Siam Cement Public Co Ltd Nvdr 1,799,991 −15,102,584 23.0 −192.9 0.2 0.3Pt Bank Rakyat Indonesia Tbk Ord B 30,824,000 −100,456,702 25.0 −81.5 0.1 0.3Wharf (Holdings) Ltd. 7,891,200 −10,877,550 58.1 −80.0 0.3 0.7PTT Chemical PCL 6,602,800 −12,952,100 36.0 −70.6 0.4 0.4Siam Commercial Bank PCL 10,183,600 −12,556,189 43.2 −53.3 0.3 0.5
Contribution Analysis by IndustryLargest Industry Holdings in
Industry MV(MM) %Port Chg(MM)Regional Banks 956 11.4 −194Trucks/Construction/Farm Machinery 647 7.7 −44Major Banks 546 6.5 19Construction Materials 535 6.4 4Real Estate Development 518 6.2 −155Engineering & Construction 350 4.2 68Industrial Conglomerates 318 3.8 44Coal 304 3.6 18Oil Refining/Marketing 268 3.2 65Agricultural Commodities/Milling 250 3.0 −67
Portfolio Distribution
Top Sector Holdings
Finance − (28.1%)Producer Manufacturing − (14.3%)Non−Energy Minerals − (8.0%)Energy Minerals − (8.0%)Process Industries − (7.9%)Remaining Sectors − (33.7%)
Portfolio Distribution
DistributionsMkt. Val
(MM)Mkt. Val
Chg(MM)%
Port.Mega 316 −10 3.8Large 3,515 −308 41.8Mid 3,811 70 45.3Small 727 107 8.6Micro 15 −9 0.2N/C 7 −1 0.1
2011 FactSet Research Systems Inc. All rights reserved. − Currency: USD
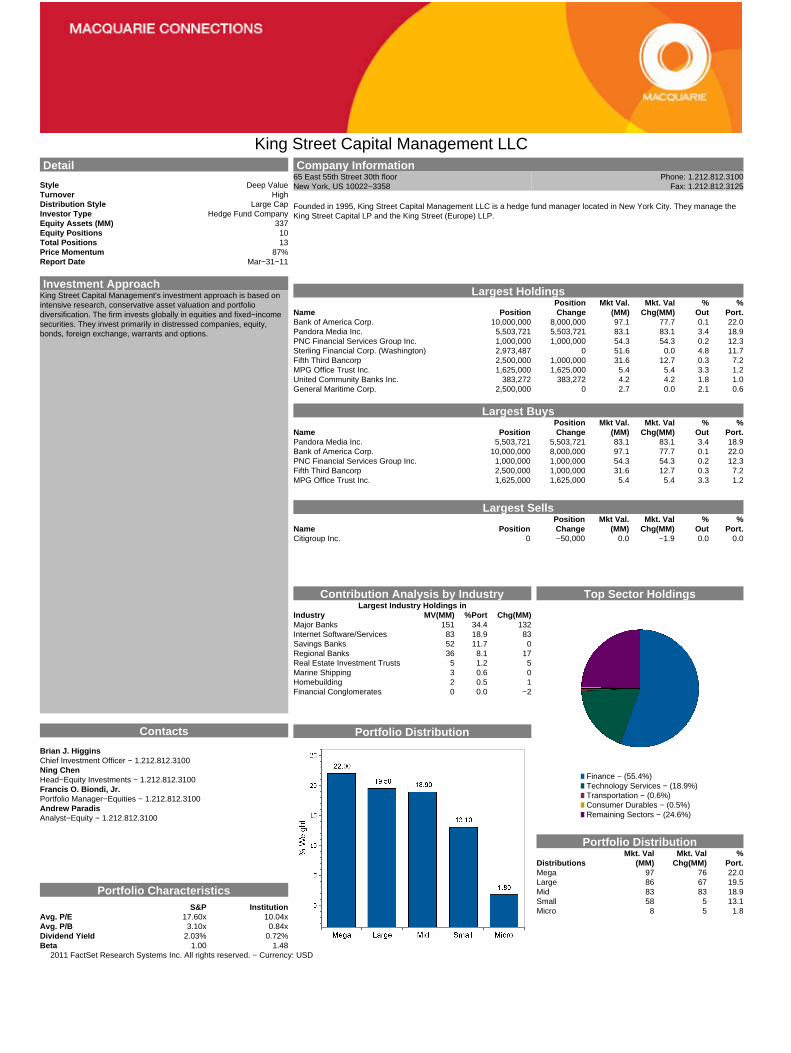
King Street Capital Management LLC Detail
Style Deep ValueTurnover HighDistribution Style Large CapInvestor Type Hedge Fund CompanyEquity Assets (MM) 337Equity Positions 10Total Positions 13Price Momentum 87%Report Date Mar−31−11
Investment ApproachKing Street Capital Management's investment approach is based onintensive research, conservative asset valuation and portfoliodiversification. The firm invests globally in equities and fixed−incomesecurities. They invest primarily in distressed companies, equity,bonds, foreign exchange, warrants and options.
Contacts
Brian J. HigginsChief Investment Officer − 1.212.812.3100Ning ChenHead−Equity Investments − 1.212.812.3100Francis O. Biondi, Jr.Portfolio Manager−Equities − 1.212.812.3100Andrew ParadisAnalyst−Equity − 1.212.812.3100
Portfolio CharacteristicsS&P Institution
Avg. P/E 17.60x 10.04xAvg. P/B 3.10x 0.84xDividend Yield 2.03% 0.72%Beta 1.00 1.48
Company Information65 East 55th Street 30th floor Phone: 1.212.812.3100New York, US 10022−3358 Fax: 1.212.812.3125
Founded in 1995, King Street Capital Management LLC is a hedge fund manager located in New York City. They manage theKing Street Capital LP and the King Street (Europe) LLP.
Largest Holdings
Name PositionPositionChange
Mkt Val.(MM)
Mkt. ValChg(MM)
%Out
%Port.
Bank of America Corp. 10,000,000 8,000,000 97.1 77.7 0.1 22.0Pandora Media Inc. 5,503,721 5,503,721 83.1 83.1 3.4 18.9PNC Financial Services Group Inc. 1,000,000 1,000,000 54.3 54.3 0.2 12.3Sterling Financial Corp. (Washington) 2,973,487 0 51.6 0.0 4.8 11.7Fifth Third Bancorp 2,500,000 1,000,000 31.6 12.7 0.3 7.2MPG Office Trust Inc. 1,625,000 1,625,000 5.4 5.4 3.3 1.2United Community Banks Inc. 383,272 383,272 4.2 4.2 1.8 1.0General Maritime Corp. 2,500,000 0 2.7 0.0 2.1 0.6
Largest Buys
Name PositionPositionChange
Mkt Val.(MM)
Mkt. ValChg(MM)
%Out
%Port.
Pandora Media Inc. 5,503,721 5,503,721 83.1 83.1 3.4 18.9Bank of America Corp. 10,000,000 8,000,000 97.1 77.7 0.1 22.0PNC Financial Services Group Inc. 1,000,000 1,000,000 54.3 54.3 0.2 12.3Fifth Third Bancorp 2,500,000 1,000,000 31.6 12.7 0.3 7.2MPG Office Trust Inc. 1,625,000 1,625,000 5.4 5.4 3.3 1.2
Largest Sells
Name PositionPositionChange
Mkt Val.(MM)
Mkt. ValChg(MM)
%Out
%Port.
Citigroup Inc. 0 −50,000 0.0 −1.9 0.0 0.0
Contribution Analysis by IndustryLargest Industry Holdings in
Industry MV(MM) %Port Chg(MM)Major Banks 151 34.4 132Internet Software/Services 83 18.9 83Savings Banks 52 11.7 0Regional Banks 36 8.1 17Real Estate Investment Trusts 5 1.2 5Marine Shipping 3 0.6 0Homebuilding 2 0.5 1Financial Conglomerates 0 0.0 −2
Portfolio Distribution
Top Sector Holdings
Finance − (55.4%)Technology Services − (18.9%)Transportation − (0.6%)Consumer Durables − (0.5%)Remaining Sectors − (24.6%)
Portfolio Distribution
DistributionsMkt. Val
(MM)Mkt. Val
Chg(MM)%
Port.Mega 97 76 22.0Large 86 67 19.5Mid 83 83 18.9Small 58 5 13.1Micro 8 5 1.8
2011 FactSet Research Systems Inc. All rights reserved. − Currency: USD
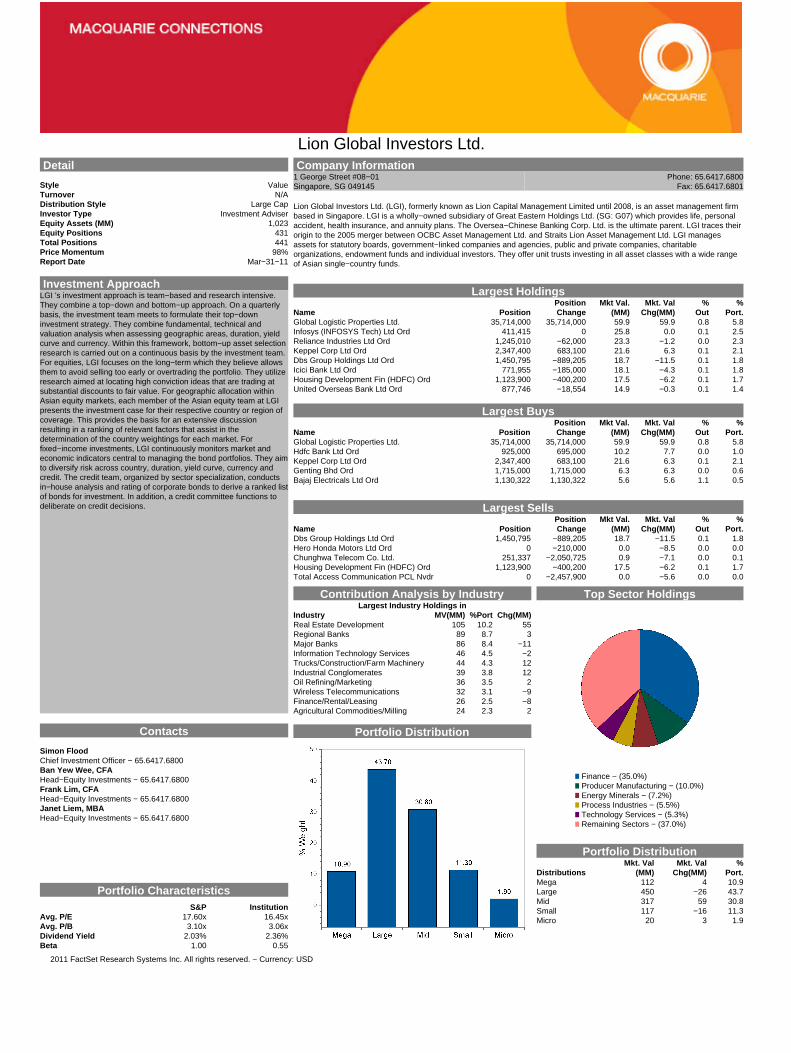
Lion Global Investors Ltd. Detail
Style ValueTurnover N/ADistribution Style Large CapInvestor Type Investment AdviserEquity Assets (MM) 1,023Equity Positions 431Total Positions 441Price Momentum 98%Report Date Mar−31−11
Investment ApproachLGI 's investment approach is team−based and research intensive.They combine a top−down and bottom−up approach. On a quarterlybasis, the investment team meets to formulate their top−downinvestment strategy. They combine fundamental, technical andvaluation analysis when assessing geographic areas, duration, yieldcurve and currency. Within this framework, bottom−up asset selectionresearch is carried out on a continuous basis by the investment team.For equities, LGI focuses on the long−term which they believe allowsthem to avoid selling too early or overtrading the portfolio. They utilizeresearch aimed at locating high conviction ideas that are trading atsubstantial discounts to fair value. For geographic allocation withinAsian equity markets, each member of the Asian equity team at LGIpresents the investment case for their respective country or region ofcoverage. This provides the basis for an extensive discussionresulting in a ranking of relevant factors that assist in thedetermination of the country weightings for each market. Forfixed−income investments, LGI continuously monitors market andeconomic indicators central to managing the bond portfolios. They aimto diversify risk across country, duration, yield curve, currency andcredit. The credit team, organized by sector specialization, conductsin−house analysis and rating of corporate bonds to derive a ranked listof bonds for investment. In addition, a credit committee functions todeliberate on credit decisions.
Contacts
Simon FloodChief Investment Officer − 65.6417.6800Ban Yew Wee, CFAHead−Equity Investments − 65.6417.6800Frank Lim, CFAHead−Equity Investments − 65.6417.6800Janet Liem, MBAHead−Equity Investments − 65.6417.6800
Portfolio CharacteristicsS&P Institution
Avg. P/E 17.60x 16.45xAvg. P/B 3.10x 3.06xDividend Yield 2.03% 2.36%Beta 1.00 0.55
Company Information1 George Street #08−01 Phone: 65.6417.6800Singapore, SG 049145 Fax: 65.6417.6801
Lion Global Investors Ltd. (LGI), formerly known as Lion Capital Management Limited until 2008, is an asset management firmbased in Singapore. LGI is a wholly−owned subsidiary of Great Eastern Holdings Ltd. (SG: G07) which provides life, personalaccident, health insurance, and annuity plans. The Oversea−Chinese Banking Corp. Ltd. is the ultimate parent. LGI traces theirorigin to the 2005 merger between OCBC Asset Management Ltd. and Straits Lion Asset Management Ltd. LGI managesassets for statutory boards, government−linked companies and agencies, public and private companies, charitableorganizations, endowment funds and individual investors. They offer unit trusts investing in all asset classes with a wide rangeof Asian single−country funds.
Largest Holdings
Name PositionPositionChange
Mkt Val.(MM)
Mkt. ValChg(MM)
%Out
%Port.
Global Logistic Properties Ltd. 35,714,000 35,714,000 59.9 59.9 0.8 5.8Infosys (INFOSYS Tech) Ltd Ord 411,415 0 25.8 0.0 0.1 2.5Reliance Industries Ltd Ord 1,245,010 −62,000 23.3 −1.2 0.0 2.3Keppel Corp Ltd Ord 2,347,400 683,100 21.6 6.3 0.1 2.1Dbs Group Holdings Ltd Ord 1,450,795 −889,205 18.7 −11.5 0.1 1.8Icici Bank Ltd Ord 771,955 −185,000 18.1 −4.3 0.1 1.8Housing Development Fin (HDFC) Ord 1,123,900 −400,200 17.5 −6.2 0.1 1.7United Overseas Bank Ltd Ord 877,746 −18,554 14.9 −0.3 0.1 1.4
Largest Buys
Name PositionPositionChange
Mkt Val.(MM)
Mkt. ValChg(MM)
%Out
%Port.
Global Logistic Properties Ltd. 35,714,000 35,714,000 59.9 59.9 0.8 5.8Hdfc Bank Ltd Ord 925,000 695,000 10.2 7.7 0.0 1.0Keppel Corp Ltd Ord 2,347,400 683,100 21.6 6.3 0.1 2.1Genting Bhd Ord 1,715,000 1,715,000 6.3 6.3 0.0 0.6Bajaj Electricals Ltd Ord 1,130,322 1,130,322 5.6 5.6 1.1 0.5
Largest Sells
Name PositionPositionChange
Mkt Val.(MM)
Mkt. ValChg(MM)
%Out
%Port.
Dbs Group Holdings Ltd Ord 1,450,795 −889,205 18.7 −11.5 0.1 1.8Hero Honda Motors Ltd Ord 0 −210,000 0.0 −8.5 0.0 0.0Chunghwa Telecom Co. Ltd. 251,337 −2,050,725 0.9 −7.1 0.0 0.1Housing Development Fin (HDFC) Ord 1,123,900 −400,200 17.5 −6.2 0.1 1.7Total Access Communication PCL Nvdr 0 −2,457,900 0.0 −5.6 0.0 0.0
Contribution Analysis by IndustryLargest Industry Holdings in
Industry MV(MM) %Port Chg(MM)Real Estate Development 105 10.2 55Regional Banks 89 8.7 3Major Banks 86 8.4 −11Information Technology Services 46 4.5 −2Trucks/Construction/Farm Machinery 44 4.3 12Industrial Conglomerates 39 3.8 12Oil Refining/Marketing 36 3.5 2Wireless Telecommunications 32 3.1 −9Finance/Rental/Leasing 26 2.5 −8Agricultural Commodities/Milling 24 2.3 2
Portfolio Distribution
Top Sector Holdings
Finance − (35.0%)Producer Manufacturing − (10.0%)Energy Minerals − (7.2%)Process Industries − (5.5%)Technology Services − (5.3%)Remaining Sectors − (37.0%)
Portfolio Distribution
DistributionsMkt. Val
(MM)Mkt. Val
Chg(MM)%
Port.Mega 112 4 10.9Large 450 −26 43.7Mid 317 59 30.8Small 117 −16 11.3Micro 20 3 1.9
2011 FactSet Research Systems Inc. All rights reserved. − Currency: USD
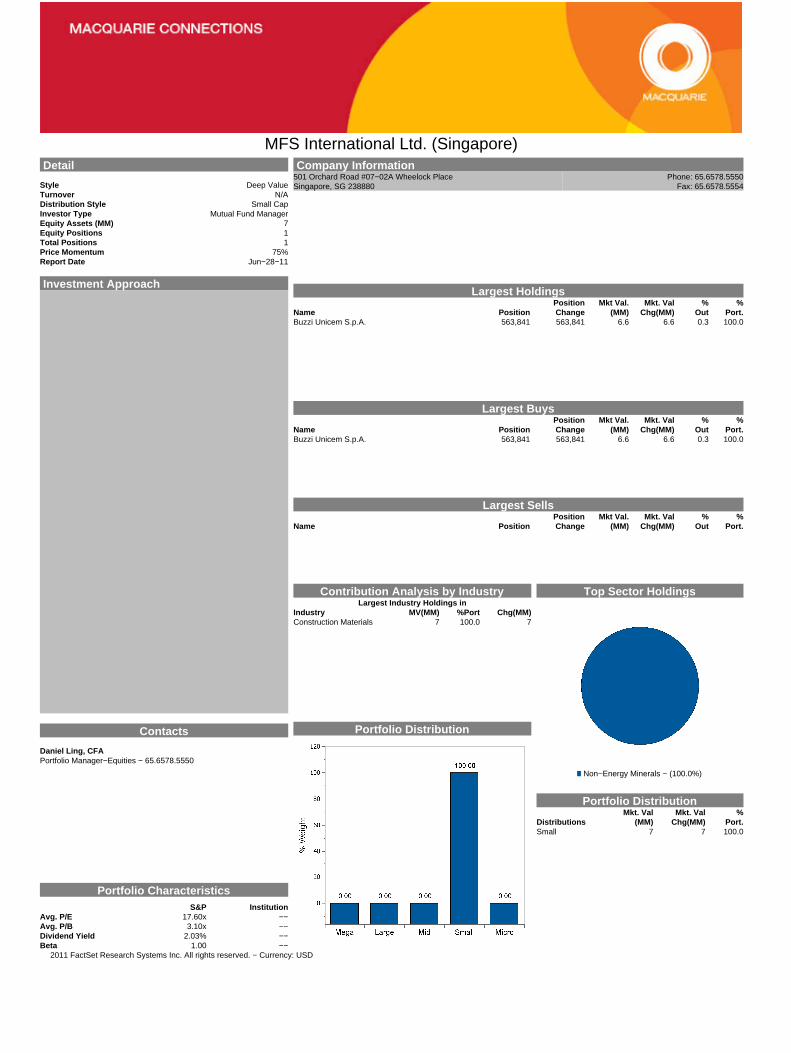
MFS International Ltd. (Singapore) Detail
Style Deep ValueTurnover N/ADistribution Style Small CapInvestor Type Mutual Fund ManagerEquity Assets (MM) 7Equity Positions 1Total Positions 1Price Momentum 75%Report Date Jun−28−11
Investment Approach
Contacts
Daniel Ling, CFAPortfolio Manager−Equities − 65.6578.5550
Portfolio CharacteristicsS&P Institution
Avg. P/E 17.60x −−Avg. P/B 3.10x −−Dividend Yield 2.03% −−Beta 1.00 −−
Company Information501 Orchard Road #07−02A Wheelock Place Phone: 65.6578.5550Singapore, SG 238880 Fax: 65.6578.5554
Largest Holdings
Name PositionPositionChange
Mkt Val.(MM)
Mkt. ValChg(MM)
%Out
%Port.
Buzzi Unicem S.p.A. 563,841 563,841 6.6 6.6 0.3 100.0
Largest Buys
Name PositionPositionChange
Mkt Val.(MM)
Mkt. ValChg(MM)
%Out
%Port.
Buzzi Unicem S.p.A. 563,841 563,841 6.6 6.6 0.3 100.0
Largest Sells
Name PositionPositionChange
Mkt Val.(MM)
Mkt. ValChg(MM)
%Out
%Port.
Contribution Analysis by IndustryLargest Industry Holdings in
Industry MV(MM) %Port Chg(MM)Construction Materials 7 100.0 7
Portfolio Distribution
Top Sector Holdings
Non−Energy Minerals − (100.0%)
Portfolio Distribution
DistributionsMkt. Val
(MM)Mkt. Val
Chg(MM)%
Port.Small 7 7 100.0
2011 FactSet Research Systems Inc. All rights reserved. − Currency: USD
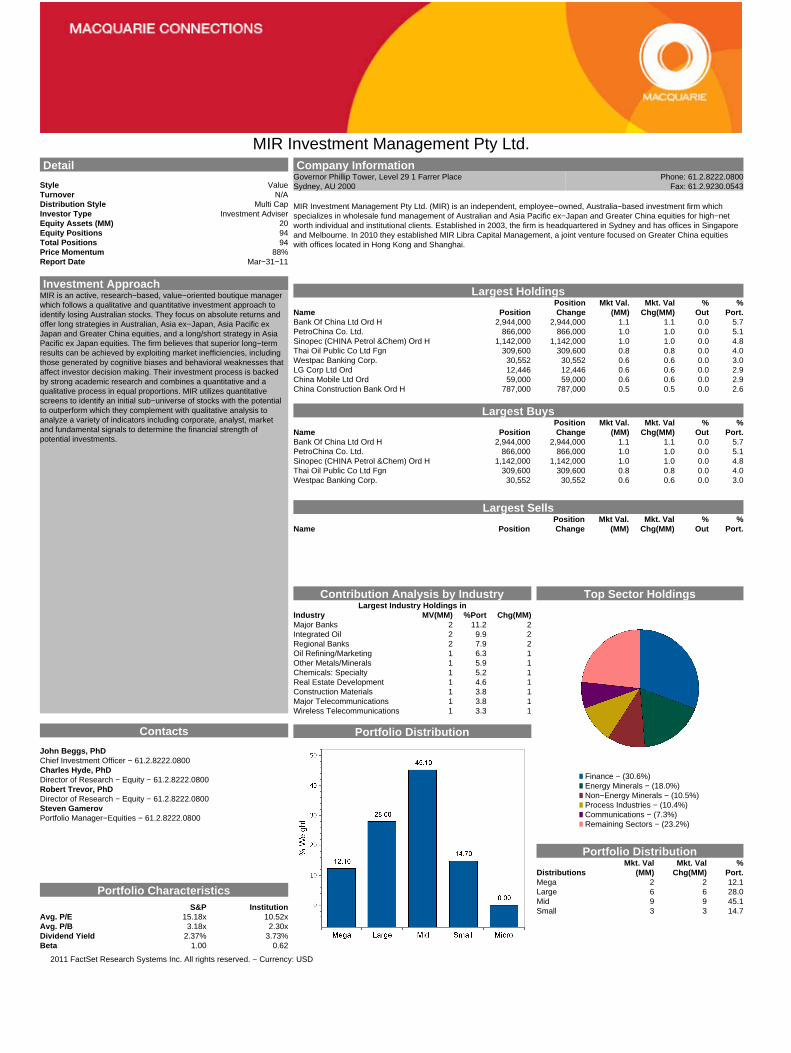
MIR Investment Management Pty Ltd. Detail
Style ValueTurnover N/ADistribution Style Multi CapInvestor Type Investment AdviserEquity Assets (MM) 20Equity Positions 94Total Positions 94Price Momentum 88%Report Date Mar−31−11
Investment ApproachMIR is an active, research−based, value−oriented boutique managerwhich follows a qualitative and quantitative investment approach toidentify losing Australian stocks. They focus on absolute returns andoffer long strategies in Australian, Asia ex−Japan, Asia Pacific exJapan and Greater China equities, and a long/short strategy in AsiaPacific ex Japan equities. The firm believes that superior long−termresults can be achieved by exploiting market inefficiencies, includingthose generated by cognitive biases and behavioral weaknesses thataffect investor decision making. Their investment process is backedby strong academic research and combines a quantitative and aqualitative process in equal proportions. MIR utilizes quantitativescreens to identify an initial sub−universe of stocks with the potentialto outperform which they complement with qualitative analysis toanalyze a variety of indicators including corporate, analyst, marketand fundamental signals to determine the financial strength ofpotential investments.
Contacts
John Beggs, PhDChief Investment Officer − 61.2.8222.0800Charles Hyde, PhDDirector of Research − Equity − 61.2.8222.0800Robert Trevor, PhDDirector of Research − Equity − 61.2.8222.0800Steven GamerovPortfolio Manager−Equities − 61.2.8222.0800
Portfolio CharacteristicsS&P Institution
Avg. P/E 15.18x 10.52xAvg. P/B 3.18x 2.30xDividend Yield 2.37% 3.73%Beta 1.00 0.62
Company InformationGovernor Phillip Tower, Level 29 1 Farrer Place Phone: 61.2.8222.0800Sydney, AU 2000 Fax: 61.2.9230.0543
MIR Investment Management Pty Ltd. (MIR) is an independent, employee−owned, Australia−based investment firm whichspecializes in wholesale fund management of Australian and Asia Pacific ex−Japan and Greater China equities for high−networth individual and institutional clients. Established in 2003, the firm is headquartered in Sydney and has offices in Singaporeand Melbourne. In 2010 they established MIR Libra Capital Management, a joint venture focused on Greater China equitieswith offices located in Hong Kong and Shanghai.
Largest Holdings
Name PositionPositionChange
Mkt Val.(MM)
Mkt. ValChg(MM)
%Out
%Port.
Bank Of China Ltd Ord H 2,944,000 2,944,000 1.1 1.1 0.0 5.7PetroChina Co. Ltd. 866,000 866,000 1.0 1.0 0.0 5.1Sinopec (CHINA Petrol &Chem) Ord H 1,142,000 1,142,000 1.0 1.0 0.0 4.8Thai Oil Public Co Ltd Fgn 309,600 309,600 0.8 0.8 0.0 4.0Westpac Banking Corp. 30,552 30,552 0.6 0.6 0.0 3.0LG Corp Ltd Ord 12,446 12,446 0.6 0.6 0.0 2.9China Mobile Ltd Ord 59,000 59,000 0.6 0.6 0.0 2.9China Construction Bank Ord H 787,000 787,000 0.5 0.5 0.0 2.6
Largest Buys
Name PositionPositionChange
Mkt Val.(MM)
Mkt. ValChg(MM)
%Out
%Port.
Bank Of China Ltd Ord H 2,944,000 2,944,000 1.1 1.1 0.0 5.7PetroChina Co. Ltd. 866,000 866,000 1.0 1.0 0.0 5.1Sinopec (CHINA Petrol &Chem) Ord H 1,142,000 1,142,000 1.0 1.0 0.0 4.8Thai Oil Public Co Ltd Fgn 309,600 309,600 0.8 0.8 0.0 4.0Westpac Banking Corp. 30,552 30,552 0.6 0.6 0.0 3.0
Largest Sells
Name PositionPositionChange
Mkt Val.(MM)
Mkt. ValChg(MM)
%Out
%Port.
Contribution Analysis by IndustryLargest Industry Holdings in
Industry MV(MM) %Port Chg(MM)Major Banks 2 11.2 2Integrated Oil 2 9.9 2Regional Banks 2 7.9 2Oil Refining/Marketing 1 6.3 1Other Metals/Minerals 1 5.9 1Chemicals: Specialty 1 5.2 1Real Estate Development 1 4.6 1Construction Materials 1 3.8 1Major Telecommunications 1 3.8 1Wireless Telecommunications 1 3.3 1
Portfolio Distribution
Top Sector Holdings
Finance − (30.6%)Energy Minerals − (18.0%)Non−Energy Minerals − (10.5%)Process Industries − (10.4%)Communications − (7.3%)Remaining Sectors − (23.2%)
Portfolio Distribution
DistributionsMkt. Val
(MM)Mkt. Val
Chg(MM)%
Port.Mega 2 2 12.1Large 6 6 28.0Mid 9 9 45.1Small 3 3 14.7
2011 FactSet Research Systems Inc. All rights reserved. − Currency: USD
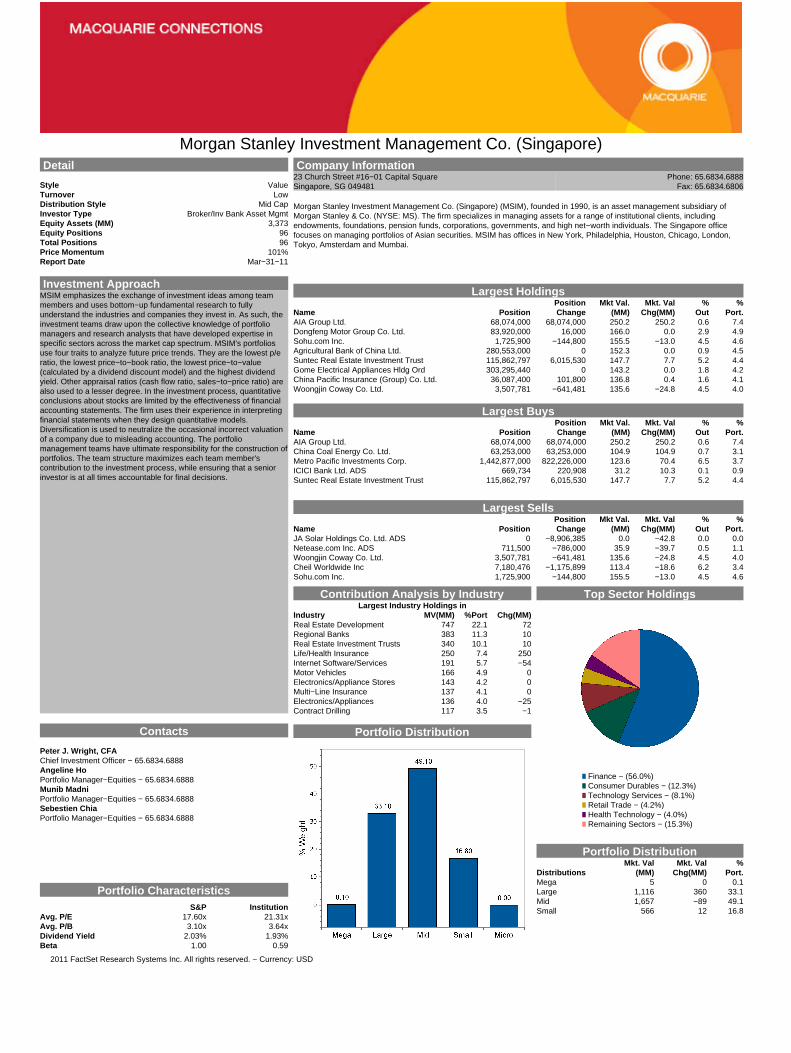
Morgan Stanley Investment Management Co. (Singapore) Detail
Style ValueTurnover LowDistribution Style Mid CapInvestor Type Broker/Inv Bank Asset MgmtEquity Assets (MM) 3,373Equity Positions 96Total Positions 96Price Momentum 101%Report Date Mar−31−11
Investment ApproachMSIM emphasizes the exchange of investment ideas among teammembers and uses bottom−up fundamental research to fullyunderstand the industries and companies they invest in. As such, theinvestment teams draw upon the collective knowledge of portfoliomanagers and research analysts that have developed expertise inspecific sectors across the market cap spectrum. MSIM's portfoliosuse four traits to analyze future price trends. They are the lowest p/eratio, the lowest price−to−book ratio, the lowest price−to−value(calculated by a dividend discount model) and the highest dividendyield. Other appraisal ratios (cash flow ratio, sales−to−price ratio) arealso used to a lesser degree. In the investment process, quantitativeconclusions about stocks are limited by the effectiveness of financialaccounting statements. The firm uses their experience in interpretingfinancial statements when they design quantitative models.Diversification is used to neutralize the occasional incorrect valuationof a company due to misleading accounting. The portfoliomanagement teams have ultimate responsibility for the construction ofportfolios. The team structure maximizes each team member'scontribution to the investment process, while ensuring that a seniorinvestor is at all times accountable for final decisions.
Contacts
Peter J. Wright, CFAChief Investment Officer − 65.6834.6888Angeline HoPortfolio Manager−Equities − 65.6834.6888Munib MadniPortfolio Manager−Equities − 65.6834.6888Sebestien ChiaPortfolio Manager−Equities − 65.6834.6888
Portfolio CharacteristicsS&P Institution
Avg. P/E 17.60x 21.31xAvg. P/B 3.10x 3.64xDividend Yield 2.03% 1.93%Beta 1.00 0.59
Company Information23 Church Street #16−01 Capital Square Phone: 65.6834.6888Singapore, SG 049481 Fax: 65.6834.6806
Morgan Stanley Investment Management Co. (Singapore) (MSIM), founded in 1990, is an asset management subsidiary ofMorgan Stanley & Co. (NYSE: MS). The firm specializes in managing assets for a range of institutional clients, includingendowments, foundations, pension funds, corporations, governments, and high net−worth individuals. The Singapore officefocuses on managing portfolios of Asian securities. MSIM has offices in New York, Philadelphia, Houston, Chicago, London,Tokyo, Amsterdam and Mumbai.
Largest Holdings
Name PositionPositionChange
Mkt Val.(MM)
Mkt. ValChg(MM)
%Out
%Port.
AIA Group Ltd. 68,074,000 68,074,000 250.2 250.2 0.6 7.4Dongfeng Motor Group Co. Ltd. 83,920,000 16,000 166.0 0.0 2.9 4.9Sohu.com Inc. 1,725,900 −144,800 155.5 −13.0 4.5 4.6Agricultural Bank of China Ltd. 280,553,000 0 152.3 0.0 0.9 4.5Suntec Real Estate Investment Trust 115,862,797 6,015,530 147.7 7.7 5.2 4.4Gome Electrical Appliances Hldg Ord 303,295,440 0 143.2 0.0 1.8 4.2China Pacific Insurance (Group) Co. Ltd. 36,087,400 101,800 136.8 0.4 1.6 4.1Woongjin Coway Co. Ltd. 3,507,781 −641,481 135.6 −24.8 4.5 4.0
Largest Buys
Name PositionPositionChange
Mkt Val.(MM)
Mkt. ValChg(MM)
%Out
%Port.
AIA Group Ltd. 68,074,000 68,074,000 250.2 250.2 0.6 7.4China Coal Energy Co. Ltd. 63,253,000 63,253,000 104.9 104.9 0.7 3.1Metro Pacific Investments Corp. 1,442,877,000 822,226,000 123.6 70.4 6.5 3.7ICICI Bank Ltd. ADS 669,734 220,908 31.2 10.3 0.1 0.9Suntec Real Estate Investment Trust 115,862,797 6,015,530 147.7 7.7 5.2 4.4
Largest Sells
Name PositionPositionChange
Mkt Val.(MM)
Mkt. ValChg(MM)
%Out
%Port.
JA Solar Holdings Co. Ltd. ADS 0 −8,906,385 0.0 −42.8 0.0 0.0Netease.com Inc. ADS 711,500 −786,000 35.9 −39.7 0.5 1.1Woongjin Coway Co. Ltd. 3,507,781 −641,481 135.6 −24.8 4.5 4.0Cheil Worldwide Inc 7,180,476 −1,175,899 113.4 −18.6 6.2 3.4Sohu.com Inc. 1,725,900 −144,800 155.5 −13.0 4.5 4.6
Contribution Analysis by IndustryLargest Industry Holdings in
Industry MV(MM) %Port Chg(MM)Real Estate Development 747 22.1 72Regional Banks 383 11.3 10Real Estate Investment Trusts 340 10.1 10Life/Health Insurance 250 7.4 250Internet Software/Services 191 5.7 −54Motor Vehicles 166 4.9 0Electronics/Appliance Stores 143 4.2 0Multi−Line Insurance 137 4.1 0Electronics/Appliances 136 4.0 −25Contract Drilling 117 3.5 −1
Portfolio Distribution
Top Sector Holdings
Finance − (56.0%)Consumer Durables − (12.3%)Technology Services − (8.1%)Retail Trade − (4.2%)Health Technology − (4.0%)Remaining Sectors − (15.3%)
Portfolio Distribution
DistributionsMkt. Val
(MM)Mkt. Val
Chg(MM)%
Port.Mega 5 0 0.1Large 1,116 360 33.1Mid 1,657 −89 49.1Small 566 12 16.8
2011 FactSet Research Systems Inc. All rights reserved. − Currency: USD

Nezu Asia Capital Management Ltd. Detail
Style −−Turnover −−Distribution Style −−Investor Type Hedge Fund CompanyEquity Assets (MM) 0Equity Positions 0Total Positions 0Price Momentum 0%Report Date
Investment ApproachNezu Asia is an active manager which manages equity−focusedhedge funds, aiming to achieve high risk−adjusted returns forinvestors through fundamental research, extensive market experienceand risk management.
Contacts
Nicholas E. S. LongcroftTrading−Equity − 852.3151.3500Richard P. KincaidChief Operating Officer − 852.3151.3500
Portfolio CharacteristicsS&P Institution
Avg. P/E 17.60x −−Avg. P/B 3.10x −−Dividend Yield 2.03% −−Beta 1.00 −−
Company Information22/F 8 Queen's Road Phone: 852.3151.3500Hong Kong, HK Fax: 852.3151.3550
Nezu Asia Capital Management Ltd. (Nezu Asia) is an independent alternative investment firm which was established in 2000.Based in Hong Kong, the firm is an Asia−focused, specialist hedge fund manager which manages the Nezu range ofequity−focused hedge funds. Nezu Asia became a licensed Type 9 Asset Manager with the Hong Kong Securities and FuturesCommission in 2004.
Largest Holdings
Name PositionPositionChange
Mkt Val.(MM)
Mkt. ValChg(MM)
%Out
%Port.
Largest Buys
Name PositionPositionChange
Mkt Val.(MM)
Mkt. ValChg(MM)
%Out
%Port.
Largest Sells
Name PositionPositionChange
Mkt Val.(MM)
Mkt. ValChg(MM)
%Out
%Port.
Contribution Analysis by IndustryLargest Industry Holdings in
Industry MV(MM) %Port Chg(MM)
Portfolio Distribution
Top Sector Holdings
Portfolio Distribution
DistributionsMkt. Val
(MM)Mkt. Val
Chg(MM)%
Port.
2011 FactSet Research Systems Inc. All rights reserved. − Currency: USD
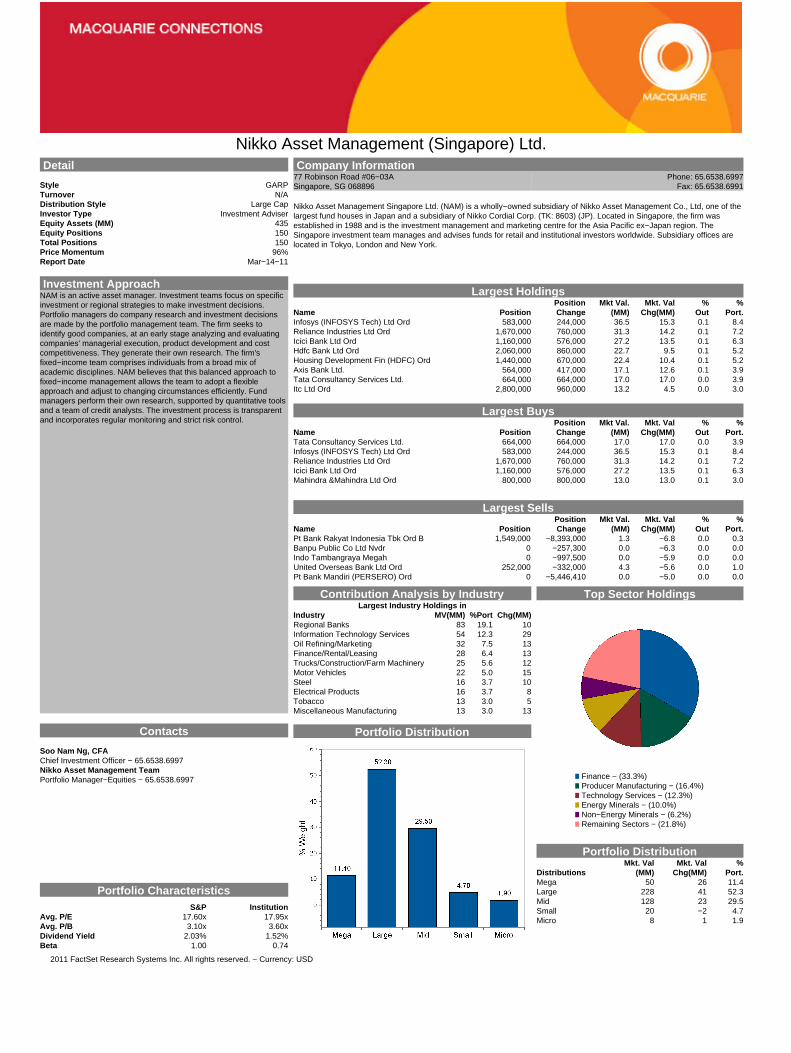
Nikko Asset Management (Singapore) Ltd. Detail
Style GARPTurnover N/ADistribution Style Large CapInvestor Type Investment AdviserEquity Assets (MM) 435Equity Positions 150Total Positions 150Price Momentum 96%Report Date Mar−14−11
Investment ApproachNAM is an active asset manager. Investment teams focus on specificinvestment or regional strategies to make investment decisions.Portfolio managers do company research and investment decisionsare made by the portfolio management team. The firm seeks toidentify good companies, at an early stage analyzing and evaluatingcompanies' managerial execution, product development and costcompetitiveness. They generate their own research. The firm'sfixed−income team comprises individuals from a broad mix ofacademic disciplines. NAM believes that this balanced approach tofixed−income management allows the team to adopt a flexibleapproach and adjust to changing circumstances efficiently. Fundmanagers perform their own research, supported by quantitative toolsand a team of credit analysts. The investment process is transparentand incorporates regular monitoring and strict risk control.
Contacts
Soo Nam Ng, CFAChief Investment Officer − 65.6538.6997Nikko Asset Management TeamPortfolio Manager−Equities − 65.6538.6997
Portfolio CharacteristicsS&P Institution
Avg. P/E 17.60x 17.95xAvg. P/B 3.10x 3.60xDividend Yield 2.03% 1.52%Beta 1.00 0.74
Company Information77 Robinson Road #06−03A Phone: 65.6538.6997Singapore, SG 068896 Fax: 65.6538.6991
Nikko Asset Management Singapore Ltd. (NAM) is a wholly−owned subsidiary of Nikko Asset Management Co., Ltd, one of thelargest fund houses in Japan and a subsidiary of Nikko Cordial Corp. (TK: 8603) (JP). Located in Singapore, the firm wasestablished in 1988 and is the investment management and marketing centre for the Asia Pacific ex−Japan region. TheSingapore investment team manages and advises funds for retail and institutional investors worldwide. Subsidiary offices arelocated in Tokyo, London and New York.
Largest Holdings
Name PositionPositionChange
Mkt Val.(MM)
Mkt. ValChg(MM)
%Out
%Port.
Infosys (INFOSYS Tech) Ltd Ord 583,000 244,000 36.5 15.3 0.1 8.4Reliance Industries Ltd Ord 1,670,000 760,000 31.3 14.2 0.1 7.2Icici Bank Ltd Ord 1,160,000 576,000 27.2 13.5 0.1 6.3Hdfc Bank Ltd Ord 2,060,000 860,000 22.7 9.5 0.1 5.2Housing Development Fin (HDFC) Ord 1,440,000 670,000 22.4 10.4 0.1 5.2Axis Bank Ltd. 564,000 417,000 17.1 12.6 0.1 3.9Tata Consultancy Services Ltd. 664,000 664,000 17.0 17.0 0.0 3.9Itc Ltd Ord 2,800,000 960,000 13.2 4.5 0.0 3.0
Largest Buys
Name PositionPositionChange
Mkt Val.(MM)
Mkt. ValChg(MM)
%Out
%Port.
Tata Consultancy Services Ltd. 664,000 664,000 17.0 17.0 0.0 3.9Infosys (INFOSYS Tech) Ltd Ord 583,000 244,000 36.5 15.3 0.1 8.4Reliance Industries Ltd Ord 1,670,000 760,000 31.3 14.2 0.1 7.2Icici Bank Ltd Ord 1,160,000 576,000 27.2 13.5 0.1 6.3Mahindra &Mahindra Ltd Ord 800,000 800,000 13.0 13.0 0.1 3.0
Largest Sells
Name PositionPositionChange
Mkt Val.(MM)
Mkt. ValChg(MM)
%Out
%Port.
Pt Bank Rakyat Indonesia Tbk Ord B 1,549,000 −8,393,000 1.3 −6.8 0.0 0.3Banpu Public Co Ltd Nvdr 0 −257,300 0.0 −6.3 0.0 0.0Indo Tambangraya Megah 0 −997,500 0.0 −5.9 0.0 0.0United Overseas Bank Ltd Ord 252,000 −332,000 4.3 −5.6 0.0 1.0Pt Bank Mandiri (PERSERO) Ord 0 −5,446,410 0.0 −5.0 0.0 0.0
Contribution Analysis by IndustryLargest Industry Holdings in
Industry MV(MM) %Port Chg(MM)Regional Banks 83 19.1 10Information Technology Services 54 12.3 29Oil Refining/Marketing 32 7.5 13Finance/Rental/Leasing 28 6.4 13Trucks/Construction/Farm Machinery 25 5.6 12Motor Vehicles 22 5.0 15Steel 16 3.7 10Electrical Products 16 3.7 8Tobacco 13 3.0 5Miscellaneous Manufacturing 13 3.0 13
Portfolio Distribution
Top Sector Holdings
Finance − (33.3%)Producer Manufacturing − (16.4%)Technology Services − (12.3%)Energy Minerals − (10.0%)Non−Energy Minerals − (6.2%)Remaining Sectors − (21.8%)
Portfolio Distribution
DistributionsMkt. Val
(MM)Mkt. Val
Chg(MM)%
Port.Mega 50 26 11.4Large 228 41 52.3Mid 128 23 29.5Small 20 −2 4.7Micro 8 1 1.9
2011 FactSet Research Systems Inc. All rights reserved. − Currency: USD

Nomura Asset Management (Singapore) Ltd. Detail
Style GARPTurnover HighDistribution Style Large CapInvestor Type Broker/Inv Bank Asset MgmtEquity Assets (MM) 2,356Equity Positions 587Total Positions 591Price Momentum 96%Report Date Mar−31−11
Investment ApproachNAM−SG is an active value−oriented investment manager with aglobal perspective and a medium− to long−term outlook. The firm'sinvestment philosophy emphasizes multi−faceted research sharedinternationally throughout the group, and local expertise contributedby each overseas team. Their strong research capabilities, supportedand integrated globally by proprietary systems, include fundamentalanalysis, previsions at the corporate level based on company visits,market research, credit analysis, macroeconomic projections andquantitative analysis. The firm's global asset allocation strategy isdetermined by an investment committee at the group level. NAM−SGuses a variety of investment processes, including active, passive andactive quantitative. The firm's funds are invested globally in equity andfixed−income, with a strong focus on the equity markets of the PacificBasin ex−Japan. The majority of their investments are in equity,complemented with bonds and investments in private placementfunds. Their investment process is team−based and combinesbottom−up and top−down strategies, with a bias towards stockpicking.
Contacts
Graham B. Muirhead, CFAHead−Equity Investments − 65.6420.1788Ken LeongPortfolio Manager−Equities − 65.6420.1788Kok Song Ng, CFAPortfolio Manager−Equities − 65.6420.1788Nomura Asset Management TeamPortfolio Manager−Equities − 65.6420.1788
Portfolio CharacteristicsS&P Institution
Avg. P/E 17.60x 19.31xAvg. P/B 3.10x 4.22xDividend Yield 2.03% 1.61%Beta 1.00 0.76
Company Information6 Battery Road #34−01 Phone: 65.6420.1788Singapore, SG 049909 Fax: 65.6420.1799
Nomura Asset Management (Singapore) Ltd. (NAM−SG) is the Singapore office of Tokyo−based Nomura Asset Management.NAM−SG is an international investment management firm and a subsidiary of Nomura Holdings, Inc. (TSE: 8604; NYSE:NMR). Other overseas offices are located in New York, London, Hong Kong, Kuala Lumpur and Seoul. The Singapore officewas established in 1988. NAM−SG manages funds for institutional clients worldwide, including government agencies, publicand private pension funds, multinational corporations, insurance companies and financial institutions. The firm also serves asthe Asia ex−Japan center of competence for the group.
Largest Holdings
Name PositionPositionChange
Mkt Val.(MM)
Mkt. ValChg(MM)
%Out
%Port.
Infosys (INFOSYS Tech) Ltd Ord 3,248,645 1,054,062 203.4 66.0 0.6 8.6Hdfc Bank Ltd Ord 14,847,320 2,278,840 163.8 25.1 0.6 6.9Tata Consultancy Services Ltd. 4,963,600 3,295,000 127.4 84.6 0.3 5.4Tata Motors Ltd Ord 4,797,310 3,388,724 102.9 72.7 0.9 4.4Itc Ltd Ord 21,080,757 −871,623 99.4 −4.1 0.3 4.2Reliance Industries Ltd Ord 5,130,984 −557,514 96.1 −10.4 0.2 4.1Icici Bank Ltd Ord 3,291,800 −129,000 77.3 −3.0 0.3 3.3China National Materials Co. Ltd. 75,855,000 11,776,000 56.1 8.7 6.5 2.4
Largest Buys
Name PositionPositionChange
Mkt Val.(MM)
Mkt. ValChg(MM)
%Out
%Port.
Tata Consultancy Services Ltd. 4,963,600 3,295,000 127.4 84.6 0.3 5.4Tata Motors Ltd Ord 4,797,310 3,388,724 102.9 72.7 0.9 4.4Infosys (INFOSYS Tech) Ltd Ord 3,248,645 1,054,062 203.4 66.0 0.6 8.6Hdfc Bank Ltd Ord 14,847,320 2,278,840 163.8 25.1 0.6 6.9Infrastructure Development Finance Co. Ltd. 6,597,492 6,537,584 18.8 18.6 0.5 0.8
Largest Sells
Name PositionPositionChange
Mkt Val.(MM)
Mkt. ValChg(MM)
%Out
%Port.
Housing Development Fin (HDFC) Ord 375,000 −4,446,155 5.8 −69.3 0.0 0.2Bajaj Auto Ltd. 240,300 −1,773,700 8.0 −58.8 0.1 0.3Hero Honda Motors Ltd Ord 700,000 −892,000 28.3 −36.1 0.4 1.2Bank Of Baroda Ord 341,000 −1,624,000 6.8 −32.3 0.1 0.3Larsen &Toubro Ltd Ord 930,922 −690,879 36.4 −27.0 0.2 1.5
Contribution Analysis by IndustryLargest Industry Holdings in
Industry MV(MM) %Port Chg(MM)Information Technology Services 357 15.1 161Regional Banks 329 13.9 −7Trucks/Construction/Farm Machinery 158 6.7 60Oil Refining/Marketing 117 5.0 −13Tobacco 104 4.4 −5Industrial Machinery 73 3.1 5Engineering & Construction 61 2.6 21Oil & Gas Production 52 2.2 −10Motor Vehicles 51 2.2 −94Electrical Products 51 2.2 3
Portfolio Distribution
Top Sector Holdings
Finance − (20.4%)Technology Services − (17.2%)Producer Manufacturing − (14.8%)Energy Minerals − (9.6%)Consumer Non−Durables − (7.3%)Remaining Sectors − (30.8%)
Portfolio Distribution
DistributionsMkt. Val
(MM)Mkt. Val
Chg(MM)%
Port.Mega 477 150 20.2Large 1,041 8 44.2Mid 511 −47 21.7Small 315 75 13.4Micro 9 −1 0.4N/C 2 −1 0.1
2011 FactSet Research Systems Inc. All rights reserved. − Currency: USD
Noonday Asset Management (Asia) Pte Ltd. Detail
Style −−Turnover −−Distribution Style −−Investor Type Hedge Fund CompanyEquity Assets (MM) 0Equity Positions 0Total Positions 0Price Momentum 0%Report Date
Investment ApproachNAM is an opportunistic value−oriented manager which seeks toachieve high risk−adjusted rates of return by pursuing multipleinvestment strategies. The firm manages portfolios invested globallyin fixed−income, equity, venture capital and real estate, focusing onboth developed and emerging markets. They actively invest in thefinancial services, healthcare, energy and infrastructure industries inthe US, Europe, Australia, and Asia. NAM's investment approach isbased on in−house fundamental research, which includes consultingwith industry, legal and regulatory advisors as well as meeting withthe management of the companies in which they invest. The firmseeks to identify businesses with substantial franchise value, healthycash flow, and strong management teams with aligned incentives.NAM's merger arbitrage effort focuses on US, international orcross−border corporate takeovers. The firm also makes creditinvestments in companies experiencing financial distress or whosecredit is poor but expected to improve. Finally NAM has developedexpertise as an investor in real estate assets, including fee simpleinterests, leaseholds, mortgages or other real estate assets that theybelieve are undervalued or inefficiently managed or financed.
Contacts
Raymond G. Zage, CPAChief Investment Officer − 65.6338.2132Ashish GuptaPortfolio Manager−Equities − 65.6338.2132Jefferson Chen, MBAPortfolio Manager−Equities − 65.6338.2132Mino EncarnacionPortfolio Manager−Equities − 65.6338.2132
Portfolio CharacteristicsS&P Institution
Avg. P/E 16.85x −−Avg. P/B 2.97x −−Dividend Yield 2.11% −−Beta 1.00 −−
Company Information250 North Bridge Road #31−01 Raffles City Tower Phone: 65.6338.2132Singapore, SG 179101 Fax: 65.6333.3198
Noonday Asset Management (Asia) Pte Ltd. (NAM−A) is the Singapore−based sub advisor of Noonday Global ManagementLtd., a global private investment management firm headquartered in Charlotte, North Carolina. Founded in 1997, the firm hasan additional sub advisory office in London. NAM manages discretionary capital for institutional investors and high net−worthindividuals, through its relationship with Farallon Capital Management LLC.
Largest Holdings
Name PositionPositionChange
Mkt Val.(MM)
Mkt. ValChg(MM)
%Out
%Port.
Largest Buys
Name PositionPositionChange
Mkt Val.(MM)
Mkt. ValChg(MM)
%Out
%Port.
Largest Sells
Name PositionPositionChange
Mkt Val.(MM)
Mkt. ValChg(MM)
%Out
%Port.
Contribution Analysis by IndustryLargest Industry Holdings in
Industry MV(MM) %Port Chg(MM)
Portfolio Distribution
Top Sector Holdings
Portfolio Distribution
DistributionsMkt. Val
(MM)Mkt. Val
Chg(MM)%
Port.
2011 FactSet Research Systems Inc. All rights reserved. − Currency: USD
Norges Bank Investment Management (Singapore Branch) Detail
Style −−Turnover −−Distribution Style −−Investor Type Sovereign Wealth ManagerEquity Assets (MM) 0Equity Positions 0Total Positions 0Price Momentum 0%Report Date
Investment ApproachNBIM−Singapore is an active manager which also uses externalmanagers to manage parts of the Government Pension Fund Global,seeking to use their expertise to identify investment opportunities thatwill generate an excess return. The fund only invests outside Norway,making equity investments in Europe, the Americas, Africa and theMiddle East, Asia and Oceania and fixed−income investments inEurope, the Americas, Asia and Oceania. The firm aims to get thehighest possible return on the fund within the investment mandate setby the Ministry of Finance, which sets the investment strategy inconsultation with advisers including NBIM. The fund invests inequities, fixed−income securities and real estate, aiming to achieve ahigher return than their benchmark portfolio, which consists of a globalequities index, a global fixed−income index and a global real estateindex. They make investment decisions when fundamental strategiesare used to invest in companies, analyzing individual issuers debt andequity securities, to find and exploit mispriced assets they expect willgenerate solid returns over time. Active investment decisions are alsomade in the fund's management of systematic risk factors. These arecommon characteristics that securities have to varying degrees andthat contribute to both risk and return on different securities.Systematic risk is a key part of the fund's risk management and canalso be a source of excess return through active investmentdecisions. Liquidity and volatility are among the most importantsystematic risk factors. Real estate investments are spread overdifferent types of sectors, properties and securities in Europeancountries except Norway, mainly investing in unlisted real estate,well−developed property markets and traditional property types.Investments are typically funded with capital from the fixed−incomeportfolio.
Contacts
Sigmund KyrdalenHead−Equity Investments − 65.6571.6000
Portfolio CharacteristicsS&P Institution
Avg. P/E 16.05x −−Avg. P/B 3.28x −−Dividend Yield 2.26% −−Beta 1.00 −−
Company InformationOne Raffles Quay #19−03 North Tower Phone: 65.6571.6000Singapore, SG 048583 Fax:
Norges Bank Investment Management (Singapore Branch) (NBIM−Singapore) is the Singapore−based asset management unitof the Norwegian central bank, Norges Bank. NBIM was established by Norges Bank in 1998 to manage the GovernmentPension Fund Global, most of Norges Bank's foreign exchange reserves and the Government Petroleum Insurance Fund. Inaddition to the Singapore branch, NBIM has offices in Oslo, London, New York and Shanghai.
Largest Holdings
Name PositionPositionChange
Mkt Val.(MM)
Mkt. ValChg(MM)
%Out
%Port.
Largest Buys
Name PositionPositionChange
Mkt Val.(MM)
Mkt. ValChg(MM)
%Out
%Port.
Largest Sells
Name PositionPositionChange
Mkt Val.(MM)
Mkt. ValChg(MM)
%Out
%Port.
Contribution Analysis by IndustryLargest Industry Holdings in
Industry MV(MM) %Port Chg(MM)
Portfolio Distribution
Top Sector Holdings
Portfolio Distribution
DistributionsMkt. Val
(MM)Mkt. Val
Chg(MM)%
Port.
2011 FactSet Research Systems Inc. All rights reserved. − Currency: USD

Pacific Group Ltd. Detail
Style −−Turnover −−Distribution Style −−Investor Type Hedge Fund CompanyEquity Assets (MM) 0Equity Positions 0Total Positions 0Price Momentum 0%Report Date
Investment ApproachPGL is an active manager which employs a equity long/short strategywith a macro overlay, investing primarily in equities listed on theHKSE. Through their fund, the firm targets annual returns of 10−20%over a three to five year period, aiming to preserve capital on anannualized basis.
Contacts
William S. Kaye, MBAChief Investment Officer − 852.2810.1399Cecilia MakPortfolio Manager−Equities − 852.2810.1399Jacky SoongChief Operating Officer − 852.2810.1399
Portfolio CharacteristicsS&P Institution
Avg. P/E 15.18x −−Avg. P/B 3.18x −−Dividend Yield 2.37% −−Beta 1.00 −−
Company InformationSuite 2501 9 Queen's Road Phone: 852.2810.1399Hong Kong, HK Fax: 852.2524.1280
Pacific Group Ltd. (PGL) is the alternative investment management subsidiary of Pacific Alliance Group Ltd. in Hong Kong,founded in 1991 by William Samuel Kaye. PGL was established in 2005 and manages the Greater Asian Hedge Fundexclusively for sophisticated investors.
Largest Holdings
Name PositionPositionChange
Mkt Val.(MM)
Mkt. ValChg(MM)
%Out
%Port.
Largest Buys
Name PositionPositionChange
Mkt Val.(MM)
Mkt. ValChg(MM)
%Out
%Port.
Largest Sells
Name PositionPositionChange
Mkt Val.(MM)
Mkt. ValChg(MM)
%Out
%Port.
Contribution Analysis by IndustryLargest Industry Holdings in
Industry MV(MM) %Port Chg(MM)
Portfolio Distribution
Top Sector Holdings
Portfolio Distribution
DistributionsMkt. Val
(MM)Mkt. Val
Chg(MM)%
Port.
2011 FactSet Research Systems Inc. All rights reserved. − Currency: USD

Prudential Asset Management (Singapore) Ltd. Detail
Style ValueTurnover MediumDistribution Style Large CapInvestor Type Insurance Management DivisionEquity Assets (MM) 11,732Equity Positions 698Total Positions 715Price Momentum 98%Report Date Mar−31−11
Investment ApproachPAM−S is a value−oriented investor and manages portfolios investedin global equity and fixed−income with a strong focus on the AsiaPacific region. The firm has access to the global research and fundmanagement resources of the Prudential Group in Europe, USA andkey Asian markets including Japan, Taiwan, Korea, India andMalaysia. They do not have any market cap restrictions, but the bulkof investments is in large−cap equity. PAM−S follows a bottom−upinvestment approach, and fund managers try to gain anunderstanding of each company and sector before making investmentdecisions. They aim to select sound companies whose share pricesdo not currently reflect the potential value of their businesses. Thisresearch process is also supported by a company visitation program.PAM−S conducts in−house research but also outsources someresearch from third−party analysts.
Contacts
Kelvin BlacklockChief Investment Officer − 65.6317.9618Kevin GibsonChief Investment Officer − 65.6317.9618Michael Lim Foong LiatChief Investment Officer − 65.6317.9618Andrew C. Cormie, CFAPortfolio Manager−Equities − 65.6317.9618
Portfolio CharacteristicsS&P Institution
Avg. P/E 17.60x 18.02xAvg. P/B 3.10x 2.97xDividend Yield 2.03% 2.60%Beta 1.00 0.63
Company Information10 Marina Boulevard #32−01 Marina Bay Financial Centre T Phone: 65.6317.9618Singapore, SG 018983 Fax: 65.6536.3521
Prudential Asset Management (Singapore) Ltd. (PAM−S) was established in 1994 as the Singapore−based asset managementarm of London−based Prudential Plc (LSE: PRU). The firm specializes in life insurances and manages mutual funds for retailcustomers.
Largest Holdings
Name PositionPositionChange
Mkt Val.(MM)
Mkt. ValChg(MM)
%Out
%Port.
Fraser &Neave Ltd. 112,300,259 −461,000 559.8 −2.3 8.0 4.7Reliance Industries Ltd Ord 13,169,632 5,159,145 246.7 96.6 0.4 2.1Oil &Natural Gas Corp Ord 33,548,523 4,364,527 204.0 26.5 0.4 1.7Hdfc Bank Ltd Ord 16,872,595 14,083,040 186.1 155.3 0.7 1.6Bank Of China Ltd Ord H 387,433,067 −26,231,836 178.4 −12.1 0.5 1.5Itc Ltd Ord 35,022,884 19,072,017 165.1 89.9 0.5 1.4CNOOC Ltd. 61,845,483 −8,421,213 138.2 −18.8 0.1 1.2Infosys (INFOSYS Tech) Ltd Ord 2,183,591 102,872 136.7 6.4 0.4 1.1
Largest Buys
Name PositionPositionChange
Mkt Val.(MM)
Mkt. ValChg(MM)
%Out
%Port.
Hdfc Bank Ltd Ord 16,872,595 14,083,040 186.1 155.3 0.7 1.6Reliance Industries Ltd Ord 13,169,632 5,159,145 246.7 96.6 0.4 2.1Itc Ltd Ord 35,022,884 19,072,017 165.1 89.9 0.5 1.4Bharti Airtel Ltd. 12,890,530 8,323,149 127.5 82.3 0.3 1.1Housing Development Fin (HDFC) Ord 5,735,234 5,210,114 89.4 81.2 0.4 0.7
Largest Sells
Name PositionPositionChange
Mkt Val.(MM)
Mkt. ValChg(MM)
%Out
%Port.
Tata Consultancy Services Ltd. 1,029,464 −5,813,239 26.4 −149.2 0.1 0.2Focus Media Holding Ltd. ADS 2,344,200 −2,309,000 77.1 −75.9 1.7 0.6Hutchison Whampoa Ltd Ord 5,438,953 −4,738,155 63.4 −55.2 0.1 0.5Hindustan Unilever Ltd. 94,518 −6,829,995 0.7 −50.1 0.0 0.0Sinopec (CHINA Petrol &Chem) Ord H 53,067,662 −49,305,417 52.4 −48.6 0.3 0.4
Contribution Analysis by IndustryLargest Industry Holdings in
Industry MV(MM) %Port Chg(MM)Regional Banks 1,161 9.7 303Major Banks 772 6.5 2Industrial Conglomerates 659 5.5 −84Major Telecommunications 506 4.2 47Oil & Gas Production 460 3.9 76Real Estate Development 406 3.4 46Wireless Telecommunications 378 3.2 118Electric Utilities 347 2.9 17Finance/Rental/Leasing 316 2.6 122Oil Refining/Marketing 313 2.6 86
Portfolio Distribution
Top Sector Holdings
Finance − (26.7%)Producer Manufacturing − (11.0%)Energy Minerals − (9.1%)Communications − (7.4%)Electronic Technology − (5.6%)Remaining Sectors − (40.1%)
Portfolio Distribution
DistributionsMkt. Val
(MM)Mkt. Val
Chg(MM)%
Port.Mega 1,537 −102 12.9Large 4,612 621 38.7Mid 3,993 338 33.5Small 889 187 7.5Micro 52 −6 0.4
2011 FactSet Research Systems Inc. All rights reserved. − Currency: USD
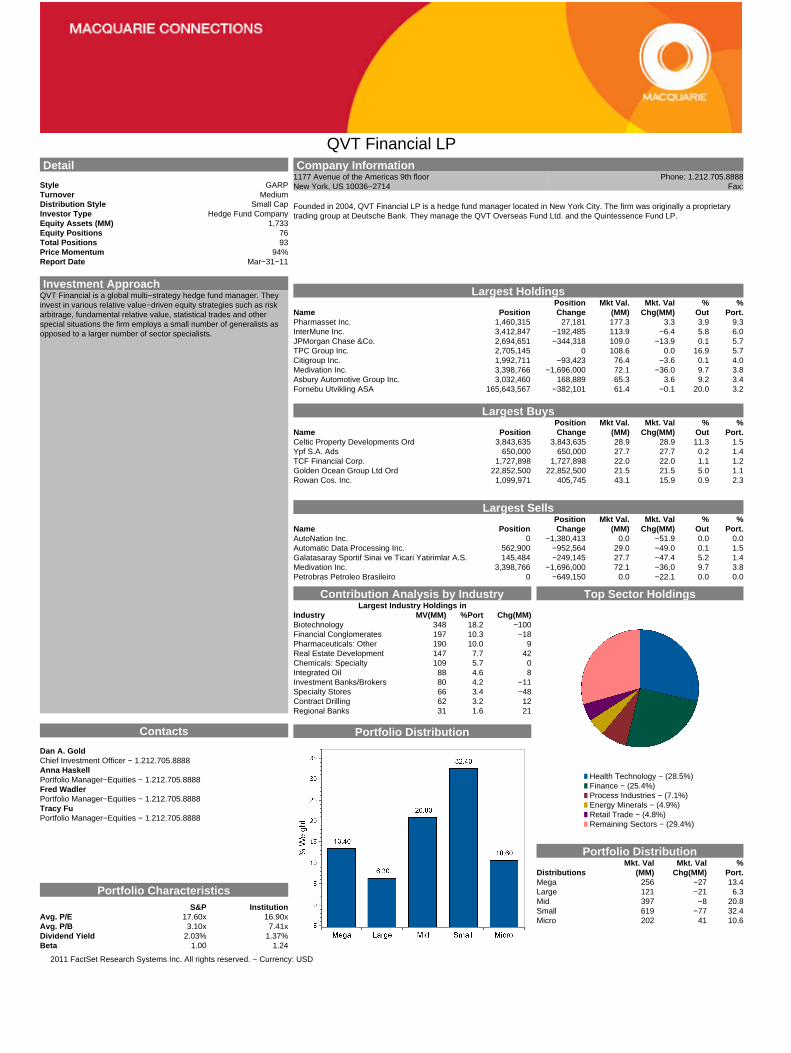
QVT Financial LP Detail
Style GARPTurnover MediumDistribution Style Small CapInvestor Type Hedge Fund CompanyEquity Assets (MM) 1,733Equity Positions 76Total Positions 93Price Momentum 94%Report Date Mar−31−11
Investment ApproachQVT Financial is a global multi−strategy hedge fund manager. Theyinvest in various relative value−driven equity strategies such as riskarbitrage, fundamental relative value, statistical trades and otherspecial situations the firm employs a small number of generalists asopposed to a larger number of sector specialists.
Contacts
Dan A. GoldChief Investment Officer − 1.212.705.8888Anna HaskellPortfolio Manager−Equities − 1.212.705.8888Fred WadlerPortfolio Manager−Equities − 1.212.705.8888Tracy FuPortfolio Manager−Equities − 1.212.705.8888
Portfolio CharacteristicsS&P Institution
Avg. P/E 17.60x 16.90xAvg. P/B 3.10x 7.41xDividend Yield 2.03% 1.37%Beta 1.00 1.24
Company Information1177 Avenue of the Americas 9th floor Phone: 1.212.705.8888New York, US 10036−2714 Fax:
Founded in 2004, QVT Financial LP is a hedge fund manager located in New York City. The firm was originally a proprietarytrading group at Deutsche Bank. They manage the QVT Overseas Fund Ltd. and the Quintessence Fund LP.
Largest Holdings
Name PositionPositionChange
Mkt Val.(MM)
Mkt. ValChg(MM)
%Out
%Port.
Pharmasset Inc. 1,460,315 27,181 177.3 3.3 3.9 9.3InterMune Inc. 3,412,847 −192,485 113.9 −6.4 5.8 6.0JPMorgan Chase &Co. 2,694,651 −344,318 109.0 −13.9 0.1 5.7TPC Group Inc. 2,705,145 0 108.6 0.0 16.9 5.7Citigroup Inc. 1,992,711 −93,423 76.4 −3.6 0.1 4.0Medivation Inc. 3,398,766 −1,696,000 72.1 −36.0 9.7 3.8Asbury Automotive Group Inc. 3,032,460 168,889 65.3 3.6 9.2 3.4Fornebu Utvikling ASA 165,643,567 −382,101 61.4 −0.1 20.0 3.2
Largest Buys
Name PositionPositionChange
Mkt Val.(MM)
Mkt. ValChg(MM)
%Out
%Port.
Celtic Property Developments Ord 3,843,635 3,843,635 28.9 28.9 11.3 1.5Ypf S.A. Ads 650,000 650,000 27.7 27.7 0.2 1.4TCF Financial Corp. 1,727,898 1,727,898 22.0 22.0 1.1 1.2Golden Ocean Group Ltd Ord 22,852,500 22,852,500 21.5 21.5 5.0 1.1Rowan Cos. Inc. 1,099,971 405,745 43.1 15.9 0.9 2.3
Largest Sells
Name PositionPositionChange
Mkt Val.(MM)
Mkt. ValChg(MM)
%Out
%Port.
AutoNation Inc. 0 −1,380,413 0.0 −51.9 0.0 0.0Automatic Data Processing Inc. 562,900 −952,564 29.0 −49.0 0.1 1.5Galatasaray Sportif Sinai ve Ticari Yatirimlar A.S. 145,484 −249,145 27.7 −47.4 5.2 1.4Medivation Inc. 3,398,766 −1,696,000 72.1 −36.0 9.7 3.8Petrobras Petroleo Brasileiro 0 −649,150 0.0 −22.1 0.0 0.0
Contribution Analysis by IndustryLargest Industry Holdings in
Industry MV(MM) %Port Chg(MM)Biotechnology 348 18.2 −100Financial Conglomerates 197 10.3 −18Pharmaceuticals: Other 190 10.0 9Real Estate Development 147 7.7 42Chemicals: Specialty 109 5.7 0Integrated Oil 88 4.6 8Investment Banks/Brokers 80 4.2 −11Specialty Stores 66 3.4 −48Contract Drilling 62 3.2 12Regional Banks 31 1.6 21
Portfolio Distribution
Top Sector Holdings
Health Technology − (28.5%)Finance − (25.4%)Process Industries − (7.1%)Energy Minerals − (4.9%)Retail Trade − (4.8%)Remaining Sectors − (29.4%)
Portfolio Distribution
DistributionsMkt. Val
(MM)Mkt. Val
Chg(MM)%
Port.Mega 256 −27 13.4Large 121 −21 6.3Mid 397 −8 20.8Small 619 −77 32.4Micro 202 41 10.6
2011 FactSet Research Systems Inc. All rights reserved. − Currency: USD
Rockhampton Management (Singapore) Pte Ltd. Detail
Style −−Turnover −−Distribution Style −−Investor Type Hedge Fund CompanyEquity Assets (MM) 0Equity Positions 0Total Positions 0Price Momentum 0%Report Date
Investment ApproachRockhampton−Singapore is a risk−conscious alternative investmentmanager investing in Japanese equity. They invest in large−capequity as well as in the small− to mid−cap market segment where theyhave specialist expertise. The firm's investment philosophyemphasizes return consistency, and adaptability to widely differentmarket conditions and through different investment cycles. Theirinvestment approach relies on a broad range of investment strategies,and seeks to maintain strong downside protection. The Yaraka fund isprimarily invested in small− to mid−cap Japanese equity,complemented with large−cap equity and Japanese real estate trusts.The firm follows a long/short investment approach.
Contacts
Geoffrey FordayPortfolio Manager−Equities − 65.6224.7300
Portfolio CharacteristicsS&P Institution
Avg. P/E 17.60x −−Avg. P/B 3.10x −−Dividend Yield 2.03% −−Beta 1.00 −−
Company InformationDuxton Hill #24−00 C Phone: 65.6224.7300Singapore, SG 089607 Fax: 65.6224.2045
Rockhampton Management (Singapore) Pte Ltd. (Rockhampton−Singapore) is the asset management subsidiary ofRockhampton Management Ltd., itself a subsidiary of Silverstone Capital LLP in the UK. Established in 2003, the firm is locatedin Singapore and operates jointly with their twin office in Hong Kong. Rockhampton−Singapore is an alternative investmentspecialist. The firm manages Asian hedge funds including the Rockhampton fund and the Yaraka fund. Their clients areinstitutions and high−net worth individuals.
Largest Holdings
Name PositionPositionChange
Mkt Val.(MM)
Mkt. ValChg(MM)
%Out
%Port.
Largest Buys
Name PositionPositionChange
Mkt Val.(MM)
Mkt. ValChg(MM)
%Out
%Port.
Largest Sells
Name PositionPositionChange
Mkt Val.(MM)
Mkt. ValChg(MM)
%Out
%Port.
Contribution Analysis by IndustryLargest Industry Holdings in
Industry MV(MM) %Port Chg(MM)
Portfolio Distribution
Top Sector Holdings
Portfolio Distribution
DistributionsMkt. Val
(MM)Mkt. Val
Chg(MM)%
Port.
2011 FactSet Research Systems Inc. All rights reserved. − Currency: USD

Detail Company Information77 Robinson Road # 31-00 Phone: +65 6536 6848
Style -- Robinson 77, Singapore 068896 Fax: +65 6536 3866Turnover --Distribution Stule --Investor TypeEquity Assets ($MM) 0Equity Positions 0Total Positions 0Price Momentum 0%Report Date
Investment ApproachLargest Holdings
Position Mkt Val. Pos Chg % %Name Position Change ($MM) MV($MM) Out Port.
Largest BuysPosition Mkt Val. Pos Chg % %
Name Position Change ($MM) MV($MM) Out Port.
Largest SellsPosition Mkt Val. Pos Chg % %
Name Position Change ($MM) MV($MM) Out Port.
Contribution Analysis by Industry Top Sector HoldingsLargest Industry Holdings
Industry MV ($MM) % Port $ Chg
Contacts Portfolio Distribution
Portfolio Characteristics
S&P InstitutionAvg. P/EAvg. P/BDividend YieldBeta
Founded in 1841, Bank Sarasin proudly nurtures one of Switzerland's longest traditions in private banking excellence. They specialize in investment advisory and asset management services for private and institutional clients. Bank Sarasin has assets under management of CHF 101.6 billion*. In 2011, their superior reputation and experience were again recognized when, for the eighth consecutive year, they were ranked first in Elite Report for investment advice, risk information and services to private clients. To maintain their leading position, Bank Sarasin will continue to focus intently on people and innovation.
Bank Sarasin-Rabo (Asia) Limited
0.0
0.2
0.4
0.6
0.8
1.0
1.2
© 2006-2007 FactSet Research Systems Inc. All rights reserved.

Silver Metis Capital Management Pte Ltd. Detail
Style −−Turnover −−Distribution Style −−Investor Type Hedge Fund CompanyEquity Assets (MM) 0Equity Positions 0Total Positions 0Price Momentum 0%Report Date
Investment ApproachSilver Metis is an active manager which employs an Asia−Pacificex−Japan long/short equity strategy with a long bias to invest incompanies in the Asia Pacific region.
Contacts
Samir Mehta, CFAChief Investment Officer − 65.6511.6308Cho Yu Kooi, CFAPortfolio Manager−Equities − 65.6511.6308
Portfolio CharacteristicsS&P Institution
Avg. P/E 15.18x −−Avg. P/B 3.18x −−Dividend Yield 2.37% −−Beta 1.00 −−
Company Information25 Church Street #02−01A Capital Square Three Phone: 65.6511.6308Singapore, SG 049482 Fax: 65.6511.6319
Silver Metis Capital Management Pte Ltd. (Silver Metis) is the Singapore−based alternative investment subsidiary of JOHambro Capital Management Group Ltd. in Great Britain. The firm was founded in 2007 by Samir Mehta and Ashley Silveiraspecializing in the Asia Pacific region. The co−founders previously worked at Lloyd George Management and Credit Suisse'sAbsoute Return Group, respectively.
Largest Holdings
Name PositionPositionChange
Mkt Val.(MM)
Mkt. ValChg(MM)
%Out
%Port.
Largest Buys
Name PositionPositionChange
Mkt Val.(MM)
Mkt. ValChg(MM)
%Out
%Port.
Largest Sells
Name PositionPositionChange
Mkt Val.(MM)
Mkt. ValChg(MM)
%Out
%Port.
Contribution Analysis by IndustryLargest Industry Holdings in
Industry MV(MM) %Port Chg(MM)
Portfolio Distribution
Top Sector Holdings
Portfolio Distribution
DistributionsMkt. Val
(MM)Mkt. Val
Chg(MM)%
Port.
2011 FactSet Research Systems Inc. All rights reserved. − Currency: USD

Spinnaker Capital (Asia) Pte Ltd. Detail
Style −−Turnover −−Distribution Style −−Investor Type Hedge Fund CompanyEquity Assets (MM) 0Equity Positions 0Total Positions 0Price Momentum 0%Report Date
Investment ApproachSpinnaker−Asia is an active manager which invests through theirfunds primarily in emerging market securities. The firm utilizes variouscriteria for investing, including special situations, events, cashflow andvalue criteria.
Contacts
Christopher Ian TeagueCorporate Officer/Principal − 65.6303.9900
Portfolio CharacteristicsS&P Institution
Avg. P/E 15.18x −−Avg. P/B 3.18x −−Dividend Yield 2.37% −−Beta 1.00 −−
Company Information16, Collyer Quay #34−02 Hitachi Tower Phone: 65.6303.9900Singapore, SG 049318 Fax:
Spinnaker Capital (Asia) Pte Ltd. (Spinnaker−Asia) is the Singapore−based alternative investment subsidiary of SpinnakerCapital Ltd. in Great Britain. Established in 2003, the firm manages funds primarily for high−net worth individuals.
Largest Holdings
Name PositionPositionChange
Mkt Val.(MM)
Mkt. ValChg(MM)
%Out
%Port.
Largest Buys
Name PositionPositionChange
Mkt Val.(MM)
Mkt. ValChg(MM)
%Out
%Port.
Largest Sells
Name PositionPositionChange
Mkt Val.(MM)
Mkt. ValChg(MM)
%Out
%Port.
Contribution Analysis by IndustryLargest Industry Holdings in
Industry MV(MM) %Port Chg(MM)
Portfolio Distribution
Top Sector Holdings
Portfolio Distribution
DistributionsMkt. Val
(MM)Mkt. Val
Chg(MM)%
Port.
2011 FactSet Research Systems Inc. All rights reserved. − Currency: USD
Detail Company Information95A Club Street Phone: 65.6325.8654
Style -- Singapore 069463 Fax: 65.6226.4628Turnover --Distribution Stule --Investor TypeEquity Assets ($MM) 0Equity Positions 0Total Positions 0Price Momentum 0%Report Date
Investment ApproachLargest Holdings
Position Mkt Val. Pos Chg % %Name Position Change ($MM) MV($MM) Out Port.
Largest BuysPosition Mkt Val. Pos Chg % %
Name Position Change ($MM) MV($MM) Out Port.
Largest SellsPosition Mkt Val. Pos Chg % %
Name Position Change ($MM) MV($MM) Out Port.
Contribution Analysis by Industry Top Sector HoldingsLargest Industry Holdings
Industry MV ($MM) % Port $ Chg
Contacts Portfolio Distribution
Portfolio Characteristics
S&P InstitutionAvg. P/EAvg. P/BDividend YieldBeta
Swiss Asia Capital is an independent asset manager operating and headquartered in Singapore, offering asset management, private banking, consultancy and training, and offshore business services.A leading player in the investment field, Swiss Asia Capital's team of investment professionals has decades of experience in analysing securities, managing institutional and private client investment portfolios and formulating investment strategies. Our managers, with their extensive experience in wealth-management and a strong knowledge of business and corporate culture of each of the target investment markets, understand each client's needs and expectations to put together an optimum portfolio.
The overall goal at Swiss Asia Capital is to add value to client portfolios, whilst adhering stringently to a disciplined risk management process. To accomplish this objective, the Firm targets both strategic and tactical investment decisions as key inputs into the decision-making process. Strategic decisions include asset allocation, country/currency allocation and investment cycle analysis; tactical decisions cover economic cycle analysis, sector allocation, duration weighting, gearing/transparency analysis, peer group analysis, issue selection and market timing. These areas represent the key sources of added value in active portfolio management at Swiss Asia Capital.The investment process at Swiss Asia Capital centres upon a team approach. Their specialists offer many decades of experience in managing various financial investments; fixed income, equities, alternative investments and foreign exchange capabilities. As a result, their clients benefit considerably from such a wealth of specialist knowledge.
Swiss Asia Capital
0.0
0.2
0.4
0.6
0.8
1.0
1.2
© 2006-2007 FactSet Research Systems Inc. All rights reserved.
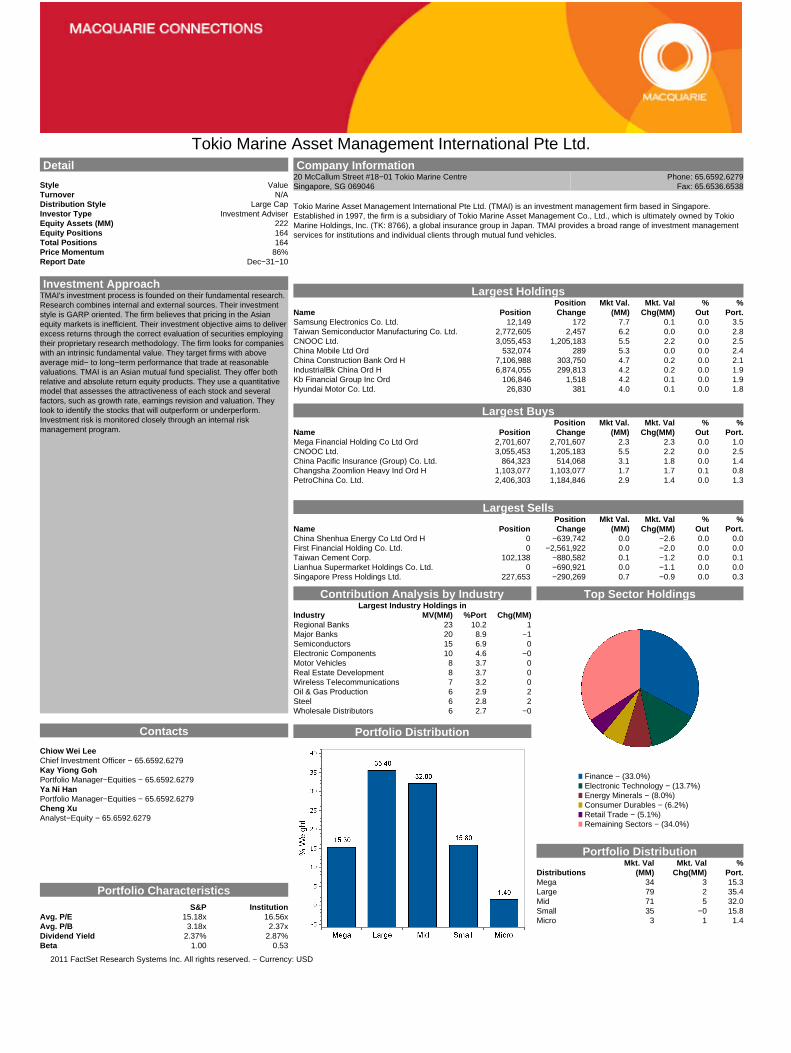
Tokio Marine Asset Management International Pte Ltd. Detail
Style ValueTurnover N/ADistribution Style Large CapInvestor Type Investment AdviserEquity Assets (MM) 222Equity Positions 164Total Positions 164Price Momentum 86%Report Date Dec−31−10
Investment ApproachTMAI's investment process is founded on their fundamental research.Research combines internal and external sources. Their investmentstyle is GARP oriented. The firm believes that pricing in the Asianequity markets is inefficient. Their investment objective aims to deliverexcess returns through the correct evaluation of securities employingtheir proprietary research methodology. The firm looks for companieswith an intrinsic fundamental value. They target firms with aboveaverage mid− to long−term performance that trade at reasonablevaluations. TMAI is an Asian mutual fund specialist. They offer bothrelative and absolute return equity products. They use a quantitativemodel that assesses the attractiveness of each stock and severalfactors, such as growth rate, earnings revision and valuation. Theylook to identify the stocks that will outperform or underperform.Investment risk is monitored closely through an internal riskmanagement program.
Contacts
Chiow Wei LeeChief Investment Officer − 65.6592.6279Kay Yiong GohPortfolio Manager−Equities − 65.6592.6279Ya Ni HanPortfolio Manager−Equities − 65.6592.6279Cheng XuAnalyst−Equity − 65.6592.6279
Portfolio CharacteristicsS&P Institution
Avg. P/E 15.18x 16.56xAvg. P/B 3.18x 2.37xDividend Yield 2.37% 2.87%Beta 1.00 0.53
Company Information20 McCallum Street #18−01 Tokio Marine Centre Phone: 65.6592.6279Singapore, SG 069046 Fax: 65.6536.6538
Tokio Marine Asset Management International Pte Ltd. (TMAI) is an investment management firm based in Singapore.Established in 1997, the firm is a subsidiary of Tokio Marine Asset Management Co., Ltd., which is ultimately owned by TokioMarine Holdings, Inc. (TK: 8766), a global insurance group in Japan. TMAI provides a broad range of investment managementservices for institutions and individual clients through mutual fund vehicles.
Largest Holdings
Name PositionPositionChange
Mkt Val.(MM)
Mkt. ValChg(MM)
%Out
%Port.
Samsung Electronics Co. Ltd. 12,149 172 7.7 0.1 0.0 3.5Taiwan Semiconductor Manufacturing Co. Ltd. 2,772,605 2,457 6.2 0.0 0.0 2.8CNOOC Ltd. 3,055,453 1,205,183 5.5 2.2 0.0 2.5China Mobile Ltd Ord 532,074 289 5.3 0.0 0.0 2.4China Construction Bank Ord H 7,106,988 303,750 4.7 0.2 0.0 2.1IndustrialBk China Ord H 6,874,055 299,813 4.2 0.2 0.0 1.9Kb Financial Group Inc Ord 106,846 1,518 4.2 0.1 0.0 1.9Hyundai Motor Co. Ltd. 26,830 381 4.0 0.1 0.0 1.8
Largest Buys
Name PositionPositionChange
Mkt Val.(MM)
Mkt. ValChg(MM)
%Out
%Port.
Mega Financial Holding Co Ltd Ord 2,701,607 2,701,607 2.3 2.3 0.0 1.0CNOOC Ltd. 3,055,453 1,205,183 5.5 2.2 0.0 2.5China Pacific Insurance (Group) Co. Ltd. 864,323 514,068 3.1 1.8 0.0 1.4Changsha Zoomlion Heavy Ind Ord H 1,103,077 1,103,077 1.7 1.7 0.1 0.8PetroChina Co. Ltd. 2,406,303 1,184,846 2.9 1.4 0.0 1.3
Largest Sells
Name PositionPositionChange
Mkt Val.(MM)
Mkt. ValChg(MM)
%Out
%Port.
China Shenhua Energy Co Ltd Ord H 0 −639,742 0.0 −2.6 0.0 0.0First Financial Holding Co. Ltd. 0 −2,561,922 0.0 −2.0 0.0 0.0Taiwan Cement Corp. 102,138 −880,582 0.1 −1.2 0.0 0.1Lianhua Supermarket Holdings Co. Ltd. 0 −690,921 0.0 −1.1 0.0 0.0Singapore Press Holdings Ltd. 227,653 −290,269 0.7 −0.9 0.0 0.3
Contribution Analysis by IndustryLargest Industry Holdings in
Industry MV(MM) %Port Chg(MM)Regional Banks 23 10.2 1Major Banks 20 8.9 −1Semiconductors 15 6.9 0Electronic Components 10 4.6 −0Motor Vehicles 8 3.7 0Real Estate Development 8 3.7 0Wireless Telecommunications 7 3.2 0Oil & Gas Production 6 2.9 2Steel 6 2.8 2Wholesale Distributors 6 2.7 −0
Portfolio Distribution
Top Sector Holdings
Finance − (33.0%)Electronic Technology − (13.7%)Energy Minerals − (8.0%)Consumer Durables − (6.2%)Retail Trade − (5.1%)Remaining Sectors − (34.0%)
Portfolio Distribution
DistributionsMkt. Val
(MM)Mkt. Val
Chg(MM)%
Port.Mega 34 3 15.3Large 79 2 35.4Mid 71 5 32.0Small 35 −0 15.8Micro 3 1 1.4
2011 FactSet Research Systems Inc. All rights reserved. − Currency: USD
Tudor Capital (Singapore) Pte Ltd. Detail
Style −−Turnover −−Distribution Style −−Investor Type Hedge Fund CompanyEquity Assets (MM) 0Equity Positions 0Total Positions 0Price Momentum 0%Report Date
Investment ApproachTudor Capital Singapore is an Asian trading specialist which performsactive trading, investing and research in the global public and privateequities and related derivative instruments, fixed−income, currencyand commodities. The firm utilizes a variety of investment strategiesincluding discretionary global macro, quantitative global macro,quantitative equity market−neutral, equity long−short and venturecapital. ,
Contacts
Stephen RooneyCorporate Officer/Principal − 65.6213.6500Gavin S. BoylePresident/CEO − 65.6213.6500
Portfolio CharacteristicsS&P Institution
Avg. P/E 17.60x −−Avg. P/B 3.10x −−Dividend Yield 2.03% −−Beta 1.00 −−
Company Information1 George Street #22−01 Phone: 65.6213.6500Singapore, SG 049145 Fax: 65.6223.9294
Tudor Capital (Singapore) Pte Ltd. (Tudor Capital Singapore) is the Singapore−based subsidiary of Tudor Investment Corp. inthe US. Established in 2005, the firm manages alternative investment funds for institutional and high−net worth investors. Inaddition to the Singapore office, the firm is headquartered in Greenwich, Connecticut and has offices in Boston, New York,Washington, D.C. in the US, in London and Surrey in Great Britain and in Sydney, Australia.
Largest Holdings
Name PositionPositionChange
Mkt Val.(MM)
Mkt. ValChg(MM)
%Out
%Port.
Largest Buys
Name PositionPositionChange
Mkt Val.(MM)
Mkt. ValChg(MM)
%Out
%Port.
Largest Sells
Name PositionPositionChange
Mkt Val.(MM)
Mkt. ValChg(MM)
%Out
%Port.
Contribution Analysis by IndustryLargest Industry Holdings in
Industry MV(MM) %Port Chg(MM)
Portfolio Distribution
Top Sector Holdings
Portfolio Distribution
DistributionsMkt. Val
(MM)Mkt. Val
Chg(MM)%
Port.
2011 FactSet Research Systems Inc. All rights reserved. − Currency: USD
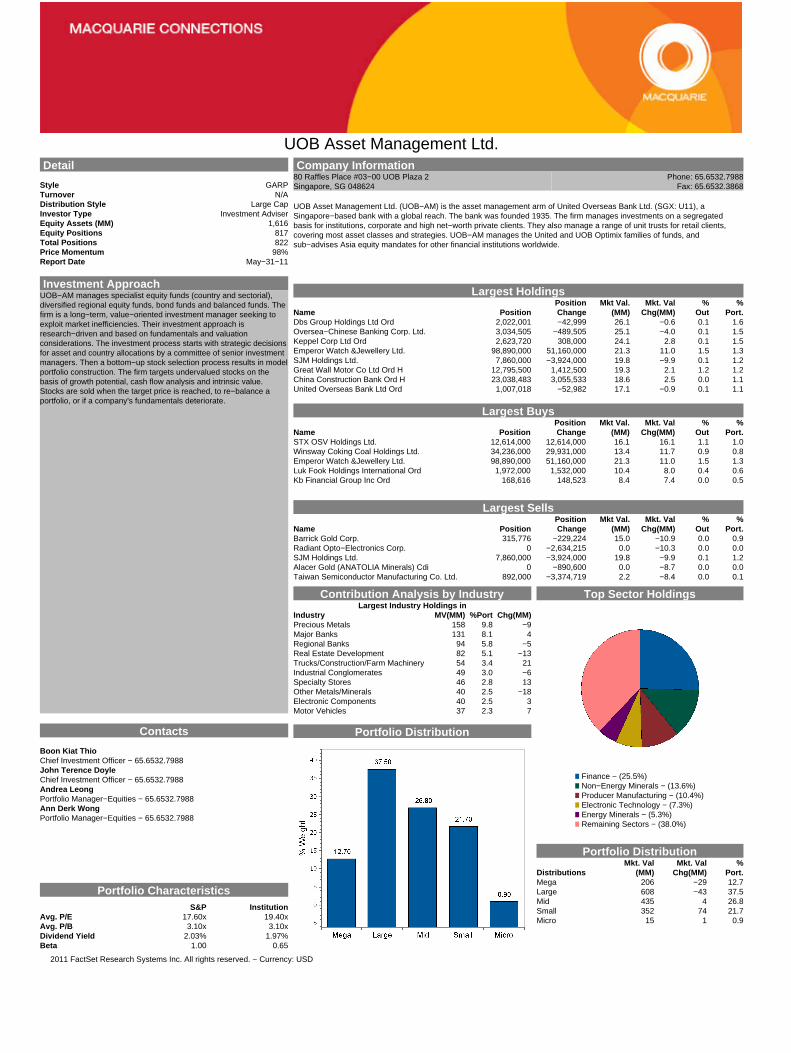
UOB Asset Management Ltd. Detail
Style GARPTurnover N/ADistribution Style Large CapInvestor Type Investment AdviserEquity Assets (MM) 1,616Equity Positions 817Total Positions 822Price Momentum 98%Report Date May−31−11
Investment ApproachUOB−AM manages specialist equity funds (country and sectorial),diversified regional equity funds, bond funds and balanced funds. Thefirm is a long−term, value−oriented investment manager seeking toexploit market inefficiencies. Their investment approach isresearch−driven and based on fundamentals and valuationconsiderations. The investment process starts with strategic decisionsfor asset and country allocations by a committee of senior investmentmanagers. Then a bottom−up stock selection process results in modelportfolio construction. The firm targets undervalued stocks on thebasis of growth potential, cash flow analysis and intrinsic value.Stocks are sold when the target price is reached, to re−balance aportfolio, or if a company's fundamentals deteriorate.
Contacts
Boon Kiat ThioChief Investment Officer − 65.6532.7988John Terence DoyleChief Investment Officer − 65.6532.7988Andrea LeongPortfolio Manager−Equities − 65.6532.7988Ann Derk WongPortfolio Manager−Equities − 65.6532.7988
Portfolio CharacteristicsS&P Institution
Avg. P/E 17.60x 19.40xAvg. P/B 3.10x 3.10xDividend Yield 2.03% 1.97%Beta 1.00 0.65
Company Information80 Raffles Place #03−00 UOB Plaza 2 Phone: 65.6532.7988Singapore, SG 048624 Fax: 65.6532.3868
UOB Asset Management Ltd. (UOB−AM) is the asset management arm of United Overseas Bank Ltd. (SGX: U11), aSingapore−based bank with a global reach. The bank was founded 1935. The firm manages investments on a segregatedbasis for institutions, corporate and high net−worth private clients. They also manage a range of unit trusts for retail clients,covering most asset classes and strategies. UOB−AM manages the United and UOB Optimix families of funds, andsub−advises Asia equity mandates for other financial institutions worldwide.
Largest Holdings
Name PositionPositionChange
Mkt Val.(MM)
Mkt. ValChg(MM)
%Out
%Port.
Dbs Group Holdings Ltd Ord 2,022,001 −42,999 26.1 −0.6 0.1 1.6Oversea−Chinese Banking Corp. Ltd. 3,034,505 −489,505 25.1 −4.0 0.1 1.5Keppel Corp Ltd Ord 2,623,720 308,000 24.1 2.8 0.1 1.5Emperor Watch &Jewellery Ltd. 98,890,000 51,160,000 21.3 11.0 1.5 1.3SJM Holdings Ltd. 7,860,000 −3,924,000 19.8 −9.9 0.1 1.2Great Wall Motor Co Ltd Ord H 12,795,500 1,412,500 19.3 2.1 1.2 1.2China Construction Bank Ord H 23,038,483 3,055,533 18.6 2.5 0.0 1.1United Overseas Bank Ltd Ord 1,007,018 −52,982 17.1 −0.9 0.1 1.1
Largest Buys
Name PositionPositionChange
Mkt Val.(MM)
Mkt. ValChg(MM)
%Out
%Port.
STX OSV Holdings Ltd. 12,614,000 12,614,000 16.1 16.1 1.1 1.0Winsway Coking Coal Holdings Ltd. 34,236,000 29,931,000 13.4 11.7 0.9 0.8Emperor Watch &Jewellery Ltd. 98,890,000 51,160,000 21.3 11.0 1.5 1.3Luk Fook Holdings International Ord 1,972,000 1,532,000 10.4 8.0 0.4 0.6Kb Financial Group Inc Ord 168,616 148,523 8.4 7.4 0.0 0.5
Largest Sells
Name PositionPositionChange
Mkt Val.(MM)
Mkt. ValChg(MM)
%Out
%Port.
Barrick Gold Corp. 315,776 −229,224 15.0 −10.9 0.0 0.9Radiant Opto−Electronics Corp. 0 −2,634,215 0.0 −10.3 0.0 0.0SJM Holdings Ltd. 7,860,000 −3,924,000 19.8 −9.9 0.1 1.2Alacer Gold (ANATOLIA Minerals) Cdi 0 −890,600 0.0 −8.7 0.0 0.0Taiwan Semiconductor Manufacturing Co. Ltd. 892,000 −3,374,719 2.2 −8.4 0.0 0.1
Contribution Analysis by IndustryLargest Industry Holdings in
Industry MV(MM) %Port Chg(MM)Precious Metals 158 9.8 −9Major Banks 131 8.1 4Regional Banks 94 5.8 −5Real Estate Development 82 5.1 −13Trucks/Construction/Farm Machinery 54 3.4 21Industrial Conglomerates 49 3.0 −6Specialty Stores 46 2.8 13Other Metals/Minerals 40 2.5 −18Electronic Components 40 2.5 3Motor Vehicles 37 2.3 7
Portfolio Distribution
Top Sector Holdings
Finance − (25.5%)Non−Energy Minerals − (13.6%)Producer Manufacturing − (10.4%)Electronic Technology − (7.3%)Energy Minerals − (5.3%)Remaining Sectors − (38.0%)
Portfolio Distribution
DistributionsMkt. Val
(MM)Mkt. Val
Chg(MM)%
Port.Mega 206 −29 12.7Large 608 −43 37.5Mid 435 4 26.8Small 352 74 21.7Micro 15 1 0.9
2011 FactSet Research Systems Inc. All rights reserved. − Currency: USD
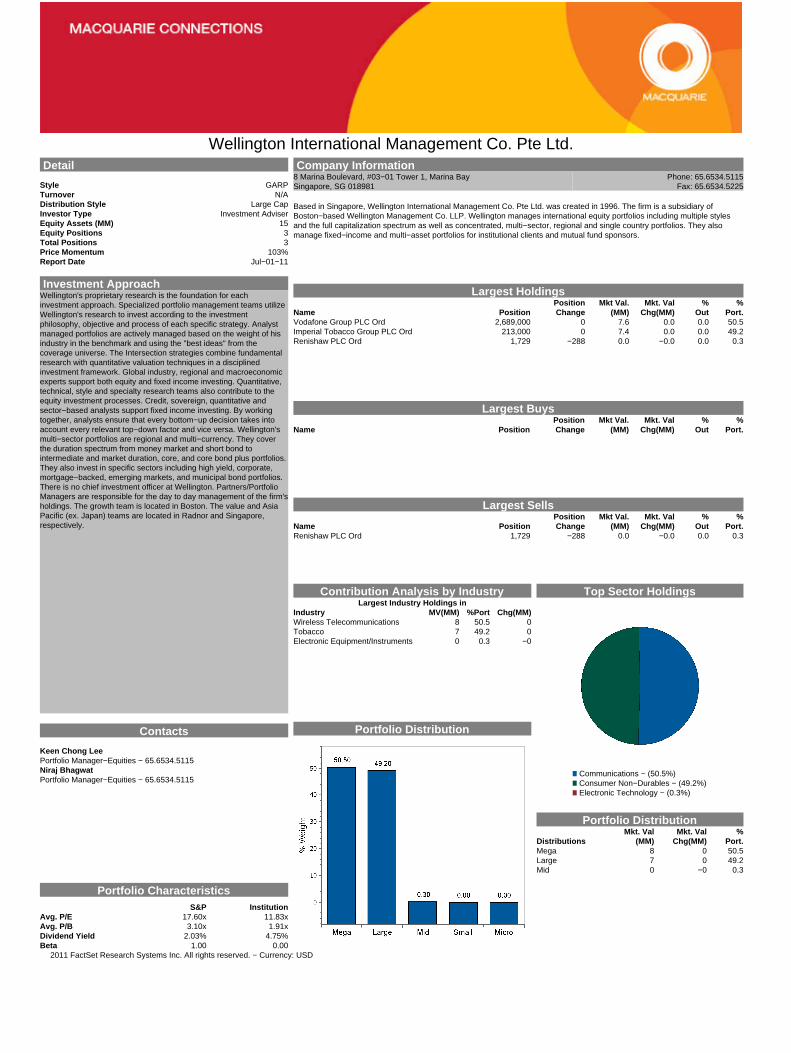
Wellington International Management Co. Pte Ltd. Detail
Style GARPTurnover N/ADistribution Style Large CapInvestor Type Investment AdviserEquity Assets (MM) 15Equity Positions 3Total Positions 3Price Momentum 103%Report Date Jul−01−11
Investment ApproachWellington's proprietary research is the foundation for eachinvestment approach. Specialized portfolio management teams utilizeWellington's research to invest according to the investmentphilosophy, objective and process of each specific strategy. Analystmanaged portfolios are actively managed based on the weight of hisindustry in the benchmark and using the "best ideas" from thecoverage universe. The Intersection strategies combine fundamentalresearch with quantitative valuation techniques in a disciplinedinvestment framework. Global industry, regional and macroeconomicexperts support both equity and fixed income investing. Quantitative,technical, style and specialty research teams also contribute to theequity investment processes. Credit, sovereign, quantitative andsector−based analysts support fixed income investing. By workingtogether, analysts ensure that every bottom−up decision takes intoaccount every relevant top−down factor and vice versa. Wellington'smulti−sector portfolios are regional and multi−currency. They coverthe duration spectrum from money market and short bond tointermediate and market duration, core, and core bond plus portfolios.They also invest in specific sectors including high yield, corporate,mortgage−backed, emerging markets, and municipal bond portfolios.There is no chief investment officer at Wellington. Partners/PortfolioManagers are responsible for the day to day management of the firm'sholdings. The growth team is located in Boston. The value and AsiaPacific (ex. Japan) teams are located in Radnor and Singapore,respectively.
Contacts
Keen Chong LeePortfolio Manager−Equities − 65.6534.5115Niraj BhagwatPortfolio Manager−Equities − 65.6534.5115
Portfolio CharacteristicsS&P Institution
Avg. P/E 17.60x 11.83xAvg. P/B 3.10x 1.91xDividend Yield 2.03% 4.75%Beta 1.00 0.00
Company Information8 Marina Boulevard, #03−01 Tower 1, Marina Bay Phone: 65.6534.5115Singapore, SG 018981 Fax: 65.6534.5225
Based in Singapore, Wellington International Management Co. Pte Ltd. was created in 1996. The firm is a subsidiary ofBoston−based Wellington Management Co. LLP. Wellington manages international equity portfolios including multiple stylesand the full capitalization spectrum as well as concentrated, multi−sector, regional and single country portfolios. They alsomanage fixed−income and multi−asset portfolios for institutional clients and mutual fund sponsors.
Largest Holdings
Name PositionPositionChange
Mkt Val.(MM)
Mkt. ValChg(MM)
%Out
%Port.
Vodafone Group PLC Ord 2,689,000 0 7.6 0.0 0.0 50.5Imperial Tobacco Group PLC Ord 213,000 0 7.4 0.0 0.0 49.2Renishaw PLC Ord 1,729 −288 0.0 −0.0 0.0 0.3
Largest Buys
Name PositionPositionChange
Mkt Val.(MM)
Mkt. ValChg(MM)
%Out
%Port.
Largest Sells
Name PositionPositionChange
Mkt Val.(MM)
Mkt. ValChg(MM)
%Out
%Port.
Renishaw PLC Ord 1,729 −288 0.0 −0.0 0.0 0.3
Contribution Analysis by IndustryLargest Industry Holdings in
Industry MV(MM) %Port Chg(MM)Wireless Telecommunications 8 50.5 0Tobacco 7 49.2 0Electronic Equipment/Instruments 0 0.3 −0
Portfolio Distribution
Top Sector Holdings
Communications − (50.5%)Consumer Non−Durables − (49.2%)Electronic Technology − (0.3%)
Portfolio Distribution
DistributionsMkt. Val
(MM)Mkt. Val
Chg(MM)%
Port.Mega 8 0 50.5Large 7 0 49.2Mid 0 −0 0.3
2011 FactSet Research Systems Inc. All rights reserved. − Currency: USD