Embed Size (px)
Citation preview
Macro economy and Financial Flows in India and Japan:
Fact Findings and Proposals for Further Growth
Atsushi Kawamoto*
Senior Economist, Policy Research Institute, Ministry of Finance
Email: [email protected]
July 5, 2012
* I would like to express my appreciation to the Indian Council for Research and International Economic Relations (ICRIER) for the visiting fellow position with them, and especially to Dr. Parthasarathi Shome, Ms. Sanjana Joshi and Ms. Isha Dayal for their warm hospitality. I also appreciate my research grant from the Sasakawa Peace Foundation. I express my gratitude to Mr. Junichi Koyanagi, the program officer in charge. Also, I acknowledge support from the Policy Research Institute (PRI) in Ministry of Finance, especially Mr. Mitsutaka Inagaki, Mr. Yasurou Narita, Ms. Hidemi Kimura and Mr. Junji Ueda for offering me the opportunity to have this valuable experience; and Mr. Hiroshi Fujii, Mr. Yuichi Takamizawa, Ms. Chie Umezaki and Mr. Hiroshi Yoshikawa for their assistance with logistics and research. Additionally, I am indebted to Dr. Takahiro Sato, a visiting scholar in Jawaharlal Nehru University at that time, Mr. Satoshi Iwaki, New Delhi Bureau Chief of Nikkei Inc., and Mr. Shoichi Yuyama, Financial Attaché of the Japanese Embassy in Delhi, for enlightening me on firsthand views regarding Indian economy. I also thank Dr. Chadha Rajesh, Senior Fellow at the National Council of Applied Economic Research, Mr. Ashish Kumar, Additional Director General at the Central Statistical Organisation, and Mr. Rajib Das, Senior Research Fellow at the Institute for Indian Economic Studies for their cooperation. Furthermore, I would like to thank to participants at workshops in Jawaharlal Nehru University, Financial Services Agency, Ministry of Finance, the University of Tokyo, Kobe University, and World Bank Tokyo Office. Any remaining errors are my own. The views expressed in this paper are those of the author and not those of the Ministry of Finance, the PRI or ICRIER.

2
Abstract Until recently, there has been no internationally comparable data source to capture sector-wise financial surplus or deficit in India. By utilizing a newly launched version of the National Accounts Statistics, an overview of the macro economy and sector-wise financial flows in India are visually illustrated, through comparison with China. Furthermore, to see the background to the lack of adequate infrastructure, two issues related to financial flows are investigated: gold demand and banking regulations. As an example of the contribution of foreign financial institutions to the Indian economy, the current situation of and challenges faced by Japanese Banks are described.
3
1. Introduction India is known as having one of the most promising economies in the world. In recent years, its growth rate is the highest in the world next only to China. Also in the future, thanks to a favorable demographic composition, it is expected that the high growth rate will be sustained in the long run. On the other hand, it is said that one factor which is a drag on its development is a lack of adequate infrastructure.
In this paper, first, to see the background of financial flows in India, basic fact finding on macro economy, including industrial composition, income distribution, use of income, and financial balance, is conducted. Until recently, there has been no internationally comparable data source on sector-wise National Account Statistics (NAS), in India, but a newly launched version of NAS (the Central Statistical Organisation, 2011b) provides us with a sector-wise data source following international standards. This new version of NAS is utilized to observe the characteristics of India, through comparison with China.
Second, as topics relating to financial flows in India, we investigate two issues: Gold demand and banking regulations. Although the excess demand for gold is well-known anecdotally, the reality of the situation is captured, also by utilizing NAS. In addition, related opinions from classical literature and current government are introduced. Furthermore, the operation of Japanese Banks in India is introduced as an example of foreign financial institutions.
2. Overview of Macroeconomy 2.1 Macro economy and Financial Balance in India 2.1.1 National Accounts Statistics in India First, we provide an overview of macro economy in India based on National Account Statistics. Previously, the presentation of national accounts complied by the Government of India (Central Statistical Organisation, 2011a) did not fully follow the United Nations System of National Accounts (1993 SNA). In particular, it classified its institutional sectors into the public sector, private corporate sector and household sector, where the public sector includes government corporations. In contrast, the 1993 SNA classifies them into the general government, non-financial corporation, and household sectors and so on, where general government does not include government corporations. Since almost all countries follow the 1993 SNA standard, it created a problem for international comparison of sector-wise transactions, including financial flows. But almost all existing analyses on India, including the IMF’s recent report (2011), are based on this version of national accounts.
4
In October 2011, an alternative series of national accounts was launched (Central
Statistical Organisation, 2011b). This newly developed series includes finance accounts classified by general government and household. This paper utilizes this new data source, and macro economy and financial flows in India are visually illustrated.1
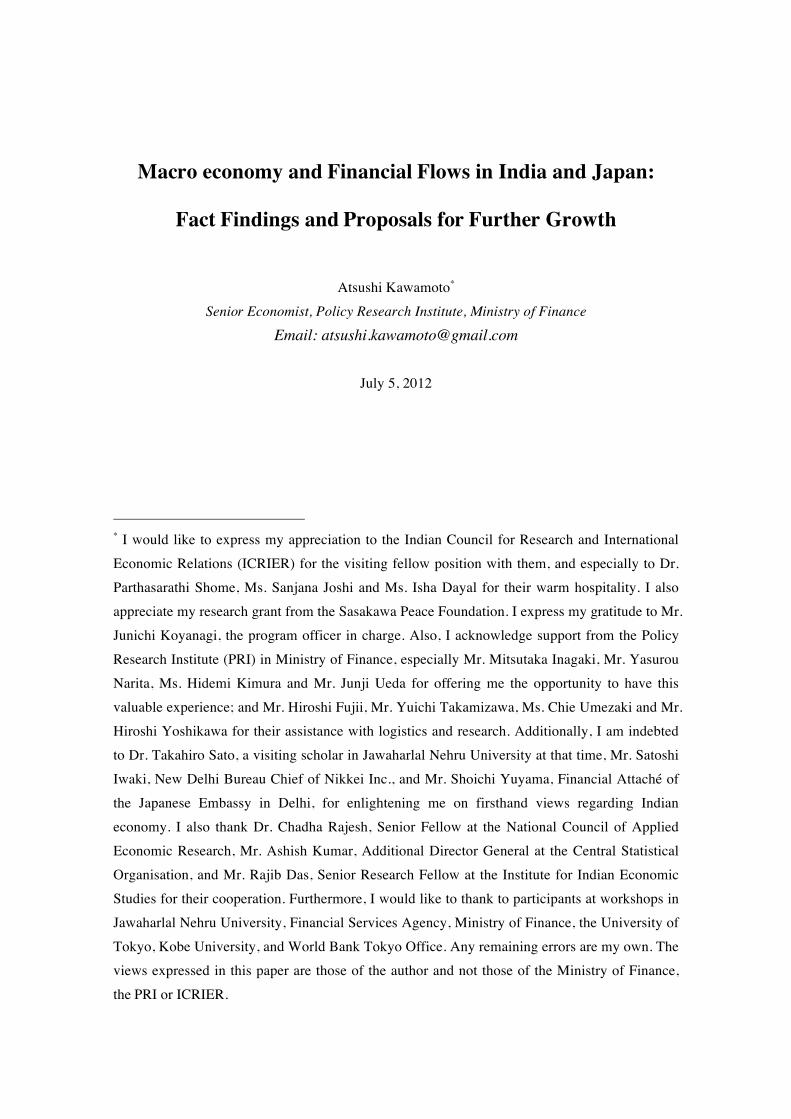
2.1.2 Production Figure 1 shows an overview of macro economy and financial flows in India, based on data from the Central Statistical Organisation (2011). In the horizontal axis, I standardize the value of nominal GDP to 100 (hereafter, one percent of GDP is referred to as “one point”). That is, the horizontal axis and each number on it show the percentage of GDP.
The first three lines are a breakdown of sector-wise GDP, which is valued added, that Indians create by themselves. Approximately speaking, agriculture and industry are twenty percent of GDP. The rest is produced by the service-sector. As discussed later, the volume of service sector is relatively large. 1 Detailed procedure to construct Figure 1 is provided in Appendix A.1.
!"#$%&'()'*+,%-'&,-.-/0'+.1'!".+.,"+2'!2-34'".'5.1"+
(6''
(7''
89''
:''
(;''
(;''
(;''
(;''
6:''
6:''
(<''
96'' <''
9''
(6''
(<''
(<''
(<''
7''
7''
6''
6''
:''
;'' <;'' =;'' 8;'' 6;'' (;;''
>'?4&'
!".+.,&'>'@&4-$%,&'
>'?4&'
A-B&%./&.C'>'@&4-$%,&'
>'?4&'
D-%E-%+F-.4'>'@&4-$%,&'
>'?4&'
G-$4&H-214'>'@&4-$%,&'
I"4E-4+J2&'5.,-/&'
5.,-/&'K%-/'LJ%-+1'
>'M&%B",&'
>'5.1$4C%0'
AIN'>'L#%",$2C$%&'
OAINP(;;QOM-$%,&Q'D&.C%+2'MC+F4F,4'RS,&
D-.4$/EF-.'
T+2$+J2&4'
5.B&4C/&.C'
U-%%-3".#'K%-/'LJ%-+1''OPD$%%&.C'L,,-$.C'I&V,"CQ'
5
2.1.3 Disposable Income By adding income and transfers from abroad, which is mostly remittances from non-resident Indians, to GDP, we can get the national disposable income. As a total, the Indian economy’s own resources for consumption and investment is 103 points. This is called the national disposable income. The national disposable income is divided into three institutional sectors: households, corporations, and government, where households include small businesses and private-non profit institutions serving households, such as private schools; corporations include both non-financial corporations and financial institutions. Government is general government, which includes central and local governments, and social security funds, but does not include public corporations, such as national railways.
Disposable income is the income left after redistribution of income by the government. Households’ and corporations’ disposable income is the income left after tax payments and receiving transfers from the government such as pension benefits. The government’s disposable income is the income left after receiving tax revenues and paying cash transfers to households and corporations. Households, corporations and governments have respectively 83 points, 10 points and 10 points. 2.1.4 Use of Disposable Income Households have 83 points of disposable income. Utilizing this disposable income, households consume 58 points, and invest 12 points in capital formation, including housing investment and equipment investment by unincorporated businesses, and purchase 2 points of net acquisition of valuables. Valuables mean net acquisition of precious metals, mainly gold, which is discussed in detail later. The balance between disposable income and its use, 12 points, are the financial surplus of the households sector. That is, the households sector lends 12 points to other sectors.
Corporations have 10 points of disposable income, but they invest 18 points. Corporations consume only intermediate goods and so final consumption is zero at any time. The balance between disposable income and its use, 8 points, is financial deficit. That is, the corporations sector needs to borrow 8 points from other sectors.
The general government has 10 points of disposal income, but consumes 12 points and invests 5 points, and so the general government needs to borrow 7 points from other sectors. 2.1.5 Financial Balance The lending and borrowing of each sector can be summarized as follows. The government and corporations need to borrow 7 points and 8 points respectively, but households can lend only 12 points. The balance between internal lending and borrowing, 3 points, is covered by financial inflow from the rest of the world. These 3 points are also called the current account deficit.
6
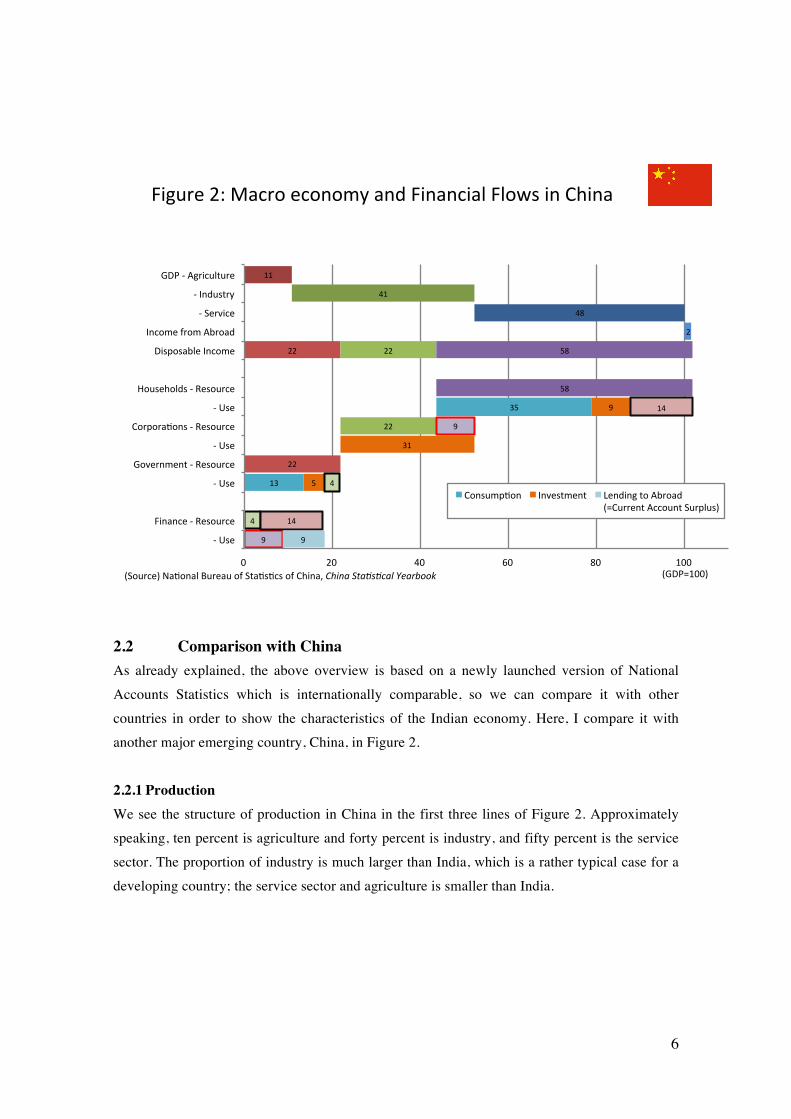
2.2 Comparison with China As already explained, the above overview is based on a newly launched version of National Accounts Statistics which is internationally comparable, so we can compare it with other countries in order to show the characteristics of the Indian economy. Here, I compare it with another major emerging country, China, in Figure 2. 2.2.1 Production We see the structure of production in China in the first three lines of Figure 2. Approximately speaking, ten percent is agriculture and forty percent is industry, and fifty percent is the service sector. The proportion of industry is much larger than India, which is a rather typical case for a developing country; the service sector and agriculture is smaller than India.
!"#$%&'()'*+,%-'&,-.-/0'+.1'!".+.,"+2'!2-34'".'56".+
77''
87''
89''
(''
((''
((''
((''
((''
:9''
:9''
7;''
;:''
:''
;7''
<''
<''
<''
8''
8''
78''
78''
<''
='' (='' 8='' >='' 9='' 7==''
?'@4&'
!".+.,&'?'A&4-$%,&'
?'@4&'
B-C&%./&.D'?'A&4-$%,&'
?'@4&'
5-%E-%+F-.4'?'A&4-$%,&'
?'@4&'
G-$4&6-214'?'A&4-$%,&'
H"4E-4+I2&'J.,-/&'
J.,-/&'K%-/'LI%-+1'
?'M&%C",&'
?'J.1$4D%0'
BHN'?'L#%",$2D$%&'
OM-$%,&P'Q+F-.+2'R$%&+$'-K'MD+F4F,4'-K'56".+S'!"#$%&'(%)*)+%,&-.%/0112& OBHNT7==P
5-.4$/EF-.' J.C&4D/&.D' U&.1".#'D-'LI%-+1''OT5$%%&.D'L,,-$.D'M$%E2$4P'
7
2.2.2 Disposable Income and its Use Adding income and transfer from abroad, which is mostly profits from oversea assets, to GDP, the national disposable income becomes 102 points. The allocation for households, 58 points, is smaller than in India. It is same as India in that households have financial surplus, and corporations have financial deficit, but it should be noted that China’s government has a financial surplus. It is also worth noting that investment in China is larger than in India, especially in the corporations sector. 2.2.3 Financial Balance Regarding the lending and borrowing of each sector, households and the government have a financial surplus, of 14 points and 4 points respectively, but the deficit of corporations is only 9 points, and so the balance, 9 points, is the lending to the abroad, which is also called the current account surplus.
2.2.4 Remarks on the Indian Economy By comparison with China, I can summarize the characteristics of the Indian macro economy
!"#$%&'()'*&+,-%./"0&'1-23-0"4-5'-6'789'"5':5;"<
=>' ?=>' @=>' (=>' A=>' B=>' C=>' D=>' E=>' F=>' ?==>'
?FB='
?FC='
?FD='
?FE='
?FF='
@==='
@=?='
:5;$0,%G' H#%"+$I,$%&' *&%J"+&'
K*-$%+&L'1&5,%<I'*,<404+0'MN+&
8
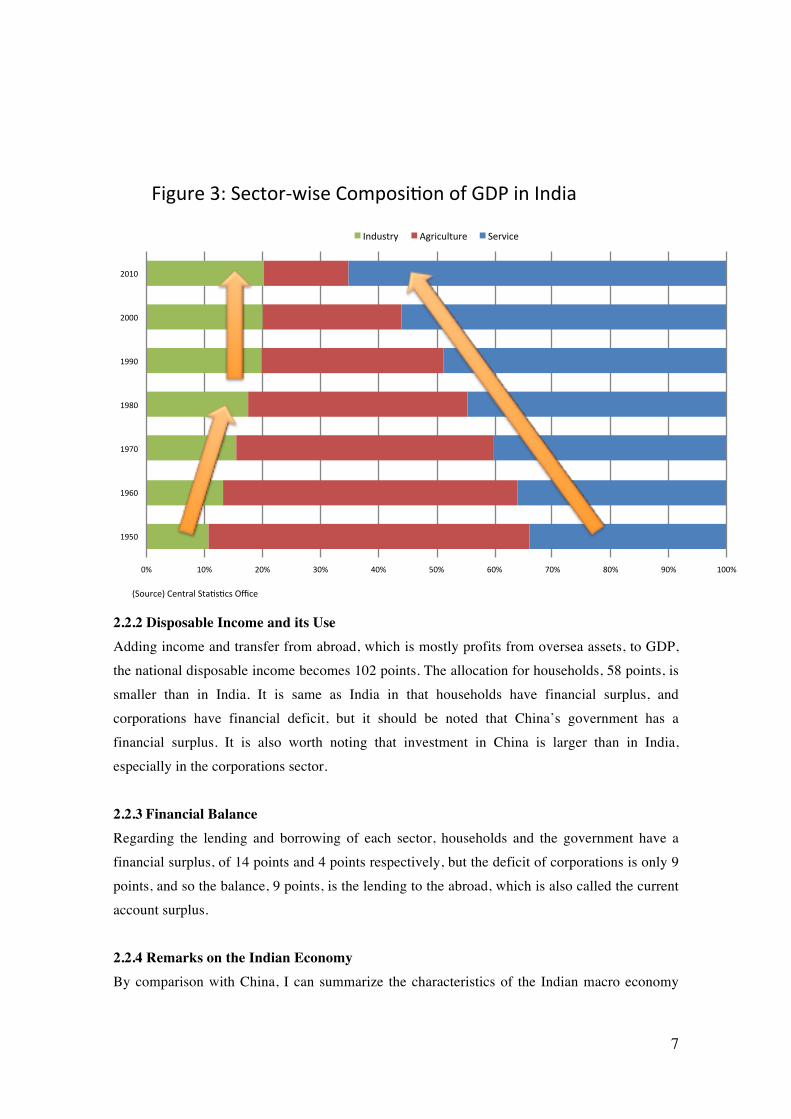
as: high agriculture dependency, low industry dependency and high service dependency; larger allocation of disposable income to households due to the presence of an informal sector; large consumption and few investments; fiscal deficit and a current account deficit. 2.3 Weakness of Industry As seen before, the proportion of industry to the total economy is limited. Related to this point, this section provides a historical view of this issue, and its effects. 2.3.1 Historical View The low presence of industry is not just recent. Figure 3 shows a time series of the ratio of three sectors from 1950 to present. We can observe that the ratio of industry increases from 1950 to 1990, but it does not change from 1990 to 2010. On the other hand, the ratio of the service sector continuously increases from 1950 to present, and agriculture decreases during same period. It is true that the Indian economy is growing rapidly, especially in the last 10 years, and so the industry sector grows at the same pace as the total economy, but it is difficult to say that industry leads high-speed growth. Rather, the service sector, such as commerce and IT-related businesses, is a driving force for the Indian economy. 2.3.2 Effects of Industry/the Service Sector on the Economy We have seen how the growth of Indian economy is led by the service sector, instead of the industry sector. So, what is the difference in the effect of the two sectors on the total economy?
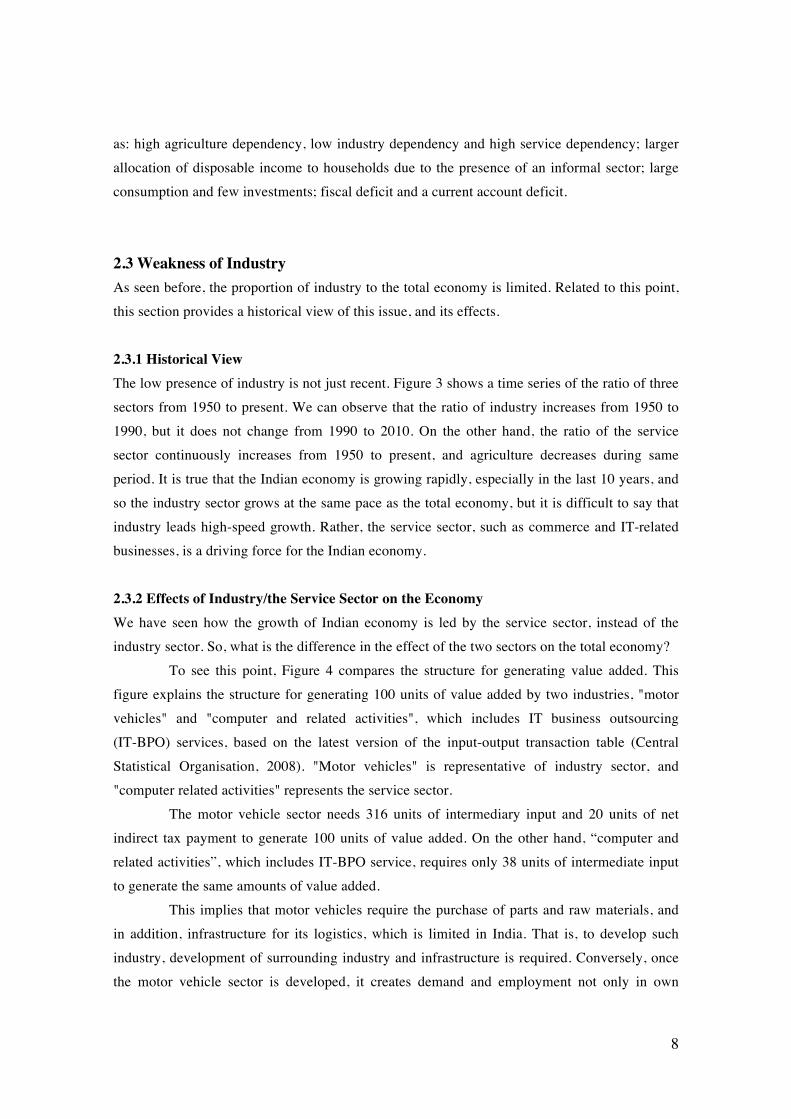
To see this point, Figure 4 compares the structure for generating value added. This figure explains the structure for generating 100 units of value added by two industries, "motor vehicles" and "computer and related activities", which includes IT business outsourcing (IT-BPO) services, based on the latest version of the input-output transaction table (Central Statistical Organisation, 2008). "Motor vehicles" is representative of industry sector, and "computer related activities" represents the service sector.
The motor vehicle sector needs 316 units of intermediary input and 20 units of net indirect tax payment to generate 100 units of value added. On the other hand, “computer and related activities”, which includes IT-BPO service, requires only 38 units of intermediate input to generate the same amounts of value added.
This implies that motor vehicles require the purchase of parts and raw materials, and in addition, infrastructure for its logistics, which is limited in India. That is, to develop such industry, development of surrounding industry and infrastructure is required. Conversely, once the motor vehicle sector is developed, it creates demand and employment not only in own
9
business, but also in surrounding businesses. Also, column of "demand" splits demand into domestic demand and overseas demand.
Domestic demand includes both final demand and intermediate demand. Most of the demand for motor vehicles is domestic; in contrast, most of the demand for computer and related activities is for overseas.
This implies that computer and related activities contribute to the improvement of the trade balance. To summarize, the advantage of service-sector-oriented growth is that it does not require the development of periphery industry and infrastructure for logistics, and so it makes it possible to grow faster. In addition, most of its demand is external demand, so it improves the trade balance. On the other hand, its disadvantage is the limitation of spillover effects on periphery industry and employment.
Briefly speaking, it is hard to say that the IT sector is a solution for poverty or income disparity between urban and rural areas. To overcome such issues, it is necessary for India to foster the industry sector by building adequate infrastructure.
!"#$%&'()'*+,+%'-&."/0&1'213'45
677'' 677''
87''
96:''
9;''
(9:''
69;''
6:''
(''
(6:''
9<''
9:''
67=''
7''
=7''
677''
6=7''
877''
8=7''
977''
9=7''
(77''
(=7''
=77''
>$,?$,' @$??0A'' B&CDEF' >$,?$,' @$??0A'' B&CDEF'
*+,+%'2&."/0&1' 3' G+C?$,&%'DEF'%&0D,&F'D/H2"H&1'
'I677'J'@&/,+%KL"1&'-D0$&'MFF&FN
I@+$%/&N'G&E,%D0'@,DH1H/D0'>%#DE"1DH+EO'!"#$%&'$%#$%()*+",+-./"()+012(3445&3446
PQ?+%,'
B+C&1H/'B&CDEF'
4C?+%,'
>$,?$,'
4E,&%C&F"D,&'"E?$,'
IR&,N'4EF"%&/,'5DQ'
IJ'4EF"%&/,'5DQ'K'@$S1"FAN'
-D0$&'MFF&F'
10
3. Topics on Financial Flows 3.1 Saving: Impact of Gold Demand 3.1.1 Impact of Gold Demand on Macro economy As we already saw in Figure 1, Indian households spend 2 points on valuables out of 81 points of income. “Valuables” mean expenditures made on net acquisition of valuable or precious items, mainly gold. “Valuables” is included under gross capital formation, and so not included in consumption2 and investment (both gross fixed capital formation and changes in stocks) in the United Nations system of National Accounts (1993 SNA).3
To measure the impact of spending on valuables, we compare it with the current account deficit. If households save the amount of money corresponding to spending on valuables and lend to other sectors of economy, and if borrowing by corporations and government does not change, the current account deficit would decrease from 3 percent to 1 percent. That is, if Indian economy did not purchase valuables and saved the same amount of money, the current account deficit become one third of its current level.
India's presence in world gold demand is huge. In fiscal year 2011, India was responsible for 25 percent of the world’s gold demand, but the amount of its mining is negligible. India imports gold to cover its huge demand.
India can improve its structural problems such as its deficiency of infrastructure and its current account deficit by reducing its expense outlaid for gold. 3.1.2 Keynes: India as the “Sink of Precious Metals” We see the view today that excess spending on valuables harms economic growth through deficiency of capital accumulation and soundness of oversea balance, and such a view is also shared by classical literature, including John Maynard Keynes' maiden effort, Indian Currency
and Finance, which was written based on his experience and analysis in the Indian Office of the
British government, his first work destination after graduating from college. In this literature, Keynes makes a critical assessment of expenses spent on precious
metals:
"India, as we all know, already wastes far too high a proportion of her resources in the needless accumulation of the precious metals."
2 The McKinsey Global Institute (2006) mentions that “Gold purchases by households are treated as consumption in national accounts,” (page 72), but this would be imprecise, at least in 1993 SNA. 3 “Valuables” are not estimated in China and Japan due the limitation of data source.
11
Then, he proposes to reduce such expenses: "By the elimination of both precious metals, to the utmost extent that public opinion will permit, from amongst the boards and the circulation of the country, they ought to counteract an uncivilized and wasteful habit." Furthermore, in the context of the gold standard regime in Europe, he pointed out that
Indian excess demand for precious metals prevents European economy from harmful inflation: "It is interesting to reflect that India's love of precious metals, ruinous though it has been to her own economic development, has flourished in the past to the great advantage of Western nations. Every one knows Jevons’s description of India as the sink of the precious metals, always ready to absorb the redundant bullion of the West and to save Europe from the more violent disturbances to her price level."
3.1.3 Budget 2012 The current Indian government also shares this view on the excess gold demand. In India, when Finance Minister submits a budget plan to the congress, he makes a budget speech to explain its purpose. In a paragraph from this year’s budget speech on March 16, 2012, Finance Minister Pranab Mukherjee mentioned that gold imports are a primary cause of current account deficit:
"One of the primary drivers of the current account deficit has been the growth of almost 50 per cent in imports of gold and other precious metals in the first three quarters of this year."
Based on these findings, he proposes to double the customs rate on gold purchases:
"I have been advised to strengthen the steps already taken to check this trend for better results. I propose to increase basic customs duty on standard gold bars; gold coins of purity exceeding 99.5 per cent and platinum from 2 per cent to 4 per cent and on non-standard gold from 5 per cent to 10 per cent."
In reaction to this speech, there was a strike by gold traders. According to a news
report, it caused a 29 percent year-on-year decrease in gold demand in the first quarter of 2012. Also, World Gold Council (WGC) forecasts that gold demand will decrease by 14 percent. If the WGC's prediction comes true, this policy by the Indian government will have an effect.
12
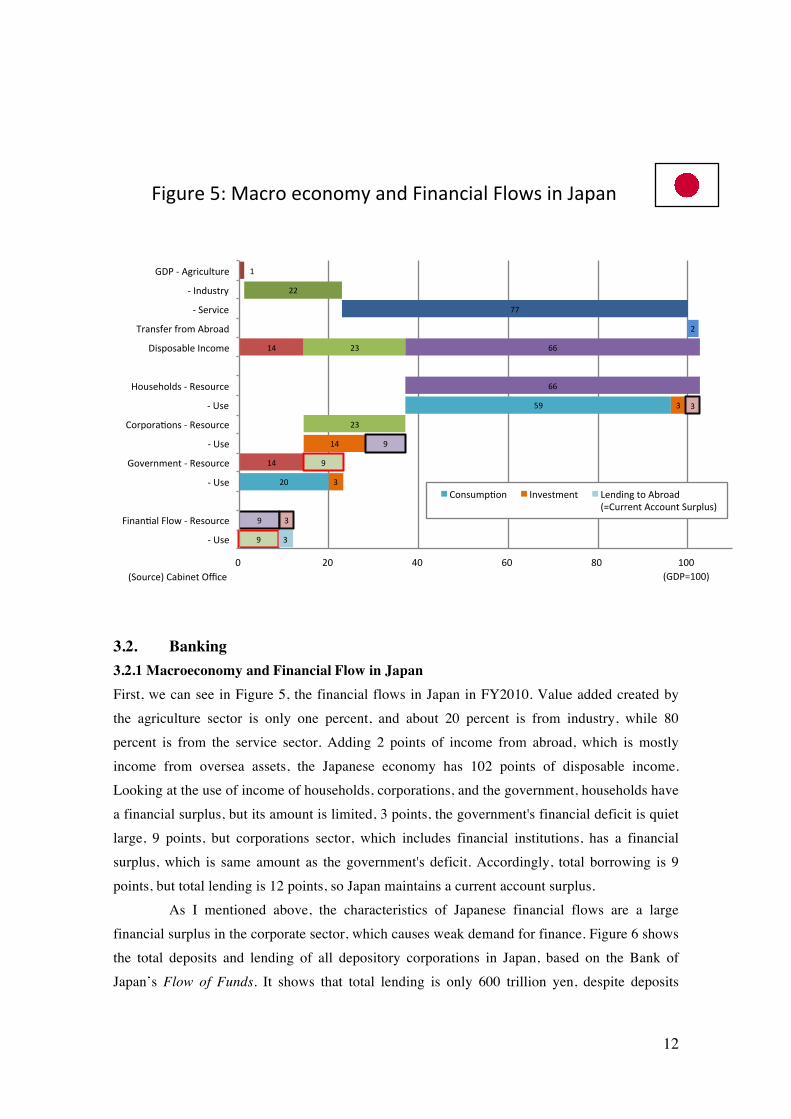
3.2. Banking 3.2.1 Macroeconomy and Financial Flow in Japan First, we can see in Figure 5, the financial flows in Japan in FY2010. Value added created by the agriculture sector is only one percent, and about 20 percent is from industry, while 80 percent is from the service sector. Adding 2 points of income from abroad, which is mostly income from oversea assets, the Japanese economy has 102 points of disposable income. Looking at the use of income of households, corporations, and the government, households have a financial surplus, but its amount is limited, 3 points, the government's financial deficit is quiet large, 9 points, but corporations sector, which includes financial institutions, has a financial surplus, which is same amount as the government's deficit. Accordingly, total borrowing is 9 points, but total lending is 12 points, so Japan maintains a current account surplus.
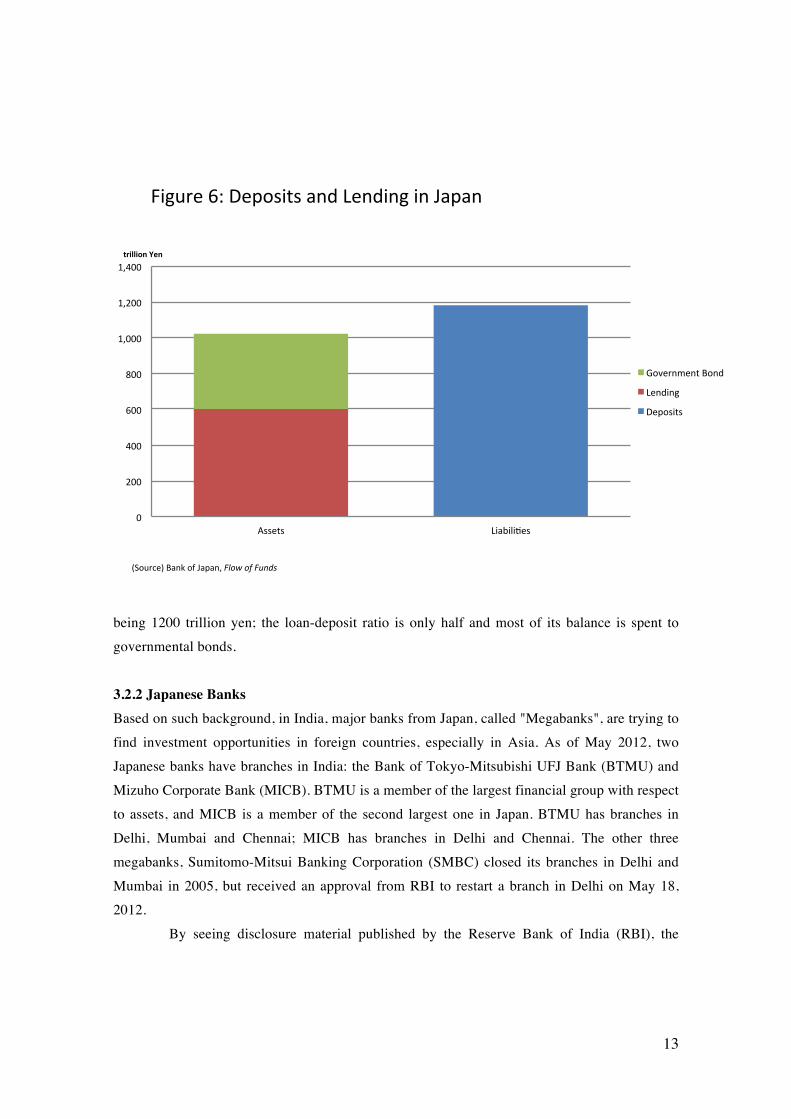
As I mentioned above, the characteristics of Japanese financial flows are a large financial surplus in the corporate sector, which causes weak demand for finance. Figure 6 shows the total deposits and lending of all depository corporations in Japan, based on the Bank of Japan’s Flow of Funds. It shows that total lending is only 600 trillion yen, despite deposits
!"#$%&'()'*+,%-'&,-.-/0'+.1'!".+.,"+2'!2-34'".'5+6+.
7''
88''
99''
8''
7:''
7:''
8;''
8;''
<<''
<<''
8=''
(>''
;''
7:''
;''
>''
>''
;''
;''
>''
>''
;''
='' 8='' :='' <='' ?='' 7==''
@'A4&'
!".+.B+2'!2-3'@'C&4-$%,&'
@'A4&'
D-E&%./&.F'@'C&4-$%,&'
@'A4&'
G-%6-%+B-.4'@'C&4-$%,&'
@'A4&'
H-$4&I-214'@'C&4-$%,&'
J"46-4+K2&'L.,-/&'
M%+.4N&%'N%-/'OK%-+1'
@'P&%E",&'
@'L.1$4F%0'
DJQ'@'O#%",$2F$%&'
RDJQS7==TRP-$%,&T'G+K".&F'UV,&
G-.4$/6B-.' L.E&4F/&.F' W&.1".#'F-'OK%-+1''RSG$%%&.F'O,,-$.F'P$%62$4T'
13
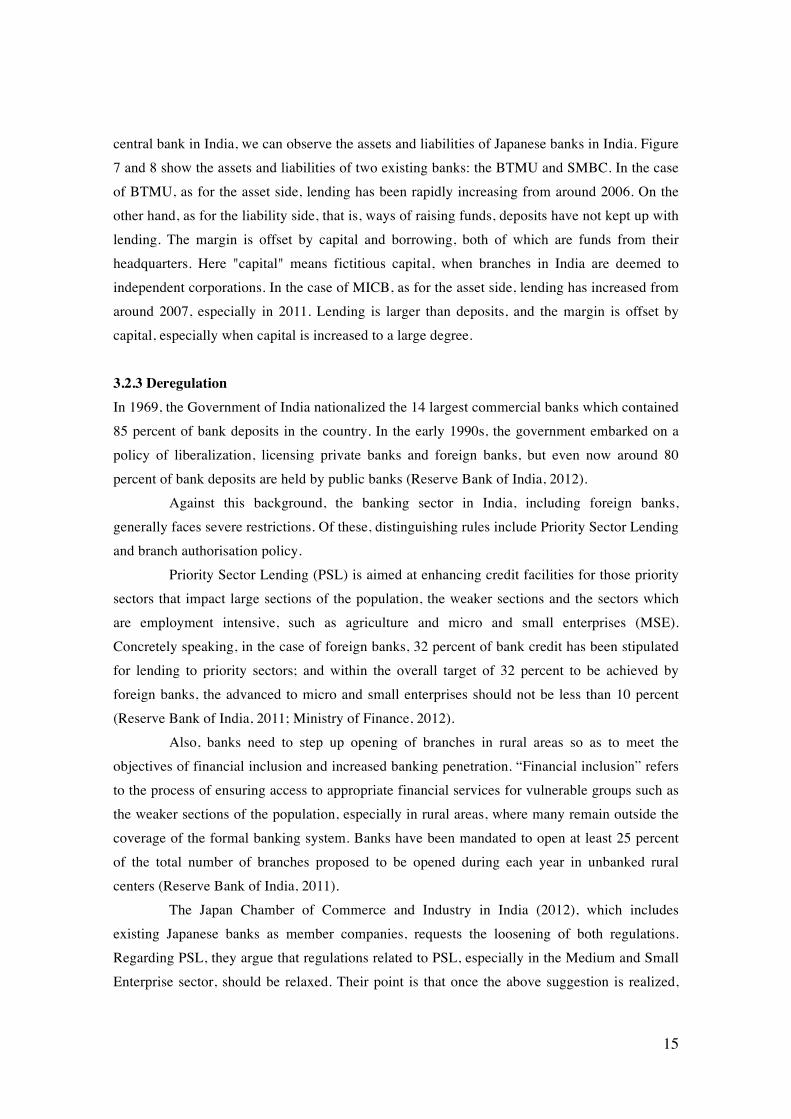
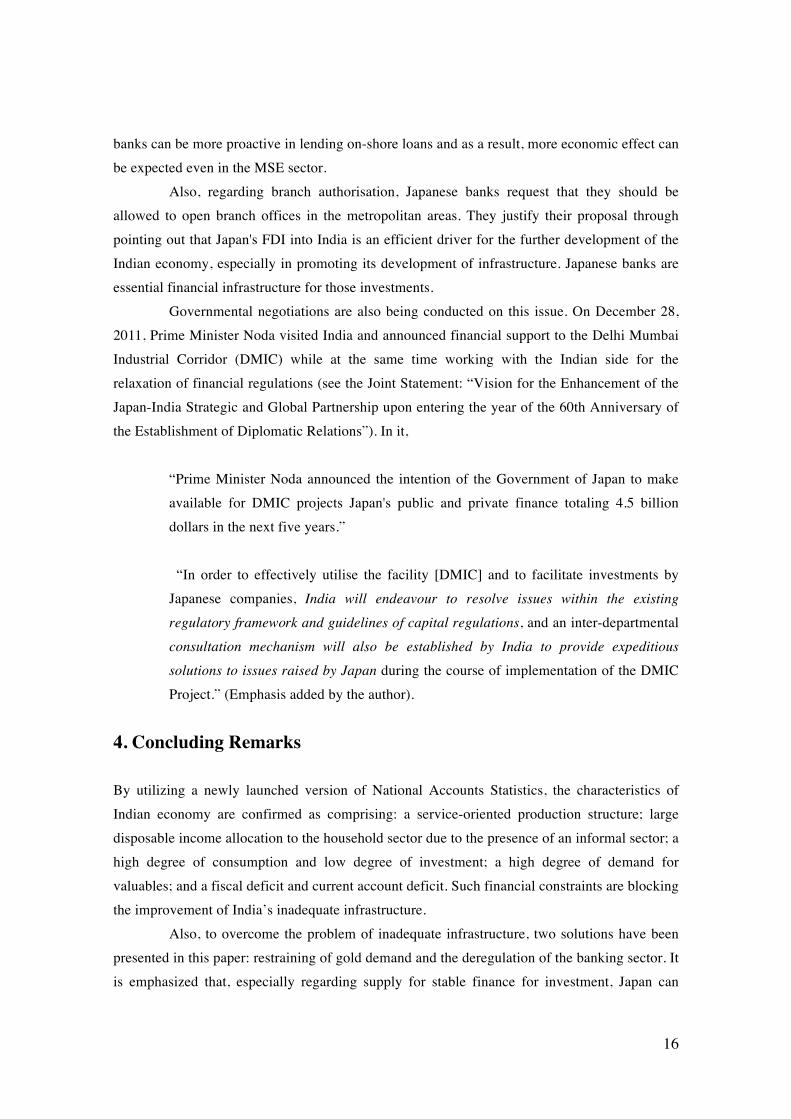
being 1200 trillion yen; the loan-deposit ratio is only half and most of its balance is spent to governmental bonds. 3.2.2 Japanese Banks Based on such background, in India, major banks from Japan, called "Megabanks", are trying to find investment opportunities in foreign countries, especially in Asia. As of May 2012, two Japanese banks have branches in India: the Bank of Tokyo-Mitsubishi UFJ Bank (BTMU) and Mizuho Corporate Bank (MICB). BTMU is a member of the largest financial group with respect to assets, and MICB is a member of the second largest one in Japan. BTMU has branches in Delhi, Mumbai and Chennai; MICB has branches in Delhi and Chennai. The other three megabanks, Sumitomo-Mitsui Banking Corporation (SMBC) closed its branches in Delhi and Mumbai in 2005, but received an approval from RBI to restart a branch in Delhi on May 18, 2012.
By seeing disclosure material published by the Reserve Bank of India (RBI), the
!"#$%&'()'*&+,-".-'/01'2&01"0#'"0'3/+/0
4'
544'
644'
(44'
744'
89444'
89544'
89644'
:--&.-' 2"/;"<"=&-'
!"#$$#%&'()&
>,?&%0@&0.'A,01'
2&01"0#'
*&+,-".-'
BC,$%D&E'A/0F',G'3/+/09'!"#$%#&%!'()*

14
!""#$" %&'(&)&*#"
7
+,
-+.+++,
/+.+++,
0+.+++,
1+.+++,
2+.+++,
3+.+++,
4+.+++,
5+.+++,
-66/,
-660,
-661,
-662,
-663,
-664,
-665,
-666,
/+++,
/++-,
/++/,
/++0,
/++1,
/++2,
/++3,
/++4,
/++5,
/++6,
/+-+,
/+--,
78&))&9:,;<=>
?'@&$'),
A$B#C,%&'(&)&*#",
D9CC9E&:F",
=#"#CG#",':H,IJC@)J",
K#@9"&$",
+,
-+.+++,
/+.+++,
0+.+++,
1+.+++,
2+.+++,
3+.+++,
4+.+++,
5+.+++,
-66/,
-660,
-661,
-662,
-663,
-664,
-665,
-666,
/+++,
/++-,
/++/,
/++0,
/++1,
/++2,
/++3,
/++4,
/++5,
/++6,
/+-+,
/+--,
7I9JCL#>,=#"#CG#,D':M,9N,;:H&'
A$B#C",
;:G#"$8#:$",
!HG':L#",7OC&9C&$P>,
!HG':L#",7A$B#C">,
Q&FJC#,4R,D':M,9N,S9MP9,T&$"J(&"B&,UQV,7DSTU>,&:,;:H&'
!"
#$!!!"
%!$!!!"
%#$!!!"
&!$!!!"
&#$!!!"
'!$!!!"
'#$!!!"
(!$!!!"
(#$!!!"
%))&"
%))'"
%))("
%))#"
%))*"
%))+"
%)),"
%)))"
&!!!"
&!!%"
&!!&"
&!!'"
&!!("
&!!#"
&!!*"
&!!+"
&!!,"
&!!)"
&!%!"
&!%%"
-./00/12"3456
789/:80"
;:<=>"?/8@/0/A=B"
C1>>1D/2EB"
5=B=>F=B"82G"HI>90IB"
J=91B/:B"
!"
#$!!!"
%!$!!!"
%#$!!!"
&!$!!!"
&#$!!!"
'!$!!!"
'#$!!!"
(!$!!!"
(#$!!!"
%))&"
%))'"
%))("
%))#"
%))*"
%))+"
%)),"
%)))"
&!!!"
&!!%"
&!!&"
&!!'"
&!!("
&!!#"
&!!*"
&!!+"
&!!,"
&!!)"
&!%!"
&!%%"
-H1I>K=6"5=B=>F="C82L"1M"32G/8!
;:<=>B"
32F=B:N=2:B"
OGF82K=B"-P>/1>/:Q6"
OGF82K=B"-;:<=>B6"
R/EI>=",S"./TI<1"71>91>8:="C82L"-.37C6"/2"32G/8
OBB=:B ?/8@/0/A=B
15
central bank in India, we can observe the assets and liabilities of Japanese banks in India. Figure 7 and 8 show the assets and liabilities of two existing banks: the BTMU and SMBC. In the case of BTMU, as for the asset side, lending has been rapidly increasing from around 2006. On the other hand, as for the liability side, that is, ways of raising funds, deposits have not kept up with lending. The margin is offset by capital and borrowing, both of which are funds from their headquarters. Here "capital" means fictitious capital, when branches in India are deemed to independent corporations. In the case of MICB, as for the asset side, lending has increased from around 2007, especially in 2011. Lending is larger than deposits, and the margin is offset by capital, especially when capital is increased to a large degree. 3.2.3 Deregulation In 1969, the Government of India nationalized the 14 largest commercial banks which contained 85 percent of bank deposits in the country. In the early 1990s, the government embarked on a policy of liberalization, licensing private banks and foreign banks, but even now around 80 percent of bank deposits are held by public banks (Reserve Bank of India, 2012).
Against this background, the banking sector in India, including foreign banks, generally faces severe restrictions. Of these, distinguishing rules include Priority Sector Lending and branch authorisation policy.
Priority Sector Lending (PSL) is aimed at enhancing credit facilities for those priority sectors that impact large sections of the population, the weaker sections and the sectors which are employment intensive, such as agriculture and micro and small enterprises (MSE). Concretely speaking, in the case of foreign banks, 32 percent of bank credit has been stipulated for lending to priority sectors; and within the overall target of 32 percent to be achieved by foreign banks, the advanced to micro and small enterprises should not be less than 10 percent (Reserve Bank of India, 2011; Ministry of Finance, 2012).
Also, banks need to step up opening of branches in rural areas so as to meet the objectives of financial inclusion and increased banking penetration. “Financial inclusion” refers to the process of ensuring access to appropriate financial services for vulnerable groups such as the weaker sections of the population, especially in rural areas, where many remain outside the coverage of the formal banking system. Banks have been mandated to open at least 25 percent of the total number of branches proposed to be opened during each year in unbanked rural centers (Reserve Bank of India, 2011). The Japan Chamber of Commerce and Industry in India (2012), which includes existing Japanese banks as member companies, requests the loosening of both regulations. Regarding PSL, they argue that regulations related to PSL, especially in the Medium and Small Enterprise sector, should be relaxed. Their point is that once the above suggestion is realized,
16
banks can be more proactive in lending on-shore loans and as a result, more economic effect can be expected even in the MSE sector.
Also, regarding branch authorisation, Japanese banks request that they should be allowed to open branch offices in the metropolitan areas. They justify their proposal through pointing out that Japan's FDI into India is an efficient driver for the further development of the Indian economy, especially in promoting its development of infrastructure. Japanese banks are essential financial infrastructure for those investments.
Governmental negotiations are also being conducted on this issue. On December 28, 2011, Prime Minister Noda visited India and announced financial support to the Delhi Mumbai Industrial Corridor (DMIC) while at the same time working with the Indian side for the relaxation of financial regulations (see the Joint Statement: “Vision for the Enhancement of the Japan-India Strategic and Global Partnership upon entering the year of the 60th Anniversary of the Establishment of Diplomatic Relations”). In it,
“Prime Minister Noda announced the intention of the Government of Japan to make available for DMIC projects Japan's public and private finance totaling 4.5 billion dollars in the next five years.” “In order to effectively utilise the facility [DMIC] and to facilitate investments by Japanese companies, India will endeavour to resolve issues within the existing regulatory framework and guidelines of capital regulations, and an inter-departmental consultation mechanism will also be established by India to provide expeditious solutions to issues raised by Japan during the course of implementation of the DMIC Project.” (Emphasis added by the author).
4. Concluding Remarks By utilizing a newly launched version of National Accounts Statistics, the characteristics of Indian economy are confirmed as comprising: a service-oriented production structure; large disposable income allocation to the household sector due to the presence of an informal sector; a high degree of consumption and low degree of investment; a high degree of demand for valuables; and a fiscal deficit and current account deficit. Such financial constraints are blocking the improvement of India’s inadequate infrastructure. Also, to overcome the problem of inadequate infrastructure, two solutions have been presented in this paper: restraining of gold demand and the deregulation of the banking sector. It is emphasized that, especially regarding supply for stable finance for investment, Japan can
17
contribute through financial transactions along with ODA. Such financial transactions are beneficial not only for the further development of Indian economy, but also could become a good source of growth for the Japanese economy. Currently, many western financial institutions are not in a healthy state due to financial crisis, but the situation in Japan is relatively better. I believe there is a plenty of scope for Japan to enhance its cooperation with India to find opportunity for the growth of both.
18
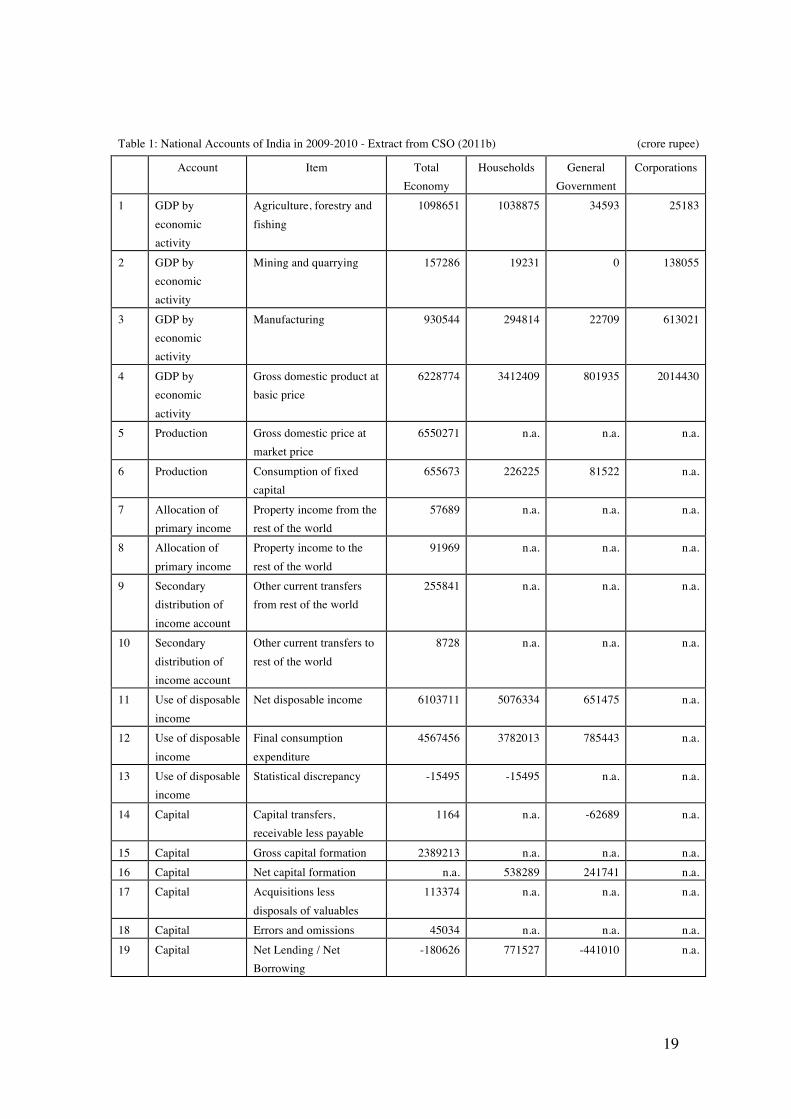
Appendix A.1 Method and Assumptions for Figure 1 This appendix explains the method and assumptions used to construct the numbers for Figure 1.
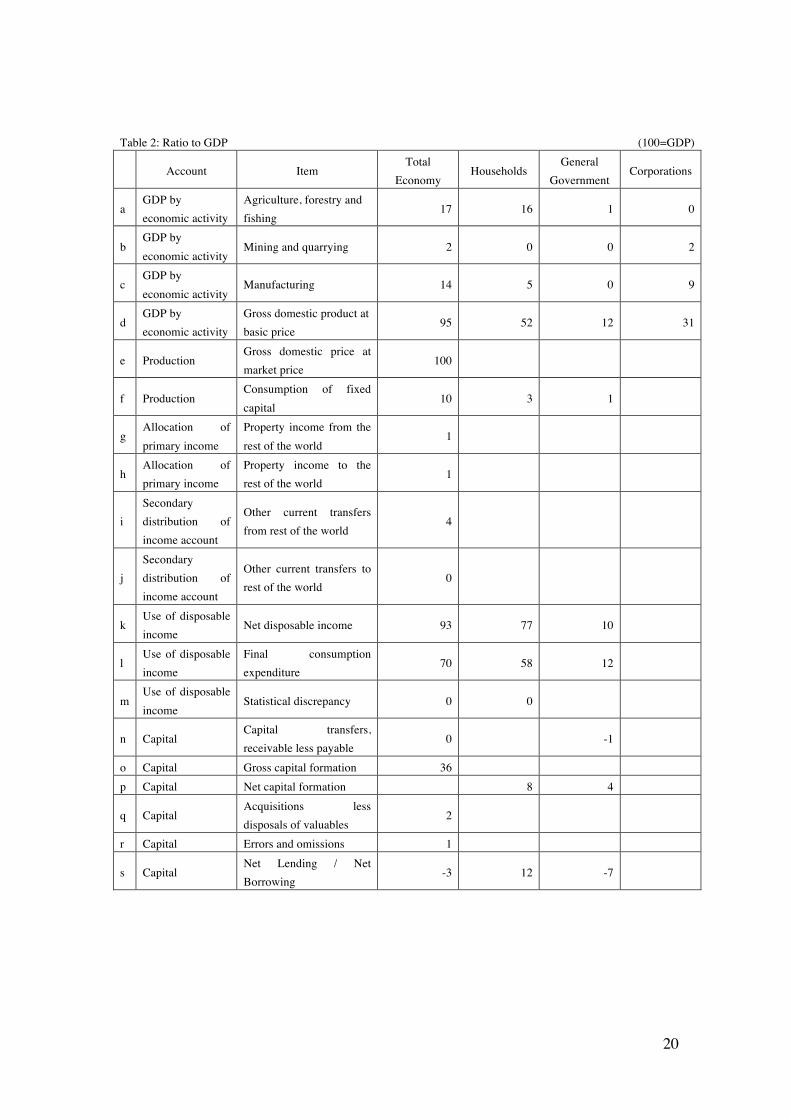
Table 1 displays the raw data from the National Accounts of India (Centre of Statistical Organisation, 2011b). The units are crore (10 million) rupee. For Lines 1 to 3, the industry-wise GDP based on market price was not available, so the GDP based on basic price is shown. Lines 7 to 10 show the receipt and payment of income and transfers to and from overseas. Line 11 shows disposable income, which is the main source for consumption and capital formation (Lines 12 to 17). Line 19 shows the balance between income and its physical use, which also implies the source for financial transactions. Most financial and non-financial data on corporations, excluding accounts of economic activity, was not available, so this estimation is performed later. Table 2 shows the ratio of each figure in Table 1 to GDP.
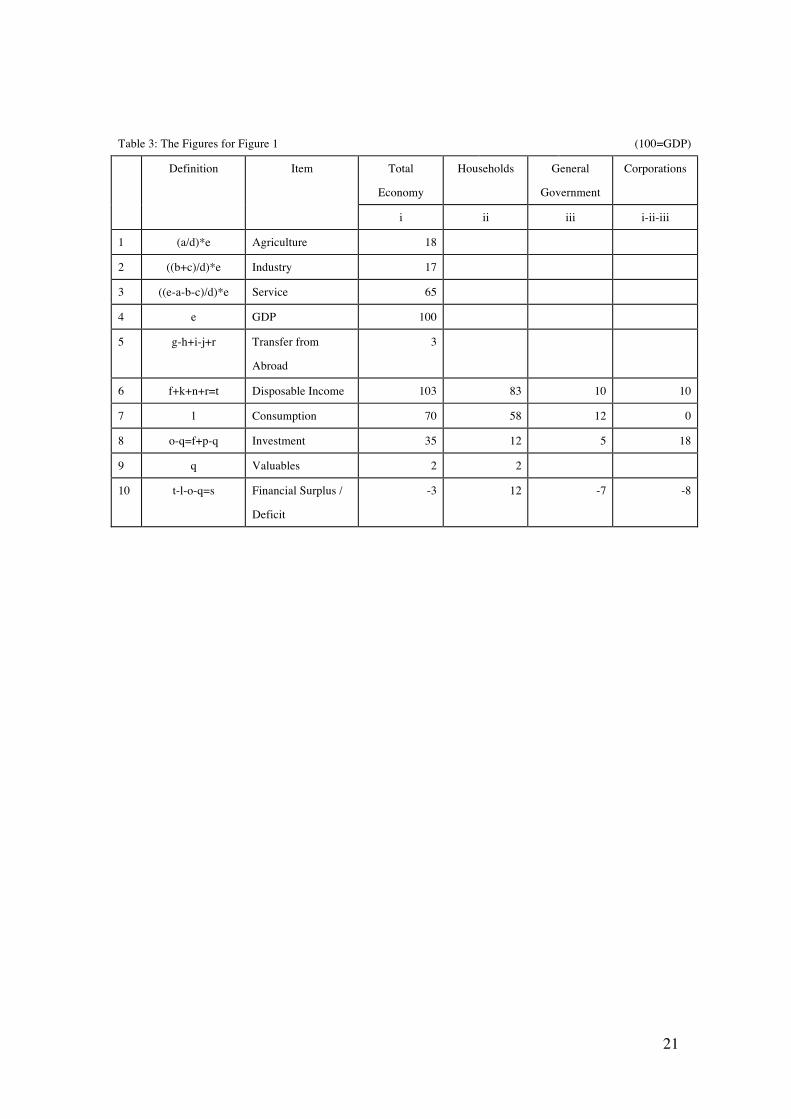
Table 3 shows the definition and estimated values of each item. Lines 1 to 3 display industry-wise GDP. Its raw data is based on basic price, instead of market price, so they are proportionally allocated. Line 5 shows the net receipt of property income and transfers from overseas. Line 6 shows gross disposable income, including the consumption of capital. Additionally, miscellaneous items, including capital transfers, statistical discrepancy, errors and omissions, are shown in Line 6.
There is no sector-wise figure for the net acquisitions of valuables, so it is assumed that all valuables are acquired by the household sector. This assumption is plausible, because
valuables do not include industrial use and monetary gold. The explanatory notes on valuables from the Central Statistical Organisation (2007, 2011b) are quoted in the next section of this
Appendix. However, the capital account for households is balanced in spite of ignoring
valuables, so the statistical discrepancy of the capital account is accounted for in Line 6: disposable income of households, along with other miscellaneous items.
19
Table 1: National Accounts of India in 2009-2010 - Extract from CSO (2011b) (crore rupee)
Account Item Total Economy
Households General Government
Corporations
1 GDP by economic activity
Agriculture, forestry and fishing
1098651 1038875 34593 25183
2 GDP by economic activity
Mining and quarrying 157286 19231 0 138055
3 GDP by economic activity
Manufacturing 930544 294814 22709 613021
4 GDP by economic activity
Gross domestic product at basic price
6228774 3412409 801935 2014430
5 Production Gross domestic price at market price
6550271 n.a. n.a. n.a.
6 Production Consumption of fixed capital
655673 226225 81522 n.a.
7 Allocation of primary income
Property income from the rest of the world
57689 n.a. n.a. n.a.
8 Allocation of primary income
Property income to the rest of the world
91969 n.a. n.a. n.a.
9 Secondary distribution of income account
Other current transfers from rest of the world
255841 n.a. n.a. n.a.
10 Secondary distribution of income account
Other current transfers to rest of the world
8728 n.a. n.a. n.a.
11 Use of disposable income
Net disposable income 6103711 5076334 651475 n.a.
12 Use of disposable income
Final consumption expenditure
4567456 3782013 785443 n.a.
13 Use of disposable income
Statistical discrepancy -15495 -15495 n.a. n.a.
14 Capital Capital transfers, receivable less payable
1164 n.a. -62689 n.a.
15 Capital Gross capital formation 2389213 n.a. n.a. n.a. 16 Capital Net capital formation n.a. 538289 241741 n.a. 17 Capital Acquisitions less
disposals of valuables 113374 n.a. n.a. n.a.
18 Capital Errors and omissions 45034 n.a. n.a. n.a. 19 Capital Net Lending / Net
Borrowing -180626 771527 -441010 n.a.
20
Table 2: Ratio to GDP
(100=GDP)
Account Item Total
Economy Households
General Government
Corporations
a GDP by economic activity
Agriculture, forestry and fishing
17 16 1 0
b GDP by economic activity
Mining and quarrying 2 0 0 2
c GDP by economic activity
Manufacturing 14 5 0 9
d GDP by economic activity
Gross domestic product at basic price
95 52 12 31
e Production Gross domestic price at market price
100
f Production Consumption of fixed capital
10 3 1
g Allocation of primary income
Property income from the rest of the world
1
h Allocation of primary income
Property income to the rest of the world
1
i Secondary distribution of income account
Other current transfers from rest of the world
4
j Secondary distribution of income account
Other current transfers to rest of the world
0
k Use of disposable income
Net disposable income 93 77 10
l Use of disposable income
Final consumption expenditure
70 58 12
m Use of disposable income
Statistical discrepancy 0 0
n Capital Capital transfers, receivable less payable
0 -1
o Capital Gross capital formation 36 p Capital Net capital formation 8 4
q Capital Acquisitions less disposals of valuables
2
r Capital Errors and omissions 1
s Capital Net Lending / Net Borrowing
-3 12 -7
21
Table 3: The Figures for Figure 1 (100=GDP)
Definition Item Total
Economy
Households General
Government
Corporations
i ii iii i-ii-iii
1 (a/d)*e Agriculture 18
2 ((b+c)/d)*e Industry 17
3 ((e-a-b-c)/d)*e Service 65
4 e GDP 100
5 g-h+i-j+r Transfer from
Abroad
3
6 f+k+n+r=t Disposable Income 103 83 10 10
7 l Consumption 70 58 12 0
8 o-q=f+p-q Investment 35 12 5 18
9 q Valuables 2 2
10 t-l-o-q=s Financial Surplus /
Deficit
-3 12 -7 -8
22
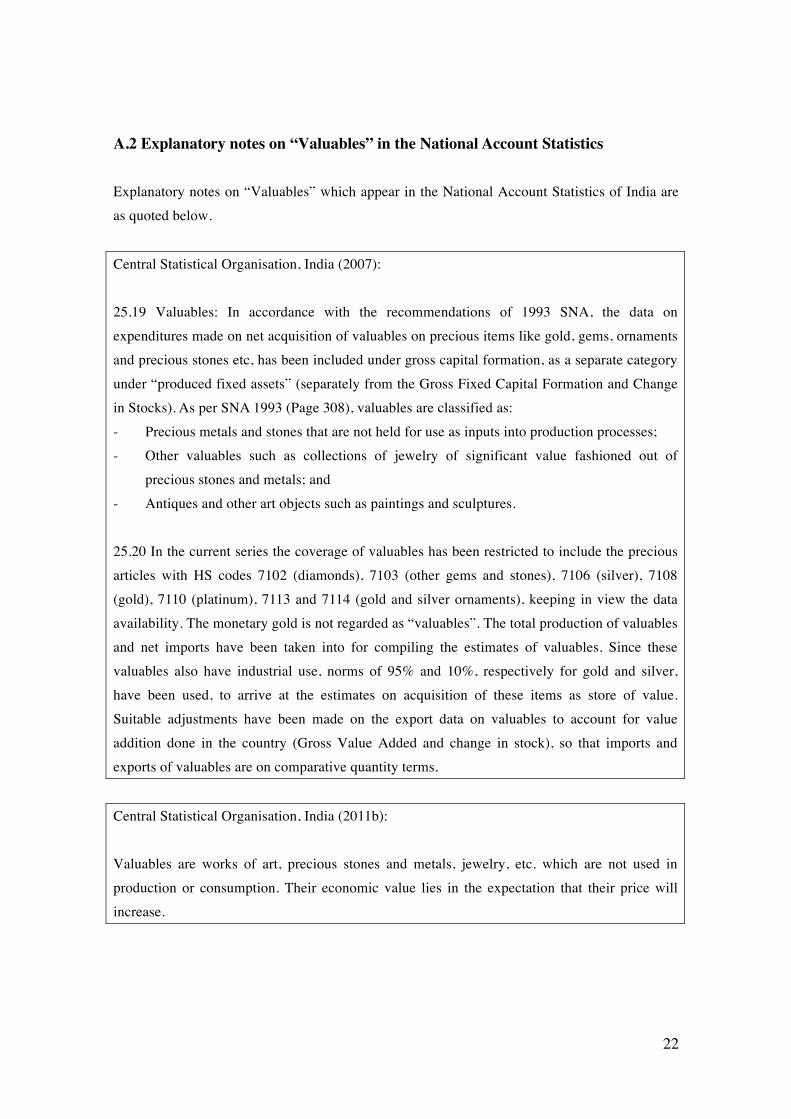
A.2 Explanatory notes on “Valuables” in the National Account Statistics Explanatory notes on “Valuables” which appear in the National Account Statistics of India are as quoted below.
Central Statistical Organisation, India (2007): 25.19 Valuables: In accordance with the recommendations of 1993 SNA, the data on expenditures made on net acquisition of valuables on precious items like gold, gems, ornaments and precious stones etc, has been included under gross capital formation, as a separate category under “produced fixed assets” (separately from the Gross Fixed Capital Formation and Change in Stocks). As per SNA 1993 (Page 308), valuables are classified as: - Precious metals and stones that are not held for use as inputs into production processes; - Other valuables such as collections of jewelry of significant value fashioned out of
precious stones and metals; and - Antiques and other art objects such as paintings and sculptures.
25.20 In the current series the coverage of valuables has been restricted to include the precious articles with HS codes 7102 (diamonds), 7103 (other gems and stones), 7106 (silver), 7108 (gold), 7110 (platinum), 7113 and 7114 (gold and silver ornaments), keeping in view the data availability. The monetary gold is not regarded as “valuables”. The total production of valuables and net imports have been taken into for compiling the estimates of valuables. Since these valuables also have industrial use, norms of 95% and 10%, respectively for gold and silver, have been used, to arrive at the estimates on acquisition of these items as store of value. Suitable adjustments have been made on the export data on valuables to account for value addition done in the country (Gross Value Added and change in stock), so that imports and exports of valuables are on comparative quantity terms.
Central Statistical Organisation, India (2011b): Valuables are works of art, precious stones and metals, jewelry, etc. which are not used in production or consumption. Their economic value lies in the expectation that their price will increase.
23
Reference Bank of Japan (2012). Flow of Funds. Cabinet Office, Japan (2012). Annual Report on National Accounts 2012. Central Statistical Organisation, India (2007). National Accounts Statistics Sources and Methods
2007. Central Statistical Organisation, India (2008). Input-Output Transactions Table 2003-04. Central Statistical Organisation, India (2011a). National Account Statistics 2011. Central Statistical Organisation, India (2011b). National Account Statistics (In the Accounting
Framework of the UN System of National Accounts), 2011. International Monetary Fund (2011). “India Sustainability Report.” Japan Chamber of Commerce and Industry in India (2012). Suggestions for the Government of
India by the Japan Chamber of Commerce and Industry in India (JCCII) 2012. Keynes, John Maynard (1913). Indian Currency and Finance. Kohli, Renu (2012). “India: Financial and Capital Markets”. Mimeograph. McKinsey Global Institute (2006). “Accelerating India’s Growth through Financial System
Reform.” Ministry of Finance, India (2012). Economic Survey 2012. National Bureau of Statistics of China (2011), China Statistical Yearbook 2011. Reserve Bank of India (2009). “Flow of Funds Accounts of the Indian Economy 2001-2 to
2007-2008.” Monthly Bulletin. October 2009. Reserve Bank of India (2011). Annual Report. 2010-2011. Reserve Bank of India (2012). A Profile of Banks. 2010-2011. Rao, K. G. K. Subba (2004). “Saving, Investment and Flow of Funds Accounts.” Economic and
Political Weekly. World Gold Council (2010). “India: Heart of Gold.”