Embed Size (px)
Citation preview
Department:Basic Education REPUBLIC OF SOUTH AFRICA
MACRO INDICATOR TRENDS IN SCHOOLING:
SUMMARY REPORT2011
Published by the Department of Basic Education
Sol Plaatje House222 Struben StreetPretoriaSouth Africa
Private Bag X895, Pretoria, 0001Tel: 012 357 3000 Fax: 012 323 6260/0601
ISBN: 978-1-4315-0397-1
© Department of Basic Education, 2011
1
ABBREVIATIONS AND ACRONYMS .................................................... 5
FOREWORD .............................................................................. 6
KEY FINDINGS............................................................................ 9
Access ............................................................................... 9
Efficiency ........................................................................... 10
Quality .............................................................................. 12
Finance ............................................................................. 14
1. INTRODUCTION ............................................................. 15
2. ACCESS TO EDUCATION ................................................... 16
2.1 Participation in Grade R programmes ................................ 16
2.2 Attendance at education institutions amongst 7- to 15-year olds 24
2.3 Attendance at education institutions amongst 16-to-18-year olds 26
2.4 Children not attending an educational institution.................. 30
3. EFFICIENCY ................................................................. 33
3.1 Percentage of Repeaters............................................... 33
2
3.2 Drop-out rate ........................................................... 37
3.3 Primary and Secondary Completion Rate........................... 40
4. QUALITY .................................................................... 43
4.1 Learner achievement................................................... 43
4.2 National and International Learner Achievement Assessments.. 47
4.3 Class Size................................................................ 51
4.4 EducatorQualifications............................................... 54
4.5 Literacy Rates .......................................................... 57
5. FINANCE ................................................................... 59
5.1 Public Expenditure on Schooling as a percentage of GDP ....... 59
5.2 Public expenditure on education as a percentage of total government expenditure 62
5.3 Per Capita Expenditure on primary and secondary schooling.... 64
5.4 Percentage of provincial education expenditure on personnel .. 67
6. CONCLUSION .............................................................. 69
REFERENCES ........................................................................... 70
3
List of tables
Table 1: Percentage of 16-to-18- year olds attending educational institutions by race: 2002 to 2009... 29
Table 2: Percentage of 16-to-18- year olds attending educational institutions by gender: 2002 to 2009. 30
Table 3: Number and percentage of children not attending an education institution: 2002 to 2009..... 32
Table 4: Percentage of repeaters at schools by grade and gender, 2009 ..................................... 36
Table 5: Average percentage score and pass rate in a sample of schools that participated in the Annual National
Assessment, 2009 ...................................................................................................... 48
Table 6: Mean reading and mathematics scores of all participating countries in SACMEQ II and SACMEQ III Project
Table 7: Average class size in ordinary schools, by funding type: 2007 – 2009................................ 51
Table 8: Number of school by class size in public ordinary schools, 2008 and 2009.......................... 53
Table 9: Adult literacy rates among the population aged 20 and over: 2002 to 2009........................ 58
4
List of figures
Figure 1: Percentage of Grade 1 learners who had attended a pre-primary school programme: 2006 to 2009 18
Figure 2: Attendance in education programmes amongst 5-year olds: 2002 to 2009 ....................... 21
Figure 3 : Attendance in education programmes amongst 5-year olds by province: 2009 ................. 23
Figure 4: Participation in education programmes amongst 7-to-15-year olds: 2002 to 2009 .............. 25
Figure 5: Attendance at education institutions by 16-to-18- year olds in single years: 2002 to 2009.... 27
Figure 6: Drop-out rate, 2007/2008 ................................................................................ 39
Figure 7: Proportion of 16-year old in the population who have completed Grade 7 and proportion of 24-year olds
who have completed Grade 12, 2002 to 2009 .................................................................. 42
Figure8:Numberofcandidatesandtheandthepassratesintheseniorcertificateexamination/nationalsenior
certificateexamination:1994to2010........................................................................... 46
Figure9:PercentageofQualifiedEducators:2002to2010.................................................. 56
Figure 10: Public expenditure on schooling as a percentage of GDP: 1995/6 to 2009/10 ............... 61
Figure 11: Percentage of total public expenditure on schooling ............................................. 63
Figure 12: Nominal and real per capita expenditure on primary and secondary schooling............... 66
Figure 13: Percentage of provincial education expenditure allocated to personnel: 1989/90 to 2009/10 68
5
Abbreviations And Acronyms
ANA Annual National Assessment
DBE Department of Basic Education
DoE Department of Education
ECD Early Childhood Development
FET Further Education and Training
GDP Gross Domestic Product
GHS General Household Survey
GNP Gross National Product
GPI Gender Parity Index
MTSF Medium Term Strategic Framework
NSC National Senior Certificate
NIDS National Income Dynamics Study
RSA Republic of South Africa
REQV Relative Education Qualification Value
SACMEQ Southern and Eastern African Consortium for Monitoring Education Quality
Stats SA Statistics South Africa
UNESCO United Nations Education, Scientific and Cultural Organisation
6
FOREWORD
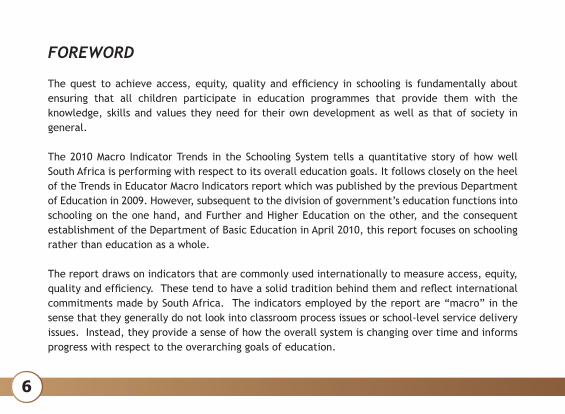
Thequest toachieveaccess,equity,qualityandefficiency in schooling is fundamentallyaboutensuring that all children participate in education programmes that provide them with the knowledge, skills and values they need for their own development as well as that of society in general.
The 2010 Macro Indicator Trends in the Schooling System tells a quantitative story of how well South Africa is performing with respect to its overall education goals. It follows closely on the heel of the Trends in Educator Macro Indicators report which was published by the previous Department of Education in 2009. However, subsequent to the division of government’s education functions into schooling on the one hand, and Further and Higher Education on the other, and the consequent establishment of the Department of Basic Education in April 2010, this report focuses on schooling rather than education as a whole.
The report draws on indicators that are commonly used internationally to measure access, equity, qualityandefficiency.Thesetendtohaveasolidtraditionbehindthemandreflectinternationalcommitments made by South Africa. The indicators employed by the report are “macro” in the sense that they generally do not look into classroom process issues or school-level service delivery issues. Instead, they provide a sense of how the overall system is changing over time and informs progress with respect to the overarching goals of education.
7
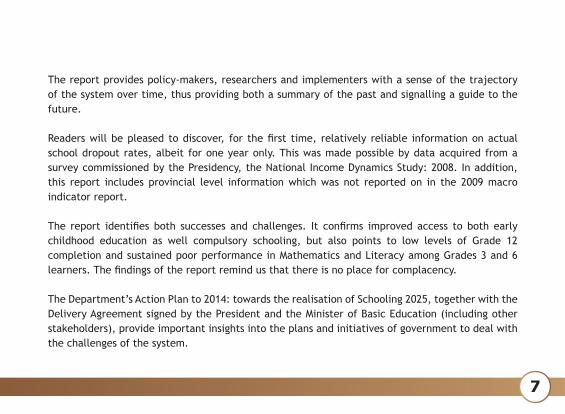
The report provides policy-makers, researchers and implementers with a sense of the trajectory of the system over time, thus providing both a summary of the past and signalling a guide to the future.
Readerswillbepleasedtodiscover, for thefirst time, relatively reliable informationonactualschool dropout rates, albeit for one year only. This was made possible by data acquired from a survey commissioned by the Presidency, the National Income Dynamics Study: 2008. In addition, this report includes provincial level information which was not reported on in the 2009 macro indicator report.
The report identifies both successes and challenges. It confirms improved access to both earlychildhood education as well compulsory schooling, but also points to low levels of Grade 12 completion and sustained poor performance in Mathematics and Literacy among Grades 3 and 6 learners.Thefindingsofthereportremindusthatthereisnoplaceforcomplacency.
The Department’s Action Plan to 2014: towards the realisation of Schooling 2025, together with the Delivery Agreement signed by the President and the Minister of Basic Education (including other stakeholders), provide important insights into the plans and initiatives of government to deal with the challenges of the system.
8
This is a summary report. It should therefore be read in conjunction with the more comprehensive report which is published on the Department’s website: www.education.gov.za
I am confident that this report provides a useful reference for decision-making and definingpriorities. I am therefore pleased to present this report and have little doubt that it provides insightful information on the schooling system.
Bobby Soobrayan
9
MACRO INDICATOR TRENDS IN SCHOOLING:
SUMMARY REPORT
KEY FINDINGS
Access
1. The proportion of children attending pre-school programmes has increased substantially over the past five years. This is evidenced by the growth in the percentage of learners enrolled in Grade 1 who had attended a pre-primary programme, from 61% in 2006 to 71% in 2009.
2. Levels of participation among children of compulsory school-going age (7 to 15 years) are high, with almost 99% of children in this age group enrolled in an education institution in 2009.
10
3. Although participation rates in education programmes beyond the compulsory school age band are good by middle-income country standards, there has been little improvement in participation rates in education among 16 to 18 year old children since 2002. Overall, about 83% of 16 to 18 year olds attended an education institution in 2009, with significantly higher proportions of 16 year olds attending education institutions (93%) as compared to 18 year olds (72%). Distinct racial patterns of participation have emerged in the 16 to 18 year age group. For example, in 2009, only 68% of Coloured youths aged 16 to 18 were enrolled in an education institution compared to 85% for Africans and 87% for Whites.
4. Close to 670 000 children aged 7 to 18 were not attending any education institution in 2009, down from approximately 860 000 in 2002. The majority of these children were in the 16 to 18 age group.
Efficiency
5. About 9% of learners enrolled in schools in 2009, were repeating the grade they were in, in the previous year. Available comparative international information indicates that the level of repetition in primary schools in South Africa was high (7%) compared to the average level of repetition in primary schools in developing
11
countries (5%) and developed countries (less than 1%). Male learners generally tend to repeat much more than female learners. Additionally, repetition is much more extensive in the higher grades than the lower grades as teachers in the higher grades try to deal with backlogs in learning from the primary schools and also as a result of “gate-keeping” in Grades 10 and 11.
6. The overall drop-out rate from the school system (from Grades 1 to 11) was 4% between 2007 and 2008. The drop-out rate was minimal up until Grade 8 but increased from Grade 9 upwards, with about 10% of learners in Grades 9 to 11 dropping out of school between 2007 and 2008.
7. Although the primary completion rate1 has increased substantially over the past eight years (from 79% in 2002 to 88% in 2009), it remains a challenge that 12% of 16 year olds have not completed primary education. A reduction in repetition rates is likely to improve the primary completion rate.
1 This refers to the completion of Grade 7 by 16 year olds.
12
8. The secondary completion rate2, which was 43% in 2009, has remained basically unchanged between 2002 and 2009. The challenge for the system is to increase both primary and secondary completion rates.
Quality
9. As is generally well known, academic achievement is a major cause for concern in South Africa. Both national and international assessments indicate that South African children have failed to master the Mathematics and language skills appropriate for their grade.
10. While the pass rate in the national senior certificate examination has been erratic since 1994, rising and falling over several years, there has been an improvement in the number of candidates passing, both with a senior certificate as well as with an endorsement/bachelor pass. In 1994, 287 343 candidates had passed the senior certificate examination. By 2010 this had increased to 364 513 candidates. The number of endorsement/bachelor passes increased from 88 497 in 1994 to 126 371 in 2010.
2 This refers to the completion of Grade 12 by 24 year olds.
13
11. The national average class size in public ordinary schools ranged between 36 and 38 between 2007 and 2009. However, overcrowding in a large number of schools remains a matter of concern. In 2009, almost 40% of public ordinary schools (over 8 000 schools) had average class sizes above the norm of 40. In Mpumalanga almost 48% of schools had average class sizes of more than 40.
12. There have been significant improvements in the qualifications of educators since 1990. In 2010, 95% of educators were appropriately qualified compared to 64% in 1994.
13. The adult literacy rate3 was 80% in 2009, compared to 71% in 2002. A higher proportion of adult men than women are literate, although the difference is very small.
3 This refers to persons aged 20 years and older, who have completed primary schooling (Grade 7).
14
Finance
14. Per capita expenditure has increased substantially both in nominal and real terms4. In nominal terms, it increased from R3 250 in 2000/01 to R7 826 in 2009/10.
15. The percentage of provincial education budgets allocated to personnel was just over 76% in 2009/10. This figure reflects a steady and significant gain for non-personnel expenditure since 1998/99 (which was less than 10% at the time), and comes closer to the desired ratio of personnel to non-personnel expenditure at 80:20.
4 A nominal value is one that reflects the current situation at that time and where the effects of inflation have not been taken into account. A real value is one where inflation has been taken into account.
15
1. INTRODUCTION
This report provides a summary of key trends in macro-indicators for the South African schooling system. It needs to be read in conjunction with the more comprehensive version of the report, which provides information on a wider range of indicators and is more explanatory. The indicators used in this report are widely used internationally for monitoring and evaluating education systems, and focus on the overall education goals of access, equity, quality and efficiency.
Because schooling in South Africa is compulsory for children from the age of 7 until the age of 15 (or from Grades 1 to 9), relevant indicators have been analysed in terms of those children who are subject to compulsory education (7 to 15) and those who fall beyond compulsory school age (16 to 18). Much of the data provided in the report covers the period 2002 to 2009, however, where data sources were available, the data goes back in time as far as possible.
This report shows that substantial progress has been made with regards to access to education for children of compulsory school age, as well as access to pre-primary education. The results of the 2010 National Senior Certificate (NSC) examinations also indicate a marked improvement from that of the past few years. There are however
16
still several areas of concern, particularly, attendance of post-compulsory school- aged children as well as issues pertaining to learning. These areas of concern are addressed in government’s Medium Term Strategic Framework (RSA, 2009) and the Department of Basic Education (DBE)’s Action Plan to 2014: Towards the Realisation of Schooling 2025 (DBE, 2010), which spells out the Department of Basic Education’s long-term sector plan for schools.
As is often the case with reports of this nature, the accuracy of the data that is available is often questionable. However, efforts are being made to improve the consistency and accuracy of the data to produce a more reliable and in-depth analysis of macro-indicator trends in schooling.
2. ACCESS TO EDUCATION
2.1 Participation in Grade R programmes
The Department of Basic Education plans to expand public provisioning of Grade R so that every child entering Grade 1 would have participated in an accredited reception year programme by 2014 (DBE, 2010:20). The original intention of phasing in Grade R
17
for every child by 2010 (Department of Education (DoE), 2001) was not met, and has thus been extended to 2014.
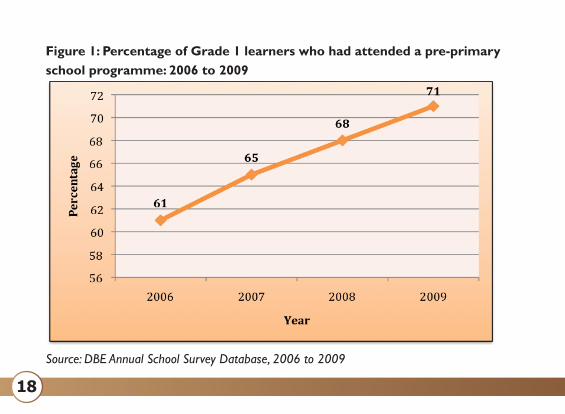
Figure 1 indicates that the percentage of learners enrolled in Grade 1, who had previously attended a pre-primary programme, increased substantially from 61% in 2006 to 71% in 2009. This trend is a reflection of improved access to pre-primary education, which is deemed essential for improved learning outcomes in higher grades.
18
Figure 1: Percentage of Grade 1 learners who had attended a pre-primary school programme: 2006 to 2009
Source: DBE Annual School Survey Database, 2006 to 2009
19
The proportion of 5 year old children who attend some form of education programme is another indicator of participation.
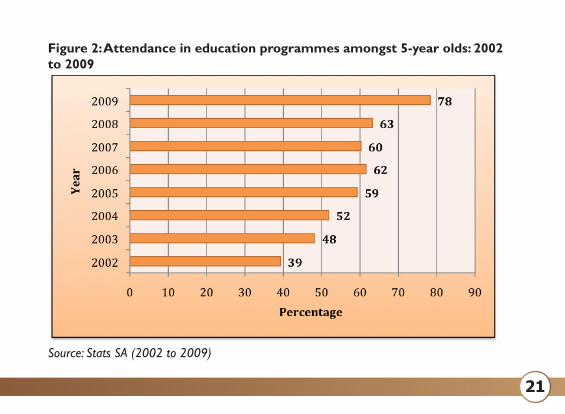
Figure 2 shows that the percentage of 5 years old enrolled in an education institution actually doubled from 39% in 2002 to 78% in 2009. The large increase from 2002 to 2005 was most likely the result of the Department beginning the process of phasing in Grade R in terms of White Paper on Early Childhood Education (ECD) that was released in 2001 (DoE, 2001).
Similarly, the significant increase in the percentage of 5 years old children attending education institutions between 2008 and 2009 could be attributed to the efforts made by provincial education departments and other stakeholders to meet the original target of ensuring that all 5 years old had access to Grade R by 2010. In particular, the provision of nutrition to Grade R learners, increased subsidies to Grade R practitioners, cheaper fees paid by parents at public schools offering Grade R and the automatic acceptance of registered Grade R learners to grade1 could have contributed to greater attendance of 5 year old children at education institutions.
20
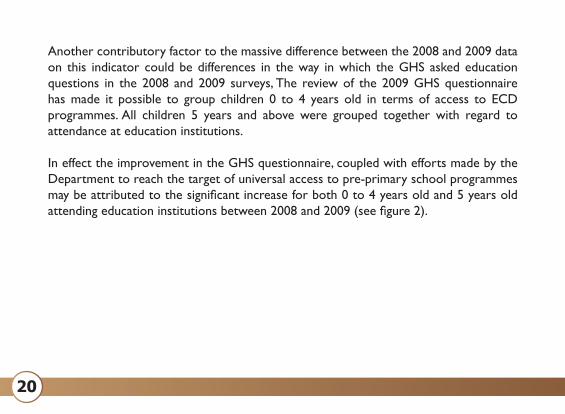
Another contributory factor to the massive difference between the 2008 and 2009 data on this indicator could be differences in the way in which the GHS asked education questions in the 2008 and 2009 surveys, The review of the 2009 GHS questionnaire has made it possible to group children 0 to 4 years old in terms of access to ECD programmes. All children 5 years and above were grouped together with regard to attendance at education institutions.
In effect the improvement in the GHS questionnaire, coupled with efforts made by the Department to reach the target of universal access to pre-primary school programmes may be attributed to the significant increase for both 0 to 4 years old and 5 years old attending education institutions between 2008 and 2009 (see figure 2).
21
Figure 2: Attendance in education programmes amongst 5-year olds: 2002 to 2009
Source: Stats SA (2002 to 2009)
22
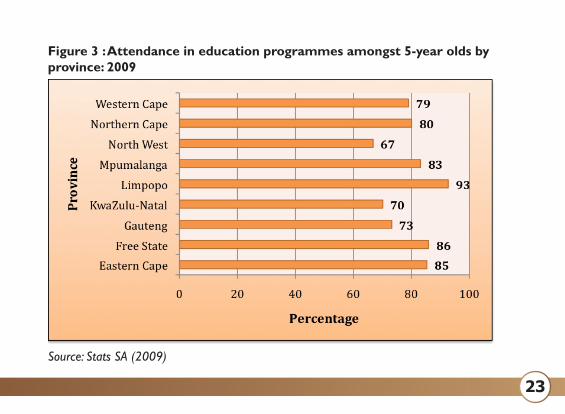
Figure 3 shows substantial variation between provinces with respect to the proportion of 5-year olds enrolled in education institutions. This ranged from a low of 67% in the North West to a high of 93% in Limpopo. This is an indication of inequitable access to education for 5 year old children across provinces. However, it also indicates that “poorer” provinces such as the Eastern Cape and Limpopo have invested much in this sub-sector of education.
23
Figure 3 : Attendance in education programmes amongst 5-year olds by province: 2009
Source: Stats SA (2009)
24
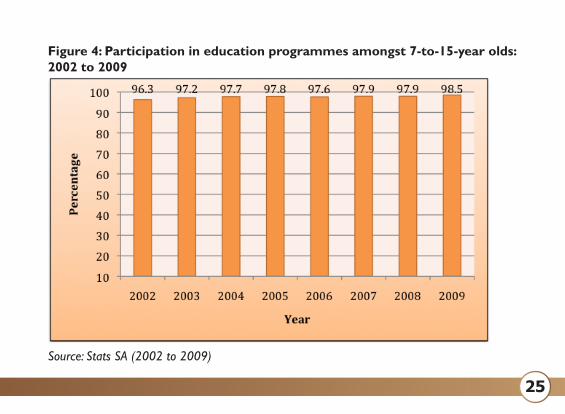
2.2 Attendance at education institutions amongst 7-to-15-year olds
Schooling in South Africa is compulsory for a child from the first school day of the year in which a child turns 7 until the last school day of the year in which the child reaches the aged of 15 years or the ninth grade, whichever comes first (RSA, 1996).
As part of its Action Plan to 2014, the Department has set a target that by 2014, 99% of children would remain effectively enrolled in school up to the year in which they turn 15 (DBE, 2010a:16).
Figure 4 shows that this plan is on target. The participation of children in this age group is extremely high with almost 99% of children enrolled in an education institution in 2009, up from 96% in 2002.
25
Figure 4: Participation in education programmes amongst 7-to-15-year olds: 2002 to 2009
Source: Stats SA (2002 to 2009)
26
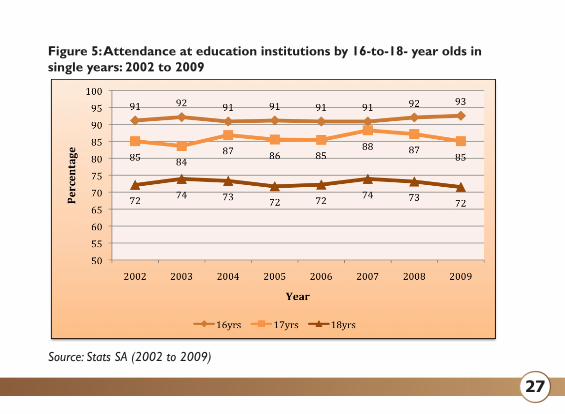
2.3 Attendance at education institutions amongst 16-to-18-year olds
Figure 5 shows that once children move beyond the compulsory school age band, enrolment in any form of education drops. For example, while 96% of 15 year olds attended an education institution in 2009, this dropped to 93% of 16-year olds (see figure 5). The biggest decline in learner participation in an education institution occurs among 17- and 18-year olds. In 2009, 85% of 17-year olds, and only 72% of 18-year olds attended an education institution.
Of great concern is the fact that there has been no improvement in the participation of 17 and 18 year old children in education programmes, over the eight year period from 2002 to 2009.
Ensuring that as many young people as possible are able to access and complete secondary education is a very important strategic goal for the South African government. The Medium Term Strategic Framework commits government to increasing secondary school enrolment rates to 95% by 2014 (Republic of South Africa, 2009:23), however this goal needs to be understood in the context of improving the access of youth to all forms of Further Education and Training (FET) beyond Grade 9 ( DBE, 2011b), including both schools as well as FET Colleges.
27
Figure 5: Attendance at education institutions by 16-to-18- year olds in single years: 2002 to 2009
Source: Stats SA (2002 to 2009)
28
The challenge in meeting this target is that it will require the building of a substantial number of additional classrooms as well as the training of additional teachers in order to accommodate the approximately 500 000 youth who drop out of school after the age of 15.
Table 1 shows distinct racial patterns of attendance, with a smaller proportion of Coloured youth aged 16 to 18 participating in education in comparison to other population groups. In 2009, this applied to 68% of Coloured youth compared to 80% for Indians, 85% for Africans and 87% for whites. Possible reasons for the lower participation of Coloured youth include: historically better access to the labour market; the negative impact of gang involvement in areas in the Western Cape; youths taking up farm work in the Western Cape to supplement household income; and, the possible effects of foetal alcohol syndrome (Social Surveys and Centre for Applied Social Studies, 2009:40)
29
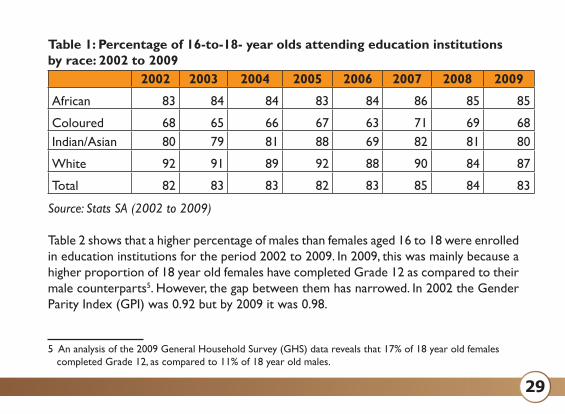
Table 1: Percentage of 16-to-18- year olds attending education institutions by race: 2002 to 2009
2002 2003 2004 2005 2006 2007 2008 2009
African 83 84 84 83 84 86 85 85
Coloured 68 65 66 67 63 71 69 68Indian/Asian 80 79 81 88 69 82 81 80
White 92 91 89 92 88 90 84 87
Total 82 83 83 82 83 85 84 83
Source: Stats SA (2002 to 2009)
Table 2 shows that a higher percentage of males than females aged 16 to 18 were enrolled in education institutions for the period 2002 to 2009. In 2009, this was mainly because a higher proportion of 18 year old females have completed Grade 12 as compared to their male counterparts5. However, the gap between them has narrowed. In 2002 the Gender Parity Index (GPI) was 0.92 but by 2009 it was 0.98.
5 An analysis of the 2009 General Household Survey (GHS) data reveals that 17% of 18 year old females completed Grade 12, as compared to 11% of 18 year old males.
30
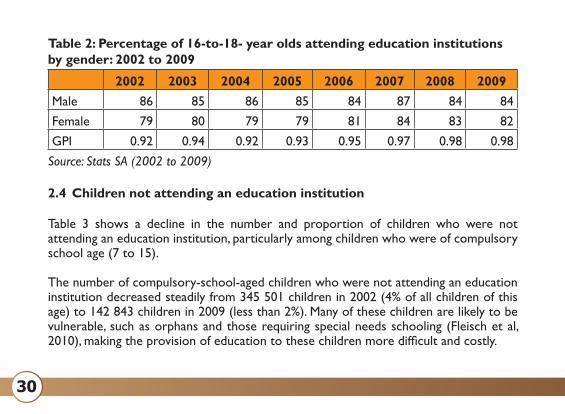
Table 2: Percentage of 16-to-18- year olds attending education institutions by gender: 2002 to 2009
2002 2003 2004 2005 2006 2007 2008 2009Male 86 85 86 85 84 87 84 84Female 79 80 79 79 81 84 83 82GPI 0.92 0.94 0.92 0.93 0.95 0.97 0.98 0.98
Source: Stats SA (2002 to 2009)
2.4 Children not attending an education institution
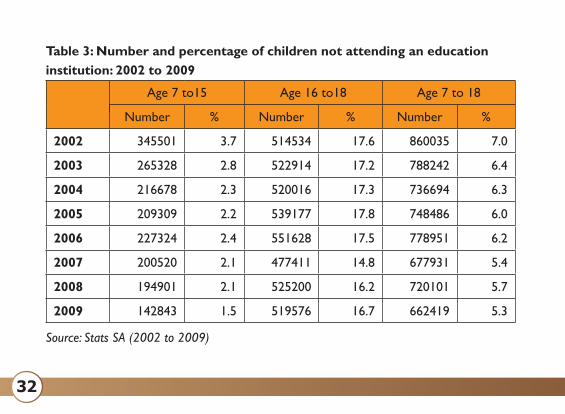
Table 3 shows a decline in the number and proportion of children who were not attending an education institution, particularly among children who were of compulsory school age (7 to 15).
The number of compulsory-school-aged children who were not attending an education institution decreased steadily from 345 501 children in 2002 (4% of all children of this age) to 142 843 children in 2009 (less than 2%). Many of these children are likely to be vulnerable, such as orphans and those requiring special needs schooling (Fleisch et al, 2010), making the provision of education to these children more difficult and costly.
31
The majority of children not attending an education institution were in the 16 to 18 age group. There has not been much change in the percentage of 16-to-18-year olds out of school over the past 8 years. In 2009, this applied to 519 576 children (or 17%), down very slightly from 514 535 (or 18%) in 2002.
In total 662 419 children aged 7 to 18 were not attending an education institution in 2009. This amounted to just over 5% of all children of this age group, down from 7% in 2002 when 860 035 children were out of school.
32
Table 3: Number and percentage of children not attending an education institution: 2002 to 2009
Age 7 to15 Age 16 to18 Age 7 to 18
Number % Number % Number %
2002 345501 3.7 514534 17.6 860035 7.0
2003 265328 2.8 522914 17.2 788242 6.4
2004 216678 2.3 520016 17.3 736694 6.3
2005 209309 2.2 539177 17.8 748486 6.0
2006 227324 2.4 551628 17.5 778951 6.2
2007 200520 2.1 477411 14.8 677931 5.4
2008 194901 2.1 525200 16.2 720101 5.7
2009 142843 1.5 519576 16.7 662419 5.3
Source: Stats SA (2002 to 2009)
33
1. 2.
3. EFFICIENCY
3.1 Percentage of repeaters
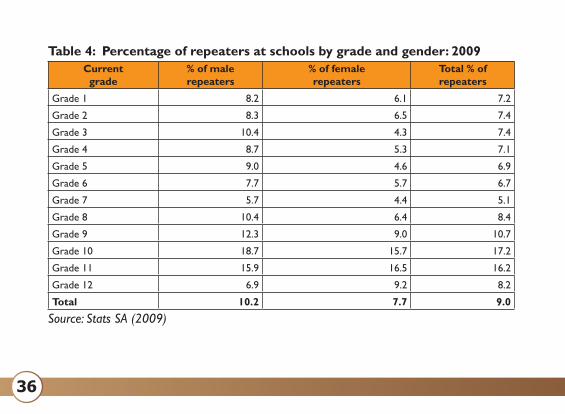
Table 4, indicates that, overall, 9% of learners enrolled in schools in 2009 were repeating the grade they were in the previous year6. 1South Africa’s level of repetition is high. International comparative information for primary schools for 2007 (UNESCO, 2010:355), shows that South Africa’s average level of repetition in primary schools (at 7%), was higher than the average level for developing countries (5%) and for developed countries (less than 1%).
In general, repetition is higher among male learners than female learners. Table 4 shows that this is apparent in all grades except Grades 11 and 12. Owing to their higher repeater rate, male learners tend to move at a slower rate from one grade to the next, than female learners. Consequently, more males are left behind in primary school, which accounts for the much higher primary school participation rates for males (99% in 2009) as compared to that for females (96% in 2009). Because females move through to 6The General Household Survey included a question on grade repetition for the first time in 2009. Because data for only one year are available, no trends analysis could be done.
34
secondary school more efficiently than male learners this accounts for the much higher secondary school participation rate for females (88% in 2009) than males (82% in 2009).
Repetition is much greater in higher grades than in the lower grades. This occurs as a result of teachers in the higher grades trying to deal with learners who have failed to master basic skills in primary school but who have nonetheless progressed from grade to grade. The percentage of repeaters in Grades 10 and 11 are particularly high as schools “gate-keep” in an attempt to improve their national senior certificate examination results which are publicly reported in a way that results of earlier grades are not (De Souza, 2003:4). It will be interesting though, to see the effect of the new Annual National Assessments (ANA) on this trend.
Table 4 shows that in 2009, 8% of school learners enrolled in Grade 12, were repeaters. However the actual level of repetition in Grade 12 is likely to be much higher, since large numbers of learners enrol in FET colleges and Adult Education Centres to have a second chance at passing Grade 12.
35
Research has shown that in 2007, a third of all children at school had repeated a grade. This applied to 21% of learners in the Foundation Phase (Grades 1 to 3) while 52% had repeated by the time they were in the Further Education and Training (FET) phase (Grades 10 to 12) (Social Surveys Africa and Centre for Applied Legal Studies, 2009:11).
36
Table 4: Percentage of repeaters at schools by grade and gender: 2009Current grade
% of male repeaters
% of female repeaters
Total % of repeaters
Grade 1 8.2 6.1 7.2
Grade 2 8.3 6.5 7.4
Grade 3 10.4 4.3 7.4
Grade 4 8.7 5.3 7.1
Grade 5 9.0 4.6 6.9
Grade 6 7.7 5.7 6.7
Grade 7 5.7 4.4 5.1
Grade 8 10.4 6.4 8.4
Grade 9 12.3 9.0 10.7
Grade 10 18.7 15.7 17.2
Grade 11 15.9 16.5 16.2
Grade 12 6.9 9.2 8.2
Total 10.2 7.7 9.0
Source: Stats SA (2009)
37
3.2 Drop-out rate
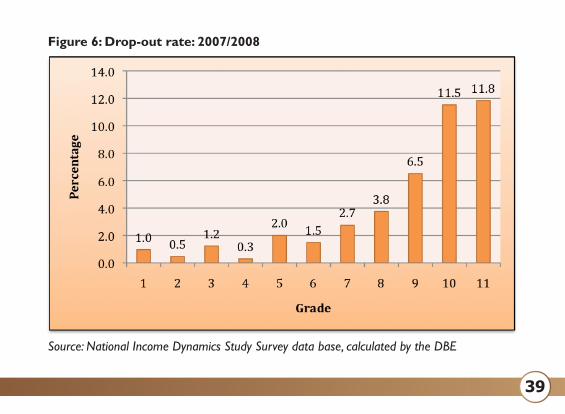
For many years, the Department faced several challenges in determining the dropout rate of children from school owing to the unavailability of reliable data. The recent National Income Dynamics Study (NIDS)72has however, proved to be a useful source for this indicator. Since the NIDS data is only available for one year, no trend analysis could be undertaken. Figure 1 shows the drop-out rate from school by grade between 2007 and 2008 (i.e. children who were enrolled in a particular grade in 2007 and were not enrolled in school in 2008).
The overall drop-out rate from the school system (from Grades 1 to 11) was 4%. It can be seen in Figure 6 that the drop-out rate before Grade 9 was extremely low. It was around 1% in Grades 1 and 3 and less than 1% in Grades 2 and 4. From Grades 5 to 8 the drop-out rate was minimal, ranging between 2% and 4%. The low drop-out rate in the lower grades was consistent with the high enrolment rates in these grades.
7 NIDS is a national panel study initiated by the Presidency. It is a household survey that was carried out in 2008.
38
From Grade 9 upwards, however, the drop-out rate increases, reaching almost 12% in both Grades 10 and 11. In total 10% of learners who had been enrolled in Grades 9 to 11 dropped out of school between 2007 and 2008.
Research by Strassburg et al (2010) and Fleisch et al (2010) has found that dropping out of schools is not a single event but is usually the result of a combination of inter-related factors that lead up to a child eventually dropping out of school. Fleisch et al (2010:7) noted that poverty alone did not explain why children were not in school and identified other factors (such as disability, family structure, i.e., not living with biological parents or grandparents, orphanhood, being eligible for, but not accessing social welfare and living in isolated communities) which, combined with poverty, make children more vulnerable to dropping out of schools.
Strassburg et al (2010: 40-41) found that financial pressures and complex social processes (such as teenage pregnancy and substance abuse) combined with in-school factors (such as lack of stimulation and support) result in youth disengaging from their education and eventually dropping out of school.
39
Figure 6: Drop-out rate: 2007/2008
Source: National Income Dynamics Study Survey data base, calculated by the DBE
40
3.3 Primary and secondary completion rate
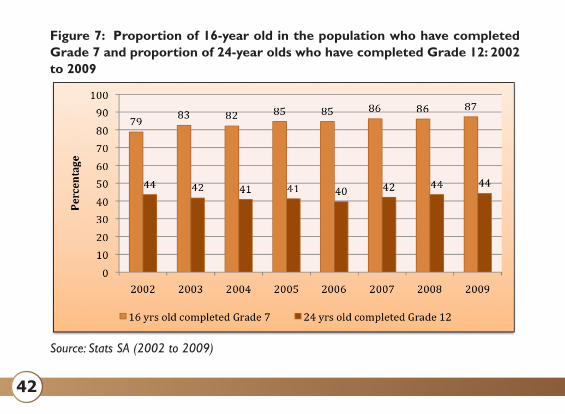
Completion rate identifies the percentage of learners who have completed a given level of education. Although participation rates are high in South Africa, problems with repetition and drop-out can result in poor completion rates and reflects on the efficiency of the school system. Figure 7 shows the achieved completion rate for the number of 16-year olds83 who have completed Grade 7 and the number of 24 year olds9 who have completed Grade 12.
There has been a steady increase in the percentage of 16-year olds who have completed Grade 7, from 79% in 2002 to 88% in 2009.
As a result of the large number of youth who leave school after the age of 15 and particularly the high number of 17 and 18 year olds who leave school without completingtheir schooling, fewer than half of all 24-year olds in the population have
8 Age 16 was selected for this purpose because, theoretically, if a learner enrols in school a the age of 7 and repeats grades at the maximum allowed in terms of the Department’s policy on grade progression, (namely, once per phase – or three times by Grade 7), the learner could be 16 in Grade 7. 9 Age 24 was selected for the secondary completion rate to take into account repetition, late entry to school as well as the phenomenon of dropping out of and back into school.
41
completed Grade 12. The situation has remained basically unchanged between 2002 and 2009, with the completion rate varying between 40% and 45% during this eight year period.
The Department’s target for 2014 though is to ensure that 50% of youth obtain a National Senior Certificate (NSC) by 2014 (DBE, 2010:22).
42
Figure 7: Proportion of 16-year old in the population who have completed Grade 7 and proportion of 24-year olds who have completed Grade 12: 2002 to 2009
Source: Stats SA (2002 to 2009)
43
4. QUALITY
4.1 Learner achievement
The National Senior Certificate (NSC) examination of 2008 was the first Grade 12 examination based on the new national curriculum statement that had been introduced in Grade 10 in 2006. A learner is issued with a NSC if the learner achieves: at least 40% in the required official language at Home Language level; at least 30% in the other required language on at least First Additional Language level; at least 30% in Mathematical Literacy or Mathematics; at least 40% in Life Orientation; and at least 40% in one of the remaining three subjects and at least 30% in two other subjects in the National Senior Certificate (NSC) examination (Section 11, DoE, 2005a).
In order to obtain admission to a higher education diploma programme, a NSC with a minimum achievement rating of between 40% and 49%) in four subjects (not including life orientation) is required. For admission to a higher education Degree programme an NSC with a minimum achievement rating of between 50% and 59% in four subjects (not including life orientation) is required. However, each higher education institution is free to set more exacting standards for admission either overall or for particular courses of study.
44
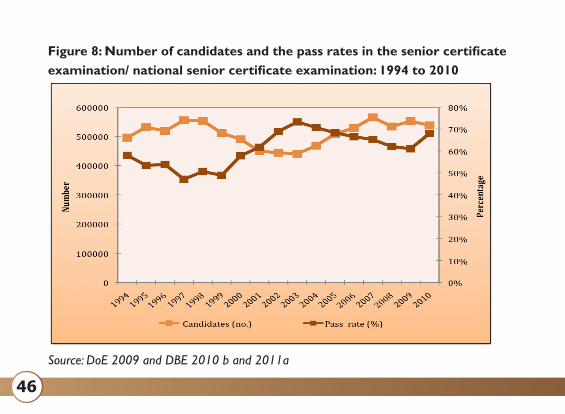
The NSC examination (which prior to 2008 was known as the senior certificate examination) takes place at the end of Grade 12.
The trend in the number of candidates writing the examination has varied since 1994, rising and falling over several years. Over the same period there was a substantial improvement in the number of candidates passing, as well as the number of candidates passing with an endorsement/bachelor pass. In 1994, 287 343 candidates passed the examination increasing to 364 513 candidates in 2010, an increase of 27%. The number of endorsement/bachelor passes increased from 88 497 in 1994 to 126 371 in 2010, an increase of 43%.
The Department plans to increase the number of learners who become eligible for a bachelors programme at a university to 175 000 by 2014 as part of its Action Plan to 2014, (DBE, 2010:46).
The pass rate has been has been highly variable over the reporting period, and as one can see in figure 8. The trend in the pass rate is almost the exact reverse of the number of candidates writing the examination, i.e. when the number of learners writing
45
increases, the pass rate decreases and vice versa. In 2010, 68% of candidates passed the examination up from 61% in 2009. In 2010, 24% of candidates obtained a pass that would enable them to get entrance to a university, the highest recorded since the introduction of democratic governance in South Africa in 1994.
46
Figure 8: Number of candidates and the pass rates in the senior certificate examination/ national senior certificate examination: 1994 to 2010
Source: DoE 2009 and DBE 2010 b and 2011a
47
4.2 National and international learner achievement assessments
In 2008, the Department introduced a national standardised assessment system known as the Annual National Assessments (ANA), as part of its Foundations for Learning campaign. ANA aimed to assess learners in Grades 1 to 6 in literacy/language and numeracy/Mathematics. To date, two rounds of assessment have been undertaken, one in 2008 and the other in 2009. In 2008, about 70% of schools participated in ANA, and in 2009 90% participated.
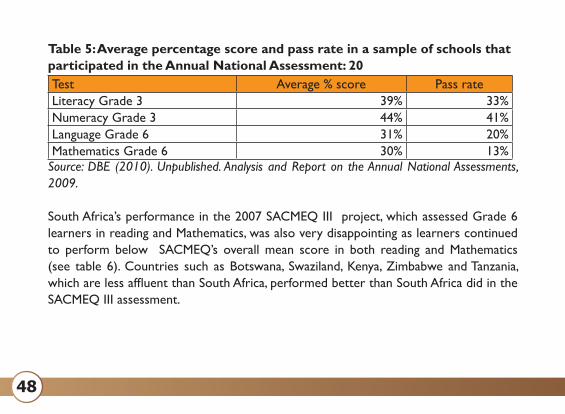
The results of a sample of learners that participated in the 2009 Annual National Assessment is shown Table 5 . The achievement of learners in these assessments was very poor and the results indicate that the average Grade 3 and Grade 6 child in South African struggles with numeracy or maths and has failed to master reading and writing.
In the 2009 annual national assessment, 50% was deemed to be a pass. The average aggregate obtained in Grade 3 for numeracy in 2009 was 44% and 39% for literacy. While 41% of Grade 3 learners passed the numeracy assessment, only 33% passed the literacy assessment. In Grade 6 the situation was even worse; only 13% of learners passed Mathematics and 20% passed language. The average aggregate achieved in language was 31% and the average aggregate in Mathematics was 30%.
48
Table 5: Average percentage score and pass rate in a sample of schools that participated in the Annual National Assessment: 20Test Average % score Pass rateLiteracy Grade 3 39% 33%Numeracy Grade 3 44% 41%Language Grade 6 31% 20%Mathematics Grade 6 30% 13%
Source: DBE (2010). Unpublished. Analysis and Report on the Annual National Assessments, 2009.
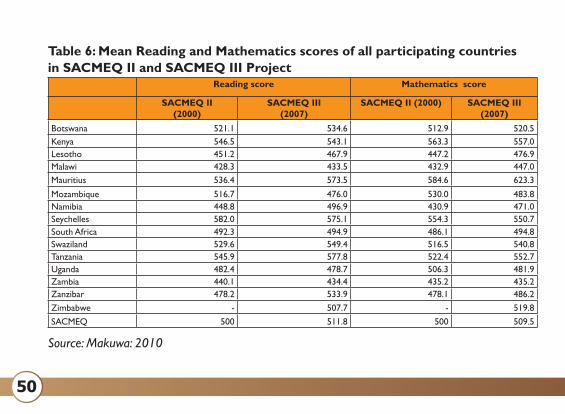
South Africa’s performance in the 2007 SACMEQ III project, which assessed Grade 6 learners in reading and Mathematics, was also very disappointing as learners continued to perform below SACMEQ’s overall mean score in both reading and Mathematics (see table 6). Countries such as Botswana, Swaziland, Kenya, Zimbabwe and Tanzania, which are less affluent than South Africa, performed better than South Africa did in the SACMEQ III assessment.
49
There was very little if any improvement in South Africa’s results between SACMEQ II in 2000 and SACMEQ III in 2007. There was negligible improvement in the reading score between SACMEQ II and SACMEQ III, with learners improving by just over two points over the period. The improvement in Mathematics was slightly better but still small, with the average learners’ score increasing by just less than nine points. South Africa ranked ninth (out of 14) in Mathematics in 2000 and (tenth out of 15) in 2007. In reading, South Africa ranked eighth in both 2000 and 2007.
50
Table 6: Mean Reading and Mathematics scores of all participating countries in SACMEQ II and SACMEQ III Project
Reading score Mathematics score
SACMEQ II(2000)
SACMEQ III(2007)
SACMEQ II (2000) SACMEQ III (2007)
Botswana 521.1 534.6 512.9 520.5Kenya 546.5 543.1 563.3 557.0Lesotho 451.2 467.9 447.2 476.9Malawi 428.3 433.5 432.9 447.0Mauritius 536.4 573.5 584.6 623.3
Mozambique 516.7 476.0 530.0 483.8Namibia 448.8 496.9 430.9 471.0Seychelles 582.0 575.1 554.3 550.7South Africa 492.3 494.9 486.1 494.8Swaziland 529.6 549.4 516.5 540.8Tanzania 545.9 577.8 522.4 552.7Uganda 482.4 478.7 506.3 481.9Zambia 440.1 434.4 435.2 435.2Zanzibar 478.2 533.9 478.1 486.2Zimbabwe - 507.7 - 519.8SACMEQ 500 511.8 500 509.5
Source: Makuwa: 2010
51
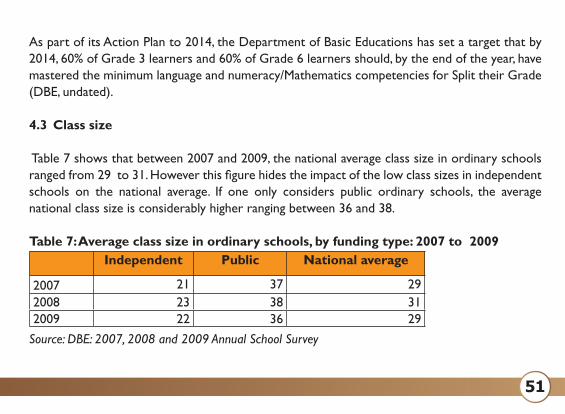
As part of its Action Plan to 2014, the Department of Basic Educations has set a target that by 2014, 60% of Grade 3 learners and 60% of Grade 6 learners should, by the end of the year, have mastered the minimum language and numeracy/Mathematics competencies for Split their Grade (DBE, undated).
4.3 Class size
Table 7 shows that between 2007 and 2009, the national average class size in ordinary schools ranged from 29 to 31. However this figure hides the impact of the low class sizes in independent schools on the national average. If one only considers public ordinary schools, the average national class size is considerably higher ranging between 36 and 38.
Table 7: Average class size in ordinary schools, by funding type: 2007 to 2009Independent Public National average
2007 21 37 292008 23 38 312009 22 36 29
Source: DBE: 2007, 2008 and 2009 Annual School Survey
52
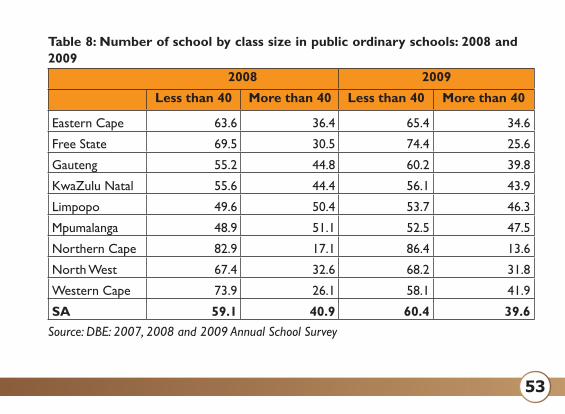
However, these national averages also mask huge disparities in actual class sizes at schools. Table 8 shows that there substantial overcrowding in a large number of schools. In 2009, almost 40% of public ordinary schools (over 8 000 schools) had average class sizes above the norm of 40 which has been established for classroom size. Just over 2 800 schools had had an average of more than 50 children in a class.
The proportion of schools in each province accommodating more than 40 learners, ranged from 14% in the Northern Cape to almost 48% in Mpumalanga in 2009. In 2008 Mpumalanga and Limpopo also had a high proportion of schools with classes accommodating more than 40 learners (51% and 50% respectively).
53
Table 8: Number of school by class size in public ordinary schools: 2008 and 2009
2008 2009
Less than 40 More than 40 Less than 40 More than 40
Eastern Cape 63.6 36.4 65.4 34.6
Free State 69.5 30.5 74.4 25.6
Gauteng 55.2 44.8 60.2 39.8
KwaZulu Natal 55.6 44.4 56.1 43.9
Limpopo 49.6 50.4 53.7 46.3
Mpumalanga 48.9 51.1 52.5 47.5
Northern Cape 82.9 17.1 86.4 13.6
North West 67.4 32.6 68.2 31.8
Western Cape 73.9 26.1 58.1 41.9
SA 59.1 40.9 60.4 39.6Source: DBE: 2007, 2008 and 2009 Annual School Survey
54
4.4 Educator qualifications
According to the Criteria for the Recognition of Qualifications for Employment in Education Based on the Norms and Standards for Educators (DoE 2000:1), a minimum of REQV 13 (which equates to a minimum of three year professional training) is required in order to be registered with the South African Council for Educators. An educator who does not have a matric certificate and three years of training as an educator or who has received training outside the field of education is considered to be unqualified or under-qualified.
Educator qualifications have been an important policy issue in South Africa mainly because during the apartheid period, different qualifications were required for educators of different race groups. This resulted in a situation where white and Indian educators were much better qualified than African and Coloured educators. Since 2000 in order to be considered a professionally qualified educator a person must have a matric certificate and at least three years of professional training (DoE 2000:1).
55
There has been significant improvement in the qualifications of educators since 1990. In 2010, 95% of educators were appropriately qualified compared to 64% in 1994, the first year of democratic government in South Africa, and only 53% in 1990.
The fact that learning outcomes among children and youth remains low, while the percentage of qualified educators has increased, raises questions about the value of these qualifications as a measure of the competency of teachers. A discussion on the impact of educator qualifications on the quality of education outcomes would be enhanced by also looking at issues such as educators’ subject matter knowledge, their pedagogic skills, the use of learning materials and curriculum coverage as well as the quality of educator training.
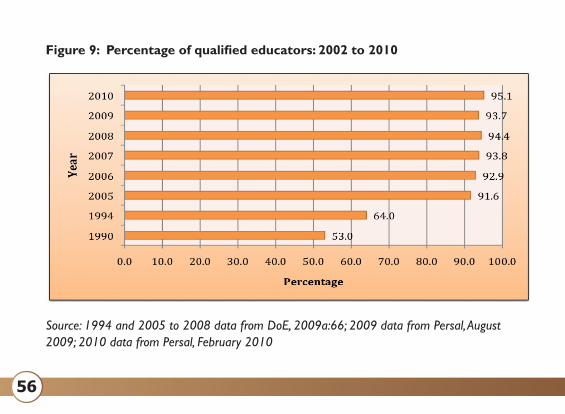
56
Figure 9: Percentage of qualified educators: 2002 to 2010
Source: 1994 and 2005 to 2008 data from DoE, 2009a:66; 2009 data from Persal, August 2009; 2010 data from Persal, February 2010
57
4.5 Literacy rates It is very difficult to obtain accurate data on literacy levels as literacy statistics are seldom based on assessments of actual ability. In order to measure literacy rates in South Africa level of education attained is used as a proxy for literacy. It is assumed that literacy is reached with the attainment of a minimum level of formal education. Censuses or surveys are used to obtain this information. In this report a person is defined as literate if he/she has achieved at least seven years of education (i.e. has completed primary school). A person is defined as totally illiterate if he/she has received no formal education at all. Although this method is used for measuring literacy rates in South Africa, it is not uncontroversial. It does not take into account people who become literate through literacy programmes.
The Department of Education launched the Kha Ri Gude mass literacy campaign in 2008 with the aim of halving the number of illiterate adults in the country by 2015. Kha Ri Gude enables adult learners to read, write and calculate in their mother tongue and also to learn spoken English. In 2009 a total of 613 643 adult learners, were registered with the campaign (DoE 2010: 125), and a specific effort has been made to target vulnerable groups. Currently 80% of the learners are women, 8% are disabled, 25% are youth, and 20% are above the age of 60 (DBE, undated).
58
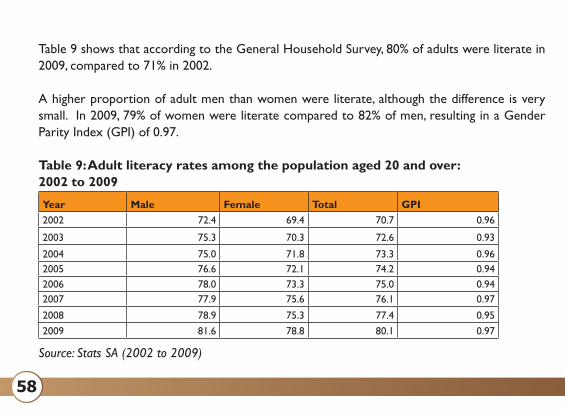
Table 9 shows that according to the General Household Survey, 80% of adults were literate in 2009, compared to 71% in 2002.
A higher proportion of adult men than women were literate, although the difference is very small. In 2009, 79% of women were literate compared to 82% of men, resulting in a Gender Parity Index (GPI) of 0.97.
Table 9: Adult literacy rates among the population aged 20 and over: 2002 to 2009
Year Male Female Total GPI2002 72.4 69.4 70.7 0.96
2003 75.3 70.3 72.6 0.93
2004 75.0 71.8 73.3 0.962005 76.6 72.1 74.2 0.942006 78.0 73.3 75.0 0.942007 77.9 75.6 76.1 0.97
2008 78.9 75.3 77.4 0.952009 81.6 78.8 80.1 0.97
Source: Stats SA (2002 to 2009)
59
1. 2. 3. 4.
5. FINANCE
5.1 Public expenditure on schooling as a percentage of GDP
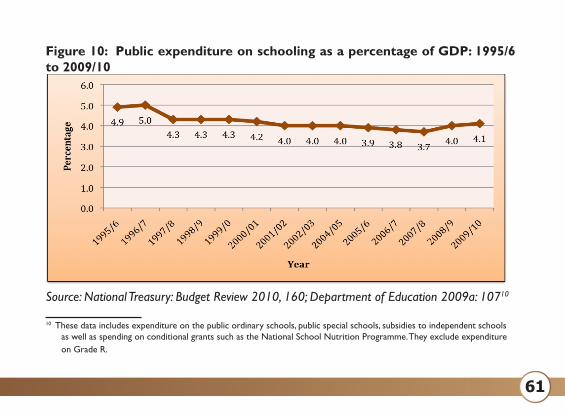
Government expenditure on schooling as a percentage of the country’s Gross Domestic Product (GDP) was about 4% in 2009/10 (see Figure 10). This figure compares favourably with that of other countries, which indicate an average of 3% for developing countries and 2.9% in Sub-Saharan Africa (DBE 2011b:15).
As Figure 10 shows, that after peaking at 5% in 1996/97, mainly as a result of the equalisation of the post-apartheid educator salary equalisation process, public expenditure as a percentage of GDP decreased from the late 1990s until 2007/08. This decline can be attributed to the effects of the teacher rationalisation policy implemented for several years after 1996 and, later to the strong increase in expenditure in other public sectors such as social welfare and local government. The continuing decline can also be attributed to a lower growth pattern in the education budget relative to the growth in the economy.
60
After 2007/08 there has been a steady increase in public expenditure on schooling as a percentage of GDP. This pattern reflects the phased introduction of the no-fee school policy and the extension of the National School Nutrition Programme to the poorest 25% of secondary schools in 2009/10.
61
Figure 10: Public expenditure on schooling as a percentage of GDP: 1995/6 to 2009/10
Source: National Treasury: Budget Review 2010, 160; Department of Education 2009a: 107101
10 These data includes expenditure on the public ordinary schools, public special schools, subsidies to independent schools as well as spending on conditional grants such as the National School Nutrition Programme. They exclude expenditure on Grade R.
62
5.2 Public expenditure on education as a percentage of total government expenditure
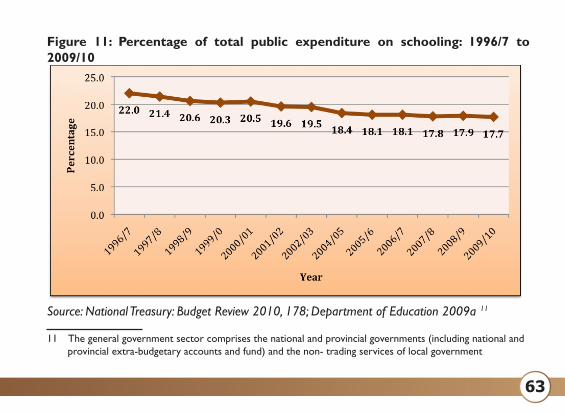
Figure 11 indicates that education’s share of government expenditure declined from 22% in 1996/97 to 17.7% in 2009/10. This decline is a result of substantial increases in other areas of government spending, such as social welfare, housing and local government, rather than a fall in priority accorded to education, and, as is evident in Figure 12, has not resulted in a decrease in per capita expenditure, even in real terms.
63
Figure 11: Percentage of total public expenditure on schooling: 1996/7 to 2009/10
Source: National Treasury: Budget Review 2010, 178; Department of Education 2009a211
11 The general government sector comprises the national and provincial governments (including national and provincial extra-budgetary accounts and fund) and the non- trading services of local government
64
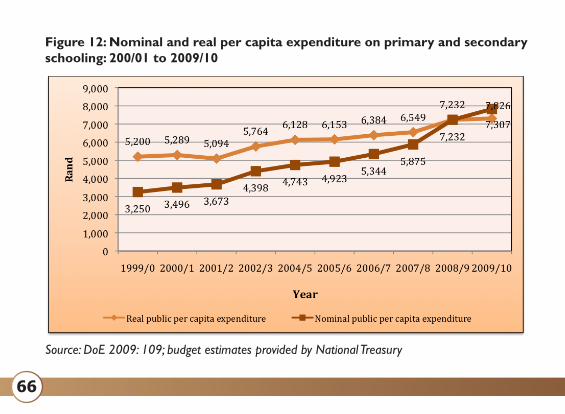
5.3 Per Capita Expenditure on primary and secondary schooling
As shown in figure 12, per capita expenditure in schooling has increased in both nominal12
and real13 terms. In nominal terms, it has increased from R3 250 in 2000/01 to R7 826
in 2009/10. This increase reflects, among others, the introduction and expansion of the school nutrition programme, the introduction of the no-fee policy in 2007/08 as well as the overall reduction in the learner: educator ratio.
There has also been a big increase in the per capita amount, even after adjusting for inflation. Based 2008 prices, per capita expenditure increased by 40%, from R 5 200 in 2000/01 to R7 307 in 2009/10.
12 Thisreferstotheactualsituationatthetimeanddoesnottakeintoaccounttheeffectsofinflation.13 Thistakesintoaccounttheeffectsofinflation
65
South Africa’s per learner expenditure is relatively good by international standards. About US$1,383 is spent for every primary school learner South Africa, against US$167 in Sub-Saharan Africa and US$614 in Latin America. Similarly large differences are seen at the secondary level, where the figures are US$1,726, US$ 376 and US$ 594 for South Africa, Sub-Saharan Africa and Latin America respectively (DBE, 2011b:15)
66
Figure 12: Nominal and real per capita expenditure on primary and secondary schooling: 200/01 to 2009/10
Source: DoE 2009: 109; budget estimates provided by National Treasury
67
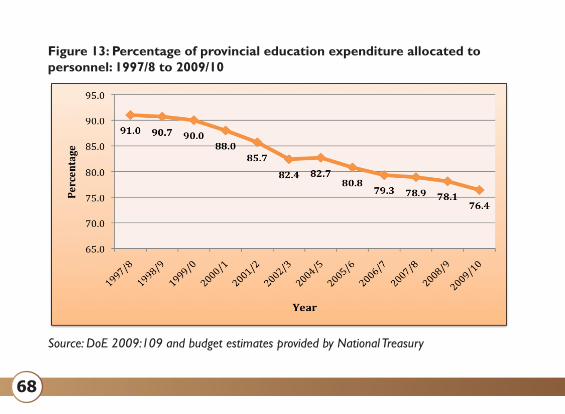
5.4 Percentage of provincial education expenditure on personnel
Teachers – and thus personnel expenditure – are clearly an essential aspect of education, if not the most vital element. Nevertheless, if virtually the full budget is spent on teacher and administrator salaries, delivery of quality education will not be possible. An indicator of the non-personnel “space” in the budget is therefore a useful indicator of funds available for resources such as learning and teaching materials. The National Norms and Standards for School funding 2006 (Republic of South Africa, 2006) puts the desired ratio of personnel to non-personnel expenditure at 80:20.
Figure 13 shows the percentage of provincial expenditure on education personnel (which includes teachers, office staff and other staff in schools). It reveals a steady decrease in the percentage of the combined provincial education budgets allocated to personnel, from 91% in 1998/99 to just over 76% in 2009/10.
As the percentage of the budget allocated to personnel declines, the greater the percentage available to non-personnel items. Consequently, there has been a steady increase in the proportion of the combined provincial education expenditure on non-personnel items. Between 1989/90 and 2009/10 this has more than doubled from 9% to 24%.
68
Figure 13: Percentage of provincial education expenditure allocated to personnel: 1997/8 to 2009/10
Source: DoE 2009:109 and budget estimates provided by National Treasury
69
6. CONCLUSION
This report has provided extensive information on the South African schooling system in the form of selected macro indicators. It focuses on trends over time and identifies areas of progress and of concern in South Africa’s overall education goals of access, efficiency, quality and equity.
Overall, the report has found that the schooling system has achieved significant rates of participation, but low rates of completion owing to repetition and drop-out, especially in the higher grades of the school system. Most importantly, academic achievement, especially in Grades 3 and 6, has not kept pace when compared to the advances made in access to schooling.
The Department has identified interventions required to combat the challenge of poor education quality and through its Action Plan to 2014 as well as the Minister’s Delivery Agreement, is committed to ensuring the delivery of quality education to all learners.
70
REFERENCES
Department of Basic Education. (2010). Analysis and Report on the Annual National Assessments 2009. Final Draft 5 August 2010. Unpublished mimeograph.
Department of Basic Education. (2010a). Action Plan to 2014: Towards the Realisation of Schooling 2025.Government Gazette no. 33434. Government Notice 752 of 2010. 2 August. Pretoria; Government Printer.
Department of Basic Education. (2010b). Report on the National Senior Examination Results, 2009. 7 January 2010.
Department of Basic Education. (2011a). Report on the National Senior Examination Results, 2010. 6 January 2011.
71
Department of Basic Education. (2011b). Action Plan to 2014: Towards the Realisation of Schooling in South Africa. The Full Version. 14 February
Department of Education (undated). What is the Kha Ri Gude Mass Literacy Campaign?
Kha Ri Gude Literacy Campaign South Africa. Retrieved 11 December 2010 from http://www.kharigude.co.za/
Department of Education (DoE). (1998b). Admissions Policy for Ordinary Public Schools. Government Gazette no. 19377. Government Notice 2432 of 1998, Pretoria: Government Printer
Department of Education. (2000). Criteria for the Recognition and Evaluation of Qualifications for Employment in Education Based on the Norms and Standards for Educators 2000. Retrieved 12 November 2008 from http://www.education.gov.za/dynamic/dynamic.aspx?pageid=326&dirid=46
72
Department of Education. (2001). Education White Paper 5 on Early Childhood
Education: Meeting The Challenge Of Early Childhood Development In South Africa. May. Pretoria
Department of Education. (2009a). Trends in Education Macro Indicators Report 2009. Department of Education. Pretoria.
Department of Education. (2009b). 2009 School Realities. September. Pretoria.
Department of Education. (2010a). Education Statistics in South Africa in 2008. March. Pretoria.
Department of Education. (2010b). Department of Education Annual Report 2009/10. May. Pretoria: Department of Education.
73
De Souza, C. (2003). Senior Certificate Exams 2002: Plausible Progress or Passes Below Par? EduSource Data News No39/May, Houghton: Education Foundation.
Fleisch, B. Shindler, J, and Perry, H. (2010). Who is out of school? Evidence from the Community Survey 2007, South Africa. International Journal of Educational Development. doi:10.1016/j.ijedudev.2010.05.002
Makuwa, D. (2010). What are the levels and trends in reading and Mathematics achievement? SACMEQ Policy issue series, Number 2 September 2010. Paris: SACMEQ. Retrieved 2 December 2010 from http://www.sacmeq.org/downloads/policy/002-SACMEQPolicyIssuesSeries-Pupilachievement.pdf.
National Treasury. (2010). Budget Review 2010. Pretoria.
74
Republic of South Africa (RSA). (1996). South African Schools Act, Act 84 of 1996. Pretoria: Government Printing Works
Republic of South Africa (RSA). (2002). Education Laws Amendment Act, No 50 of 2002. Government Gazette No. 24113. 28 November. Cape Town
Republic of South Africa. (2006). Amended National Norms and Standards for School Funding. Government Notice no. 869. Government Gazette no. 29179. 31 August 2006
Republic of South Africa. (2009). Together Doing More and Better: Medium Term Strategic Framework, A Framework to Guide Government’s Programme in The Electoral Mandate Period (2009 – 2014). Issued by the Minister in the Presidency: Planning. July
75
Social Surveys Africa and Centre for Applied Legal Studies (CALS). (2009). Access to Education: Technical Report of the National Household Survey. December 2009, Johannesburg.
Statistics South Africa. (2009). General Household Survey 2002-2009. Interactive Database.
Strassburg, S., Meny-Gibert, S, and Russel, B. (2010). Left Unfinished: Temporary Absence and Drop-out from South African Schools. Findings from the Access to Education Study 2. November. Social Surveys Africa and Centre for Applied Legal Studies.
UNESCO. (2010). EFA Global Monitoring Report 2010. Reaching the Marginalized. UNESCO Publishing. Paris
Department of Basic Education
Sol Plaatje House, 222 Struben Street, Pretoria, South Africa
Private Bag X895, Pretoria, 0001
Tel: 012 357 3000 Fax: 012 323 6260/0601
www.education.gov.za