Embed Size (px)
Citation preview
1
Macroeconomic Analysis
Elissaios Papyrakis and Luca Tasciotti
Nairobi, 20 July 2017
STDF/PG/460 Final meeting, Kephis, Nairobi, Kenya. Contact Luca Tasciotti at [email protected] for more information.
2
Outline
• Objectives of macroeconomic analysis
• Methodology
• Main results and policy implications.
3
Objectives
• The purpose of the macroeconomic analysis is to estimate changes in trade volumes (exports/imports) during the pre and post ISPM 15 implementation periods across multiple commodity sectors.
• The sign and magnitude of the effect will be the focus of our empirical analysis.
4
Macro: Methodology
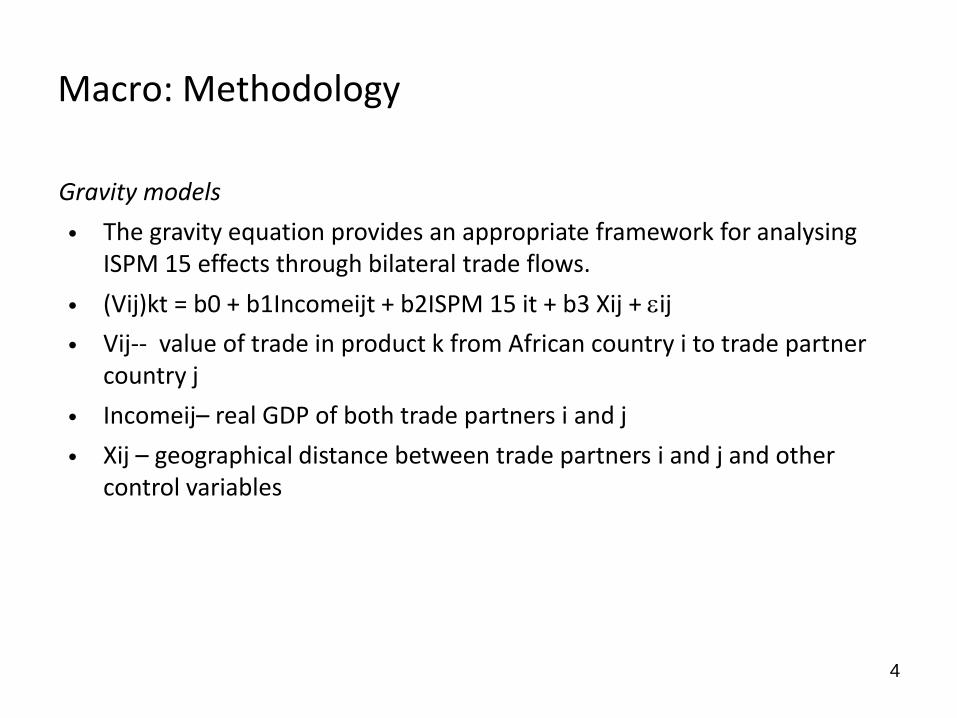
Gravity models
• The gravity equation provides an appropriate framework for analysing ISPM 15 effects through bilateral trade flows.
• (Vij)kt = b0 + b1Incomeijt + b2ISPM 15 it + b3 Xij + ij
• Vij-- value of trade in product k from African country i to trade partner country j
• Incomeij– real GDP of both trade partners i and j
• Xij – geographical distance between trade partners i and j and other control variables
5
Macro: Methodology
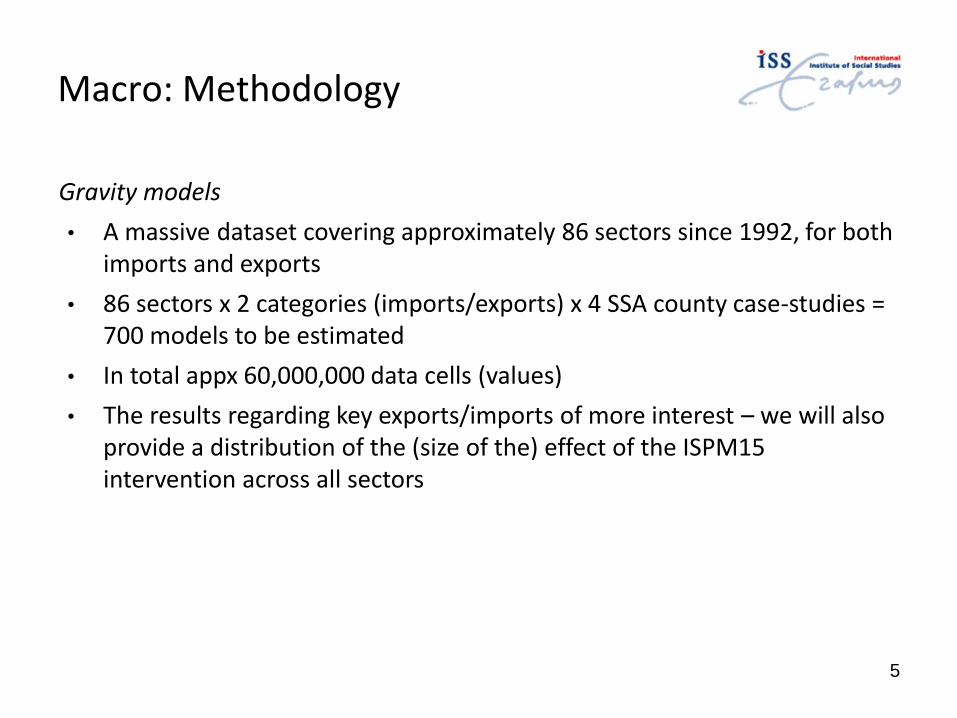
Gravity models
• A massive dataset covering approximately 86 sectors since 1992, for both imports and exports
• 86 sectors x 2 categories (imports/exports) x 4 SSA county case-studies = 700 models to be estimated
• In total appx 60,000,000 data cells (values)
• The results regarding key exports/imports of more interest – we will also provide a distribution of the (size of the) effect of the ISPM15 intervention across all sectors
6
Macro: Methodology
• Gravity models
A massive dataset covering approximately 120 sectors since 1992, for both imports and exports
125 sectors x 2 categories (imports/exports) x 4 SSA county case-studies = 1000 models to be estimated
The results regarding key exports/imports possibly more important – we will also provide a distribution of the (size of the) effect of the ISPM15 intervention across all sectors
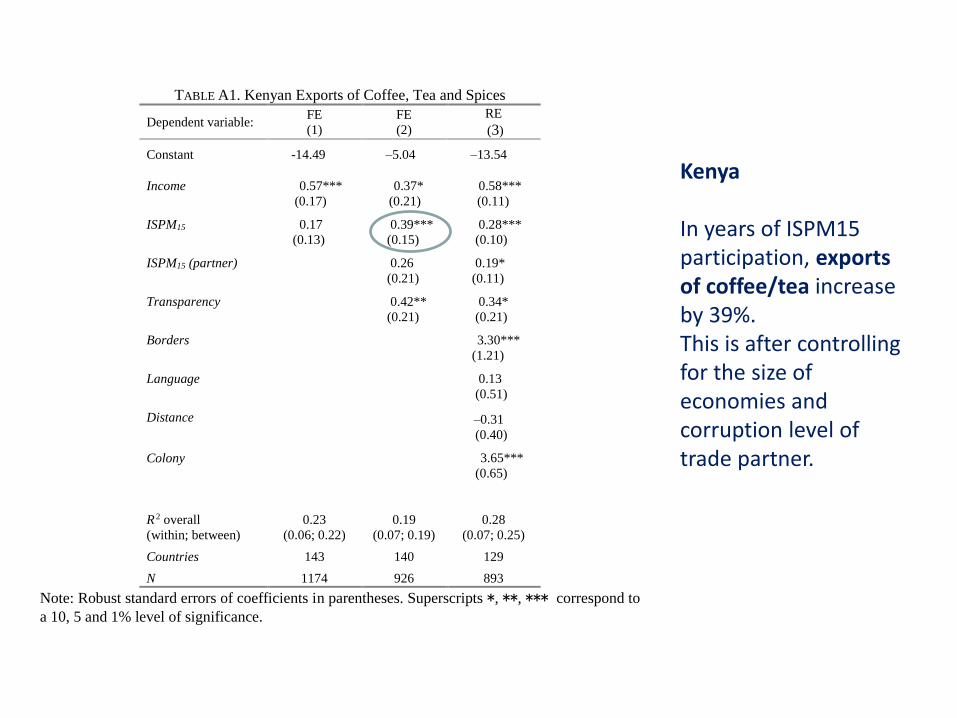
TABLE A1. Kenyan Exports of Coffee, Tea and Spices
Dependent variable: FE
(1)
FE
(2)
RE
(3)
Constant -14.49 –5.04 –13.54
Income
0.57***
(0.17)
0.37*
(0.21)
0.58***
(0.11)
ISPM15
0.17
(0.13)
0.39***
(0.15)
0.28***
(0.10)
ISPM15 (partner)
0.26
(0.21)
0.19*
(0.11)
Transparency
0.42**
(0.21)
0.34*
(0.21)
Borders
3.30***
(1.21)
Language
0.13
(0.51)
Distance
–0.31
(0.40)
Colony
3.65***
(0.65)
R 2 overall
(within; between)
0.23
(0.06; 0.22)
0.19
(0.07; 0.19)
0.28
(0.07; 0.25)
Countries 143 140 129
N 1174 926 893
Note: Robust standard errors of coefficients in parentheses. Superscripts *, **, *** correspond to
a 10, 5 and 1% level of significance.
Kenya
In years of ISPM15 participation, exports of coffee/tea increase by 39%.This is after controlling for the size of economies and corruption level of trade partner.
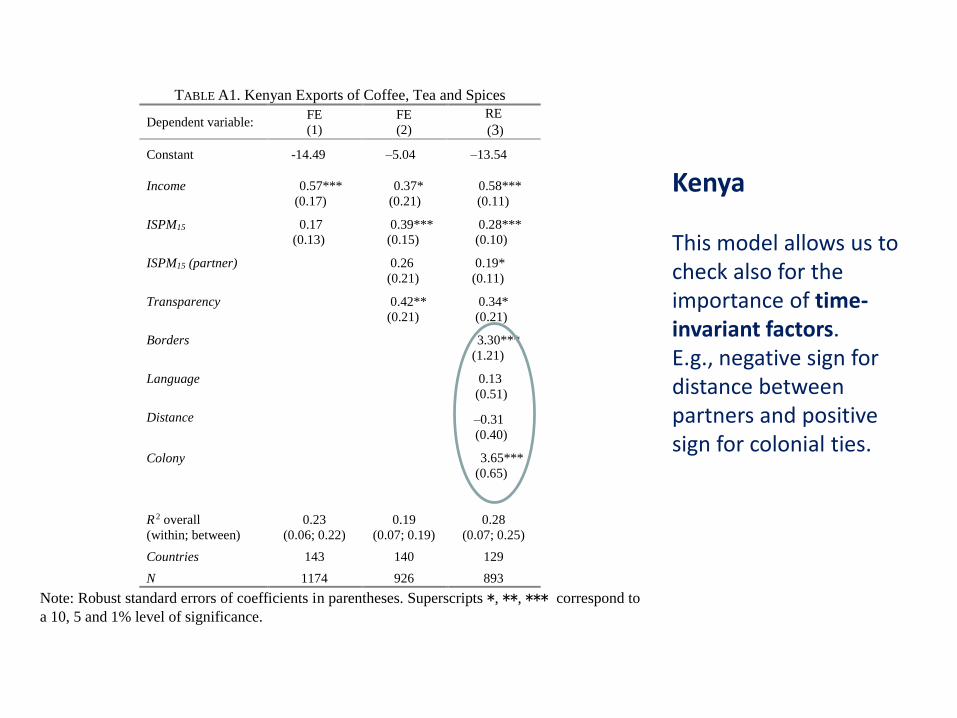
TABLE A1. Kenyan Exports of Coffee, Tea and Spices
Dependent variable: FE
(1)
FE
(2)
RE
(3)
Constant -14.49 –5.04 –13.54
Income
0.57***
(0.17)
0.37*
(0.21)
0.58***
(0.11)
ISPM15
0.17
(0.13)
0.39***
(0.15)
0.28***
(0.10)
ISPM15 (partner)
0.26
(0.21)
0.19*
(0.11)
Transparency
0.42**
(0.21)
0.34*
(0.21)
Borders
3.30***
(1.21)
Language
0.13
(0.51)
Distance
–0.31
(0.40)
Colony
3.65***
(0.65)
R 2 overall
(within; between)
0.23
(0.06; 0.22)
0.19
(0.07; 0.19)
0.28
(0.07; 0.25)
Countries 143 140 129
N 1174 926 893
Note: Robust standard errors of coefficients in parentheses. Superscripts *, **, *** correspond to
a 10, 5 and 1% level of significance.
Kenya
This model allows us to check also for the importance of time-invariant factors. E.g., negative sign for distance between partners and positive sign for colonial ties.
9
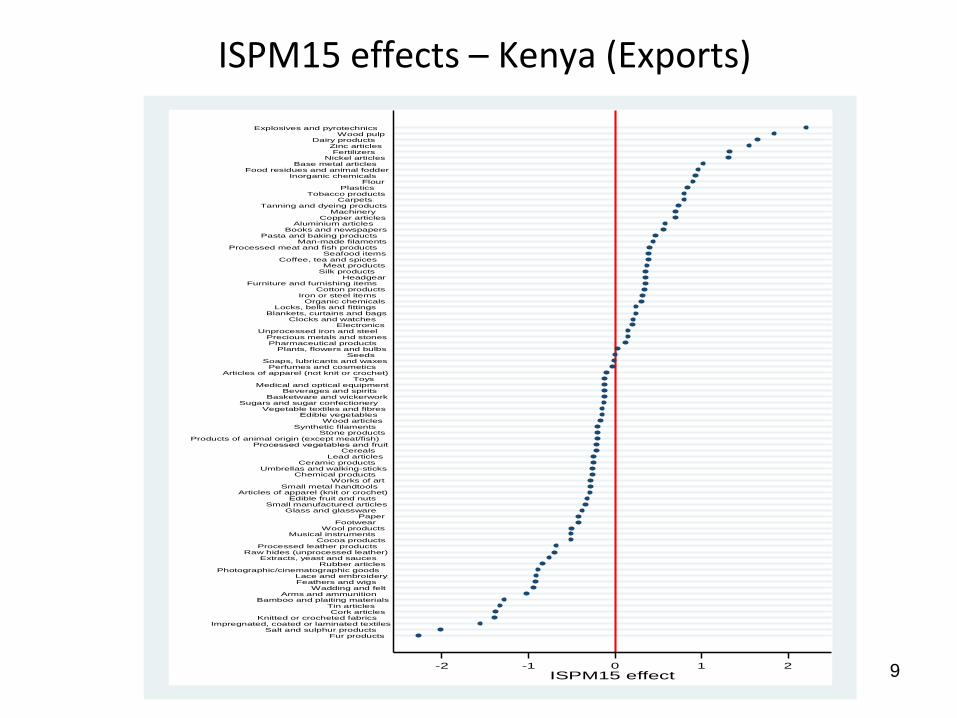
ISPM15 effects – Kenya (Exports)
-2 -1 0 1 2
ISPM15 effect
Fur productsSalt and sulphur products
Impregnated, coated or laminated textilesKnitted or crocheted fabrics
Cork articlesTin articles
Bamboo and plaiting materialsArms and ammunition
Wadding and feltFeathers and wigsLace and embroidery
Photographic/cinematographic goodsRubber articles
Extracts, yeast and saucesRaw hides (unprocessed leather)
Processed leather productsCocoa products
Musical instrumentsWool products
FootwearPaper
Glass and glasswareSmall manufactured articles
Edible fruit and nutsArticles of apparel (knit or crochet)
Small metal handtoolsWorks of art
Chemical productsUmbrellas and walking-sticks
Ceramic productsLead articles
Cereals Processed vegetables and fruit
Products of animal origin (except meat/fish)Stone products
Synthetic filamentsWood articles
Edible vegetablesVegetable textiles and fibres
Sugars and sugar confectioneryBasketware and wickerwork
Beverages and spiritsMedical and optical equipment
ToysArticles of apparel (not knit or crochet)
Perfumes and cosmeticsSoaps, lubricants and waxes
SeedsPlants, flowers and bulbs
Pharmaceutical productsPrecious metals and stones
Unprocessed iron and steelElectronics
Clocks and watchesBlankets, curtains and bags
Locks, bells and fittingsOrganic chemicals
Iron or steel itemsCotton products
Furniture and furnishing itemsHeadgear
Silk productsMeat products
Coffee, tea and spicesSeafood items
Processed meat and fish productsMan-made filaments
Pasta and baking productsBooks and newspapers
Aluminium articles Copper articles
MachineryTanning and dyeing products
Carpets Tobacco products
PlasticsFlour
Inorganic chemicalsFood residues and animal fodder
Base metal articlesNickel articles
FertilizersZinc articles
Dairy productsWood pulp
Explosives and pyrotechnics
10
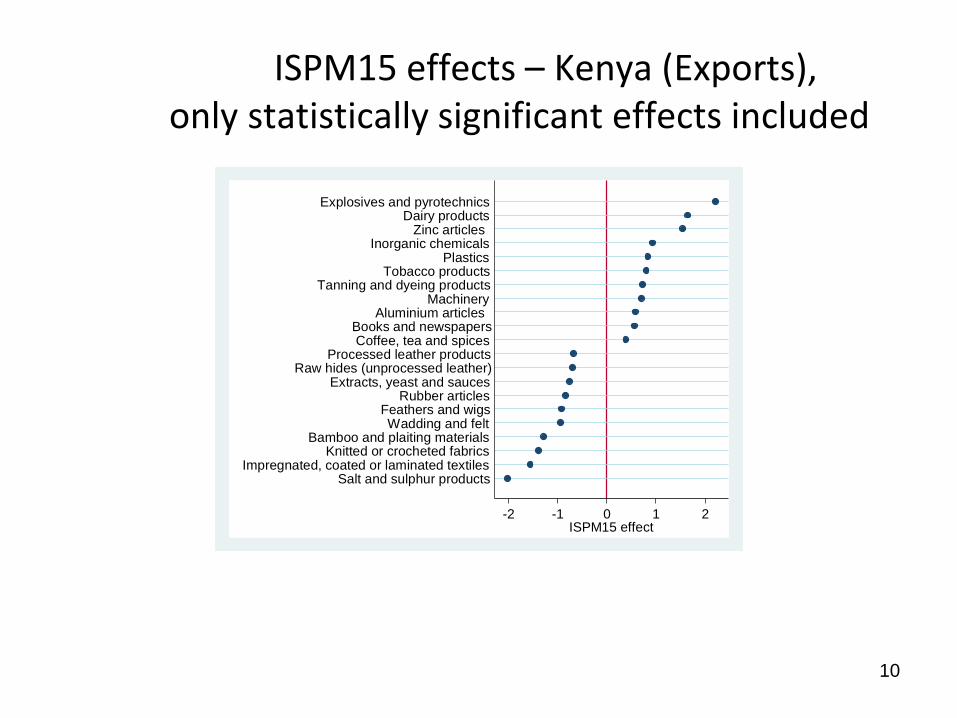
ISPM15 effects – Kenya (Exports), only statistically significant effects included
-2 -1 0 1 2ISPM15 effect
Salt and sulphur productsImpregnated, coated or laminated textiles
Knitted or crocheted fabricsBamboo and plaiting materials
Wadding and feltFeathers and wigs
Rubber articlesExtracts, yeast and sauces
Raw hides (unprocessed leather)Processed leather products
Coffee, tea and spicesBooks and newspapers
Aluminium articles Machinery
Tanning and dyeing productsTobacco products
PlasticsInorganic chemicals
Zinc articles Dairy products
Explosives and pyrotechnics
11
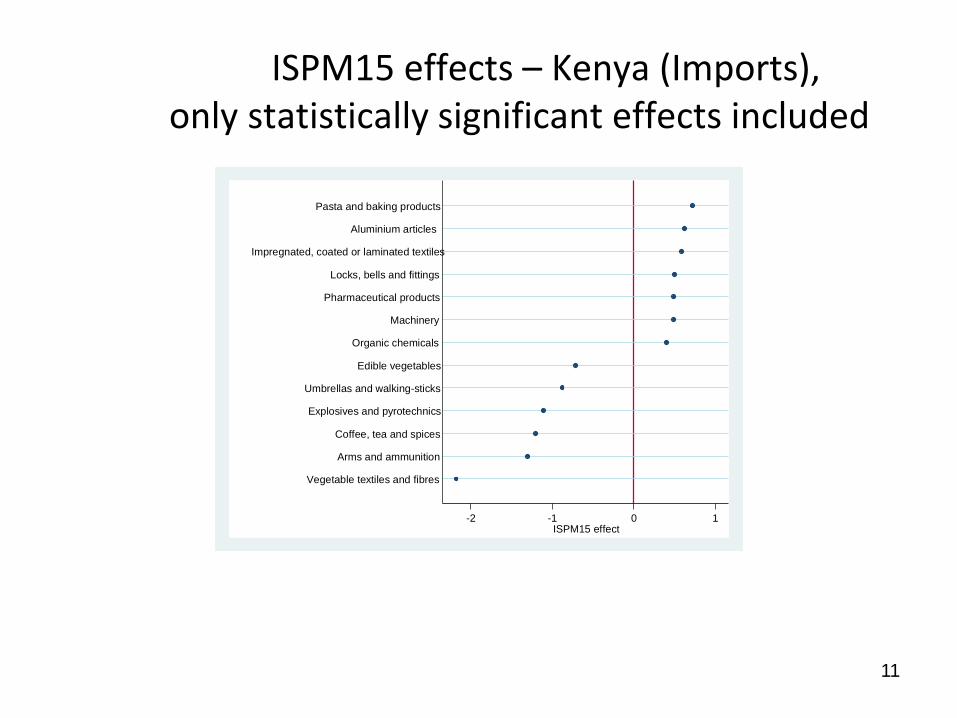
ISPM15 effects – Kenya (Imports), only statistically significant effects included
-2 -1 0 1ISPM15 effect
Vegetable textiles and fibres
Arms and ammunition
Coffee, tea and spices
Explosives and pyrotechnics
Umbrellas and walking-sticks
Edible vegetables
Organic chemicals
Machinery
Pharmaceutical products
Locks, bells and fittings
Impregnated, coated or laminated textiles
Aluminium articles
Pasta and baking products
12
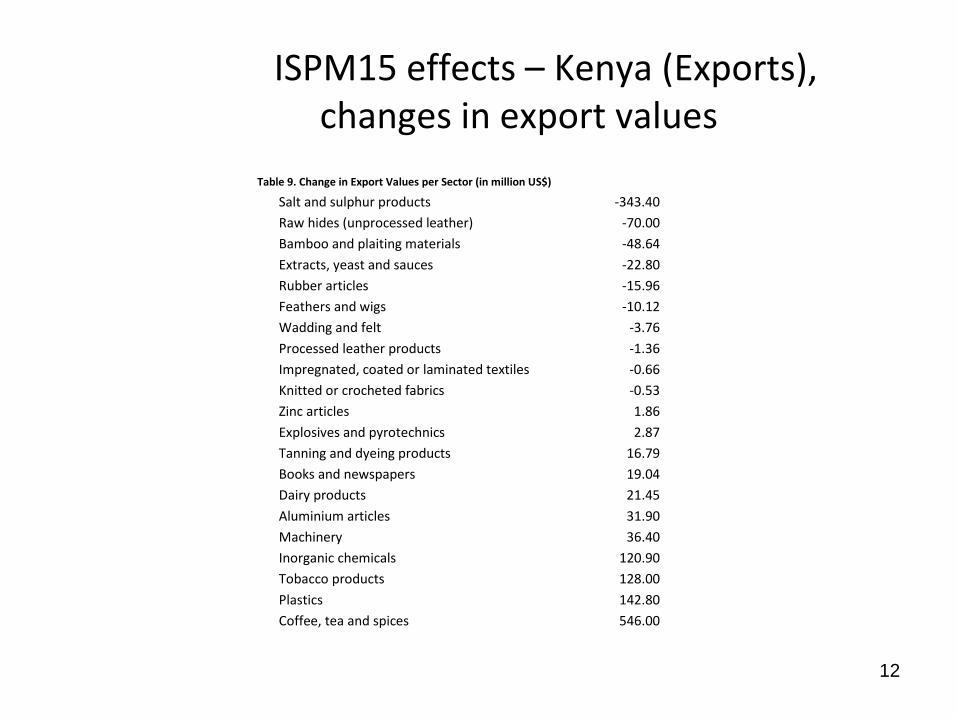
ISPM15 effects – Kenya (Exports), changes in export values
Table 9. Change in Export Values per Sector (in million US$)
Salt and sulphur products -343.40
Raw hides (unprocessed leather) -70.00
Bamboo and plaiting materials -48.64
Extracts, yeast and sauces -22.80
Rubber articles -15.96
Feathers and wigs -10.12
Wadding and felt -3.76
Processed leather products -1.36
Impregnated, coated or laminated textiles -0.66
Knitted or crocheted fabrics -0.53
Zinc articles 1.86
Explosives and pyrotechnics 2.87
Tanning and dyeing products 16.79
Books and newspapers 19.04
Dairy products 21.45
Aluminium articles 31.90
Machinery 36.40
Inorganic chemicals 120.90
Tobacco products 128.00
Plastics 142.80
Coffee, tea and spices 546.00
13
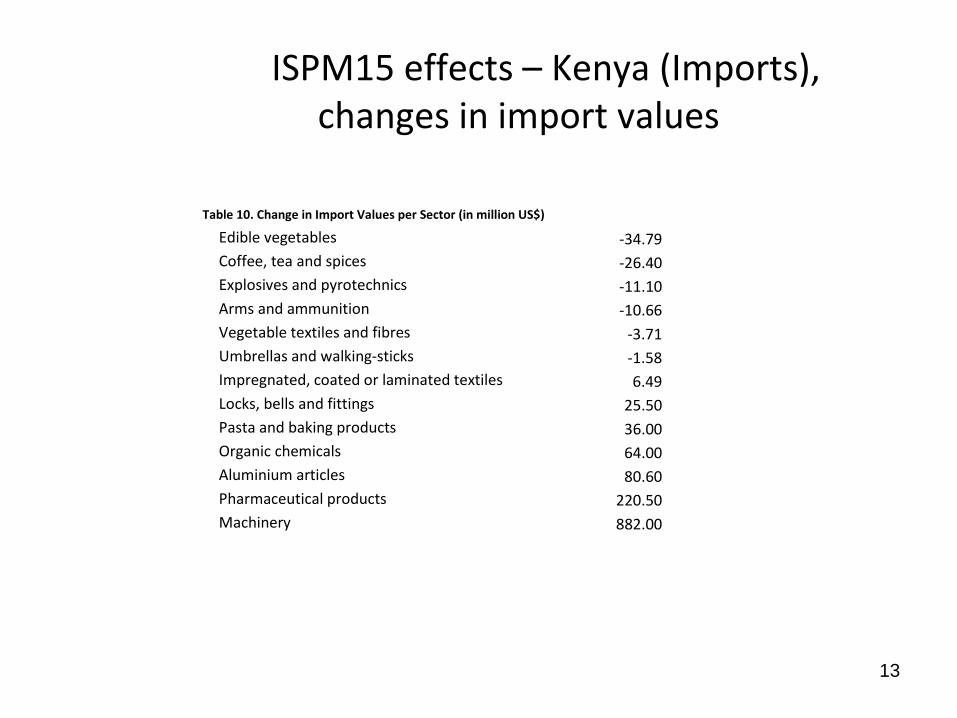
ISPM15 effects – Kenya (Imports), changes in import values
Table 10. Change in Import Values per Sector (in million US$)
Edible vegetables -34.79
Coffee, tea and spices -26.40
Explosives and pyrotechnics -11.10
Arms and ammunition -10.66
Vegetable textiles and fibres -3.71
Umbrellas and walking-sticks -1.58
Impregnated, coated or laminated textiles 6.49
Locks, bells and fittings 25.50
Pasta and baking products 36.00
Organic chemicals 64.00
Aluminium articles 80.60
Pharmaceutical products 220.50
Machinery 882.00
14
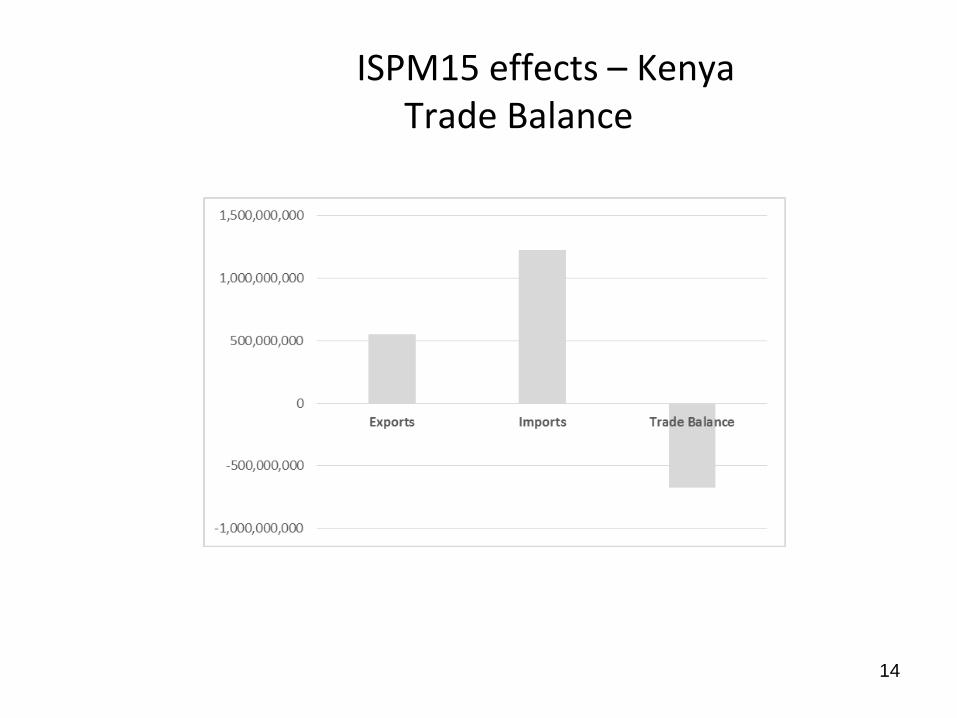
ISPM15 effects – Kenya Trade Balance
15
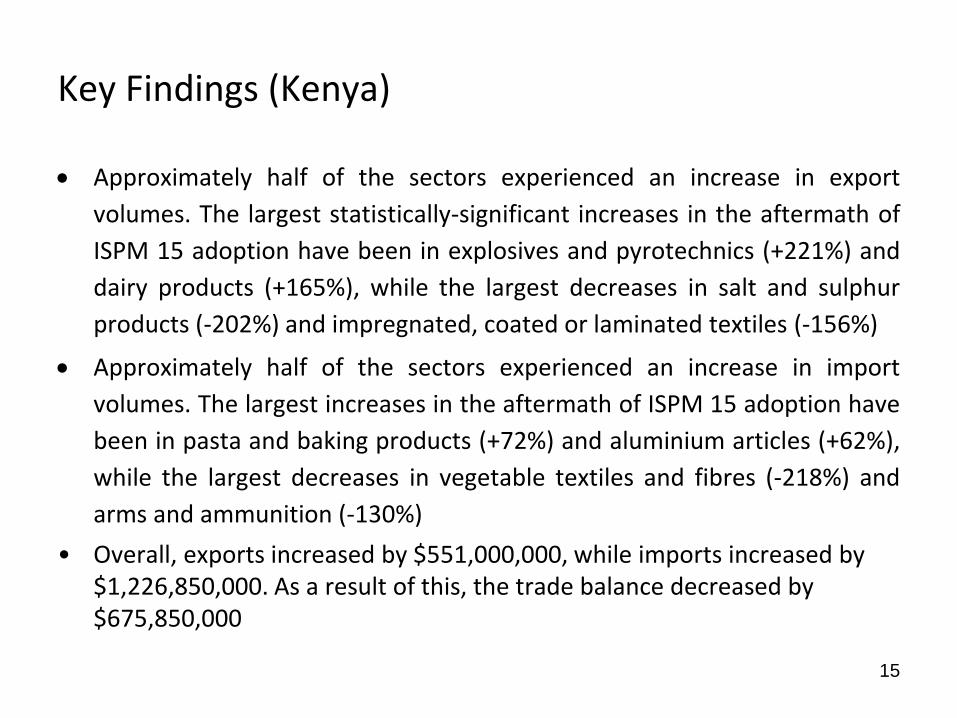
Key Findings (Kenya)
Approximately half of the sectors experienced an increase in export
volumes. The largest statistically-significant increases in the aftermath of
ISPM 15 adoption have been in explosives and pyrotechnics (+221%) and
dairy products (+165%), while the largest decreases in salt and sulphur
products (-202%) and impregnated, coated or laminated textiles (-156%)
Approximately half of the sectors experienced an increase in import
volumes. The largest increases in the aftermath of ISPM 15 adoption have
been in pasta and baking products (+72%) and aluminium articles (+62%),
while the largest decreases in vegetable textiles and fibres (-218%) and
arms and ammunition (-130%)
• Overall, exports increased by $551,000,000, while imports increased by $1,226,850,000. As a result of this, the trade balance decreased by $675,850,000
16
Policy Implications (Kenya)
• Given the unequal distribution of effects across sectors, the Kenyan
authorities need to pay attention to those sectors that experienced an
economic contraction in the aftermath of the ISPM 15 implementation
• In Kenya, the ISPM 15 adoption appears to be associated with an overall
increase in both exports and imports. Overall, exports increased by
$551,000,000, while imports increased by much more $1,226,850,000. As
a result of this, the trade balance decreased by $675,850,000. This is an
issue of concern, given that Kenya has been running an overall trade
deficit in the last 5 years.
17
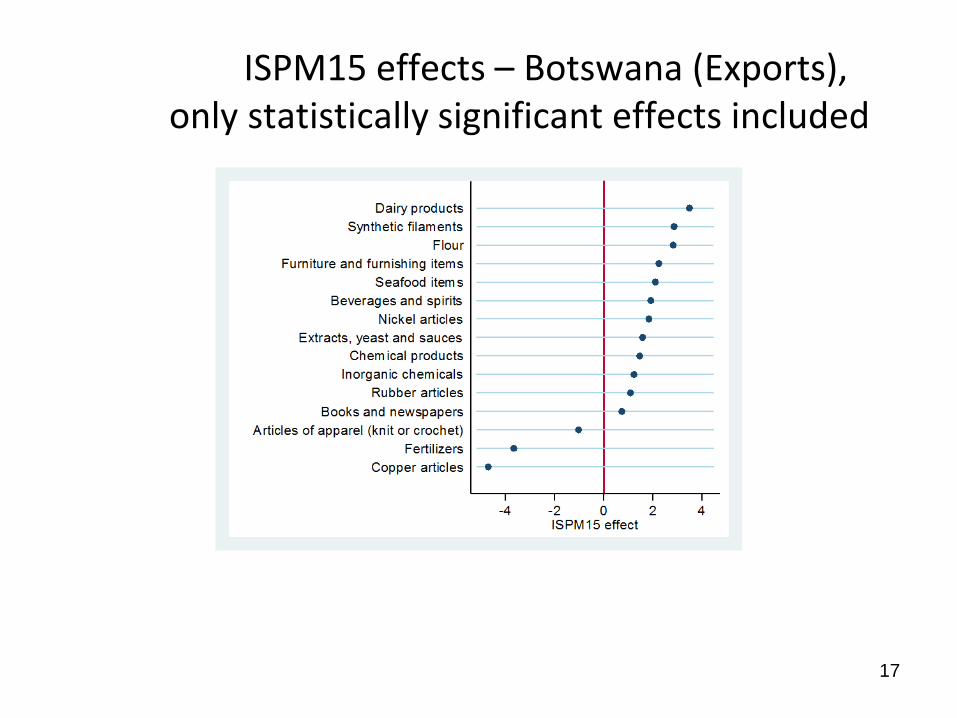
ISPM15 effects – Botswana (Exports), only statistically significant effects included
18
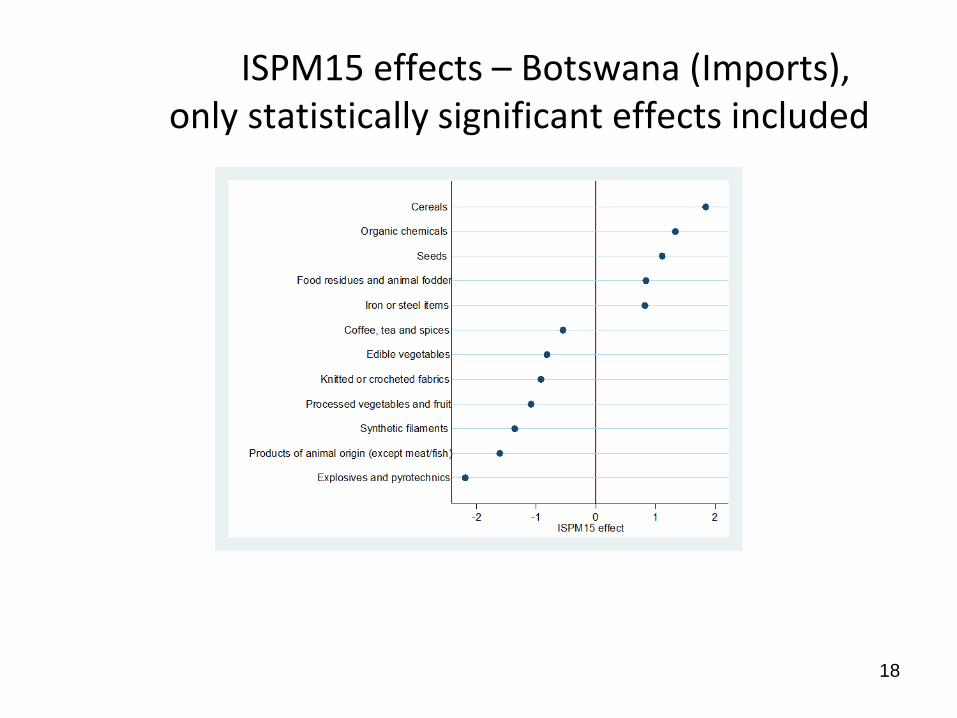
ISPM15 effects – Botswana (Imports), only statistically significant effects included
19
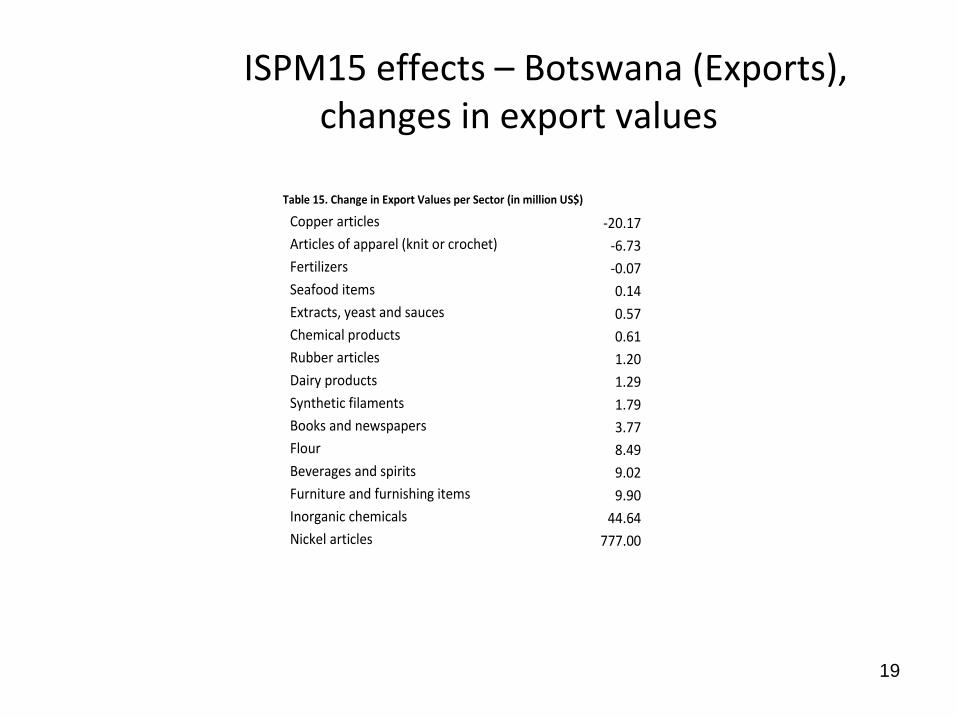
ISPM15 effects – Botswana (Exports), changes in export values
Table 15. Change in Export Values per Sector (in million US$)
Copper articles -20.17
Articles of apparel (knit or crochet) -6.73
Fertilizers -0.07
Seafood items 0.14
Extracts, yeast and sauces 0.57
Chemical products 0.61
Rubber articles 1.20
Dairy products 1.29
Synthetic filaments 1.79
Books and newspapers 3.77
Flour 8.49
Beverages and spirits 9.02
Furniture and furnishing items 9.90
Inorganic chemicals 44.64
Nickel articles 777.00
20
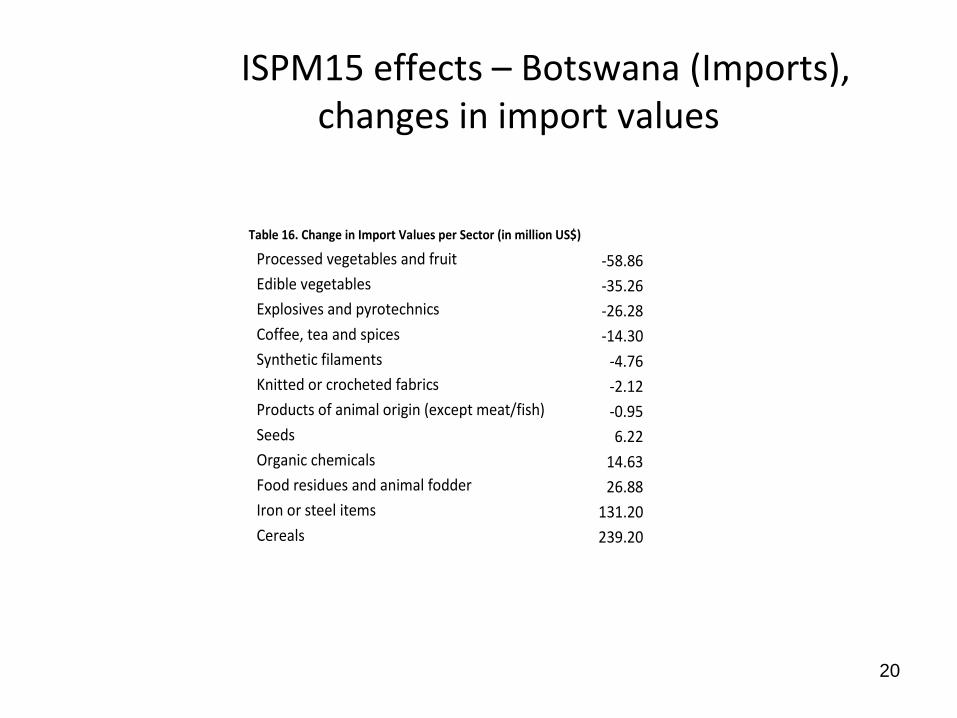
ISPM15 effects – Botswana (Imports), changes in import values
Table 16. Change in Import Values per Sector (in million US$)
Processed vegetables and fruit -58.86
Edible vegetables -35.26
Explosives and pyrotechnics -26.28
Coffee, tea and spices -14.30
Synthetic filaments -4.76
Knitted or crocheted fabrics -2.12
Products of animal origin (except meat/fish) -0.95
Seeds 6.22
Organic chemicals 14.63
Food residues and animal fodder 26.88
Iron or steel items 131.20
Cereals 239.20
21
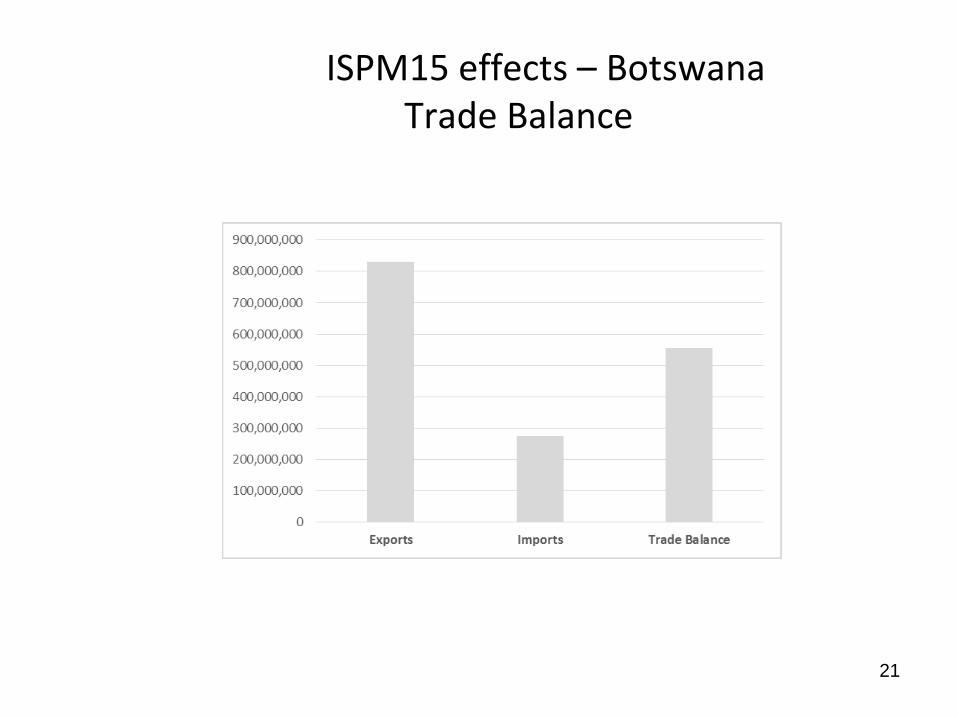
ISPM15 effects – Botswana Trade Balance
22
Key Findings (Botswana)
The vast majority of sectors experienced an increase in export volumes.
The largest increases in the aftermath of ISPM 15 adoption have been in
dairy products (+349%) and synthetic filaments (+287%), while the largest
decreases in copper articles (-469%) and fertilizers (-366%). The decrease
in the value of exports of copper articles could have also been facilitated
by the fluctuations in copper prices in global markets.
Approximately half of the sectors experienced an increase in import
volumes. The largest increases in the aftermath of ISPM 15 adoption have
been in cereals (+184%) and organic chemicals (+133%), while the largest
decreases in explosives and pyrotechnics (-219%) and products of animal
origin (-161%).
Overall, exports increased by $831,457,000, while imports increased by
$275,596,000. As a result of this, the trade balance improved by
$555,861,000
23
Policy Implications (Botswana)
• Given the unequal distribution of effects across sectors, the authorities
need to pay attention to those sectors that experienced an economic
contraction in the aftermath of the ISPM 15 implementation
• In Botswana, the ISPM 15 adoption appears to be associated with an
overall increase in both exports and imports. Overall, exports increased by
$831,457,000, while imports increased by less, namely $275,596,000. As a
result of this, the trade balance improved by $555,861,000. This is quite
encouraging, given that Botswana has been running an overall trade
deficit until recently (2015).
24
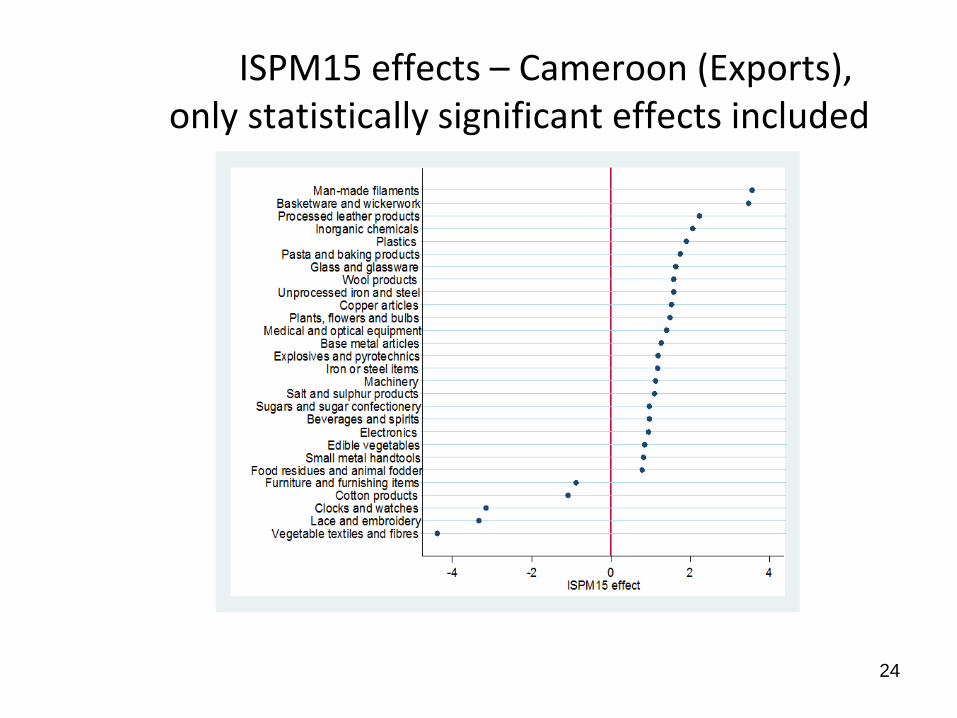
ISPM15 effects – Cameroon (Exports), only statistically significant effects included
25
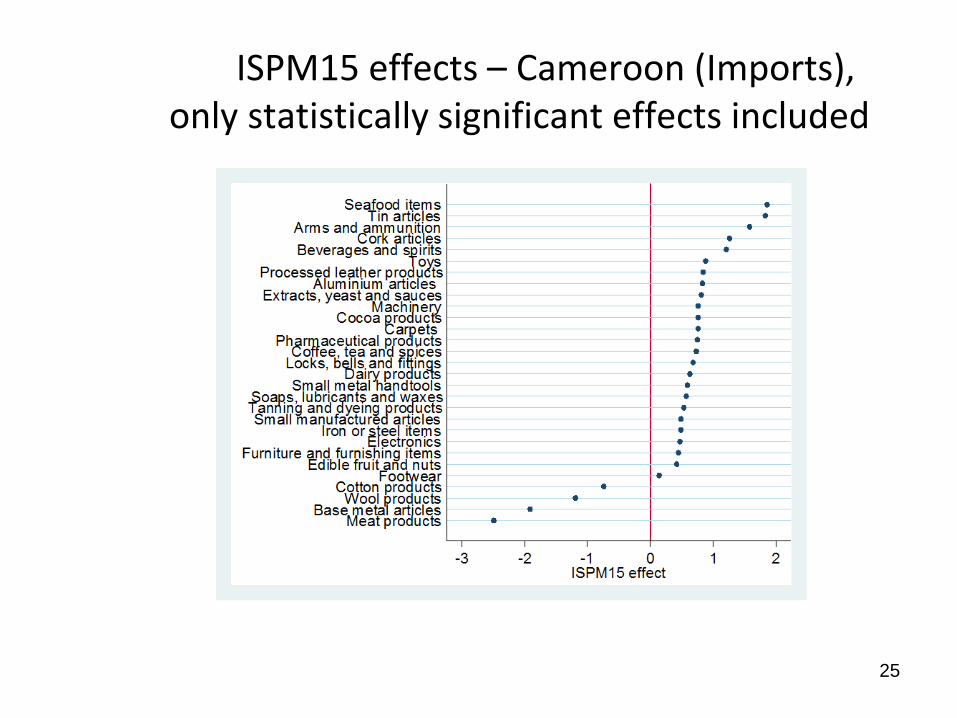
ISPM15 effects – Cameroon (Imports), only statistically significant effects included
26
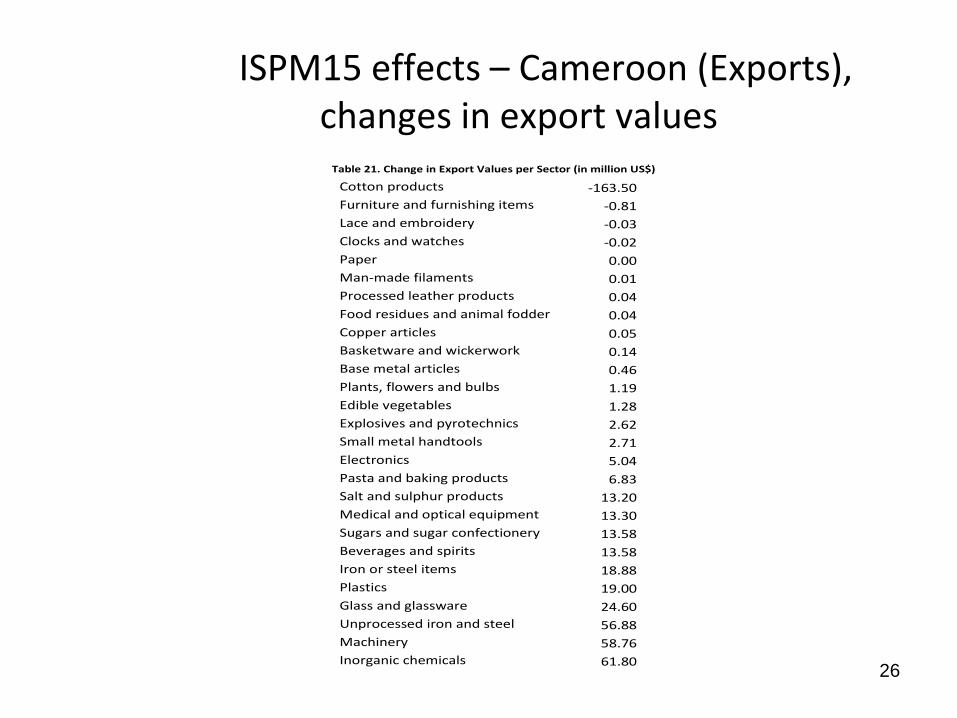
ISPM15 effects – Cameroon (Exports), changes in export values
Table 21. Change in Export Values per Sector (in million US$)
Cotton products -163.50
Furniture and furnishing items -0.81
Lace and embroidery -0.03
Clocks and watches -0.02
Paper 0.00
Man-made filaments 0.01
Processed leather products 0.04
Food residues and animal fodder 0.04
Copper articles 0.05
Basketware and wickerwork 0.14
Base metal articles 0.46
Plants, flowers and bulbs 1.19
Edible vegetables 1.28
Explosives and pyrotechnics 2.62
Small metal handtools 2.71
Electronics 5.04
Pasta and baking products 6.83
Salt and sulphur products 13.20
Medical and optical equipment 13.30
Sugars and sugar confectionery 13.58
Beverages and spirits 13.58
Iron or steel items 18.88
Plastics 19.00
Glass and glassware 24.60
Unprocessed iron and steel 56.88
Machinery 58.76
Inorganic chemicals 61.80
27
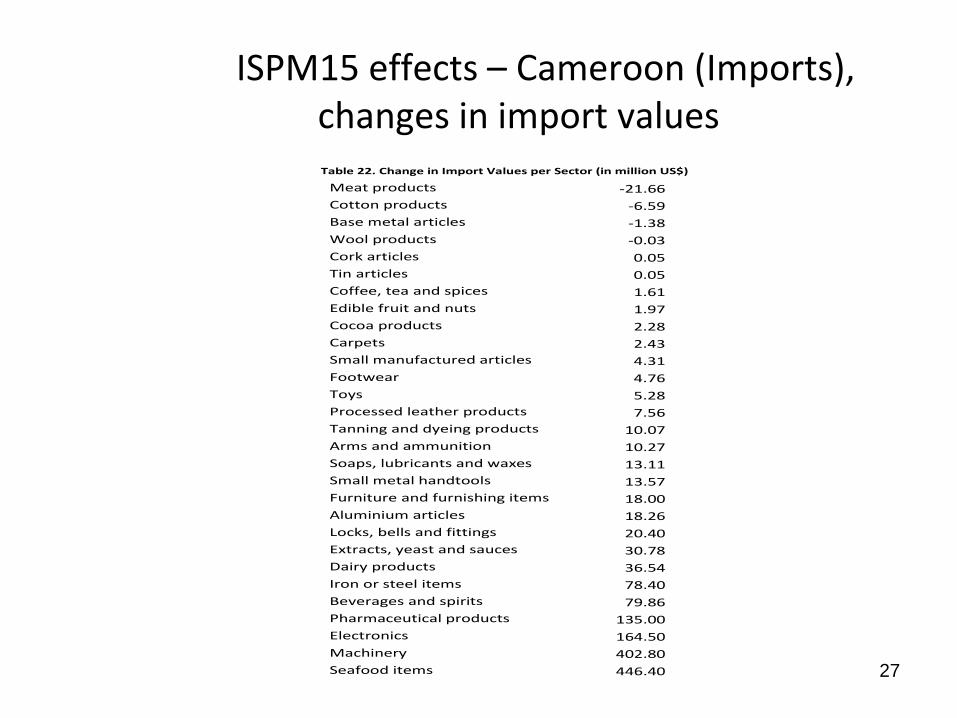
ISPM15 effects – Cameroon (Imports), changes in import valuesTable 22. Change in Import Values per Sector (in million US$)
Meat products -21.66
Cotton products -6.59
Base metal articles -1.38
Wool products -0.03
Cork articles 0.05
Tin articles 0.05
Coffee, tea and spices 1.61
Edible fruit and nuts 1.97
Cocoa products 2.28
Carpets 2.43
Small manufactured articles 4.31
Footwear 4.76
Toys 5.28
Processed leather products 7.56
Tanning and dyeing products 10.07
Arms and ammunition 10.27
Soaps, lubricants and waxes 13.11
Small metal handtools 13.57
Furniture and furnishing items 18.00
Aluminium articles 18.26
Locks, bells and fittings 20.40
Extracts, yeast and sauces 30.78
Dairy products 36.54
Iron or steel items 78.40
Beverages and spirits 79.86
Pharmaceutical products 135.00
Electronics 164.50
Machinery 402.80
Seafood items 446.40
28
ISPM15 effects – CameroonTrade Balance
29
Key Findings (Cameroon)
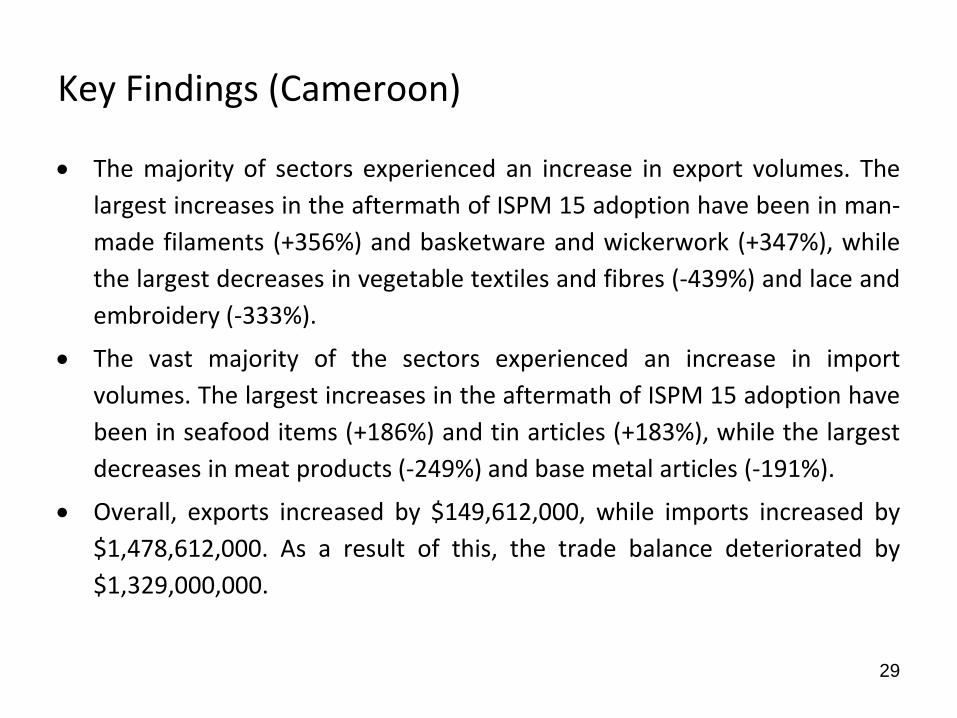
The majority of sectors experienced an increase in export volumes. The
largest increases in the aftermath of ISPM 15 adoption have been in man-
made filaments (+356%) and basketware and wickerwork (+347%), while
the largest decreases in vegetable textiles and fibres (-439%) and lace and
embroidery (-333%).
The vast majority of the sectors experienced an increase in import
volumes. The largest increases in the aftermath of ISPM 15 adoption have
been in seafood items (+186%) and tin articles (+183%), while the largest
decreases in meat products (-249%) and base metal articles (-191%).
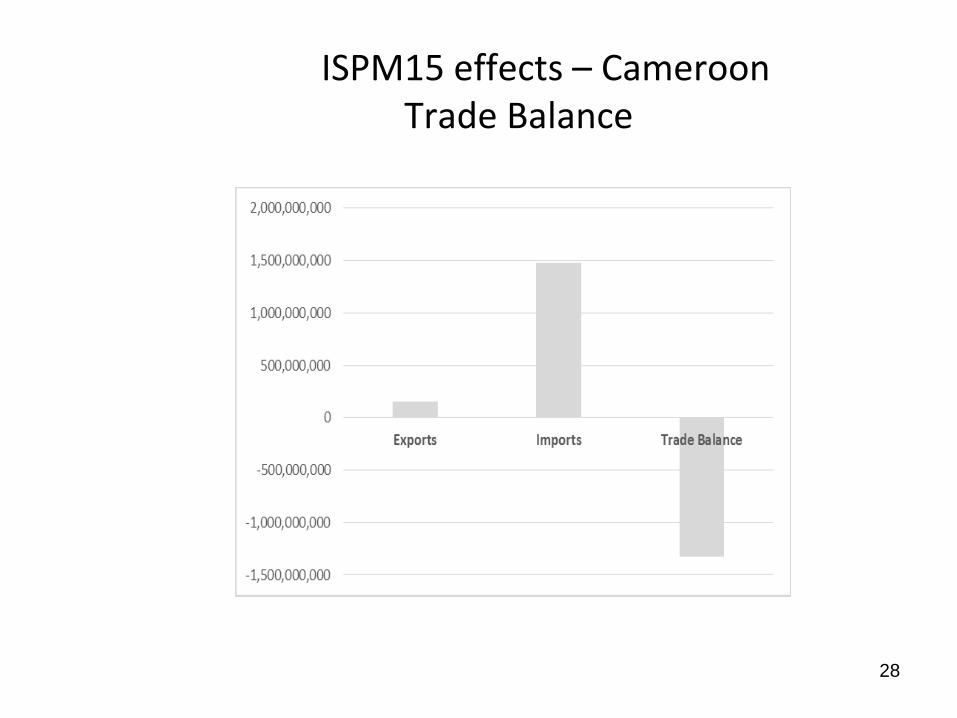
Overall, exports increased by $149,612,000, while imports increased by
$1,478,612,000. As a result of this, the trade balance deteriorated by
$1,329,000,000.
30
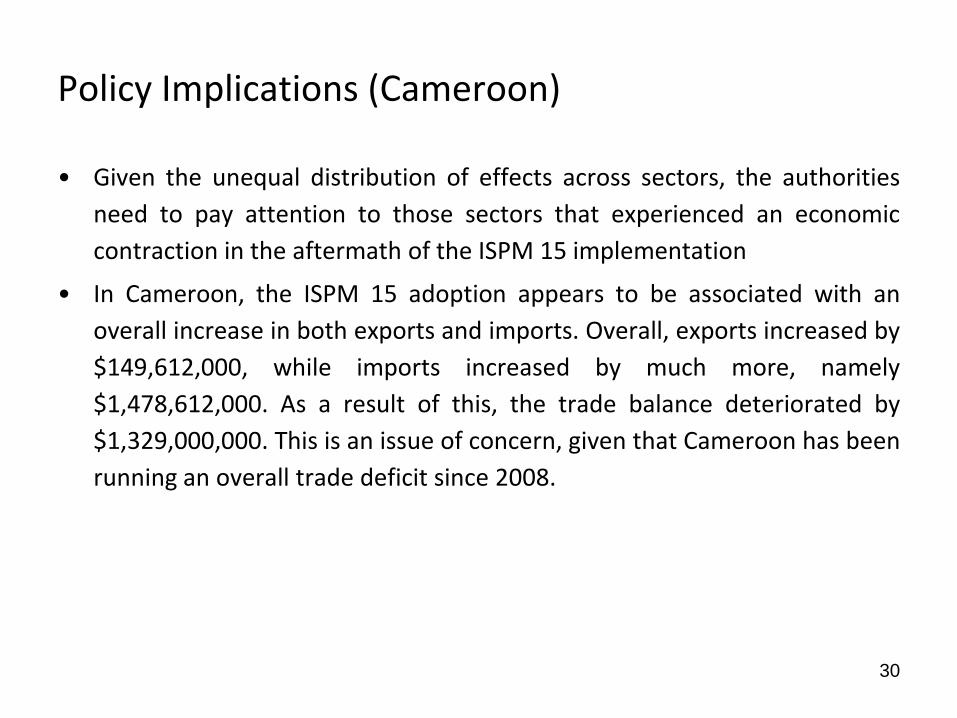
Policy Implications (Cameroon)
• Given the unequal distribution of effects across sectors, the authorities
need to pay attention to those sectors that experienced an economic
contraction in the aftermath of the ISPM 15 implementation
• In Cameroon, the ISPM 15 adoption appears to be associated with an
overall increase in both exports and imports. Overall, exports increased by
$149,612,000, while imports increased by much more, namely
$1,478,612,000. As a result of this, the trade balance deteriorated by
$1,329,000,000. This is an issue of concern, given that Cameroon has been
running an overall trade deficit since 2008.
31
ISPM15 effects – Mozambique (Exports), only statistically significant effects included
32
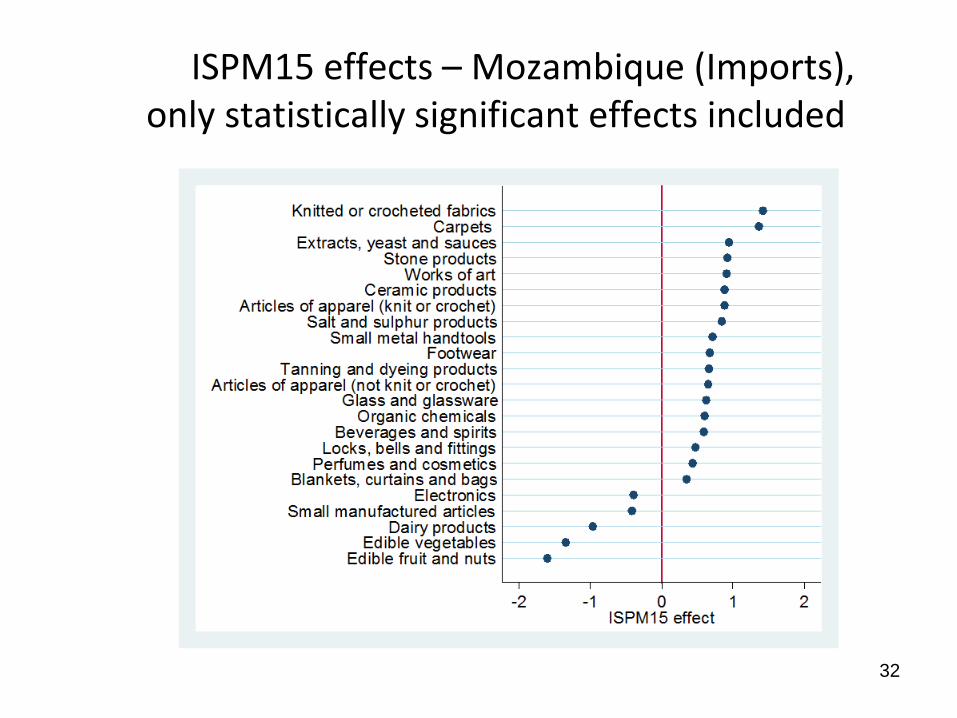
ISPM15 effects – Mozambique (Imports), only statistically significant effects included
33
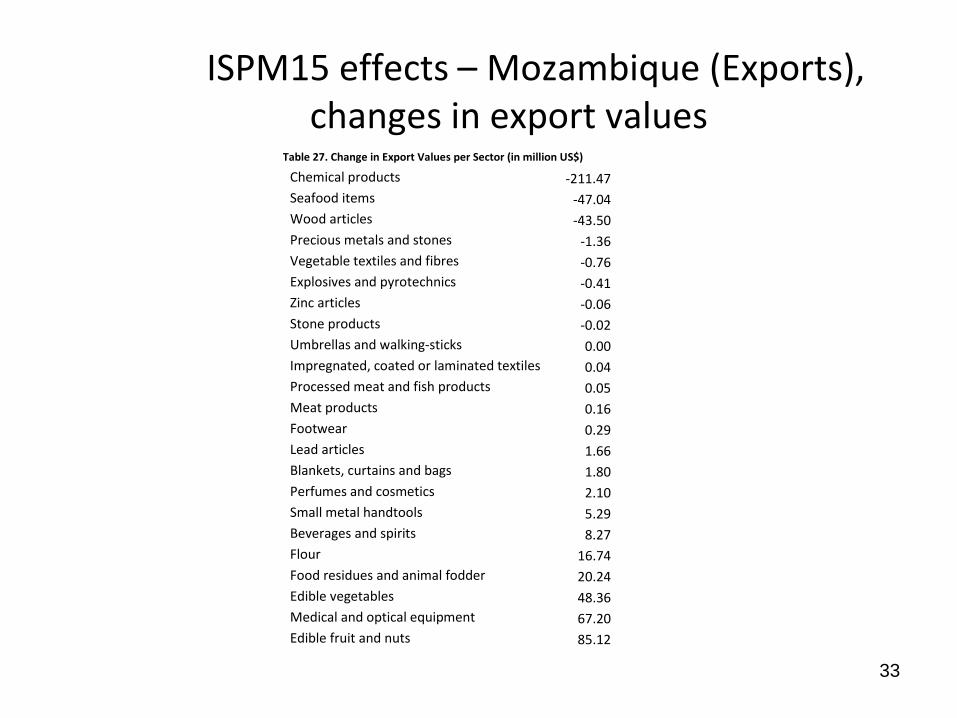
ISPM15 effects – Mozambique (Exports), changes in export values
Table 27. Change in Export Values per Sector (in million US$)
Chemical products -211.47
Seafood items -47.04
Wood articles -43.50
Precious metals and stones -1.36
Vegetable textiles and fibres -0.76
Explosives and pyrotechnics -0.41
Zinc articles -0.06
Stone products -0.02
Umbrellas and walking-sticks 0.00
Impregnated, coated or laminated textiles 0.04
Processed meat and fish products 0.05
Meat products 0.16
Footwear 0.29
Lead articles 1.66
Blankets, curtains and bags 1.80
Perfumes and cosmetics 2.10
Small metal handtools 5.29
Beverages and spirits 8.27
Flour 16.74
Food residues and animal fodder 20.24
Edible vegetables 48.36
Medical and optical equipment 67.20
Edible fruit and nuts 85.12
34
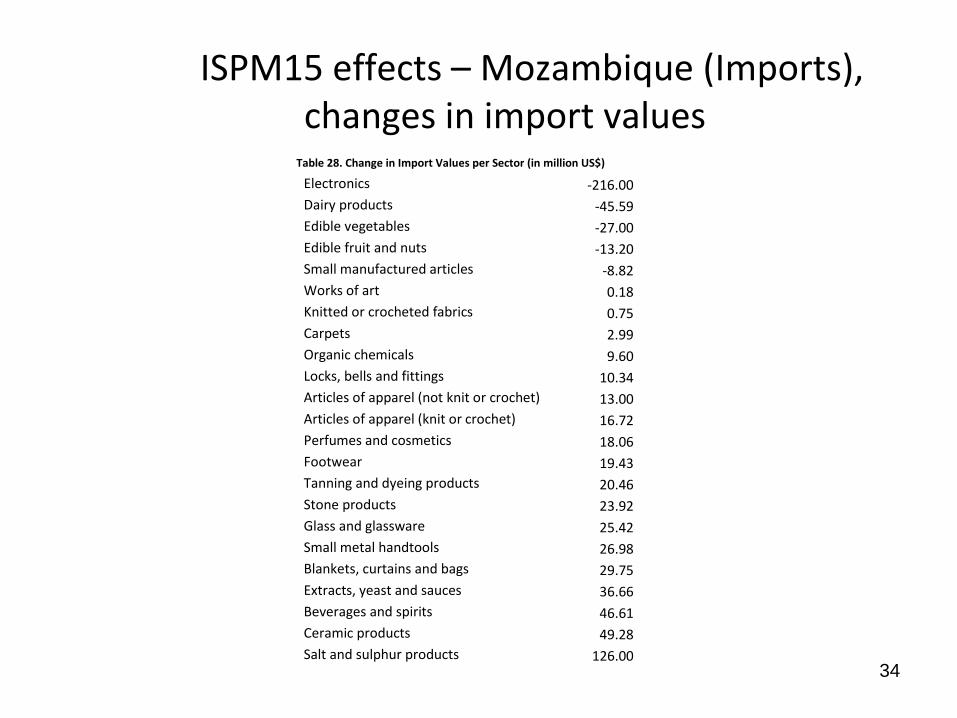
ISPM15 effects – Mozambique (Imports), changes in import values
Table 28. Change in Import Values per Sector (in million US$)
Electronics -216.00
Dairy products -45.59
Edible vegetables -27.00
Edible fruit and nuts -13.20
Small manufactured articles -8.82
Works of art 0.18
Knitted or crocheted fabrics 0.75
Carpets 2.99
Organic chemicals 9.60
Locks, bells and fittings 10.34
Articles of apparel (not knit or crochet) 13.00
Articles of apparel (knit or crochet) 16.72
Perfumes and cosmetics 18.06
Footwear 19.43
Tanning and dyeing products 20.46
Stone products 23.92
Glass and glassware 25.42
Small metal handtools 26.98
Blankets, curtains and bags 29.75
Extracts, yeast and sauces 36.66
Beverages and spirits 46.61
Ceramic products 49.28
Salt and sulphur products 126.00
35
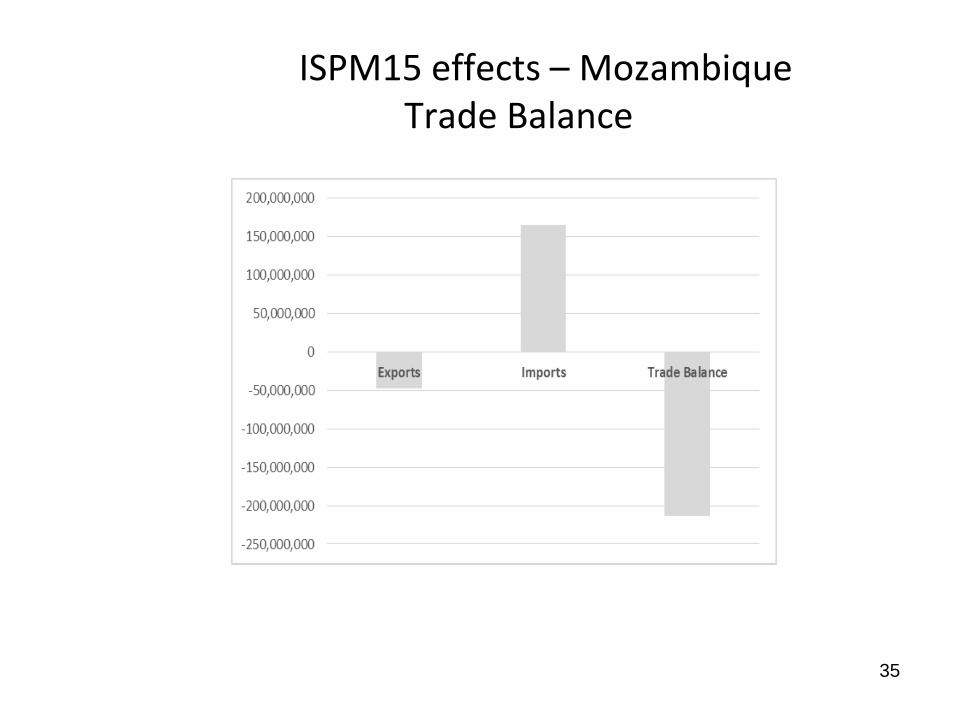
ISPM15 effects – MozambiqueTrade Balance
36
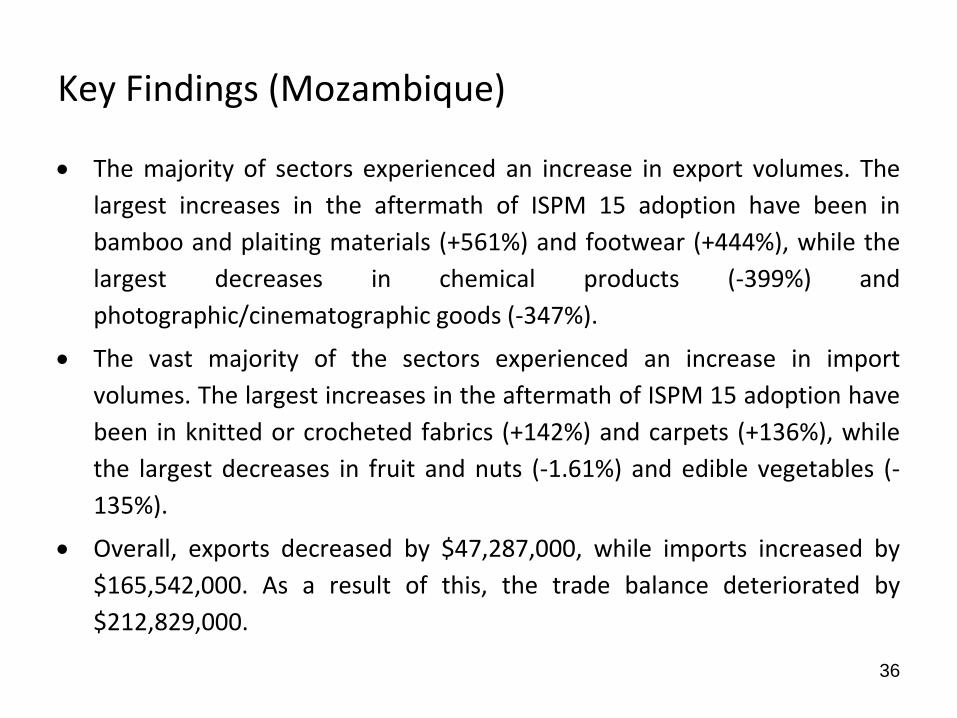
Key Findings (Mozambique)
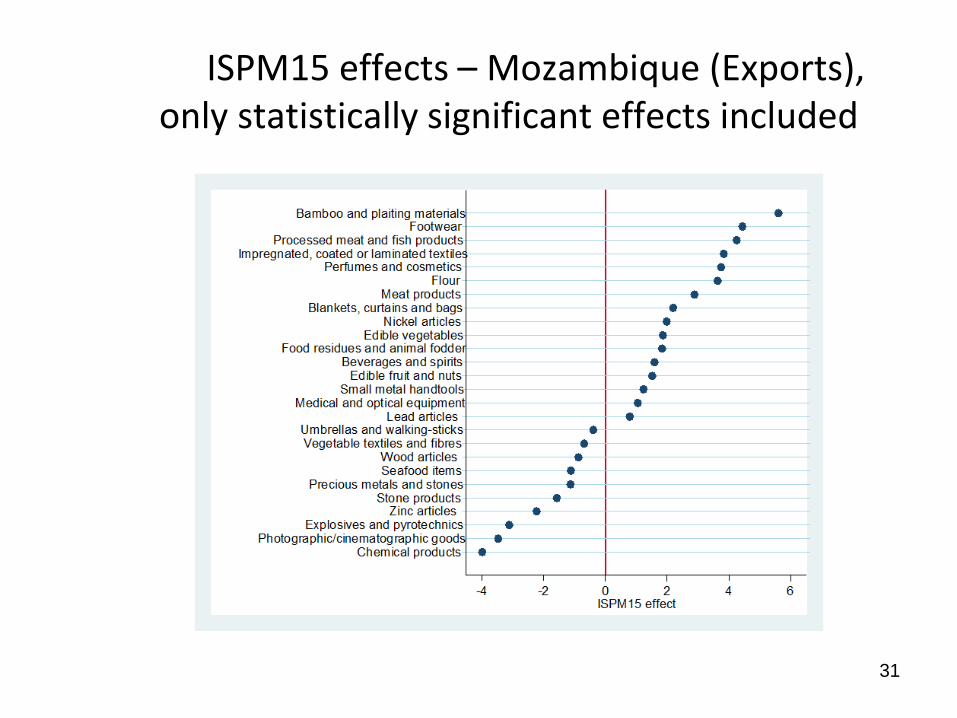
The majority of sectors experienced an increase in export volumes. The
largest increases in the aftermath of ISPM 15 adoption have been in
bamboo and plaiting materials (+561%) and footwear (+444%), while the
largest decreases in chemical products (-399%) and
photographic/cinematographic goods (-347%).
The vast majority of the sectors experienced an increase in import
volumes. The largest increases in the aftermath of ISPM 15 adoption have
been in knitted or crocheted fabrics (+142%) and carpets (+136%), while
the largest decreases in fruit and nuts (-1.61%) and edible vegetables (-
135%).
Overall, exports decreased by $47,287,000, while imports increased by
$165,542,000. As a result of this, the trade balance deteriorated by
$212,829,000.
37
Policy Implications (Mozambique)
• Given the unequal distribution of effects across sectors, the authorities
need to pay attention to those sectors that experienced an economic
contraction in the aftermath of the ISPM 15 implementation
• In Mozambique, the ISPM 15 adoption appears to be associated with a
decrease in overall exports and an increase in overall imports. Overall,
exports decreased by $47,287,000, while imports increased by
$165,542,000. As a result of this, the trade balance deteriorated by
$212,829,000. This is an issue of concern, given that Mozambique has
been running an overall trade deficit since 2008.
Regional policy implications
• The regional analysis has allowed us to discern some visible differences in
export/import trends when comparing the pre and post ISPM 15 periods.
• In Kenya, half of the export sectors experienced an increase in export
volumes – this is in contrast with Botswana, Cameroon and Mozambique
where the majority of the export sectors experienced an increase.
• In Kenya and Botswana, half of the import sectors experienced an
increase in import volumes – this is in contrast with Cameroon and
Mozambique where the majority of the import sectors experienced an
increase.
• In Kenya and Cameroon, overall imports increased by far more than
exports, resulting hence in a decrease of the trade balance – Mozambique
also experienced a deterioration of its trade balance, but this was a result
of both a decline in overall exports as well as increase in total imports. In
contrast, in Botswana overall exports increased by far more than exports,
resulting hence in an improvement of the trade balance. 38

Thank you for your attention
Contact details