Embed Size (px)
Citation preview

Please cite this page as:
Hviding, Ketil and M. Mérette (1998), " MacroeconomicEffects of Pension Reforms in The Context of AgeingPopulations: Overlapping Generations Model Simulationsfor Seven OECD Countries ", OECD EconomicsDepartment Working Papers, No. 201, OECD Publishing.doi:10.1787/638376177076
OECD Economics DepartmentWorking Papers No. 201
Macroeconomic Effects ofPension Reforms in TheContext of AgeingPopulations: OverlappingGenerations ModelSimulations for Seven OECDCountries
Ketil Hviding and Marcel Mérette

Unclassified ECO/WKP(98)14
Organisation de Coopération et de Développement Economiques OLIS : 23-Jun-1998Organisation for Economic Co-operation and Development Dist. : 01-Jul-1998__________________________________________________________________________________________
English text onlyECONOMICS DEPARTMENT
MACROECONOMIC EFFECTS OF PENSION REFORMS IN THE CONTEXT OFAGEING POPULATIONS: OVERLAPPING GENERATIONS MODELSIMULATIONS FOR SEVEN OECD COUNTRIESECONOMICS DEPARTMENT WORKING PAPERS N0. 201
byKetil Hviding and Marcel Mérette
66988
Document complet disponible sur OLIS dans son format d'origine
Complete document available on OLIS in its original format
Unclassified
EC
O/W
KP
(98)14E
nglishtextonly
Most Economics Department Working Papers beginning with No. 144 are now available through OECD'sInternet Web site at http://www.oecd.org/eco/eco.

ECO/WKP(98)14
2
ABSTRACT/RÉSUMÉ
Using overlapping generations (OLG) models calibrated on seven OECD countries -- the United States,Japan, France, Canada, Italy, the United Kingdom and Sweden -- the authors investigate themacroeconomic impact of possible pension reform strategies as populations age. Simulations include areduction in the level of pensions, phased abolition of PAYG schemes and general fiscal consolidation.By raising the national saving rate future GDP levels are higher, but not enough to offset the affects ofageing. A rise in the retirement age has larger effects, but implies significant loss of leisure time.
*****
En utilisant des modèles à générations imbriquées pour sept pays de l'OCDE -- Etats-Unis, Japon, France,Canada, Italie, Royaume-Uni et Suède -- les auteurs analysent les effets macro-économiques desdifférentes réformes de systèmes des pensions dans un contexte de vieillissement de la population. Lessimulations considèrent une réduction des niveaux de pensions, une élimination graduelle des systèmes àrépartition et une réduction généralisée des dépenses publiques. Dans la mesure où ces réformesaugmentent les taux d'épargne, les niveaux futurs du PIB seront plus élevés, mais pas suffisamment pourcompenser les effets du vieillissement de la population. Le recul de l'âge officiel de la retraite aurait uneffet plus important, mais aussi des implications négatives sur le temps disponible pour les loisirs.
Copyright © OECD. All rights reserved
Applications for permission to reproduce or translate all, or part of, this material should be madeto: Head of Publications Service, OECD, 2 rue André Pascal, 75775 Paris Cedex 16, France.
ECO/WKP(98)14
3
TABLE OF CONTENTS
MACROECONOMIC EFFECTS OF PENSION REFORMS IN THE CONTEXT OF AGEINGPOPULATIONS: OVERLAPPING GENERATIONS MODEL SIMULATIONS FOR SEVEN OECDCOUNTRIES ..................................................................................................................................................4
1. Introduction .............................................................................................................................................42. Demographic projections.........................................................................................................................63. Some earlier OLG simulations ................................................................................................................84. The model ................................................................................................................................................9
Household behaviour .............................................................................................................................10The production sector ............................................................................................................................11The government sector...........................................................................................................................12Aggregation and equilibrium conditions ...............................................................................................13
5. Calibration and baseline simulations.....................................................................................................136. Simulations of different policy options .................................................................................................16Concluding comments ...............................................................................................................................29
BIBLIOGRAPHY .........................................................................................................................................31
Tables
1. The share of older people in total population ..................................................................................62. Average effective tax rates: 1965-1994........................................................................................143. Calibration results ..........................................................................................................................154. Effects of policy reform on wage-income tax rates and national savings .....................................255. Effects of policy reform on net real wages and real return on capital ...........................................266. Effects of policy reform on GDP and consumption ......................................................................27
Figures
1. Old-age dependency ratios in selected OECD countries .................................................................72. Simulation results ..........................................................................................................................18

ECO/WKP(98)14
4
MACROECONOMIC EFFECTS OF PENSION REFORMSIN THE CONTEXT OF AGEING POPULATIONS:
OVERLAPPING GENERATIONS MODEL SIMULATIONSFOR SEVEN OECD COUNTRIES
Ketil Hviding and Marcel Mérette 1
1. Introduction
1. Most OECD countries are faced with a rapid increase in the proportion of elderly in thepopulation. These trends reflect a combination of the ageing of the post-war “baby boom” generation,increased longevity, and low birth rates. Although the ratio of elderly non-active to the working agepopulation is already rising, an accelerating pace is expected in the second decade of the next millennium,posing serious challenges for many public sector pension schemes. Recognising that the financial needs ofpublic pensions could become intolerably high if benefit rates remain unchanged, several governmentshave been considering reforming their pension systems. Most reform proposals concentrate on putting thepension system on a sustainable footing by reducing the benefits or increasing contributions, while leavingthe overall design of the system unaltered. More drastic reform proposals aim at systemic changes, suchas improving the links between private contributions and prospective benefits, or various forms ofprivatisation.
2. The purpose of this paper is to analyse the macro-economic effects of different types of pensionreforms in the context of ageing populations. In particular, the paper attempts to answer whether a givenpension reform results in a significant reduction in the need to raise taxes (or contributions) when theeffects of ageing are taken into account. Four basic reforms are analysed: i) a gradual abolition(privatisation) of the public pension system, phased in over 52 years; ii) an across-the-board cut in thereplacement rate of 20 per cent; iii) fiscal consolidation, that is, a decline in the debt-GDP ratio of 20percentage points; and, finally iv) an increase in the effective retirement age of four years. It should benoted, however, that the simulated reforms do not pretend to accurately represent any precise reformproposal, but rather a set of stylised reform types. The effects of policy reforms in the context of ageing
1. OECD and Department of Finance, Canada, respectively. A first version of this paper was prepared as partof an OECD project on Ageing Populations and presented at the Working Party 1 of the Economic PolicyCommittee of the OECD in September 1997. The authors are grateful for comments and suggestions byPaul O’Brien, Nick Vanston, Constantino Lluch, Mike Feiner, Robert Ford, Alain De Serres,Helmut Reisen, Douglas Fore, Peter Richardson and Richard Kohl. In particular, Paul O’Brien’s supportin getting the model off the ground was valuable. We are also indebted to the invaluable assistance ofMartine Levasseur, Sandra Raymond and Brenda Livsey-Coates. The views expressed in this paper arethose of the authors and do not necessarily reflect those of the OECD or the Canadian Department ofFinance.
ECO/WKP(98)14
5
populations were simulated for seven countries: the United States, Japan, France, Italy, United Kingdom,Canada, and Sweden.
3. The simulations were performed by using a general equilibrium model with an overlappinggenerations structure (OLG). The general equilibrium framework incorporates feed-back effects oncapital accumulation from pension reform, as well as “ageing” itself. In order to make the modeltractable, several simplifications had to be made, both regarding the structure of the pension schemes, aswell as assumptions about economic behaviour. First, the pension systems are consolidated with generalgovernment and financed by general taxation. Second, one individual is assumed to represent eachgeneration, thus abstracting from differences between men and women and income groups. Third, theagents are rational, forward-looking and have no liquidity constraints, embodying thelife-cycle hypothesisof consumption behaviour and continuousmarket clearing. Fourth, individual labour supply is fixed.Finally, the economy is closed and all investment has to be financed out of domestic saving2.
4. Despite the above limitations, the OLG model provides a rich description of the generationalstructure of the population, breaking down the population into different age-groups. Thus, aggregatelabour supply is based on the size of the working-age population while pension expenditures aredependent on the size of retired age groups. Aggregate savings are dependent on the desired life-timeconsumption profile and disposable income of each generation, mirroring developments in factor returns.Capital accumulation and interest rates are thus endogenous, dependinginter alia on the size of theworking population, the design of the pension system or public debt policies.
5. OLG models have been criticised for their dependency on the life-cycle hypothesis. In particular,the assumption about "perfect foresight" -- i.e. no uncertainty and rational expectations -- overlooksprecautionary saving motives. Moreover, household surveys indicate that, contrary to predictions of thelife-cycle hypothesis, recent retirees save more than middle-aged workers, resulting in an initial positivesaving effect of ageing. The life-cycle hypothesis has been retained, however, because it is fairly wellsupported by other empirical evidence. The main empirical support for the life-cycle hypothesis comesfrom cross-country evidence which shows a positive link between the old-age dependency ratio and lowersavings3. Other predictions of the life-cycle hypothesis, such as the non-neutrality of government debtpolicies and negative saving effects of the introduction of a PAYG pension systems, are largely supportedby the empirical evidence, although no firm conclusions can be reached.
6. The remainder of the paper is divided into seven sections. The second section establishes thedemographic projections of the seven countries considered. The third section reviews the results fromsome previous studies on pension reforms that use OLG models. The fourth section presents the structureof the model. The fifth section details the calibration method, followed by a presentation of the simulationresults in section six. Section seven is a conclusion.
2. See Turneret al. (1998) for a discussion of the international repercussions of ageing.
3. See, for example, Masson, Paul et. al. (1996), Graham, J.W. (1987), and Miles, D. (1997). Weil (1994)offers a different kind of argument that reconciles empirical analysis based on macro and micro data andhence, support the life-cycle hypothesis. For a survey of the literature of the effect of pension on saving,see Kohl and O’Brien (1998).

ECO/WKP(98)14
6
2. Demographic projections
7. According to recent demographic projections by the United Nations, the share of older people(65 years old and above) in the total population is expected to increase substantially over the next 50 yearsfor all the seven countries examined, with Italy and Japan projected to experience the largest increases(Table 1). The increase is projected to be less dramatic in Sweden, Canada, France, and the United States,whereas the United Kingdom ranks in middle of the countries considered.
Table 1. The share of older people in total population
(Per cent)
1996 2050Canada 12 24
France 15 24
Italy 17 34
Japan 15 30
Sweden 17 22
United Kingdom 15 23
United States 13 21
Source: United Nations
8. The old-age dependency ratio with regard to the working population is shown in Figure 1. Thisratio gives a more accurate description of the economic burden arising from population ageing bymeasuring the ratio of older people (65 years old and above) to those of working-age (15 to 64 years old).In Japan and Italy, the dependency ratio is already increasing rapidly and is projected to increase evenmore rapidly in the future. In Japan, the increase is projected to be 190 per cent and in Italy 170 per cent,from 1996 to 2050. For the other five countries, the increase in the dependency ratio is gradual until 2010,but increases at a much faster pace thereafter. For Canada, France and the United States, the dependencyratio is expected — from 1996 to 2050 — to increase by 130 per cent, 100 per cent and 90 per centrespectively, compared to 60 per cent and 50 per cent for the United Kingdom and Sweden.

ECO/WKP(98)14
7
1) The ratio of olderpeople (more than 65years old) to those of working age (15-64years old).
Source:World populationprospects (1996 revision), United Nations.
Figure 1.Old-age dependency ratios in selected OECD countries
0
10
20
30
40
50
60
70
1970 1980 1990 2000 2010 2020 2030 2040 2050
Canada France Italy Japan
0
10
20
30
40
50
60
70
80
1970 1980 1990 2000 2010 2020 2030 2040 2050
Sweden UK US
9. Clearly, demographic forecasts for the mid 21 century are subject of wide margins of error.Unexpected changes in life-expectancy is probably the most important factor of uncertainty. To the extentincreased life expectancy also implies increased effective working life, an increased demographic old-agedependency ratio does not necessary imply an increased economic burden. An increased fertility rate, onthe other hand, would have a delayed effect of at least 15 years before it affects the size of the working-

ECO/WKP(98)14
8
age population, but would cut or postpone the projected increase in the old-age dependency ratio.Immigration, e.g., from populations with many young people would have a similar but more rapid effect.To this extent that this immigration comes from countries with similar age-profile the problem would onlybe moved from one country to another. Due to the relative size of the “baby boom generation”, it ishowever unlikely that any of these effects would prevent a significantly increase in the ratio between olderpeople in need of support and the working-age population.
3. Some earlier OLG simulations
10. The pioneering large-scale numerical OLG model was built by Auerbach and Kotlikoff (1987).Their model contained 55 generations, certain life-time, perfect foresight, exogenous technical change andendogenous individual labour supply. Although later models have extended the original Auerbach-Kotlikoff model by adding such factors as uncertain life-time4, traded and non-traded goods,heterogeneous consumers and credit restrictions, the main insights from A-K’s original model remainlargely unchanged. In Auerbachet al. (1989), this model was employed to analyse the effects ofdemographic changes for four OECD countries: the United States, Japan, Germany, and Sweden. Theeffects of the projected increase in ageing were assessed in a series of dynamic simulations under differentassumptions about pension formulas, fiscal policy and openness of the economy.
11. In their baseline scenario, Auerbachet al. (1989) simulated the “pure effect” of ageing. Hence itwas assumed that the old-age pension replacement rate -- defined as the ratio of average pension benefitsto wage-indexed life-time earnings -- would remain unchanged, while fiscal expenditures would rise inline with the growth rate of the economy. The estimated effect from demographic changes on nationalsaving was large: over the period 1990 to 2030 the simulations showed a fall in the net national savingratios by 4 percentage points in the United States, and by more than 18 percentage points in Japan. Theimplied increase in the “social security tax” was also quite dramatic: in the same period, payroll taxeswere projected to increase by nearly 8 percentage points of GDP in Germany, and over 4½ percentagepoints of GDP in the United States.
12. Auerbachet al. simulated the effects of three different policy options: freezing non-pensiongovernment expenditures in per capita terms; a 2-year increase in the retirement age; and a 20 per cent cutin pension benefits. For all options there was a simulated increase in the national saving rate and areduction in the need for an increase in payroll taxes relative to the baseline scenario. The effect on realwage growth varies, from almost significant to zero in the case of freezing government non-pensionexpenditures, to relatively significant in the case of a cut in benefits.
13. In very recent work by Kotlikoffet al. (1997), the effects of privatising United States SocialSecurity have been simulated. The model contains 12 different income groups, imposes a ceiling onearnings subject to Social Security contributions, includes the progressive benefits schedule in US SocialSecurity, and was calibrated on US household income data. Privatisation -- which in the model isequivalent to abolishing public old-age pensions -- was simulated to take place with constant populationgrowth, excluding the effects of population ageing. The pension replacement rate was reduced gradually,starting 11 years after the beginning of the reform in order to ensure that workers aged 45 and abovereceive their full benefits.
4. See Chauveu and Loufir (1997) for a recent model with uncertain life-time.

ECO/WKP(98)14
9
14. Drawing on these simulations, Kotlikoffet al. (1997) estimated that the long-run effect of a taxfinanced “privatisation” would be to increase the capital stock by 37 per cent and per capita output by11 per cent. These effects would take about 60 years to be achieved, but almost three-quarters of theeffects are obtained after 30 years in most of the simulations. According to the simulations a“privatisation” would be redistributive: the poorest income groups would gain about 50 per cent more thanthe highest income groups (in the case the transition is financed by a consumption tax). This reflects thefact that -- in Kotlikoff’s model -- the progressive effect of current Social Security contributions embodiedin the benefits schedule is outweighed by the ceiling on taxable earnings. But the overall welfareimprovement embodies significant inter-generational effects: for example, in the case of consumption-taxfinanced transition, average earners aged 54 when the reform is partially implemented experience a3.8 per cent drop in remaining life-time utility, while those born when the reform is fully implementedenjoy a 8.1 per cent increase in utility.
15. A number of authors have modelled the effects of pension reform in developing countries, withparticular reference to Chile. In a model where it is not possible to borrow on the basis of human capital,and young workers are credit constrained, Cifuentes and Valdés-Prieto (1995) simulated the effect of animmediate introduction of a mandatory pension system in line with the Chilean reform. While allowing(explicit) government debt to increase in the transition period, the reform still has net positive effects onsaving and capital stock. This is because young credit constrained workers cannot offset the “forcedsaving” imposed by the new mandatory pension system, thus raising aggregate private saving. In the caseof 75 per cent debt financing, the capital-output ratio increases by approximately 28 per cent. In the caseof credit constraints, whether or not the remaining part of transition induced deficit is financed withincome or consumption taxes make little difference to the results.
16. In contrast to most of the above studies, this paper combines pension reforms and ageingpopulations. Therefore, it can be viewed as an extension of Auerbachet al. (1989). Our simulationresults suggest that the benefits that can be expected from reforming pension schemes, such as the onesinvestigated in the above studies, will not be sufficient to fully offset the significant macroeconomiceffects arising from ageing populations. Before commenting in more detail on the results, we present themodel.
4. The model
17. The model is based on the life-cycle theory of saving behaviour. In the model, there are 15generations living side by side at each point in time. Each new generation has 15 periods to live, witheach period corresponding to 4 years of life. The structure of the model is similar to that of Auerbach andKotlikoff (1987) and Auerbachet al. (1989), with the exception that labour supply is exogenous andbequest motives are included. Households are assumed to be rational, have perfect foresight, theproduction technology is given by a standard Cobb-Douglas function, and the one-good economy isassumed to be closed. Although the closed economy feature of the model excludes the assessment ofinternational repercussion of the pension reforms, it is probably a fairly good representation of mostOECD countries given that the ageing process is widespread (Figure 1)5. The model can be separated intoseveral sets of equations relating to, household/consumer behaviour, the production sector, thegovernment sector (including the pension system), and the aggregation and equilibrium conditions. In the
5. A more satisfactory treatment of the international consequences of ageing populations can be found inTurneret al. (1998).
ECO/WKP(98)14
10
following equations, subscriptt is for time period andg for age-group:g=1 is for age-group 17 to 19 yearsold, g=2 for age-group 20 to 22 years old, up tog=15 for age-group 73 to 76 years old.
Household behaviour
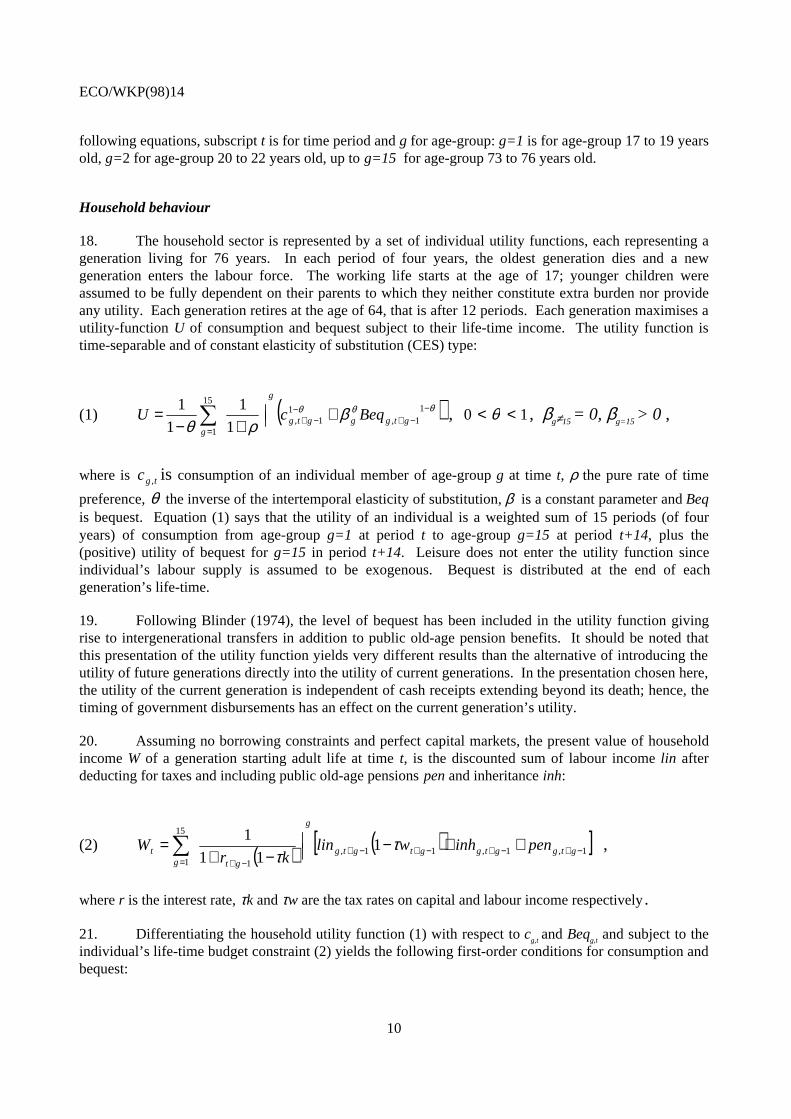
18. The household sector is represented by a set of individual utility functions, each representing ageneration living for 76 years. In each period of four years, the oldest generation dies and a newgeneration enters the labour force. The working life starts at the age of 17; younger children wereassumed to be fully dependent on their parents to which they neither constitute extra burden nor provideany utility. Each generation retires at the age of 64, that is after 12 periods. Each generation maximises autility-function U of consumption and bequest subject to their life-time income. The utility function istime-separable and of constant elasticity of substitution (CES) type:
(1) ( )θθθ βρθ
−−+
−−+
=
+���
����
�
+−= �
11,
11,
15
1 1
1
1
1gtgggtg
g
g
BeqcU , 10 << θ , βg≠15= 0, βg=15> 0 ,
where is tgc , is consumption of an individual member of age-groupg at time t, ρ the pure rate of time
preference,θ the inverse of the intertemporal elasticity of substitution,β= is a constant parameter andBeqis bequest. Equation (1) says that the utility of an individual is a weighted sum of 15 periods (of fouryears) of consumption from age-groupg=1 at period t to age-groupg=15 at period t+14, plus the(positive) utility of bequest forg=15 in period t+14. Leisure does not enter the utility function sinceindividual’s labour supply is assumed to be exogenous. Bequest is distributed at the end of eachgeneration’s life-time.
19. Following Blinder (1974), the level of bequest has been included in the utility function givingrise to intergenerational transfers in addition to public old-age pension benefits. It should be noted thatthis presentation of the utility function yields very different results than the alternative of introducing theutility of future generations directly into the utility of current generations. In the presentation chosen here,the utility of the current generation is independent of cash receipts extending beyond its death; hence, thetiming of government disbursements has an effect on the current generation’s utility.
20. Assuming no borrowing constraints and perfect capital markets, the present value of householdincomeW of a generation starting adult life at timet, is the discounted sum of labour incomelin afterdeducting for taxes and including public old-age pensionspenand inheritanceinh:
(2) ( ) ( )[ ]1,1,11,
15
1 1
111
1−+−+−+−+
= −+
++−��
�
�
��
�
�
−+=� gtggtggtgtg
g
g gtt peninhwlin
krW τ
τ,
wherer is the interest rate,τk andτw are the tax rates on capital and labour income respectively.
21. Differentiating the household utility function (1) with respect tocg,t andBeqg,t and subject to theindividual’s life-time budget constraint (2) yields the following first-order conditions for consumption andbequest:

ECO/WKP(98)14
11
(3)( )
1,
/1
,1 1
11−+
+++ �
�
���
�
+−+
= gtg
gt
gtg ckr
c
θ
ρτ
, g = 1,2,….,14;
(4) tggtg cBeq ,, β= , g = 15.
Inheritances arising from the oldest age-group’s (g=15) bequests are assumed to be equallydistributed to all working generations:
(5) tmtmtjtj nBeqnInh ,,,, 12
1= , for all j = 1,2,…,12 andm = 15,
whereng,t is the number of people in age-groupg at periodt.
The production sector
22. The economy’s production technology is represented by a simple Cobb-Douglas function:
(6) εε −= 1ttt LAKY ,
whereY represents real output,K is the real value of the capital stock,L describes the effective labourforce,ε stands for the capital income share andA is a scaling variable. In this simple presentation of thecorporate sector it is assumed that thecorporate veilis fully transparent – there are no “agency” problems.It is also assumed that there are no installation costs6 and that the companies operate in a perfectlycompetitive market. Hence, factor demand and output are determined by the two first-order conditions formaximum profit:
(7) εεε −−= 11ttt LAKr ,
(8) ( ) εεε −−= ttt LAKw 1 ,
whereδ is the rate of capital depreciation andw is the wage rate per unit of effective labour.
23. It is assumed that technical change is exogenous and “labour embodied”; every new generationhas a larger stock of technical knowledge than the previous generation and is more productive by a
constant factorγ. Thus the technology embodied in the age-groupg at period t+1 is 1, +tgte where
6. Auerbach and Kotlikoff (1987) found that the presence of such costs do not affect much the simulationresults.
ECO/WKP(98)14
12
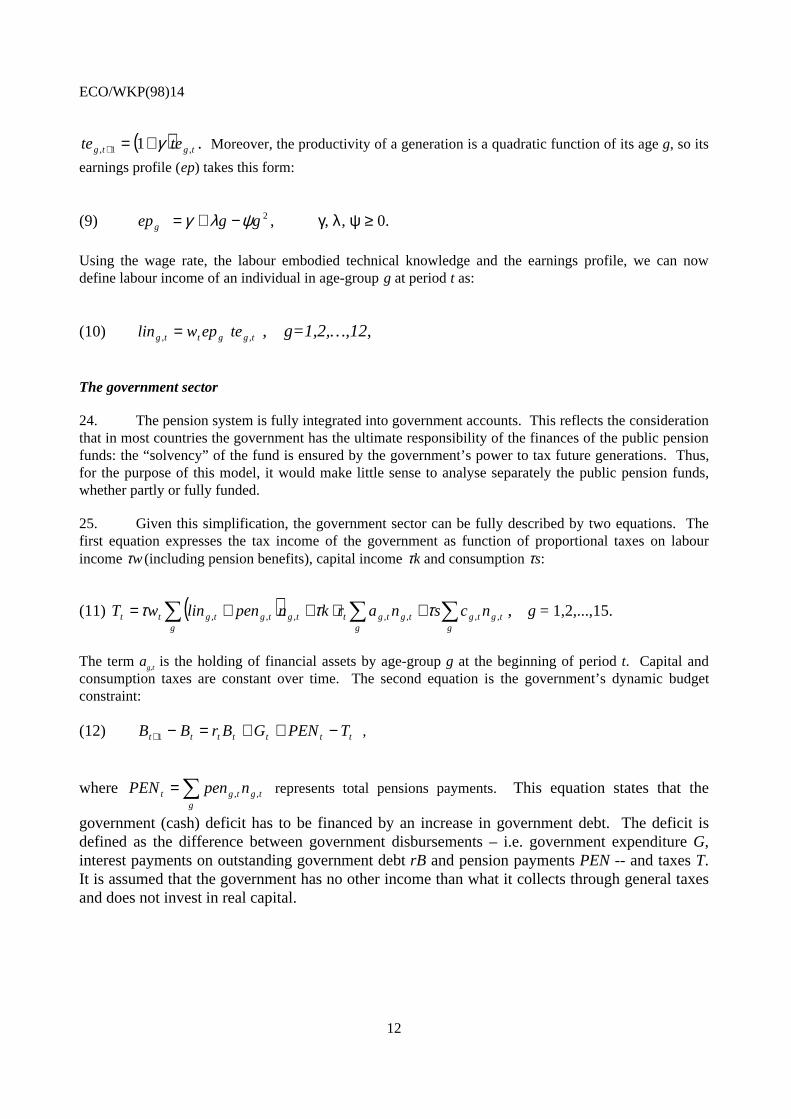
( ) tgtg tete ,1, 1 γ+=+ . Moreover, the productivity of a generation is a quadratic function of its ageg, so its
earnings profile (ep) takes this form:
(9) 2ggepg ψλγ −+= , γ, λ, ψ ≥ 0.
Using the wage rate, the labour embodied technical knowledge and the earnings profile, we can nowdefine labour income of an individual in age-groupg at periodt as:
(10) tggttg teepwlin ,, = , g=1,2,…,12,
The government sector
24. The pension system is fully integrated into government accounts. This reflects the considerationthat in most countries the government has the ultimate responsibility of the finances of the public pensionfunds: the “solvency” of the fund is ensured by the government’s power to tax future generations. Thus,for the purpose of this model, it would make little sense to analyse separately the public pension funds,whether partly or fully funded.
25. Given this simplification, the government sector can be fully described by two equations. Thefirst equation expresses the tax income of the government as function of proportional taxes on labourincomeτw(including pension benefits), capital incomeτk and consumptionτs:
(11) ( ) ��� +⋅++=g
tgtgg
tgtgtg
tgtgtgtt ncsnarknpenlinwT ,,,,,,, τττ , g = 1,2,...,15.
The termag,t is the holding of financial assets by age-groupg at the beginning of periodt. Capital andconsumption taxes are constant over time. The second equation is the government’s dynamic budgetconstraint:
(12) ttttttt TPENGBrBB −++=−+1 ,
where �=g
tgtgt npenPEN ,, represents total pensions payments.This equation states that the
government (cash) deficit has to be financed by an increase in government debt. The deficit isdefined as the difference between government disbursements – i.e. government expenditureG,interest payments on outstanding government debtrB and pension paymentsPEN -- and taxesT.It is assumed that the government has no other income than what it collects through general taxesand does not invest in real capital.

ECO/WKP(98)14
13
Aggregation and equilibrium conditions
26. In order to ensure that the model is logically consistent and that no resources are wasted, threeadditional conditions are introduced. The first defines effective labour supply by summing over the twelveworking generations a term that involves the multiplication of age-group productivity factor (ep), thelabour embodied technology factor (te), and the number of workers belonging to that group (n):
(13) �=
=12
1,,
gtgtggt nteepL .
With the presence of labour embodied technical change, the supply of labourL is growing over time witha constant rate in excess of the growth rate of the working-age population. The second requires that thestock of real capitalKt in the economy plus government debt be equal to total financial assets in theeconomy, represented by the sum of all age-groups’ wealth in periodt :
(14) �=+g
tgtgtt naBK ,,
27. The closed economy assumption of the model implies that foreign asset holdings are excluded.The third and final relationship in the model requires that aggregate supplyYt is equal to total demand(Walras Law):
(15) ( ) ttttt KKGCY δ−−++= + 11 ,
where �=g
tgtgt ncC ,,
5. Calibration and baseline simulations
28. Calibration of the model proceeded in two steps7. The first step consisted of fitting the “steadystate” version of the model – i.e. the long-run path with constant population and productivity growth – to aset of macroeconomic variables for the 1950s/60s, a period with relatively constant population growth.The model was easier to solve for the steady state, since tax rates, the national saving rate, the debt-to-GDP ratio and public spending to GDP, are all constants on such a path. In the calibration procedure,several of country specific parameters and ratios were based on OECD data and empirical studies. Theseinclude the capital share of output, the ratio of net public debt to GDP, the tax rates (Table 2), the rate ofdepreciation of physical capital, and the old-age pension replacement rates. The old-age replacement rateswere based on the 1995 population averages of pension benefits over earnings, used in Roseveareet al.(1996) and shown in Table 3. Other parameters, such as the intertemporal elasticity of substitution (1/θ)and the age-wage profile function coefficients were assumed identical in all countries, because of lack ofsatisfactory country-specific data. The elasticity of substitution was taken from Auerbach and Kotlikoff
7. Both the static and dynamic solutions to the model were found by using numerical algorithms provided byGeneral Algebraic Modelling System (GAMS), copyright World Bank.

ECO/WKP(98)14
14
(1987)8, whereas the age-wage profile parameters were set to produce a maximum at the age of 52. Theinitial population growth rate was taken to fit the average observed old-age dependency ratio in the period1950 to 1965. The technical progress and the capital stock were adjusted to generate the level of nationalsaving found in the data.
Table 2. Average effective tax rates: 1965-19941
ττττκκκκ ττττL ττττC
Canada 41 22 9
France 22 36 18
Italy 25 30 11
Japan 33 16 5
Sweden 51 47 18
United Kingdom 54 23 13
United States 41 20 5
Notes: τk average tax rate on capitalτL average tax rate on wage incomeτC average tax rate on consumption
1. For Sweden, the data are averages of 1975-1994.
Source: Leibfritz et al. (1997)
8. Auberbach and Koltikoff (1987) used an intertemporal rate of substitution at 0.25. This figure correspondsto an approximate average of estimates made by Weber (1970), and Grossman and Shiller (1981), Mankiw(1981, 1985), Mankiw, Rotemberg, and Summers (1985) and others.

ECO/WKP(98)14
15
Table 3. Calibration results
εεεε δδδδ ηηηη ρρρρ r K/Y S/Y B/Y ααααCanada 34.5 3.10 2.4 0.0047 8.3 2.7 0.22 0.27 0.46France 33.2 3.02 1.6 0.0002 4.8 4.0 0.23 0.08 0.52Italy 34.4 2.58 2.6 0.0050 6.2 3.6 0.29 0.62 0.45Japan 34.2 4.54 2.4 0.0025 6.4 2.9 0.32 0.09 0.54Sweden 30.0 2.70 2.4 -0.0030 5.1 3.6 0.23 -0.08 0.49United Kingdom 30.4 2.75 2.9 0.0035 8.1 2.5 0.18 0.35 0.24United States 32.6 3.52 2.4 0.0055 8.2 2.5 0.19 0.34 0.42
Parameters common to all countries: 1/θ = 0.251, γ===1=, λ== 0.25 ψ== 0.012
ε business sector capital income shareNotes: δ rate of capital stock depreciation (per cent)
η rate of technical growth (per cent)ρ consumer time preferencer real return on capital (per cent)
K/Y capital to GDP ratioS/Y gross national saving ratioB/Y public debt to GDP ratio1/θ intertemporal elasticity of substitutionα average pension replacement rateγ constant term in the age-wage profile functionλ coefficient on age term in the age-wage profile functionψ coefficient on the quadratic term in the age-wage profile function
1. Auerbach and Kotlikoff (1987).
:
29. Table 3 details the calibration results. National saving rates (from 19 per cent of GDP in the USto 32 per cent of GDP in Japan) and public debt levels (from minus 8 per cent of GDP in Sweden to plus62 per cent of GDP in Italy) vary quite significantly among countries. Similarly, consumers’ timepreferences generated by the calibration procedure vary substantially, from a positive rate of 0.55 per centin the United States, to a negative rate of 0.3 per cent in Sweden. By contrast, real rates of return at theinitial steady state are in a relatively narrow range, from 5 per cent to 8 per cent.
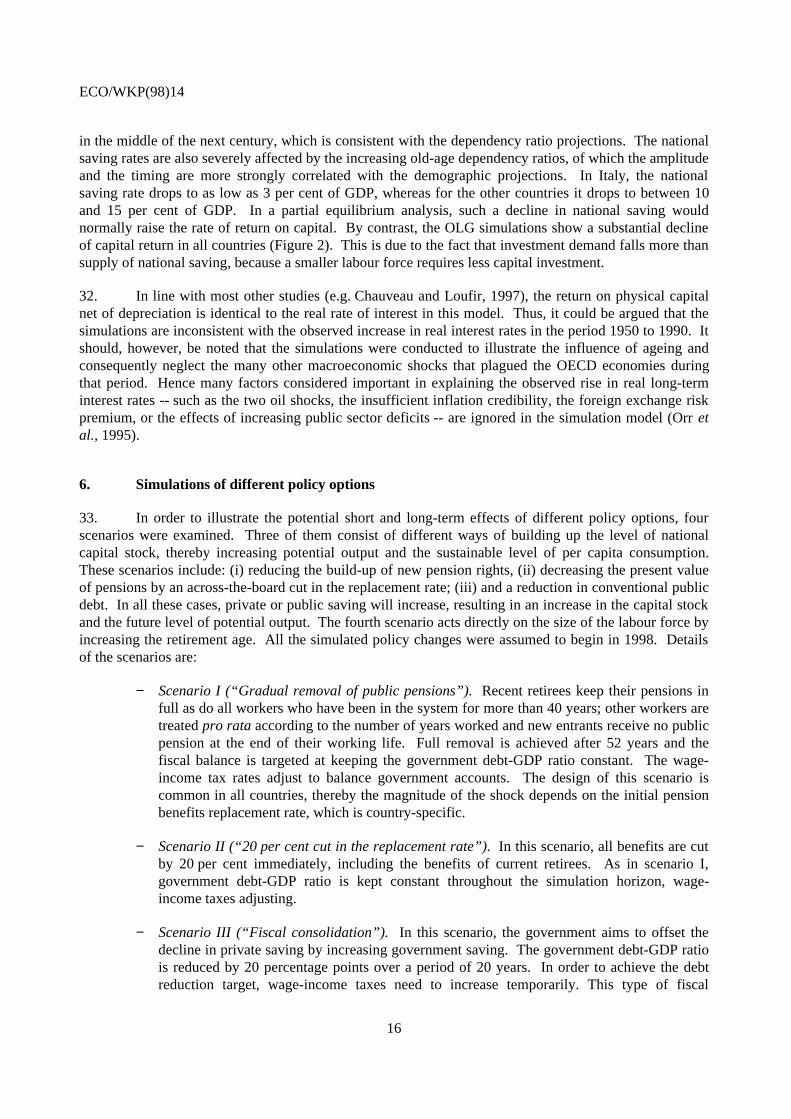
30. The second step of the calibration consisted of finding the adjustment path to a demographicshock, such as an increase followed by a decline in the birth rate. The model was solved numerically over60 periods (240 years) until a new steady state was found. This dynamic solution is considered to be thebaselinefor policy simulations. In the baseline scenario, the public sector debt-GDP ratio is assumed toremain constant, requiring wage-income taxes to adjust in order to balance government accounts, whereasother taxes are kept constant. The baseline scenario can be considered to represent the “pure” ageingeffect. The demographic shock was imposed by changes in the birth rate to replicate, as closely aspossible, the rise in the old-age dependency ratio for the period 1950 to 2050. Due to the assumption of acertain death at a given age, the projected developments in the demographic structure could only bereplicated approximately. The top panel of Figure 2 for each country, compares the dependency ratioobtained with the United Nations’ projections. After 2050, it is assumed that the birth rate convergesslowly to a population replacement rate.
31. In all countries, the effect of ageing results in large increase in the wage-income tax that exhibitslarger amplitude at the beginning of the next millennium. Italy and Japan are the most extreme cases,with an increase of about 40 and 25 percentage points of wage-income tax rate respectively, whereas forother countries the rise is between 10 and 25 percentage points. In all countries, the tax rate peak occurs
ECO/WKP(98)14
16
in the middle of the next century, which is consistent with the dependency ratio projections. The nationalsaving rates are also severely affected by the increasing old-age dependency ratios, of which the amplitudeand the timing are more strongly correlated with the demographic projections. In Italy, the nationalsaving rate drops to as low as 3 per cent of GDP, whereas for the other countries it drops to between 10and 15 per cent of GDP. In a partial equilibrium analysis, such a decline in national saving wouldnormally raise the rate of return on capital. By contrast, the OLG simulations show a substantial declineof capital return in all countries (Figure 2). This is due to the fact that investment demand falls more thansupply of national saving, because a smaller labour force requires less capital investment.
32. In line with most other studies (e.g. Chauveau and Loufir, 1997), the return on physical capitalnet of depreciation is identical to the real rate of interest in this model. Thus, it could be argued that thesimulations are inconsistent with the observed increase in real interest rates in the period 1950 to 1990. Itshould, however, be noted that the simulations were conducted to illustrate the influence of ageing andconsequently neglect the many other macroeconomic shocks that plagued the OECD economies duringthat period. Hence many factors considered important in explaining the observed rise in real long-terminterest rates -- such as the two oil shocks, the insufficient inflation credibility, the foreign exchange riskpremium, or the effects of increasing public sector deficits -- are ignored in the simulation model (Orretal., 1995).
6. Simulations of different policy options
33. In order to illustrate the potential short and long-term effects of different policy options, fourscenarios were examined. Three of them consist of different ways of building up the level of nationalcapital stock, thereby increasing potential output and the sustainable level of per capita consumption.These scenarios include: (i) reducing the build-up of new pension rights, (ii) decreasing the present valueof pensions by an across-the-board cut in the replacement rate; (iii) and a reduction in conventional publicdebt. In all these cases, private or public saving will increase, resulting in an increase in the capital stockand the future level of potential output. The fourth scenario acts directly on the size of the labour force byincreasing the retirement age. All the simulated policy changes were assumed to begin in 1998. Detailsof the scenarios are:
−= Scenario I (“Gradual removal of public pensions”).Recent retirees keep their pensions infull as do all workers who have been in the system for more than 40 years; other workers aretreatedpro rata according to the number of years worked and new entrants receive no publicpension at the end of their working life. Full removal is achieved after 52 years and thefiscal balance is targeted at keeping the government debt-GDP ratio constant. The wage-income tax rates adjust to balance government accounts. The design of this scenario iscommon in all countries, thereby the magnitude of the shock depends on the initial pensionbenefits replacement rate, which is country-specific.
−= Scenario II (“20 per cent cut in the replacement rate”). In this scenario, all benefits are cutby 20 per cent immediately, including the benefits of current retirees. As in scenario I,government debt-GDP ratio is kept constant throughout the simulation horizon, wage-income taxes adjusting.
−= Scenario III (“Fiscal consolidation”). In this scenario, the government aims to offset thedecline in private saving by increasing government saving. The government debt-GDP ratiois reduced by 20 percentage points over a period of 20 years. In order to achieve the debtreduction target, wage-income taxes need to increase temporarily. This type of fiscal

ECO/WKP(98)14
17
consolidation would be equivalent to a pension reform entailing a build-up of public pensionfund assets, without changing the way the pension rights are calculated and without aconcomitant draw-down of other types of government assets.
−= Scenario IV (“Raising the retirement age”). The retirement age is raised from age 64 to 68.The government debt-GDP ratio is maintained as in Scenarios I and II.
34. The simulation results are summarised in Figure 2, Table 4 and Table 5, which illustrate thesimulated effects on the wage tax rate, the national saving rate and the rate of return on capital by country,and in Table 6, which report changes in per capita GDP and consumption by country.

ECO/WKP(98)14
18
Figure 2. Canada
Ageing only Fiscal consolidationGradual removal of public old-age pensions Increased retirement age
2
3
4
5
6
7
8
9
1954 1962 1970 1978 1986 1994 2002 2010 2018 2026 2034 2042 2050 2058 2066 2074 2082 2090
2
3
4
5
6
7
8
9
Real return on capital
-4
0
4
8
12
16
20
24
28
32
36
1954 1962 1970 1978 1986 1994 2002 2010 2018 2026 2034 2042 2050 2058 2066 2074 2082 2090
-4
0
4
8
12
16
20
24
28
32
36
Ratio of national savings to GDP
13
23
33
43
53
63
73
1954 1962 1970 1978 1986 1994 2002 2010 2018 2026 2034 2042 2050 2058 2066 2074 2082 2090
13
23
33
43
53
63
73
Wage-Income tax rate
8
18
28
38
48
58
68
1954 1962 1970 1978 1986 1994 2002 2010 2018 2026 2034 2042 2050 2058 2066 2074 2082 2090
8
18
28
38
48
58
68
Projected
Simulated
Old-Age dependency ratio

ECO/WKP(98)14
19
Figure 2. France
Ageing only Fiscal consolidationGradual removal of public old-age pensions Increased retirement age
2
3
4
5
6
7
8
1954 1962 1970 1978 1986 1994 2002 2010 2018 2026 2034 2042 2050 2058 2066 2074 2082 2090
2
3
4
5
6
7
8Real return on capital
-4
0
4
8
12
16
20
24
28
32
36
1954 1962 1970 1978 1986 1994 2002 2010 2018 2026 2034 2042 2050 2058 2066 2074 2082 2090
-4
0
4
8
12
16
20
24
28
32
36
Ratio of national savings to GDP
13
23
33
43
53
63
73
1954 1962 1970 1978 1986 1994 2002 2010 2018 2026 2034 2042 2050 2058 2066 2074 2082 2090
13
23
33
43
53
63
73Wage-Income tax rate
8
18
28
38
48
58
68
1954 1962 1970 1978 1986 1994 2002 2010 2018 2026 2034 2042 2050 2058 2066 2074 2082 2090
8
18
28
38
48
58
68
Projected
Simulated
Old-Age dependency ratio

ECO/WKP(98)14
20
Figure 2. Italy
Ageing only Fiscal consolidationGradual removal of public old-age pensions Increased retirement age
2
3
4
5
6
7
8
1954 1962 1970 1978 1986 1994 2002 2010 2018 2026 2034 2042 2050 2058 2066 2074 2082 2090
2
3
4
5
6
7
8Real return on capital
-4
0
4
8
12
16
20
24
28
32
36
1954 1962 1970 1978 1986 1994 2002 2010 2018 2026 2034 2042 2050 2058 2066 2074 2082 2090
-4
0
4
8
12
16
20
24
28
32
36Ratio of national savings to GDP
13
23
33
43
53
63
73
1954 1962 1970 1978 1986 1994 2002 2010 2018 2026 2034 2042 2050 2058 2066 2074 2082 2090
13
23
33
43
53
63
73Wage-Income tax rate
8
18
28
38
48
58
68
1954 1962 1970 1978 1986 1994 2002 2010 2018 2026 2034 2042 2050 2058 2066 2074 2082 2090
8
18
28
38
48
58
68
Projected
Simulated
Old-Age dependency ratio

ECO/WKP(98)14
21
Figure 2. Japan
Ageing only Fiscal consolidationGradual removal of public old-age pensions Increased retirement age
2
3
4
5
6
7
8
1954 1962 1970 1978 1986 1994 2002 2010 2018 2026 2034 2042 2050 2058 2066 2074 2082 2090
2
3
4
5
6
7
8Real return on capital
-4
0
4
8
12
16
20
24
28
32
36
1954 1962 1970 1978 1986 1994 2002 2010 2018 2026 2034 2042 2050 2058 2066 2074 2082 2090
-4
0
4
8
12
16
20
24
28
32
36
Ratio of national savings to GDP
13
23
33
43
53
63
73
1954 1962 1970 1978 1986 1994 2002 2010 2018 2026 2034 2042 2050 2058 2066 2074 2082 2090
13
23
33
43
53
63
73Wage-Income tax rate
8
18
28
38
48
58
68
1954 1962 1970 1978 1986 1994 2002 2010 2018 2026 2034 2042 2050 2058 2066 2074 2082 2090
8
18
28
38
48
58
68
Projected
SimulatedOld-Age dependency ratio

ECO/WKP(98)14
22
Figure 2. Sweden
Ageing only Fiscal consolidationGradual removal of public old-age pensions Increased retirement age
2
3
4
5
6
7
8
1954 1962 1970 1978 1986 1994 2002 2010 2018 2026 2034 2042 2050 2058 2066 2074 2082 2090
2
3
4
5
6
7
8
Real return on capital
-4
0
4
8
12
16
20
24
28
32
36
1954 1962 1970 1978 1986 1994 2002 2010 2018 2026 2034 2042 2050 2058 2066 2074 2082 2090
-4
0
4
8
12
16
20
24
28
32
36
Ratio of national savings to GDP
13
23
33
43
53
63
73
1954 1962 1970 1978 1986 1994 2002 2010 2018 2026 2034 2042 2050 2058 2066 2074 2082 2090
13
23
33
43
53
63
73Wage-Income tax rate
8
18
28
38
48
58
68
1954 1962 1970 1978 1986 1994 2002 2010 2018 2026 2034 2042 2050 2058 2066 2074 2082 2090
8
18
28
38
48
58
68
Projected
Simulated
Old-Age dependency ratio

ECO/WKP(98)14
23
Figure 2. United Kingdom
Ageing only Fiscal consolidationGradual removal of public old-age pensions Increased retirement age
2
3
4
5
6
7
8
1954 1962 1970 1978 1986 1994 2002 2010 2018 2026 2034 2042 2050 2058 2066 2074 2082 2090
2
3
4
5
6
7
8
Real return on capital
-4
0
4
8
12
16
20
24
28
32
36
1954 1962 1970 1978 1986 1994 2002 2010 2018 2026 2034 2042 2050 2058 2066 2074 2082 2090
-4
0
4
8
12
16
20
24
28
32
36
Ratio of national savings to GDP
13
23
33
43
53
63
73
1954 1962 1970 1978 1986 1994 2002 2010 2018 2026 2034 2042 2050 2058 2066 2074 2082 2090
13
23
33
43
53
63
73Wage-Income tax rate
8
18
28
38
48
58
68
1954 1962 1970 1978 1986 1994 2002 2010 2018 2026 2034 2042 2050 2058 2066 2074 2082 2090
8
18
28
38
48
58
68
Projected
Simulated
Old-Age dependency ratio
ECO/WKP(98)14
24
Figure 2United States
Ageing only Fiscal consolidationGradual removal of public old-age pensions Increased retirement age
2
3
4
5
6
7
8
1954 1962 1970 1978 1986 1994 2002 2010 2018 2026 2034 2042 2050 2058 2066 2074 2082 2090
2
3
4
5
6
7
8
Real return oncapital
-4
0
4
8
12
16
20
24
28
32
36
1954 1962 1970 1978 1986 1994 2002 2010 2018 2026 2034 2042 2050 2058 2066 2074 2082 2090
-4
0
4
8
12
16
20
24
28
32
36
Ratio of national savings to GDP
13
23
33
43
53
63
73
1954 1962 1970 1978 1986 1994 2002 2010 2018 2026 2034 2042 2050 2058 2066 2074 2082 2090
13
23
33
43
53
63
73Wage-Income tax
8
18
28
38
48
58
68
1954 1962 1970 1978 1986 1994 2002 2010 2018 2026 2034 2042 2050 2058 2066 2074 2082 2090
8
18
28
38
48
58
68
Projected
Simulated
Old-Age dependency ratio

ECO/WKP(98)14
25
Table 4. Effects of Policy Reform on Wage-income Tax Rates and National Savings (Per cent difference from baseline)
Scenario I: Gradual removal of public old-age pensions (Pension Reform I)
Canada France Italy Japan Sweden United Kingdom United States
Wage National saving Wage National saving Wage National saving Wage National saving Wage National saving Wage National saving Wage National saving
tax rate rate tax rate rate tax rate rate tax rate rate tax rate rate tax rate rate tax rate rate
2002 -0.1 1.2 0.0 1.7 -0.1 0.8 -0.1 1.7 0.0 1.5 0.3 -0.5 -0.1 1.02010 -0.3 2.2 -0.1 3.0 -0.1 1.5 -0.3 3.1 -0.1 2.8 0.4 0.1 -0.2 1.92018 -0.7 3.6 -1.1 5.2 -0.3 3.0 -1.9 5.3 -0.5 4.7 2.7 0.8 -0.1 3.22050 -17.3 14.3 -18.0 23.6 -10.4 45.1 -25.2 18.5 -8.1 17.6 -6.8 8.2 -18.1 9.9
Long run -19.7 8.3 -17.7 10.6 -28.8 6.2 -27.1 9.5 -14.4 11.9 -12.4 5.8 -23.2 7.6(2194)
Scenario II: 20 per cent reduction in the replacement rate policy (Pension Reform II)
Canada France Italy Japan Sweden United Kingdom United StatesWage National saving Wage National saving Wage National saving Wage National saving Wage National saving Wage National saving Wage National saving
tax rate rate tax rate rate tax rate rate tax rate rate tax rate rate tax rate rate tax rate rate
2002 -3.0 1.1 -3.1 1.6 -2.1 1.0 -4.3 1.3 -1.5 1.6 -1.8 0.9 -3.5 1.12010 -3.3 1.3 -3.4 2.1 -2.4 1.5 -4.8 1.8 -1.6 2.1 -1.9 1.1 -3.7 1.32018 -3.6 1.6 -3.7 2.5 -2.6 2.1 -5.2 2.3 -1.8 2.5 -2.0 1.3 -4.0 1.52050 -4.3 2.6 -4.3 3.7 -2.8 7.6 -5.6 3.0 -2.2 3.4 -2.4 1.7 -4.5 1.8
Long run -3.9 1.5 -3.6 1.8 -2.8 1.1 -4.9 1.6 -1.5 2.1 -2.1 1.1 -4.2 1.3(2194)
Scenario III: Fiscal Consolidation
Canada France Italy Japan Sweden United Kingdom United StatesWage National saving Wage National saving Wage National saving Wage National saving Wage National saving Wage National saving Wage National saving
tax rate rate tax rate rate tax rate rate tax rate rate tax rate rate tax rate rate tax rate rate
2002 22.0 3.7 13.4 3.8 14.3 3.5 23.4 3.0 11.8 5.7 20.4 5.2 24.6 3.82010 8.3 5.1 7.9 5.6 6.9 5.7 12.2 4.4 6.6 8.2 9.4 6.9 9.0 5.12018 -10.2 6.8 -7.7 7.9 -7.7 9.4 -8.3 6.3 -2.4 11.5 -6.4 8.9 -11.0 6.32050 -13.6 15.2 -10.5 18.3 -13.0 66.3 -10.9 12.3 -6.1 22.1 -10.2 15.9 -13.7 10.3
Long run -12.4 8.2 -8.5 8.1 -11.6 6.7 -6.3 6.5 -5.3 11.5 -8.2 9.4 -12.1 7.5(2194)
Scenario IV: Increased retirement age
Canada France Italy Japan Sweden United Kingdom United StatesWage National saving Wage National saving Wage National saving Wage National saving Wage National saving Wage National saving Wage National saving
tax rate rate tax rate rate tax rate rate tax rate rate tax rate rate tax rate rate tax rate rate
2002 -8.6 -0.9 -10.3 1.9 -6.6 0.1 -13.4 -1.1 -6.8 -0.2 -6.2 -2.5 -9.5 -0.22010 -11.1 -1.4 -13.0 1.6 -9.3 1.0 -16.5 -0.4 -8.6 0.8 -8.2 -3.4 -11.5 -1.32018 -12.9 -1.3 -15.1 2.3 -11.1 3.1 -17.8 0.6 -10.0 3.1 -9.6 -3.4 -13.1 -1.62050 -16.3 2.3 -19.0 7.4 -15.7 45.7 -20.0 2.3 -13.0 8.1 -12.3 -0.4 -15.5 -1.0
Long run -13.6 -1.2 -15.1 -0.2 -13.9 -1.8 -15.5 -1.3 -11.6 0.6 -9.9 -3.3 -14.1 -1.8(2194)
ECO/WKP(98)14
26
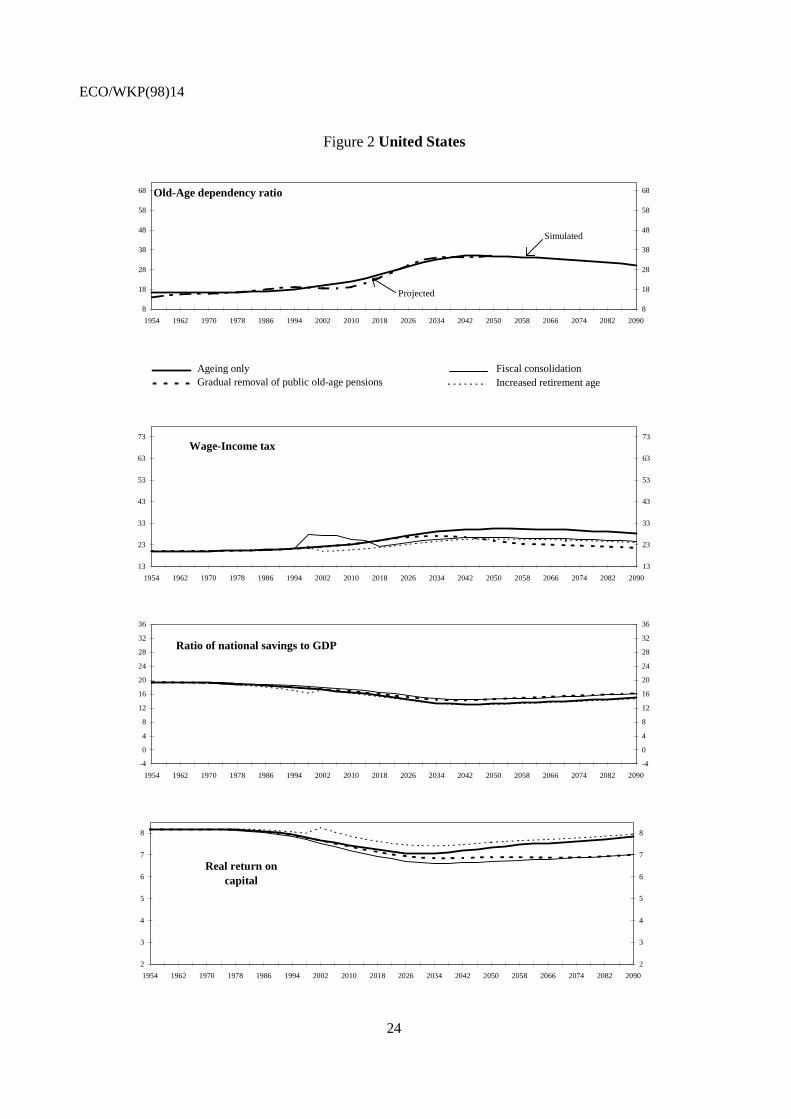
Table 5. Effects of policy reform on net real wages and real return on capital 1 (Per cent difference from baseline)
Scenario I: Gradual removal of public old-age pensions (Pension Reform I)
Canada France Italy Japan Sweden United Kingdom United States
Net real Real return Net real Real return Net real Real return Net real Real return Net real Real return Net real Real return Net real Real return
wages on capital wages on capital wages on capital wages on capital wages on capital wages on capital wages on capital
2002 0.2 -0.3 0.2 -0.6 0.1 -0.2 0.3 -0.9 0.2 -0.5 -0.3 0.6 -2.6 -0.22010 0.4 -0.7 0.4 -1.1 0.3 -0.5 0.6 -1.8 0.4 -1.0 -0.3 0.5 0.3 -0.62018 0.8 -1.3 1.4 -2.0 0.6 -0.8 1.7 -3.1 1.1 -1.9 -0.3 0.3 0.5 -1.22050 14.4 -6.7 20.9 -10.6 20.9 -5.6 21.2 -14.0 16.2 -9.0 5.1 -2.8 10.4 -6.1
Long run 13.1 -9.6 17.2 -15.0 29.5 -9.4 14.3 -14.7 22.7 -15.7 7.5 -6.5 11.8 -9.1(2194)
Scenario II: 20 per cent reduction in the replacement rate policy (Pension Reform II)
Canada France Italy Japan Sweden United Kingdom United States
Net real Real return Net real Real return Net real Real return Net real Real return Net real Real return Net real Real return Net real Real return
wages on capital wages on capital wages on capital wages on capital wages on capital wages on capital wages on capital
2002 1.3 -0.7 2.1 -1.0 1.4 -0.6 1.7 -1.3 1.8 -1.1 0.9 -0.6 1.3 -0.72010 1.6 -0.9 2.6 -1.4 2.0 -0.8 2.3 -1.7 2.2 -1.4 1.0 -0.7 1.5 -1.02018 2.0 -1.1 3.1 -1.9 2.6 -1.1 3.0 -2.3 2.7 -1.9 1.2 -0.9 1.8 -1.22050 3.7 -2.1 5.2 -3.5 5.9 -2.4 4.8 -4.0 4.6 -3.2 2.0 -1.5 2.7 -1.9
Long run 2.5 -1.8 4.0 -2.8 1.0 -1.8 2.5 -2.7 2.8 -3.0 1.3 -1.3 2.1 -1.7(2194)
Scenario III: Fiscal Consolidation
Canada France Italy Japan Sweden United Kingdom United States
Net real Real return Net real Real return Net real Real return Net real Real return Net real Real return Net real Real return Net real Real return
wages on capital wages on capital wages on capital wages on capital wages on capital wages on capital wages on capital
2002 -6.7 -1.7 -7.4 -2.0 -7.7 -1.6 -6.4 -2.4 -11.1 -3.1 -6.7 -2.3 -6.3 -1.82010 -2.1 -2.6 -4.1 -3.0 -3.9 -2.5 -3.7 -3.6 -6.1 -4.5 -2.6 -3.4 -1.7 -2.92018 6.0 -3.6 6.7 -4.4 7.9 -3.7 5.3 -5.1 4.9 -6.4 4.7 -4.8 5.2 -4.02050 13.2 -9.5 14.0 -11.9 28.8 -12.0 10.9 -12.4 15.2 -15.4 10.4 -10.7 9.6 -8.7
Long run 9.8 -9.5 9.7 -11.8 15.0 -10.9 5.5 -10.4 11.6 -15.8 7.4 -10.3 7.8 -9.0(2194)
Scenario IV: Increased retirement age
Canada France Italy Japan Sweden United Kingdom United States
Net real Real return Net real Real return Net real Real return Net real Real return Net real Real return Net real Real return Net real Real return
wages on capital wages on capital wages on capital wages on capital wages on capital wages on capital wages on capital
2002 0.1 6.7 2.4 11.6 0.7 8.4 0.8 11.6 3.5 11.6 -1.1 9.7 -0.1 7.42010 1.6 6.1 5.2 9.6 3.3 8.1 3.1 11.2 6.7 9.8 0.3 8.6 1.3 5.92018 3.1 6.0 7.7 8.4 6.4 7.8 5.4 10.1 10.1 8.1 1.5 8.2 2.3 5.52050 9.4 2.5 17.4 1.5 27.0 1.8 11.6 4.9 21.6 -1.7 5.5 5.0 5.6 3.1
Long run 5.1 1.6 9.7 0.2 11.8 0.3 4.5 2.2 14.1 -1.7 2.4 4.1 3.9 2.3(2194)
1) Net wage per efficiency unit of labour.

ECO/WKP(98)14
27
Table 6. Effects of policy reform on GDP and consumption (Per cent difference from baseline)
Scenario I: Gradual removal of public old-age pensions (Pension Reform I)
Canada France Italy Japan Sweden United Kingdom United StatesPer capita Per capita Per capita Per capita Per capita Per capita Per capita Per capita Per capita Per capita Per capita Per capita Per capita Per capita
GDP consumption GDP consumption GDP consumption GDP consumption GDP consumption GDP consumption GDP consumption
2002 0.1 -0.2 0.2 -0.4 0.1 -0.2 0.3 -0.4 0.1 -0.6 -0.2 -0.2 0.1 -0.22010 0.3 -0.2 0.3 -0.5 0.2 -0.2 0.5 -0.4 0.3 -0.8 -0.2 -0.4 0.2 -0.22018 0.5 -0.2 0.6 -0.6 0.3 -0.3 0.9 -0.4 0.5 -0.9 -0.1 -0.4 0.5 -0.22050 2.8 1.6 3.3 0.8 2.1 0.9 4.1 1.2 2.8 0.5 1.0 0.1 2.3 1.1
Long run 4.3 4.1 5.2 4.2 3.9 3.7 4.8 2.5 5.1 5.4 -8.5 2.5 3.6 3.0(2194)
Scenario II: 20 per cent reduction in the replacement rate policy (Pension Reform II)
Canada France Italy Japan Sweden United Kingdom United StatesPer capita Per capita Per capita Per capita Per capita Per capita Per capita Per capita Per capita Per capita Per capita Per capita Per capita Per capita
GDP consumption GDP consumption GDP consumption GDP consumption GDP consumption GDP consumption GDP consumption
2002 0.3 0.1 0.3 -0.1 0.2 -0.1 0.4 0.0 0.3 -0.2 0.2 0.1 0.3 0.12010 0.4 0.2 0.4 0.0 0.3 0.0 0.5 0.0 0.4 -0.1 0.3 0.1 0.4 0.12018 0.5 0.3 0.5 0.1 0.4 0.1 0.6 0.2 0.5 0.1 0.3 0.2 0.4 0.22050 0.9 0.9 1.1 1.1 0.9 1.1 1.1 0.9 1.0 1.3 0.5 0.6 0.7 0.6
Long run 0.8 0.8 0.9 0.8 0.7 0.7 0.8 0.5 0.9 1.1 0.5 0.5 0.6 0.6(2194)
Scenario III: Fiscal Consolidation
Canada France Italy Japan Sweden United Kingdom United StatesPer capita Per capita Per capita Per capita Per capita Per capita Per capita Per capita Per capita Per capita Per capita Per capita Per capita Per capita
GDP consumption GDP consumption GDP consumption GDP consumption GDP consumption GDP consumption GDP consumption
2002 0.7 -0.2 0.6 -0.5 0.6 -0.5 0.7 -0.3 0.9 -1.3 0.8 -0.2 0.7 -0.12010 1.1 0.1 0.9 -0.5 0.9 -0.4 1.0 -0.2 1.3 -1.3 1.2 0.1 1.1 0.12018 1.5 0.4 1.3 -0.3 1.3 -0.2 1.4 0.0 1.8 -0.9 1.7 0.6 1.5 0.42050 4.1 3.4 3.7 2.7 4.6 4.1 3.6 2.1 4.9 4.3 4.0 3.8 3.4 2.5
Long run 4.3 4.0 4.0 3.4 4.6 4.5 3.3 1.8 5.2 5.7 4.0 3.9 3.5 2.9(2194)
Scenario IV: Increased retirement age
Canada France Italy Japan Sweden United Kingdom United StatesPer capita Per capita Per capita Per capita Per capita Per capita Per capita Per capita Per capita Per capita Per capita Per capita Per capita Per capita
GDP consumption GDP consumption GDP consumption GDP consumption GDP consumption GDP consumption GDP consumption
2002 1.2 2.1 2.7 3.9 2.0 3.2 1.8 2.9 1.9 5.0 0.9 2.4 1.4 2.02010 2.4 4.2 4.4 6.9 3.8 5.9 4.0 5.7 3.3 7.9 2.0 4.4 2.5 3.92018 3.5 5.9 5.9 9.3 5.4 8.3 5.8 7.9 4.6 10.3 2.8 5.9 3.4 5.32050 7.0 11.0 10.2 16.5 11.6 18.2 9.6 13.4 8.2 19.0 5.1 9.5 5.7 8.5
Long run 4.4 7.3 6.2 11.1 4.6 8.9 4.4 6.6 5.6 14.2 2.9 6.2 4.1 6.5(2194)

ECO/WKP(98)14
28
35. All the above simulations suggest a number of general observations (Figure 2). First, theincrease in the wage-income tax rate and the decline in national saving and capital returns, are inevitable,with or without the simulated policy reforms. Second, compared with the wage-income tax rate, thenational saving path is less sensitive to policy reforms in most cases. Third, except for the increase inretirement age scenario, it takes a long time for the policy reforms to have significant macroeconomicimpacts. Fourth, the gradual removal policy reform is the most effective in the long run, but the increasein retirement age scenario is the most effective in the short and medium run. Fifth, despite the largeincrease in wage-income taxes, the simulation results suggest that population ageing will increase the (netof tax) wage rate-capital return ratio (Table 5).
36. The first three simulations illustrate the effects of reducing the generosity of the pension system.Although the effects are large in the long run, in the short to medium-term they are rather small. In thecase of a reduction of as much as 20 per cent in pension benefits (for current and future retirees), thewage-income tax rate (Table 4) falls by only 1.8 to 5.2 per cent by 2018 and national saving rate increasesby 1.3 to 2.5 per cent. Similarly, in most countries, significant effects of a gradual but full removal of thepension system only materialise around 2030-2040, which is too late to prevent a sharp rise in the wage-income tax. The exception is France, where the effects are sufficient to prevent a sharp rise in the wage-income tax (see Figure 2). Noteworthy is the fact that the fiscal consolidation scenario has significantmedium and long-term effects on the wage-income tax, saving and interest rates, and hence illustrates thepotential use of fiscal consolidation to smooth the rise in future tax increases. However, the large effectsfrom fiscal consolidation come at the expense of a sharp temporary increase in the wage-income tax and adrop in per capita consumption.
37. The simulated rise in the retirement age has significant effects on per capita consumption andthe wage tax rate with a negligible effect on aggregate saving9. The increase in per capita consumptionand the fall in the wage tax reflect the rapid reduction in the number of retirees and a correspondingincrease in the number of wage-tax contributors. In contrast to the fiscal consolidation scenario, percapita consumption rises even in the short run and by more than per capita GDP, relative to the baseline.This is due to the fact that the larger labour force allows less of the extra output to be devoted to saving, sothat the permanent increase in consumption per capita are larger. Gains to GDP and consumption aresomewhat smaller in the long run than in the mid-21st century because in the long run dependency ratiosare assumed to fall back from their peaks, thus reducing the relative increase in the labour force. Inassessing welfare, the gains from increased consumption would have to be set against reduced leisure10.
38. The specific country effects depend on a combination of institutional, demographic andeconomic factors. As all calibrated parameters differ across countries, it is difficult to identify the factorsthat explain the different macroeconomic impacts of policy reforms when comparing countries. However,the simulations suggest that policy reform would be more successful in offsetting the effects from ageingin countries with initially high steady-state wage income tax rate and high pension benefit replacementrate, but with moderate increase in the old-age dependency ratio. Among the seven countries examined,France has the second highest pension benefit replacement rate, the second highest initial wage-incometax rate, but its old-age dependency ratio is projected to increase moderately. These factors may explainthe comparably larger macroeconomic effects (see Figure 2) of the gradual removal and increasedretirement age scenarios in France. The latter scenario has also relatively larger effects in Canada,
9. The exception is Italy, where the per cent difference for national saving rate tends to be large at some pointsince the baseline rate is very low.
10. It is noteworthy that for Canada, France, Sweden and the United States, this scenario results in short-run dipin the wage-income tax rate below its 1954 level.

ECO/WKP(98)14
29
Sweden and the United States, that is, in countries with relatively high replacement rates and moderatelyageing populations. Partly due to previous pension reforms, the United Kingdom has a very lowreplacement rate. The design of the gradual removal scenario is such that it implies a temporary increasein the generosity of pension benefits for some cohorts in this country. This is why the United Kingdomsuffers from an increase in the wage-income tax rate in the short and medium-term, under the gradualremoval scenario. In Italy and Japan, the effects of the reforms in comparison with the baseline scenarioare important in absolute terms, but their highly and rapidly ageing populations remain the dominatingfactor in determining the direction and magnitude of the macroeconomic outcomes.
39. As a final comment, note that a debt-financed transition to a funded policy system is not directlyrepresented in any of the simulations. Such a reform could be done by simply recognising outstandingpension liabilities by the distribution of conventional debt. Such a simulation would be similar to acombination of Scenario I (“Removal of the old-age pension system”) and theoppositeof Scenario III(“Fiscal consolidation”). If “old” pension liabilities were converted into conventional debt as they comedue, the debt-finance scenario would result in anincreasein conventional debt to GDP ratio, equal to thereduction in unfunded pension liabilities in the PAYG system. As a consequence, the net effect onnational saving would be negligible11, since the government deficit would offset the increase in privatesaving.
Concluding comments
40. The simulations presented here suggest that a reduction in the generosity of the public sectorpension system would alleviate the problems linked to the rapidly ageing populations in two ways: first,through a direct reduction in the fiscal burden of future pension liabilities; second, through an increase innational saving and future potential output. However, these positive effects would only be realised if thereduction in the generosity of the pension system were “financed” by taxation or the present value ofaccrued pension liabilities were cut for instance by an across-the-board reduction in the replacement rate.A debt-financed transition runs the risk of being counterproductive, as an increase in conventionalgovernment debt would crowd out private investment more or less proportional to the increase in privatesaving.
41. The simulated effects of policy reforms on saving and taxes are, in most cases, rather small andovershadowed by the effects of increased ageing. Thus, in order to prevent dramatic increases in futuretaxes, more drastic cuts in benefits, or a combination of the simulated measures, are necessary. A generalreduction in benefits could usefully be supported by partial "privatisation" of the pension system,introduced gradually for new entrants to the labour market, together with the removal of incentives forearly retirement. In the same vein, fiscal consolidation, either in the form of repayment of public debt orthe accumulation of pension fund assets, could also be used to alleviate future pressures on the pensionsystem.
42. The short-term costs of reform are significant. Most of the simulated policy reforms result in asustained period of depressed per capita consumption of goods or leisure (Table 6). Only after about 12 to20 years, would the income increase be sufficiently large to offset the reduction in the propensity toconsume. While an increase in the retirement age seems to be most effective in reducing the need forfuture tax increases, it comes at the cost of reducing life-time leisure. All the other reforms are, in fact,very similar and entail increased national saving, either as a result of a reduction in expected pension
11. Unless workers are credit constrained as in Cifuentes and Valdes-Prieto (1995).

ECO/WKP(98)14
30
benefits or increases in public saving (fiscal consolidation). The combination of short-term costs andlong-term gains implies inter-generational welfare redistribution; it is very difficult to introduce a reformwhere all generations experience a net increase in life-time consumption, unless the overall efficiencygains are very large.
43. There are reasons to believe that the simulations underestimate the efficiency gains from thereforms, or overestimate the negative effects of ageing populations. First, the assumption concerning afixed individual labour supply omits any positive effects on output and welfare derived from reducedlabour market distortions. Second, a purely neo-classical production function does not include anypositive spillover effects from increased investment in human capital, for example, as predicted in the"new growth theory". Indeed, the increase in the ratio of the wage to the rate of return on capital obtainedin the simulations supports the presumptions that ageing populations may stimulate labour supply andhuman capital investment. Third, the saving effect from mandatory and funded pension schemes might belarger than simulated, due to effective borrowing constraints, making it difficult for many households tooffset the effects of "forced saving". Fourth, the closed economy assumption results in a decline in theaverage rate of return on capital. With an open economy, the depressive effect on the rate of return shouldbe smaller, as the current account would absorb the “excess saving”, unless the whole world is ageing andevery country follow the same policy12.
44. In spite of the uncertainties attached to the size of the effects, the simulations presented hereshow that there is no easy way to reduce the burden of the projected increase in the number of olderpeople relatively to those of working-age. To the extent that ageing implies that a larger share of thepopulation contribute less to productive activities, the society at large can only alleviate the pressures onfuture working-age populations by either increasing the productive capacity or through increased nationalsaving, i.e. foregoing current consumption. The simulations also show that most pension reform proposalswould require much time before having a significant effect on saving and incomes. To the extent thatpolicy actions can alleviate the economic burden of ageing, it should act on a broad front, involving acombination of reduced pension benefits, fiscal consolidation, an increase in the retirement age at least inline with increased longevity, as well as policies to improve the allocation of resources and promoteeconomic growth.
12. See Turneret al.,1998.

ECO/WKP(98)14
31
BIBLIOGRAPHY
Arrau, Patricio and Klaus Schmidt-Hebbel (1993), “Macroeconomic and IntergenerationalWelfare Effects of a Transition from Pay-as-you-go to Fully-funded pensions System”,background paper to the World Bank study on old-age security.
Auerbach, Alan J, and Laurence J. Kotlikoff (1987),Dynamic Fiscal Policy, CambridgeUniversity Press.
Auerbach, Alan J., Laurence J. Kotlikoff, Robert P. Hagemann and Guiseppe Nicoletti (1989),“The Economic Dynamics of an Ageing Population: the Case of Four OECD Countries”,OECD Economic Studiesno. 12.
Barro, Robert (1978),The Impact of social security on private savings. Washington, DC:American Enterprise Institute.
Boyle, Phelim and John Murray (1979), "Social security wealth and private saving in Canada",Canadian Journal of Economics,No. 12 :3 August . pp. 456-69.
Broer, D.P. and E.W.M.T. Westerhout (1996), “Pension Policies and Lifetime Uncertainty in anApplied General Equilibrium Model”, inPension Policies and Public Debt in DynamicCGE Models, ETLA.
Browning, M.J. (1982), "Savings and Pensions: Some UK evidence",Economic Journal,No. 92:December, pp. 954-63.
Cazes, Sandrine, Thierry Chauveau, Jacques Le Cacheux and Rahim Loufir, (1992) “An OLGmodel of the French Economy Studying the Long-run Prospects of the Public PensionScheme”,Document de travail, Observatoire Française des Conjunctures Economiques.
Chaveau, Thierry and Rahim Loufir (1997), “The Future of Public Pensions in the Seven MajorEconomies”, inPension Policies and Public Debt in Dynamic CGE Models, ETLA.
Cifuentes, Rodrigo and Salvador Valdes-Prieto (1995) “Transitions in the presence of creditconstraints”, inThe Economics of Pensionsedited by Salvador Valdes-Prieto, CambridgeUniversity Press.
Cifuentes, Rodrigo and Salvador Valdés-Prieto, (1996) “Fiscal Effects of Pension Reform: ASimple Simulation Model”, paper prepared for the World Bank conference onPensionSystems: from Crisis to Reform.

ECO/WKP(98)14
32
Cutler, D., James M. Poterba, Louise M. Steiner and Lawrence H. Summers (1990), “An AgingSociety: Opportunity or Challenge?”,Brookings Papers on Economic Activity, 1990No. 1,pp. 1-73.
Davis, E. Philip (1997),Can Pension Systems Cope? Population Ageing and Retirement IncomeProvision in the European Union, Royal Institute for International Affairs, London.
Diamond, Peter A. (1965), “National Debt in a Neoclassical Growth Model”,American EconomicReview55, 5 (December), pp. 1126-1150.
Engen, Eric M., William G. Gale, and John Karl Scholz (1994), "Do Savings Incentives Work?",Brookings Papers on Economic Activity,No. 2 . pp. 85-180.
Engen, Eric M., William G. Gale, and John Karl Scholz (1996), "The Illusory Effects of SavingIncentives on Savings",Journal of Economic Perspectives,No. 10 :4, pp. 113-38.
Feldstein, Martin (1974), "Social Security, induced retirement and aggregate capital formation",Journal of Political Economy,No. 82 :September/October no. 5 . pp. 905-26.
Feldstein, Martin (1978), "Do Private Pensions Increase National Savings?",Journal of PublicEconomics,No. 10 . pp. 277-93.
Feldstein, Martin (1980), "International Differences in Social Security and Savings",Journal ofPublic Economics,No. 14 :2 . pp. 225-44.
Feldstein, Martin (1996), "Social Security and Savings: New Time Series Evidence",NationalTax Journal,No. 49 :2 . pp. 151-64.
Graham, J.W. (1987), “International Differences in Savings Rates and the Life Cycle Hypothesis,”European Economic Review, Vol. 31, pp. 1509-29.
Grossman, Stanford, and Robert J. Shiller (1981), “The Determinants of the Variability of StockMarket Prices,”American Economic Review, vol.71, no.2.
Hagemann, R.P. and G. Nicoletti (1989), “Population Ageing: Economic Effects and Some PolicyImplications for Financing Public Pensions”,OECD Economic Studies(12): 51-96.
Hubbard, R. Glenn (1986), "Pension Wealth and Individual Savings",Journal of Money, Creditand Banking,No. 18 :2 . pp. 167-78.
Jappelli, Tullio. (1995), "Does social security reduce the accumulation of private wealth?Evidence from Italian Survey Data",Ricerche Economiche,No. 49 . pp. 1-31.
Kenc, Turalay and William Perraudin (1996) “Demography, Pensions and Welfare: FertilityShocks and the Finnish Economy”,VATT-Discussion Paper.
Kenc, Turalay and William Perraudin (1996), “Pensions Systems in Europe: A GeneralEquilibrium Study”, inPension Policies and Public Debt in Dynamic CGE Models, ETLA.

ECO/WKP(98)14
33
Kohl, Richard and Paul O’Brien (1998), “The Macroeconomics of Ageing, Pensions and Savings:A Survey”, Ageing Working Paper Series, OECD Economics Department Working paperNo. 200.
Kotlikoff, Laurence J. (1979), "Testing the Theory of Social Security and Life CycleAccumulation", American Economic Review,No. 69 :3 . pp. 396-410.
Kotlikoff, Laurence J. and Alan J. Auerbach (1983), "An Examination of Empirical Tests ofSocial Security and Savings", in E. Helpman (ed.),Social Policy Evaluation: An EconomicPerspective, Academic Press, New York.
Kotlikoff, Laurence J., Kent Smetter and Jan Walliser (1996), “Privatizing US Social Security - ASimulation Study”, paper prepared for the World Bank conference onPension Systems:from Crisis to Reform.
Leibfritz, W., D. Roseveareet al. (1995), “Ageing populations, pension systems and governmentbudgets: how do they affect savings?”,OECD Economics Department Working Paper(156).
Magnussen, Knut A. (1994), “Old-Age Pensions, Retirement Behaviour and Personal Saving: ADiscussion of the Literature”,Social and Economic Studiesno.87, Statistics Norway.
Mankiw, N. Gregory (1981), “The Permanent Income Hypothesis and the Real Interest Rate,”Economic Letters, vol. 7.
Mankiw, N. Gregory (1985), “Consumer Durables and the Real Interest Rate,”Review ofEconomics and Statistics.
Mankiw, N. Gregory, Juilo J. Rotemberg, and Lawrence H. Summers (1985), “IntertemporalSubstitution in Macroeconomics,”Quarterly Journal of Economics.
Masson, P., T. Bayoumi, J. Samiei (1996), “International evidence on the Determinants of PrivateSavings”,CEPR Discussion Paper No.1368.
Munnell , Alicia and Frederick Yohn (1992), "What is the Impact of Pensions on Savings?", inZvi Bodie and Alicia Munnell (ed.),Pensions in the Economy: Sources, Uses andLimitations of Data, University of Pennsylvania Press,
Miles, David (1997), “Demographics and Saving: Can We Reconcile the Evidence?”,IFSWorking Paper, London.
Orr, Adrian, Malcolm Edey and Michael Kennedy (1995), “The Determinants of Real Long-termInterest Rates: 17 Country Pooled-Time-Series Evidence”,Economics Department WorkingPapersno 155, OECD.
Perraudin and Kenc (1996), “Demography, Pensions and Welfare: Fertility Shocks and theFinnish Economy”.VATT-Discussion Papersno. 131, Helsinki 1996.

ECO/WKP(98)14
34
Roseveare, Deborah, Willi Leibfritz, Douglas Fore and Eckhard Wurzel (1996), “AgeingPopulations, Pension Systems and Government Budgets: Simulations for 20 OECDCountries”,Economics Department Working Papersno. 168, OECD.
Samuelson, P.A. (1975), “Optimum Social Security in a Life-Cycle Growth Model”,InternationalEconomic Review16, pp 539-544.
Siebert, Horst (1998), “Pay-As-You-Go Versus Capital Funded Pensions Systems: The Issues”, inSiebert (ed.)Redesigning Social Security, Kiel.
Turner, Dave, Claude Giorno, Alain De Serres, Ann Vourc’h and Peter Richardson (1998), “TheMacroeconomic Implications of Ageing in a Global Context”, OECD,EconomicsDepartment Working Papers no. 193.
Weber, Warren E. (1970), “The Effect of Interest Rates on Aggregate Consumption”,AmericanEconomic Review, vol. 60, no. 4, September.
Weil, David N. (1994), “The Saving of the Elderly in Micro and Macro Data”,Quarterly Journalof Economics,Vol 109, pp. 55-82.
World Bank (1994),Averting the Old Age Crisis. Oxford: Oxford University Press.
ECO/WKP(98)14
35
ECONOMICS DEPARTMENTWORKING PAPERS
200. The macroeconomics of ageing, pensions and savings: a survey(June 1998) Richard Kohl and Paul O’Brien
199. Marginal Effective Tax Rates on Physical, Human and R&D Capital(May 1998) Kathryn Gordon and Harry Tchilinguirian
198. The Norwegian Health Care System(May 1998) Paul van den Noord, Terje Hagen and Tor Iversen
197. APEC Trade Liberalisation : Its Implications(May 1998) Seunghee Han and Inkyo Cheong
196. The OECD Jobs Strategy : Progress Report on Implementation of Country Specific Recommendations(May 1998)
196 La Strategie de l’OCDE pour l’emploi : rapport sur l’état d’avancement de la mise en oeuvre desrecommandations par pays(May 1998)
195. Trends in OECD Countries’ International Competitiveness(April 1998) Martine Durand, Christophe Madashi and Flavia Terribile
194. The European Union’s Trade Policies and their Economic Effects(April 1998) Peter Hoeller, Nathalie Girouard and Alessandra Colecchia
193. The Macroeconomic Implications of Ageing in a Global Context(March 1998) Dave Turner, Claude Giorno, Alain De Serres, Ann Vourc’h and Pete Richardson
192. Efficiency and Distribution in Computable Models of Carbon Emission Abatement(March 1998) Joaquim Oliveira Martins and Peter Sturm
191. Monetary Policy when Inflation is Low(March 1998) Charles Pigott and Hans Christiansen
190. Submission by the OECD to the G8 Growth, Employability and Inclusion Conference(March 1998)
189. Income Distribution and Poverty in Selected OECD Countries(March 1998) Jean-Marc Burniaux, Thai-Thanh Dang, Douglas Fore, Michael Förster,Marco Mira d’Ercole and Howard Oxley
188. Asset Prices and Monetary Policy(February 1998) Mike Kennedy, Angel Palerm, Charles Pigott and Flavia Terribile
187. NAIRU: Incomes Policy and Inflation(January 1998) Silvia Fabiani, Alberto Locarno, Gian Paolo Oneto and Paolo Sestito
186. OECD Submission to the Irish National Minimum Wage Commission(December 1997)
ECO/WKP(98)14
36
185. OECD Submission to the UK Low Pay Commission(December 1997)
184. Concept, Measurement and Policy Implications of the NAIRU - Perspective from Belgium(October 1997) Joost Verlinden
183. Structural unemployment in Denmark(September 1997) Agnete Gersing
182. The United Kingdom NAIRU: Concepts, Measurement and Policy Implications(September 1997) Chris Melliss and A.E. Webb
181. Globalisation and Linkages: Macro-Structural Challenges and Opportunities(August 1997) Pete Richardson
180. Regulation and Performance in the Distribution Sector(August 1997) Dirk Pilat
179. Measurement of Non-tariff Barriers(July 1997) Alan Deardorff and Robert M. Stern
178. The NAIRU-Concept: A Few Remarks(July 1997) Karl Pichelmann and Andreas Ulrich Schuh
177. Structural Unemployment in Finland(July 1997) Pasi Holm and Elina Somervouri
176. Taxation and Economic Performance(June 1997) Willi Leibfritz, John Thornton and Alexandra Bibbee
175. Long-Term Interest Rates in Globalised Markets(May 1997) Hans Christiansen and Charles Pigott
174. International Implications of European Economic and Monetary Union(May 1997) Norbert Funke and Mike Kennedy
173. The NAIRU in Japan: Measurement and its implications(March 1997) Fumihira Nishizaki
172. The Unemployment Problem - A Norwegian Perspective(February 1997) Steinar Holden
171. The Reliability of Quarterly National Accounts in Seven Major Countries: A User’s Perspective(February 1997) Robert York and Paul Atkinson
170. Confidence Indicators and their Relationship to changes in Economic Activity(November 1996) Teresa Santero and Niels Westerlund.
169. Labour Productivity Levels in OECD Countries. Estimates for Manufacturing and Selected Service Sectors(September 1996) Dirk Pilat
168. Ageing Populations, Pension Systems and Government Budgets: Simulations for 20 OECD Countries(September 1996) Deborah Roseveare, Willi Leibfritz, Douglas Fore and Eckhard Wurzel