Embed Size (px)
Citation preview
Macroeconomic Labor Productivity and Its Impact on Firm’s Profitability
Journal of the Operational Research Society August 2013
K. Choi and M. Haque
Texas A&M University, College Station, USA
H. W. Lee
Oregon State University, Corvallis, USA
Y. K. Cho
University of Nebraska-Lincoln, Omaha, USA
Y. H. Kwak
George Washington University, Washington DC, USA
This is a post-peer-review, pre-copyedit version of an article published in Journal of the Operational Research
Society. The definitive publisher-authenticated version (Choi, K., Haque, M., Lee, H.W., Cho, Y.K., & Kwak, Y.H. (2013). Macroeconomic labour productivity and its impact on firm's profitability. Journal of the Operational Research Society, 64(8),
1258-1268. doi:10.1057/jors.2012.157) is available online at: http://www.palgrave-journals.com/jors/index.html.
Macroeconomic Labor Productivity and Its Impact on Firm’s Profitability !
ABSTRACT
The construction industry is one of the largest sectors in the U.S. economy, yet little is known about the
key macroeconomic parameters that affect its industry’s structure and performance. The main objectives
of this research are 1) to analyze the macroeconomic performance of construction industry as a whole and
at fourteen of its sub-sectors in terms of labor productivity, gross margin, and worker’s wages; and 2) to
develop a quantitative model that predicts a firm’s profitability by analyzing various levels of labor
productivity. The results of a non-linear regression analysis based on the comprehensive U.S. Economic
Census data show that the construction industry’s sub-sectors with the highest productivity are the most
profitable with regard to the gross margins that they are able to generate. This study and its model will
help decision makers better assess macroeconomic performance and conduct trend analysis of the
construction industry to serve as a basis for developing strategic roadmap for the future.
Keywords: Labor Productivity, Gross Margin, Construction, Project Management, Regression Analysis
! 2!
1 INTRODUCTION
Construction industry is an integral part of any nation’s economy, whether measured by dollar volume or
workforce size. In the United States, the value of construction work put in place was almost $837 billion,
or about 8% of the Gross National Product (GNP) in 2007 (U.S. Census Bureau, 2012). The industry also
accounted for the employment of more than 8.1 million people and nearly 1.5 million people in related
fields (U.S. Census Bureau, 2011a). However, research on labor productivity and performance of the
construction industry and its sub-sectors has been fairly limited, given the substantial size of the industry
and its perennial influence on the nation’s economy.
Architecture, engineering, and construction industry experts believe that one of the most critical
challenges in improving productivity is the lack of reliable labor productivity data (Tuchman, 2003). As a
result, overall performance of the construction industry remains mostly unmeasured (Goodrum and Hass,
2002), and concerns have been constantly raised that there are no accurate measures of labor productivity
data for the industry and its sub-sectors (Chapman and Bustry, 2008). The inability to acquire reliable
labor productivity data has become a major impediment to improving productivity for the construction
industry, because the limited number of theoretical studies in the measurement and interpretation of the
industry’s performance data inhibits a clear vision for performance improvement and industry growth.
This paper addresses the need for such research by analyzing data and drawing conclusions on the
difference and changes in productivity, gross margins, and wages among the industry’s sub-sectors.
The analysis of this research has shown that some sectors in the construction industry have suffered a loss
in performance, while other sectors have made great strides in improving performance. Specifically, for
the construction industry as a whole and 14 of its sub-sectors, this paper aims at:
1. Quantifying sizes and economic characteristics, specifically macroeconomic labor productivity,
gross margin, and labor wages.
! 3!
2. Investigating the statistical relationship among the three key parameters by performing a
correlation coefficient analysis; and
3. Developing a quantitative model that predicts the level of a firm’s profitability as a function of
other key parameters by performing a non-linear regression analysis with a best-fitting least
squares curve on the plotted scatterplot.
This research will provide insights that decision-makers and planners in each sub-sector in the industry
can use to devise effective business strategies by considering the magnitude and trends of key
performance parameters. Moreover, research into the macroeconomic characteristics of the construction
industry and its sub-sectors provides a clearer focus on the strengths, weaknesses, and needs of the
industry to have a roadmap for future growth and performance improvements.
2 LITERATURE REVIEW
Prior to conceiving the research methodology for this study, it was necessary to identify existing relevant
research work. Studies related to the measurement of productivity and performance in the construction
industry have been fairly limited (BFC, 2006). In terms of labor productivity, previous studies focused on
the investigation of labor productivity trends over time at the industry-wide level. Systematic research has
not been conducted to estimate such economic characteristics at the sub-sector level, yielding no
consensus of labor productivity trends (Allmon et al, 2000; Rojas and Aramvareekul, 2003).
A research study concluded that labor productivity itself would not be the sole source responsible for cost
overruns and schedule delays; rather poor planning and improper management should be dealt as one of
the main reasons (Chanmeka et al, 2012). The study by Hendrickson and Au (2008) discovered that the
level of management in a given construction firm was not a principal contributor to labor productivity
increases over time. This finding contradicts a previous analysis that the higher level of management
! 4!
results in a greater level of labor productivity (Bloom et al, 2007), although construction methods,
planning, supervision, and jobsite conditions play an important role in determining the level of
productivity (Ghoddousi and Hosseini, 2012). Jarkas (2012) explained how the design and geometry of
any construction activity at the job site influence the labor productivity by introducing a few example
cases, which may have either positive or negative implications on labor productivity. In another study
carried out by Jarkas (2011), the relationship between construction efficiency of any activity and its
related impact on labor productivity was examined, arrived at a conclusion that the relationship between
construction efficiency and labor productivity may vary within various subsectors at the industry-wide
level. Efficiency of equipment used at the construction site is also being cited as one of the important
factors favorable affecting labor productivity. Shen et al (2011) conducted a research study that compares
construction equipment efficiency of the U.S. and China, indicating that the U.S. is far ahead of China
when it comes to construction labor productivity.
The main conclusion of the Allmon et al’s (2000) study was that labor productivity had increased
substantially over a decade between the 1980s and 1990s, primarily due to depressed real wages and
technological advances. Allmon et al’s (2000) study tracked labor cost and output productivity trends for
tasks representing different trades and differing levels of technological intensity, using the ratio of
equipment to labor cost per unit of output within the building construction sector. The benchmark
productivity trends for these tasks came from R.S. Means’ cost data, while the Consumer Price Index
(CPI) was used to reflect the effect of inflation. In the heavy construction sector, soil compaction activity
was chosen as the sample for the industry to measure labor productivity (Stiedl, 1998; Franzluebbers,
2007). The data associated with direct work rates from 72 different projects in Austin, Texas, were used
to compare productivity trends based on R.S. Means’ cost manuals.
! 5!
Rojas and Aramvareekul (2003) also investigated labor productivity trends over time for the entire
industry. In Rojas study, labor productivity was calculated from 1979 to 1998 simply by applying the
following equation: !"#!!"#$%&''(!∗!"#$%!
where GPOi is gross product originated by industry i; employeesi is average number of employees for
industry i, and hoursi is average number of hours worked in industry i.
The values of GPO in the industry were based on data compiled by the Bureau of Economic Analysis
(BEA) of the U.S. Department of Commerce, while the average number of employees and work hour data
were compiled by the Bureau of Labor Statistics (BLS) of the U.S. Department of Labor. However, these
raw data were proved to be unreliable and invalid, leading to the conclusion that labor productivity trends
for the time period could not be determined (Rojas and Aramvareekul, 2003). Consequently, their study
recommended that the measurement of labor productivity be examined at the sub-sector level rather than
at the industry level since the aggregation of data at the overall industry level camouflages productivity
trends at the individual sub-sectors (Rojas and Aramvareekul, 2003).
In general, labor wages are determined as a function of the type of work to be performed and the level of
worker’s expertise. Labor wages among various industries of the nation’s economy have shown a
different trend. For instance, labor wages in the construction industry may have a similar or dissimilar
trend with the automobile industry (Yeaple, 2005). In fact, in the construction industry there has been a
noticeable increase in the labor wages over the past 20 years due primarily to innovations and growing
awareness of educated workers (Bartel and Sicherman, 1997). With the growth of the labor wages, gross
margins for the construction firms have also witnessed a sharp rise (Bartel and Sicherman, 1997).
! 6!
3 DATA COLLECTION PROCESS
Compiled by the U.S. Census Bureau every five years, the U.S. Economic Census Report includes highly
detailed data about most sectors of the U.S. economy on the local, regional, and national levels (U.S.
Census Bureau, 2011b). Three latest U.S. Economic Census Reports of 1997, 2002, and 2007 were used
for this study on labor productivity, gross margins, and labor wages for the construction industry. The
census data for the 14 sub-sectors of the construction industry, as well as the industry as a whole, contain
state and regional level information collected for 51 geographic areas (50 states and Washington D.C.).
Although geographic diversification may be an important factor in construction labor productivity (Goetz
et al, 2012), this study focuses on the sector-level performance. The three census reports are slightly
limited, in that they lack certain data for a number of reasons: (1) companies did not want to share
proprietary information in the census; (2) companies did not respond in a timely manner to the census
request; and (3) companies miscoded their entries in completing the census. Missing values were
estimated and interpolated by performing a simple bivariate linear regression analysis to improve the
reliability and validity of these data.
Inflation is another important parameter in macroeconomic studies because it is considered as an indicator
of overall economic trends (BLS, 2011). Similar to Allmon et al’s (2000) study, this study applied the
CPI to capture inflation over time from 1993 to 2007. An inflation calculator provided by the BLS was
used to adjust the monetary data of the 1997 and 2002 series to match the dollar value of 2007 (BLS,
2011).
4 MACROECONOMIC LABOR PRODUCTIVITY
Due to its large size and labor force component, the construction industry greatly affects national and
local economies, and labor productivity is a key macroeconomic parameter to calibrate the performance
of the industry. Among many ways to define productivity (Thomas and Raynar, 1997; Freeman, 2008; Li
! 7!
and Prescott, 2009), it is possible to define productivity in terms of labor, as a relative measure of labor
efficiency in dollar value (Bernstein, 2003).
4.1 Quantifying Macroeconomic Labor Productivity
Given the labor-intensive, diverse and fragmented structure of the U.S. construction industry, there are
many possible ways to define and estimate labor productivity. Typically, studies of labor productivity
tend to focus on trend investigations of total man-hours of employed field labor over time provided by the
BLS. BLS data, however, have had some reliability and validity problems due to deficiencies in data
collection, processing, and interpretation (Rojas and Aramvareekul, 2003). To address these problems,
values of labor productivity presented in this paper are calculated based on the U.S. Economic Census
Reports, adjusted by a linear regression technique as mentioned earlier; this may provide the most
detailed, acceptable, and credible measurement of macroeconomic labor productivity for the industry.
Although this study attempted to incorporate the BLS’s hourly output rate data for construction industry
labor into the research for this paper, it proved impractical to combine BLS data with the Economic
Census data, since they represent heterogeneous sources from different levels and perspectives.
In this study, macroeconomic labor productivity is defined as average throughput (output) of value of
construction work per construction worker. Value of construction work in turn is defined by the U.S.
Census Bureau as the sum of all the value (in dollars) of construction work done by general contractors,
as well as special, heavy, and special trade contractors, including new construction, additions, alterations,
or reconstruction, and maintenance and repair construction work (U.S. Census Bureau, 2012). To
calculate the macroeconomic labor productivity of the 14 sub-sectors and the entire construction industry,
the following formula was developed and applied:
Sub-sectors! ! (1)!LPi =VCijj=1
51∑
NCWijj=1
51∑
! 8!
In the equation above, LPi equals the labor productivity of industry sub-sector i (state j), where VCij equals
the value of construction work in dollars (industry sub-sector i in state j), and NCWij equals the number of
construction workers of industry i in state j.
4.2 Assessing Macroeconomic Labor Productivity
Table 1 shows that labor productivity has improved over the study period from 1992 to 2007 when taking
into account all sub-sectors and the industry as a whole. In particular, the land sub-sector, followed by the
residential and nonresidential sub-sectors, produced the highest level of macroeconomic labor
productivity. As the land sub-sector has the second-lowest labor intensity in the industry (see Table 1), a
relatively small number of competitive employees are needed to create the high value of construction
work within the land sub-sector. This high productivity also results from the land sub-sector’s primary
role of site acquisition and pre-development market research and analysis, not physical development.
Even though the nonresidential and residential sub-sectors typically experience the highest labor intensity
(Page and Curtis, 2011), good labor productivity performance in these sub-sectors is attributed to the fact
that they create the second highest value of construction work (see Table 1). Based on the North
American Industry Classification System (NAICS) codes, the residential building construction sector can
be categorized into two main housing construction subgroups: (1) single family and (2) multifamily (U.S.
Census Bureau, 2011c). The nonresidential building construction sector is also divided into two building
construction subcategories: (1) industrial and (2) commercial and institutional. In addition to high labor
productivity performance, the residential sector constitutes 63 percent of the private-sector activity in the
United States construction industry (Anderson, 1994). Therefore, it is estimated that overall the high
productivity in this sector exercises the highest leveraged effects on the nation’s construction industry.
<Insert Table 1 Here>
! 9!
According to the theory of age, the trend of consumers seeking residential space shifts from the “age of
quantity,” whose objective is for builders to produce just enough shelter to meet market demands, to the
“age of customization,” whose objective is to increase the extent to which builders’ products are
differentiated (Laidler, 1991). Therefore, as the elastic demand for high-quality, affordable residential
space increases over time in the inelastic supply structure, the residential sector often experiences periods
of many innovations in building and housing construction projects, including additions, alterations, and
reconstruction, as well as repairs and remodeling. This rapid adoption of innovative practices contributes
to high labor productivity in the residential sector. Even though the construction industry is known to
adopt innovation rather slowly (Sabol, 2007), the residential sector in particular quickly adopts
innovations such as modularization, panelized housing systems using prefabricated materials, and other
engineered products (Koebel et al, 2004; Lutzenhiser et al, 2009).
Housing construction’s strong commitment to innovation as a business survival strategy serves not only
to reduce direct costs but also to improve macroeconomic labor productivity in several ways. For example,
the use of predrilled studs in wall framing and the use of sealed panels in roof insulation save labor steps
and contribute to a higher rate of labor productivity. Rapid population growth is also a contributing factor
to improved labor productivity (Bloom and Freeman, 1986; Chansarn, 2010). As the population steadily
increases, cities are simultaneously expanding, sometimes at great speed, creating an accelerated demand
for more affordable housing in metropolitan areas to be built by existing construction firms.
The high productivity of these sub-sectors contrasts with the painting and wall-covering sub-sector, which
has the least macroeconomic labor productivity value, as shown in Table 2. This sub-sector has high labor
intensity with relatively little value of construction work: the second smallest value in 1997 and the
smallest in both 2002 and 2007, followed by the masonry, drywall, and tile sub-sector. Both of these sub-
sectors are typically filled through a subcontractor’s role in construction projects, and rarely create much
value beyond the cost of materials and prevailing labor rates.
! 10!
<Insert Table 2 Here>
5 LABOR WAGES
In this study, labor wages were computed using the Equation (2) to examine the validity of the research
hypothesis that there is a significant relationship between the level of labor wages and labor productivity.
It has been believed that higher payments for labor have contributed to labor’s high productivity in
generating gross margins. If labor wages are determined by an economic supply-demand curve, a higher
demand may result in a wage increase over time. To calculate the macroeconomic labor wages of the 14
sub-sectors and of the entire construction industry, the following formula was developed and applied:
(2)
where WPCi equals the wages of sub-sector i in state j; TWij equals the total wages for sub-sector i
in state j; and NCWij equals the number of construction workers in sub-sector i in state j. Table 2
indicates that labor wages in the construction industry have increased over the study period from 1992 to
2007.
6 GROSS MARGIN
Most construction firms appear to be strongly committed to improving productivity. Firms in productive
sectors are more profitable than those that are not; opportunities for growth are also seen to be higher. The
reason for the latter is that productive (profitable) sectors can better absorb the business risks associated
with the implementation of innovations or new business strategies for growth (Bernstein, 2003). To
identify the most productive – and therefore most profitable – sub-sectors, gross margins were evaluated
in connection with the sub-sectors’ macroeconomic labor productivity and labor wages.
WPCi =TWijj=1
51∑
NCWijj=1
51∑
! 11!
6.1 Quantifying Gross Margin
In this study, gross margin is defined as the firm’s profit before operating expenses. The estimates of the
14 sub-sectors’ gross margins were calculated using industry revenue and general and administrative
expense information, including employees’ wages, equipment rental costs, capital expenditures, material
costs, and subcontractors’ fees. To calculate the gross margin per construction worker in each of the 14
sub-sectors, the following formula was developed and applied:
(3)
where GPCi equals the gross margin per construction worker for industry sub-sector i (state j); Revenueij
equals total revenue; and G&A Expensesij equals the general and administrative expenses for sub-sector i
in state j. NCWij equals the number of construction workers.
6.2 Assessing Gross Margin
Table 3 shows that the gross margin per construction worker has improved over the past 15 years. In
particular, the residential sub-sector, followed by the nonresidential sub-sector, have experienced the
highest gross margins since these sub-sectors generate the highest value added with relatively lower
general and administrative expenses. Value added, as reported in this study, is defined as the value of
construction work done by the sub-sector, less costs for subcontract work, materials, components, and
fuels (U.S. Census Bureau, 2011b). However, the high gross margin of the residential sub-sector overall
cannot be directly translated into a high profitability at the firm level, since relatively more subcontractors
are involved in the residential sub-sector. In most cases, firms in the residential sub-sector are involved in
small-scale new building and housing construction projects, and therefore realize less profit because of
the unique characteristics of such projects. Therefore, the residential sub-sector realizes a relatively small
gross margin ratio, as shown in Table 3.!!
<Insert Table 3 Here>
GPCi = (Revenueij −G& AExpensesij
NCWijj=1
51∑ )
! 12!
The gross margin ratio is a critical variable in determining a sub-sector’s profitability potential, defined as
the percentage of profit margin on revenue, denoted as Equation 3 divided by the total revenue of each
sub-sector. The gross margin ratio indicates how the contracting amount awarded to a construction firm
for the project contributes to covering all other expenses and yielding a profit. To illustrate, the land sub-
sector’s gross margin ratio was estimated at over 47 percent on average over the past 15 years, meaning
that about 47 percent of revenue was accounted as profit from 1993 to 2007 (see Figure 1). While the
construction industry’s overall profitability average is around 2 percent for the same period of time, the
land sub-sector, the most profitable sector in the construction industry, far exceeds the industry average.
This higher level of gross margin could be achieved through increasing sales, reducing general and
administrative costs, or a combination of both.
<Insert Figure 1 Here>
7 MODELING RELATIONSHIP AMONG KEY PARAMETERS
One of the major objectives of this study was to examine the relationship among three key performance
parameters by testing the validity of the research hypothesis that industry sub-sectors with higher
productivity and labor wages are more profitable with regard to the gross margins than sub-sectors that
represent low productivity and wages. In this study, a firm’s profitability was captured by the quantified
gross margins per construction worker, believing that construction workers generating more profits also
contributed to adding more profits for the firm. The quantified data of all three key parameters were
carefully checked for normality and multicollinearity issues to ensure an unbiased analysis. This study
employed a Pearson’s correlation coefficient analysis to test the validity of the research hypothesis. An
exponential least squares function was chosen as the best-fitting curve on the plotted scatterplot. A
nonlinear regression analysis was then performed to further investigate the relationships among
! 13!
parameters to arrive at the final predictive model that determines the levels of a firm’s profitability as a
main function of labor productivity. !
7.1 Impact of Labor Productivity and Wages on Firm’s Profitability
Figure 2 shows a positive relationship between labor productivity and gross margin over the study period,
wherein the gross margin values are almost mirror images of labor productivity values. This was
confirmed by the Pearson’s correlation coefficient analysis. Table 4 indicates that the relationship
between labor productivity and gross margin is significant, with the p-value smaller than the set threshold
level of .001. However, there was no significant relationship between wages and other two parameters.
Therefore, labor wage was not considered as an independent variable in the following regression analysis.
A non-linear regression analysis with an exponential least squares curve was performed to develop a
profitability prediction model by analyzing how a firm’s profitability was affected by the level of labor
productivity. The non-linear exponential function proved to be the best-fitting least squares function, as it
showed the highest r-square value compared with all other available functions on a plotted scatterplot. A
positive r-squared value of 0.862 shows a very strong fit, suggesting that approximately 86 percent of the
variation in the gross margin can be explained by differing levels of labor productivity. This conveys the
important fact that higher labor productivity produces higher gross margins at the firm level for the 14
sub-sectors (see Table 5 and Figure 3). Therefore, in order to improve gross margins at the firm or
employee level, it is critical to create sustained labor productivity improvements; for those sub-sectors in
the construction industry that have low profit margins and difficulty in creating economies of scale
largely due to small size, improving labor productivity may become more of a survival strategy,
especially in an environment of consolidation among industry fragmentation.
<Insert Figure 2 and Figure 3 Here>
<Insert Table 4 and Table 5 Here>
! 14!
Table 5 shows that the selected exponential equation of gross margin is adequate (F-ratio = 250.267,
significant at 0.001 level), generating the following regression equation for determining a firm’s level of
profitability:
(4)
!8 MODEL VALIDATION
The robustness of the proposed prediction model of Equation 4 in predicting a firm’s profitability was
validated using the Predicted Error Sum of Square (PRESS). When creating a quantitative model,
validation of the model is essential to ensuring its accuracy and reliability. A typical method of validation
is to test the model with new data or holdout data reserved from the original sample. Meanwhile, it is not
unusual for researchers to have difficulties in data acquisition. The PRESS is one of the most widely used
and preferred validation alternatives because it clearly indicates the predictability and accuracy of the
model (Ott and Longnecker, 2000). PRESS determines the quality of prediction by comparing each
prediction to the one of a new subset model without the use of each observation that serves as a holdout
sample of size 1. The PRESS statistic of a regression model is computed using the following equation:
PRESS = (y! − y!∗)!!!!! where y! is a prediction of the regression model for the ith observation, and y!∗ is
a prediction of a new subset model for the ith observation, which is fitted with leaving out the ith
observation.
Computing the PRESS statistic of a regression model starts with repetitively fitting a new subset model
with leaving out one observation at a time. The statistic is calculated by summing the squared residuals
between the predicted values of the original model and the predicted values of each subset model for each
observation. The PRESS statistic is then compared to the Sum of Squared Error (SSE), which is the value
generated by the proposed regression model. The SSE measures the level of variation by looking at the
GPC = 26.246e0.0027982LPC
! 15!
sum of the squared differences between each observation and its model's mean. If the value estimated by
the PRESS statistic is close to the value of SSE, it suggests that the proposed model possesses a
significant predictability. If the value estimated by the PRESS statistics turns out to be several times
larger than the value of SSE, the model has a validation issue. The estimated PRESS statistic of the
proposed non-linear exponential model was 3.265, and the estimated SSE value was 2.819. As the
exponential model yields a PRESS statistic very close to the computed SSE value, it confirms that the
proposed model is robust in predicting a firm’s profitability as a function of labor productivity.
9 DISCUSSIONS
Comparison of the 14 sub-sectors with regard to labor productivity and gross margins shows that some
sectors have suffered a loss while a few others have made significant progress. Specifically, land,
residential, and non-residential sub-sectors had the best performance in computed macroeconomic labor
productivity, while the painting and masonry sub-sectors had the worst performance. Across the entire
construction industry, residential and non-residential sectors had the highest gross margin and gross
margin ratio, due to the fact that they generate the most value added, further supporting their high labor
productivity. Also, the study revealed that the value of construction work has increased significantly over
time in the industry, especially in the major sub-sectors such as residential, non-residential, highway, and
HVAC.
It is also noted that labor wages had increased throughout from the industry and sub-sector perspectives.
In an industry where the average level of gross margin ratio is about 25 percent, it was found that the land
sub-sector was the most profitable in the construction industry with a 47 percent gross margin ratio. Also,
the industry sub-sectors with higher levels of labor productivity had higher levels of profitability, more so
on a per firm basis than on a per employee basis, as proved by the results of a correlation and regression
! 16!
analysis. This result indicating that higher productivity results in higher gross margins was supported by a
very strong r-square value with positive correlation between labor productivity and gross margin. Finally,
a validation study proved the robustness of the proposed predictive model in projecting a firm’s
profitability as a function of varied levels of labor productivity.
A number of critical factors must be improved to create practical and sustained labor productivity
improvements. This study shows a strong impact of labor productivity on a firm’s profitability, but also
has revealed that over the past fifteen years some sub-sectors were experiencing a notable growth in labor
productivity while some were suffering from tardy productivity growth. It is, however, important to
understand the complex, multi-faceted nature of the construction industry, which can explain many of the
sharp differences in labor productivity among the 14 sub-sectors.
Beyond their structural differences, a number of practical trends may explain the disparities in gross
margin and labor productivity in the 14 sub-sectors. First, the construction industry has suffered from
labor shortage. Noticeable changes in labor-force participation had occurred in the construction industry
over the study period. It is believed that the construction industry has not been successful to attract labor
from other industries in recent years because of poor working environments, insufficient job growth
opportunities, depressed wages, and low performance incentives.
Second, the level of project management would be a crucial factor affecting the labor productivity and
gross margin. In a practical sense, effective project management can predict and quantify potential
problems in a project to better control and reduce bottlenecks and disruptions. A lack of effective decision
making is a major hindrance to labor productivity; a low level of management commitment – rather than
! 17!
the quality of the workforce – has been cited as the major cause of poor labor productivity (Sanvido, 1988;
Assaf and Al-Hejji, 2006; Chanmeka et al, 2012).
Third, technological and organizational innovations would produce sustained productivity improvements
in most industries, even those with low wages. However, only 0.5 percent of the construction industry’s
aggregate budget is devoted to research and development of innovation (Lemer, 1996). Lastly, some sub-
sectors have invested in more modern plants, equipment, methods, and materials to improve productivity,
as capital-intensive innovations have been seen as more economical than reliance on technologies that
utilized more increasingly expensive labor; however, such investments are only undertaken once firms
believe that trends that require innovation will continue (Turin and Reid, 1975; Loof and Heshmati, 2002;
Loss and Timmer, 2005; Shen et al, 2011; Ghoddousi and Hosseini, 2012).
10 CONCLUSIONS AND FUTURE RESEARCH
This paper has examined the macroeconomic performance of the construction industry by focusing on
three key parameters that affect the industry’s performance from the perspective of industry sub-sectors.
This paper also has investigated the magnitude and trends of macroeconomic labor productivity, wages,
and gross margin in the industry. Data from the three-time series of U.S. Economic Census Reports
covering the past 15 years from 1992 to 2007 were evaluated and organized by the 14 construction sub-
sectors. Missing values in the collected data were interpolated by applying a bivariate linear regression
technique.
This research concludes that the industry sub-sectors with the strongest productivity are the most
profitable with regard to the gross margins that they are able to generate. The paradigm of labor
productivity has shifted away from “working harder and longer” toward “working smarter,” whereby
! 18!
improvements in productivity can offset labor limitations contained within the structure of the U.S.
construction industry. Therefore, it is crucial for each sub-sector in the construction industry to invest
more time and resources in devising ways to improve sustained and efficient macroeconomic labor
productivity to realize greater profitability. The findings of this study should be of value to decision
makers and strategic planners who need to make critical strategic decisions on firm’s business directions,
as this research provides scholars and industry practitioners with the first view they can use to develop
business strategies by looking at the trends and percentages of key macroeconomic performance
parameters. This study will help them make better-informed business decisions by understanding the
strengths, weaknesses, and needs of each sector in the construction industry. The predictive model would
help them develop a business strategy for future growth and productivity improvements in more viable
ways. The non-linear regression method and PRESS validation technique adopted in this study can be
repeated by other researchers knowledgeable about the operational research field.
This study has attempted to develop a prediction model of firm’s profitability by investigating the
macroeconomic performance of the construction industry at 14 of its sub-sectors. The industry sector-
wide study provides a basis for future research analyzing and comparing the State level macroeconomic
performance such as looking into the productivity and wage trends of the highway sector between
California and Florida. The predictive model developed in this study can be tailored by applying a cluster
analysis technique. The current model’s capability in predicting the firm’s profitability can also be
enhanced by considering additional performance parameters.
11 REFERENCES
Allmon E, Haas C T, Borcherding J D and Goodrum P M (2000). U.S. construction labor productivity
trends, 1970-1998. Journal of Construction Engineering and Management 126(2): 97-104.
! 19!
Assaf S and Al-Hejji S (2006). Causes of delay in large construction projects. International Journal of
Project Management 24(4): 349-357.
Bartel A P and Sicherman N (1997). Technological Changes and Wages: An Inter-Industry Analysis.
http://www.nber.org/papers/w5941.pdf?new_window=1, accessed 20 September 2012.
Bernstein H (2003). Measuring productivity: an industry challenge. Civil Engineering Magazine, ASCE:
46-53.
BFC (2006). Measuring Productivity and Evaluating Innovation in the U.S. Construction Industry.
http://www.thebfc.org/uploads/BFC_Productivity_whitepaper.pdf, accessed 15 April 2011.
Bloom D and Freeman R (1986). The effects of rapid population growth on labor supply and employment
in developing countries. Population and Development Review 12(3): 381-414.
Bloom N, Dorgan S, Dowdy J and Reenen J (2007). Management, Practice and Productivity: Why They
Matter. http://www.stanford.edu/~nbloom/ManagementReport.pdf, accessed 10 September 2011.
BLS (2011). Bureau of Labor Statistics, Consumer Price Index. http://www.bls.gov/cpi, accessed 02
February 2012.
BLS (2011). Bureau of Labor Statistics, Consumer Price Index, Inflation Calculator.
http://www.bls.gov/data/inflation_calculator.htm%3E, accessed 28 January 2012
Chanmeka A, Thomas S R, Caldas C H and Mulva S P (2012). Assessing key factors impacting the
performance and productivity of oil and gas projects in Alberta. Canadian Journal of Civil Engineering
39(3): 259-270.
Chansarn S (2010). Labor productivity growth, education, health and technological progress: a cross-
country analysis. Economic Analysis & Policy 40(2): 249-261.
Chapman R E and Butry D T (2008). Measuring and improving the productivity of the U.S. construction
industry: issues, challenges, and opportunities. National Institute of Standards and Technology,
Washington, DC.
Franzluebbers A (2007). Integrated crop–livestock systems in the southeastern USA. American Society of
Agronomy 99(2): 361-372.
! 20!
Freeman R (2008). Labor Productivity Indicators.
http://www.oecd.org/employment/labourstatistics/41354425.pdf, accessed 10 October 2011.
Ghoddousi P and Hosseini M R (2012). A survey of the factors affecting the productivity of construction
projects in Iran. Technological and Economic Development of Economy 18(1).
Goetz M, Laeven L and Levine R (2012). The valuation effects of geographic diversification: evidence
from U.S. banks, International Monetary Fund (IMF) working paper.
Goodrum P M and Haas C T (2002). Partial factor productivity and equipment technology change at
activity level in US construction industry. Journal of Construction Engineering and Management 128(6):
463-472.
Hendrickson C and Au T (2008). Project Management for Construction. Printed by Prentice Hall, ISBN
0-13-731266-0, 1989.
Jarkas A M (2012). Influence of buildability factors on rebar installation labor productivity of columns.
Journal of Construction Engineering and Management 138(2): 258-267.
Jarkas A M (2011). Buildability factors influencing concreting labor productivity. Journal of Construction
Engineering and Management 138(1): 89-97.
Koebel C, Papadakis M, Hudson E and Cavell M (2004). The Diffusion of Innovation in the Residential
Building Industry. http://www.huduser.org/Publications/PDF/Diffusion_Report.pdf, accessed 16
November 2011.
Laidler D (1991). The golden age of the quantity theory, Princeton University Press.
Li X and Prescott D (2009). Measuring productivity in the service sector. Canadian Tourism Human
Research Council and University of Guelph.
Lemer A (1996). Solving the innovation puzzle: challenges facing the U.S. design & construction
industry, ASCE Press.
Loof H and Heshmati A (2002). Knowledge capital and performance heterogeneity: A firm level
innovation study. International Journal of Production Mechanics 76(01): 61-85.
! 21!
Loss B and Timmer M (2005). The appropriate technology explanation of productivity growth
differentials: An empirical approach. Journal of Development Economics, 77(2): 517-531.
Lutzenhiser L, Cesafsky L, Chappells H, Gossard M, Moezzi M, Moran D, Peters J, Spahic M, Stern P,
Simmons E and Wilhite H (2009). Behavioral Assumptions Underlying California Residential Sector
Energy Efficiency Programs. http://uc-ciee.org/downloads/ba_ee_res_wpsumm.pdf, accessed 18
November 2011.
Ott R L, and Longnecker M T (2000). An Introduction to Statistical Methods and Data Analysis. Duxbury
Press, Pacific Grove, CA.
Page I and Curtis M (2011). Study Report: Firm Productivity Variations
http://www.branz.co.nz/cms_show_download.php?id=58c58fbf2b947a181f130baf0e8ebd025a873fa6,
accessed 15 October 2011.
Rojas E M and Aramvareekul P (2003). Is construction labor productivity really declining? Journal of
Construction Engineering and Management 129(1): 41-46.
Sabol L (2007). Technology, change, and the building industry. Real Estate Review 36(3).
Sanvido, V E (1988). Conceptual construction process model. Journal of Construction Engineering and
Management 114(2): 294-312.
Shen Z, Jensen W, Berryman C and Zhu Y (2011). Comparative study of activity-based construction
labor productivity in the United States and China. Journal of Construction Engineering and Management
27(2): 116-124.
Stiedl D, 1998. International Labor Organization.
http://www.ilo.org/public/english/employment/recon/eiip/download/prod_norms.pdf, accessed 28 May
2011.
Thomas H and Raynar K (1997). Scheduled overtime and labor productivity: quantitative analysis.
Journal of Construction Engineering and Management 123(2): Paper No. 13135.
Tuchman J (2003). Productivity: Accurate Measures are Elusive.
http://enr.construction.com/news/bizLabor/archives/030512.asp, accessed 20 February 2011.

! 22!
Turin D A, and Reid D A G (1975). Aspects of the Economics of Construction. Godwin Publishers:
London.
U.S. Census Bureau (2012). Construction Spending: Value of Construction Work Put In Place at a Glance
August 2012. http://www.census.gov/construction/c30/c30index.html, accessed 01 October 2012.
U.S. Census Bureau (2011a). 2007 Economic Census: Construction Sector.
http://factfinder.census.gov/servlet/MetadataBrowserServlet?type=surveyInstance&id=Construction&&se
ctorId=&survey=2007+Economic+Census&_lang=en%3E, accessed 31 January 2012.
U.S. Census Bureau (2011b). 2007 Economic Census: User Guide.
http://www.census.gov/econ/census07/www/user_guide.html%3E, accessed 03 February 2012.
U.S. Census Bureau (2011c). North American Industry Classification System-2007.
http://www.census.gov/epcd/naics07/%3E, accessed 10 February 2012.
Yeaple S R (2005). A simple model of firm heterogeneity, international trade, and wages. Journal of International Economics 65(1): 1-20.

LIST OF FIGURES
Figure 1 Magnitude and trends of gross margin ratios over time
Figure 2 Relationship between productivity and gross margin
Figure 3 Regression model with a very high r-squared value
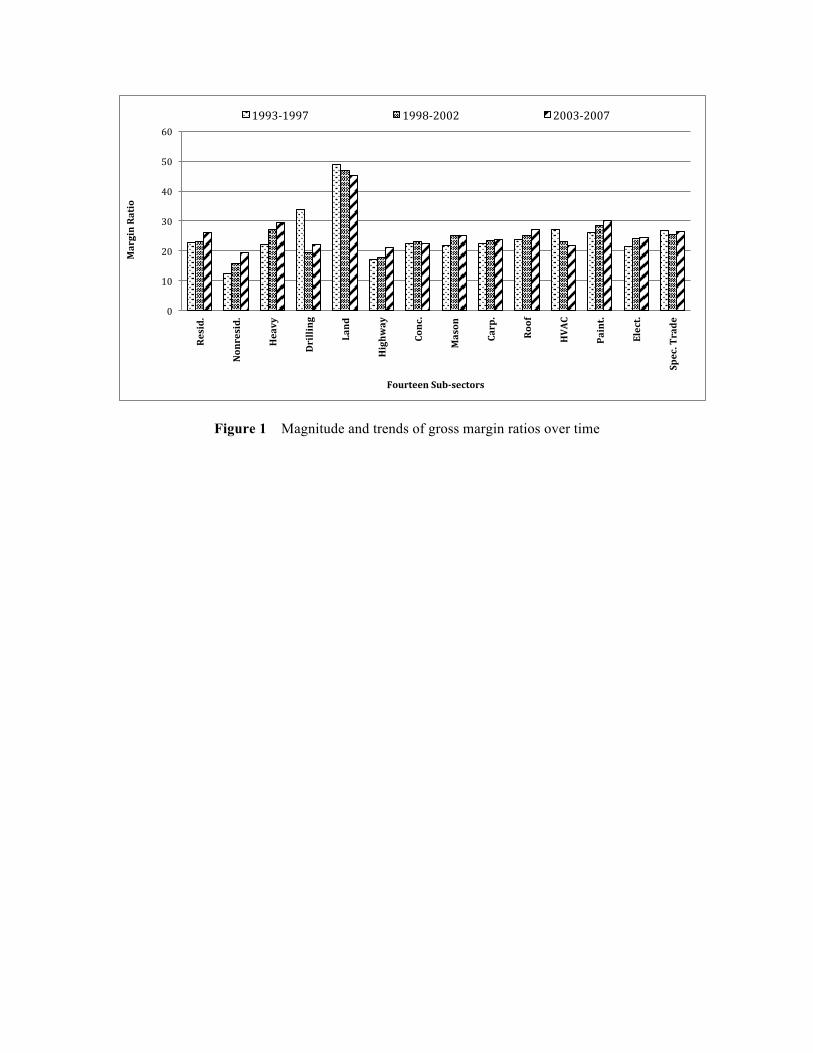
Figure 1 Magnitude and trends of gross margin ratios over time
0"
10"
20"
30"
40"
50"
60"
Resid.'
Nonresid.'
Heavy'
Drilling'
Land'
Highw
ay'
Conc.'
Mason'
Carp.'
Roof'
HVAC'
Paint.'
Elect.'
Spec.'Trade'
Fourteen'SubEsectors'
'Margin'Ratio''
1993*1997"" 1998*2002"" 2003*2007""
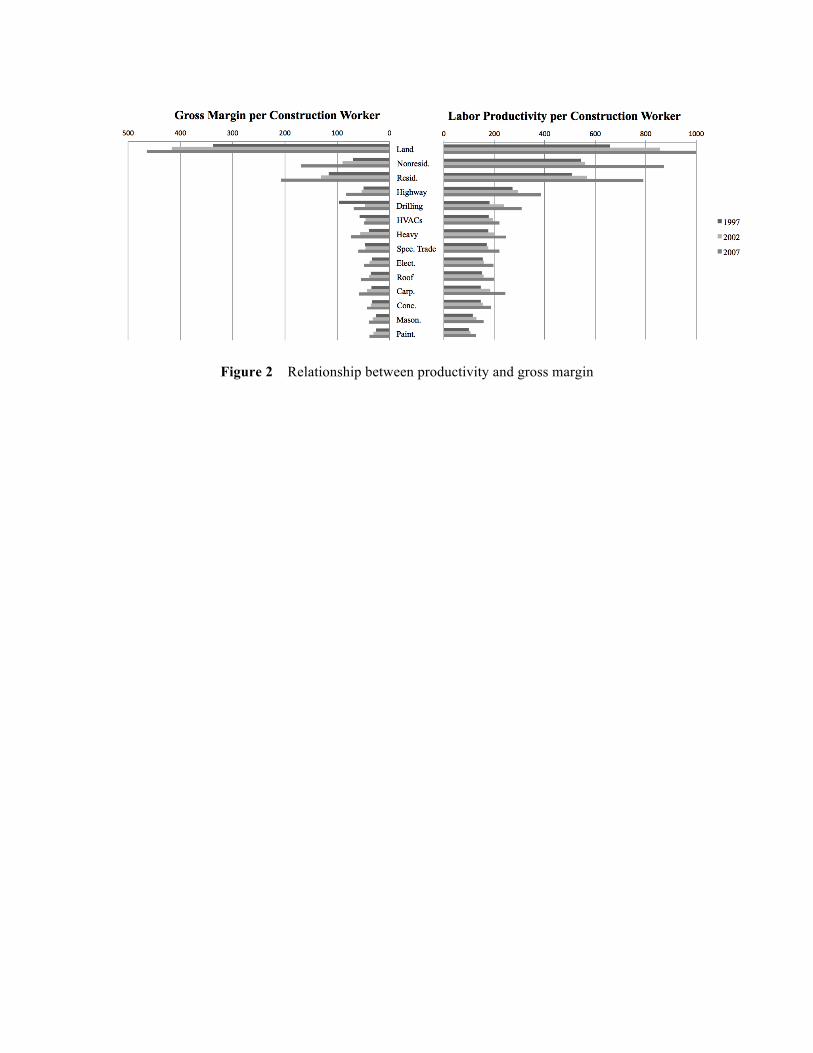
Figure 2 Relationship between productivity and gross margin
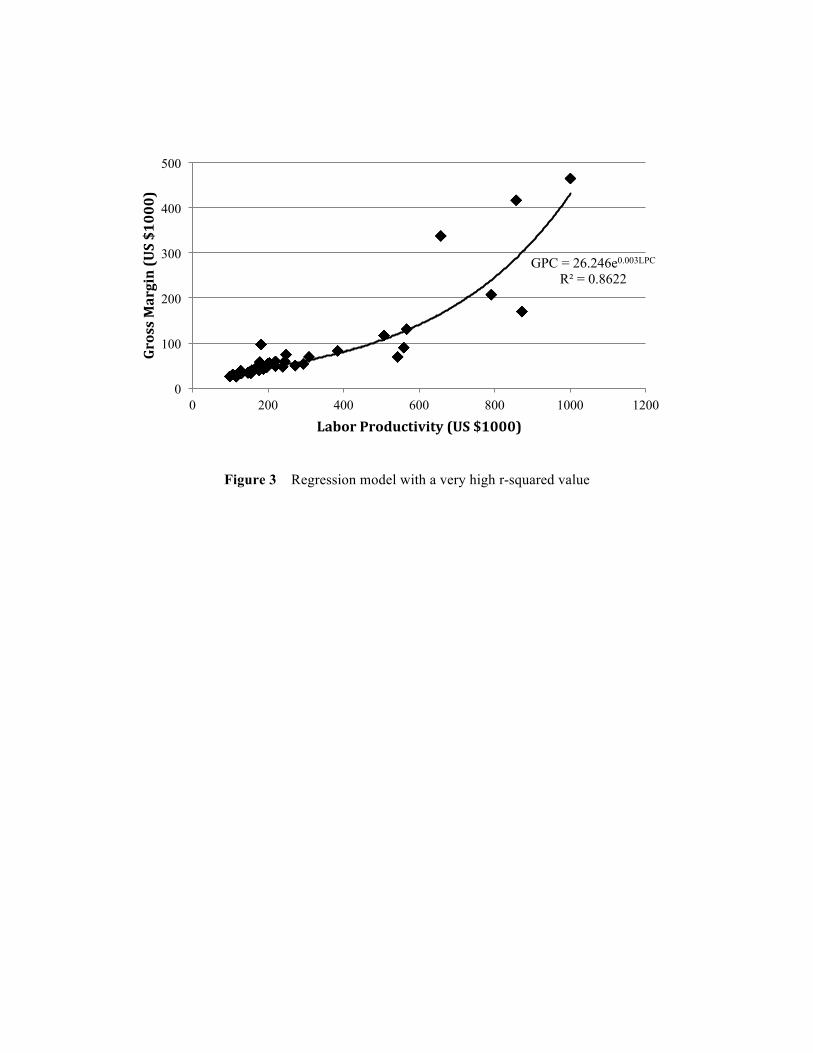
Figure 3 Regression model with a very high r-squared value
"
GPC = 26.246e0.003LPC R² = 0.8622
0
100
200
300
400
500
0 200 400 600 800 1000 1200
Gross'Margin'(US'$1000)'
Labor'Productivity'(US'$1000)'

LIST OF TABLES
Table 1 Trends of labor productivity over time from 1992 to 2007 (in 2007 U.S.
dollars)
Table 2 Labor wages trends from 1993 to 2007 (in 2007 U.S. dollars)
Table 3 Trends of gross margin over time from 1992 to 2007 (in 2007 U.S. dollars)
Table 4 Results of Pearson’s correlation coefficient analysis
Table 5 Results of non-linear regression analysis
!
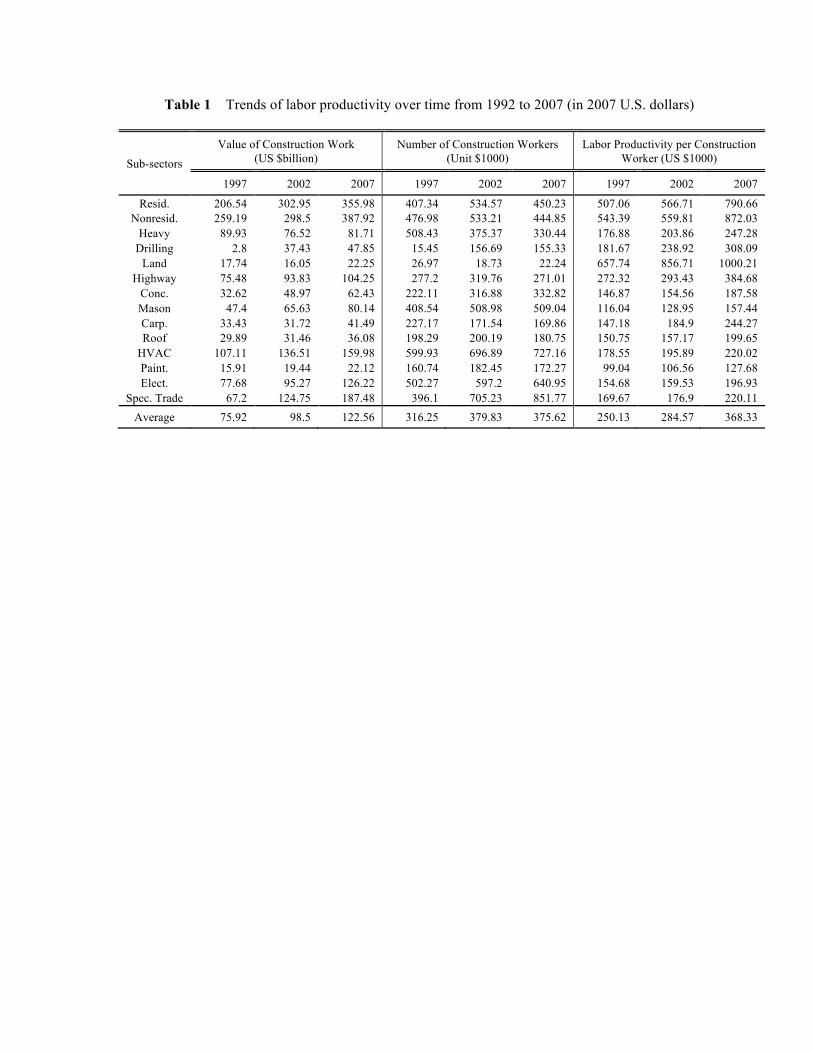
Table 1 Trends of labor productivity over time from 1992 to 2007 (in 2007 U.S. dollars)
Sub-sectors
Value of Construction Work (US $billion)
Number of Construction Workers (Unit $1000)
Labor Productivity per Construction Worker (US $1000)
1997 2002 2007 1997 2002 2007 1997 2002 2007
Resid. 206.54 302.95 355.98 407.34 534.57 450.23 507.06 566.71 790.66 Nonresid. 259.19 298.5 387.92 476.98 533.21 444.85 543.39 559.81 872.03
Heavy 89.93 76.52 81.71 508.43 375.37 330.44 176.88 203.86 247.28 Drilling 2.8 37.43 47.85 15.45 156.69 155.33 181.67 238.92 308.09
Land 17.74 16.05 22.25 26.97 18.73 22.24 657.74 856.71 1000.21 Highway 75.48 93.83 104.25 277.2 319.76 271.01 272.32 293.43 384.68
Conc. 32.62 48.97 62.43 222.11 316.88 332.82 146.87 154.56 187.58 Mason 47.4 65.63 80.14 408.54 508.98 509.04 116.04 128.95 157.44 Carp. 33.43 31.72 41.49 227.17 171.54 169.86 147.18 184.9 244.27 Roof 29.89 31.46 36.08 198.29 200.19 180.75 150.75 157.17 199.65
HVAC 107.11 136.51 159.98 599.93 696.89 727.16 178.55 195.89 220.02 Paint. 15.91 19.44 22.12 160.74 182.45 172.27 99.04 106.56 127.68 Elect. 77.68 95.27 126.22 502.27 597.2 640.95 154.68 159.53 196.93
Spec. Trade 67.2 124.75 187.48 396.1 705.23 851.77 169.67 176.9 220.11
Average 75.92 98.5 122.56 316.25 379.83 375.62 250.13 284.57 368.33
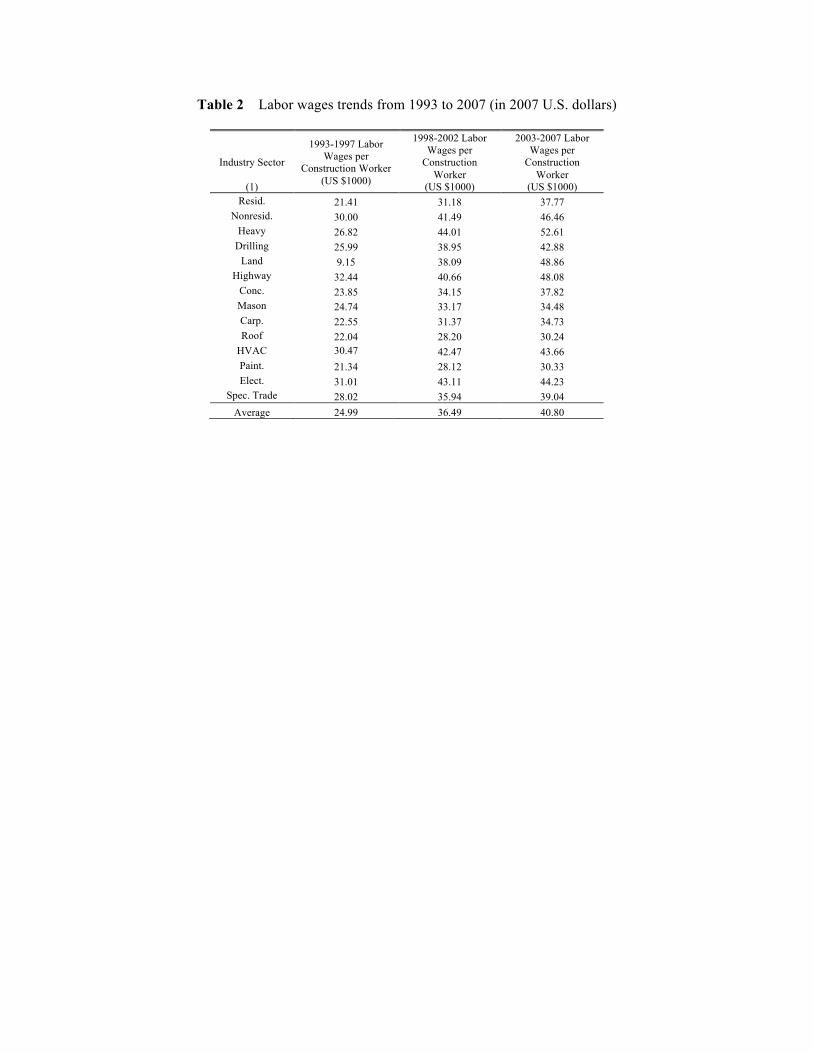
Table 2 Labor wages trends from 1993 to 2007 (in 2007 U.S. dollars)
Industry Sector
(1)
1993-1997 Labor Wages per
Construction Worker (US $1000)
1998-2002 Labor Wages per
Construction Worker
(US $1000)
2003-2007 Labor Wages per
Construction Worker
(US $1000) Resid. 21.41 31.18 37.77
Nonresid. 30.00 41.49 46.46 Heavy 26.82 44.01 52.61
Drilling 25.99 38.95 42.88 Land 9.15 38.09 48.86
Highway 32.44 40.66 48.08 Conc. 23.85 34.15 37.82 Mason 24.74 33.17 34.48 Carp. 22.55 31.37 34.73 Roof 22.04 28.20 30.24
HVAC 30.47 42.47 43.66 Paint. 21.34 28.12 30.33 Elect. 31.01 43.11 44.23
Spec. Trade 28.02 35.94 39.04 Average 24.99 36.49 40.80
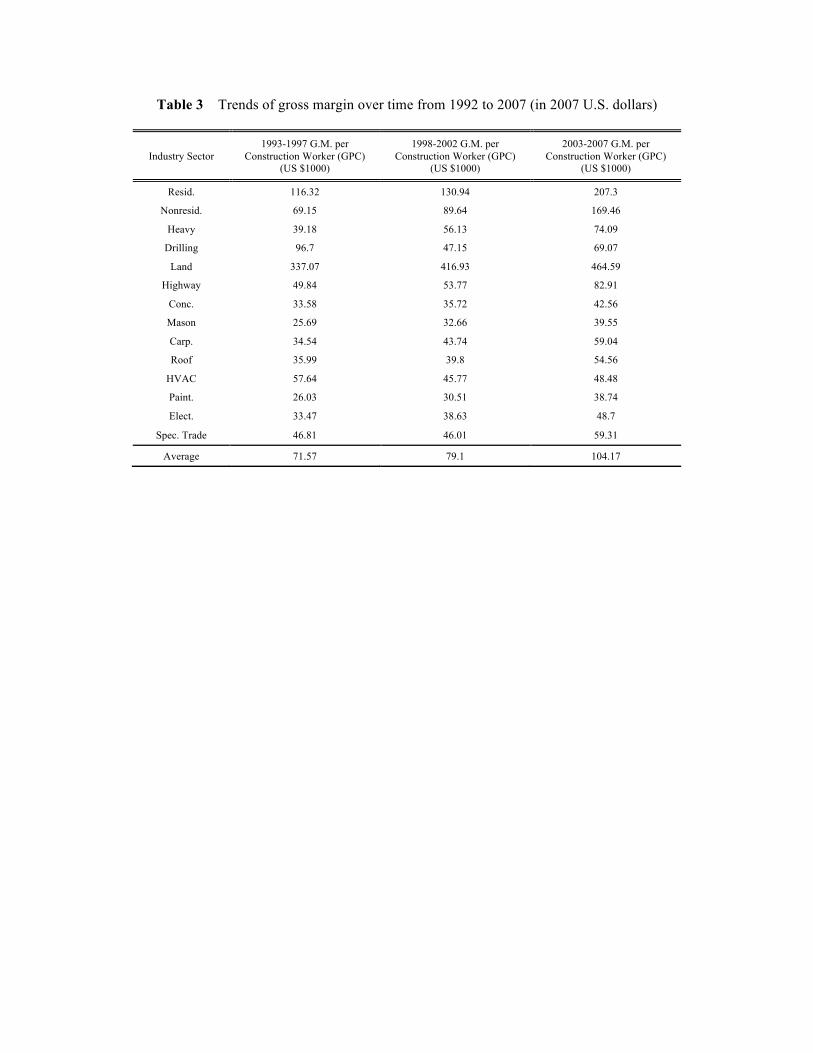
Table 3 Trends of gross margin over time from 1992 to 2007 (in 2007 U.S. dollars)
Industry Sector 1993-1997 G.M. per
Construction Worker (GPC) (US $1000)
1998-2002 G.M. per Construction Worker (GPC)
(US $1000)
2003-2007 G.M. per Construction Worker (GPC)
(US $1000)
Resid. 116.32 130.94 207.3
Nonresid. 69.15 89.64 169.46
Heavy 39.18 56.13 74.09
Drilling 96.7 47.15 69.07
Land 337.07 416.93 464.59
Highway 49.84 53.77 82.91
Conc. 33.58 35.72 42.56
Mason 25.69 32.66 39.55
Carp. 34.54 43.74 59.04
Roof 35.99 39.8 54.56
HVAC 57.64 45.77 48.48
Paint. 26.03 30.51 38.74
Elect. 33.47 38.63 48.7
Spec. Trade 46.81 46.01 59.31
Average 71.57 79.1 104.17
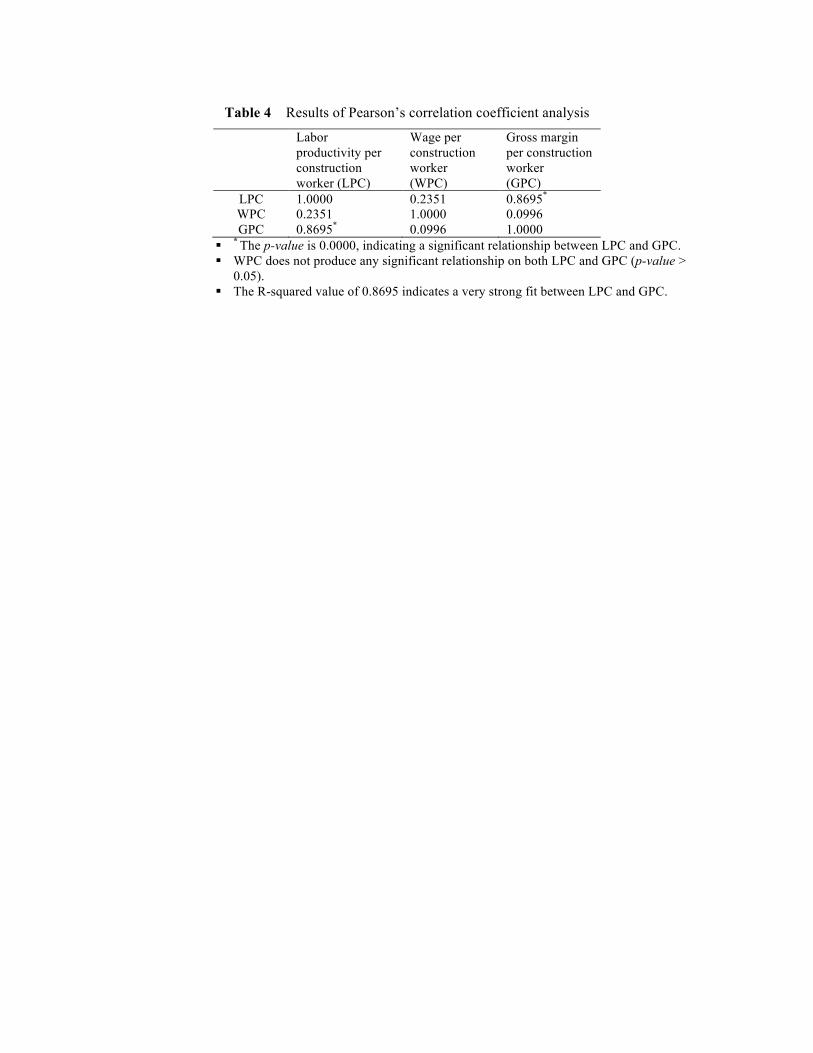
Table 4 Results of Pearson’s correlation coefficient analysis
Labor productivity per construction worker (LPC)
Wage per construction worker (WPC)
Gross margin per construction worker (GPC)
LPC 1.0000 0.2351 0.8695* WPC 0.2351 1.0000 0.0996 GPC 0.8695* 0.0996 1.0000
! * The p-value is 0.0000, indicating a significant relationship between LPC and GPC. ! WPC does not produce any significant relationship on both LPC and GPC (p-value >
0.05). ! The R-squared value of 0.8695 indicates a very strong fit between LPC and GPC.

Table 5 Results of non-linear regression analysis
Model Coefficient Std. Error Beta t-value p-value
Constant 26.246* 0.067 48.641* 0.000
LPC 0.003 0.000 0.929 15.820 0.000
R2: 0.862 Sum of Squares for Error (SSE): 2.818 F-ratio: 250.267 (p=0.000) * these values show the results after log transformation
!