Embed Size (px)
Citation preview
Macroeconomic Policy and Institutional Convergence in Member States of Southern African Development Community
November 2007
Economic Commission for Africa (ECA)Southern Africa Office (SRO-SA)

Economic Commission for AfricaSouthern Africa Office
ECA-SA/SADC/TPUB/MEC/2007/03
Macroeconomic Policy and Institutional Convergence in Member States of Southern African Development Community
November 2007

iiiMacroeconomic Policy and Institutional Convergence in Member States of Southern African Development Community
Table of Contents
Acronyms vAcknowledgements vii
1. Introduction 1
II. Developments in the World Economy and Implications for Southern Africa 2 2.1 Global economic performance, world prices for African commodities and implications to Southern Africa 3 2.2 Globalization trends and implications for Southern Africa 3
III. Recent Performance Review and Assessment of the Macroeconomic Convergence (MEC) in SADC Region 5 3.1 Gross Domestic Product 6 3.2 Inflation 8 3.3 Fiscal performance: Government Budget Deficit (as % GDP) 10 3.4 Public Debt and Publicly Guaranteed Debt (as % GDP) 11 3.5 Current Account Balance (as % of GDP) 12 3.6. External Reserves (import cover months) 14 3.7 Domestic saving (% GDP) and Domestic Investment (% GDP) 15
IV. Regional integration issues affecting the macroeconomic Convergence Programme in the SADC Region 18 4.1 Theoretical and Conceptual Issues 18 4.2 Methodological and Statistical Issues 19 4.3 Regional Integration Issues 22 4.4. Institutional issues 23 4.5 Political issues 24 4.6 Reporting issues 24 4.7 Indicator-specific issues 24 (i) Growth 25 (ii) Inflation 25 (iii) Debt/GDP ratio 26 (iv) Current Account Balance 26 (v) Exchange Rates 27 (vi) Relevance of MEC criteria 27
iv
Conclusion 27
References Cited 30
List of Figures
Figure 1. GDP Growth rates of major regions, 2000 – 2007 2Figure 2. Sub-regional growth performance in 2004-2006 3Figure 3. Projected real GDP growth in 2007 by region 4Figure 4. Real GDP growth rate (%) 7Figure 5. Current account Balance (as % of GDP) 14
List of Tables
Table 3.1 Real GDP growth rate (%) 7Table 3.2 SADC Annual Average Inflation Rates 9Table 3.3 SADC Government Budget Deficit (as % GDP) 10Table 3.4 Public Debt (as % of GDP) 12Table 3.5 Current account Balance (as % of GDP) 13Table 3.6 External Reserves (import cover, months) 15Table 3.7 Domestic saving (% GDP) 16Table 3.8 Domestic Investment (as % GDP) 17
vMacroeconomic Policy and Institutional Convergence in Member States of Southern African Development Community
Acronyms and Abbreviations
AEC African Economic Community AfDB African Development BankAIDS Acquired Immune Deficiency Syndrome AU African Union CCBG Committee of Central Bank Governors CEMAC Central African Economic and Monetary Community COMESA Common Market for Eastern and Southern Africa CPI Consumer Price Index DRC Democratic Republic of CongoFDI Foreign Direct InvestmentFIP Finance and Investment Protocol GDP Gross Domestic ProductHCPI Harmonized Consumer Price Index HIPC Highly Indebted Poor CountriesHIV Human Immune Virus ICP-Africa International Comparison Program for Africa IMF International Monetary Fund MDGs Millennium Development GoalsMEC Macroeconomic Convergence MOU Memorandum of Understanding MRI Multilateral Relief Initiative NPISHs Non-profit institutions serving households NSO National Statistics Offices PPP Purchase Power Parity RECs Regional Economic Communities RISDP Regional Indicative Strategic Development PlanSADC Southern Africa Development Community SNA System of National Accounts SPD Structured Product Description Method TIFI Trade, Industry, Finance and Investment of SADCUNECA-SA United Nations Commission for Africa, Southern Africa Office

viiMacroeconomic Policy and Institutional Convergence in Member States of Southern African Development Community
Acknowledgements
This report benefits from an on-going review process involving 14 countries of Southern Africa Development Community (SADC) on macroeconomic convergence. The United Nations Commission for Africa, Southern Af-rica Office (UNECA-SA) in Lusaka undertook the review on behalf of the SADC Secretariat and member states of SADC.
The United Nations Commission for Africa, Southern Africa Office is par-ticularly grateful to Mr. Noko Murangi, Director, Industry, Finance and Investment TIFI, (SADC) and his staff, Mr. Sadwick Mtonakutha, Senior Programme Manager, Ms. Thembi Langa, Senior Program Manager – Fi-nance and Investment and Mr. Willem Goeiemann, Senior Economist who provided the national reports and facilitated the study.
The work was carried out under the general direction of Ms. Jennifer Karg-bo, Director,. UNECA-SA. A team of the Regional Integration and Macro-economic Policy Analysis Programme of UNECA-SA undertook the review under the leadership and coordination of Alfred Latigo, Senior Economic Affairs Officer, and included Mzwanele Mfunwa, Economic Affairs Officer, Ian Filakati, Research Assistant and Grace Kaonga, Team Assistant.

1
1. Introduction
1. This report provides a summary of 14 national reports of Southern Africa Development Community (SADC) member states on past, present and likely future compliance of Memo-randum of Understanding (MOU) on macroeconomic convergence and the Finance and In-vestment Protocol (FIP) adopted by Member States. The paper briefly presents an overview of developments in the world economy and implications for Southern Africa and then focuses on the progress towards the achievement of macroeconomic convergence (MEC) targets in SADC member states. It compares the actual performance against agreed macroeconomic indicators and targets in the SADC macroeconomic convergence programme, and presents prospects for the year 2007 and beyond. MEC as defined in MOU is the convergence by Member States to low and stable levels of inflation, sustainable budget deficits, public and publicly guaranteed debt and current account balances although it now includes other indicators. Although mostly the economic aspects underpinning convergence are considered, political issues are also high-lighted.
2. Section 1 of the report is this introduction, followed by section 2 that reviews the devel-opments in the world economy in 2006 and implications for Southern Africa. Section 3 reviews the performance of the SADC region in 2006 compared with that for the period 2002-2005. The review covers both primary indicators: inflation; budget deficit, public debt and current ac-count balance as percentage of GDP as well as secondary indicators: economic growth, external reserves (import cover months), central bank credit to govt (% of revenues), Domestic saving (% GDP) and domestic investment (% GDP). Section 4 discusses the regional integration process and issues affecting the macroeconomic convergence programme in the SADC region. The report concludes with a summary of topical issues that need to be redressed. Unlike previous reports, this report attempts to map out critical issues in MEC requiring urgent attention. It also covers the period 2002 – 2007 consistent with the need to examine convergence over an extended period.
3. Most of the data used in this paper were sourced from past and recent 14 MEC reports submitted by individual SADC member states. Data were also sourced from reports from the Committee of Central Bank Governors (CCBG). In cases where data were not available from the aforementioned sources, other sources were used, especially, the International Financial Statistics and the World Economic Outlook database prepared by the International Monetary Fund (IMF).
2
II. Developments in the World Economy and implications for Southern Africa
2.1 Global economic performance, world prices for African commodi-ties and implications to Southern Africa
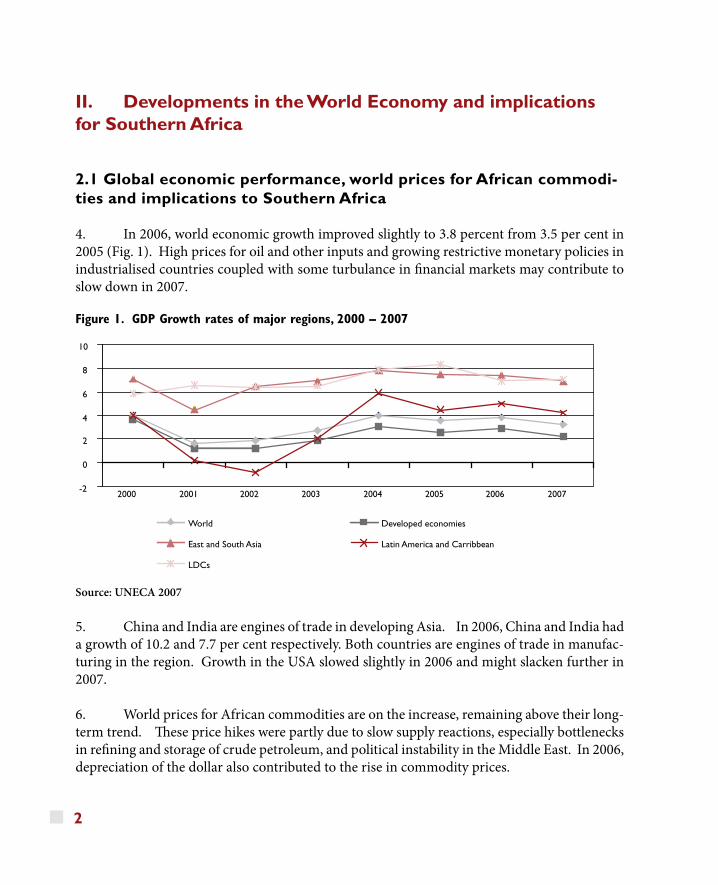
4. In 2006, world economic growth improved slightly to 3.8 percent from 3.5 per cent in 2005 (Fig. 1). High prices for oil and other inputs and growing restrictive monetary policies in industrialised countries coupled with some turbulance in financial markets may contribute to slow down in 2007.
Figure 1. GDP Growth rates of major regions, 2000 – 2007
Source: UNECA 2007
5. China and India are engines of trade in developing Asia. In 2006, China and India had a growth of 10.2 and 7.7 per cent respectively. Both countries are engines of trade in manufac-turing in the region. Growth in the USA slowed slightly in 2006 and might slacken further in 2007.
6. World prices for African commodities are on the increase, remaining above their long-term trend. These price hikes were partly due to slow supply reactions, especially bottlenecks in refining and storage of crude petroleum, and political instability in the Middle East. In 2006, depreciation of the dollar also contributed to the rise in commodity prices.
-2
0
2
4
6
8
10
2000 2001 2002 2003 2004 2005 2006 2007
World Developed economies
East and South Asia Latin America and Carribbean
LDCs
3
7. To Africa and in particular, Southern Africa, exporters of minerals were able to im-prove their external accounts and offset the negative effects of high oil prices on terms of trade. For example, in Zambia total exports increased from $US919 million to $US2095 million be-tween 2002 and 2005 with copper accounting for 57 per cent of total exports. The surge in copper prices has significantly contributed to Zambia’s growth rate of more than 5 per cent in the past three years (UNCTAD 2006a; EIU 2006b; IMF 2006). The rise in oil prices to an aver-age of US$70/barrel in 2006 boosted Angola’s crude oil output to between 1.3m barrels/day to 2m barrels/day in 2007. This rise in oil prices was responsible for high real GDP growth rate of 26.9% in 2006 and an estimated 30% in 2007. 2.2 Globalization trends and implications for Southern Africa
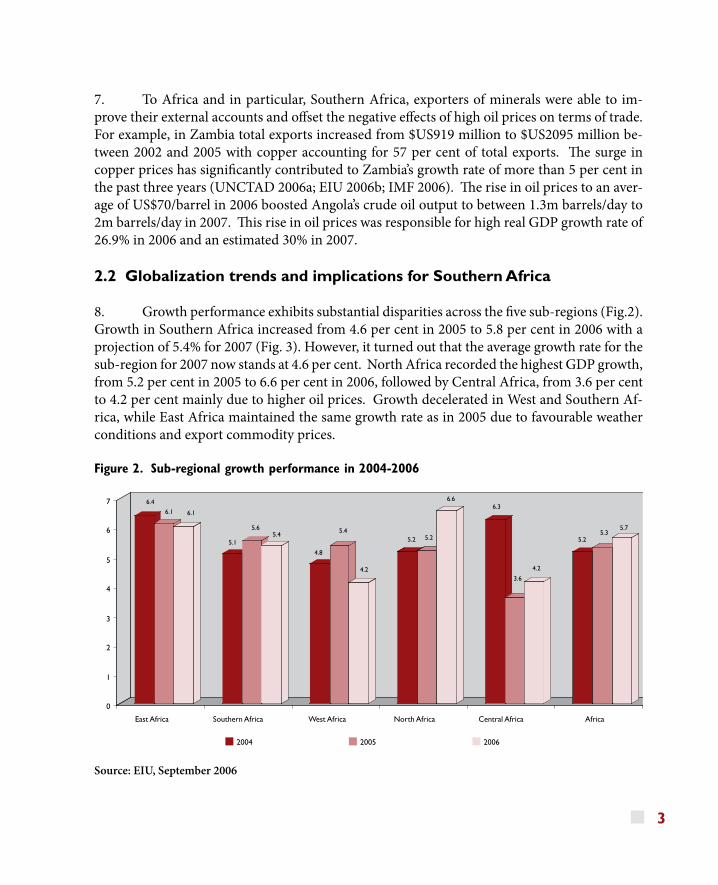
8. Growth performance exhibits substantial disparities across the five sub-regions (Fig.2). Growth in Southern Africa increased from 4.6 per cent in 2005 to 5.8 per cent in 2006 with a projection of 5.4% for 2007 (Fig. 3). However, it turned out that the average growth rate for the sub-region for 2007 now stands at 4.6 per cent. North Africa recorded the highest GDP growth, from 5.2 per cent in 2005 to 6.6 per cent in 2006, followed by Central Africa, from 3.6 per cent to 4.2 per cent mainly due to higher oil prices. Growth decelerated in West and Southern Af-rica, while East Africa maintained the same growth rate as in 2005 due to favourable weather conditions and export commodity prices.
Figure 2. Sub-regional growth performance in 2004-2006
Source: EIU, September 2006
6.4
6.1 6.1
5.1
5.65.4
4.8
4.2
5.2
6.66.3
3.6
4.2
5.25.3
5.7
0
1
2
3
4
5
6
7
Growth rate (%)
East Africa Southern Africa West Africa North Africa Central Africa Africa
2004 2005 2006
5.25.4
4
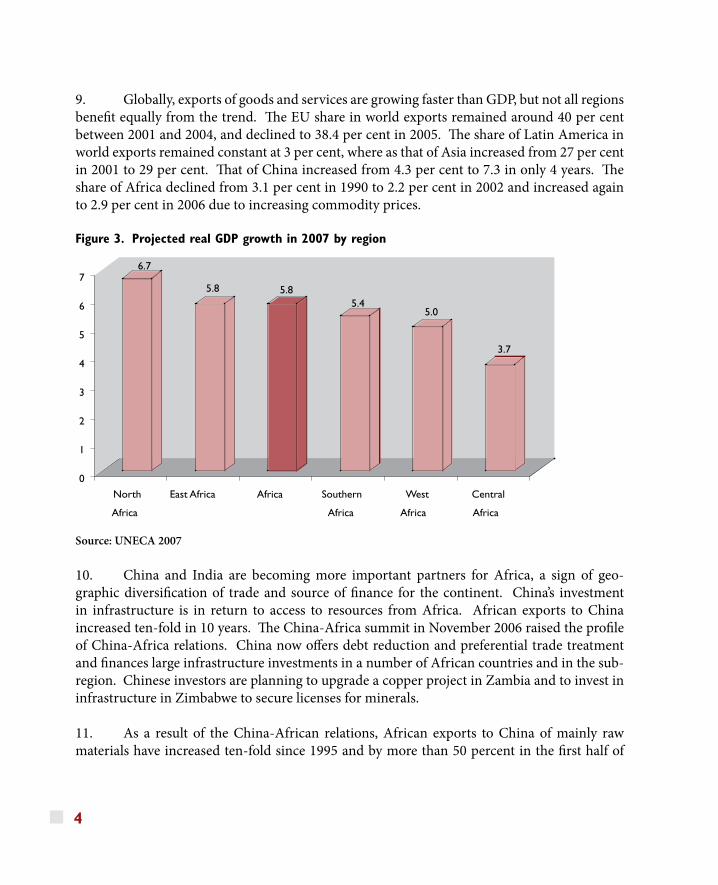
9. Globally, exports of goods and services are growing faster than GDP, but not all regions benefit equally from the trend. The EU share in world exports remained around 40 per cent between 2001 and 2004, and declined to 38.4 per cent in 2005. The share of Latin America in world exports remained constant at 3 per cent, where as that of Asia increased from 27 per cent in 2001 to 29 per cent. That of China increased from 4.3 per cent to 7.3 in only 4 years. The share of Africa declined from 3.1 per cent in 1990 to 2.2 per cent in 2002 and increased again to 2.9 per cent in 2006 due to increasing commodity prices.
Figure 3. Projected real GDP growth in 2007 by region
Source: UNECA 2007
10. China and India are becoming more important partners for Africa, a sign of geo-graphic diversification of trade and source of finance for the continent. China’s investment in infrastructure is in return to access to resources from Africa. African exports to China increased ten-fold in 10 years. The China-Africa summit in November 2006 raised the profile of China-Africa relations. China now offers debt reduction and preferential trade treatment and finances large infrastructure investments in a number of African countries and in the sub-region. Chinese investors are planning to upgrade a copper project in Zambia and to invest in infrastructure in Zimbabwe to secure licenses for minerals.
11. As a result of the China-African relations, African exports to China of mainly raw materials have increased ten-fold since 1995 and by more than 50 percent in the first half of
6.7
5.8 5.85.4
5.0
3.7
0
1
2
3
4
5
6
7
North
Africa
East Africa Africa Southern
Africa
West
Africa
Central
Africa
5
2006 alone. For example in 2006, Angola overtook Saudi Arabia and Iran to become China’s largest crude oil supplier, exporting 456,000 barrels/day (b/d) – 15% of Chinese crude imports compared with 445,000 b/d from Saudi Arabia. Imports from China have also increased by 30 per cent in 2006.
12. Much as China and India are becoming major sources of FDI in Africa, there are some concerns with this growing influence. One complaint is that they are not observing workers’ rights and do not protect the environment, as they face less pressure from civil society. In ad-dition, they bring a lot of Chinese personnel, a trend that could undermine capacity building. Also, the high demand for Chinese commodities reduces the incentives to diversify. Sudden increases in export revenues cause exchange rate appreciation and increase the risk of currency instability due to fluctuations in commodity prices. There is also a risk for countries that have just reduced their debt burden through HIPC and Multilateral Relief Initiative to accumulate more debt through Chinese infrastructure and export credit loans.
13. Of concern to Africa as a whole are the impending risks for its countries arising from competition from Asia and the protectionist trade policies in major export destination coun-tries. African countries need to observe these international developments carefully and to en-force measures to reduce vulnerability to external shocks, increase diversification and strength-en domestic demand.
III. Recent Performance Review and Assessment of the Macroeconomic Convergence (MEC) in SADC Region
14. This section presents the level of convergence of the SADC region between 2002 and 2006 in terms of whether or not the process of convergence is sustainable over time by the member states. The SADC members that did not achieve the different convergence targets be-tween 2002 and 2006 are highlighted in red shade as opposed to light red shade for those, which have achieved. The performance by different MEC targets are depicted in Tables 3.1 – 3.8.
6
3.1 Gross Domestic Product
15. Southern African countries like other African sub-regions still face the critical chal-lenge of raising the rate of GDP growth and sustaining high growth rates over an extended period in order to accelerate progress towards meeting the Millennium Development Goals (MDGs). While growth has recovered over the past few years, very few countries have achieved and maintained the growth rate of at least 7 per cent that is necessary to reduce poverty and create employment. High levels of poverty and unemployment continue to be registered in the sub-region where 50 per cent of the population is below poverty line and unemployment range from 9.3 per cent for Mauritius to 43 per cent in Lesotho. Also, high levels of HIV/AIDS pan-demic (18%) and the resultant low life expectancy (45.7), and high levels of income inequality characterize the economies of the sub-region. Countries with the highest inequality are Na-mibia, Botswana, Lesotho and Swaziland at more than 60 per cent. The sub-region is plagued by shocks from the instabilities in international markets, climatic changes and the increasing HIV/AIDS pandemic.
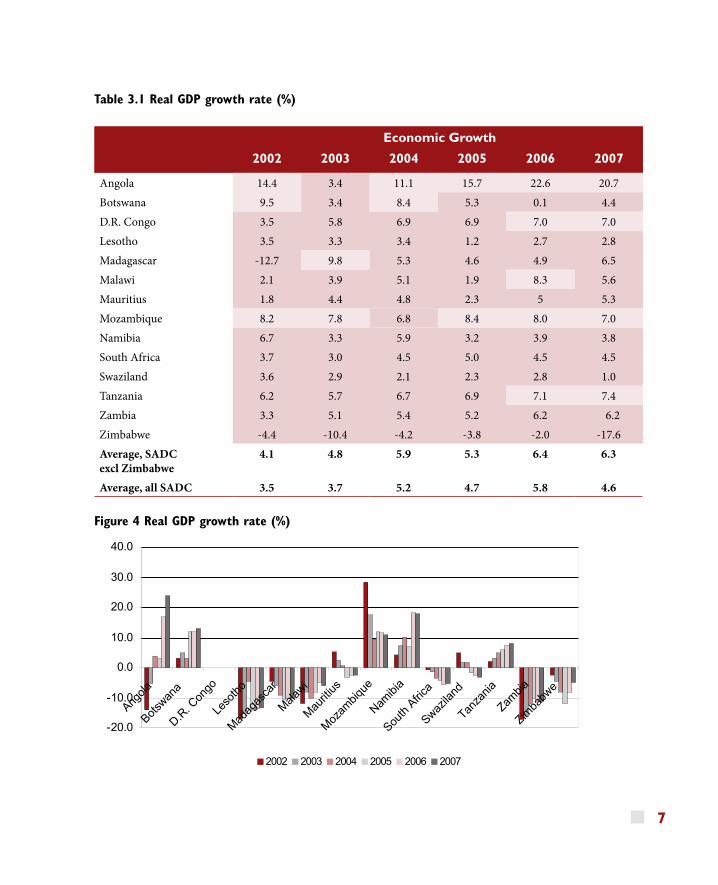
16. Growth in Southern Africa increased from 4.7 per cent in 2005 to 5.8 per cent in 2006, exhibiting marked disparities across the sub-region characterized by factors such as endow-ment of natural resources, political climate, exogenenous factors including external markets as outlined below. Five countries in the sub-region registered marked increase in GDP growth rates of 7 per cent and above in 2006 (Angola, DRC, Malawi, Mozambique and Tanzania), while Zimbabwe continues to register negative growth rate.
17. Angola and South Africa continue to influence economic performance of the sub-re-gion. Angola remains the fastest growing economy in Southern Africa influenced by the oil sector. The economy grew by 15.7% in 2005, 22.6% in 2006 and is expected to reduce to 20.7% in 2007. South Africa, which accounted for 73% of the sub-region’s GDP in 2005, grew by 4.5% in 2006 with projection of 4.5% in 2007.
18. The main factors that contributed to increases in GDP growth in Southern Africa in-clude: increased political stability - decline in conflicts (Angola and Mozambique); and debt relief and external capital flows (Malawi).
19. Unfavourable factors that contributed to decline in GDP in some countries are: lack of diversification of production and export base; high oil prices which hurt oil importers through the current account and inflationary pressures; inefficient public infrastructure and unreliable energy supply at the national level as well as poor integration of transportation and energy net-work at the regional level; and weather conditions and fluctuations in commodity prices.
7
Table 3.1 Real GDP growth rate (%)
Economic Growth
2002 2003 2004 2005 2006 2007
Angola 14.4 3.4 11.1 15.7 22.6 20.7Botswana 9.5 3.4 8.4 5.3 0.1 4.4D.R. Congo 3.5 5.8 6.9 6.9 7.0 7.0Lesotho 3.5 3.3 3.4 1.2 2.7 2.8Madagascar -12.7 9.8 5.3 4.6 4.9 6.5Malawi 2.1 3.9 5.1 1.9 8.3 5.6Mauritius 1.8 4.4 4.8 2.3 5 5.3Mozambique 8.2 7.8 6.8 8.4 8.0 7.0 Namibia 6.7 3.3 5.9 3.2 3.9 3.8South Africa 3.7 3.0 4.5 5.0 4.5 4.5Swaziland 3.6 2.9 2.1 2.3 2.8 1.0Tanzania 6.2 5.7 6.7 6.9 7.1 7.4Zambia 3.3 5.1 5.4 5.2 6.2 6.2 Zimbabwe -4.4 -10.4 -4.2 -3.8 -2.0 -17.6Average, SADC excl Zimbabwe
4.1 4.8 5.9 5.3 6.4 6.3
Average, all SADC 3.5 3.7 5.2 4.7 5.8 4.6
Figure 4 Real GDP growth rate (%)
-20.0
-10.0
0.0
10.0
20.0
30.0
40.0
Angola
Botswan
a
D.R. C
ongo
Leso
tho
Madag
asca
r
Malawi
Mauriti
us
Mozam
bique
Namibi
a
South
Africa
Swazila
nd
Tanza
nia
Zambia
Zimba
bwe
2002 2003 2004 2005 2006 2007
8
20. Disparity can also be cited in the diversification of Southern African economies as one way of sustaining the recent economic growth achievements. Diversification helps build com-petitive economies that can productively be integrated into the regional and global economy. Several Southern African economies suffer from low levels of diversification in exports and very little change over the past two decades. However, compared to other sub-regions, SADC is the most diversified sub-region on the continent. It is followed by COMESA and North Af-rica. CEMAC has remained the least diversified. Diversification in SADC in recent years is attributed more to heavily diversified economies of Mauritius and South Africa.
21. Diversification in Mauritius is reflected in more traditional sectors that include sugar and honey, knitted outer garments; watches and clocks as well as non-traditional export sectors: fish, woven cotton fabrics, knitted undergarments, and non-knitted women’s wear. However, unlike Mauritius and South Africa the Angolan economy is becoming increasingly concen-trated owing to reliance on oil, which constitutes over 93% of exports. Angola is now more de-pendant on oil than any country in sub-Saharan Africa and other countries. Today, oil revenue as a percentage of GDP is over 84% compared to 59.3% for Kuwait, 77.3% for Oman and 58.2% for Venezezuela, distorting macroeconomic variables.
3.2 Inflation
22. Inflation is the most basic and visible indicator of a lack of balance between the demand and supply of resources in the economy. High and rising inflation demonstrates an imbalance in resource utilization in the economy and serves as a prime indicator of macroeconomic in-stability. It erodes the purchasing power of the poorest and most vulnerable society. And, it introduces uncertainty into decision-making and colludes with debt to deepen poverty.
9
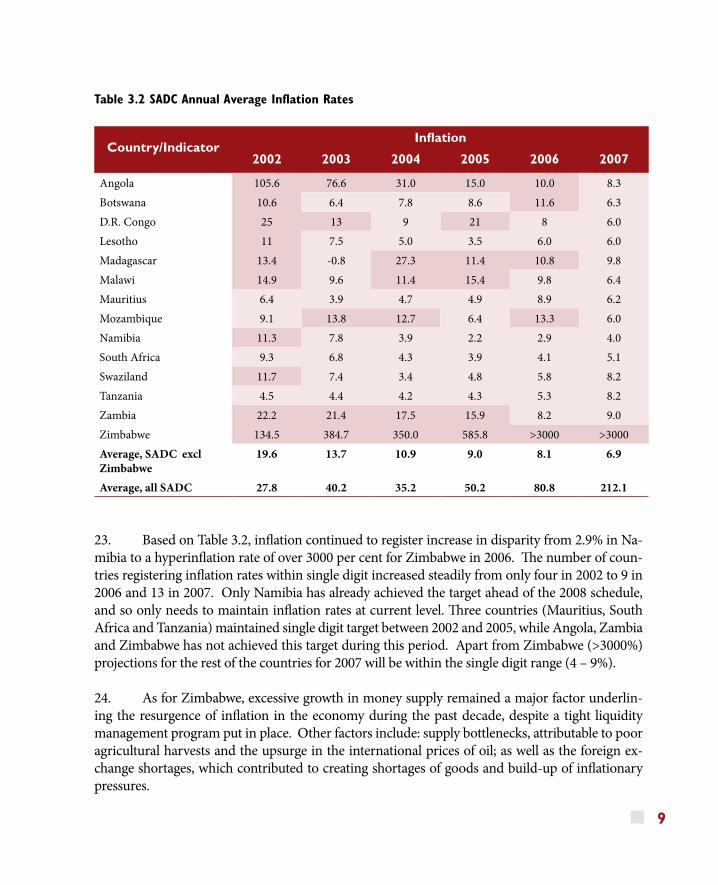
Table 3.2 SADC Annual Average Inflation Rates
Country/Indicator
Inflation
2002 2003 2004 2005 2006 2007
Angola 105.6 76.6 31.0 15.0 10.0 8.3Botswana 10.6 6.4 7.8 8.6 11.6 6.3D.R. Congo 25 13 9 21 8 6.0Lesotho 11 7.5 5.0 3.5 6.0 6.0Madagascar 13.4 -0.8 27.3 11.4 10.8 9.8Malawi 14.9 9.6 11.4 15.4 9.8 6.4Mauritius 6.4 3.9 4.7 4.9 8.9 6.2Mozambique 9.1 13.8 12.7 6.4 13.3 6.0 Namibia 11.3 7.8 3.9 2.2 2.9 4.0South Africa 9.3 6.8 4.3 3.9 4.1 5.1Swaziland 11.7 7.4 3.4 4.8 5.8 8.2Tanzania 4.5 4.4 4.2 4.3 5.3 8.2Zambia 22.2 21.4 17.5 15.9 8.2 9.0 Zimbabwe 134.5 384.7 350.0 585.8 >3000 >3000Average, SADC excl Zimbabwe
19.6 13.7 10.9 9.0 8.1 6.9
Average, all SADC 27.8 40.2 35.2 50.2 80.8 212.1
23. Based on Table 3.2, inflation continued to register increase in disparity from 2.9% in Na-mibia to a hyperinflation rate of over 3000 per cent for Zimbabwe in 2006. The number of coun-tries registering inflation rates within single digit increased steadily from only four in 2002 to 9 in 2006 and 13 in 2007. Only Namibia has already achieved the target ahead of the 2008 schedule, and so only needs to maintain inflation rates at current level. Three countries (Mauritius, South Africa and Tanzania) maintained single digit target between 2002 and 2005, while Angola, Zambia and Zimbabwe has not achieved this target during this period. Apart from Zimbabwe (>3000%) projections for the rest of the countries for 2007 will be within the single digit range (4 – 9%).
24. As for Zimbabwe, excessive growth in money supply remained a major factor underlin-ing the resurgence of inflation in the economy during the past decade, despite a tight liquidity management program put in place. Other factors include: supply bottlenecks, attributable to poor agricultural harvests and the upsurge in the international prices of oil; as well as the foreign ex-change shortages, which contributed to creating shortages of goods and build-up of inflationary pressures.
10
25. Inflation for 2007 shows that the inflation for all countries in the sub-region will be within the inflation target band due to mainly compliance with this criteria, which calls for a tight mon-etary policy from intervention of central banks to ensure its stability.
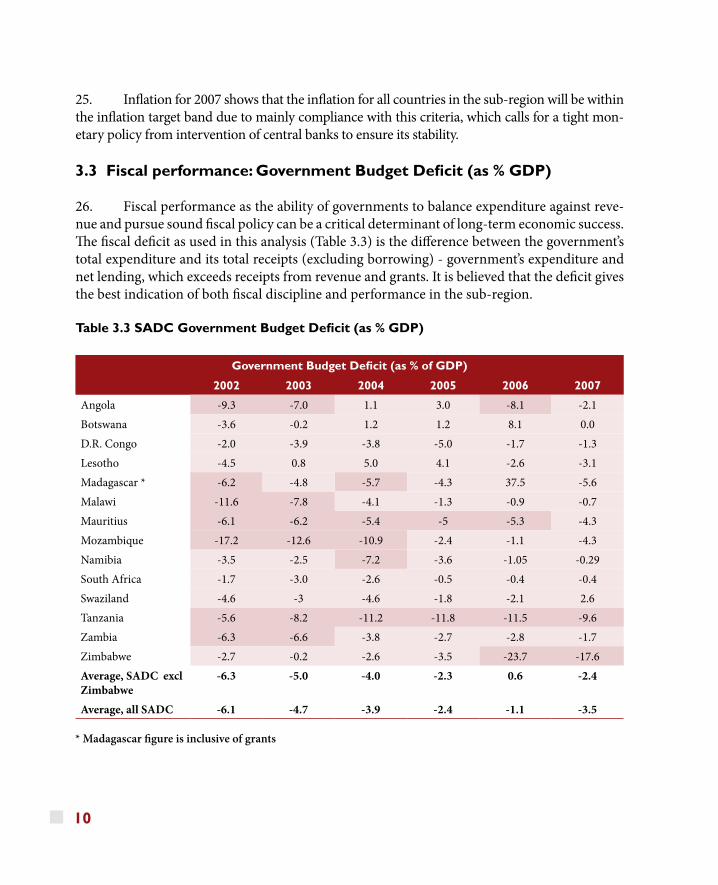
3.3 Fiscal performance: Government Budget Deficit (as % GDP)
26. Fiscal performance as the ability of governments to balance expenditure against reve-nue and pursue sound fiscal policy can be a critical determinant of long-term economic success. The fiscal deficit as used in this analysis (Table 3.3) is the difference between the government’s total expenditure and its total receipts (excluding borrowing) - government’s expenditure and net lending, which exceeds receipts from revenue and grants. It is believed that the deficit gives the best indication of both fiscal discipline and performance in the sub-region.
Table 3.3 SADC Government Budget Deficit (as % GDP)
Government Budget Deficit (as % of GDP)
2002 2003 2004 2005 2006 2007
Angola -9.3 -7.0 1.1 3.0 -8.1 -2.1Botswana -3.6 -0.2 1.2 1.2 8.1 0.0D.R. Congo -2.0 -3.9 -3.8 -5.0 -1.7 -1.3Lesotho -4.5 0.8 5.0 4.1 -2.6 -3.1Madagascar * -6.2 -4.8 -5.7 -4.3 37.5 -5.6Malawi -11.6 -7.8 -4.1 -1.3 -0.9 -0.7Mauritius -6.1 -6.2 -5.4 -5 -5.3 -4.3Mozambique -17.2 -12.6 -10.9 -2.4 -1.1 -4.3Namibia -3.5 -2.5 -7.2 -3.6 -1.05 -0.29South Africa -1.7 -3.0 -2.6 -0.5 -0.4 -0.4Swaziland -4.6 -3 -4.6 -1.8 -2.1 2.6Tanzania -5.6 -8.2 -11.2 -11.8 -11.5 -9.6Zambia -6.3 -6.6 -3.8 -2.7 -2.8 -1.7Zimbabwe -2.7 -0.2 -2.6 -3.5 -23.7 -17.6Average, SADC excl Zimbabwe
-6.3 -5.0 -4.0 -2.3 0.6 -2.4
Average, all SADC -6.1 -4.7 -3.9 -2.4 -1.1 -3.5
* Madagascar figure is inclusive of grants
11
27. All countries except Angola, Mauritius, Tanzania and Zimbabwe show improved fiscal deficit in 2006 against SADC target for 2008 of <5 per cent of GDP. Only Botswana, Lesotho, Namibia, South Africa and Swaziland maintained a budget deficit of below or equal to 5 per cent. Botswana recorded fiscal surpluses between in 2004 and 2006, while Madagascar in 2006. The dominance of the South African economy and its low budget deficit of 0.4% in 2006, ac-counts for this comparatively low estimate in SACU countries. Angola, Zambia and Zimbabwe saw a widening of the budget deficit in 2006.
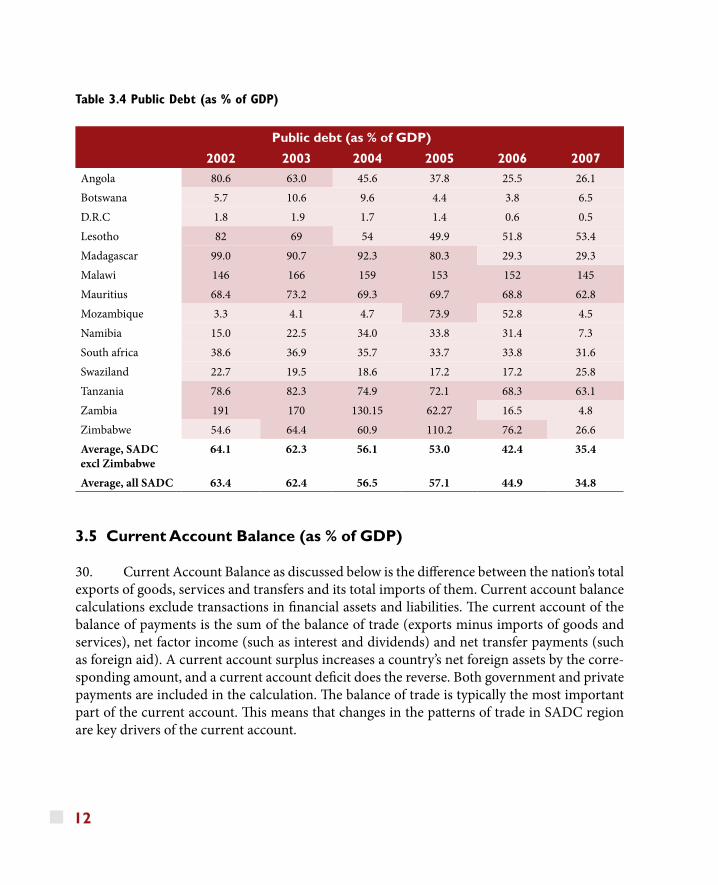
3.4 Public Debt and Publicly Guaranteed Debt (as % GDP)
28. Public Debt and Publicly Guaranteed Debt as presented in this report is the amount of monies disbursed and outstanding contractual monetary liabilities of residents of a country to repay a principal debt with or without interest, or to pay interest with or without the principal debt. Such debt consists of loans to government, including loans to public enterprises and pri-vate companies enjoying government guarantees.
29. Six SADC countries benefited from debt forgiveness under the HIPC initiative (DRC, Madagascar, Mozambique, Tanzania and Zambia except for Malawi). Consequently, there has been a decrease in Public debt in these countries recording a stock of public debt below the SADC target of 60 per cent of GDP. There was an improvement in the public debt ratio in SADC from 63.4 per cent in 2002 to 44.9 per cent in 2006 with a further projected reduction to 36.0 in 2007.
12
Table 3.4 Public Debt (as % of GDP)
Public debt (as % of GDP)
2002 2003 2004 2005 2006 2007
Angola 80.6 63.0 45.6 37.8 25.5 26.1Botswana 5.7 10.6 9.6 4.4 3.8 6.5D.R.C 1.8 1.9 1.7 1.4 0.6 0.5 Lesotho 82 69 54 49.9 51.8 53.4Madagascar 99.0 90.7 92.3 80.3 29.3 29.3Malawi 146 166 159 153 152 145Mauritius 68.4 73.2 69.3 69.7 68.8 62.8Mozambique 3.3 4.1 4.7 73.9 52.8 4.5Namibia 15.0 22.5 34.0 33.8 31.4 7.3South africa 38.6 36.9 35.7 33.7 33.8 31.6Swaziland 22.7 19.5 18.6 17.2 17.2 25.8Tanzania 78.6 82.3 74.9 72.1 68.3 63.1Zambia 191 170 130.15 62.27 16.5 4.8Zimbabwe 54.6 64.4 60.9 110.2 76.2 26.6Average, SADC excl Zimbabwe
64.1 62.3 56.1 53.0 42.4 35.4
Average, all SADC 63.4 62.4 56.5 57.1 44.9 34.8
3.5 Current Account Balance (as % of GDP)
30. Current Account Balance as discussed below is the difference between the nation’s total exports of goods, services and transfers and its total imports of them. Current account balance calculations exclude transactions in financial assets and liabilities. The current account of the balance of payments is the sum of the balance of trade (exports minus imports of goods and services), net factor income (such as interest and dividends) and net transfer payments (such as foreign aid). A current account surplus increases a country’s net foreign assets by the corre-sponding amount, and a current account deficit does the reverse. Both government and private payments are included in the calculation. The balance of trade is typically the most important part of the current account. This means that changes in the patterns of trade in SADC region are key drivers of the current account.
13
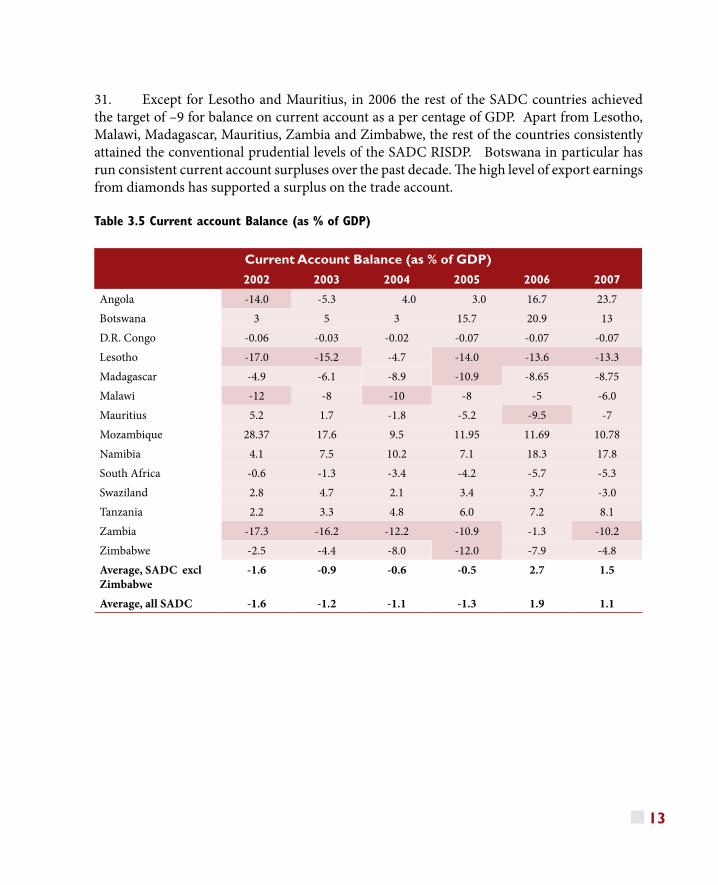
31. Except for Lesotho and Mauritius, in 2006 the rest of the SADC countries achieved the target of –9 for balance on current account as a per centage of GDP. Apart from Lesotho, Malawi, Madagascar, Mauritius, Zambia and Zimbabwe, the rest of the countries consistently attained the conventional prudential levels of the SADC RISDP. Botswana in particular has run consistent current account surpluses over the past decade. The high level of export earnings from diamonds has supported a surplus on the trade account. Table 3.5 Current account Balance (as % of GDP)
Current Account Balance (as % of GDP)
2002 2003 2004 2005 2006 2007
Angola -14.0 -5.3 4.0 3.0 16.7 23.7Botswana 3 5 3 15.7 20.9 13D.R. Congo -0.06 -0.03 -0.02 -0.07 -0.07 -0.07Lesotho -17.0 -15.2 -4.7 -14.0 -13.6 -13.3Madagascar -4.9 -6.1 -8.9 -10.9 -8.65 -8.75Malawi -12 -8 -10 -8 -5 -6.0Mauritius 5.2 1.7 -1.8 -5.2 -9.5 -7Mozambique 28.37 17.6 9.5 11.95 11.69 10.78Namibia 4.1 7.5 10.2 7.1 18.3 17.8South Africa -0.6 -1.3 -3.4 -4.2 -5.7 -5.3Swaziland 2.8 4.7 2.1 3.4 3.7 -3.0Tanzania 2.2 3.3 4.8 6.0 7.2 8.1Zambia -17.3 -16.2 -12.2 -10.9 -1.3 -10.2Zimbabwe -2.5 -4.4 -8.0 -12.0 -7.9 -4.8Average, SADC excl Zimbabwe
-1.6 -0.9 -0.6 -0.5 2.7 1.5
Average, all SADC -1.6 -1.2 -1.1 -1.3 1.9 1.1
14
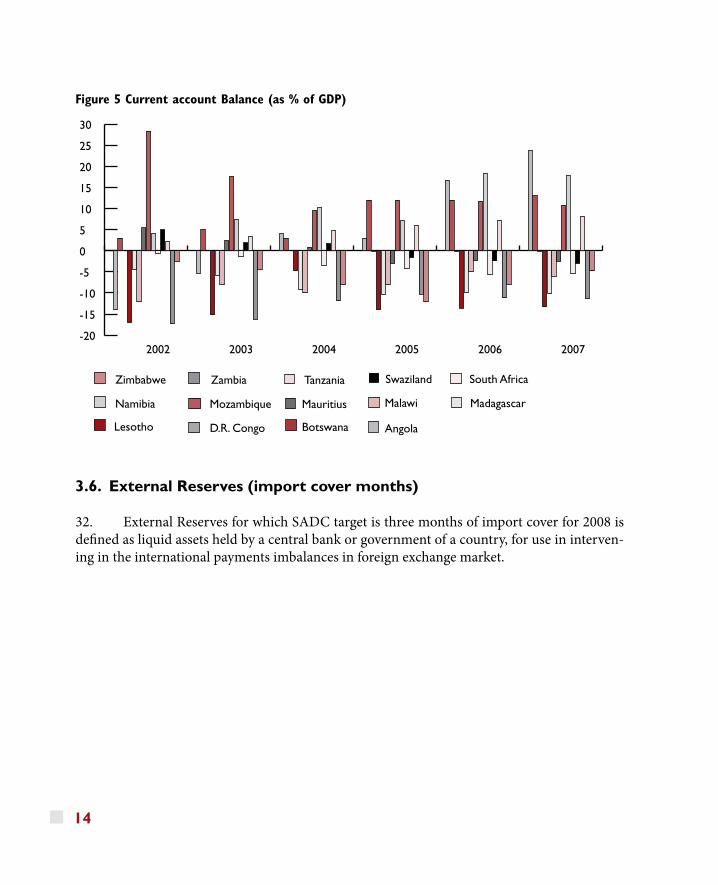
Figure 5 Current account Balance (as % of GDP)
3.6. External Reserves (import cover months)
32. External Reserves for which SADC target is three months of import cover for 2008 is defined as liquid assets held by a central bank or government of a country, for use in interven-ing in the international payments imbalances in foreign exchange market.
-20
-15
-10
-5
0
5
10
15
20
25
30Zimbabwe
Zambia
Tanzania
Swaziland
South Africa
Namibia
Mozambique
Mauritius
Malawi
Madagascar
Lesotho
D.R. Congo
Botswana
Angola
Zimbabwe Zambia Tanzania Swaziland South Africa
Namibia Mozambique Mauritius Malawi Madagascar
Lesotho D.R. Congo Botswana Angola
200720062005200420032002
15
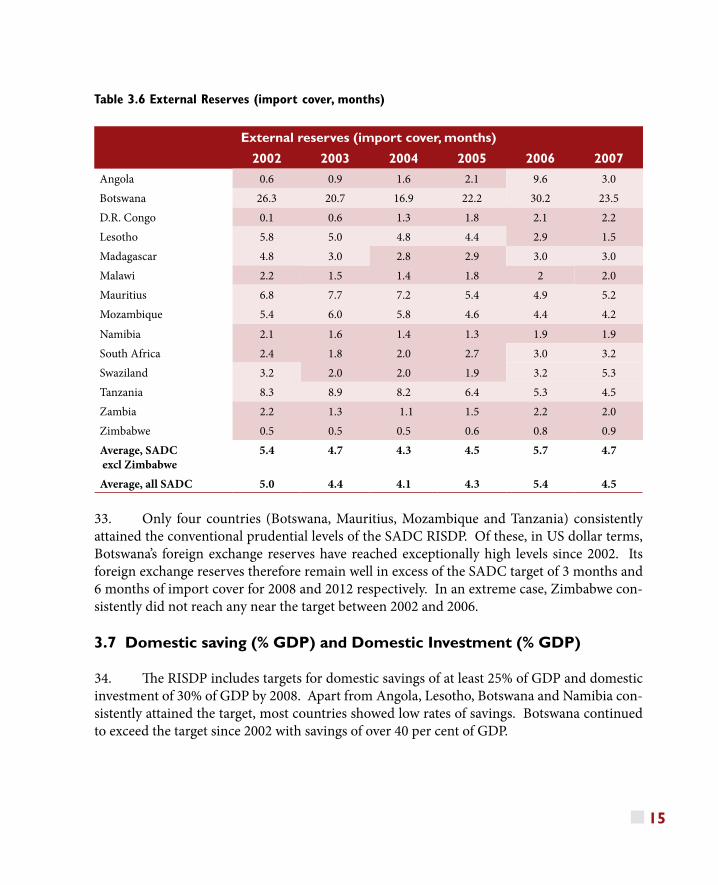
Table 3.6 External Reserves (import cover, months)
External reserves (import cover, months)
2002 2003 2004 2005 2006 2007
Angola 0.6 0.9 1.6 2.1 9.6 3.0 Botswana 26.3 20.7 16.9 22.2 30.2 23.5 D.R. Congo 0.1 0.6 1.3 1.8 2.1 2.2 Lesotho 5.8 5.0 4.8 4.4 2.9 1.5 Madagascar 4.8 3.0 2.8 2.9 3.0 3.0Malawi 2.2 1.5 1.4 1.8 2 2.0 Mauritius 6.8 7.7 7.2 5.4 4.9 5.2 Mozambique 5.4 6.0 5.8 4.6 4.4 4.2
Namibia 2.1 1.6 1.4 1.3 1.9 1.9 South Africa 2.4 1.8 2.0 2.7 3.0 3.2 Swaziland 3.2 2.0 2.0 1.9 3.2 5.3Tanzania 8.3 8.9 8.2 6.4 5.3 4.5 Zambia 2.2 1.3 1.1 1.5 2.2 2.0 Zimbabwe 0.5 0.5 0.5 0.6 0.8 0.9 Average, SADC excl Zimbabwe
5.4 4.7 4.3 4.5 5.7 4.7
Average, all SADC 5.0 4.4 4.1 4.3 5.4 4.5
33. Only four countries (Botswana, Mauritius, Mozambique and Tanzania) consistently attained the conventional prudential levels of the SADC RISDP. Of these, in US dollar terms, Botswana’s foreign exchange reserves have reached exceptionally high levels since 2002. Its foreign exchange reserves therefore remain well in excess of the SADC target of 3 months and 6 months of import cover for 2008 and 2012 respectively. In an extreme case, Zimbabwe con-sistently did not reach any near the target between 2002 and 2006.
3.7 Domestic saving (% GDP) and Domestic Investment (% GDP)
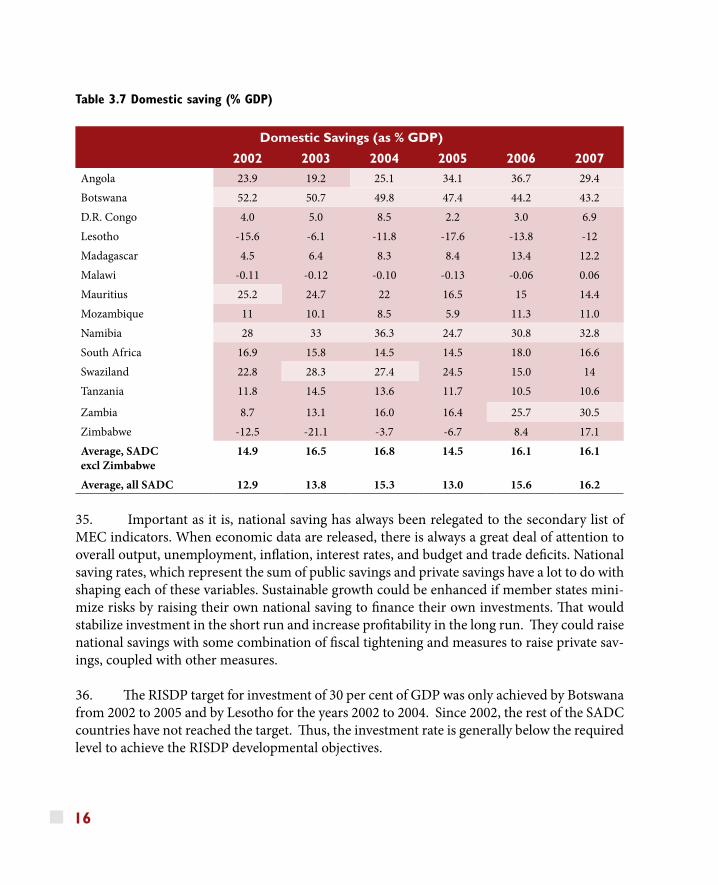
34. The RISDP includes targets for domestic savings of at least 25% of GDP and domestic investment of 30% of GDP by 2008. Apart from Angola, Lesotho, Botswana and Namibia con-sistently attained the target, most countries showed low rates of savings. Botswana continued to exceed the target since 2002 with savings of over 40 per cent of GDP.
16
Table 3.7 Domestic saving (% GDP)
Domestic Savings (as % GDP)
2002 2003 2004 2005 2006 2007
Angola 23.9 19.2 25.1 34.1 36.7 29.4Botswana 52.2 50.7 49.8 47.4 44.2 43.2D.R. Congo 4.0 5.0 8.5 2.2 3.0 6.9Lesotho -15.6 -6.1 -11.8 -17.6 -13.8 -12Madagascar 4.5 6.4 8.3 8.4 13.4 12.2Malawi -0.11 -0.12 -0.10 -0.13 -0.06 0.06Mauritius 25.2 24.7 22 16.5 15 14.4Mozambique 11 10.1 8.5 5.9 11.3 11.0Namibia 28 33 36.3 24.7 30.8 32.8South Africa 16.9 15.8 14.5 14.5 18.0 16.6Swaziland 22.8 28.3 27.4 24.5 15.0 14Tanzania 11.8 14.5 13.6 11.7 10.5 10.6
Zambia 8.7 13.1 16.0 16.4 25.7 30.5 Zimbabwe -12.5 -21.1 -3.7 -6.7 8.4 17.1Average, SADC excl Zimbabwe
14.9 16.5 16.8 14.5 16.1 16.1
Average, all SADC 12.9 13.8 15.3 13.0 15.6 16.2
35. Important as it is, national saving has always been relegated to the secondary list of MEC indicators. When economic data are released, there is always a great deal of attention to overall output, unemployment, inflation, interest rates, and budget and trade deficits. National saving rates, which represent the sum of public savings and private savings have a lot to do with shaping each of these variables. Sustainable growth could be enhanced if member states mini-mize risks by raising their own national saving to finance their own investments. That would stabilize investment in the short run and increase profitability in the long run. They could raise national savings with some combination of fiscal tightening and measures to raise private sav-ings, coupled with other measures.
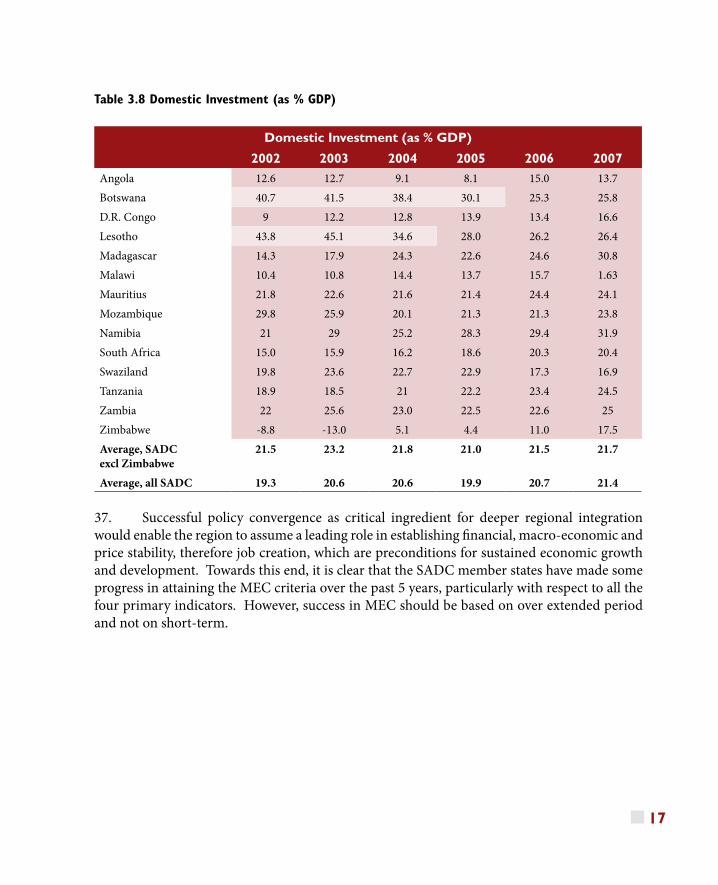
36. The RISDP target for investment of 30 per cent of GDP was only achieved by Botswana from 2002 to 2005 and by Lesotho for the years 2002 to 2004. Since 2002, the rest of the SADC countries have not reached the target. Thus, the investment rate is generally below the required level to achieve the RISDP developmental objectives.
17
Table 3.8 Domestic Investment (as % GDP)
Domestic Investment (as % GDP)
2002 2003 2004 2005 2006 2007
Angola 12.6 12.7 9.1 8.1 15.0 13.7Botswana 40.7 41.5 38.4 30.1 25.3 25.8D.R. Congo 9 12.2 12.8 13.9 13.4 16.6Lesotho 43.8 45.1 34.6 28.0 26.2 26.4Madagascar 14.3 17.9 24.3 22.6 24.6 30.8Malawi 10.4 10.8 14.4 13.7 15.7 1.63Mauritius 21.8 22.6 21.6 21.4 24.4 24.1Mozambique 29.8 25.9 20.1 21.3 21.3 23.8Namibia 21 29 25.2 28.3 29.4 31.9South Africa 15.0 15.9 16.2 18.6 20.3 20.4Swaziland 19.8 23.6 22.7 22.9 17.3 16.9Tanzania 18.9 18.5 21 22.2 23.4 24.5Zambia 22 25.6 23.0 22.5 22.6 25Zimbabwe -8.8 -13.0 5.1 4.4 11.0 17.5Average, SADCexcl Zimbabwe
21.5 23.2 21.8 21.0 21.5 21.7
Average, all SADC 19.3 20.6 20.6 19.9 20.7 21.4
37. Successful policy convergence as critical ingredient for deeper regional integration would enable the region to assume a leading role in establishing financial, macro-economic and price stability, therefore job creation, which are preconditions for sustained economic growth and development. Towards this end, it is clear that the SADC member states have made some progress in attaining the MEC criteria over the past 5 years, particularly with respect to all the four primary indicators. However, success in MEC should be based on over extended period and not on short-term.
18
IV. Regional integration issues affecting the macroeconomic Convergence Programme in the SADC Region
38. The study of cross-national policy convergence is a highly popular research area in contemporary development agenda. As a consequence, there is an ever-growing body of stud-ies that investigate the occurrence and the underlying driving forces of cross-national MEC. Notwithstanding these enormous research efforts, it is generally acknowledged that several in-terrelated issues abound in MEC, namely:
(i) Theoretical and conceptual issues;(ii) Methodological and statistical issues;(iii) Regional integration issues;(iv) Institutional issues;(v) Political issues; (vi) Indicator-specific issues; and(vii) Reporting issues
4.1 Theoretical and Conceptual Issues
39. To date there is limited understanding of the causes and conditions of macroeconomic convergence. This deficiency can be traced to two key problems. First, economic researchers argue that much more emphasis has been placed on the presentation of empirical results than on systematic theory-building. Second, policy convergence is a rather heterogeneous research field, with scholars coming from different academic backgrounds and disciplines (including, for instance, comparative politics, policy analysis and international relations). Hence, policy convergence is typically analyzed from rather diverse theoretical perspectives employed in re-lated research areas, such as policy transfer1, policy diffusion2 or isomorphism3. It is therefore hardly surprising that we find a broad number of different factors that are mentioned as poten-tial causes of policy convergence. At the same time, theoretical and conceptual heterogeneity poses important restrictions on the comparability of the empirical findings gained in different convergence studies.
1 Dolowitz and Marsh (1996, 2000) provide a classification along a continuum between coercive and voluntary policy transfer, ranging from perfectly rational lesson-drawing of government A learning from government B to the direct imposition of a policy on country A by country B.2 Simmons and Elkins (2004) distinguish three policy diffusion mechanisms: direct economic competition, informational networks, and social emulation as causes of convergence3 In DiMaggio and Powell’s (1991) theory, institutional isomorphism can result from coercion, mimetic processes, and normative pressures.
19
40. While treatise of theoretical and conceptual issues of MEC are out of the scope of this paper, it is an important area of future research to develop hypotheses and to undertake em-pirical research on the interaction effects of all potential causal mechanisms. Such a study has the potential of minimizing the current apparent ambiguity observed in some MEC studies in Africa and elsewhere as well as instituting remedial measures for macroeconomic divergence. This is because causes and factors regarding the scope, degree and direction of cross-national policy convergence as well as the conditions and effects of convergence vary strongly across the different countries of a given REC. Such studies for example, could include income and insti-tutional convergence and their relationship to MEC
4.2 Methodological and Statistical Issues
41. Related to theoretical and conceptual deficiencies in any MEC programme are meth-odological issues with statistical issues emerging as probably the most critical to monitoring progress made in convergence. One key issue is that of inadequate maintenance of track record of compliance with MEC criteria for an extended period of beyond 5 years or so. This problem can be attributed to two key factors: (i) lack of a permanent statistical monitoring system; and (ii) lack of availability of comprehensive, timely and accurate statistical information to build on relevant efforts being made at sub-regional level, as well as on lessons learned from the Interna-tional Comparison Program for Africa (ICP-Africa)4.
42. African countries are striving towards the formation of the African Economic Commu-nity (AEC). The African Development Bank (AfDB), the African Union (AU), and the United Nations Economic Commission for Africa (UNECA) are working together on a regional inte-gration agenda to promote policies and programs that would: (i) speed up the formation of the AEC, (ii) promote intra-African trade, (iii) harmonize and coordinate policies and programs in Regional Economic Communities (RECs), and (iv) promote and develop infrastructure policies and programs. In order to assess the economic and social integration process within their zone, these economic and monetary unions need convergence and surveillance statistical indicators, including indicators of population, external trade, public finance, prices, income, employment and national accounts.
43. To increase the comparability of these indicators across countries, some groupings have created statistical units aimed at strengthening the harmonization of national statistics and building sustainable capacities in member states. However, the quality of statistical infor-mation in the majority of African countries including those in the SADC region remains poor
4 ICP-Africa is carried out as part of the global 2005 ICP Round. The short-term objective is to generate quality data to meet the urgent needs of the Millennium Development Goals and Poverty Reduction Strategy Papers. The program is managed and coordinated by AfDB, with technical assistance from UK’s Office of National Statistics, and France’s INSEE..
20
and needs improvement. Lack of statistical capacity – as manifested in the inadequacy of hu-man and financial resources to plan surveys, collect, process and disseminate data in a timely manner – is one of the key constraints facing the SADC countries today.
44. The availability of comprehensive, timely and accurate statistical information is crucial for effective national development policy making, decision taking as well as for establishing and monitoring economic convergence processes. In terms of convergence criteria, African coun-tries will be expected to meet GDP related criteria and have sustainable price performance and their annual average inflation rate should not exceed a given threshold determined in relation to best-performing countries in terms of price stability. This requires a permanent statistical monitoring system to be put in place, which can build on relevant efforts being made at sub-regional level, as well as on lessons learned from the International Comparison Program for Africa (ICP-Africa).
45. The African Development Bank (AfDB) identified four types of issues to be considered if the harmonization process is to be implemented effectively:
General issues to be considered – require a common definition of inflation, covering •all GDP components, to be agreed across the countries, the same GDP classification to be used (the ICP-Africa classification was successfully used by 48 African countries), and a clear distinction to be made between basic headings in the classification for which price indices can be computed directly from surveyed prices and other basic headings for which reference price indices will be required.
Issues pertaining to price statistics – point to the need to: (i) re-affirm general princi-•ples of item selection and leveraging on relevant methods used in the ICP-Africa such as the structured product description method (SPD); (ii) ensure effective outlet sam-pling and product-outlet mapping; (iii) use the ICP method of baskets of construc-tion; (iv) build on existing ICP survey manuals and country’s survey frameworks; (v) improve data quality by applying ICP quality control packages; (vi) establish a system of measurement of regional inflation where weighting factors will be Purchase Power parity (PPP)5 adjusted; and (vii) striving towards CPI-ICP integration.
Issues related to National Accounts – are centered on the implementation of the UN •1993 System of National Accounts (SNA) which needs to be improved by: (i) extend-ing the production boundary and addressing the non-observed economy; (ii) assessing
5 A Purchase Power parity (PPP) is defined as the number of currency units required to purchase the amount of goods and services equivalent to what can be bought with one unit of the currency of the base country, for example the U.S. dollar”. The use of the US$ is arbitrary, the calculation of PPP can be linked to any currency unit.
21
each country’s implementation of the system using the SNA 1993 compliance check-list; and (iii) acknowledging Non-profit institutions serving households (NPISHs)6 in National Accounts
46. From the above analysis of issues major requirement for statistical harmonization are summarized as below. GDP and inflation related indicators require relevant statistical systems to be harmonized at sub-regional and regional levels, in terms of:
Proposing common definitions of indicators to be used to monitor•convergence criteria;•Underscoring the scope of the indicators, their main components or the indicators •they are derived from, their main components, status as wellas desired frequency; •Determining the statistical framework which would ensure data comparability; and•Providing guidelines for future activities in order to set up a harmonised•statistical system in Africa.•
47. Given the poor quality of national accounts in most countries, more emphasis is need-ed for all participating countries to shift to the implementation of the 1993 System of National Accounts (SNA 1993) and improve the compilation of their GDPs.
48. SADC/EU Price and Economic statistics Project on “Harmonized Consumer Price In-dex (HCPI)”, which began in 1995 tried to resolve these issues. HCPI is Consumer Price Index (CPI) that is developed from comparable methodologies. Based on results of the user needs analysis by the project in the SADC region, the following specific issues emerged:
Users of the statistics on Household Budget Surveys (HBS) and Consumer Price In-•dices (CPIs) expressed a strong desire to be provided with reliable statistics on a com-parable basis utilizing international standards for national planning and monitoring of inflation in the countries. An assessment study of the two sectors in all National Statistics Offices (NSO) of the SADC Member States (Democratic Republic of Congo and Madagascar excluded) identified strong weaknesses in the concepts, methods and practices followed in the compilation of these statistics in both fields.
Governments, central banks and the private sector use the CPIs for a number of dif-•ferent purposes, such as monitoring of macro-economic convergence within SADC, analysis of trade and balance of payment, determining and monitoring of monetary
6 NPISHs consist of non-profit institutions which are not predominantly financed and controlled by government and which provide goods or services to households free or at prices that are not economically significant.
22
and fiscal policies, deflation of key national aggregates expressed in nominal values to real values, wage negotiations, determining of investment needs, determining of real interest rates, comparison of imports and exports in relation to exchange rates and inflation in the countries. However, a number of users expressed concern about the reliability of the national CPIs. The heads of governments at their regional meetings repeatedly expressed the need for comparable statistical information in order to ac-celerate regional integration, improve the monitoring of the Trade Protocol and meet the requirements of poverty assessment.
4.3 Regional Integration Issues
49. The need for more political commitment to real regional integration in that although many regional initiatives have been agreed to in principle, there has been a gap between the texts approved and the actual implementation as noted in the pace of ratification of agreed protocols.
50. A second potential obstacle is a prolonged asymmetric terms of trade shock and conse-quent divergence between economies, having implications for fiscal and exchange rate manage-ment. Theoretical work on currency unions elsewhere in Africa has shown that successful ones require both fiscal coordination and a system of compensatory financing and transfer arrange-ments that could help offset income losses in countries due to exogenous shocks. While there may be some limited compensatory measures to help poorer countries catch up with wealthier ones within SADC, it is unrealistic in the foreseeable future to expect a formal mechanism to deal with the more complex issue involving asymmetric shocks resulting from cyclical varia-tions in trade.
51. Elsewhere, until a few years ago, the costs and benefits of macroeconomic coordination were analysed primarily in terms of trade. One of the main variables from the perspective of trade is the exchange rate and its random fluctuations. However, these considerations, which are based on trade flows and on the growing trade interdependence between many of the re-gion’s economies, although important, are not in themselves sufficient to account for the re-newed interest in macroeconomic coordination. Thus, studies related to the costs and benefits of pursuit of regional responses to global challenges need to be scaled up in the SADC region to include MEC.
52. Cost benefit analysis helps to deepen the understanding of policy makers demonstrates the importance and benefits of MEC and regional integration at large. Thus, prior informed cost benefit analysis and internal consultations, including bringing civil society and the private sector on board much earlier, should precede upcoming integration programmes such as the
23
customs union, to enhance ownership that motivates full implementation among all stakehold-ers. This in turn calls for strengthening technical capacity within the SADC Secretariat and member states for conducting informative cost benefit analysis and ensuring fair and equitable sharing of the costs and benefits of integration should be the starting point among member States.
4.4. Institutional issues
53. Unlike sovereign governments, the SADC does not have adequate enforcement mechanisms at its disposal for seeing that agreements are actually carried out but relies in-stead in most cases on consensus and the voluntary cooperation of its member states. There is need to strengthen and empower the institutions that implement and monitor regional integration programmes both at the regional and country levels.
54. Probably most important in MEC programme is a functioning institutional frame-work that makes MEC more transparent. Currently this responsibility lies with the Macroeco-nomic Sub-Committees of SADC and the Committee of Central Bank Governors (CCBG). What are the constraints experienced by these organs? Is there urgency for a superstructure with sufficient relative weight, for instance, a team of macroeconomic experts to advise and evaluate outcomes and, above all, enhance the transparency and credibility of the process? Would an institution like the West African Monetary Institute (WAMI) serve this purpose in assisting these committees for example, to monitor the state of macroeconomic convergence of the member countries vis-à-vis the prescribed benchmarks; to ensure that financial infra-structure in all member including laws relating to both bank and non-bank financial institu-tions, are harmonized in order to create a level playing field for all economic operators within the SADC region?
55. Any central authority overseeing convergence and integration should be indepen-dent of all national authorities’ influences. It should have a mandate that is well anchored on the agreed key objectives, such as ensuring price stability, with sufficient authority to enforce (and possibly supervise) compliance by all members for the attainment of the shared objec-tives. The relationship between such an institution and the roles for national central banks and the common central bank should also be clearly defined beforehand.
56. The European experience has shown that it is not necessary to wait for the achievement of theoretically optimal conditions before coordinating polices, but rather that the process of coordination itself strengthens the process of real convergence. The experience of West Africa, Europe, Latin America also indicates that cooperation between countries requires a suprana-
24
tional institution to act as a catalyst and steer the process. Such institutions initially serve to promote and facilitate meetings, and later to oversee —albeit informally— the fulfillment of agreements.
4.5 Political issues
57. Due to low political commitment and/or perceived or real losses and sacrifices in-volved, a number of countries have been reluctant to fully implement integration programmes on a timely basis. This has resulted to some extent to slow ratification of protocols and re-luctant implementation of agreed plans. Therefore, there is need to secure irrevocable com-mitment beyond mere political rhetoric amongst member countries to ensure the ratification and meticulous and punctual implementation of treaties and protocols, without inefficien-cies, lapses or reversals.
58. The executive level by Heads of State and Government, some Ministers (Finance, Planning and Integration, Trade/Commerce, and Foreign Affairs), Central Bank Governors and Senior Government officials, like elsewhere in some African RECs, have spearheaded the integration including MEC efforts of the SADC. National Legislatures and Parliaments as well as the general public in the member countries are yet to be fully brought into the picture to take ownership of project and lend essential support.
59. In some cases elsewhere, changes in the political dynamics within the member states involved have also militated against implementation of regionally agreed programmes, espe-cially where socio-economic sacrifices are concerned.
4.6 Reporting issues
60. Currently, there is no reporting system between the SADC Secretariat, member states and key partners of SADC. Flagship publications such as the Economic Report for Africa and Economic Report for Southern Africa of SADC and UNECA as a partner respectively, could be used to disseminate information to key stakeholders on the progress and issues of macroeconomic convergence in southern Africa.
4.7 Indicator-specific issues
61. The SADC Macroeconomic Sub-Committee held its meeting in the Republic of Mau-ritius from 21st to 24th November 2006. During the meeting members discussed the national MEC assessment reports from 14 member states for 2006 including achievements made so
25
far in convergence in the region and their challenges. The meeting reviewed the convergence targets, which are inflation; budget deficit, public debt and current account balance as percent-age of GDP; and other secondary indicators.
62. Based on the 14 reports, the SADC Macroeconomic sub-Committee made recom-mendations in a number of areas, some of which require further analysis and information to improve the quality of macroeconomic convergence programme in the region. This paper will focus on those issues that require further analysis and those UNECA identified as topi-cal issues and therefore requiring further elucidation. For the purpose of this document, the MEC issues to be addressed are summarized under indicator-specific issues. In doing so, the paper poses questions that need further investigation.
(i) Growth
63. Issues of growth relate to both conceptualization and measurement. The overall ob-jective of macroeconomic convergence is for countries to implement stability oriented poli-cies that will attract investment into the region and allow for sustainable growth. This is be-cause economic convergence should be achieved around a higher level of economic growth. As such economic growth is included as a secondary indicator in the macroeconomic con-vergence programme, i.e. a growth target of 7 per cent annually. However, one opinion sug-gests that the 7 per cent target is too ambitious for more mature economies. On the other hand there is limited evidence that poorer countries are growing at a faster rate in the region. The questions that arise include: Is there evidence to show that some countries in the region registering employment creating and pro-poor growth and therefore are close to full em-ployment (maturing)? What is important in such growth: consistency in growth or level of growth? Is there evidence that MEC is achieving stability as a condition for capacity-creating or cross-border investment?
(ii) Inflation
64. Problems still abound with regard to inflation measurement. For example, what methodology should be used to measure inflation in the region, i.e. the basket of goods and services (Consumer Price Index – CPI); geographic coverage of CPI; frequency of collec-tion of prices of goods and services; base year; and headline versus core inflation? SADC/EU Price and Economic statistics Project on “Harmonized Consumer Price Index (HCPI)”, which began in 1995 tried to resolve these issues.
65. There is on-going debate that a strategy of macroeconomic convergence, that is, poli-cies aimed at the convergence of stability indicators in a regional integration arrangement, is
26
not always best policy. And in a region like SADC, which is exposed to asymmetrical external shocks, convergence can in fact be counterproductive. In the case of monetary integration, which is scheduled for 2016, macroeconomic convergence is necessary but this is a stage in the progression of regional integration for which SADC is not ready. However, a case can be made for a programme of single-indicator convergence that focuses on inflation as the broadest indicator of balance in resource utilization. How can central banks of SADC address this issue? Can the banks for example, identify causes of inflation as basis for negotiating in-flation targets, say, at the average of annual consumer price inflation of the three economies with the lowest inflation rates, or as a fixed numerical value as has been done elsewhere?
66. The other question for SADC is whether a free trade area needs a programme of MEC? Economists have attempted to answer this question by arguing that “countries in a free trade area can have different inflation rates, changing nominal exchange rates, and different levels of budget deficit”, provided that member countries allow their currencies to depreciate if they have higher inflation rates than the others.
(iii) Debt/GDP ratio
67. While public debt/GDP ratio is included as one of the macroeconomic convergence indicators, it may not be sufficient as the impact of debt works through several macroeco-nomic channels depending on the type of debt. What would be the regional picture if the public debt/GDP ratio is supplemented with other indicators such as those derived from the HIPC initiative measures of debt sustainability on the basis of the burden of the debt ser-vice?
(iv) Current Account Balance
68. Sustainable levels of the current account balance are difficult to determine as they may depend on other factors, which are not contained in the current account indicators as defined by SADC. Besides, the reports reviewed show that a single limit on the current ac-count as a percentage of GDP could be problematic. In the case of smaller countries, large projects may push the deficit far beyond this single limit. In the context of the sub-region what are the major factors driving the current account and how should this criterion be ap-plied to make it flexible to accommodate these factors?
27
(v) Exchange Rates
69. Although it is not yet part of Member States’ policy commitments, full macroeconomic policy convergence would be difficult without common exchange rate policies. Member States exchange rate regimes still diverge and currency fluctuations are a hindrance to increasing in-vestment in the region. What common exchange rate policies should the region implement to ensure currency stability?
(vi) Relevance of MEC criteria
70. Just like any programme, it is important to review the relevance of the convergence criteria in the light of current achievements, especially the need to revisit the numerical targets set for the four convergence targets after 2008. Are the targets still achievable? Is there need to include other secondary targets apart from the four primary targets set in RISDP? Are there les-sons that can be drawn from other regions in Africa and elsewhere in preparation for monetary integration? UNECA has initiated econometric empirical studies on assessment of income con-vergence, macroeconomic convergence as well as financial and monetary integration in various RECs. How can such studies be incorporated within the MEC programme towards achieving upcoming regional integration milestones, especially, monetary integration?
Conclusion
71. This report presented an overview of developments in the world economy and im-plications for Southern Africa and reviewed the progress towards the achievement of mac-roeconomic convergence (MEC) targets in SADC member states. It compares the actual per-formance against agreed macroeconomic indicators and targets in the SADC macroeconomic convergence programme, and presents prospects for the year 2007 and beyond. The report further discusses the regional integration process and issues affecting the macroeconomic con-vergence programme in the SADC region.
72. While in 2006, world economic growth improved slightly to 3.8 percent from 3.5 per cent in 2005, growth in Southern Africa increased from 4.76 per cent in 2005 to 5.8 per cent in 2006. Although five countries in the sub-region registered marked increase in GDP growth rates of 7 per cent and above in 2006, they still face the critical challenge of raising the rate of GDP growth and sustaining high growth rates over an extended period in order to accelerate progress towards meeting the Millennium Development Goals (MDGs).
28
73. With regards to MEC performance SADC countries registered a mixed performance. With regards to MEC performance SADC countries registered a mixed performance. The number of countries registering inflation rates within single digit increased steadily from only four in 2002 to 13 in 2007. Only Namibia has already achieved the target (<5%) ahead of the 2008 schedule, and so only needs to maintain the inflation rates at current levels. Apart from Zimbabwe (>5000%) projections for the rest of the countries for 2007 will be within the single digit range (4 – 9%).
74. All countries except Angola, Mauritius, Tanzania and Zimbabwe show improved fis-cal deficit in 2006 against SADC target for 2008 of <5 per cent of GDP. Of these countries, Botswana, DRC, Lesotho, Namibia, South Africa and Swaziland maintained a budget deficit of below or equal to 5 per cent between 2002 and 2006.
75. Six SADC countries benefited from debt forgiveness under the HIPC initiative (DRC, Madagascar, Mozambique, Tanzania and Zambia except for Malawi). Consequently, there has been a decrease in Public debt in these countries recording a stock of public debt below the SADC target of 60 per cent of GDP. There was an improvement in the public debt ratio in SADC from 64.6 per cent in 2002 to 44.9 per cent in 2006 with a further projected reduction to 34.8 in 2007.
76. Except for Lesotho and Mauritius, in 2006 the rest of the SADC countries achieved the target of –9 for balance on current account as a per centage of GDP. Except for Lesotho, Malawi, Madagascar, Mauritius, Zambia and Zimbabwe, the rest of the countries consistently attained the conventional prudential levels of the SADC RISDP.
77. Apart from Botswana and Namibia, which consistently attained the 30 per cent target, most countries showed low rates of savings. And, the RISDP target for investment of 30 per cent of GDP was only achieved by Botswana from 2002 to 2005 and by Lesotho for the years 2002 to 2004. Since 2002, the rest of the SADC countries have not reached the target. Thus, the investment rate is generally below the required level to achieve the RISDP developmental objectives.
78. Overall, the SADC member states have made some progress in attaining the MEC cri-teria over the past 5 years, particularly with respect to all the four primary indicators. However, success in MEC should be based on over extended period and not on short-term.
79. In implementing SADC MEC programme, several interrelated issues can be identified, namely: theoretical and conceptual issues; methodological and statistical issues; regional inte-gration issues; institutional issues; political issues and reporting issues..
29
80. With regard to conceptual issues, to date there is limited understanding of the causes and conditions of MEC. This is mainly due to much more emphasis being placed on the pre-sentation of empirical results than on systematic theory-building and because policy conver-gence is a rather heterogeneous research field, it limits the comparability of the empirical find-ings gained in different convergence studies.
81. Methodological issues are emerging as critical to monitoring progress made in con-vergence. One key issue is that of inadequate maintenance of track record of compliance with MEC criteria for an extended period of time of 5-10 years. This problem can be attributed to two key factors: lack of a permanent statistical monitoring system and authoritative statistics on sectoral development issues such as population, gender, poverty etc; and lack of availability of comprehensive, timely and accurate statistical information to build on relevant efforts being made at sub-regional level, as well as on lessons learned from the International Comparison Program for Africa (ICPA).
82. Institutional issues include lack of mechanisms and resources for effective planning, coordination, implementation, monitoring and pragmatic adjustment of programmes on the ground have been another constraint to MEC. A related issue here is the inadequate cost-ben-efit analysis of policy convergence, which has led to some extent slow ratification of protocols and reluctant implementation of agreed plans.
83. The need for SADC to have a central authority to oversee convergence and integra-tion is one of the institutional issues. Such an institution should be independent of all national authorities’ influences. It should have a mandate that is well anchored on the agreed key objec-tives, such as ensuring price stability, with sufficient authority to enforce (and possibly super-vise) compliance by all members for the attainment of the shared objectives.
30
References Cited
Ashinze, J. O. (2002) “The West African Monetary Institute (WAMI) and the Efforts Towards Monetary Integration in the West African Sub-Region”, presented at the workshop organised by International Economic Relations Dept., CBN, Abuja. CCBG (Committee of Central Bank Governors) (2007). Integrated Paper on Recent economic Developments in SADC.
DiMaggio, P.J. and Powell, W.W. (1991) ‘The iron cage revisited. Institutionalized isomorphism and collective rationality in organizational fields’, in W.W. Powell and P.J. DiMaggio (eds), The New Institutionalism in Organizational Analysis, Chicago: Chicago University Press, pp. 63–82.
Dolowitz, D.P. and Marsh, D. (1996) ‘Who learns what from whom? A review of the policy transfer literature’, Political Studies 44: 343–57.
Dolowitz, D.P. and Marsh, D. (2000) ‘Learning from abroad: the role of policy transfer in con-temporary policy making’, Governance 13: 5–24.
Economic Intelligence Unit (2006)
Jannie Rossouw (2006). An Analysis of Macro-Economic Convergence In SADC in South Af-rican Journal of Economics Vol. 74:3 September 2006
Michel Mouyelo-Katoula2 and Adalbert Nshimyumuremyi (2007). International Comparison Program for Africa – Towards Economic Convergence Measurement. The African Statistical Journal, Volume 4, May 2007
Katharina Holzinger and Christoph Knill (2005). Causes and conditions of cross-national pol-icy convergence Journal of European Public Policy 12:5 October 2005: 775–796
Maastricht Treaty. 1993. Treaty on European Union.http://en.wikipedia.org/wiki/Maastricht_treaty [Accessed on 17 February 2005].
SADC (Southern African Devemont Community). (2006). HCPI Guidelines – A draft
UNECA (United Nations Economic Commission for Africa) (2007). The Economic Report for Africa.