Embed Size (px)
Citation preview
Macroeconomic Policy in the Eurozone: Are There
Alternatives to Slow Growth and High Unemployment?
Mark Weisbrot, Co-DirectorCenter for Economic and Policy Research
September 24, 2011
• Europe’s crisis, stagnation, and unemployment are not the result of unsustainable borrowing
• It is the result of bad macroeconomic policies from the European authorities:
• The “Troika” – European Central Bank, European Commission, IMF
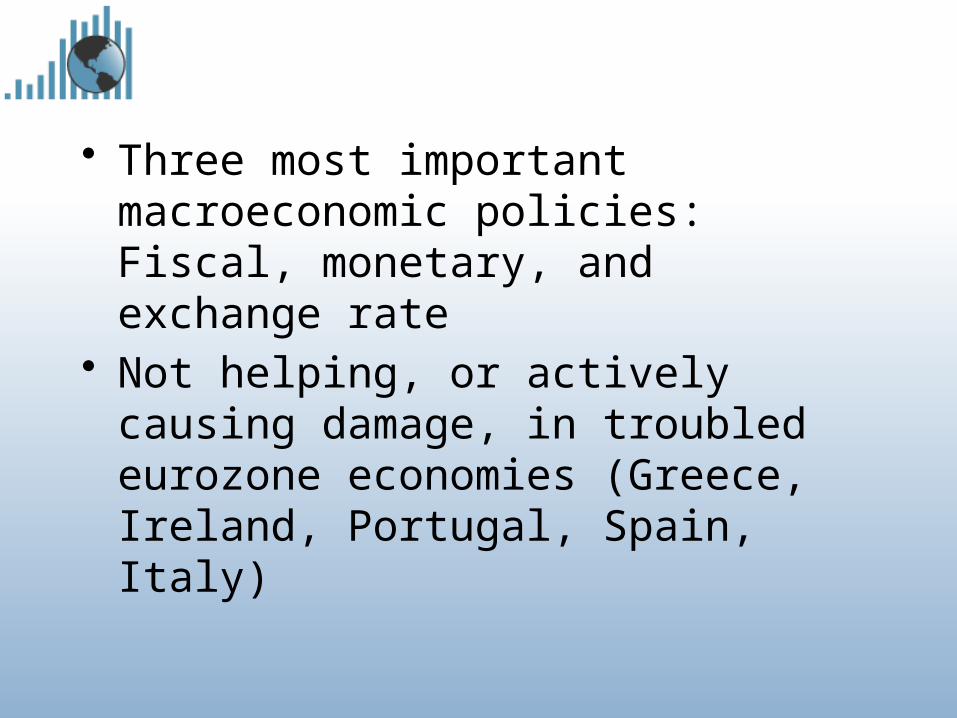
• Three most important macroeconomic policies: Fiscal, monetary, and exchange rate
• Not helping, or actively causing damage, in troubled eurozone economies (Greece, Ireland, Portugal, Spain, Italy)
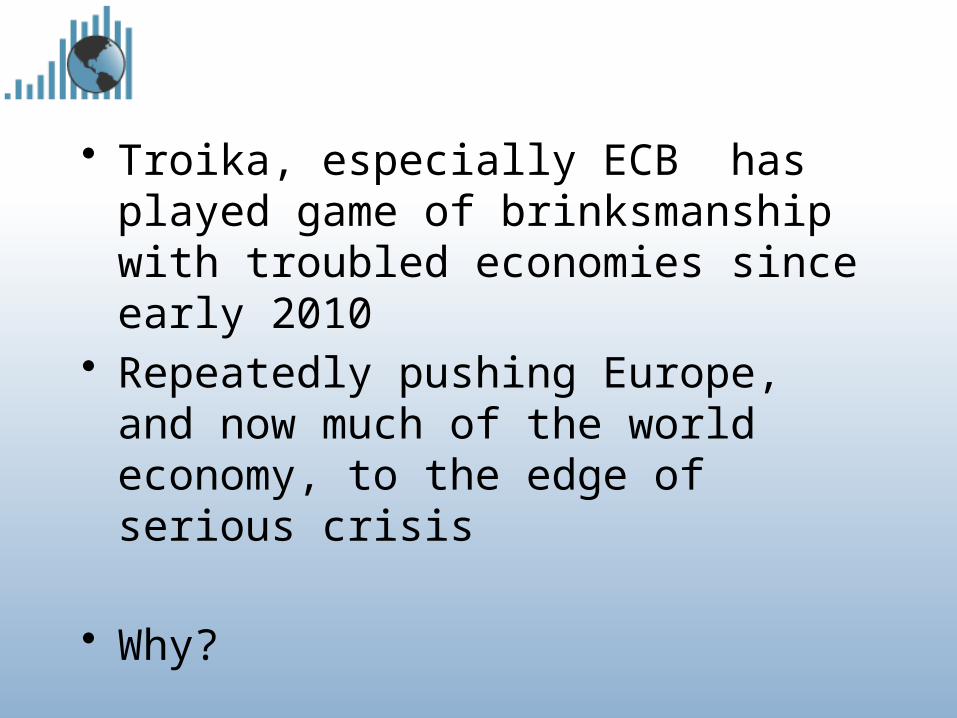
• Troika, especially ECB has played game of brinksmanship with troubled economies since early 2010
• Repeatedly pushing Europe, and now much of the world economy, to the edge of serious crisis
• Why?
What policy failure looks like
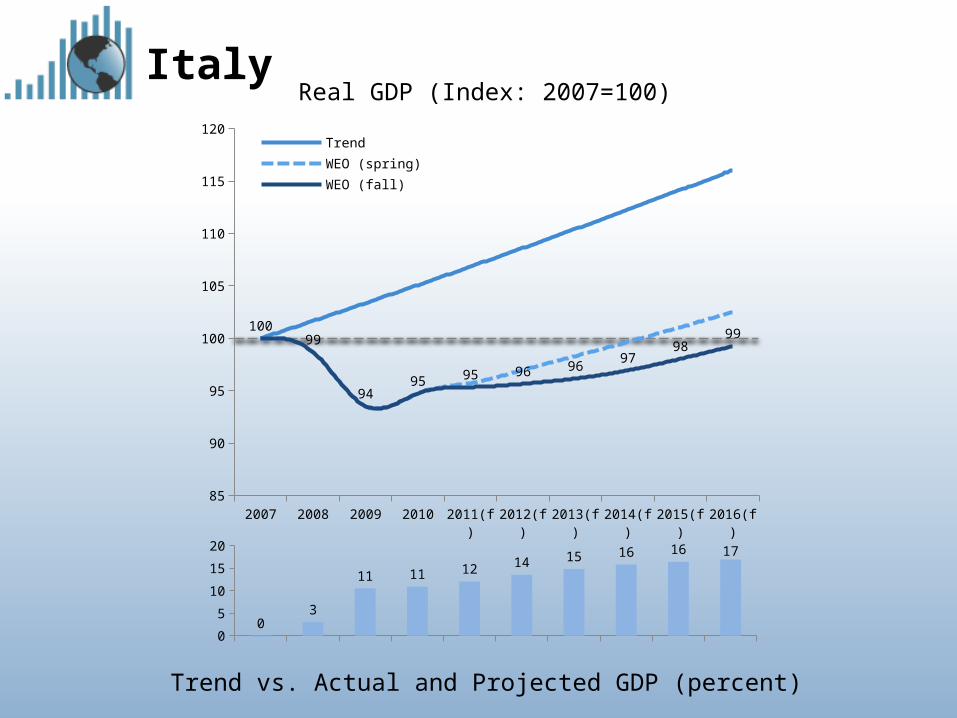
ItalyReal GDP (Index: 2007=100)
Trend vs. Actual and Projected GDP (percent)
0
5
10
15
20
03
11 11 12 14 15 16 16 17
2007 2008 2009 2010 2011(f) 2012(f) 2013(f) 2014(f) 2015(f) 2016(f)85
90
95
100
105
110
115
120
10099
9495 95 96 96
9798
99
Trend
WEO (spring)
WEO (fall)
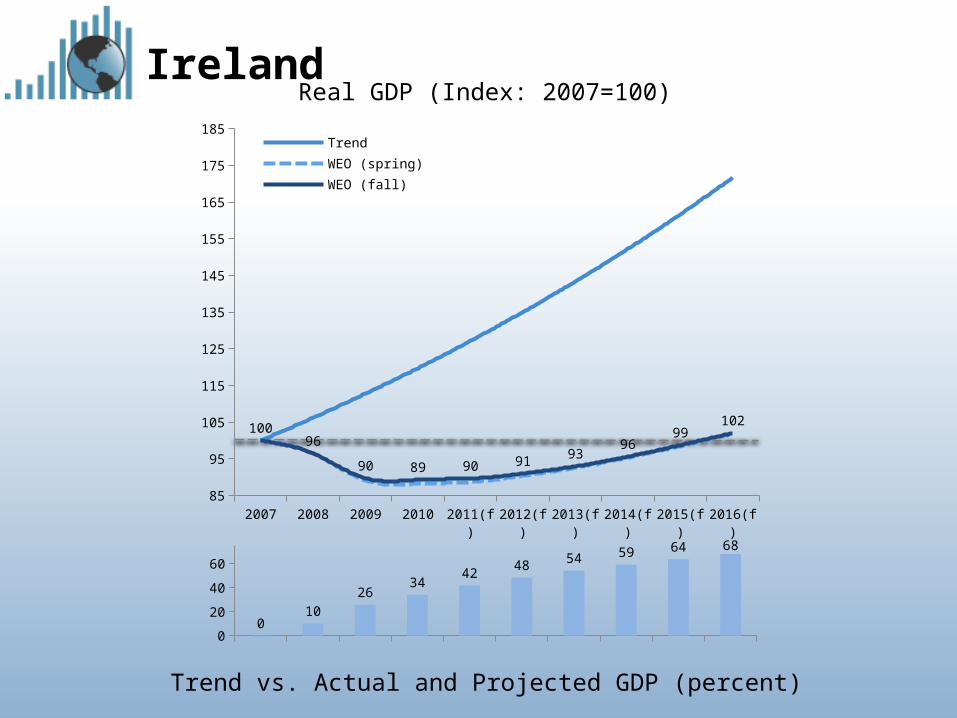
IrelandReal GDP (Index: 2007=100)
0
20
40
60
010
2634
4248 54 59 64 68
Trend vs. Actual and Projected GDP (percent)
2007 2008 2009 2010 2011(f) 2012(f) 2013(f) 2014(f) 2015(f) 2016(f)85
95
105
115
125
135
145
155
165
175
185
10096
90 89 90 91 9396
99102
Trend
WEO (spring)
WEO (fall)
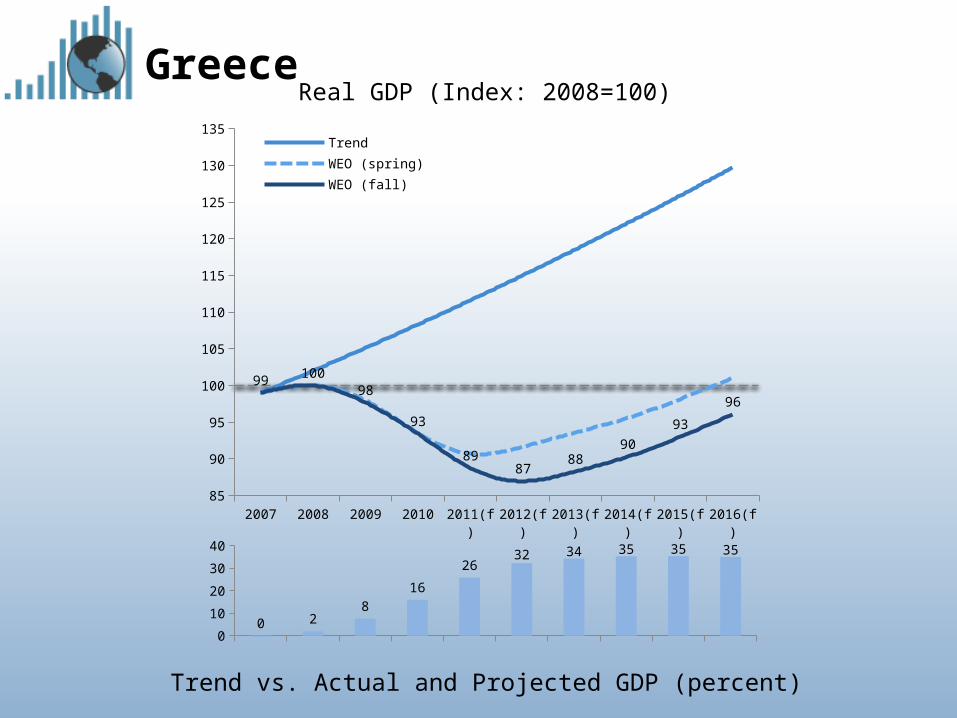
GreeceReal GDP (Index: 2008=100)
0
10
20
30
40
0 28
16
2632 34 35 35 35
Trend vs. Actual and Projected GDP (percent)
2007 2008 2009 2010 2011(f) 2012(f) 2013(f) 2014(f) 2015(f) 2016(f)85
90
95
100
105
110
115
120
125
130
135
99 10098
93
8987
8890
93
96
Trend
WEO (spring)
WEO (fall)
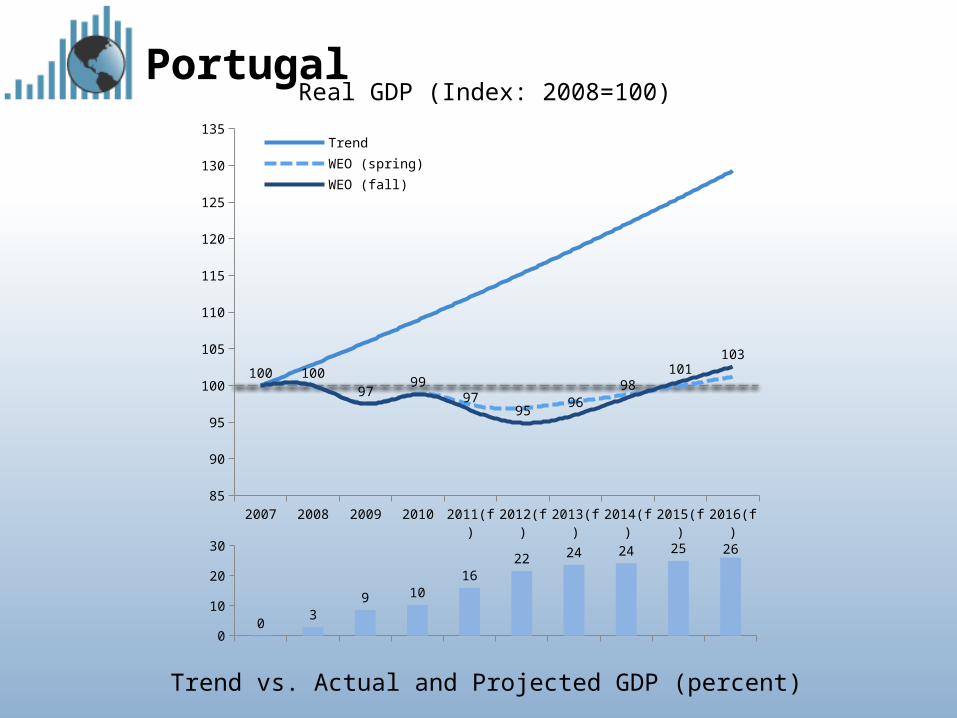
PortugalReal GDP (Index: 2008=100)
0
10
20
30
03
9 1016
22 24 24 25 26
Trend vs. Actual and Projected GDP (percent)
2007 2008 2009 2010 2011(f) 2012(f) 2013(f) 2014(f) 2015(f) 2016(f)85
90
95
100
105
110
115
120
125
130
135
100 10097
9997
9596
98101
103
Trend
WEO (spring)
WEO (fall)
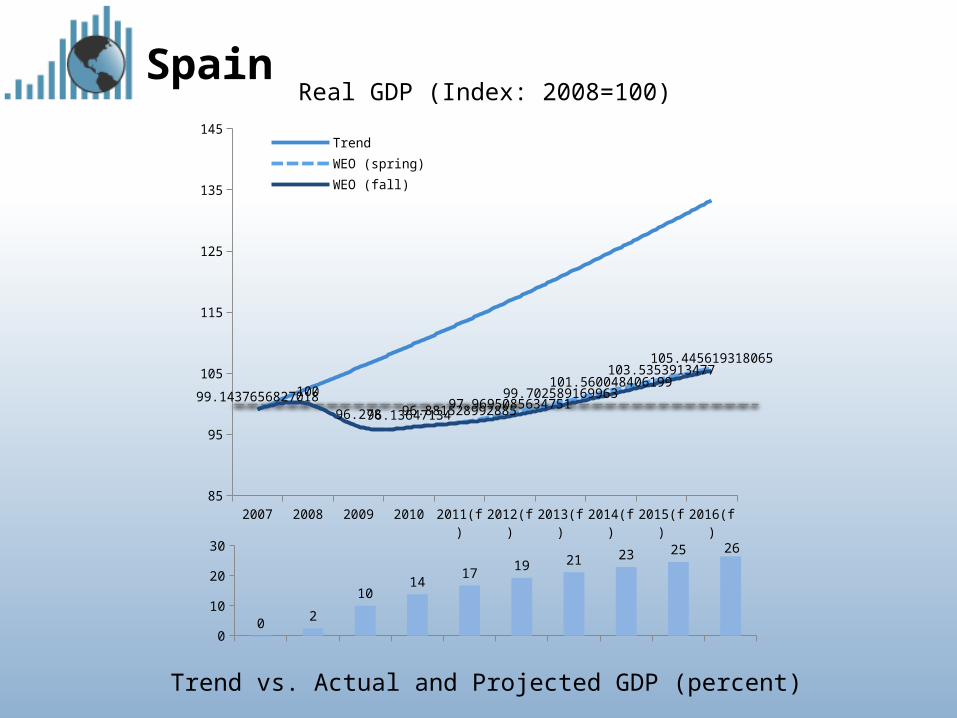
SpainReal GDP (Index: 2008=100)
0
10
20
30
0 2
1014
17 19 21 23 25 26
Trend vs. Actual and Projected GDP (percent)
2007 2008 2009 2010 2011(f) 2012(f) 2013(f) 2014(f) 2015(f) 2016(f)85
95
105
115
125
135
145
99.1437656827018100
96.27896.1364713496.88152899288597.969508563475199.702589169963
101.560048406199103.5353913477
105.445619318065
Trend
WEO (spring)
WEO (fall)
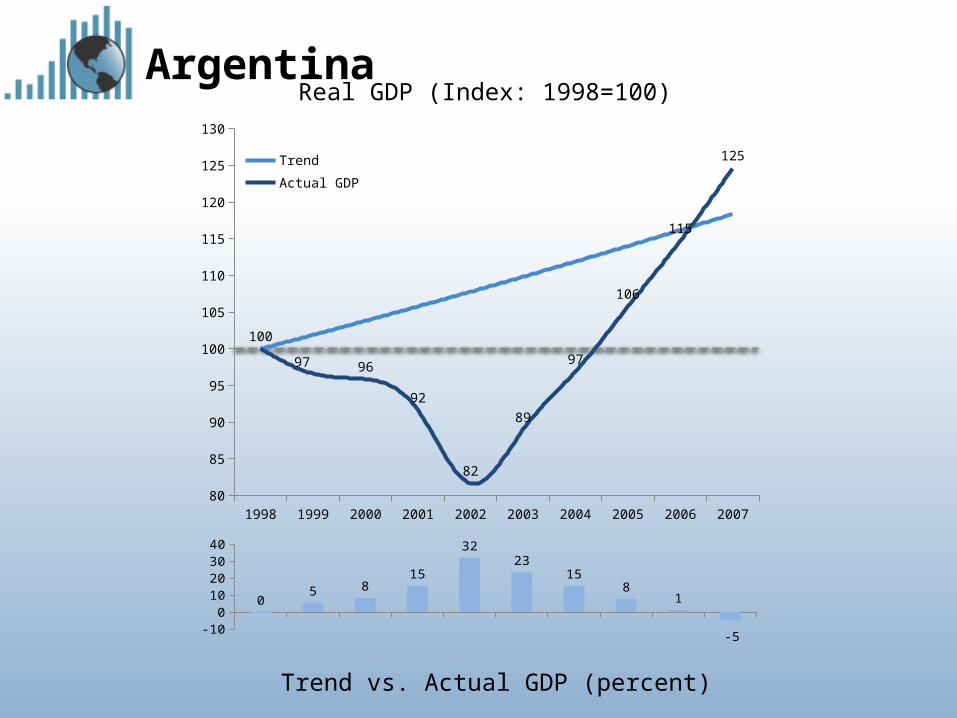
ArgentinaReal GDP (Index: 1998=100)
Trend vs. Actual GDP (percent)
-100
10203040
05 8
15
3223
158
1
-5
1998 1999 2000 2001 2002 2003 2004 2005 2006 200780
85
90
95
100
105
110
115
120
125
130
100
97 96
92
82
89
97
106
115
125Trend
Actual GDP
Lessons from Argentina:• Despite chaotic default, financial
collapse, and no outside help, Argentine economy begins to recover just one quarter after default
• Argentina reaches pre-recession GDP within 3 years, despite much deeper recession – compare to more than a decade in Greece.
• Passes trend GDP in 2006 (compare to eurozone – when?)
• Real GDP growth more than 90 percent 2002-2011
• There are ALWAYS alternatives to the years of recession, stagnation, and high unemployment that the Troika is offering to the troubled eurozone economies
The human cost of economic mismanagement
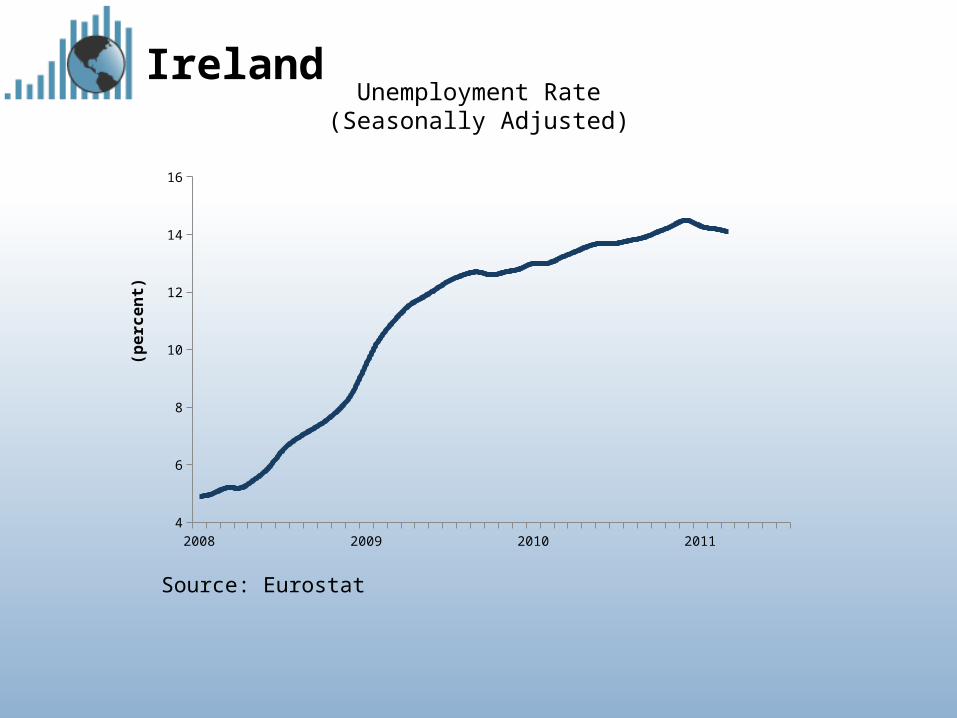
IrelandUnemployment Rate(Seasonally Adjusted)
Source: Eurostat
2008 2009 2010 20114
6
8
10
12
14
16
(pe
rce
nt)
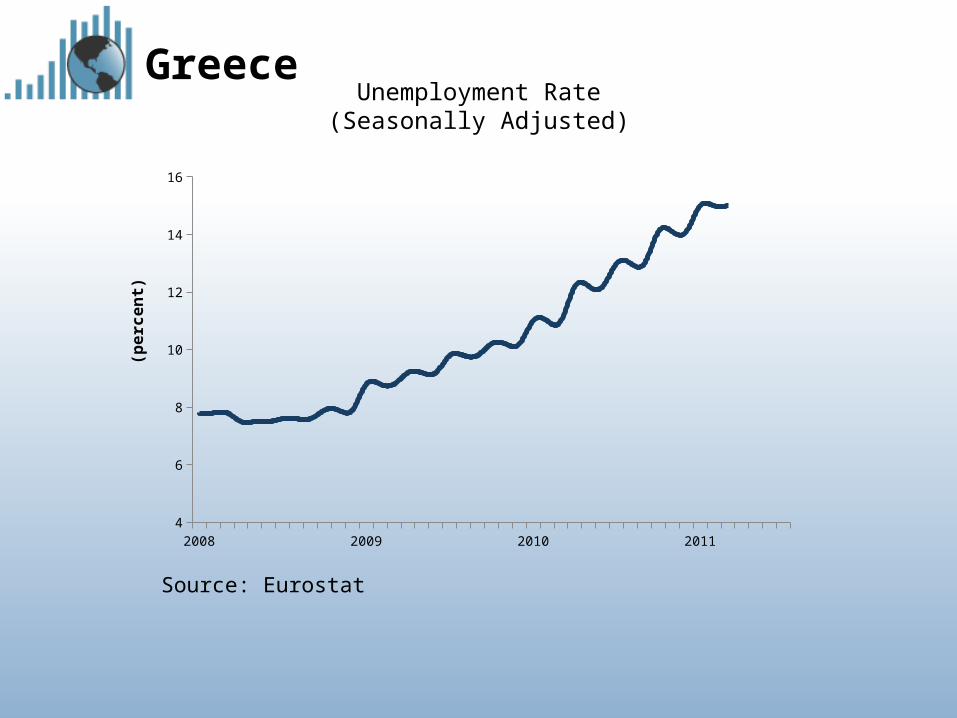
GreeceUnemployment Rate(Seasonally Adjusted)
Source: Eurostat
2008 2009 2010 20114
6
8
10
12
14
16
(pe
rce
nt)
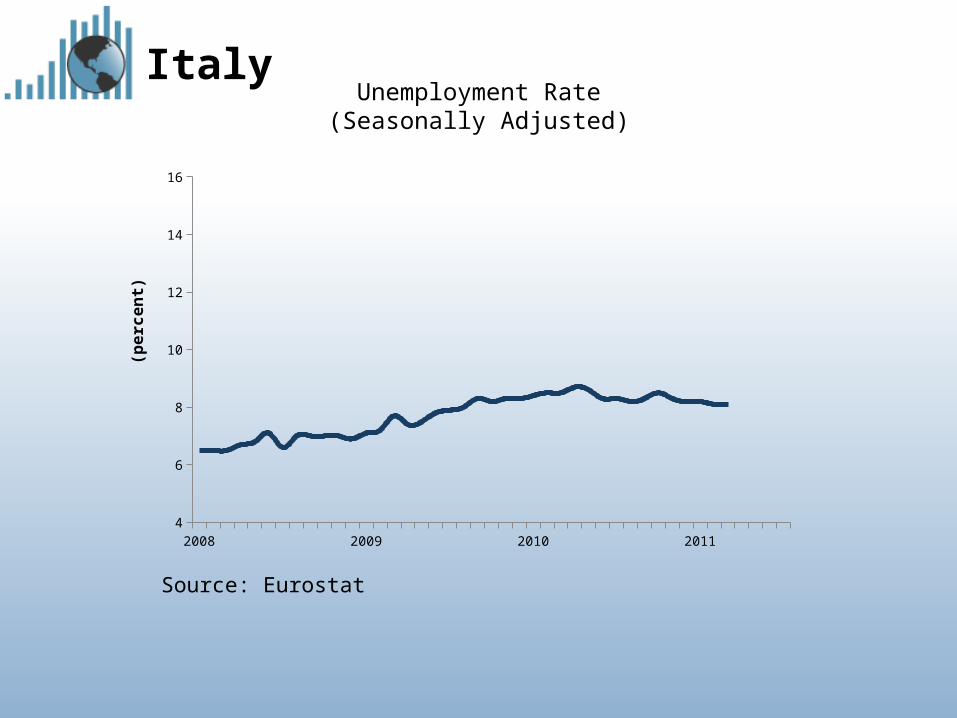
ItalyUnemployment Rate(Seasonally Adjusted)
Source: Eurostat
2008 2009 2010 20114
6
8
10
12
14
16
(pe
rce
nt)
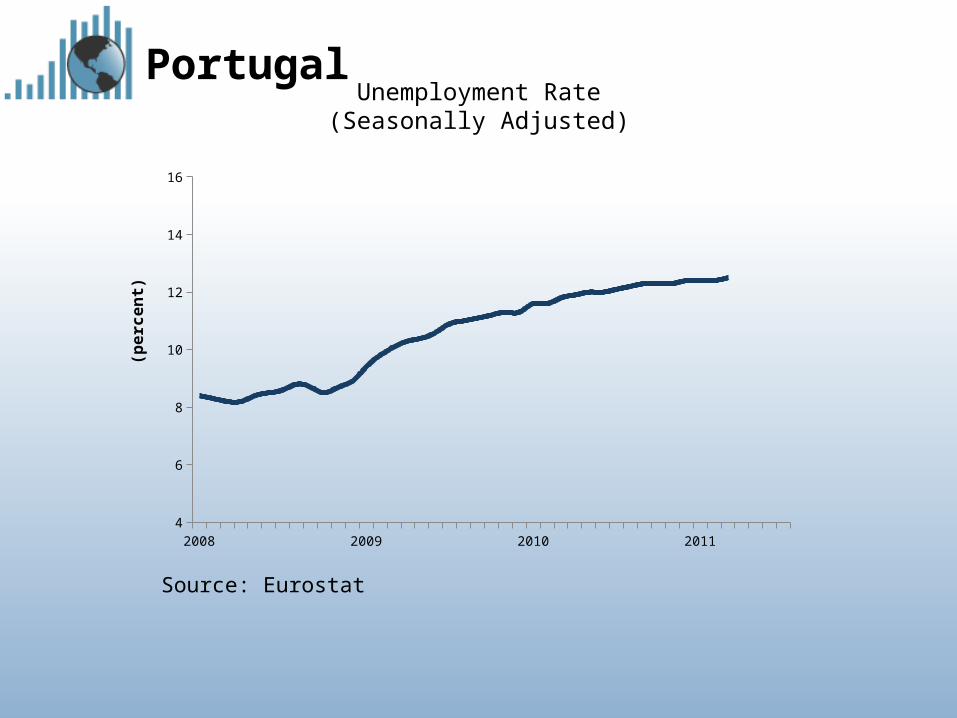
PortugalUnemployment Rate(Seasonally Adjusted)
Source: Eurostat
2008 2009 2010 20114
6
8
10
12
14
16
(pe
rce
nt)
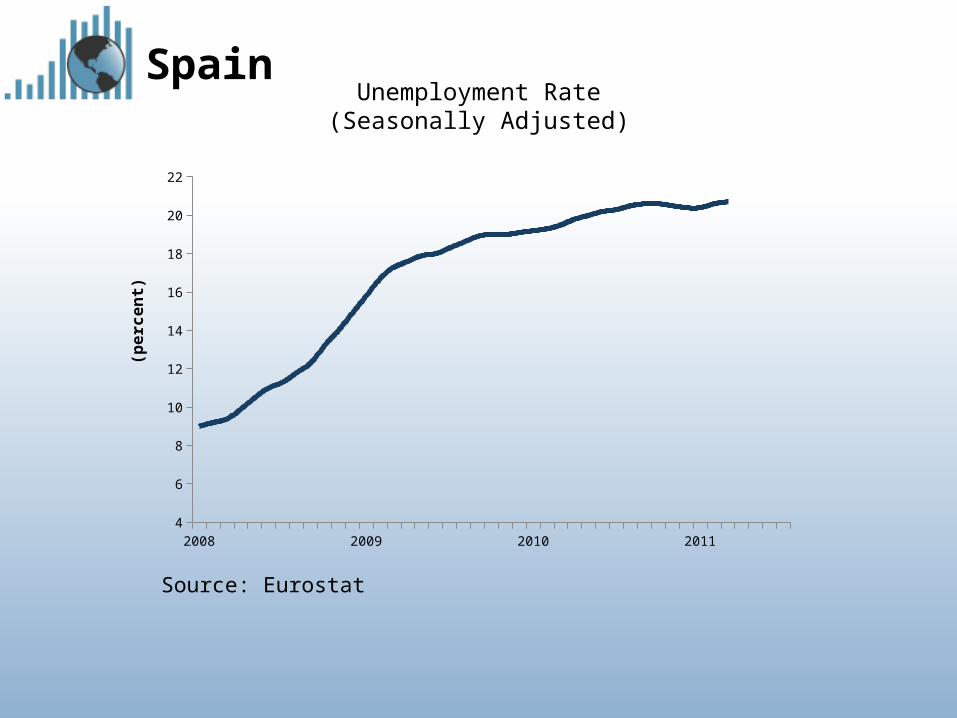
SpainUnemployment Rate(Seasonally Adjusted)
Source: Eurostat
2008 2009 2010 20114
6
8
10
12
14
16
18
20
22
(pe
rce
nt)
• Low inflation implies there is plenty of room for expansionary monetary and fiscal policies – but eurozone countries that need it can’t implement these policies
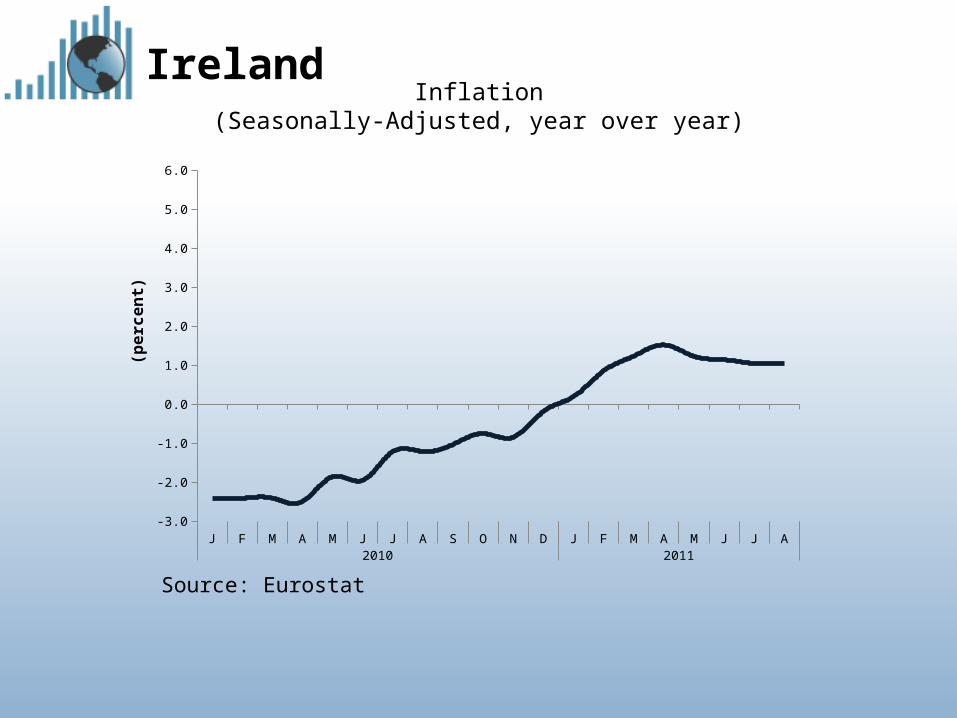
IrelandInflation
(Seasonally-Adjusted, year over year)
Source: Eurostat
J F M A M J J A S O N D J F M A M J J A2010 2011
-3.0
-2.0
-1.0
0.0
1.0
2.0
3.0
4.0
5.0
6.0
(pe
rce
nt)
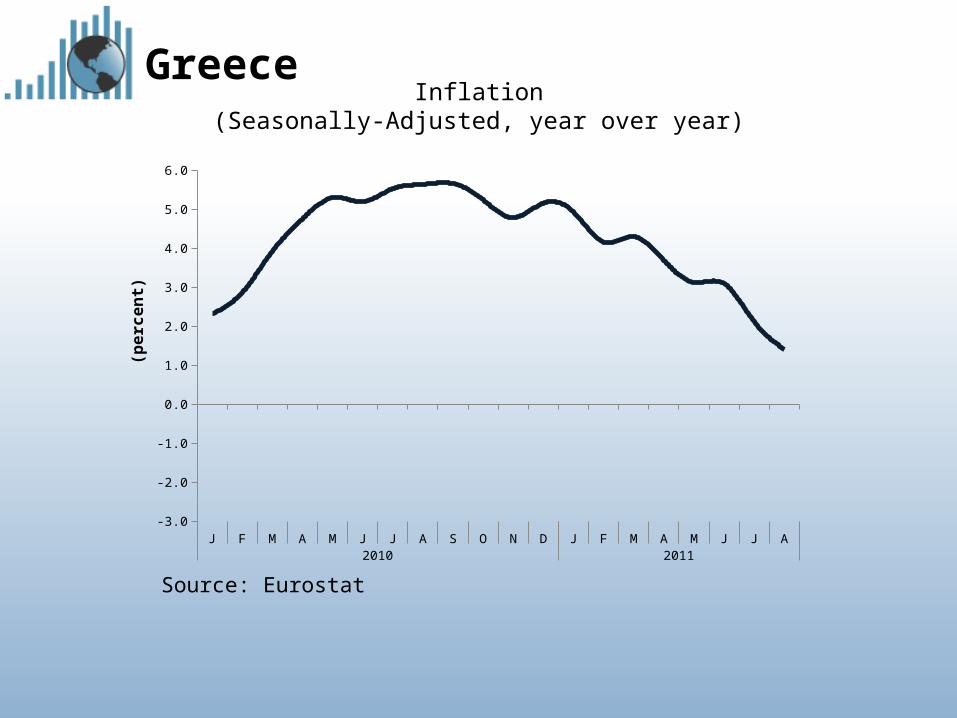
Greece
Source: Eurostat
J F M A M J J A S O N D J F M A M J J A2010 2011
-3.0
-2.0
-1.0
0.0
1.0
2.0
3.0
4.0
5.0
6.0
(pe
rce
nt)
Inflation(Seasonally-Adjusted, year over year)
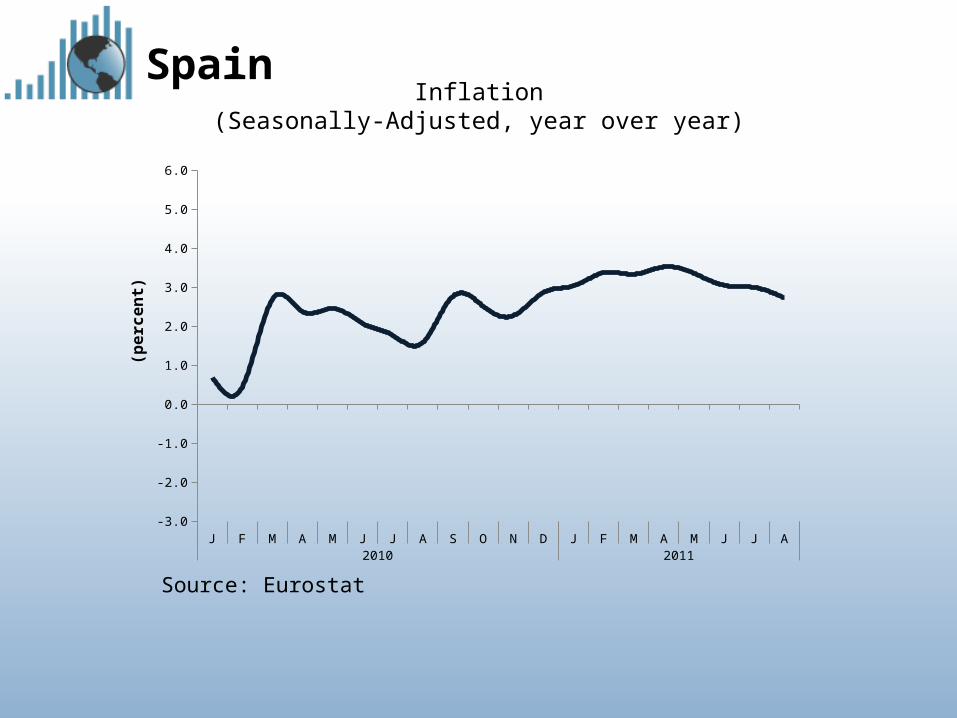
Spain
Source: Eurostat
J F M A M J J A S O N D J F M A M J J A2010 2011
-3.0
-2.0
-1.0
0.0
1.0
2.0
3.0
4.0
5.0
6.0
(pe
rce
nt)
Inflation(Seasonally-Adjusted, year over year)
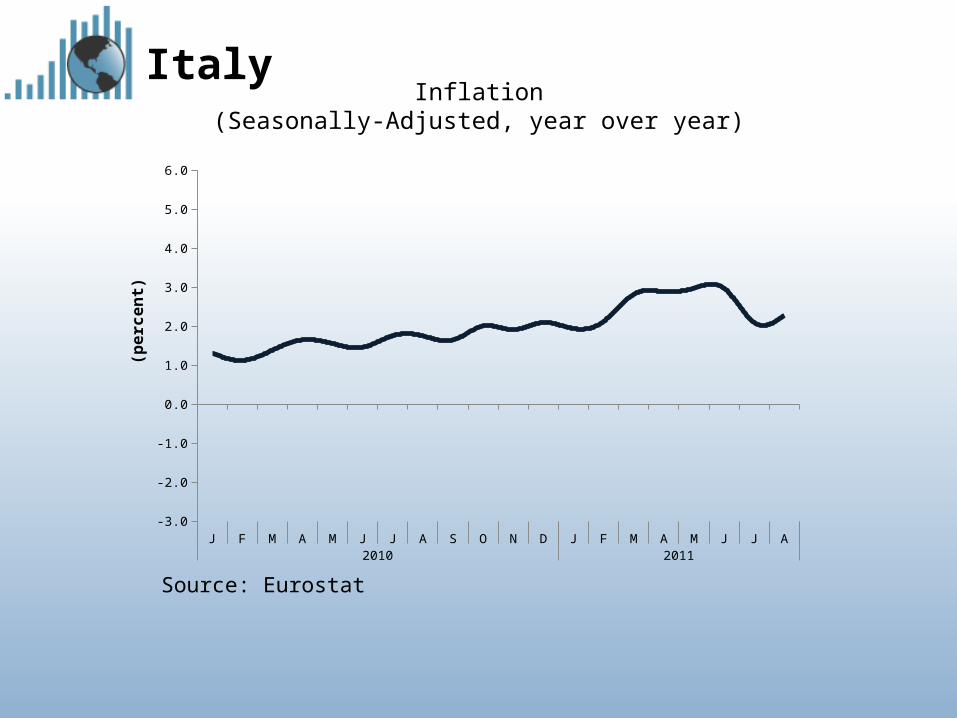
Italy
Source: Eurostat
J F M A M J J A S O N D J F M A M J J A2010 2011
-3.0
-2.0
-1.0
0.0
1.0
2.0
3.0
4.0
5.0
6.0
(pe
rce
nt)
Inflation(Seasonally-Adjusted, year over year)
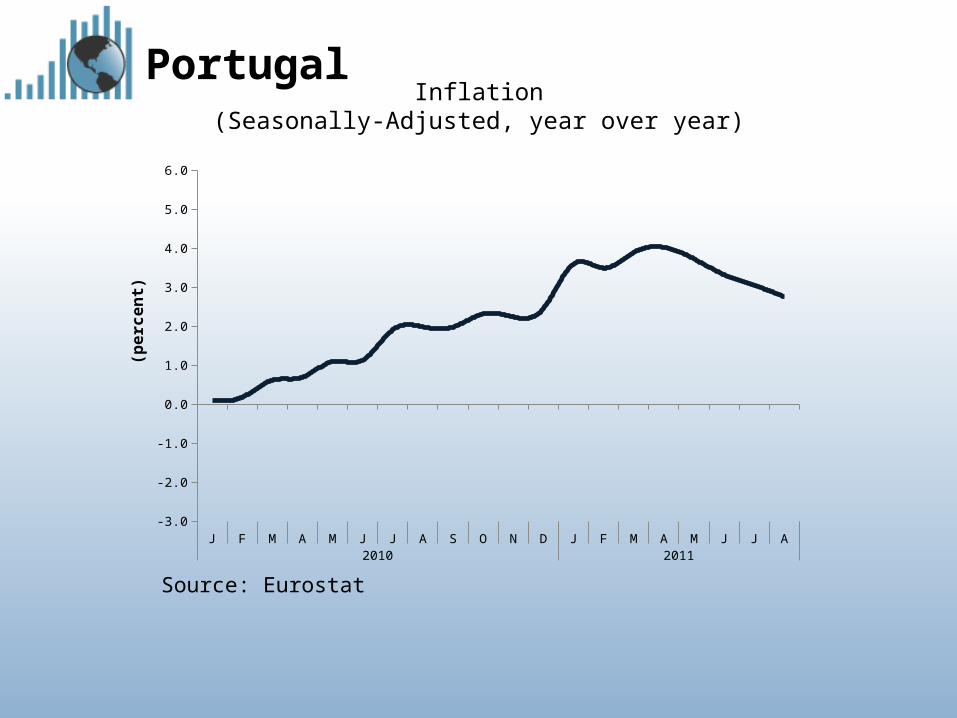
Portugal
Source: Eurostat
J F M A M J J A S O N D J F M A M J J A2010 2011
-3.0
-2.0
-1.0
0.0
1.0
2.0
3.0
4.0
5.0
6.0
(pe
rce
nt)
Inflation(Seasonally-Adjusted, year over year)
“Internal Devaluation” doesn’t work

Real Effective Exchange Rate(Based on Unit Labor Costs of 27 Trading Partners)
Source: Eurostat
I II III IV I II III IV I II III IV2008 2009 2010
90
95
100
105
Spain Ireland
Portugal Greece
Italy
(In
de
x:
20
08
QI=
10
0)
More fiscal consolidation
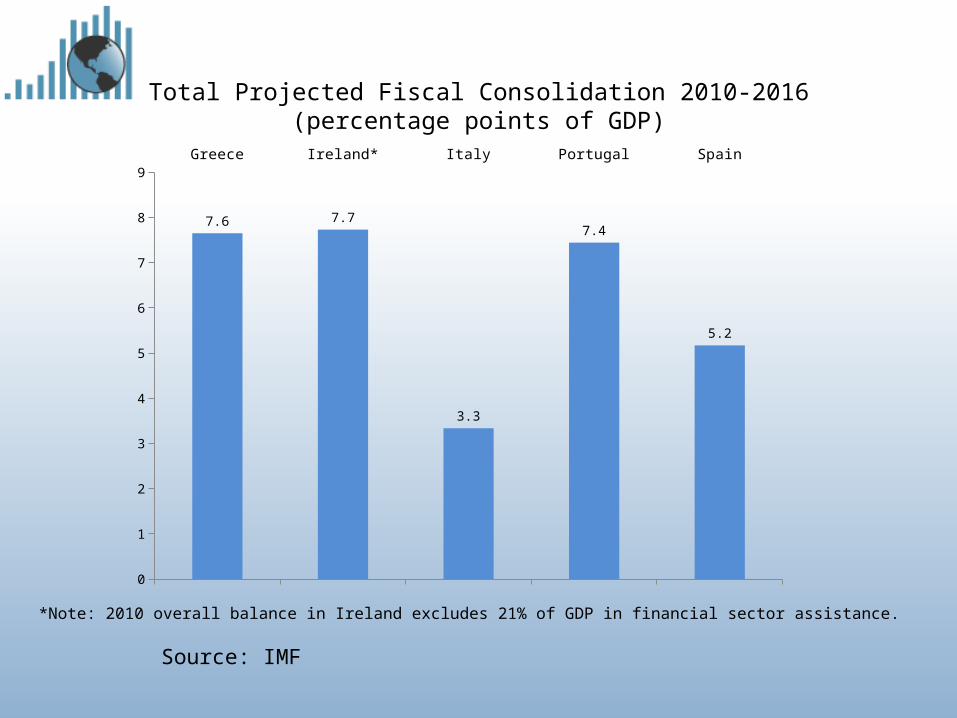
Total Projected Fiscal Consolidation 2010-2016(percentage points of GDP)
Source: IMF
Greece Ireland* Italy Portugal Spain
0
1
2
3
4
5
6
7
8
9
7.6 7.7
3.3
7.4
5.2
*Note: 2010 overall balance in Ireland excludes 21% of GDP in financial sector assistance.
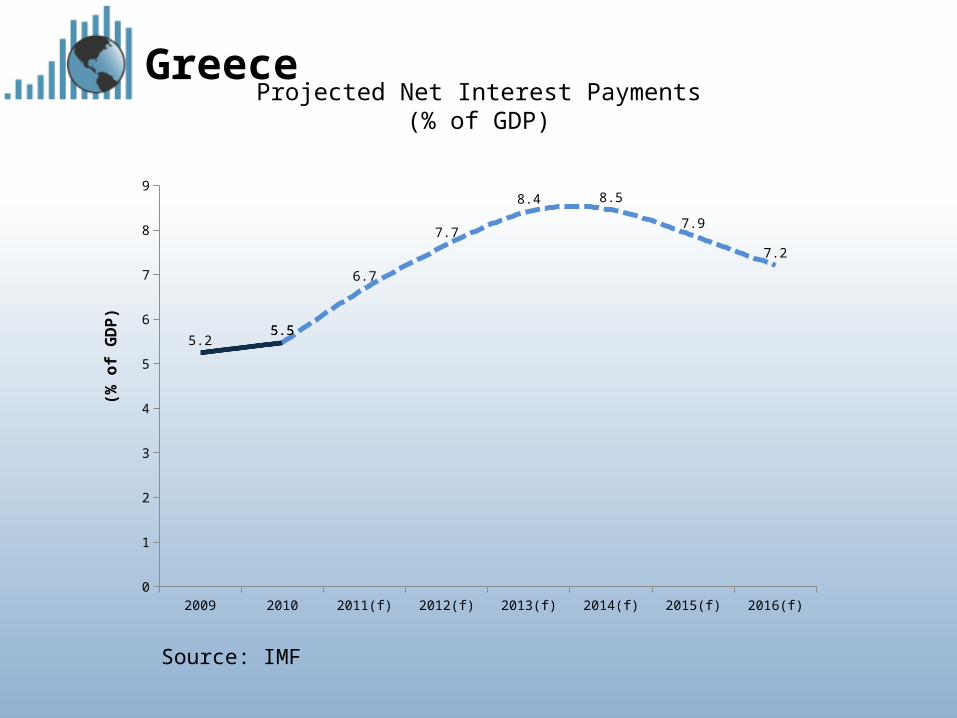
Projected Net Interest Payments(% of GDP)
Source: IMF
Greece
2009 2010 2011(f) 2012(f) 2013(f) 2014(f) 2015(f) 2016(f)0
1
2
3
4
5
6
7
8
9
5.25.55.5
6.7
7.7
8.4 8.5
7.9
7.2
(% o
f G
DP
)
• Euro zone crisis primarily a result of wrong macroeconomic policies
• European authorities will probably resolve current crisis with bigger EFSF or other rescue mechanisms, interventions in bond markets, bank bailouts, even Greek debt restructuring
Conclusion
• But continued wrong macroeconomic policies will cause unnecessary unemployment and suffering; cuts to health care, pensions, education; trillions of dollars in lost output, and possibly more crises
Conclusion