Embed Size (px)
Citation preview

Macroeconomic Update i
NEPALVOLUME. 5, NO. 1
March 2017
MACROECONOMICUPDATE


NEPALVOLUME. 5, NO. 1
March 2017
MACROECONOMICUPDATE

iv Macroeconomic Update
@2017 Asian Development Bank, Nepal Resident Mission
All rights reserved. No part of this publication may be reproduced, stored in a retrieval system, or transmitted, in any form or by any means, without the prior written permission of the Asian Development Bank (ADB). ADB does not guarantee the accuracy of the data included in this publication and accepts no responsibility for any consequences of their use.
This issue of the Nepal Resident Mission (NRM) Macroeconomic Update was prepared by the following team with overall guidance of Kenichi Yokoyama, Country Director, NRM. Sharad Bhandari, Principal Economist, NRM; Anjan Panday, Senior Programs Officer, NRM; Manbar Singh Khadka, Economics Officer, NRM; and Masato Nakane Economist, SARC, reviewed the draft and provided comments and suggestions.
Chandan Sapkota, National Graduate Institute for Policy Studies (GRIPS), TokyoNeelina Nakarmi, Economics Analyst, NRM.
The views expressed in the Macroeconomic Update are those of the authors and do not necessarily reflect the views of the ADB, or its Board of Directors, or its member governments.
Asian Development BankNepal Resident MissionMetro Park Building, LazimpatPost Box 5017Kathmandu, NepalTel +977 1 4005120Fax +977 1 [email protected]/nepalwww.facebook.com/adbnrm/

Macroeconomic Update v
CONTENTS
MACROECONOMIC UPDATE PageExecutive Summary viiA. Real Sector 1B. Fiscal Sector 6C. Monetary Sector and Exchange Rate 9D. External Sector 16
ISSUE FOCUSInvestment Climate in Nepal: Progress and Challenges 19
BOXES Box 1: Upbeat Business Scenario Owing to Improved Power Supply 12Box 2: Comparative Foreign Direct Investment Analysis 21Box 3: Legal Provisions 24Box 4: Introducing Automatic Route 25Box 5: One-Window Policy: Challenges 27Box 6: Case Study: Pashmina Trademark Boosts Investors’ Confidence 28Box 7: Emerging Priority: Inadequate Skilled Labor 30
APPENDICES Appendix 1: Country Economic Indicators 33Appendix 2: Country Poverty and Social Indicators 34
vi Macroeconomic Update
ABBREVIATIONS
BFI = banks and financial institutions
CPI = consumer price index
DOI = Department of Industry
FDI = foreign direct investment
FERA = Foreign Exchange Regulation Act
FITTA = Foreign Investment and Technology Transfer Act
GDP = gross domestic product
GFCF = gross fixed capital formation
IBN = Investment Board of Nepal
IEA = Industrial Enterprise Act
IIPB = Industrial and Investment Promotion Board
M2 = money supply
MOF = Ministry of Finance
NBF = Nepal Business Forum
NEA = Nepal Electricity Authority
NRB = Nepal Rastra Bank
NOTE(i) The fiscal year (FY) of the Government ends on 15 July. FY before a calendar year denotes the
year in which the fiscal year ends, e.g., FY2017 ends on 15 July 2017.
(ii) In this report, “$” refers to US dollars, and “€” refers to Euro.
(iii) This edition of Macroeconomic Update uses data available until 3 March 2017.

Macroeconomic Update vii
1. Despite suppressed services output because of the deceleration of remittance inflows, a bumper agricultural output, prospects of a pick-up in post-earthquake reconstruction in the last two quarters of FY2017 and an improving investment climate warrant an optimistic growth outlook than the previous update. The above average monsoon rains and the smooth availability of agricultural inputs, particularly chemical fertilizers, is likely to significantly boost agricultural output. Similarly, the notable improvement in power supply, the resumption of manufacturing activities following the lull after the earthquakes in 2015 and supplies disruption in 2016, and pick up in post-earthquake reconstruction works are expected to boost industrial output. The deceleration of remittance inflows and a marginal effect of the demonetization of higher denomination currency notes in India will likely suppress services activities from its potential level. However, services output is expected to be higher than in the last two years. Overall, tailwinds from the expected acceleration in post-earthquake reconstruction, a slight uptick in demand following the disbursement of housing grants and the election related expenditures may negate the headwinds from the demand dampening effect originating from deceleration of
remittance inflows, demonetization shock in India and some degree of political instability in the Terai region. However, there still remains uncertainty over the intensity of these opposing forces. Hence, gross domestic product (GDP) growth (at basic prices) is forecast to grow between 5.2% and 6.2% in FY2017.
2. Although FY2017 budget was announced one-and-a-half month before the start of the fiscal year on the expectation it will provide enough time to plan for procurement and approvals, the expenditure performance till the first half of the fiscal year is not encouraging. The monthly expenditure pattern is similar to the ones seen in the previous years. Actual spending was just 26.2% of the planned spending by the first half of FY2017, the same as in the first half of FY2015 but lower than 30.2% in the same period in FY2014. Actual recurrent spending was 35.4% of planned recurrent budget, higher than 30.9% in the first half of FY2015. However, capital spending was just 11.3% of the planned capital budget, lower than 12.6% and 13.5% in FY2015 and FY2014, respectively. It is very likely that actual capital spending will heavily bunch in the last quarter of FY2017,
Executive Summary
Macroeconomic Update vii

viii Macroeconomic Update
indicating a persistently weak budget execution capacity of the government. The Ministry of Finance has outlined a series of measures to expedite capital spending.
3. The mid-year revenue mobilization stood at NRs277.6 billion, which is 49% of the total revenue (tax and non-tax) target for FY2017. It is about 69% higher than the revenue mobilizedin the first half of FY2016. As a share of total targets, customs, value added tax (VAT), excise and income tax mobilization up to mid-year stood at 60.4%, 45.4%, 54.2% and 50.1%, respectively. Import-based revenues accounted for about 62% of total revenue in the review period. Overall, tax and non-tax revenue target for FY2017 looks achievable primarily because of the surge in imports following the supplies disruption last year. However, a downside risk to achieving the target is the slowdown in import of vehicles because of liquidity crunch in the last few months.
4. Inflation averaged 5.8% in the first half of FY2017, sharply down from 9.4% in the corresponding period in FY2016 and 9.9% in FY2016. The downward correction of prices following the highs during and after the crippling supplies disruption was expected as supplies gradually normalized (narrowing down the gap
between demand for and supply of goods and services) along with the favorable monsoon (which boosted agricultural output), improved power supply (which is exerting downward pressure on cost of production) and substantial cooling off of prices in India. Food and non-food inflation averaged 4.2% and 7.1% in the first half of FY2017. Considering the normalization of supplies, rosier prospect for agricultural output, continued low fuel and commodity prices, subdued inflation in India, and lower than expected pace of post-earthquake reconstruction efforts so far, inflation in FY2017 is expected to undershoot the government’s target and hover between 6.0% and 6.5%. A deterioration of political situation is a major downside risk to the forecast.
5. Despite a significant increase in net domestic assets, a slowdown in net foreign assets of the banking sector led to a marginally lower growth of money supply (M2). M2 increased by NRs180.9 billion by mid-January 2017 (against the level in mid-July 2016), up from NRs169.8 billion compared to the corresponding period in FY2016. Net foreign assets grew by 4.7% (NRs45 billion), down sharply from a 18.7% growth rate (NRs139.7 billion) in mid-January 2016. The deceleration of remittance inflows contributed to the slowdown in building up of net foreign
viii Macroeconomic Update

Macroeconomic Update ix
assets. The increase in M2 was reflected in the 5.1% growth of narrow money (M1) and 15.9% growth of time deposits.
6. The banks and financial instutions (BFI) mobilized NRs144.4 billion (reaching a total of NRs2,161.2 billion) in deposits in the first six months of FY2017, higher than NRs100.9 billion mobilized in the corresponding period in FY2016. This translates into a growth of 7.2%, up from 6.0% in the first half of FY2016. Meanwhile, total credit (loans and advances) of BFIs increased by 11.0% (NRs208.5 billion) in the first half of FY2017, up from 4.3% growth in the corresponding period in FY2016 (NRs65.9 billion). The short-term interest rates remained higher than in the corresponding periods in FY2016, reflecting the liquidity crunch in the financial sector. The weighted average deposit rate of commercial banks was as low as 3.29% in mid-August 2016 and rose to 3.98% by mid-January 2017. Meanwhile, the weighted average lending rate was 8.88% in mid-August 2016 and rose to 9.31% by mid-January 2017.
7. The country’s external situation weakened as import growth outstripped export growth and remittance inflows decelerated. In the first half of FY2017, balance of payments surplus drastically decreased and current account balance was negative. The balance of payments surplus decreased to $419.6 million
from $1.3 billion in the corresponding period in FY2016. The merchandise trade deficit widened to $3.9 billion, much larger than in the previous corresponding periods. This and deceleration of remittance inflows contributed to the current account deficit of $10.1 million, down from a surplus of $1.5 billion in the corresponding period in FY2016. The capital and financial accounts saw increases in net surpluses. Gross foreign exchange reserves increased from $9.7 billion in mid-July 2016 to $10.0 billion by mid-January 2017, sufficient to cover about 12.4 months of import of goods and non-factor services.
8. This edition of Macroeconomic Update’s issue focus reviews key regulatory and operational aspects for businesses in the country, with an emphasis on foreign investment. Current level of investment in Nepal is inadequate to support its aspirations for higher growth. It needs much higher domestic and foreign investments in priority sectors to achieve its economic potential. Foreign Direct Investment (FDI) flows over the last decade have remained below 1% of GDP. International comparison shows that Nepal lags behind many peer countries in terms of attracting foreign investments.
9. To turnaround the existing situation, it could introduce further reforms especially to address the de facto practices and procedures governing
Macroeconomic Update ix

x Macroeconomic Updatex Macroeconomic Update
foreign investment, mainly related to approval, visa and repatriation of earnings. To ensure better coordination in the approval process, any potential overlaps in institutional mandates need to be avoided. Introducing an automatic route for foreign investment will be a step change in the right direction. Also, a more pragmatic approach against placing limits on the minimum size of FDI could be adopted. Nepal needs to put more effort in protecting intellectual property rights (IPRs). As shown in the case of Pashmina trademark registration this could have a long term benefit. On operational aspects,
it could revive the public-private dialogue platform for a structured deliberation on issues of significance to both domestic and foreign firms. Similarly, serious efforts, including legal measures, are needed to create an environment of healthy industrial relations in the country. Addressing the shortage of workers, especially low-skilled ones, is now an emerging and urgent priority. Finally, a robust and periodic evaluation of industrial promotional schemes needs to be introduced to make effective use of such schemes.

Macroeconomic Update 1
MACROECONOMIC UPDATEA. Real Sector
I. Performance in FY20161. Gross domestic product (GDP) grew by an estimated 0.8% in FY2016 as the lingering impact of the catastrophic earthquakes in FY2015, slow post-earthquake reconstruction, and crippling supplies disruption stymied economic activities (Figure 1).1 This was the lowest economic growth since FY2003.
2. The agricultural sector, which comprises about 33% of GDP and provides livelihood to almost 76% of households grew by an estimated 1.3% in FY2016, marginally higher than 0.8% in FY2015. In addition to the unfavorable monsoon and prolonged drought, the slow rehabilitation of agricultural households after the earthquake and loss of agricultural land due to landslides affected the output of both summer and winter crops.2 Paddy and wheat output, which
Figure 1: Contributions to GDP growth (% points)
Source: Central Bureau of Statistics; NRM staff estimates
1 R and P denote revised estimate and provisional estimate, respectively. Any reference to GDP for FY2015 and FY2016 in this Macroeconomic Update refers to revised and provi-sional estimate, respectively.
2 Major summer crops are paddy, maize, millet, buckwheat and summer potato. Major winter crops are wheat, barley, potato, winter tomato, cauliflower and cabbage.

2 Macroeconomic Update
together account for about one-fourth of agricultural value added, declined by 10.2% and 5.0%, respectively. Meanwhile, the supplies disruption severely affected industrial output, which accounts for a mere 14% of GDP, as it registered a negative growth of 6.3% in FY2016. Mining and quarrying; manufacturing; electricity, gas and water; and construction activities grew at negative rates ranging between 1.7% and 9.9%. Similarly, services sector, which accounts for 53% of GDP and is a key stable driver of GDP growth, grew by an estimated 2.7%, lower than 3.6% after the earthquake in FY2015 and 6.2% in FY2014. Wholesale and retail trade, hotels and restaurants activities registered negative growth as supplies disruption and decline in tourist arrivals weighed heavy on their performance (Table 1).
3. On the expenditure side, consumption accounted for an estimated 94.7% of GDP in FY2016, up from 91.2% of GDP in FY2015, supported by high remittance income (Figure 2).3 Gross investment decreased to 34.0% of GDP in FY2016 from 38.8% of GDP in FY2015, reflecting the decline in private gross fixed capital formation (GFCF) and change in stocks. The investment climate uncertainty after the earthquakes and supplies disruption decreased GFCF to 25.0% of GDP from 27.7% of GDP in FY2015.4 Public GFCF stood at 5.9% of GDP against budgeted capital expenditure target of 9.3% of GDP. Overall, Nepal’s level of fixed capital investment is lower than the average of least developed countries. The four-and-a-half-month long supplies disruption decreased both export and import of goods and services, resulting in narrowing down
Figure 2: Share of GDP by expenditure
Source: Central Bureau of Statistics
-40
-20
0
20
40
60
80
100
120
140
FY2011 FY2012 FY2013 FY2014 FY2015R FY2016P
Final consumption expenditure Gross fixed capital formation
Change in stocks (incl statistical discepancy/errors) Net exports of goods and non-factor services
3 The GDP by expenditure data are prone to measurement errors as change in stocks is computed residually, which also includes statistical discrepancy/errors. Change in stocks was estimated to be 8.9% of GDP in FY2016, slightly down from 11% of GDP in FY2015. A large residual indicates that a significant portion of the GDP is either unexplained or could not be directly attributed to its components, i.e. consumption, capital formation and net exports.
4 Even with this level of investment, the impact on growth and employment is nominal, most probably due to the inefficiency of investment management arising from the lack of efficiency-enhancing prerequisites related to physical and social infrastructures, and the inability to unwind expenditures in underperforming and unfeasible projects
Growth Share of GDPSub-sector FY2015R FY2016P FY2015R FY2016PAgriculture and Forestry 0.7 1.1 32.7 32.8Fishing 7.1 11.8 0.6 0.7Mining and Quarrying 2.3 -6.5 0.4 0.4Manufacturing 0.4 -9.9 6.7 6.0Electricity and Gas 1.0 -1.7 2.1 2.1Construction 2.9 -4.0 5.9 5.7Wholesale and Retail Trade 2.1 -1.1 13.3 13.1Hotel and Restaurants 3.3 -4.8 1.8 1.7Transport, Storage and Communications 6.2 2.6 10.4 10.6Financial Intermediation 2.9 3.3 4.0 4.1Real State Renting and Business Activities 0.8 3.7 7.7 7.9Public Administration and Defence 5.4 5.8 1.8 1.9Education 3.7 6.7 6.7 7.1Health and Social Work 10.5 8.9 1.6 1.7Other Community, Social, and Personal Service Activities 4.4 5.6 4.2 4.4
Source: Central Bureau of Statistics
Table 1: Sectoral growth and composition of GDP

Macroeconomic Update 3
of trade deficit. Exports decreased to 10.7% of GDP from 11.7% of GDP in FY2015. Meanwhile, imports decreased to 39.4% of GDP from 41.7% of GDP in FY2015. Consequently, trade deficit decreased to 28.7% of GDP from 30.0% of GDP a year earlier.
4. Gross domestic savings declined sharply to an estimated 5.3% of GDP from 8.8% of GDP, indicating the high share of consumption, which are mostly met by imported goods. However, increasing remittance inflows, which accounted for 29.6% of GDP in FY2016, supported gross national savings of 42.9% of GDP. High gross national savings but lower gross capital formation resulted in a positive saving-investment gap of 9% of GDP in FY2016. Nominal per capita GDP and nominal per capita gross national income (GNI) are estimated to be around $746 and $760 in FY2016. Nominal per capita gross national disposable income, which includes net transfer such as remittances, stood at $1,035. The size of the economy was about $21.2 billion in FY2016 (Figure 3).
5. Domestic investment commitment is recovering after the earthquakes but it is still lower than the level reached in FY2014. Buoyed by an improving investment climate (including approval of key legislations related to industrial and banking sectors5) and notable effort to reduce power cuts, investment commitment by registered industries at the Department of Industry is rebounding. Overall, domestic investment commitment increased by 18.4% in the first six months of FY2017 compared to the corresponding period in FY2016. Domestic firms committed a total of NRs90.8 billion in the first half of this fiscal year, up from NRs76.7 billion in the corresponding period in FY2016 but lower than NRs182.7 billion committed in the first half of FY2014. Domestic investment commitment in agriculture, construction, energy, mineral, services and tourism increased by over double-digits in the first half of FY2017 (Figure 4).
6. Similarly, foreign direct investment (FDI) commitment is also recovering as investors remain upbeat on the economic outlook as a result of the improving electricity supply, recovering consumption demand, and approval of key laws related to the industrial sector. FDI commitment increased by 27.8% in the first half of FY2017 compared to a negative growth of 83.6% in the corresponding period in FY2016. However, the growth rate is still lower than 172.1% achieved in the first half of FY2015. About
5 Amendments to Industrial Enterprises Act, Special Economic Zone Act, Labor Act, Company Act, and Bank and Financial Institutions Act were approved recently. Meanwhile, amendments to Foreign Investment and Technology Transfer Act, and Intellectual Property Rights Act are pending approval by the parliament.
Figure 3: Nominal GDP and per capita GDP
Source: Central Bureau of Statistics
0
5
10
15
20
25
0
100
200
300
400
500
600
700
800
900
GDP
($ b
illio
n, c
urre
nt p
rices
)
Per c
apita
GDP
($, c
urre
nt p
rices
)
GDP ($ bill ion, current prices) Per capita GDP ($, current prices)
Figure 4: Domestic invesment commitment (NRs billion)
Source: Department of Industry

4 Macroeconomic Update
NRs8.3 billion FDI was committed in the first half of FY2017, up from NRs6.5 billion in the corresponding period in FY2015 but much lower than NRs39.6 billion committed in the first half of FY2014. People’s Republic of China accounted for about two-thirds of the FDI commitment mostly in agriculture and services sectors. No FDI was committed in energy sector in the first half of FY2017. Actual FDI inflow was NRs7.4 billion ($68.9 million) in the first half of FY2017 (Figure 5). Additionally, at the recently concluded Investment Summit the government has reportedly received investment commitment worth $14 billion.
II. FY2017 Growth Outlook7. Despite suppressed services output because of the deceleration of remittance inflows, a bumper agricultural output, possibility of a pick-up in post-earthquake reconstruction in the last two quarters of FY2017 and an improving investment climate warrant an optimistic growth outlook than in the previous update. The above average monsoon rains and the smooth availability of agricultural inputs, particularly chemical fertilizers, is likely to significantly boost agricultural output.6
8. Similarly, industrial output will be robust following a negative growth last year due to the four-and-a-half month long crippling supplies disruption. Specifically, the notable improvement in power supply and the resumption of manufacturing activities following a lull after the earthquakes in 2015 and the supplies disruption in 2016 will underpin a robust manufacturing sector growth. Meanwhile, the expected pick up in reconstruction of houses and settlements (in line with the latest acceleration in grant disbursement by National Reconstruction Authority [NRA]) will support growth in construction and mining and quarrying activities. Furthermore, addition of electricity from small hydropower projects this year will support growth of electricity, gas and water subsector. Increase in capital spending in the last quarter is also expected to boost construction, manufacturing and mining activities.
9. The deceleration of remittance inflows and a marginal effect of the demonetization of higher denomination currency notes in India will likely suppress services activities from its potential level. The growth of migrant workers is expected to fall in FY2017 as well because of the slowdown in investment in the major overseas employment destinations (following the impact of low oil prices in
6 Preliminary estimates by Ministry of Agriculture Development show a 21.7% increase in paddy output in FY2017, much higher than the decrease by 10.2% in FY2016 following subnormal monsoon and drought. Similarly, maize, millet and buckwheat are projected to grow by 1.2%, 1.2% and 1.4%, respectively.
Figure 5: FDI commitments and actual inflows (NRs billion)
Source: Department of Industry; Nepal Rastra Bank
Macroeconomic Update 5
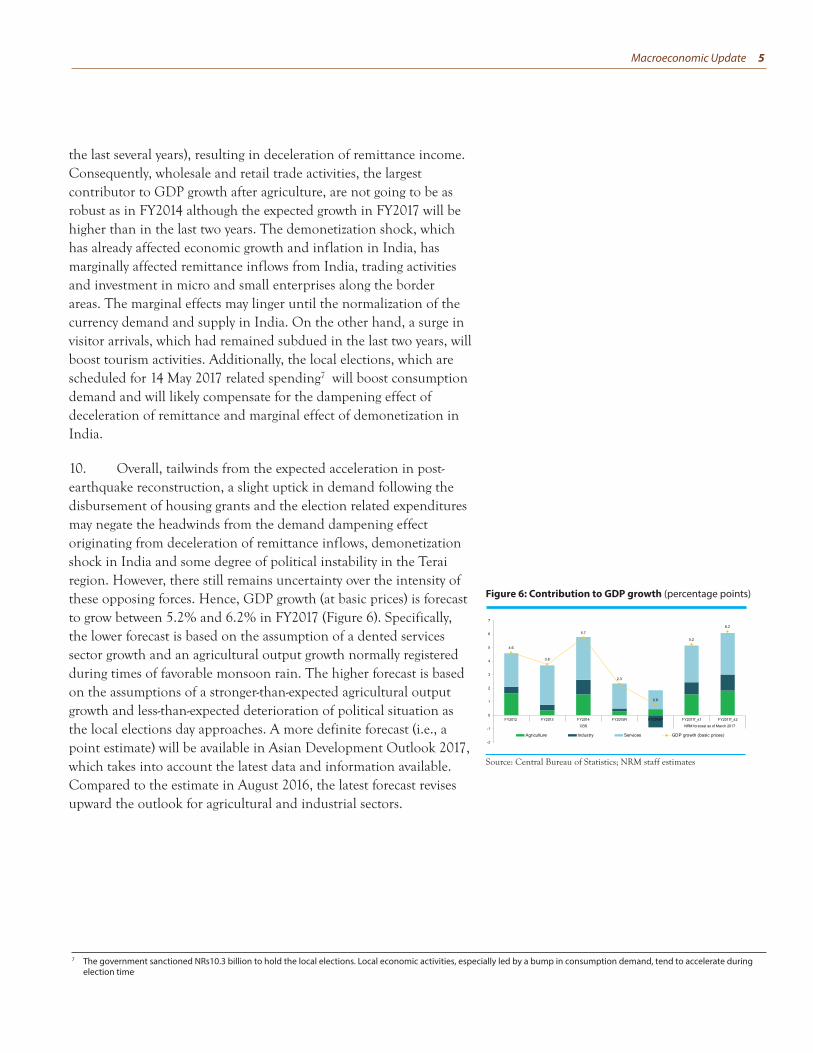
the last several years), resulting in deceleration of remittance income. Consequently, wholesale and retail trade activities, the largest contributor to GDP growth after agriculture, are not going to be as robust as in FY2014 although the expected growth in FY2017 will be higher than in the last two years. The demonetization shock, which has already affected economic growth and inflation in India, has marginally affected remittance inflows from India, trading activities and investment in micro and small enterprises along the border areas. The marginal effects may linger until the normalization of the currency demand and supply in India. On the other hand, a surge in visitor arrivals, which had remained subdued in the last two years, will boost tourism activities. Additionally, the local elections, which are scheduled for 14 May 2017 related spending7 will boost consumption demand and will likely compensate for the dampening effect of deceleration of remittance and marginal effect of demonetization in India.
10. Overall, tailwinds from the expected acceleration in post-earthquake reconstruction, a slight uptick in demand following the disbursement of housing grants and the election related expenditures may negate the headwinds from the demand dampening effect originating from deceleration of remittance inflows, demonetization shock in India and some degree of political instability in the Terai region. However, there still remains uncertainty over the intensity of these opposing forces. Hence, GDP growth (at basic prices) is forecast to grow between 5.2% and 6.2% in FY2017 (Figure 6). Specifically, the lower forecast is based on the assumption of a dented services sector growth and an agricultural output growth normally registered during times of favorable monsoon rain. The higher forecast is based on the assumptions of a stronger-than-expected agricultural output growth and less-than-expected deterioration of political situation as the local elections day approaches. A more definite forecast (i.e., a point estimate) will be available in Asian Development Outlook 2017, which takes into account the latest data and information available. Compared to the estimate in August 2016, the latest forecast revises upward the outlook for agricultural and industrial sectors.
7 The government sanctioned NRs10.3 billion to hold the local elections. Local economic activities, especially led by a bump in consumption demand, tend to accelerate during election time.
Figure 6: Contribution to GDP growth (percentage points)
Source: Central Bureau of Statistics; NRM staff estimates

6 Macroeconomic Update
B. FISCAL SECTOR
I. FY2017 Budget11. The total expenditure outlay for FY2017 is NRs1048 billion (an estimated 39.5% of GDP), which is 28.1% higher than the budget estimate for FY2016 (Table 2). The FY2017 outlay comprises NRs617.2 billion for recurrent expenditures (58.8% of the total outlay), NRs311.9 billion for capital expenditures (29.7%), and NRs119.8 billion for financial provision (11.4%). The substantially larger size of the budget is due to the large increase in recurrent and capital spending. The outlay for recurrent expenditure (equivalent to 23.3% of GDP) is 42.2% higher than the revised estimated expenditure in FY2016. The planned capital spending has been increased by 96.1% over the FY2016 revised estimate (equivalent to 11.8% of GDP). A total revenue target of NRs682.8 billion (25.7% of GDP) has been set for FY2017,
Table 2: FY2017 budget and expenditure overview
FY2017 budget targetsGDP growth target (%) 6.5
Inflation target (%) 7.5
FY2017 budget overviewNRs billion % of GDP
Budget outlay 1048.9 39.5Recurrent 617.2 23.3
Capital 311.9 11.8Financing 119.8 4.5Projected total revenue 682.8 25.7Revenue 565.9 21.3Foreign grants 106.9 4.0Principal repayment 10.0 0.4Projected deficit financing 366.1 13.8Foreign loans 195.7 7.4Domestic borrowing 111.0 4.2FY2014 cash balance 59.4 2.2
Table 3: Breakdown of reconstruction budget for FY2017
NRs billion % FY2016R FY2017 GON Share of loan & grantNational Reconstruction Authority 0.20 0.17
Recurrent 0.10 0.16
Capital 0.10 0.01National Reconstruction Authority Trust 83.8 12.3 85.3
Recurrent 49.6 8.9 82.1
Capital 34.2 3.4 90.0National Reconstruction Fund 31.3 56.8 4.0 93.0
Recurrent 22.2 8.9 3.0 66.3
Capital 9.1 47.9 1.0 97.9
Total 31.5 140.8 16.3 88.3

Macroeconomic Update 7
including projected foreign grants of NRs106.9 billion (4.0% of GDP) and principal repayment of NRs10 billion. The budget deficit is to be financed by foreign loans amounting to NRs195.7 billion, domestic borrowing of NRs111.0 billion, and FY2016 cash balance of NRs59.4 billion. Net foreign loans and net domestic borrowings are projected to be 6.4% and 3.5% of GDP, respectively.
12. About Rs141 billion has been allocated for post-earthquake reconstruction and rehabilitation in FY2017 (Table 3). These include administrative expenses for the NRA, unconditional recurrent and capital grants to government agencies, other institutions and affected households, and funding for constructing schools, hospitals and civil works, among others. Foreign loan and grants account for about 88.0% of the total reconstruction budget for FY2017. In FY2016, only 35.0% of the planned reconstruction budget was spent.
II.Expenditure Performance13. Although FY2017 budget was announced one-and-a-half month before the start of the fiscal year on the expectation it will provide enough time to plan for procurement and approvals, the expenditure performance till the first half of the fiscal year is not encouraging. The monthly expenditure pattern is similar to the ones seen in the previous years. It indicates that the low absorption capacity is procedural as well as structural in nature. Actual spending was just 26.2% of the planned spending by the first half of FY2017 (Figure 7), the same as in the first half of FY2015 but lower than 30.2% in the same period in FY2014. Actual recurrent spending was 35.4% of planned recurrent budget, higher than 30.9% in the first half of FY2015. However, capital spending was just 11.3% of the planned capital budget, lower than 12.6% and 13.5% in FY2015 and FY2014, respectively (Figure 8).
14. As in the previous years, it is very likely that actual capital spending will heavily bunch in the last quarter of FY2017, indicating a persistently weak budget execution capacity of the government. Of the actual capital spending in FY2016, 70.0% was spent in the last quarter and 49.4% in the last month. Similarly, in FY2014, 63.0% of actual capital expenditure happened in the last quarter and 44.0% in the last month. This fiscal year as well, it will mostly likely follow the same pattern and actual spending may be around 75.0% of the planned capital budget. The bunching of capital spending in the last three months raises serious concerns about the quality of spending done in haste and the lack of careful advanced planning.
Figure 7: Mid-year expenditure (NRs billion)
Source: Ministry of Finance
Figure 8: Mid-year budget utilization (%)
Source: Financial Comptroller General Office

8 Macroeconomic Update
This would mean the level of spending in the last month of FY2017 (about 4.9% of GDP) would be higher than the entire annual capital spending prior to FY2016. Assuming a 75.0% utilization rate, capital spending in FY2017 (including reconstruction related capital spending) will likely reach a record 8.2% of GDP (against a target of 11.8% of GDP) (Figure 9). In the mid-year review of FY2017 budget, the Ministry of Finance (MOF) estimated actual capital spending to be 84% of the planned capital budget.
15. Procedural as well as structural factors are plaguing expenditure absorption capacity.8 Among others these include: (i) lack of project readiness, in terms of timely preparatory activities such as land acquisition, establishment of project management offices, and preparation of procurement plans; (ii) inter and intra ministry coordination, including delays in project approval and budget release; (iii) delays in procurement related processes;9 and (iv) overall weak project planning, implementation and contract management capacity. The lengthy processes taken by various oversight bodies and aversions to decision-making have also contributed to the delays in project implementation. Nepal needs to significantly enhance both quantum and quality of public capital spending to build the necessary infrastructure needed to graduate from Least Developed Country (LDC) category to a developing country status by 2022, and the long-term goal of becoming a middle-income country by 2030.
16. The government is gradually addressing some of these measures. So what is the proposed amendment? the proposed amendment is that the line ministries will no longer need re-approval of NPC for the already approved and included projects in the budget. These approval processes are lengthy and delay implementation of projects that are already agreed upon, approved, and included in the budget. It is expected to be implemented starting FY2018. The MOF is also considering expedited approval of projects and programs applied through the Line Ministry Budgetary Information System (LMBIS). The MOF has emphasized finishing detailed design and project cost estimates by mid-August, invitation of bid by mid-September, evaluation and award of contract by mid-November, and start construction work by mid-December. It is intensifying consultation with the ministries having the largest capital budget to accelerate capital spending.
8 A detailed analysis of capital spending is included in Nepal chapter of Asian Development Outlook 2015.9 A detailed analysis of public procurement is included in August 2016 edition of Macroeconomic Update.
Figure 9: Capital expenditure (% of GDP)
Source: Ministry of Finance; NRM staff estimates
Macroeconomic Update 9
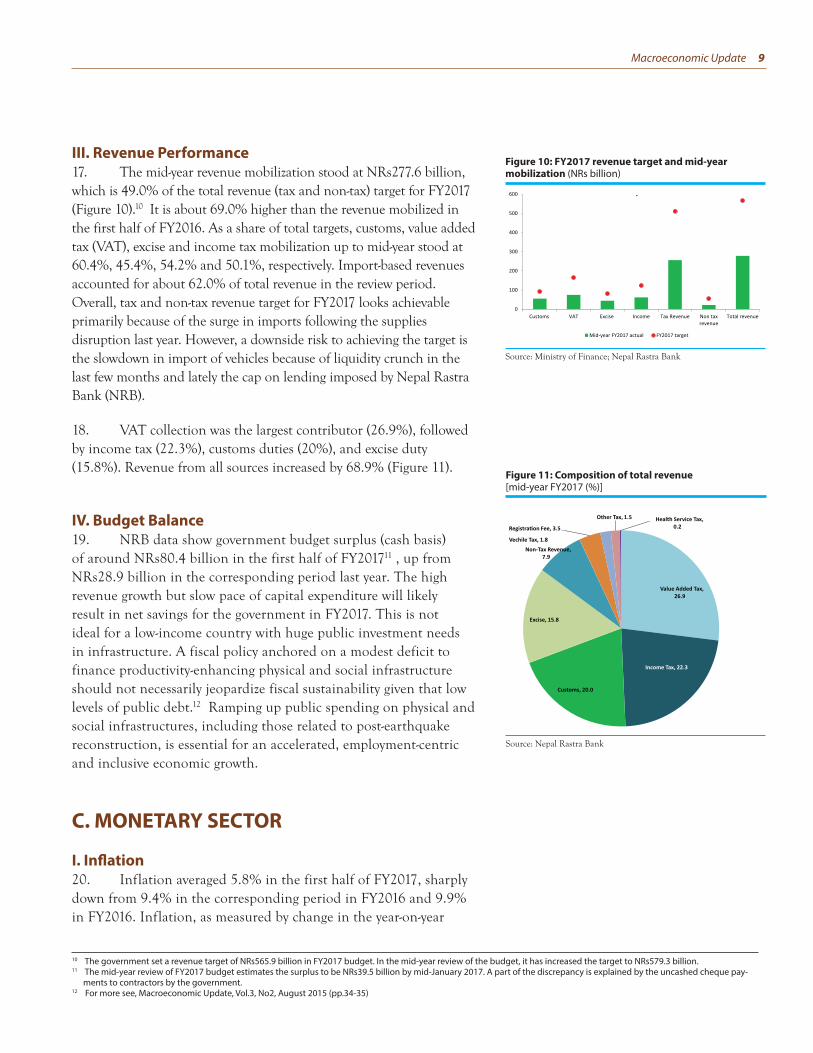
III. Revenue Performance17. The mid-year revenue mobilization stood at NRs277.6 billion, which is 49.0% of the total revenue (tax and non-tax) target for FY2017 (Figure 10).10 It is about 69.0% higher than the revenue mobilized in the first half of FY2016. As a share of total targets, customs, value added tax (VAT), excise and income tax mobilization up to mid-year stood at 60.4%, 45.4%, 54.2% and 50.1%, respectively. Import-based revenues accounted for about 62.0% of total revenue in the review period. Overall, tax and non-tax revenue target for FY2017 looks achievable primarily because of the surge in imports following the supplies disruption last year. However, a downside risk to achieving the target is the slowdown in import of vehicles because of liquidity crunch in the last few months and lately the cap on lending imposed by Nepal Rastra Bank (NRB).
18. VAT collection was the largest contributor (26.9%), followed by income tax (22.3%), customs duties (20%), and excise duty (15.8%). Revenue from all sources increased by 68.9% (Figure 11).
IV. Budget Balance19. NRB data show government budget surplus (cash basis) of around NRs80.4 billion in the first half of FY201711 , up from NRs28.9 billion in the corresponding period last year. The high revenue growth but slow pace of capital expenditure will likely result in net savings for the government in FY2017. This is not ideal for a low-income country with huge public investment needs in infrastructure. A fiscal policy anchored on a modest deficit to finance productivity-enhancing physical and social infrastructure should not necessarily jeopardize fiscal sustainability given that low levels of public debt.12 Ramping up public spending on physical and social infrastructures, including those related to post-earthquake reconstruction, is essential for an accelerated, employment-centric and inclusive economic growth.
C. MONETARY SECTOR
I. Inflation20. Inflation averaged 5.8% in the first half of FY2017, sharply down from 9.4% in the corresponding period in FY2016 and 9.9% in FY2016. Inflation, as measured by change in the year-on-year
Figure 10: FY2017 revenue target and mid-year mobilization (NRs billion)
Source: Ministry of Finance; Nepal Rastra Bank
10 The government set a revenue target of NRs565.9 billion in FY2017 budget. In the mid-year review of the budget, it has increased the target to NRs579.3 billion.11 The mid-year review of FY2017 budget estimates the surplus to be NRs39.5 billion by mid-January 2017. A part of the discrepancy is explained by the uncashed cheque pay-
ments to contractors by the government. 12 For more see, Macroeconomic Update, Vol.3, No2, August 2015 (pp.34-35)
Source: Nepal Rastra Bank
Figure 11: Composition of total revenue [mid-year FY2017 (%)]

10 Macroeconomic Update
(y-o-y) consumer price index (CPI), started moderating from October compared to the price level in the corresponding months in FY2016 (Figure 12). The downward correction of prices following the highs during and after the crippling supplies disruption was expected as supplies gradually normalized (narrowing down the gap between demand for and supply of goods and services) along with the favorable monsoon (which boosted agricultural output), improved power supply (which is exerting downward pressure on cost of production) and substantial cooling off of prices in India.
21. Compared to the corresponding months of FY2016, food inflation (y-o-y CPI), which constitutes 43.9% weight in the CPI basket, increased in the first month of FY2017, and then started to slow down rapidly (Figure 13). It averaged 4.2% in the first half of FY2017, down from an average of 11.1% in the corresponding period in FY2016. Prices of perishable and consumable goods such as cereal grains, pluses and legumes, vegetables, meat, fish, ghee and oil and fruits have declined rapidly. However, prices of sugar and sugar products have been edging upward due to shortages in recent months. Similarly, prices of alcoholic drinks and tobacco products have increased in line with the increase in their tariff announced in the FY2017 budget.
22. Non-food and services inflation averaged 7.1% in the first six months of FY2017, down from 8.1% in the corresponding period in FY2016 (Figure 14). Non-food inflation started to moderate starting November 2016 as prices transportation and communication started declining in line with the low fuel prices and normalization of supplies. However, prices of durables and housing are still at elevated levels, in turn exerting higher pressures on overall inflation.
23. Inflation in Nepal is primarily driven by prices of goods in India, which is Nepal’s largest trading partner and to whose currency the Nepalese rupee is pegged. The normalization of supplies in recent months led to narrowing down of inflation between Nepal and India. Other factors influencing inflation include agricultural output, oil price movements, domestic wages, exchange rate against convertible currencies, and domestic supply-side constraints. Constraints such as power outages, transport bottlenecks, lack of raw materials leading to the high import content of manufactured products, inadequate supply of key agricultural inputs, and market distortions by middlemen, cartels, and syndicates tend to induce downward price rigidity, making conventional fiscal and monetary policies less effective than expected.
Figure 13: Food inflation
Source: Nepal Rastra Bank
Figure 14: Non-food inflation
Source: Nepal Rastra Bank
Figure 12: Overall inflation
Source: Nepal Rastra Bank

Macroeconomic Update 11
II. FY2017 Inflation Outlook24. In addition to the normalization of supplies, a rosier prospect for agricultural output, continued low fuel and commodity prices, subdued inflation in India, and lower than expected pace of post-earthquake reconstruction efforts in the first half of FY2017, inflation is revised downward from the forecast in our previous update. A faster decline in prices of perishable and daily consumable goods as well as consumer durables largely accounted for the downward revision of inflation forecast for FY2017. Specifically, more than anticipated bumper agriculture harvest— thanks to the above average monsoon rains and the smooth availability of agricultural inputs, particularly chemical fertilizers— and faster than expected deceleration of consumer prices in India (partially contributed by the demand shortfall arising from demonetization shock in November 2016) played a critical role in such a forecast revision. Furthermore, the notable improvement in electricity supply this year has also decreased cost of production for business and household enterprises. That said, rise in international fuel prices and political disturbances—especially in the Terai region, as local elections, which are scheduled for May 14, approaches— may exert upward pressures on general prices of goods and services. The other likely sources of upward price pressures are direct and indirect election related expenses as political campaign intensifies and a demand boost arising from the expected acceleration in post-earthquake reconstruction works in the remaining period of this fiscal year.
25. Considering these factors, headline inflation in FY2017 is expected to undershoot the government’s target and hover between 6.0% and 6.5% (Figure 15). A substantial moderation of prices of cereal grains, pulses and legumes, ghee and oil, spices and vegetables will exert downward pressures on overall food prices and contribute between 2.2 and 2.4 percentage points to the forecasted overall inflation. Similarly, non-food and services prices, which account for 56.1% weight in the CPI basket, are also expected to cool off on account of either stabilization or moderation of prices of consumer durables and utilities. It is expected to contribute between 3.8 and 4.1 percentage points to the overall estimated inflation. A deterioration of political situation is a major downside risk to the forecast. A more definite forecasted point estimate is available in Asian Development Outlook 2017, which takes into account the latest data and information available.
Figure 15: Contribution to inflation (percentage points)
Source: Nepal Rastra Bank; NRM staff estimates

12 Macroeconomic Update
The business community and the public are enthused by the government’s drive to end load-shedding. An inadequate supply of electricity is considered the most binding constraint to economic activities in Nepal. The existing efforts to end load-shedding through administrative and management overhaul is a welcome move. These positive measures should now also be channeled into reforming the overall energy market, including legislative and institutional reforms.
The uninterrupted power supply has lowered cost of production for small and medium enterprises as they don’t have to invest in expensive alternatives such as diesel generators and inverters. Similarly, big firms are also generally pleased with limited hours of power cuts instead of unscheduled and longer hours of power cuts in the previous years. Most industries are now running at over 80% capacity compared to 50% capacity utilization in the previous years. Industrial outputs such as cement, iron and steel that are crucial for post-earthquake reconstruction are manufactured at record capital utilization rates. These efforts are having some positive effect on overall economic growth and inflation. Efforts to sustain the uninterrupted power supply would further boost economic activities in the coming years, lower pressures on prices of goods and services, and enhance the cost competitiveness of Nepalese goods and services.
As of the first week of March, the peak energy demand was estimated to be around 1253 MW. The total supply is about 857 MW, of which around 45% is imported from India. The load management efforts geared toward achieving allocative efficiency and efforts to plug in system losses are yielding positive results as evidenced in the last few months. For long-term solution, electricity generation has to increase to match the latent demand. Water and Energy Commission Secretariat (WECS) estimates that the total installed capacity requirement stood at 1721 MW in 2015
Box 1: Upbeat Business Scenario Owing to Improved Power Supply
and is expected to be in excess of 3000 MW by 2020. By 2030, the installed capacity requirement to meet demand is projected to be over 10,000 MW. Construction of more medium and large-scale run-of-the-river and reservoir type projects need to be commissioned soon so that they are completed on time to catch up with the projected increase in electricity consumption, which at present is one of the lowest in the region.
Nepal Electricity Authority (NEA) has its priority already cut out in the medium-term to supply uninterrupted power. These include: (i) continue with efforts to achieve allocative efficiency; (ii) plugging leakages (estimated to be around 25%) arising from electricity theft and system losses; (iii) maintain and expand transmission and distribution lines for smooth distribution of power from surplus to deficit areas; (iv) increase generation by accelerating completion of ongoing projects and initiating new ones; (v) expedite signing of power purchase agreements with private sector developers; and (vi) continue efforts to overhaul administrative, financial and management functions. Currently, NEA leads the pack in terms of the highest net losses among the 37 public enterprises. Its losses in FY2015 was about 0.6% of GDP. The long-term need is to have separate entities for generation, distribution, transmission and trading of electricity. The strong support by the Ministry of Energy to the reforms measure initiated by the management of NEA is reviving hopes of a financial, functional and administrative turnaround of NEA.
Projected additional electricity supply in FY2017• Public and private sectors: 142 MW (15 projects
including 50 MW Upper Marshyangdi)• 100 MW already added• Rest to be added to the grid by mid-July 2017• The government’s target is to add about 200 MW
additional electricity to the grid• Total installed capacity will likely reach 1000 MW• Current peak demand (around first week of March):
1253 MW, which will be over 1400 MW by the end of FY2017
• NEA: 328 MW• Private sector: 140 MW• Import from India: 389 MW• Deficit: 396 MW
Projected additional electricity generation in FY2018 • Private sector: 201 MW• NEA: 44 MW (30 MW Chameliya and 14 MW Kulekhani III)• Upper Tamakoshi: 456 MW (if completed within time)
Electric power consumption (kWh per capita)
Source: World Bank
Net losses of public enterprises (% of GDP)
Source: Ministry of Finance; NRM staff estimates.
Source: Nepal Electricity Authority; NRM staff estimates

Macroeconomic Update 13
III. Money Supply26. Despite a significant increase in net domestic assets,13 a slowdown in net foreign assets14 of the banking sector led to a marginally lower growth of money supply (M2).15 M2 increased by NRs180.9 billion by mid-January 2017 (against the level in mid-July 2016), up from NRs169.8 billion compared to the corresponding period in FY2016. Net foreign assets grew by 4.7% (NRs45 billion), down sharply from a 18.7% growth rate (NRs139.7 billion) in mid-January 2016 (Figure 16). The deceleration of remittance inflows contributed to the slowdown in building up of net foreign assets. The increase in M2 was reflected in the 5.1% growth of narrow money (M1) and 15.9% growth of time deposits.
27. Net claims on the government16 — direct loans and government securities held by the central bank—further decreased by 123.6% (NRs108.4 billion), higher than the 52.5% fall recorded over the commensurate period up until mid-January FY2016. It reflects the large increase in government deposits (or lower credit to the government) compared to the bank and financial institutions (BFIs) claims on the government. The overall credit to the private sector grew by 12.6% (NRs212.5 billion), sharply up from 5.9% growth (NRs81.4 billion) in mid-January FY2016, reflecting the dramatic pickup in lending as a result of the aggressive credit disbursement by BFIs following the normalization of supplies and demand for loanable funds.
IV. Deposit and Credit28. The BFIs mobilized NRs144.4 billion (reaching a total of NRs2,161.2 billion) in deposits in the first six months of FY2017, higher than NRs100.9 billion mobilized in the corresponding period in FY2016. This translates into a growth of 7.2%, up from 6.0% in the first half of FY2016. Deposit mobilization of commercial banks and development banks increased by 8.4% and 0.2%, respectively, but finance companies saw deposit mobilization decrease by 10.7% (Figure 17). Deposits were lower because of the deceleration of official remittance inflows and deposit rates.
29. Total credit (loans and advances) of BFIs increased by 11% (NRs208.5 billion) in the first half of FY2017, up from 4.3% growth
Figure 16: Monetary sector (% change)
Source: Nepal Rastra Bank
Figure 17: Growth rate of deposits (% change)
Source: Nepal Rastra Bank
13 It is the difference between the value of assets owned abroad and the value of domestic assets owned by non-residents.14 The balance sheet of monetary authorities is composed of assets and liabilities. Assets consist of net foreign assets and net domestic assets (net claims on government
and claims on the private sector). Liabilities consist of currency issued and deposits. Both net foreign assets and net claims on government affect reserve money and hence the money supply. A decline in net foreign assets, denominated in local currency in the monetary survey, and the banking sector’s net credit to government reduces the money supply. Net foreign assets are associated with the fluctuations in foreign exchange reserves (in the balance of payments account).
15 Money supply (M2) is the sum of net foreign assets and net domestic assets. Also called broad money, M2 is equal to narrow money (M1) and saving and time deposits. M1 is equal to currency in circulation and demand deposits.
16 To facilitate the analysis of the central bank’s financing of government operations, claims on the government are recorded on a net basis. The net credit to the govern-ment means creation of high powered money, i.e. monetary base (currency in circulation plus reserves of banks in the central bank)

14 Macroeconomic Update
in the corresponding period in FY2016 (NRs65.9 billion). Credit extended by commercial banks grew by 12.7% (NRs202.2 billion), up from a rate of 4.4% in mid-January FY2016. While credits by development banks increased by 3.5% (NRs10.4 billion), credits by finance companies decreased by 3.1% (NRs2.7 billion) (Figure 18). During the review period, credit to the private sector (by category A, B and C BFIs) increased by 11% (NRs208 billion), up from a 4.3% growth rate (NRs65.9 billion) in the first half of FY2016, with commercial banks, development banks, and finance companies registering growth rates of 14.5%, 6.3% and -5.4%, respectively. Unlike in the previous review period, the low lending rates led to a pickup in lending to industries, wholesale and retailers, construction, services and agriculture, among others. Cumulatively, 21.8% of the total credit went to wholesale and retail traders, followed by 17.3% to industry,17 10.8% to construction, and 8% to finance, insurance and fixed assets (Figure 19).
30. In the review period, NRB mopped up NRs36.8 billion through deposit auctions18 and NRs64.2 billion through reverse repo auction. Deposit auction is a new monetary instrument used by NRB to mop up excess liquidity and have been used since the second month of FY2015. NRB mopped up Rs198.4 billion through deposit auction in the corresponding period in FY2016, NRs97.4 billion through reverse repo auction, and NRs9.1 billion through outright sale auction. The weighted average interest rate pertaining to reverse repo auctions has been between 0.43% and 2.49%, substantially higher than the ones in the corresponding period in FY2016.
Figure 20: Annual change in lending (NRs billion)
Source: Nepal Rastra Bank
Figure 19: Composition of total lending (NRs billion)
Source: Nepal Rastra Bank
Figure 18. Growth of credit (% change)
Source: Nepal Rastra Bank
17 It comprises of productive sectors such as food production, agriculture, handicrafts, textiles, paper, medicine, processing plants, plastic, cement and metals, among others.18 Under its new interest rate corridor, NRs29.8 billion was mopped up through 14 day deposit auction and NRs7.1 billion through 90 day deposit auction. Interest rate for
the former ranged between 0.3% and 2.1%, and for the latter between 1.39% and 2.60%.
Macroeconomic Update 15
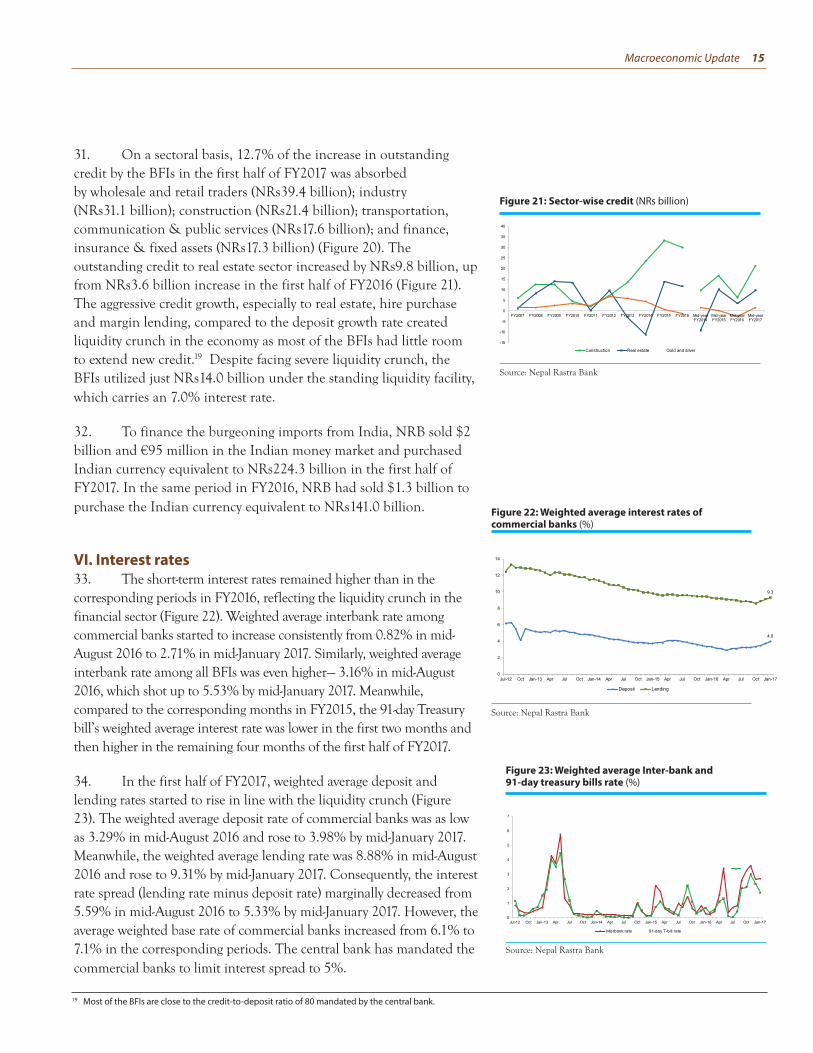
31. On a sectoral basis, 12.7% of the increase in outstanding credit by the BFIs in the first half of FY2017 was absorbed by wholesale and retail traders (NRs39.4 billion); industry (NRs31.1 billion); construction (NRs21.4 billion); transportation, communication & public services (NRs17.6 billion); and finance, insurance & fixed assets (NRs17.3 billion) (Figure 20). The outstanding credit to real estate sector increased by NRs9.8 billion, up from NRs3.6 billion increase in the first half of FY2016 (Figure 21). The aggressive credit growth, especially to real estate, hire purchase and margin lending, compared to the deposit growth rate created liquidity crunch in the economy as most of the BFIs had little room to extend new credit.19 Despite facing severe liquidity crunch, the BFIs utilized just NRs14.0 billion under the standing liquidity facility, which carries an 7.0% interest rate.
32. To finance the burgeoning imports from India, NRB sold $2 billion and €95 million in the Indian money market and purchased Indian currency equivalent to NRs224.3 billion in the first half of FY2017. In the same period in FY2016, NRB had sold $1.3 billion to purchase the Indian currency equivalent to NRs141.0 billion.
VI. Interest rates33. The short-term interest rates remained higher than in the corresponding periods in FY2016, reflecting the liquidity crunch in the financial sector (Figure 22). Weighted average interbank rate among commercial banks started to increase consistently from 0.82% in mid-August 2016 to 2.71% in mid-January 2017. Similarly, weighted average interbank rate among all BFIs was even higher— 3.16% in mid-August 2016, which shot up to 5.53% by mid-January 2017. Meanwhile, compared to the corresponding months in FY2015, the 91-day Treasury bill’s weighted average interest rate was lower in the first two months and then higher in the remaining four months of the first half of FY2017.
34. In the first half of FY2017, weighted average deposit and lending rates started to rise in line with the liquidity crunch (Figure 23). The weighted average deposit rate of commercial banks was as low as 3.29% in mid-August 2016 and rose to 3.98% by mid-January 2017. Meanwhile, the weighted average lending rate was 8.88% in mid-August 2016 and rose to 9.31% by mid-January 2017. Consequently, the interest rate spread (lending rate minus deposit rate) marginally decreased from 5.59% in mid-August 2016 to 5.33% by mid-January 2017. However, the average weighted base rate of commercial banks increased from 6.1% to 7.1% in the corresponding periods. The central bank has mandated the commercial banks to limit interest spread to 5%.
19 Most of the BFIs are close to the credit-to-deposit ratio of 80 mandated by the central bank.
Figure 21: Sector-wise credit (NRs billion)
Source: Nepal Rastra Bank
Figure 22: Weighted average interest rates of commercial banks (%)
Source: Nepal Rastra Bank
Figure 23: Weighted average Inter-bank and 91-day treasury bills rate (%)
Source: Nepal Rastra Bank
16 Macroeconomic Update
D. EXTERNAL SECTOR
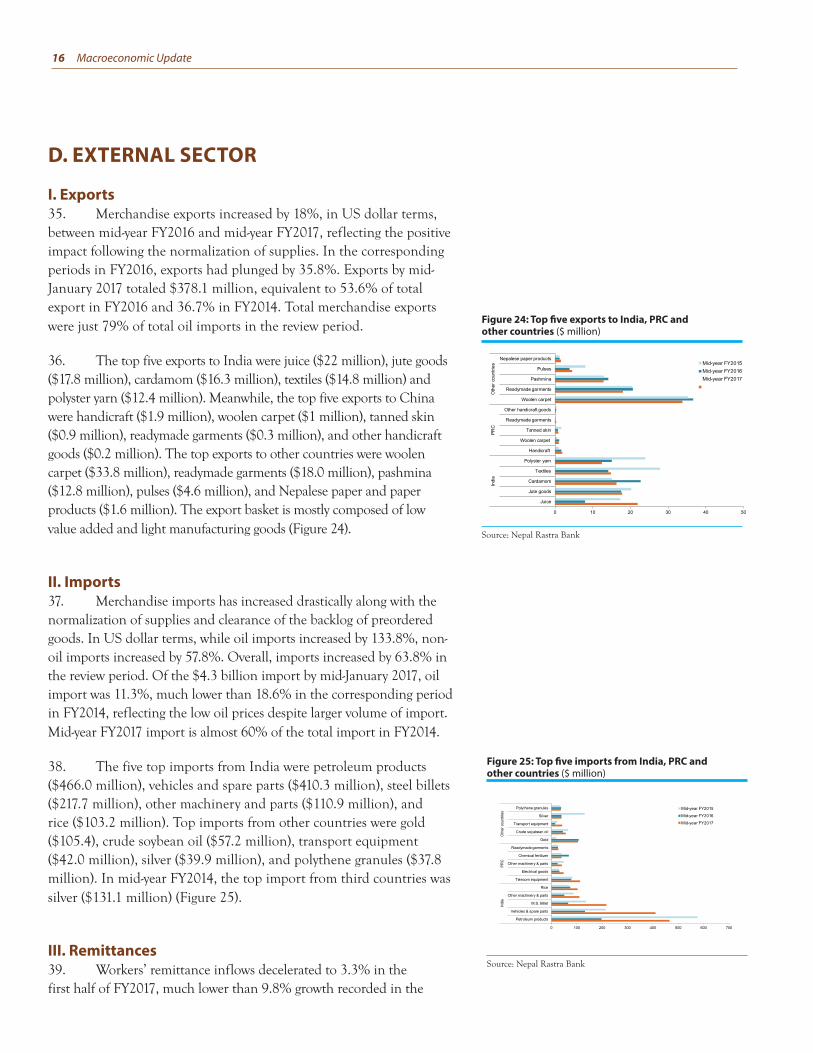
I. Exports35. Merchandise exports increased by 18%, in US dollar terms, between mid-year FY2016 and mid-year FY2017, reflecting the positive impact following the normalization of supplies. In the corresponding periods in FY2016, exports had plunged by 35.8%. Exports by mid-January 2017 totaled $378.1 million, equivalent to 53.6% of total export in FY2016 and 36.7% in FY2014. Total merchandise exports were just 79% of total oil imports in the review period.
36. The top five exports to India were juice ($22 million), jute goods ($17.8 million), cardamom ($16.3 million), textiles ($14.8 million) and polyster yarn ($12.4 million). Meanwhile, the top five exports to China were handicraft ($1.9 million), woolen carpet ($1 million), tanned skin ($0.9 million), readymade garments ($0.3 million), and other handicraft goods ($0.2 million). The top exports to other countries were woolen carpet ($33.8 million), readymade garments ($18.0 million), pashmina ($12.8 million), pulses ($4.6 million), and Nepalese paper and paper products ($1.6 million). The export basket is mostly composed of low value added and light manufacturing goods (Figure 24).
II. Imports37. Merchandise imports has increased drastically along with the normalization of supplies and clearance of the backlog of preordered goods. In US dollar terms, while oil imports increased by 133.8%, non-oil imports increased by 57.8%. Overall, imports increased by 63.8% in the review period. Of the $4.3 billion import by mid-January 2017, oil import was 11.3%, much lower than 18.6% in the corresponding period in FY2014, reflecting the low oil prices despite larger volume of import. Mid-year FY2017 import is almost 60% of the total import in FY2014.
38. The five top imports from India were petroleum products ($466.0 million), vehicles and spare parts ($410.3 million), steel billets ($217.7 million), other machinery and parts ($110.9 million), and rice ($103.2 million). Top imports from other countries were gold ($105.4), crude soybean oil ($57.2 million), transport equipment ($42.0 million), silver ($39.9 million), and polythene granules ($37.8 million). In mid-year FY2014, the top import from third countries was silver ($131.1 million) (Figure 25).
III. Remittances39. Workers’ remittance inflows decelerated to 3.3% in the first half of FY2017, much lower than 9.8% growth recorded in the
Figure 24: Top five exports to India, PRC and other countries ($ million)
Source: Nepal Rastra Bank
Figure 25: Top five imports from India, PRC and other countries ($ million)
Source: Nepal Rastra Bank

Macroeconomic Update 17
corresponding period in FY2016. This is consistent with the decline in the growth of overseas migrant workers (Figure 26) following the slowdown in investment (arising from persistently low oil prices) in the major employment destinations. Remittance inflows reached $3.2 billion in the first half of FY2017, marginally higher than $3.1 billion in the same period in FY2016. It is equivalent to 50.9% of $6.3 billion (29.6% of GDP) remittance inflows in FY2016. Labor migration (those who obtained permits from the Department of Foreign Employment) decreased by 9.9%, lower than the 22.5% decrease in the corresponding period in FY2016. On an average, 1,038 workers left the country legally each day in the first six months of FY2017, lower than 1,152 and 1,487 in the corresponding period in FY2016 and FY2015, respectively.
IV. Balance of Payments40. The country’s external situation weakened as import growth outstripped export growth and remittance inflows decelerated. In the first half of FY2017, balance of payments surplus drastically decreased and current account balance was negative. The balance of payments surplus decreased to $419.6 million from $1.3 billion in the corresponding period in FY2016 (Figure 27). The merchandise trade deficit widened to $3.9 billion, much larger than in the previous corresponding periods. This and deceleration of remittance inflows contributed to the current account deficit of $10.1 million, down from a surplus of $1.5 billion in the corresponding period in FY2016. The capital and financial accounts saw increases in net surpluses. Gross foreign exchange reserves increased from $9.7 billion in mid-July 2016 to $10.0 billion by mid-January 2017, sufficient to cover about 12.4 months of import of goods and non-factor services.
Figure 26: Number of migrants and remittance inflows
Source: Department of Foreign Employment; Nepal Rastra Bank
Figure 27: Balance of payment (US$ million)
Source: Nepal Rastra Bank

18 Macroeconomic Update
V. Exchange rate41. The Nepalese rupee continued to remain weak against the US dollar, closely following currency movement of the Indian rupee, to which the currency peg has remained unchanged since 1993 (Figure 28). Overall, the Nepalese rupee depreciated by 5.2% between mid-July 2015 and mid-July 2016. It depreciated by 1.7% in mid-January 2017 from the level in mid-July 2016. In the corresponding period in FY2016, it had depreciated by 5.1%. The Nepalese rupee has been continuously depreciating since FY2012. However, it has not been able to benefit from it, in terms of export performance, because of persistent structural as well as supply-side constraints. A weak currency should boost exports if there is adequate productive capacity and strong external demand. Similarly, it also tend to boost remittance inflows if there is not a significant decrease in the growth of overseas migrant workers. On the other hand, a weak currency also tend to increase import bill and fuel inflationary pressures (Figure 28).
42. Overall, the Nepalese rupee depreciated by 5.2% between mid-July 2015 and mid-July 2016. It depreciated by 19.9% between mid-July 2011 and mid-July 2012, a further 6.7% depreciation between mid-July 2012 and mid-July 2013, 0.9% depreciation between mid-July 2013 and mid-July 2014 and 5.3% depreciation between mid-July 2014 and mid-July 2015. Despite the consecutive five years depreciation of the currency, which typically boosts relative price competitiveness, Nepal has not been able to benefit because of persistent structural as well as supply-side constraints coupled with sluggish external demand. In FY2015 export was hit by the devastation and dislocation of production caused by the earthquake and in FY2016 it was crippled by the five month long trade blockade. A weak currency should boost exports provided that there is adequate productive capacity and strong external demand. Similarly, it also tend to boost remittance inflows. On the other hand, a weak currency also tend to increase import bill and fuel inflationary pressures.
Figure 28: Daily nominal exchange rate (NRs. per $)
Source: Nepal Rastra Bank

Macroeconomic Update 19
Investment Climate in Nepal: Progress and Challenges1
1. Introduction1. At the recently concluded Investment Summit, the Government of Nepal received a commitment of investment worth nearly $14 billion (about 66% of GDP in FY2016), mostly from foreign investors. The staggeringly high figure in Nepal’s context is nearly triple the size of total foreign investment commitment so far. With investments mostly in Nepal’s priority sectors this could help structurally transform the economy and create large employment. Investors’ response came at a time when the country has seen some progress on the political front. To complement this is the reduction in power cuts throughout the country. Businesses have expressed a much-needed relief with the power situation. In the meantime, the Ministry of Industry has taken a lead in reforming legal (e.g. Industrial Enterprise Act 2016, Special Economic Zone Act 2016, Amendment of Company Act) and regulatory regime (e.g., introducing digital signature) to help improve business environment. With collaborative effort it may be possible that the commitment of investment could be turned into actual investment.
2. However, this must entail a complete course correction from a past where foreign direct investment (FDI) as a share of GDP has remained below 1 percent. In its attempt to improve the enabling environment for businesses, Nepal must aim to support not only large firms but also small- to medium-sized enterprises (SMEs).2 The enabling environment, especially the regulatory regime, it aspires to develop must be guided by the principles of predictability, transparency, consistency, fairness and timely enforcement.
3. The proceeding discussion explores some aspects of legal and operational environment for businesses in Nepal, with an emphasis on foreign investment. Starting with investment trends, it is shown that Nepal trails behind many of its peer countries in terms of attracting foreign investment. There is a labyrinth of legal provisions and a web of bureaucratic process which yields little value but adds complexity to regulatory processes. While the regulatory regime de jure may need some improvement, often deeper problem lies in de facto practices and procedures governing investment and business operations.
1 This section was written by Anjan Panday, Senior Programs Officer, NRM in collaboration with Gopal Tiwari, Secretary General, Nepal Economic Association.2 The positive role of SMEs in creating a vibrant business environment and its contribution to growth and employment is widely documented. For instance, see: i) Katua, N.T.2014.The Role of SMEs in Employment Creation and Economic Growth in Selected Countries. International Journal of Education and Research, Vol. 2, No. 12. ii) OECD. 2004. Promoting SMEs for Development.
ISSUE FOCUS

20 Macroeconomic Update
4. Similarly, overlapping institutional mandate as well as weak capacity within institutions makes simpler processes turn into complex and cumbersome ones. This is shown using examples on the approval of foreign investment and visa-related processes. An alternative to placing limits on the size of minimum foreign investment is presented. Also the need to do more on the protection of intellectual property rights (IPRs) is discussed, and a case study of positive impact from trademark promotion is presented. At the operational level, revisiting issues of importance to both domestic and foreign firms shows a need to revive the public-private dialogue platform, efforts to improve industrial relations, address the labor-shortage issue, and making an effective use of industrial promotional schemes.
2. Investment Trends5. Slow economic growth in the last decade could be partly explained by a low rate of investment. While Nepal aspires for higher growth it needs to substantially increase investments, especially to bridge the infrastructure deficit in the country. Estimates show that it needs to invest about 8-12% of GDP annually in infrastructure.3
2.1 Infrastructure Investment 6. Investment in fixed capital formation in the recent years is about 23% of GDP (Table 1). World Bank data show that during this period, fixed capital formation in South Asia averaged about 29%. Breakdown of this investment shows that private sector contribution is driving the overall fixed capital formation. On the other hand Nepal trails behind in the South Asia region in terms of public investment, which has historically remained around 4% of GDP. This situation may be gradually improving. In terms of sectors, it is believed that agriculture and transport have seen more investments in recent years.
3 Andres, L., Biller, D. and M.H. Dappe. 2014. Infrastructure Gap in South Asia: Infrastructure Needs, Prioritization and Financing. Policy Research Working Paper 7032, World Bank
Table 1: Gross Fixed Capital Formation (% of GDP)Indicator 2011 2012 2013 2014 2015 2016Gross Fixed Capital Formation (GFCF) 21.4 20.8 22.6 23.5 27.7 25.0Public investment in GFCF 4.7 4.7 4.4 4.8 5.2 5.9Private investment in GFCF 16.7 16.1 18.1 18.7 22.5 19.1
Source: Central Bureau of Statistics

Macroeconomic Update 21
2.2 Foreign Investment7. Nepal’s own resources are not enough to meet its development needs. There is a recognition that it needs to attract much higher levels of foreign investment, including in priority areas like infrastructure. However, the trend in FDI is quite disappointing. The net FDI inflows in the last decade have averaged 0.2% of GDP (Figure 1). During this period, the South Asia region received close to 2.0% of GDP in FDI; least developed countries received about 3.0% and land-locked developing countries received nearly 4.5%.
8. To put this into perspective, the total stock of inward FDI in Nepal in 2015 is 2.8% of GDP. For the same year, this figure is lower than Afghanistan (8.8%), Bangladesh (6.6%), India (12.0%), Pakistan (11.9%), Ethiopia (18.9%), and Least Development Countries (27.9%). Arguably Nepal needs to do much more to increase foreign investment.
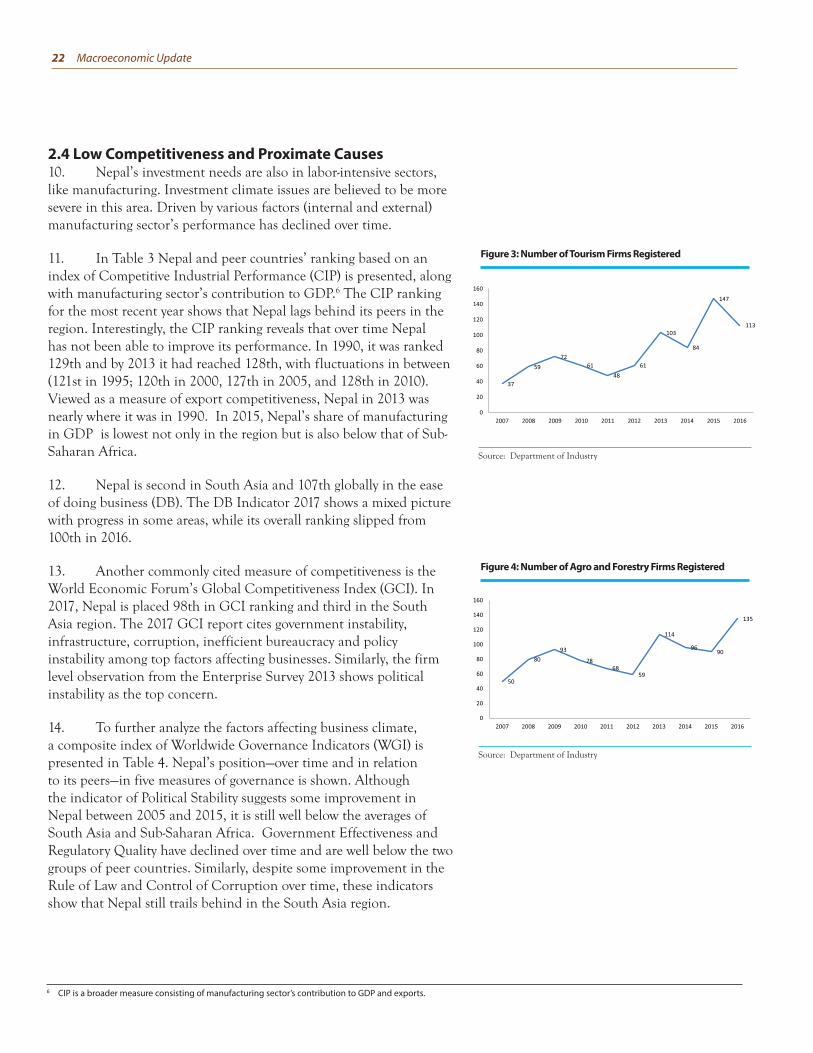
2.3 Sectoral Investment9. Analyzing the trend of investment in sectors is limited due to data unavailability. Using the number of businesses registered as a proxy to show a general trend in sectoral investment (Figures 2 to 4) it could be seen that there is a general rise in the number of firms registered after 2012. Although not conclusive, this pattern could suggest an improvement in actual investment made in these sectors (the data for which is not available). One reason for this uptick could be due to progress on the political front.
Figure 1: Foreign direct investment (net inflows, % of GDP)
Source: United Nations Conference on Trade and Development (UNCTAD)
Figure 2: Number of manufacturing firms registered
Source: Department of Industry
Nepal’s landlocked geography and the post-conflict context make a useful comparison with a similar country from Africa, namely Rwanda. Torn apart by civil conflict in the early 1990s, Rwanda has done remarkably well in terms of economic performance, which is also reflected in FDI figures. The table below shows a glimpse of Nepal’s FDI standing vis-à-vis Rwanda.
Led by investments from Mauritius, US, Luxemburg, India, and others in sectors such as mining, tourism, textile, finance and ICT, Rwanda has been in investors mind of late.4 In the case of Nepal the available data shows that it received investments from India, EU and Singapore.5 As shown in
Table 2, FDI inflows in Nepal during 2013-2015 are a little over one tenth of Rwanda’s. As a percent of GDP, the inflows are substantially higher in Rwanda. Measured in terms of stock of FDI, the African nation has nearly 5 times higher FDI. Furthermore the African nation has received a good size of foreign investment in fixed-capital formation, which shows a long-term commitment on part of investors and confidence in Rwanda as an investment destination. Indeed its Central Bank attributes the rising numbers to country’s attractiveness to foreign investment.
Box 2: Comparative Foreign Direct Investment Analysis
Table 2: Comparative FDI Indicators2013 2014 2015
Nepal Rwanda Nepal Rwanda Nepal RwandaFDI Inflows ($ million) 71 258 30 459 51 471FDI inflows (% of GDP) 0.4 3.4 0.2 5.8 0.3 5.8FDI inflows (% of GFCF) 1.9 13.4 0.8 23 1.2 23.6FDI stock (% of GDP) 2.6 11.1 2.7 14.6 2.7 14.3
Source: UNCTAD
4 Source: National Bank of Rwanda 5 Latest UNCTAD data on bilateral FDI is available up to 2012.
22 Macroeconomic Update
2.4 Low Competitiveness and Proximate Causes10. Nepal’s investment needs are also in labor-intensive sectors, like manufacturing. Investment climate issues are believed to be more severe in this area. Driven by various factors (internal and external) manufacturing sector’s performance has declined over time.
11. In Table 3 Nepal and peer countries’ ranking based on an index of Competitive Industrial Performance (CIP) is presented, along with manufacturing sector’s contribution to GDP.6 The CIP ranking for the most recent year shows that Nepal lags behind its peers in the region. Interestingly, the CIP ranking reveals that over time Nepal has not been able to improve its performance. In 1990, it was ranked 129th and by 2013 it had reached 128th, with fluctuations in between (121st in 1995; 120th in 2000, 127th in 2005, and 128th in 2010). Viewed as a measure of export competitiveness, Nepal in 2013 was nearly where it was in 1990. In 2015, Nepal’s share of manufacturing in GDP is lowest not only in the region but is also below that of Sub-Saharan Africa.
12. Nepal is second in South Asia and 107th globally in the ease of doing business (DB). The DB Indicator 2017 shows a mixed picture with progress in some areas, while its overall ranking slipped from 100th in 2016.
13. Another commonly cited measure of competitiveness is the World Economic Forum’s Global Competitiveness Index (GCI). In 2017, Nepal is placed 98th in GCI ranking and third in the South Asia region. The 2017 GCI report cites government instability, infrastructure, corruption, inefficient bureaucracy and policy instability among top factors affecting businesses. Similarly, the firm level observation from the Enterprise Survey 2013 shows political instability as the top concern.
14. To further analyze the factors affecting business climate, a composite index of Worldwide Governance Indicators (WGI) is presented in Table 4. Nepal’s position—over time and in relation to its peers—in five measures of governance is shown. Although the indicator of Political Stability suggests some improvement in Nepal between 2005 and 2015, it is still well below the averages of South Asia and Sub-Saharan Africa. Government Effectiveness and Regulatory Quality have declined over time and are well below the two groups of peer countries. Similarly, despite some improvement in the Rule of Law and Control of Corruption over time, these indicators show that Nepal still trails behind in the South Asia region.
6 CIP is a broader measure consisting of manufacturing sector’s contribution to GDP and exports.
Figure 4: Number of Agro and Forestry Firms Registered
Source: Department of Industry
Figure 3: Number of Tourism Firms Registered
Source: Department of Industry

Macroeconomic Update 23
3. Legal and Regulatory Environment15. With the introduction of first generation of economic reforms in the early 1990s, Nepal aimed to become a liberal, market-oriented economy. It aimed to create a well-regulated, yet functioning economy. To keep this broader objective in sight and create a regulatory regime that imposes a minimal cost to businesses, few areas need urgent improvements as discussed below.
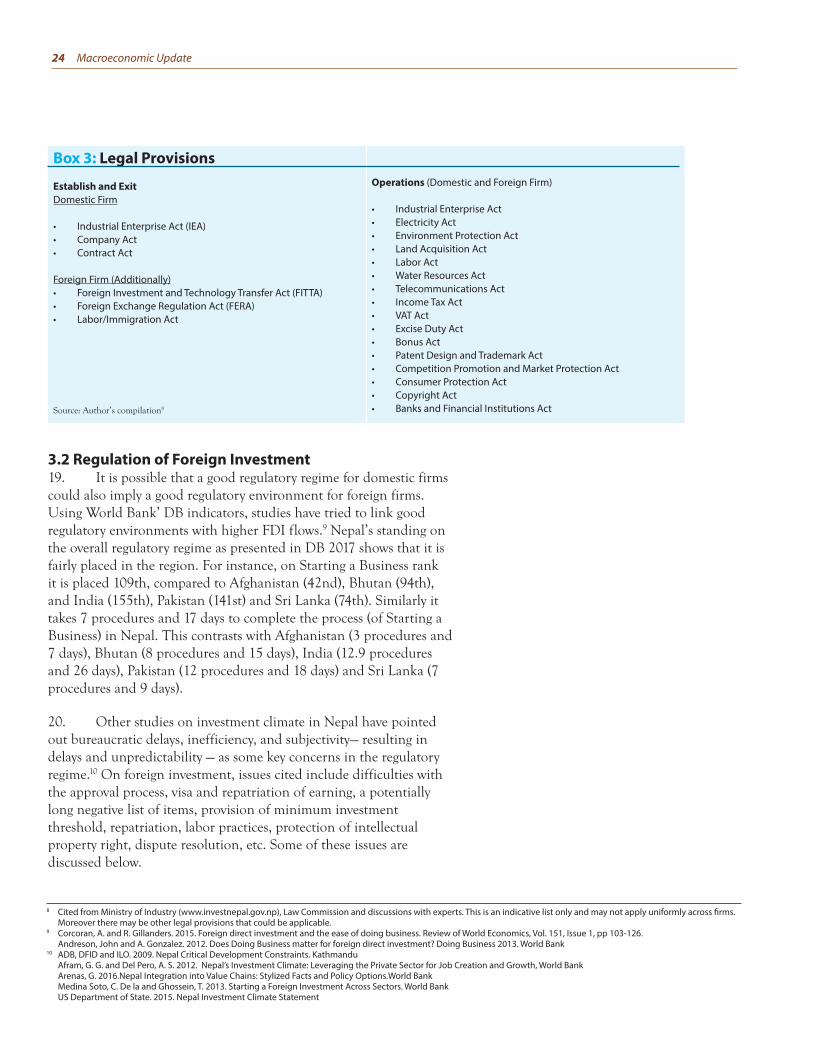
3.1 Key Legal Provisions 16. In Box 3 a labyrinth of legal provisions that a typical firm has to comply with during different stages is presented.
17. It can be seen that there are multiple laws that affect the establishment as well as operations of a business in the country. At one point or another, the ambit of these laws will encompass most businesses. For instance, a domestic firm incorporated under the Industrial Enterprise Act (IEA) and registered under the Company Act will be required to ensure that it complies with Environmental Protection Act should it require environmental impact assessment or similar other clearances. It will have to seek basic services like land, water and electricity under the provisions of related acts.
18. Within the ambit of these laws any foreign investment/firm has to pass through additional layers of legal provisions. As shown, this pertains mainly to the establishment and exit, including the repatriation of earnings, investment and work permit.
Table 3: Competitive Industrial PerformanceCountry CIP Ranking 2013 Manufacturing Value Added (% GDP) 2015Nepal 128 6.3Pakistan 75 13.4Bangladesh 77 17.6India 43 16.2South Asia - 16Sub-Saharan Africa - 10.5
Source: United Nations Industrial Development Organization (UNIDO)
Indicators Nepal South Asia Sub-Saharan Africa2005 2015 2015 2015
Political stability 0.96 16.19 30.36 32.48Government effectiveness 22.44 13.46 36.00 26.72Regulatory quality 34.31 25.00 30.00 29.76Rule of law 24.40 26.92 37.62 30.93Control of corruption 33.17 35.58 37.74 30.96
Source: World Bank
Table 4: Worldwide Governance Indicators, percentile rank7
7 Higher rank means better performance
24 Macroeconomic Update
3.2 Regulation of Foreign Investment19. It is possible that a good regulatory regime for domestic firms could also imply a good regulatory environment for foreign firms. Using World Bank’ DB indicators, studies have tried to link good regulatory environments with higher FDI flows.9 Nepal’s standing on the overall regulatory regime as presented in DB 2017 shows that it is fairly placed in the region. For instance, on Starting a Business rank it is placed 109th, compared to Afghanistan (42nd), Bhutan (94th), and India (155th), Pakistan (141st) and Sri Lanka (74th). Similarly it takes 7 procedures and 17 days to complete the process (of Starting a Business) in Nepal. This contrasts with Afghanistan (3 procedures and 7 days), Bhutan (8 procedures and 15 days), India (12.9 procedures and 26 days), Pakistan (12 procedures and 18 days) and Sri Lanka (7 procedures and 9 days).
20. Other studies on investment climate in Nepal have pointed out bureaucratic delays, inefficiency, and subjectivity— resulting in delays and unpredictability — as some key concerns in the regulatory regime.10 On foreign investment, issues cited include difficulties with the approval process, visa and repatriation of earning, a potentially long negative list of items, provision of minimum investment threshold, repatriation, labor practices, protection of intellectual property right, dispute resolution, etc. Some of these issues are discussed below.
Box 3: Legal Provisions
Establish and ExitDomestic Firm
• Industrial Enterprise Act (IEA)• Company Act• Contract Act
Foreign Firm (Additionally)• Foreign Investment and Technology Transfer Act (FITTA)• Foreign Exchange Regulation Act (FERA)• Labor/Immigration Act
Source: Author’s compilation8
Operations (Domestic and Foreign Firm)
• Industrial Enterprise Act• Electricity Act• Environment Protection Act• Land Acquisition Act• Labor Act• Water Resources Act• Telecommunications Act• Income Tax Act• VAT Act• Excise Duty Act • Bonus Act• Patent Design and Trademark Act• Competition Promotion and Market Protection Act• Consumer Protection Act• Copyright Act• Banks and Financial Institutions Act
8 Cited from Ministry of Industry (www.investnepal.gov.np), Law Commission and discussions with experts. This is an indicative list only and may not apply uniformly across firms. Moreover there may be other legal provisions that could be applicable.
9 Corcoran, A. and R. Gillanders. 2015. Foreign direct investment and the ease of doing business. Review of World Economics, Vol. 151, Issue 1, pp 103-126. Andreson, John and A. Gonzalez. 2012. Does Doing Business matter for foreign direct investment? Doing Business 2013. World Bank
10 ADB, DFID and ILO. 2009. Nepal Critical Development Constraints. Kathmandu Afram, G. G. and Del Pero, A. S. 2012. Nepal’s Investment Climate: Leveraging the Private Sector for Job Creation and Growth, World Bank Arenas, G. 2016.Nepal Integration into Value Chains: Stylized Facts and Policy Options.World Bank Medina Soto, C. De la and Ghossein, T. 2013. Starting a Foreign Investment Across Sectors. World Bank US Department of State. 2015. Nepal Investment Climate Statement
Macroeconomic Update 25
3.2.1 Approval 21. To illustrate the approval of foreign investments, an institutional view of how multiple agencies are involved in the process is shown. These include: • Department of Industry (DOI) (< $20 million fixed capital) or
Industrial and Investment Promotion Board (IIPB) (between $ 20 and 100 million) or Investment Board of Nepal (IBN) (> $100 million capital investment)
• Sector Agencies ( if a clearance is required; e.g., Telecommunication, Airline, Mining, Pharmaceutical)
• Office of Company Registrar (OCR)• Department of Inland Revenue (for tax purposes)• Department of Immigration (to hire foreign nationals)• Central Bank (foreign currency matter).
22. Specifically, consider the case of registering a foreign firm interested in agro-processing business. With the application for investment processed at the DOI, it will have to receive the approval before registering with the OCR. The firm will then have to register with the tax office (under the Income Tax Act) and initiate recommendation from Department of Food Technology and Quality Control, under the sectoral requirement. It will then have to conclude registration of the industry and obtain a license for manufacturing. Separately, under the Labor and Immigration Act, the firm will need to process the approval for any foreign national to work in Nepal. Lastly, the firm has to seek the Central Bank’s approval to bring in the investment.
As noted earlier, the government has enacted new legislations and is processing several other legislative bills, including the upcoming Foreign Investment Act.
The draft Foreign Investment Act, which will replace the Foreign Investment and Technology Transfer Act 1992, introduces the concept of automatic route to permit foreign investments in the country. Typically, an automatic route means that foreign investments do not require prior approval of the government or Central Bank, except ensuring compliance of prudential measures on source of funding and a timely notification to the authorities. While this can be considered a positive step, clarity on which sectors would be opened up for investments through the automatic route is needed. Nepal
needs to quickly formulate a position to introduce automatic route by identifying its priority sectors.
Implementation of an automatic route would be a significant change from the current practice where approval of the change in scope of a firm may need to be approved by the IIPB. The draft Foreign Investment Act also requires approval of the IIPB to raise capital of a foreign firm. As indicated earlier, time is right for Nepal to assess the effectiveness of seeking approvals from such high-level boards. A case in point here is the recent decision by the Government of India to dissolve its Foreign Investment Promotion Board.
Box 4: Introducing Automatic Route
Source: Author’s assessment 11
11 Author’s assessment here and elsewhere is based on discussions with several stakeholders.

26 Macroeconomic Update
23. It is worth noting that the decision related to approving a foreign investment is processed either by the DOI through its Director General or the IIPB, depending on the investment level. Likewise at the IBN a vetting procedure is followed before presenting investment decisions to the IBN board. The IIPB and IBN board are both high-level mechanisms, headed in the former by Minister of Industry and the latter by the Prime Minister.
24. At times, these high level committees take a long time to be organized. Media reports point to instances where delays in organizing board meeting itself has affected investment-related decisions.12 It is learnt that the DOI seeks recommendations from different sector agencies on an ad-hoc basis. Once approved, other agencies involved in the process are expected to undertake their own due diligence. For instance, once the IIPB approves an investment, the investor has to submit related paperwork to the Central Bank. Interestingly, the IIPB board has the Central Bank governor as its board member. Nevertheless, even after the IIPB’s approval, officials at the Central Bank under the power of Foreign Investment and Technology Transfer Act (FITTA) and Foreign Exchange Regulation Act (FERA) vet the applications. It is reported that often the officials are over stretched with pending applications and given constraints their vetting is likely to add little value.
25. Investors further confide that there is no prescribed set of information to be submitted at the Central Bank. In turn this leads to scenarios where information is sought mostly at discretion. While subjectivity in such a process can’t be completely ruled out, this should not come at a cost of undermining the principles of predictability and transparency.
26. Another commonly identified issue is the sequencing in the approval process. As learned from multiple sources, any foreign investment has to be approved from DOI/IIPB or IBN and incorporated with OCR before the approval of the Central Bank. Investors have expressed concerns on the rationale of this sequencing given there could be denial from the Central Bank at almost the end of the process. Further compounding the issue is that there is no finite time limit for Central Bank’s decision making.
3.2.2 Visa and Repatriation27. As per the IEA 2016, businesses can procure special skills by hiring foreign worker only when such skills could not be found in Nepal. With respect to foreign investment the draft Foreign
12 http://thehimalayantimes.com/business/crucial-projects-limbo-ibn-board-meeting-stalled/ Published October 25, 2016

Macroeconomic Update 27
Investment Act has provisions to provide business and residential visas to foreign investors. When introduced this could be a step change in the right direction. However, the draft bill authorizes a “competent official” to recommend visa in some circumstances. Instead of introducing subjectivity in the process, a better approach could be to layout criteria under which an official would evaluate the request for visa and make a decision. Making such criteria transparent will add predictability to the process.
28. Another key area of concern for foreign investors is the process of repatriating earnings. Under the FITTA and FERA, the Central Bank approves the repatriation of earnings in foreign currency following recommendation of concerned agencies (in particular DOI).
3.2.3 Investment Threshold and Intellectual Property Rights29. Foreign Investment Policy 2015 envisages a provision for minimum threshold of investments to be permitted in the country. Some other countries also have similar provisions.13 Under the draft Foreign Investment Act there is no explicit mention of a minimum-investment level. However, there is a provision which allows the government to introduce it if deemed necessary. In the government-led consultation forums, the issue of minimum FDI has surfaced—with voices for and against it. Currently, although not in the law, the government permits investments that are at least NRs5 million ($50,000). Such a blanket provision may discourage investors. Smaller, dynamic firms trying to test the market will want to start
Ensuring inter-agency coordination to simplify the governance of investment is envisaged under government’s one-window policy. There are mechanisms proposed under various legislations to implement this policy. However, past record on implementation of the one-window policy is weak. Below we present a short description of two scenarios where the effectiveness of one-window policy could be substantially improved. First, businesses call for easing of the fairly complicated process of availing work visa.14 Currently, a firm incorporated through the process shown in 3.2.1 will need to initiate and get recommendation from DOI/line ministry. With this, the firm should seek recommendation of
the Home Ministry and then obtain a work permit from the Department of Labor. Following this, the foreign national will be issued non-tourist visa from the Department of Immigration.
Second, legal experts point to issues pertaining to the repatriation of earnings by a foreign firm.15 To begin the repatriation process, firms are required to provide necessary information at the DOI which will then issue recommendation to the Central Bank. It is learnt that the Central Bank makes its own assessment and seeks several pieces of additional information before approval. Experience shows that the whole process could take up substantial time.
Box 5: One-Window Policy: Challenges
Source: Author’s assessment
13 In Kenya, the government issues investment certificate to investments of at least $100,000.14 http://kantipur.ekantipur.com/news/2017-03-05/20170305084821.html Published 5 March 201715 http://www.spotlightnepal.com/News/Article/FDI-Setback-Due-To-Practical-Hurdles Published 18 March 2015

28 Macroeconomic Update
small before committing larger investments. A better approach could be to allow investment of any size, and balance it by placing a limit on investments that could qualify for government-sponsored promotional schemes.
30. Next, a rapidly emerging priority for the government is the protection of IPRs, including trademark registration and enforcing copyright. It is quite clear that early effort in this area will have a long payoff. As an example of this, a positive impact of trademark promotion is presented in Box 6. The government, industry association and other stakeholders deserve credit for this effort.
Pashmina, made of sheep wool, is one of the exportable items of Nepal. Its export has gained momentum after the registration of Pashmina Trademark. The industry has been able to create jobs, increase investments and earn foreign currency for the country. As per the industry association it employs around 30,000 workers, and despite setbacks from the 2015 earthquakes the industry is now witnessing growth. Back in 2010, the export of Pashmina was on a downward trend. This scenario has now reversed with growing exports, which is largely credited on the Pashmina Trademark registration in different countries.
Initially, the trademark of pashmina was registered in Australia. It is now registered in 45 countries including USA, Japan, Singapore, Hong Kong, China and several European countries.
TEPC data show an increase in Pashmina export by over 70 percent between 2010 and 2015, from about $16 million to $29 million. The share of Pashmina sold to tourists in the country alone is 40%.
As per the Nepal Pashmina Industries Association (NPIA) demand is picking up on both fronts. As a result businesses feel confident about its future prospects. They argue that market penetration has increased with increased awareness generated by a distinct trademark that underpins authenticity. “Chyangra Pashmina” (shown in the picture) is now a visible brand of Pashmina exported from Nepal.
A high-ranking official of NPIA opines that earlier branding was a major issue with Nepali Pashmina products, which he now sees has enhanced market potentials. However, the official also cautions that while the energy shortage has been mitigated the industry now faces a new problem in the form of shortage of skilled workers.
Box 6: Case Study: Pashmina Trademark Boosts Investors’ Confidence
Source: Department of Industry
Pashmina exports (NRs million)
Source: Trade and Export Promotion Center

Macroeconomic Update 29
4. Operational Context Review31. This section presents discussion on key operational issues that affect both domestic and foreign firms. Implications could be drawn to improve policy and legal aspects of these issues.
4.1 Public-Private Dialogue (PPD) 32. Despite active private-sector umbrella organizations, there isn’t a proper mechanism where issues of concern to businesses could be thoroughly discussed and addressed. Several countries have an established mechanism for a structured conversation between the public and private sector. In 2010, the government helped establish Nepal Business Forum (NBF) as a platform to bridge this gap. The mandate of NBF is to thoroughly discuss reform agendas between government officials and representatives of the private sector to build recommendations for its implementation.
33. With a high-level committee under Prime Minister’s chairmanship, in the past NBF’s several working groups met regularly and discussed issues of significance. These working groups have private (industry associations and experts) and public sector representatives (Joint Secretaries and others). The NBF worked as an outlet to bring different stakeholders together. In the initial years it recommended several low-level reforms, most of which were implemented. Its work was also recognized internationally.16 Currently, however, the NBF is not very active. The working group meetings have become less frequent. The Prime Minister-led high-level committee last met in 2012. Driven by capacity constraints and delays in appointing a capable person to lead it, the NBF’s effectiveness has been impaired. There have been concerns about coordinating and sustaining reforms as well. Reviving and making this platform effective could help provide structure and give impetus to the process of generating reforms in the country.
4.2 Industrial Relations34. During the conflict era, labor relations became a contentious issue affecting mainly the multinationals and larger firms. Acharya and Bhattarai (2012) report that overall industrial relations may have been moving in the right direction in recent years.17 However the authors caution that there still is a degree of trust deficit between trade unions and management. Similarly, labor regulations feature among the top three main obstacles affecting the large firms surveyed under World Bank’s Enterprise Survey 2013.
16 http://kathmandupost.ekantipur.com/news/2014-03-07/nepal-business-forum-gets-howard-award.html Published on March 7, 201417 Acharya, G.P. and R.K. Bhattarai. 2012. Insights on Issues of Trade Unions and Industrial Relation: A Perceptual Survey of Opinion Leaders,Administration and Management
Review, Vol 24, No. 1.

30 Macroeconomic Update
35. The bone of contention on industrial relations is multifaceted. It is out of the scope of this brief summary to assess it in a comprehensive manner. However, it is generally understood that labor flexibility is sought by businesses, whereas workers’ welfare protection is seen as necessary by trade unions. Employers in general favor collective bargaining to negotiate welfare issues at the industry level, while the worker groups seem to prefer firm-level bargaining. It is believed that the government is aiming to balance the two goals through necessary reforms, including amendment of the Labor Act and a separate legal provision to ensure social safety of workers. Against this background, the government in the IEA 2016 introduced a spirit of labor flexibility through the provision of ‘no work, no pay’. Although the final decision on this rests with the Labor Act, this is seen as a positive signal by businesses.
36. Independent observers view that workers pay/benefit is linked with productivity, while skills enhancement and rightful welfare protection is a collaborative effort between the government, employer and employees. Guided by this principle it is possible to create an environment of heathy and sustainable industrial relations in the country.
4.3 Industrial Promotion 37. As an industrial policy tool, Nepal offers several promotional schemes to support businesses through various legislations. The IEA has provisions of direct and indirect income tax rebate, VAT and customs duty concessions. Similarly the SEZ Act provides income tax rebate, VAT relief, concessional lease rates, customs duty relief and foreign
As reported in the Pashmina Industry case study, labor shortage and a high turnover of workers is critically affecting businesses across the board. From footwear enterprise to manufacturer of industrial pipes to construction firms, all point out that labor shortage is coming up as a major concern. For these firms with employees between 400 and 3000, the monthly turnover of low-skilled/unskilled workers is between 50 and 100. The situation is especially acute with male workers, where the turnover rate is nearly 70 percent of all the new hires.
It is reported that male workers often come with a mindset of migrating overseas for work. They normally look for employment of 3-4
months before migrating. While the employers are aware of the issue they find themselves with no option but to train these workers and keep looking for short-term solutions. One large firm reported to us that they have found an alternative to this situation by hiring female workers. Retention is much higher among female workers and with it comes predictability in business operations.
At the policy level the continuing labor shortage could have implications in terms of rising real wages, low productivity, and the ensuing impact on the competitiveness.
Box 7: Emerging Priority: Inadequate Skilled Labor
Source: Author’s assessment
Macroeconomic Update 31
exchange facilities. The draft Foreign Investment Act also extends these facilities to foreign firms. In general there is a plethora of examples where such industrial promotional schemes are offered.
38. In reality, realizing these incentives is often challenging as it entails coordination with different agencies. First, there needs to be uniformity in understanding and interpretation of such schemes. One particular instance is the customs duty concession offered on the import of agro machines. A young agro entrepreneur revealed that the government has revoked customs duty on the import of certain-size tractors. It was argued that, in reality, the current market need is to offer duty relief on different-size tractors. Likewise, businesses inform us that leakages at customs can sometimes make imported goods cheaper than the domestically produced ones.
39. The second issue is the evaluation of promotional schemes to determine their effectiveness. One instance of such evaluation is the exporter cash incentive scheme introduced by the government in 2010/11. Pazzini et al. (2016) report that this scheme didn’t have any effect on export growth or export diversification.18 At the firm level the authors found that there is no link between the incentive rates received and export performance. As such they suggest revision of the policy.
40. While industrial promotional schemes are initiated with right intentions, a robust evaluation of such schemes is rarely carried out. In the absence of such evaluation, industrial policy tools can often end up being less effective and could create a risk of distortion in the market.
5. Conclusion41. Nepal’s need for investment is undisputed. To address sluggish growth and low domestic employment, it needs quality and quantum of investment in key sectors. It should improve competitiveness by aiming to do more than its peers and creating an enabling environment to support both large firms and SMEs.
42. Analysis of regulatory regime shows that there is no dearth of legal provisions governing businesses in Nepal. It could be argued that there may be too many legal provisions to effectively govern. At a time when global cross-border investments have become competitive, Nepal’s regulatory process governing foreign investment is multi-layered, bureaucratic and time/resource consuming. It needs to urgently see how a more predictable, less discretionary and an efficient regulatory regime could be developed.
18 Pazzini, A., Reyes, D. and G. Varela, 2016. “Assessment of the Impact of the Cash Incentive to Promote Export Diversification in Nepal,” World Bank

32 Macroeconomic Update
43. A number of areas for reforms have been highlighted. This includes simplification of legal and regulatory framework governing businesses, including FDI approval, easing of visa and repatriation of earnings. Potential for overlaps in institutional mandates in the approval process need to be avoided. Other recommendations include avoiding threshold on the size of foreign investment and introducing automatic route to permit foreign investments in priority sectors. Finally, both domestic and foreign firms could benefit from an effective public-private dialogue platform, healthy industrial relations, resolution of labor shortage, and a robust and timely evaluation of industrial promotional schemes.

Macroeconomic Update 33
GDP = gross domestic product; P = provisionalNote: FY2016 starts on 16 July 2015 and ends on 15 July 2016.
a Based on FY2016 National Accounts Statistics. Central Bureau of Statistics b Refers to gross fixed investment and does not include change in stocksc Based on FY2016 annual data. Nepal Rastra Bank d Based on FY2017 Budget Speech. Ministry of Financee Includes cash balance of previous yearf Based on FY2016 annual data. Financial Comptroller General Office
Sources: Ministry of Finance. FY2017 Budget Speech. Kathmandu; Nepal Rastra Bank. 2016. Macroeconomic Situation. Kathmandu; Central Bureau of Statistics. May 2016. FY2016 National Accounts Statistics. Kathmandu; Central Bureau of Statistics. 2014. National Population and Housing Census 2011 (Population Projection 2011 – 2031). Kathmandu; Financial Comptroller General Office. FY2015 and FY2016 National Accounts Statistics. Kathmandu; Financial Comptroller General Office. July 2015. Quarterly Debt Position of Government of Nepal 4thQuarter Data, Kathmandu; Central Bureau of Statistics. 2014. National Population and Housing Census 2011 (Population Projection 2011 – 2031). Kathmandu
ItemFiscal Year
2012 2013 2014 2015 2016PA. Income and Growth 1. GDP per Capita ($, current) 704 709 725 762 746 a
2. GDP Growth (%, in basic prices) 4.6 3.8 5.7 2.3 0.8 a
a. Agriculture 4.6 1.1 4.5 0.8 1.3 a
b. Industry 3.0 2.7 7.1 1.5 (6.3) a
c. Services 5.0 5.7 6.2 3.6 2.7 a
B. Saving and Investment (current and market prices, % of GDP) 1. Gross Domestic Investmentb 20.8 22.6 23.5 22.8 25.0 2. Gross National Saving 39.5 40.7 45.7 43.9 42.9
C. Money and Inflation 1. Consumer Price Index ( average annual % change) 8.3 9.9 9.1 7.2 9.9 c
2. Total Liquidity (M2) (annual % change) 22.6 16.4 19.1 19.9 19.5 c
D. Government Finance (% of GDP) 1. Revenue and Grants 18.6 19.5 20.6 20.9 24.5 d
2. Expenditure and Onlending 20.9 18.8 20.0 21.9 23.1 d
3. Overall Fiscal Surplus (Deficit)e (2.2) 0.8 0.9 (0.7) 1.4 d
E. Balance of Payments 1. Merchandise Trade Balance (% of GDP) (24.4) (27.2) (30.3) (31.3) (30.3) c
2. Current Account Balance (% of GDP) 5.0 3.4 4.6 5.1 6.2 c
3. Merchandise Export ($) Growth (annual % change) 5.7 (2.9) 5.1 (3.9) (28.8) c
4. Merchandise Import ($) Growth (annual % change) 4.7 10.9 13.9 8.0 (7.1) c
5. Remittances (% of GDP) 23.5 25.6 27.7 29.1 29.6 c
F. External Payments Indicators1. Gross Official Reserves ($ million) 4,960.0 5,613.7 6,938.6 8,147.7 9,736.8 c
Months of current year’s imports of goods) 10.3 10.1 10.0 11.2 14.1 c
2. External Debt Service (% of exports of goods and services) 10.6 9.5 8.9 8.1 8.8 f
3. Total External Debt (% of GDP) 20.2 19.7 17.7 16.2 17.3 f
G. Memorandum Items 1. GDP (current prices, NRs billion) 1,527.3 1,695.0 1,964.5 2,120.5 2,248.7 a
2. Exchange Rate (NRs/$, average) 80.7 87.7 98.0 99.2 106.1 c
3. Population (million) 26.9 27.3 27.6 28.0 28.4
Appendix 1: Country Economic Indicators

34 Macroeconomic Update
ItemPeriod
1990s 2000s Latest YearA. POPULATION INDICATORS1. Population (million) 18.5 (1991) 23.2 (2001) 26.5 (2011)2. Population growth (annual % change) 2.1 2.2 1.4 (2011)
B. Social Indicators1. Fertility rate (births/woman) 5.1 (1996) 3.6 (2004) 3.4 (2011)
2. Maternal mortality ratio (per 100,000 live births) 539.0 (1996) 281 (2006) 190.0 (2013)3. Infant mortality rate (below 1 year/1,000 live births) 82.0 (1991) 48.0 (2006) 32.2 (2013)4. Life expectancy at birth (years) 55.0 (1991) 62.0 (2001) 69.6 (2014)
a. Female 54.0 (1991) 63.0 (2001) 71.1 (2014)b. Male 55.0 (1991) 62.0 (2001) 68.2 (2014)
5. Adult literacy (%) 35.6 (1996) 48.0 (2004) 61.6 (2014)a. Female 19.4 (1996) 33.8 (2004) 44.5 (2011)b. Male 53.5 (1996) 64.5 (2004) 71.6 (2011)
6. Primary school gross enrollment (%) 57.0 (1996) 72.0 (2004) 134.4 (2014)7. Secondary school gross enrollment (%) 43.8 (2001) 54.4 (2004) 51.6 (2014)8. Child malnutrition (% below 5 years old) 57.0 36.4 (2010)9. Population below poverty line (international, %) 68.0 (1996) 53.1 (2003) 24.82 (2011)10. Population with access to safe water (%) 45.9 82.5 (2006) 93.5 (2014)11. Population with access to sanitation (%) 22.0 (1995) 24.5 (2006) 73.7 (2014)12. Public education expenditure (% of GDP) 2.0 2.9 (2005) 4.4 (2016)13. Human development index 0.341 0.429 (2005) 0.548 (2014)14. Rank/total number of countries 152/173 136/177 (2003) 145/188 (2014)15. Gender-related development index 0.33 (1995) 0.511 (2003) 0.908 (2014)16. Rank/total number of countries 148/163 (1995) 106/140 (2003) 145/188 (2014)
C. Poverty Indicators1. Poverty incidence 42 (1996) 31 (2004) 25.16 (2011)2. Proportion of poor to total population
a. Urban 23.0 (1996) 9.55 (2004) 15.46 (2011)b. Rural 44.0 (1996) 34.62 (2004) 27.43 (2011)c. Mountain 57.0 (1996) 32.6 (2004) 42.77 (2011)d. Hills 40.7 (1996) 34.5 (2004) 24.32 (2011)e. Terai 40.3 (1996) 27.6 (2004) 23.44 (2011)
3. Poverty gap 11.75 (1996) 7.55 (2004) 5.43 (2011)4. Poverty severity index 4.67 (1996) 2.7 (2004) 1.81 (2011)5. Inequality (Theil Index) … … …6. Multidimensional poverty index1 … … 0.197 (2011)
… = not available, GDP = gross domestic product,
Sources: Central Bureau of Statistics. 2012. National Population and Housing Census 2011. Kathmandu; Central Bureau of Statistics. 2011. Nepal Living Standards Survey 2010/11. Kathmandu; Central Bureau of Statistics. 2015. Annual Household Survey 2013/14. Kathmandu; Ministry of Health and Population. 2012. Nepal Demographic and Health Survey 2011. Kathmandu; United Nations Development Programme. 2016. Human Development Report 2015. New York; Central Bureau of Statistics. 2011. Poverty in Nepal (2010/11). Kathmandu; World Health Organization, United Nations Children’s Fund, United Nations Population Fund, and World Bank. 2012. Trends in maternal mortality 1990 to 2010, Kathmandu; Ministry of Education. 2015. Flash II Report 2014-2015. Kathmandu; Ministry of Finance. 2016. Budget Speech of FY2016/17. Kathmandu.
1 UNDP replaced Human Poverty Index with Multidimensional Poverty Index from Human Development Report 2011.
Appendix 2: Country Poverty and Social Indicators

Macroeconomic Update 35

36 Macroeconomic Update
ASIAN DEVELOPMENT BANK6 ADB Avenue, Mandaluyong City1550 Metro Manila, Philippineswww.adb.org
ADB NEPAL RESIDENT MISSIONMetro Park Building, LazimpatPost Box 5017, Kathmandu, [email protected]/nepalwww.facebook.com/adbnrm/