Embed Size (px)
Citation preview

MACROECONOMICSUNDERSTANDING THE GLOBAL ECONOMY
The Wealth of NationsThe Supply Side
Copyright © 2012 John Wiley & Sons, Inc. All rights reserved.
3-2
Key Concepts
GDP Growth Total output Output per capita
Elements of Growth Labor Capital Total Factor Productivity
3-3
The Importance of Economic Growth
"No society can surely be flourishing and happy, of which the far greater part of the
members are poor and miserable." --Adam Smith
3-4
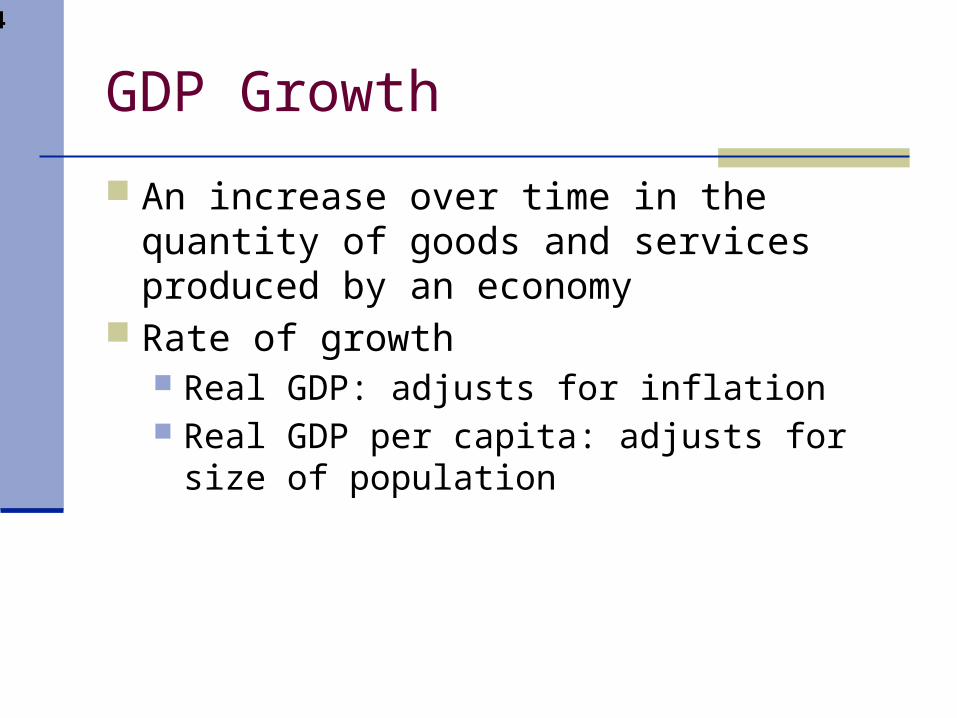
GDP Growth
An increase over time in the quantity of goods and services produced by an economy
Rate of growth Real GDP: adjusts for inflation Real GDP per capita: adjusts for size of
population
3-5
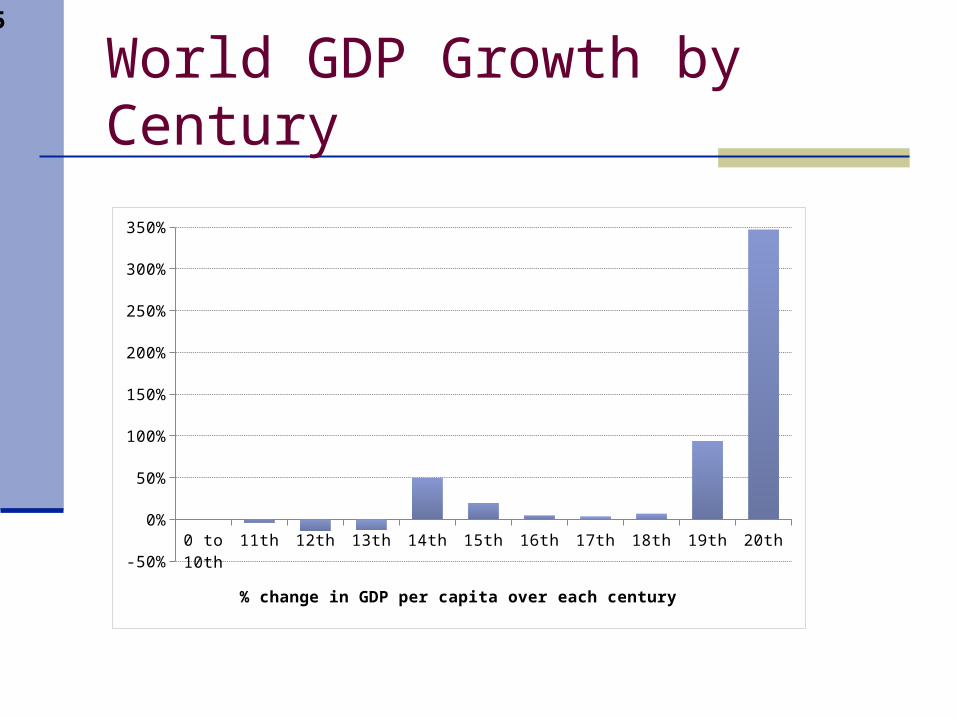
World GDP Growth by Century
0 to 10th
11th 12th 13th 14th 15th 16th 17th 18th 19th 20th
-50%
0%
50%
100%
150%
200%
250%
300%
350%
% change in GDP per capita over each century
3-6
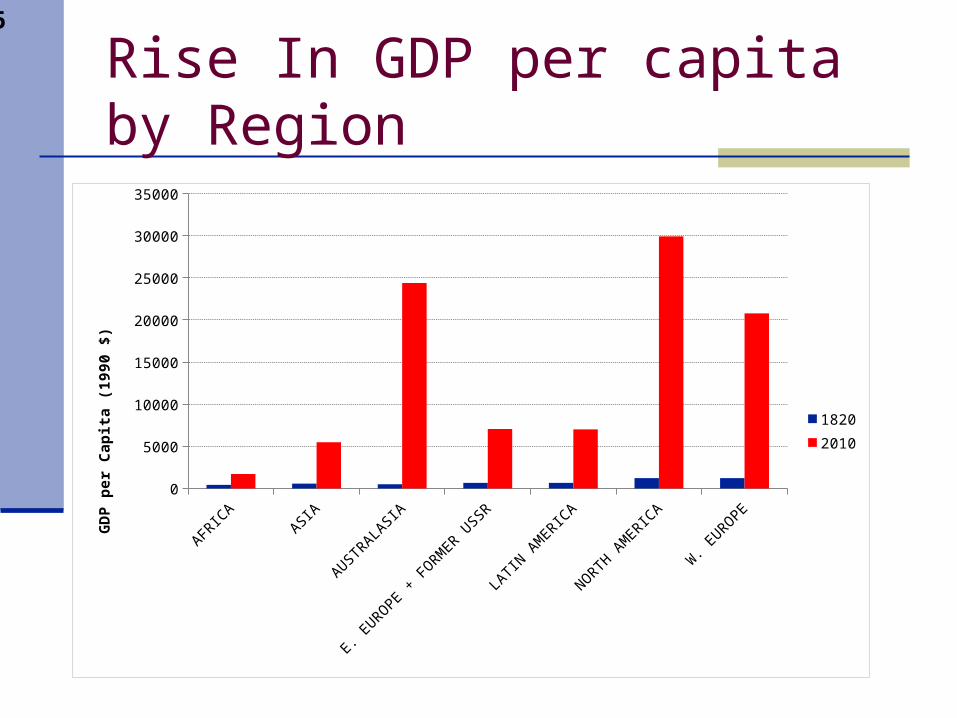
Rise In GDP per capita by Region
AFRICA
ASIA
AUSTRALASIA
E. EURO
PE + F
ORM
ER USSR
LATIN
AM
ERICA
NORTH A
MERIC
A
W. E
UROPE
0
5000
10000
15000
20000
25000
30000
35000
1820
2010
GD
P p
er C
apit
a (1
990
$)
3-7
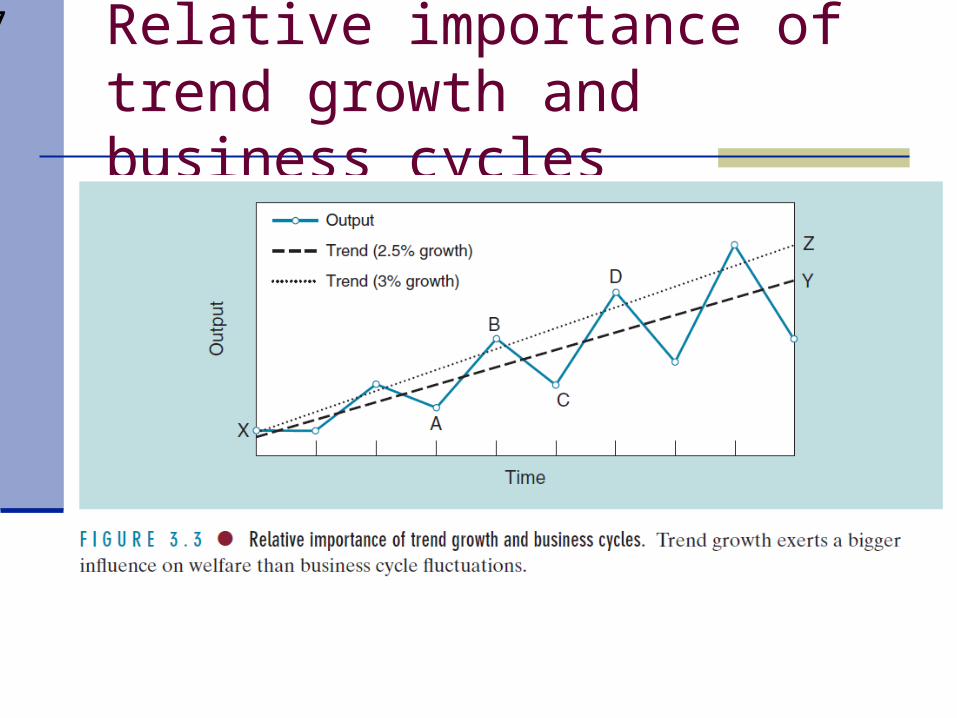
Relative importance of trend growth and business cycles
3-8
Importance of Growth
Growing population Life expectancy Improving standards of living Poverty reduction
3-9
-6%
-4%
-2%
0%
2%
4%
6%
0 5,000 10,000 15,000 20,000 25,000
GDP per capita, US $$
Gro
wth
rat
e, 1
980
– 20
00 (
per
annu
m)
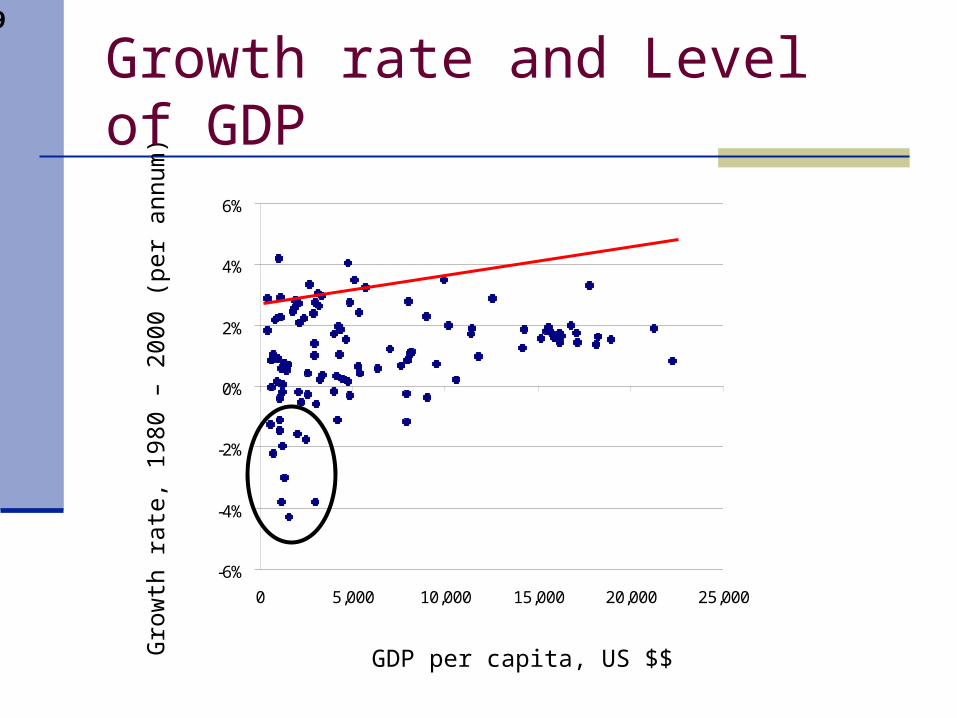
Growth rate and Level of GDP
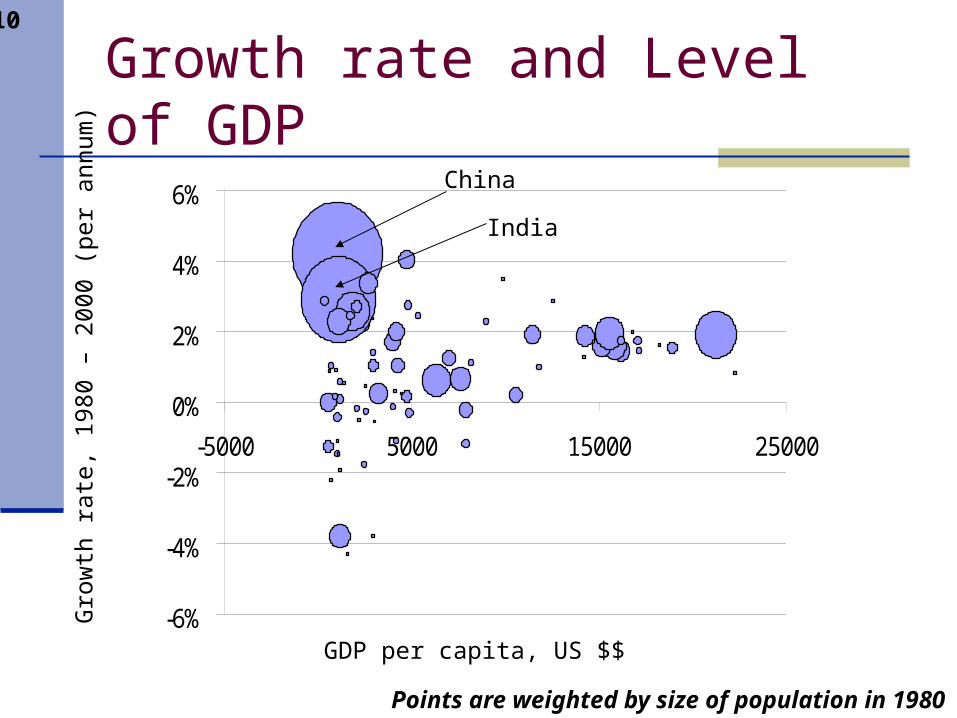
3-10
-6%
-4%
-2%
0%
2%
4%
6%
-5000 5000 15000 25000
GDP per capita, US $$
Gro
wth
rat
e, 1
980
– 20
00 (
per
annu
m)
China
India
Points are weighted by size of population in 1980
Growth rate and Level of GDP
3-11
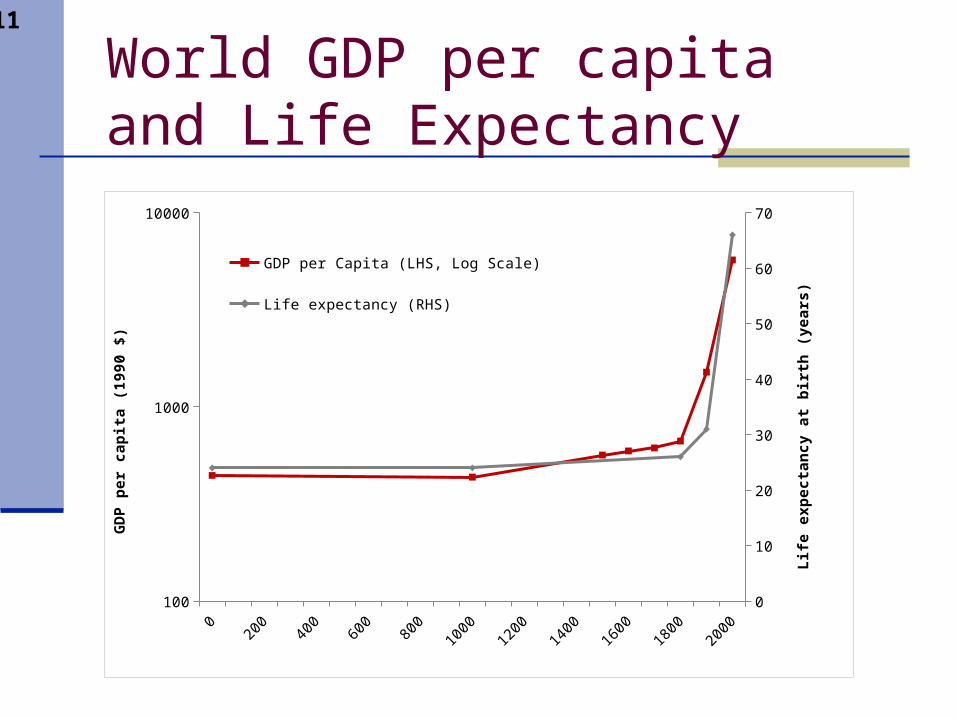
World GDP per capita and Life Expectancy
010
020
030
040
050
060
070
080
090
010
0011
0012
0013
0014
0015
0016
0017
0018
0019
0020
00100
1000
10000
0
10
20
30
40
50
60
70
GDP per Capita (LHS, Log Scale)
Life expectancy (RHS)
GD
P p
er c
apit
a (1
990
$)
Lif
e ex
pec
tan
cy a
t b
irth
(ye
ars)
3-12
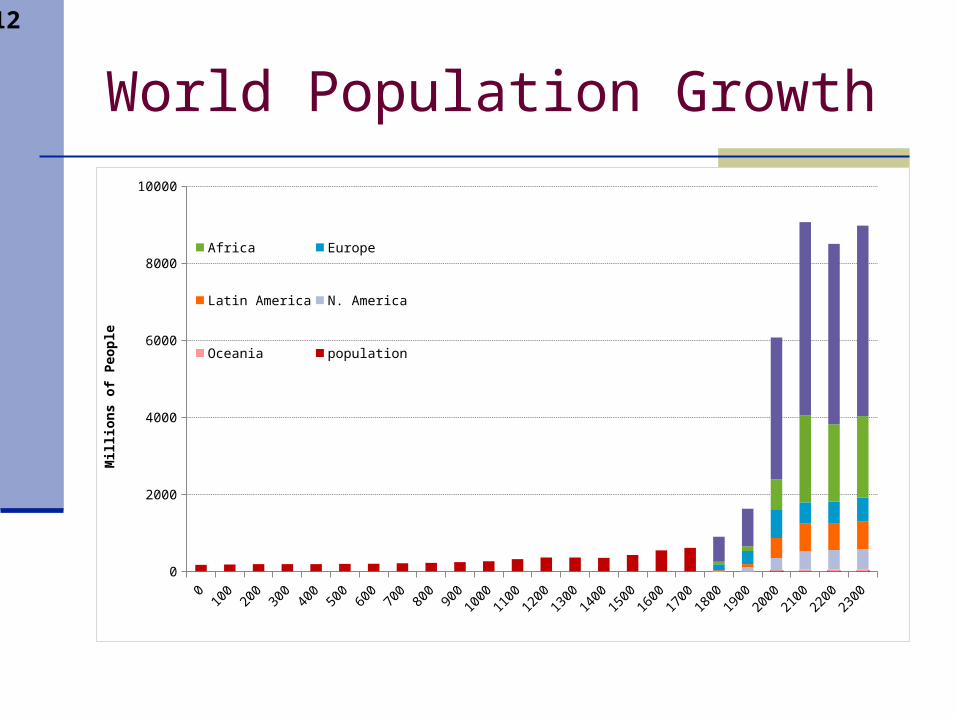
World Population Growth
0 100 200 300 400 500 600 700 800 900 100011001200130014001500160017001800190020002100220023000
2000
4000
6000
8000
10000
Africa Europe
Latin America N. America
Oceania population
Mil
lio
ns
of
Peo
ple
3-13
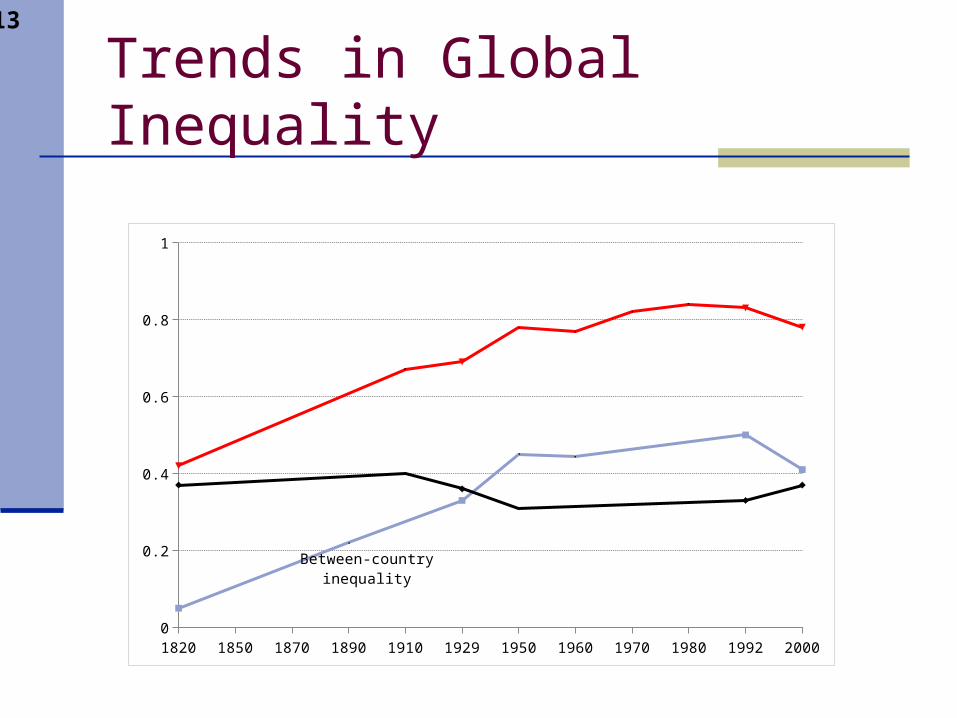
Trends in Global Inequality
1820 1850 1870 1890 1910 1929 1950 1960 1970 1980 1992 20000
0.2
0.4
0.6
0.8
1
Between-country inequality
3-14
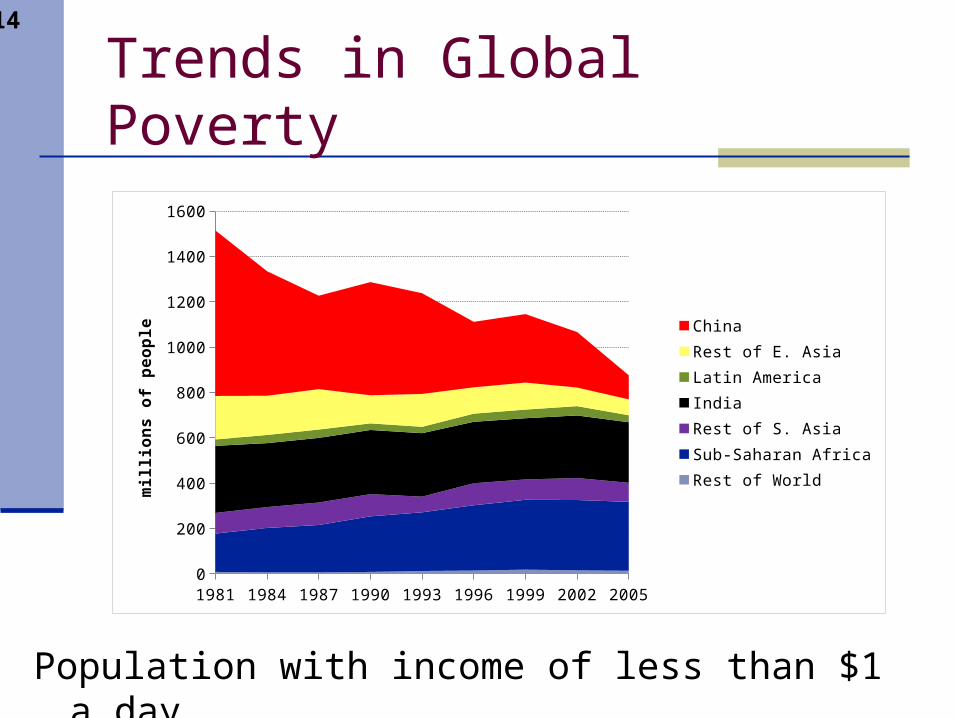
Trends in Global Poverty
Population with income of less than $1 a day
1981 1984 1987 1990 1993 1996 1999 2002 20050
200
400
600
800
1000
1200
1400
1600
ChinaRest of E. AsiaLatin AmericaIndia Rest of S. AsiaSub-Saharan AfricaRest of Worldm
illio
ns
of
pe
op
le
3-15
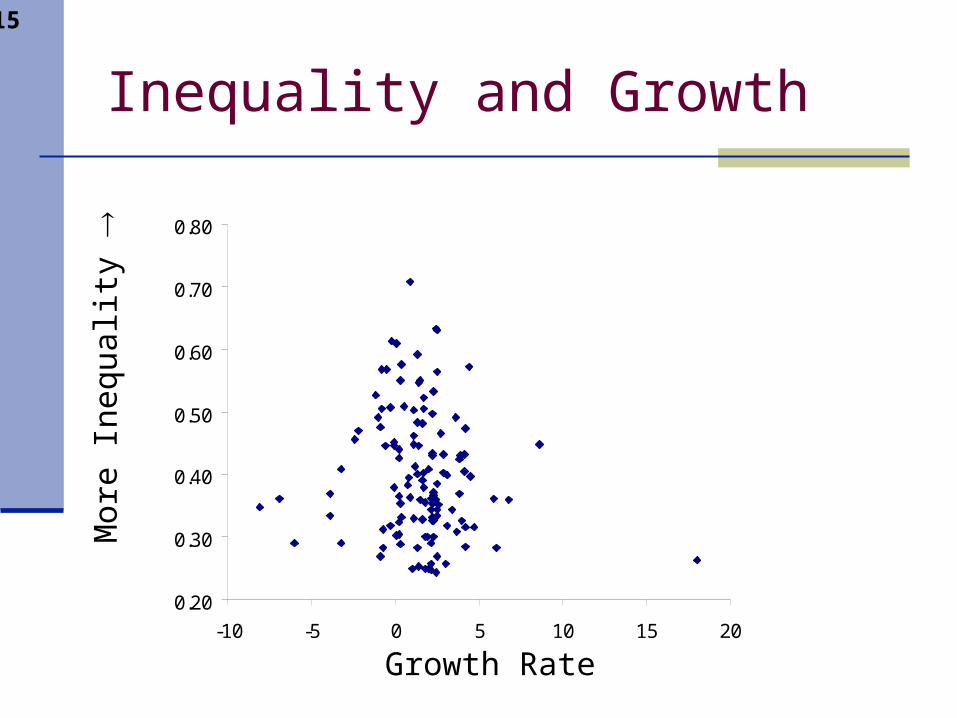
Inequality and Growth
0.20
0.30
0.40
0.50
0.60
0.70
0.80
-10 -5 0 5 10 15 20
Growth Rate
Mor
e In
equa
lity
3-16
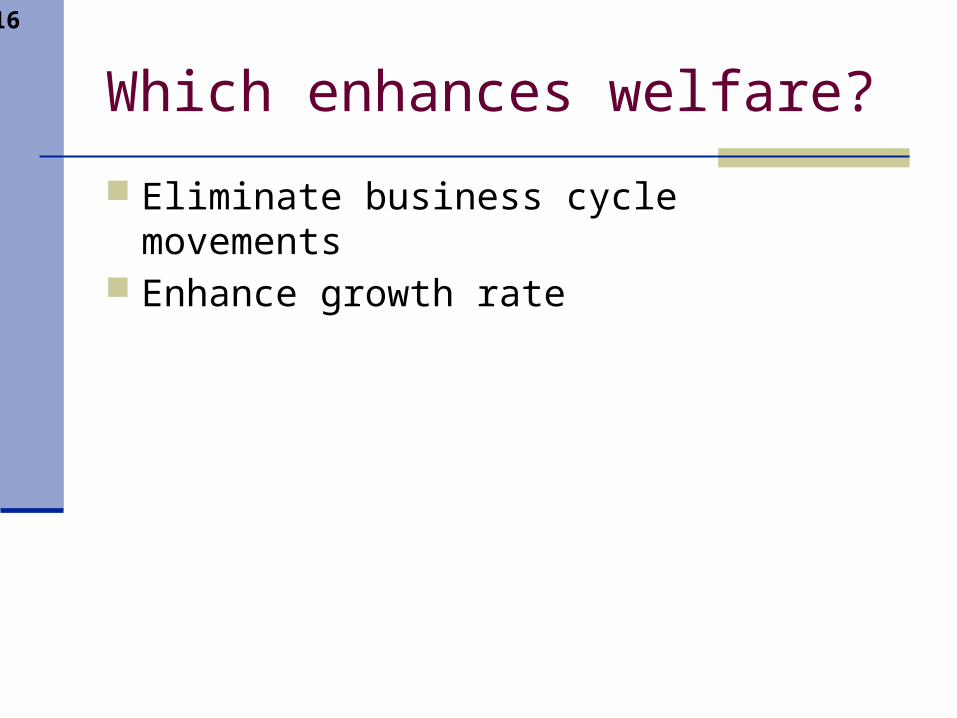
Which enhances welfare?
Eliminate business cycle movements Enhance growth rate
3-17
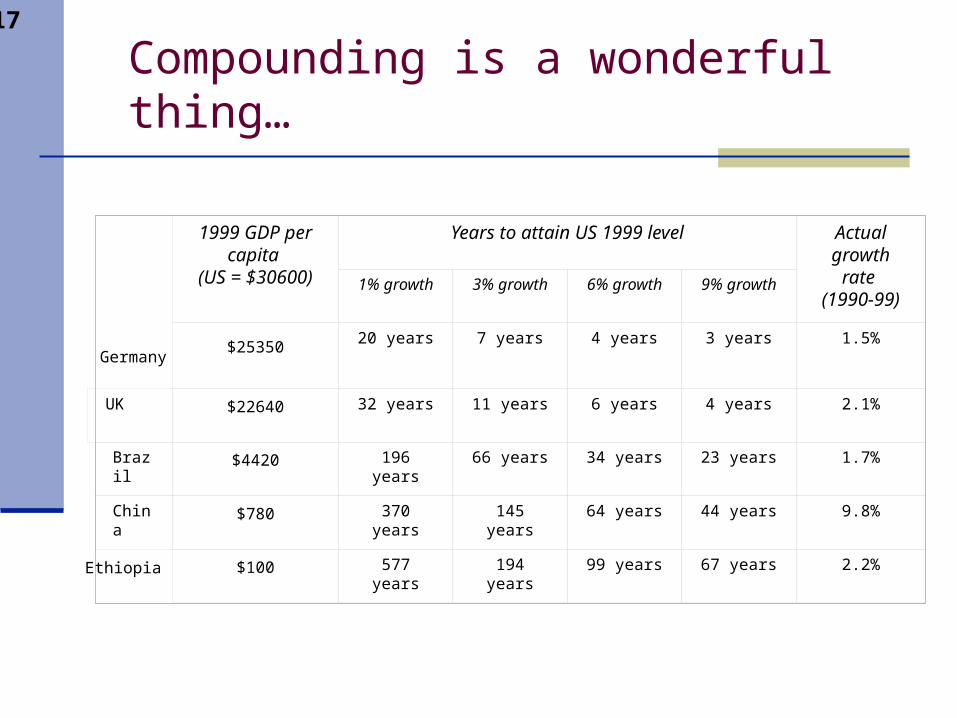
1999 GDP per capita
(US = $30600)
Years to attain US 1999 level Actual growth rate
(1990-99)1% growth 3% growth 6% growth 9% growth
Germany$25350
20 years 7 years 4 years 3 years 1.5%
UK $22640 32 years 11 years 6 years 4 years 2.1%
Brazil $4420 196 years 66 years 34 years 23 years 1.7%
China $780 370 years 145 years 64 years 44 years 9.8%
Ethiopia $100 577 years 194 years 99 years 67 years 2.2%
Compounding is a wonderful thing…
3-18
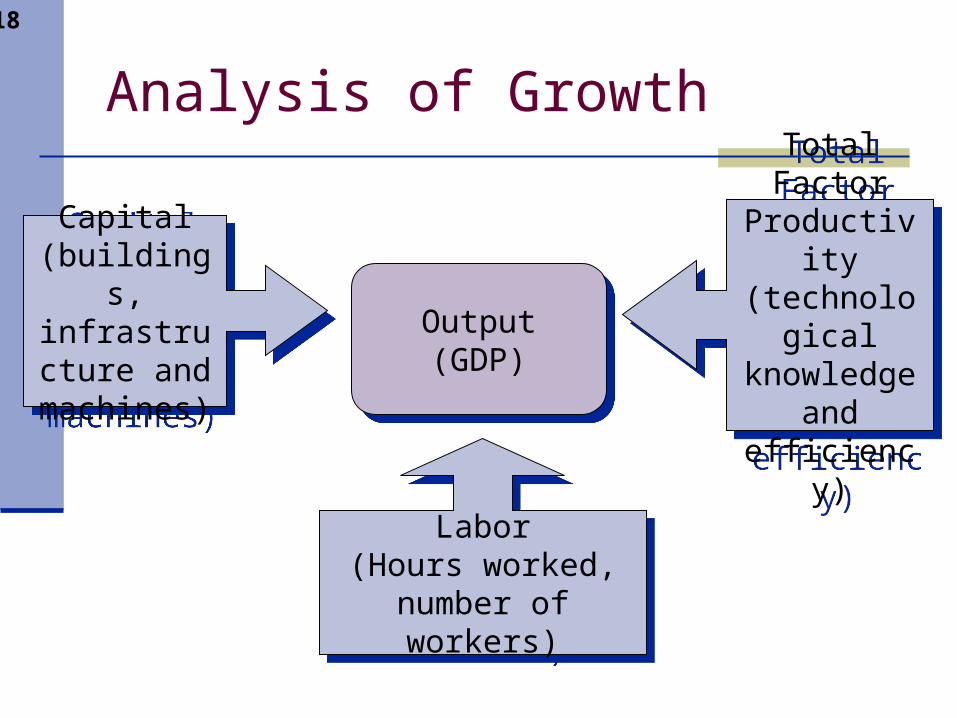
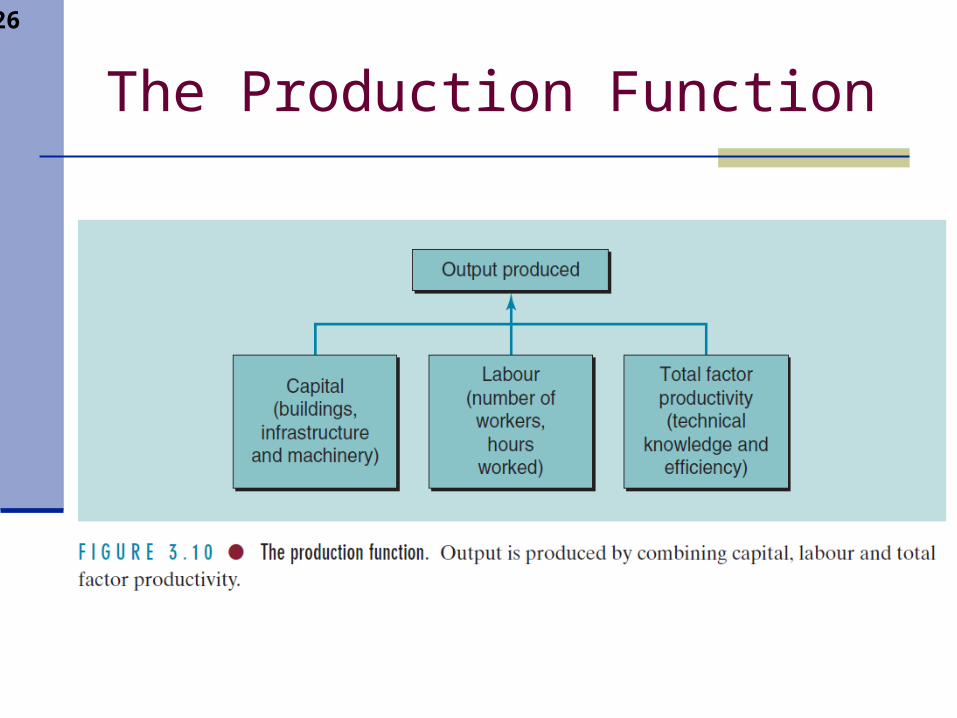
Analysis of Growth
Capital(buildings,
infrastructure and
machines)
Capital(buildings,
infrastructure and
machines)
Total Factor Productivity
(technological knowledge
and efficiency)
Total Factor Productivity
(technological knowledge
and efficiency)
Output (GDP)Output (GDP)
Labor(Hours worked, number
of workers)
Labor(Hours worked, number
of workers)
3-19
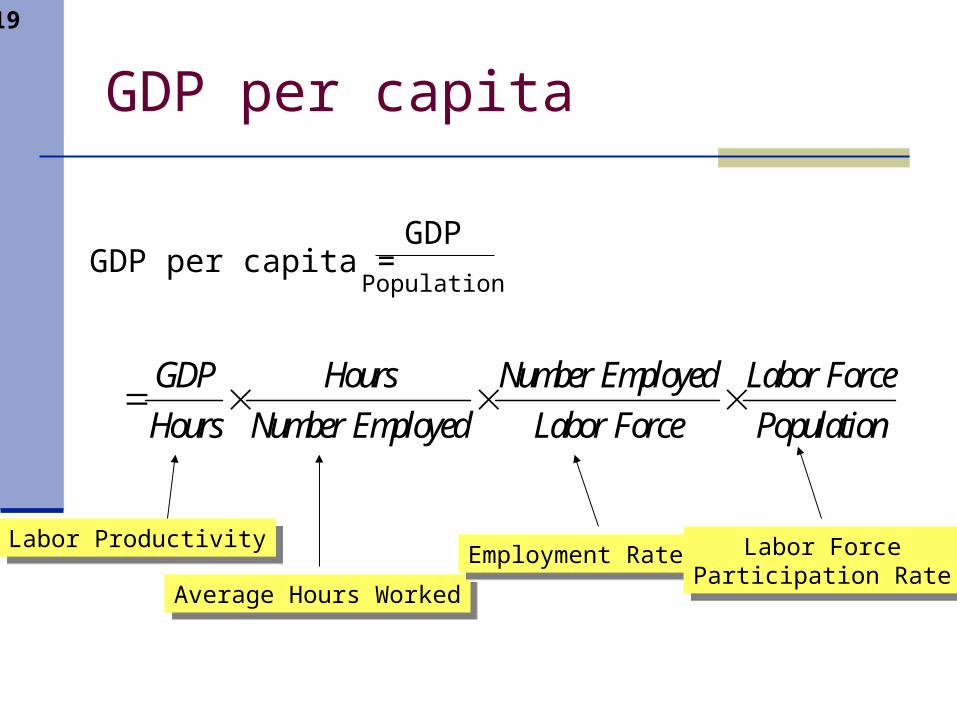
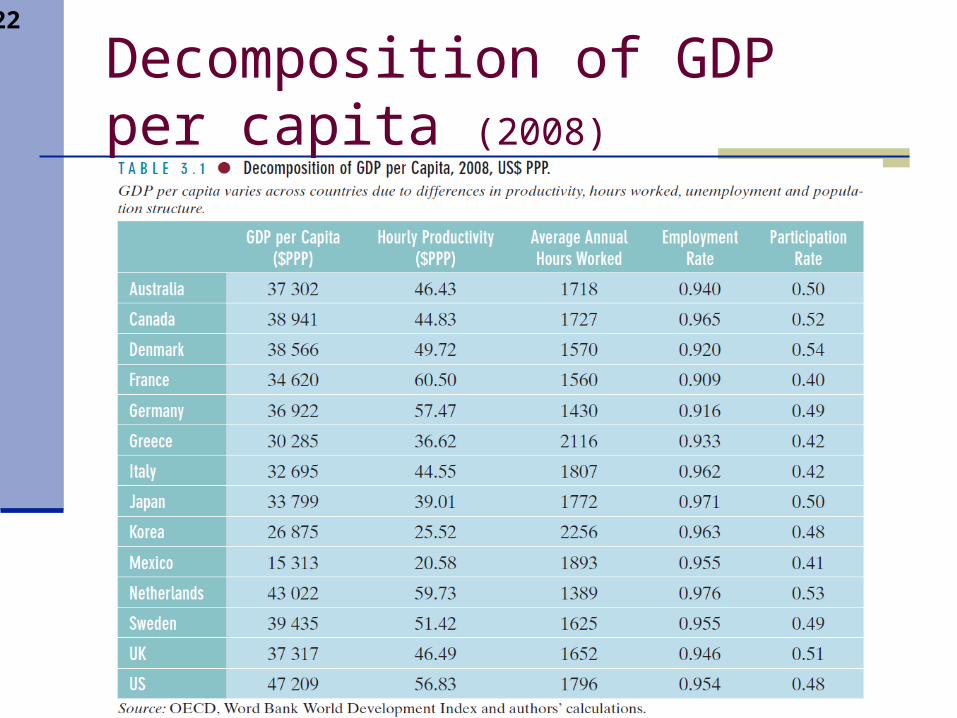
GDP per capita
GDP per capita =GDP
Population
GDP Hours Number Employed Labor Force
Hours Number Employed Labor Force Population
Labor ProductivityLabor Productivity
Average Hours WorkedAverage Hours WorkedEmployment RateEmployment Rate Labor Force
Participation Rate
Labor ForceParticipation Rate
3-20
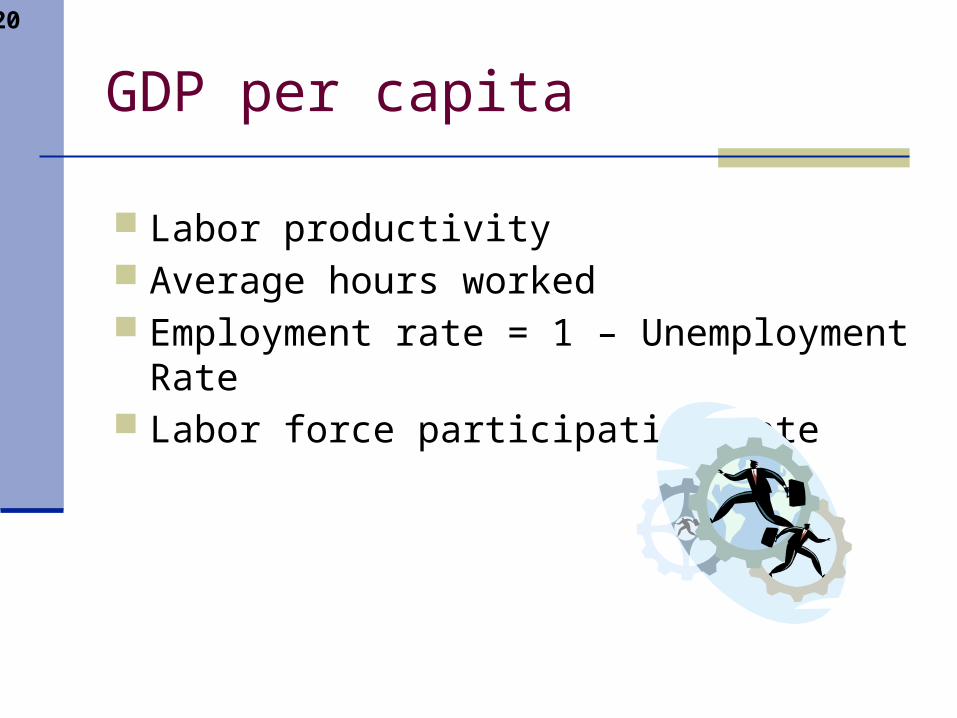
GDP per capita
Labor productivity Average hours worked Employment rate = 1 – Unemployment Rate Labor force participation rate
3-21
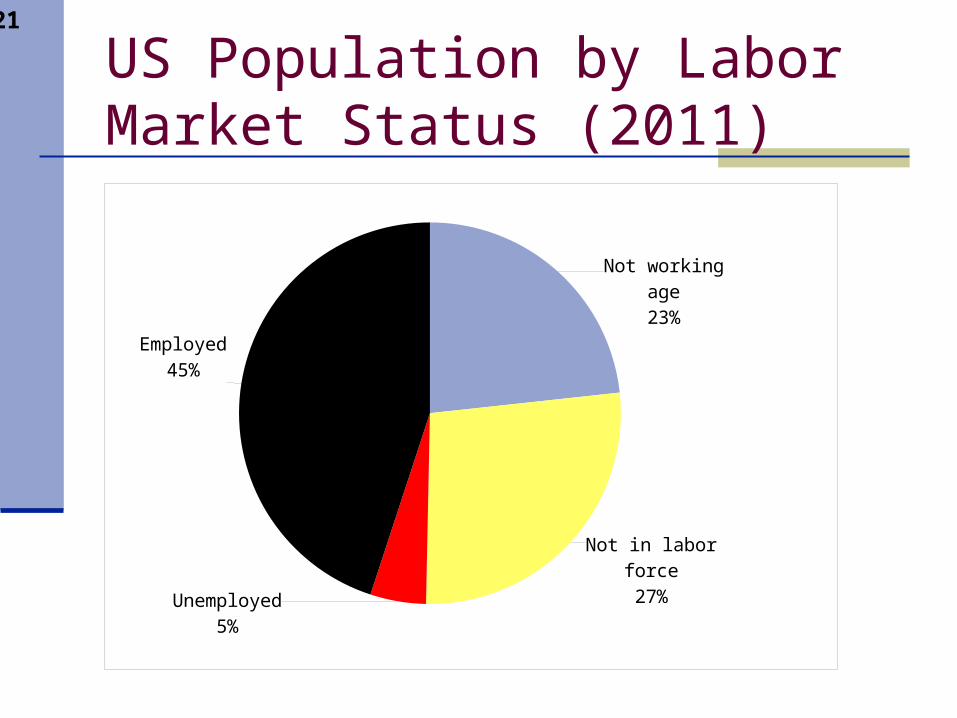
US Population by Labor Market Status (2011)
Not working age23%
Not in labor force27%
Unemployed5%
Employed45%
3-22
Decomposition of GDP per capita (2008)
3-23
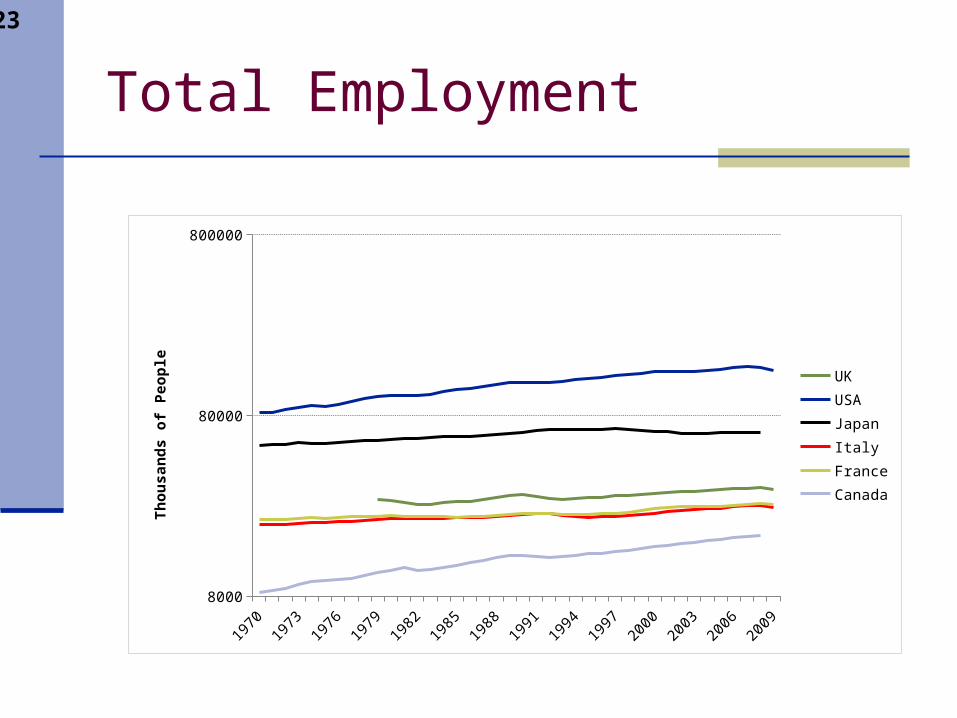
Total Employment
1970
1972
1974
1976
1978
1980
1982
1984
1986
1988
1990
1992
1994
1996
1998
2000
2002
2004
2006
2008
8000
80000
800000
UK
USA
Japan
Italy
France
Canada
Th
ou
san
ds
of
Peo
ple
3-24
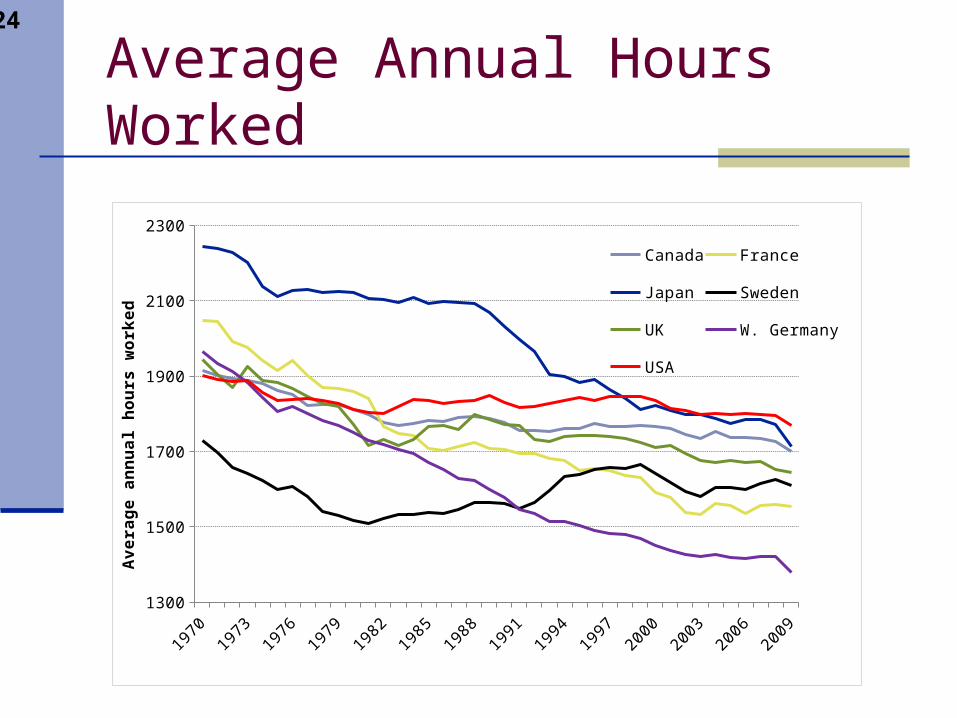
Average Annual Hours Worked
1970
1972
1974
1976
1978
1980
1982
1984
1986
1988
1990
1992
1994
1996
1998
2000
2002
2004
2006
2008
1300
1500
1700
1900
2100
2300
Canada France
Japan Sweden
UK W. Germany
USA
Av
era
ge
an
nu
al h
ou
rs w
ork
ed
3-25
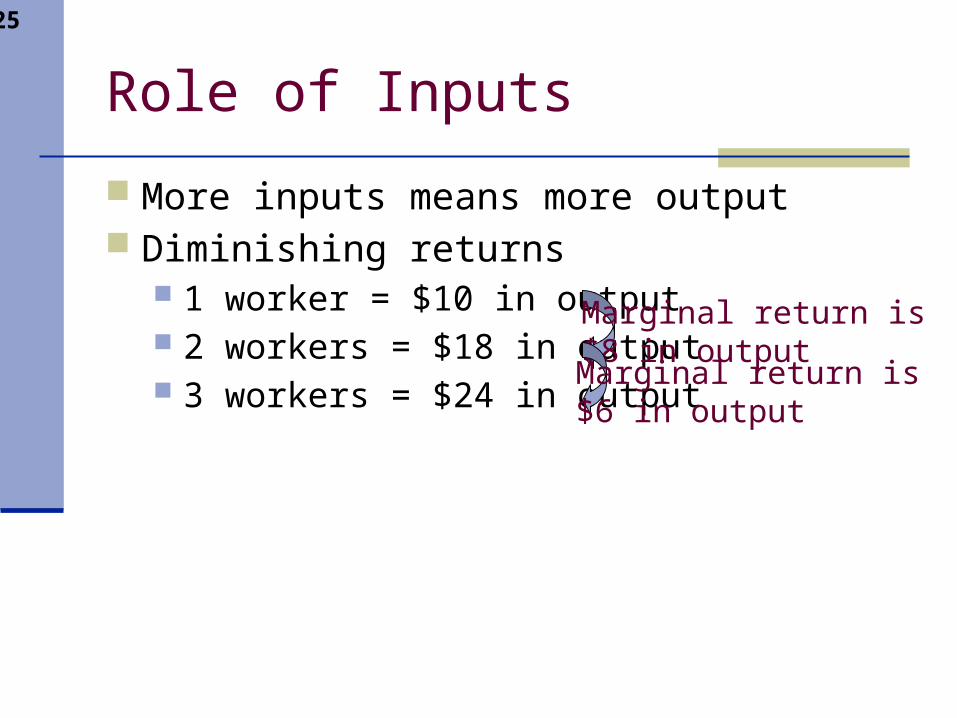
Role of Inputs
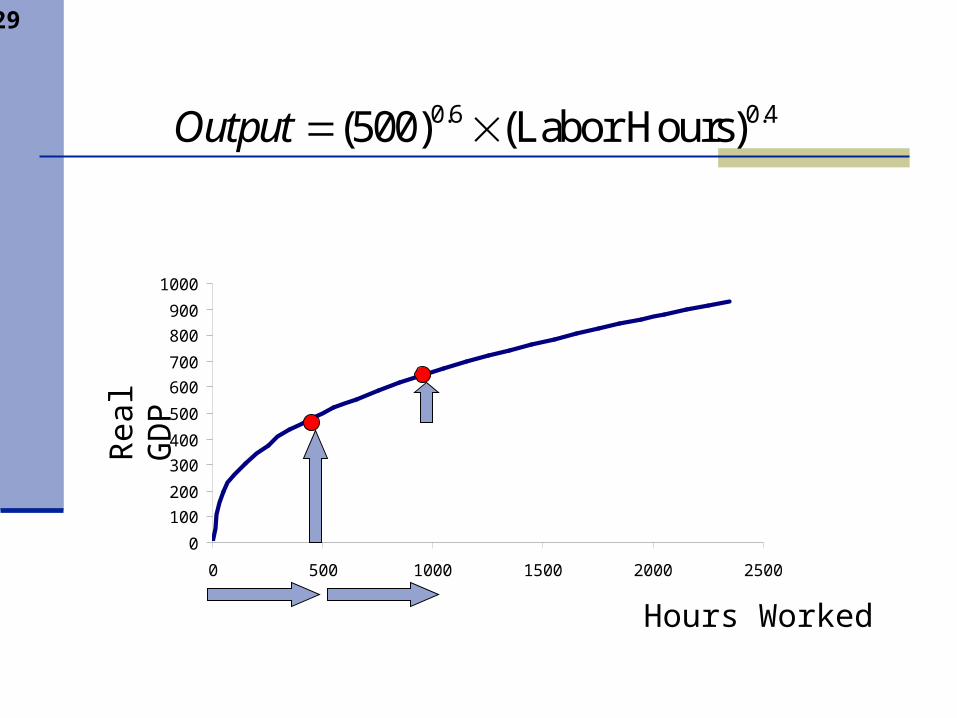
More inputs means more output Diminishing returns
1 worker = $10 in output 2 workers = $18 in output 3 workers = $24 in output
Marginal return is$8 in outputMarginal return is $6 in output
3-26
The Production Function
3-27
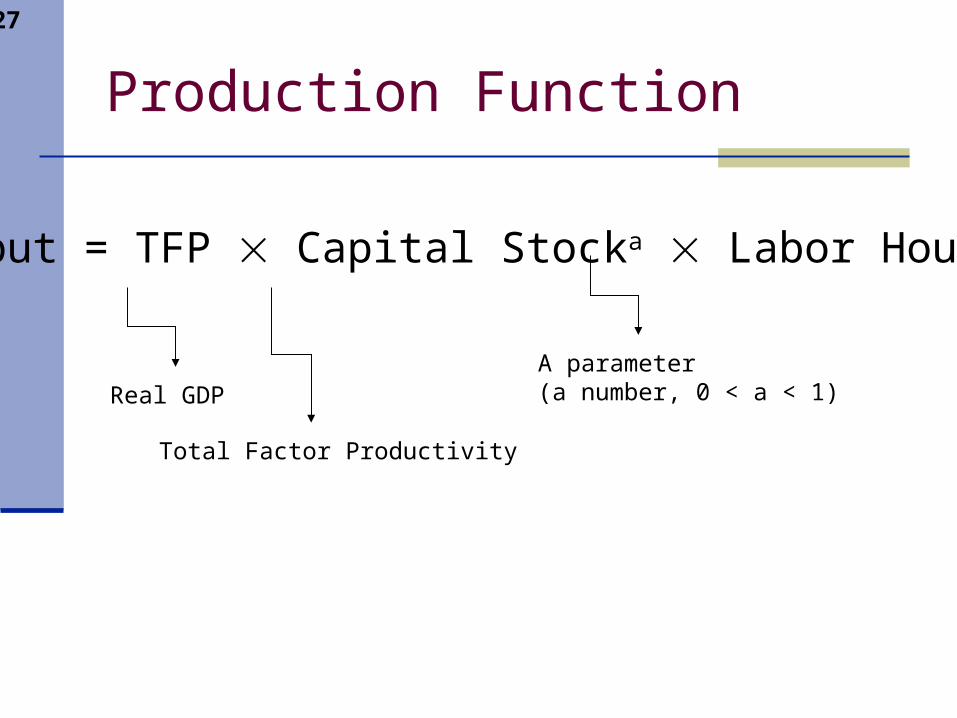
Production Function
Output = TFP Capital Stocka Labor Hours(1-a)
Real GDP
Total Factor Productivity
A parameter (a number, 0 < a < 1)
3-28
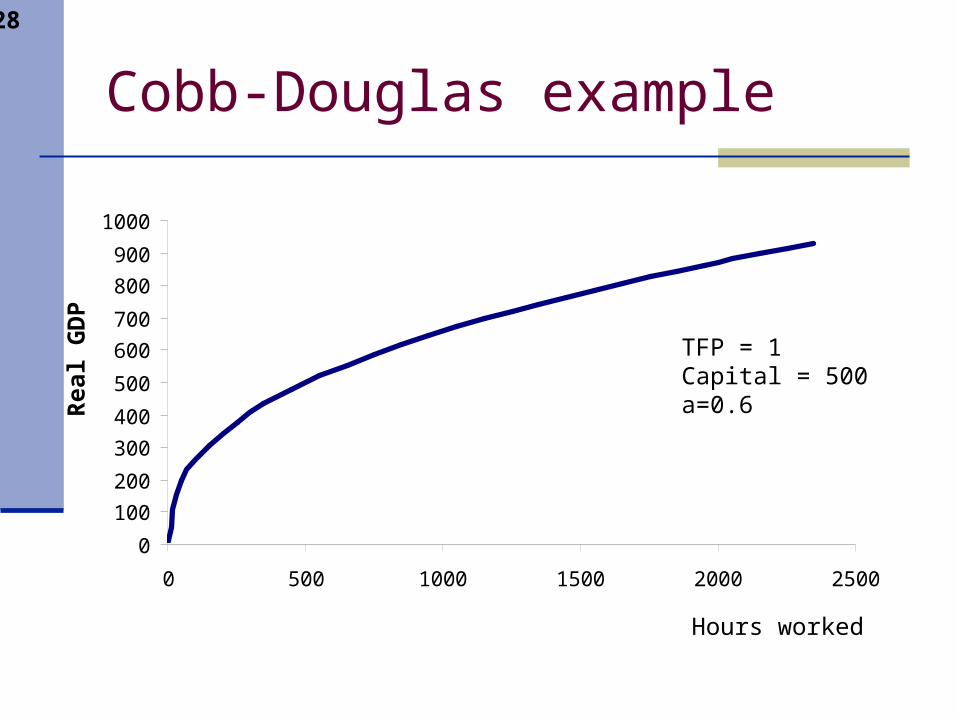
Cobb-Douglas example
0
100
200
300
400
500
600
700
800
900
1000
0 500 1000 1500 2000 2500
Rea
l G
DP
Hours worked
TFP = 1Capital = 500a=0.6
3-29
0
100
200
300
400
500
600
700
800
900
1000
0 500 1000 1500 2000 2500
Hours Worked
Rea
l GD
P0.6 0.4(500) (Labor Hours)Output
3-30
0
200
400
600
800
1000
1200
1400
1600
1800
0 500 1000 1500 2000 2500
Capital Stock
Output
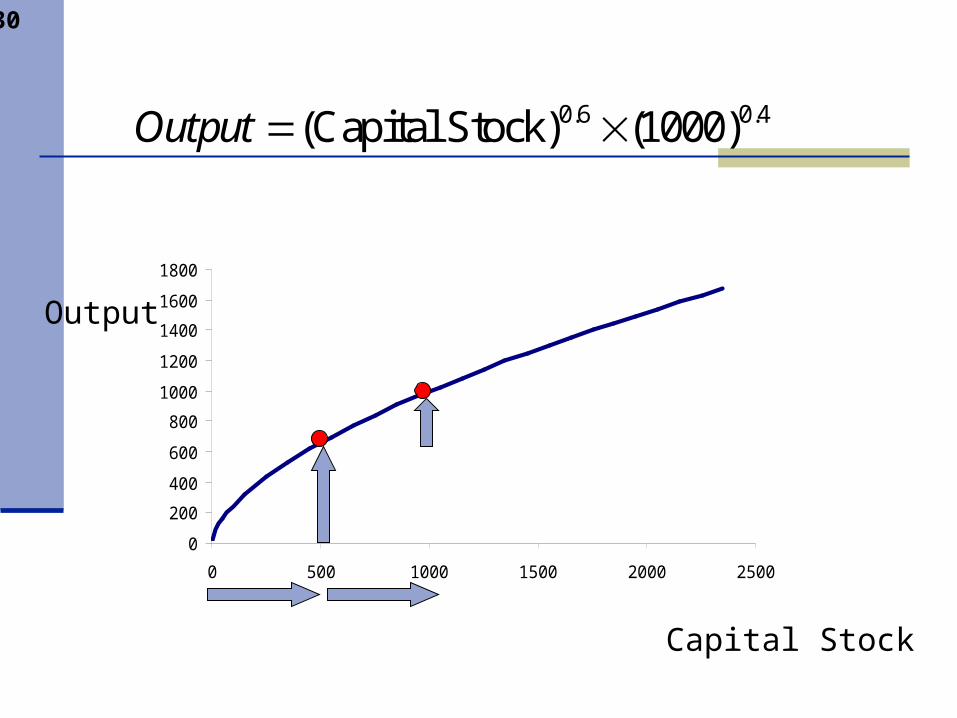
0.6 0.4(Capital Stock) (1000)Output
3-31
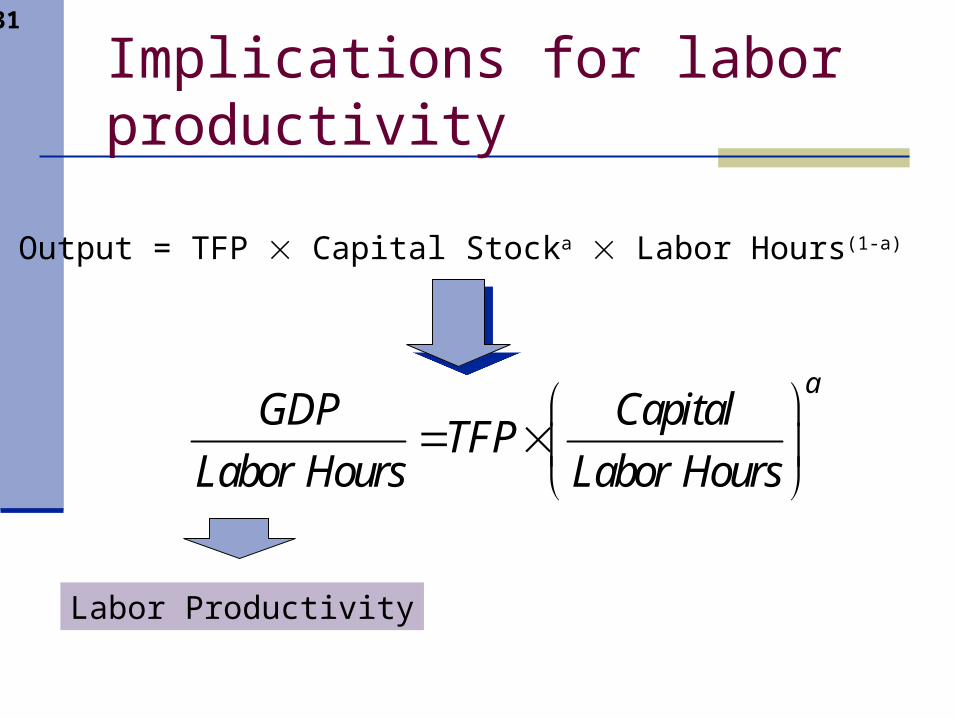
Implications for labor productivity
Output = TFP Capital Stocka Labor Hours(1-a)
Labor Productivity
aGDP Capital
TFPLabor Hours Labor Hours

3-32
Changes in Labor Productivity
Total Factor Productivity Capital per Labor Hour
3-33
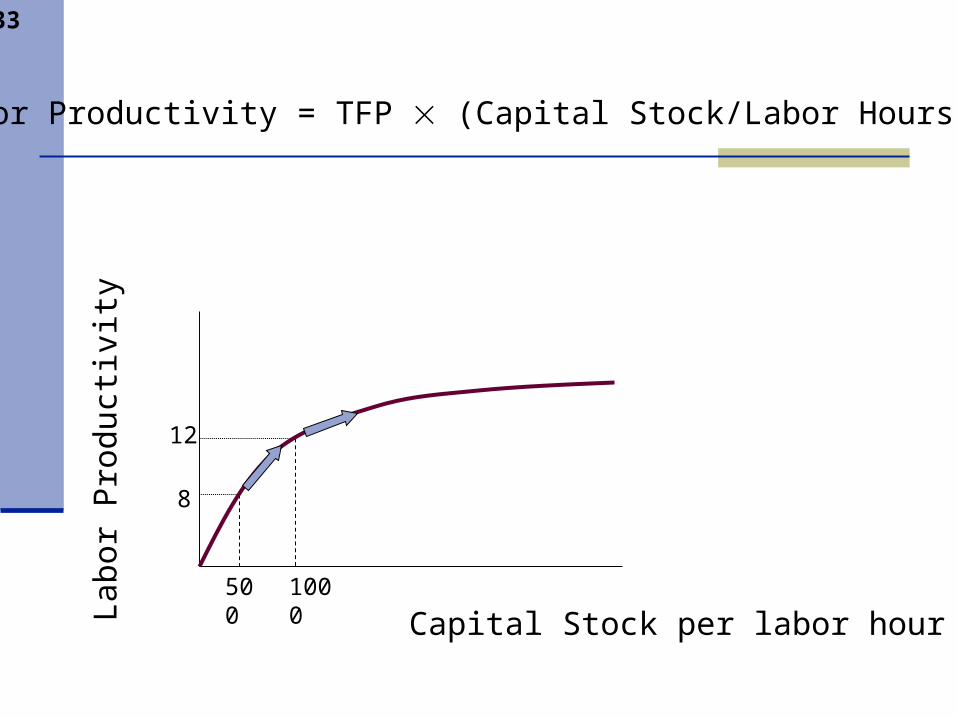
Capital Stock per labor hour
Lab
or P
rodu
ctiv
ity
500 1000
8
12
Labor Productivity = TFP (Capital Stock/Labor Hours)a
3-34
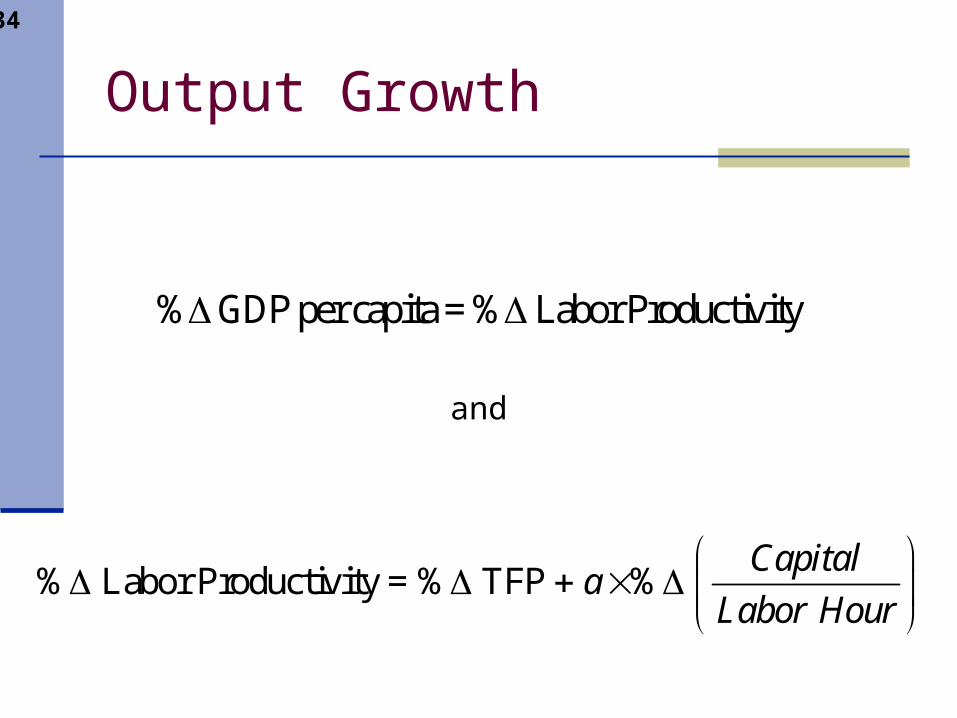
Output Growth
% GDP per capita = % Labor Productivity
and
% Labor Productivity = % TFP %Capital
aLabor Hour
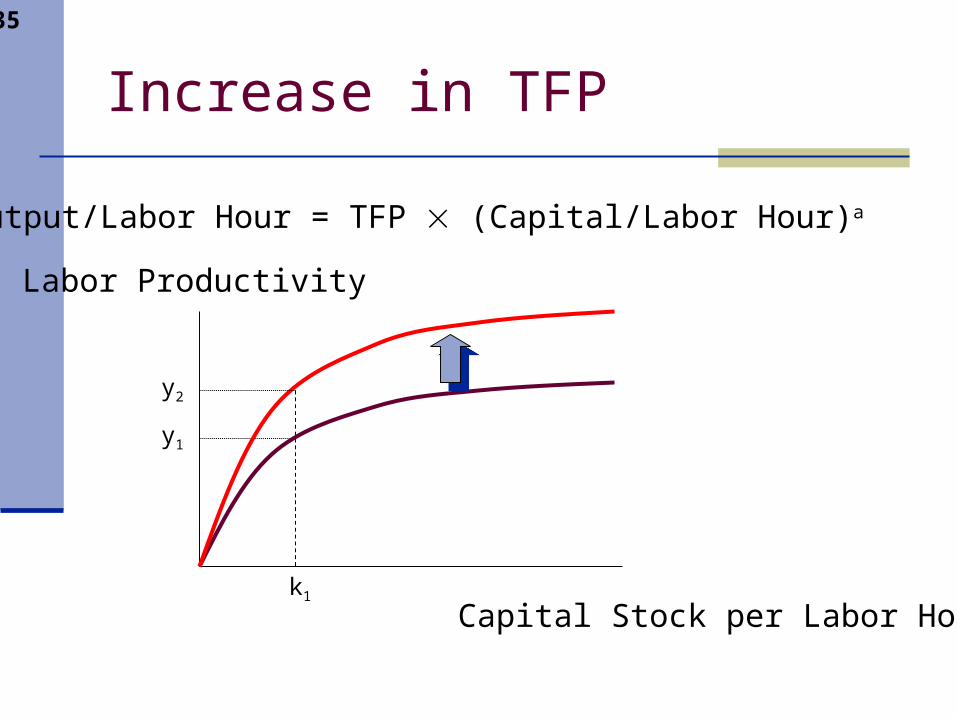
3-35
Capital Stock per Labor Hour
Labor Productivity
k1
y1
y2
Output/Labor Hour = TFP (Capital/Labor Hour)a
Increase in TFP
3-36
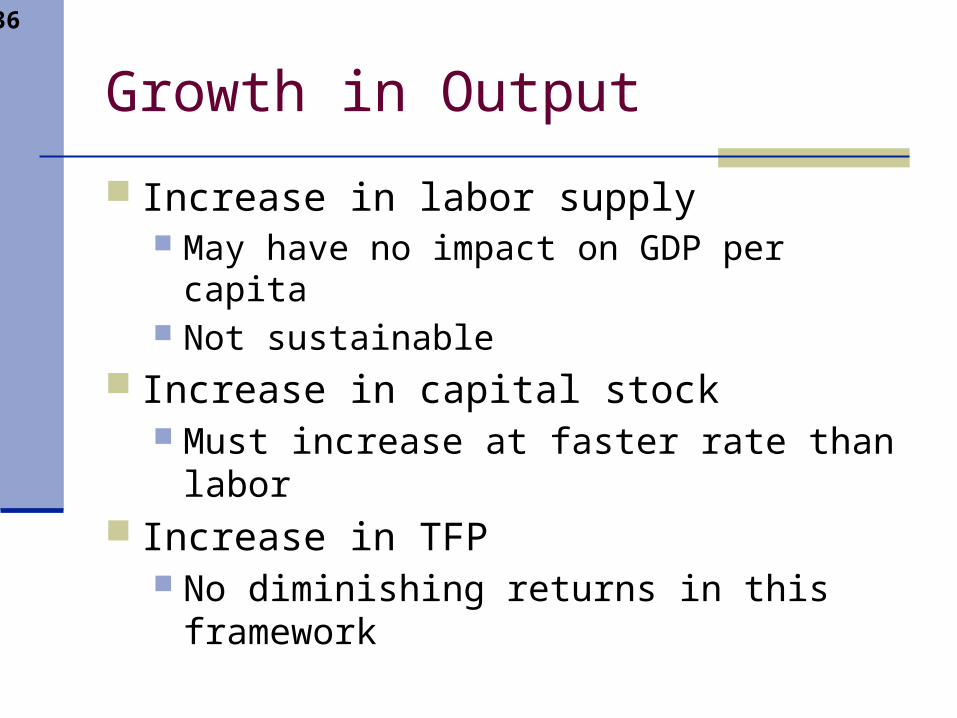
Growth in Output
Increase in labor supply May have no impact on GDP per capita Not sustainable
Increase in capital stock Must increase at faster rate than labor
Increase in TFP No diminishing returns in this framework
3-37
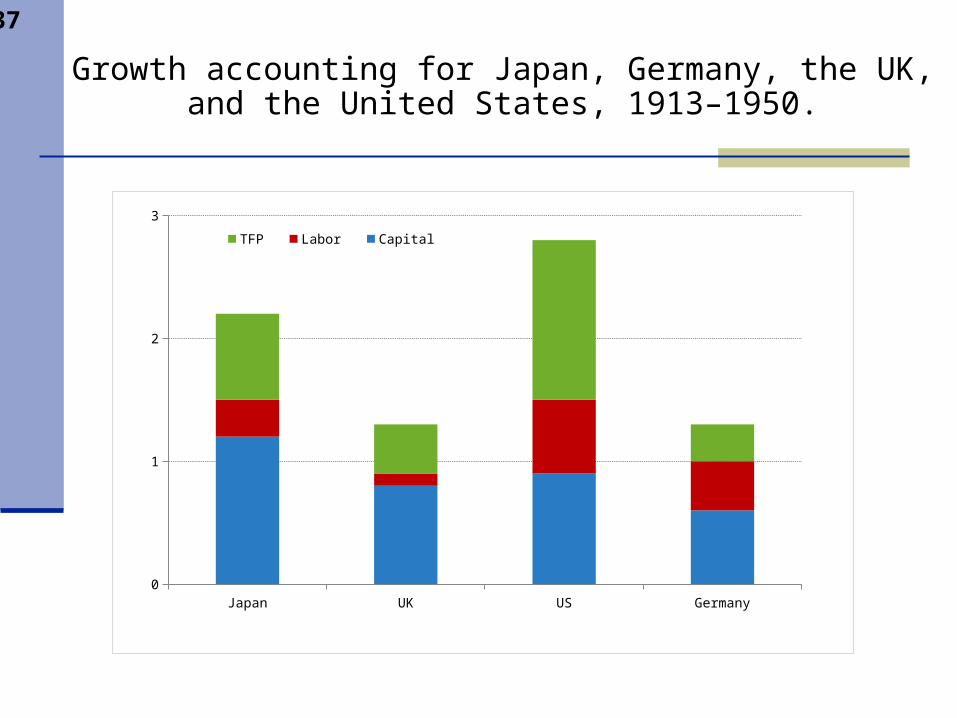
Growth accounting for Japan, Germany, the UK, and the United States, 1913–1950.
Japan UK US Germany0
1
2
3
TFP Labor Capital
3-38
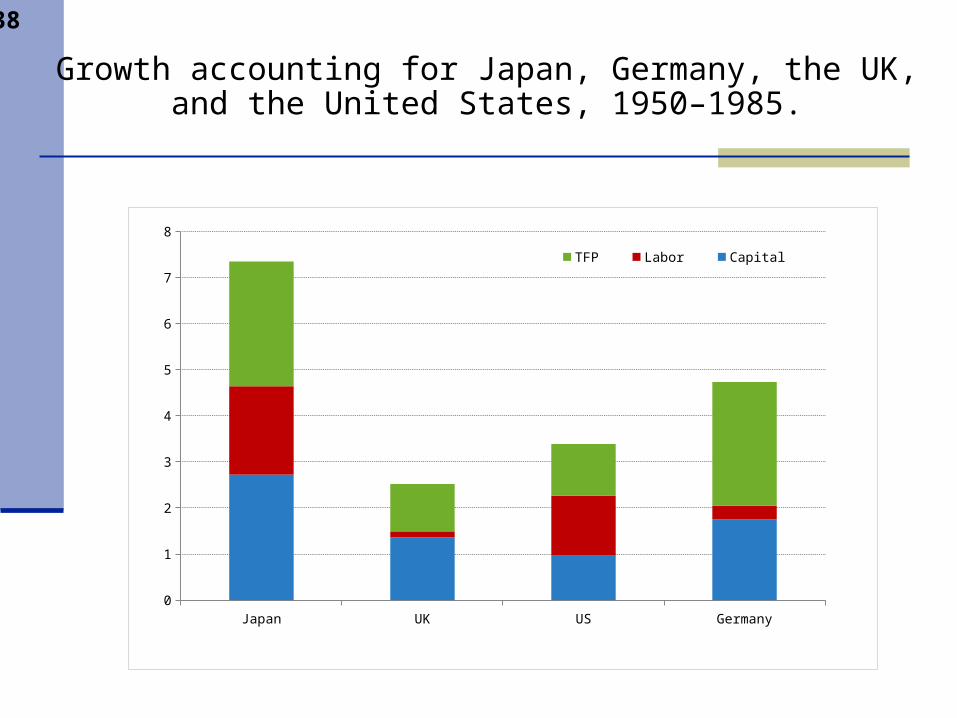
Growth accounting for Japan, Germany, the UK, and the United States, 1950–1985.
Japan UK US Germany0
1
2
3
4
5
6
7
8
TFP Labor Capital
3-39
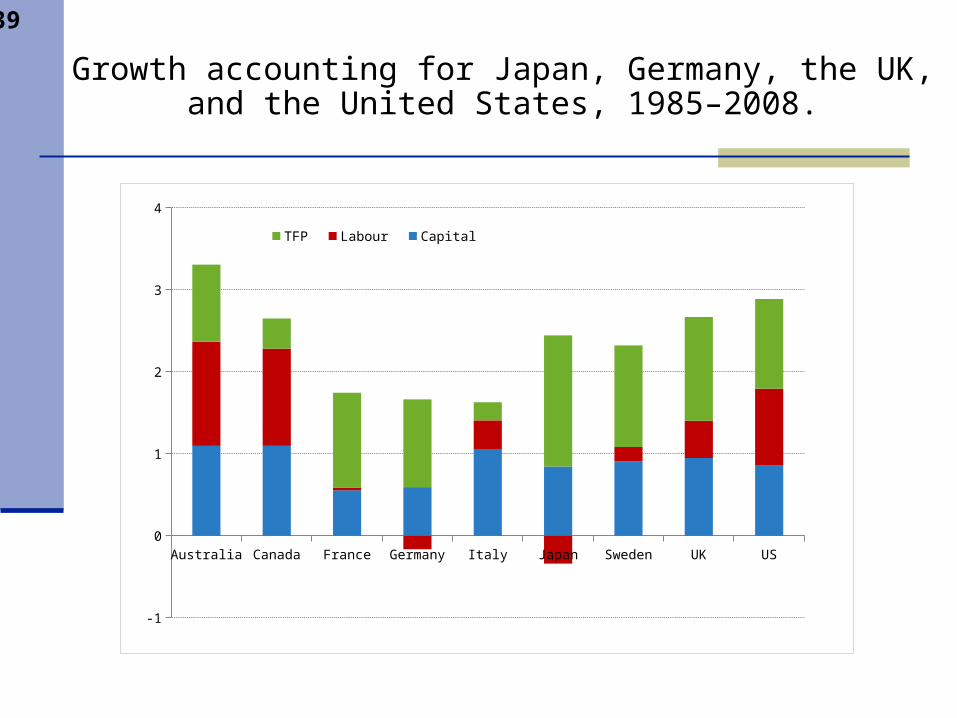
Growth accounting for Japan, Germany, the UK, and the United States, 1985–2008.
Australia Canada France Germany Italy Japan Sweden UK US
-1
0
1
2
3
4
TFP Labour Capital
3-40
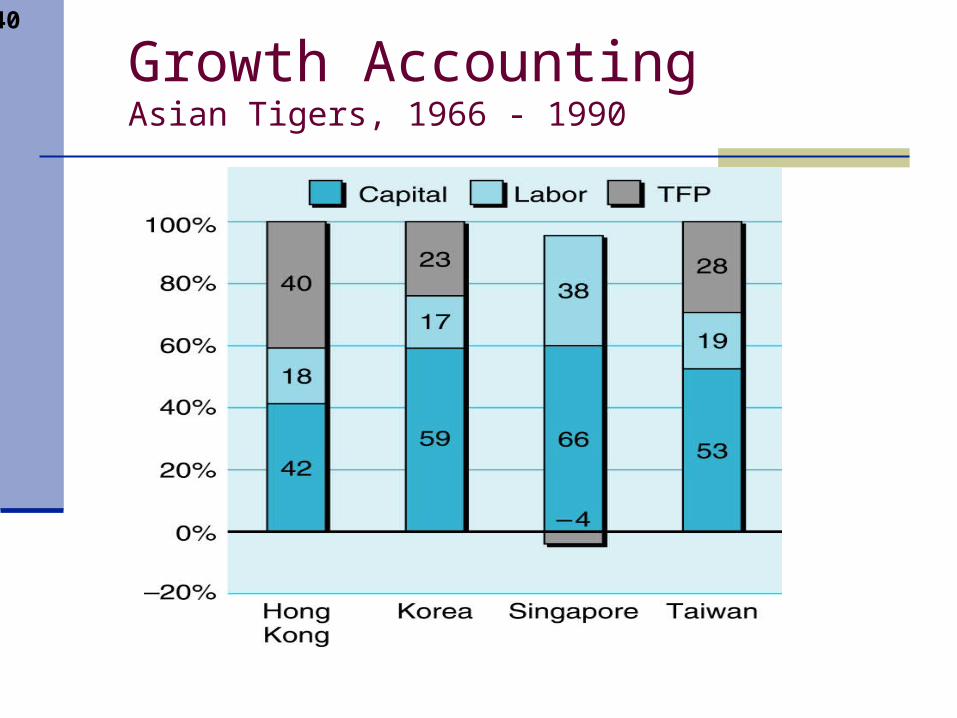
Growth AccountingAsian Tigers, 1966 - 1990
3-41
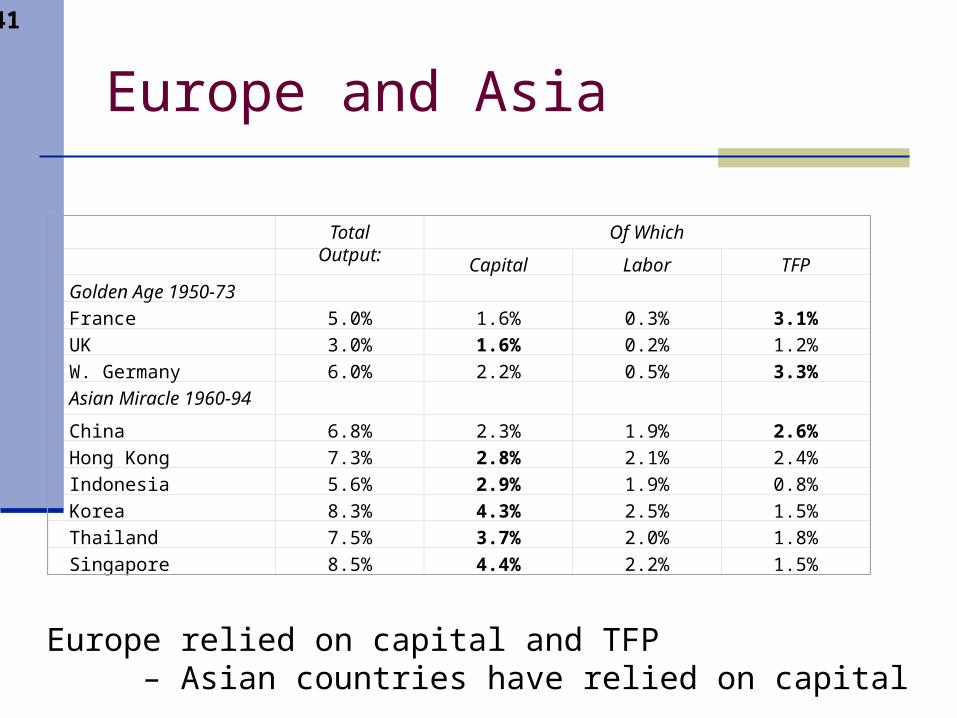
Europe and Asia
Total Output: Of Which
Capital Labor TFP
Golden Age 1950-73
France 5.0% 1.6% 0.3% 3.1%
UK 3.0% 1.6% 0.2% 1.2%
W. Germany 6.0% 2.2% 0.5% 3.3%
Asian Miracle 1960-94
China 6.8% 2.3% 1.9% 2.6%
Hong Kong 7.3% 2.8% 2.1% 2.4%
Indonesia 5.6% 2.9% 1.9% 0.8%
Korea 8.3% 4.3% 2.5% 1.5%
Thailand 7.5% 3.7% 2.0% 1.8%
Singapore 8.5% 4.4% 2.2% 1.5%
Europe relied on capital and TFP – Asian countries have relied on capital
3-42
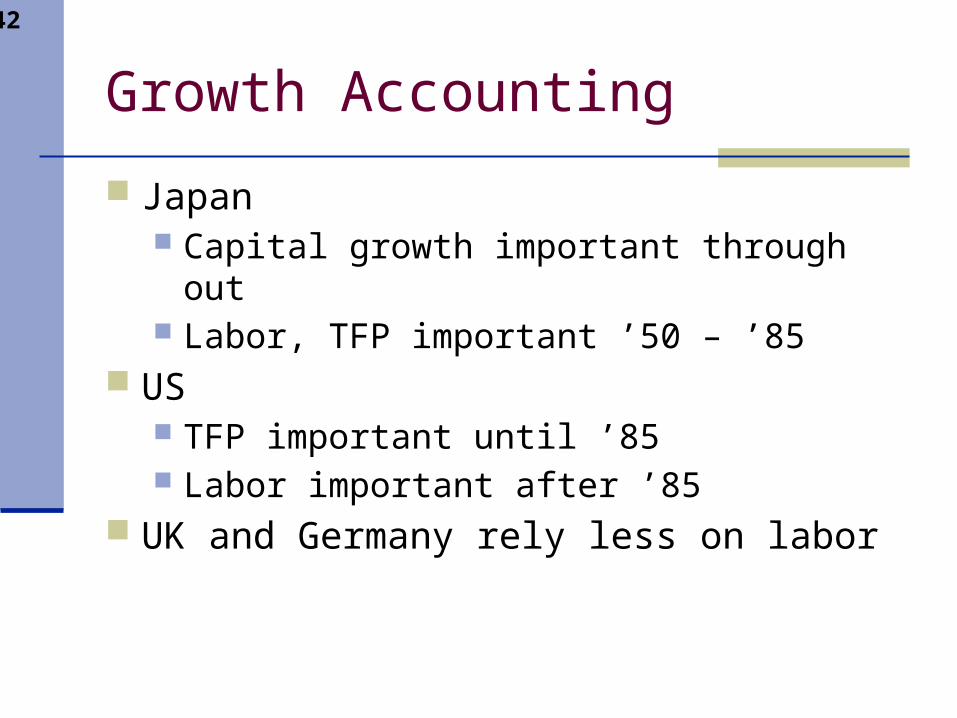
Growth Accounting
Japan Capital growth important through out Labor, TFP important ’50 – ’85
US TFP important until ’85 Labor important after ’85
UK and Germany rely less on labor
3-43
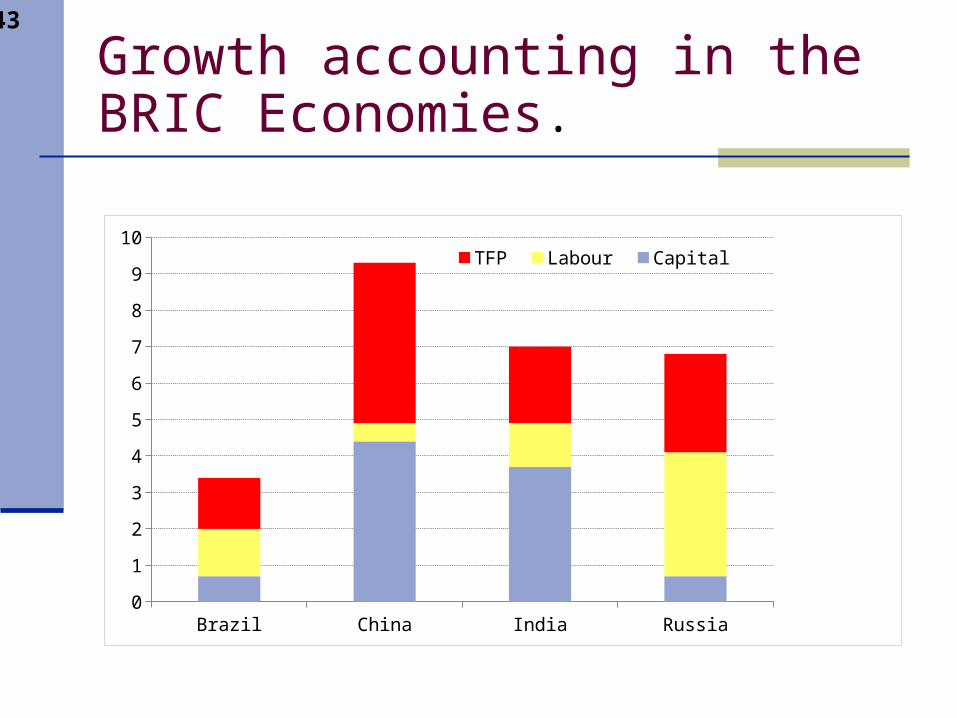
Growth accounting in the BRIC Economies.
Brazil China India Russia0
1
2
3
4
5
6
7
8
9
10TFP Labour Capital
3-44
Summary
Importance of Growth Sources of Growth
GDP per capita Hourly productivity Number of hours worked
Productivity Capital Accumulation TFP
Growth Accounting
Copyright © 2012 John Wiley & Sons, Inc. All rights reserved. Reproduction or translation of this work beyond that permitted in Section 117 of the 1976 United States Copyright Act without the express written permission of the copyright owner is unlawful. Request for further information should be addressed to the Permissions Department, John Wiley & Sons, Inc. The purchaser may make back-up copies for his/her own use only and not for distribution or resale. The Publisher assumes no responsibility for errors, omissions, or damages caused by the use of these programs or from the use of the information contained therein.