Embed Size (px)
Citation preview
06/13/2011
High Flux Backscattering Spectrometer
Madhusudan TyagiNIST Center for Neutron Research
Spectroscopy Summer School 2011
06/13/2011
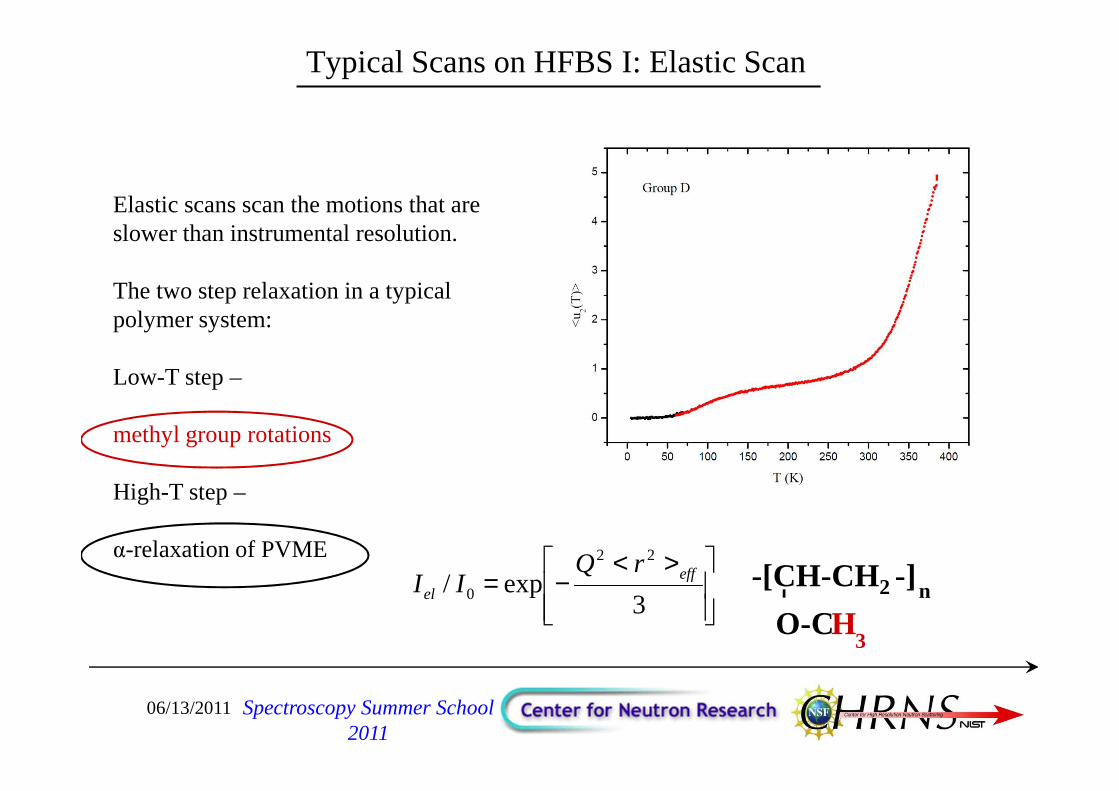
Typical Scans on HFBS I: Elastic Scan
0
0.2
0.4
0.6
0.8
1
0 50 100 150 200 250 300 350 400
Normalized Intensities for PVME
I/I0
T(K)
Elastic scans scan the motions that are slower than instrumental resolution.
The two step relaxation in a typical polymer system:
Low-T step –
methyl group rotations
High-T step –
α-relaxation of PVME-[CH-CH2 -] n
O-CH3
-
><−=
3exp/
22
0eff
el
rQII
Energy resolution = 0.8 µev
Spectroscopy Summer School 2011
06/13/2011
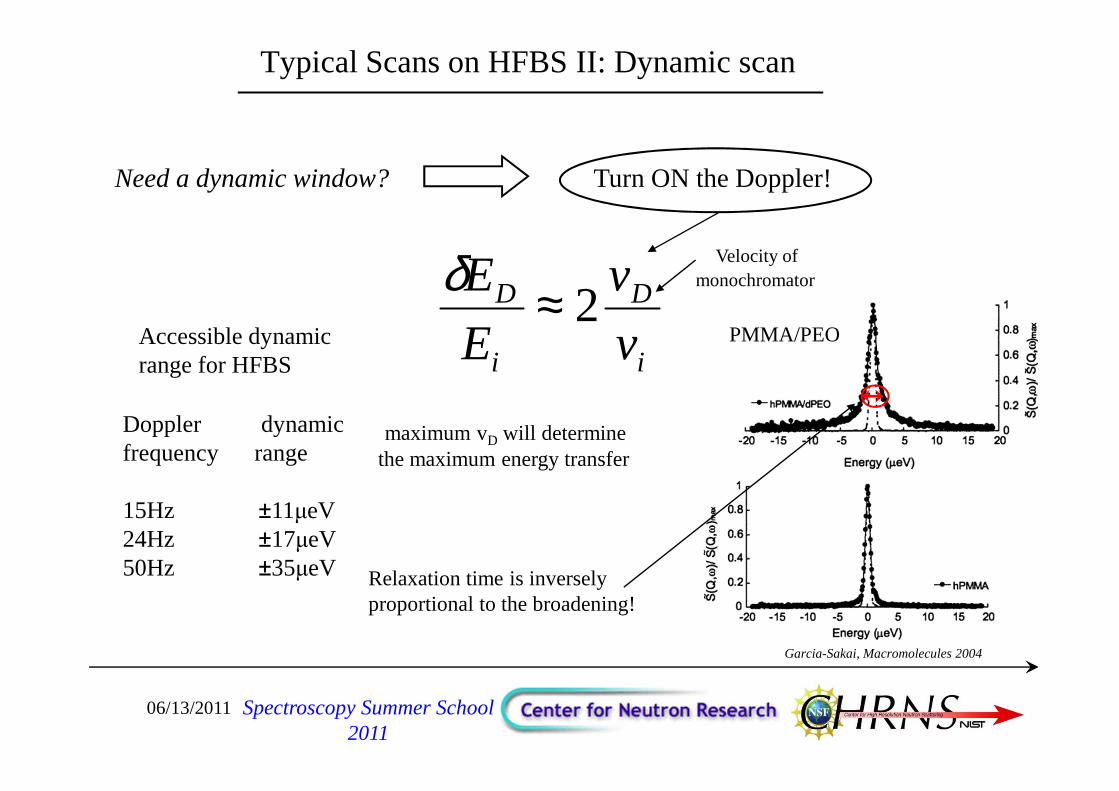
Typical Scans on HFBS II: Dynamic scan
Need a dynamic window? Turn ON the Doppler!
i
D
i
D
v
v
E
E2≈δ
maximum vD will determinethe maximum energy transfer
Doppler dynamicfrequency range
15Hz ±11µeV24Hz ±17µeV50Hz ±35µeV
Accessible dynamic range for HFBS
Velocity of monochromator
Relaxation time is inverselyproportional to the broadening!
PMMA/PEO
Spectroscopy Summer School 2011
Garcia-Sakai, Macromolecules 2004
06/13/2011
Small Molecules and Biology….
Spectroscopy Summer School 2011
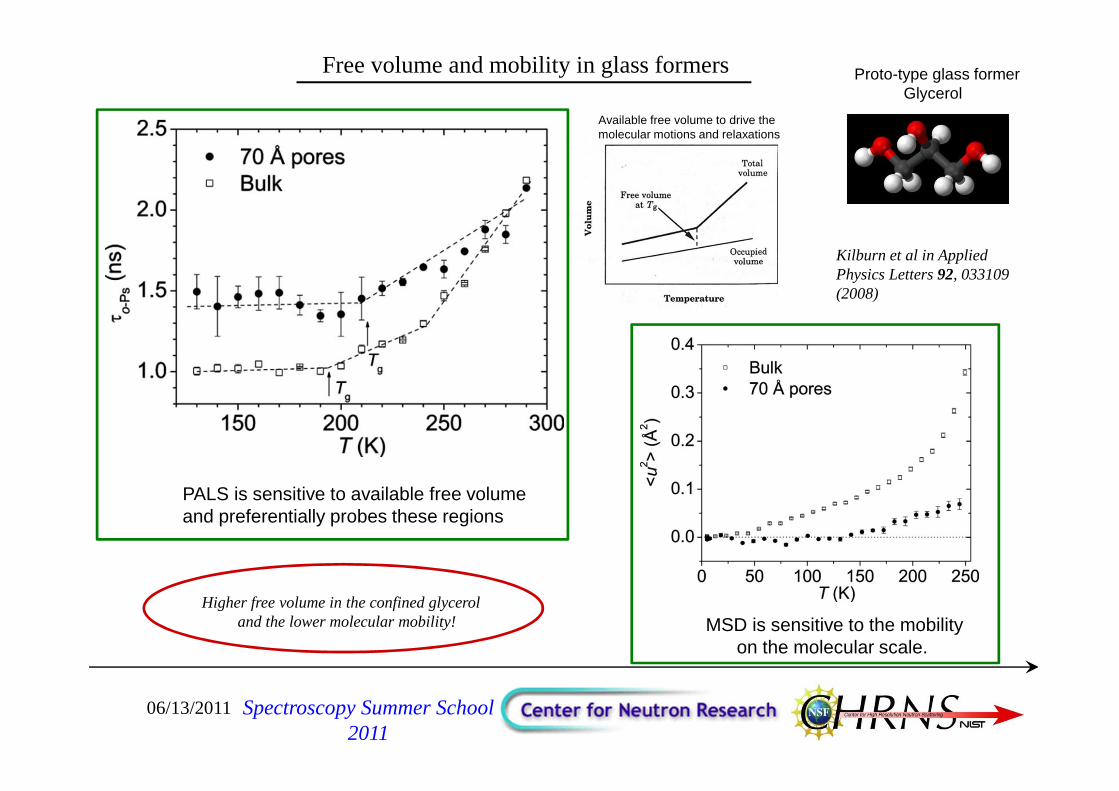
Free volume and mobility in glass formers Proto-type glass former Glycerol
Available free volume to drive the molecular motions and relaxations
PALS is sensitive to available free volumeand preferentially probes these regions
MSD is sensitive to the mobility on the molecular scale.
Higher free volume in the confined glycerol and the lower molecular mobility!
06/13/2011 Spectroscopy Summer School 2011
Kilburn et al in Applied Physics Letters 92, 033109 (2008)
06/13/2011
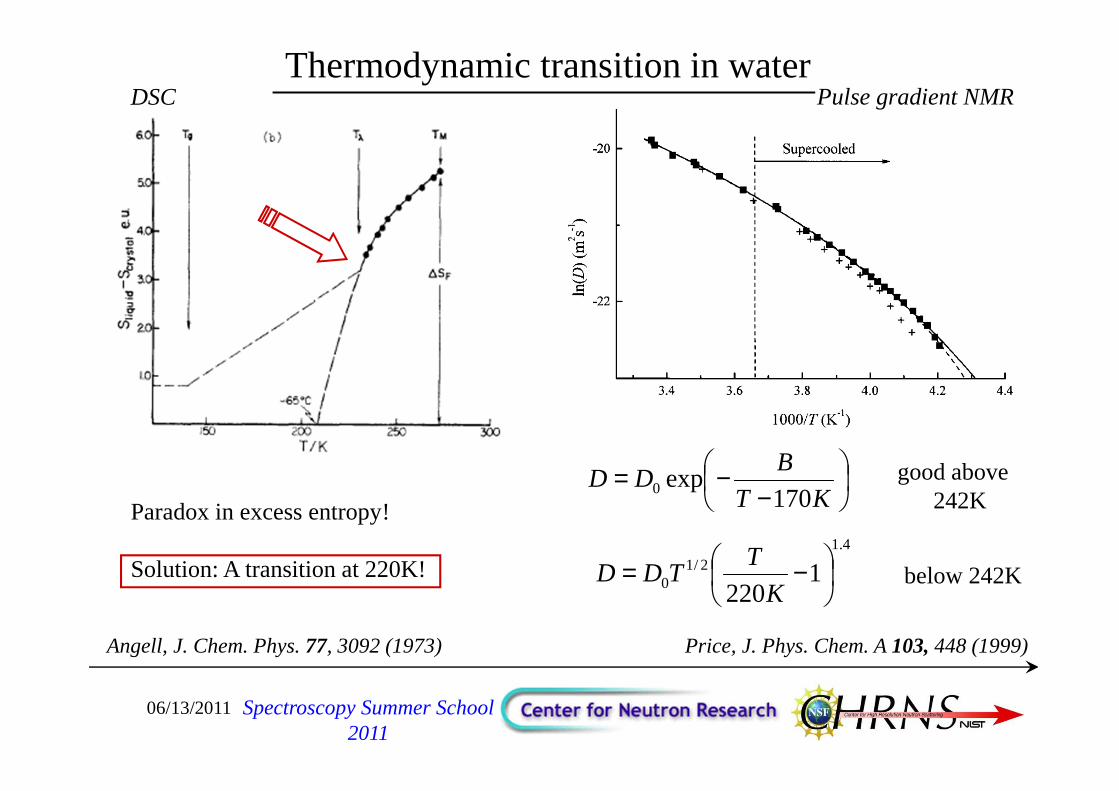
Thermodynamic transition in water
−−=
KT
BDD
170exp0
good above 242K
4.12/1
0 1220
−=K
TTDD below 242K
Paradox in excess entropy!
Solution: A transition at 220K!
Angell, J. Chem. Phys. 77, 3092 (1973)
DSC Pulse gradient NMR
Price, J. Phys. Chem. A 103, 448 (1999)
Spectroscopy Summer School 2011
06/13/2011
−=
00 exp
TT
Bττ
=RT
Eexp0ττ
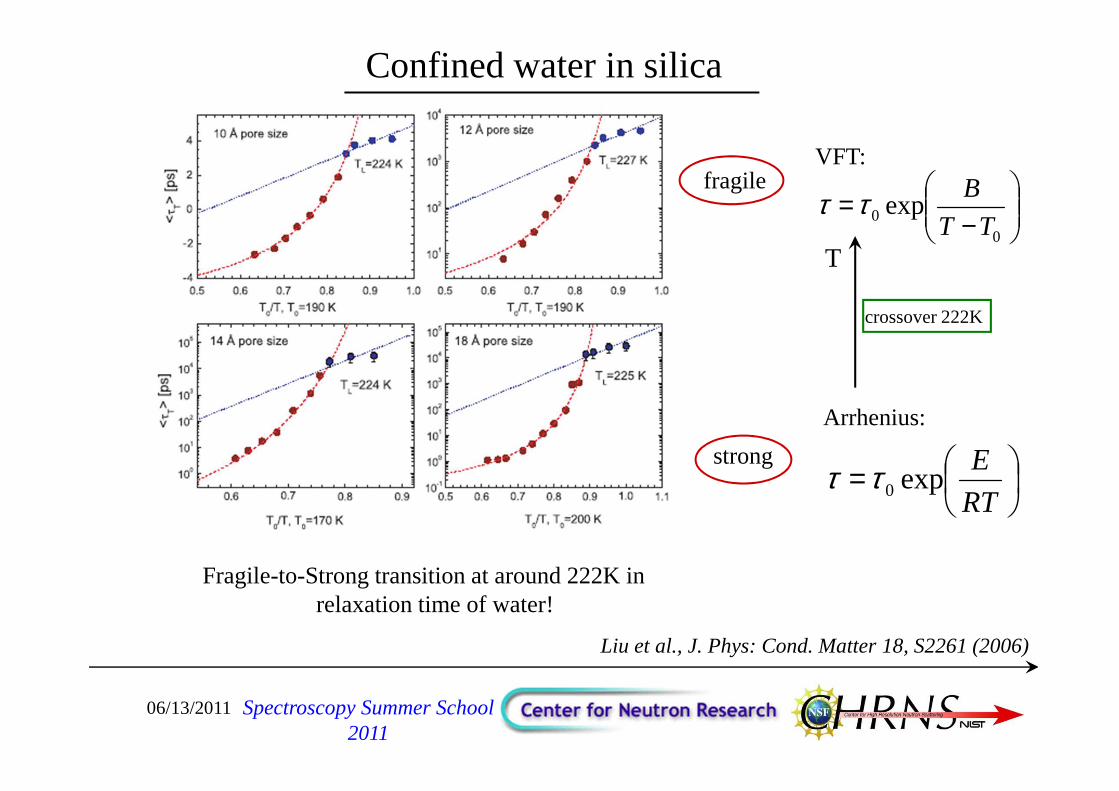
VFT:
Arrhenius:
Fragile-to-Strong transition at around 222K inrelaxation time of water!
Confined water in silica
Liu et al., J. Phys: Cond. Matter 18, S2261 (2006)
T
strong
fragile
crossover 222K
Spectroscopy Summer School 2011
06/13/2011
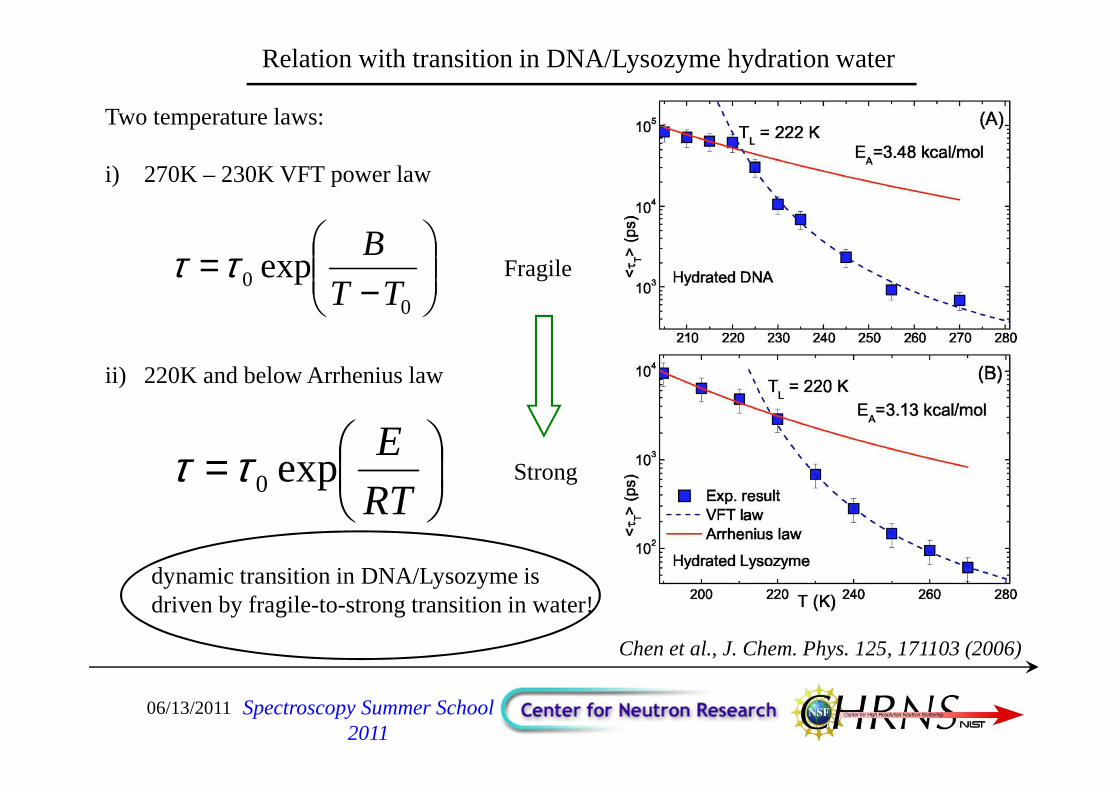
Two temperature laws:
i) 270K – 230K VFT power law
ii) 220K and below Arrhenius law
−=
00 exp
TT
Bττ
=RT
Eexp0ττ
Fragile
Strong
dynamic transition in DNA/Lysozyme is driven by fragile-to-strong transition in water!
Relation with transition in DNA/Lysozyme hydration water
Chen et al., J. Chem. Phys. 125, 171103 (2006)
Spectroscopy Summer School 2011
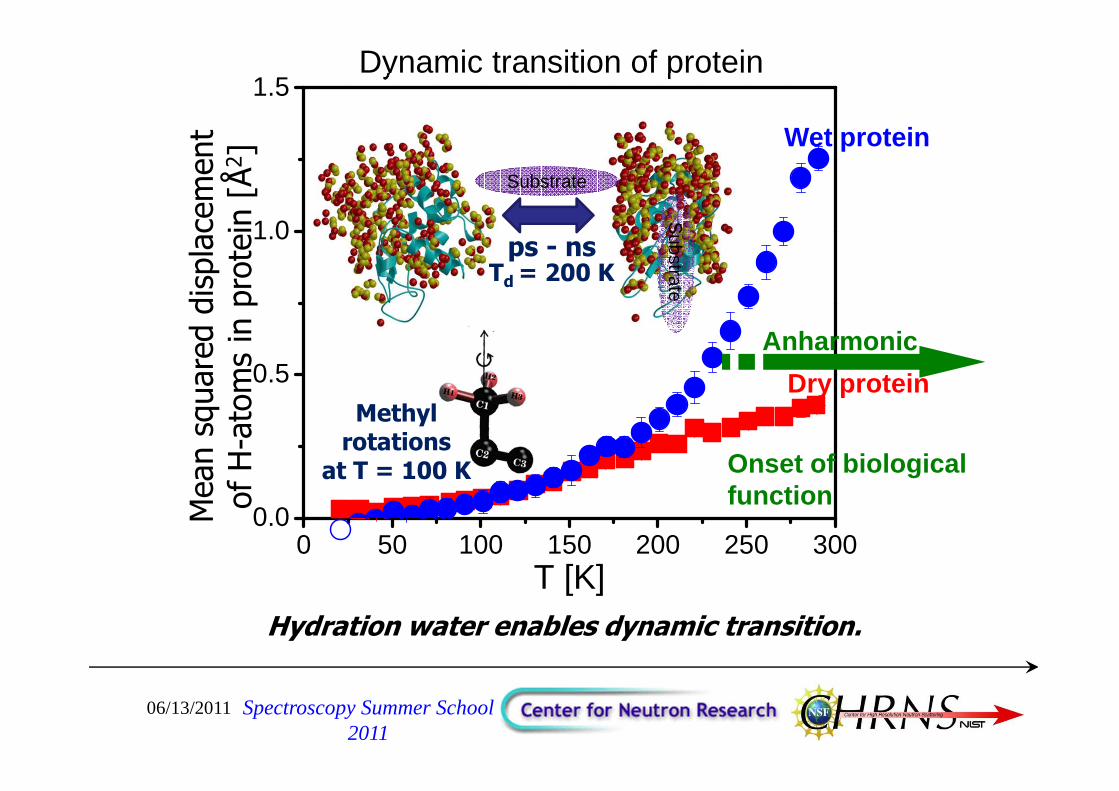
Dynamic transition of protein
ps - nsTd = 200 K
Substrate
SubstrateM
ean
squa
red
disp
lace
men
t of
H-a
tom
s in
pro
tein
[Å
2 ]
Methyl rotations
at T = 100 K
0 50 100 150 200 250 3000.0
0.5
1.0
1.5
T [K]Hydration water enables dynamic transition.
Wet protein
Dry protein
Anharmonic
Onset of biological function
06/13/2011 Spectroscopy Summer School 2011
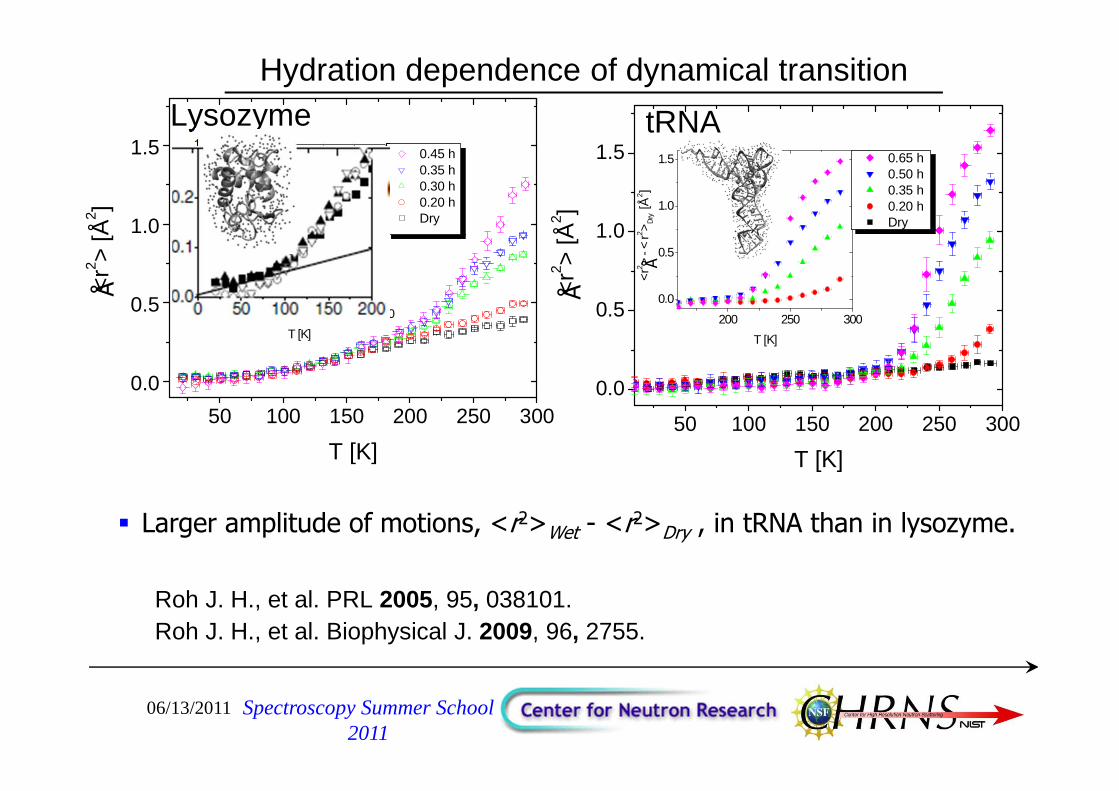
Hydration dependence of dynamical transition
50 100 150 200 250 300
0.0
0.5
1.0
1.5
200 250 300
0.0
0.5
1.0
1.5
<r2
> - <
r2 >D
ry [Å
2 ]
T [K]
0.65 h 0.50 h 0.35 h 0.20 h Dry
tRNA
<r2 >
[Å2 ]
T [K]
50 100 150 200 250 300
0.0
0.5
1.0
1.5
200 250 300
0.0
0.5
1.0
<r2
> - <
r2 > Dry [Å
2]
T [K]
Lysozyme
<r2 >
[Å2 ]
T [K]
0.45 h 0.35 h 0.30 h 0.20 h Dry
� Larger amplitude of motions, <r2>Wet - <r2>Dry , in tRNA than in lysozyme.
Å ÅRoh J. H., et al. PRL 2005, 95, 038101. Roh J. H., et al. Biophysical J. 2009, 96, 2755.
Å
Å
06/13/2011 Spectroscopy Summer School 2011
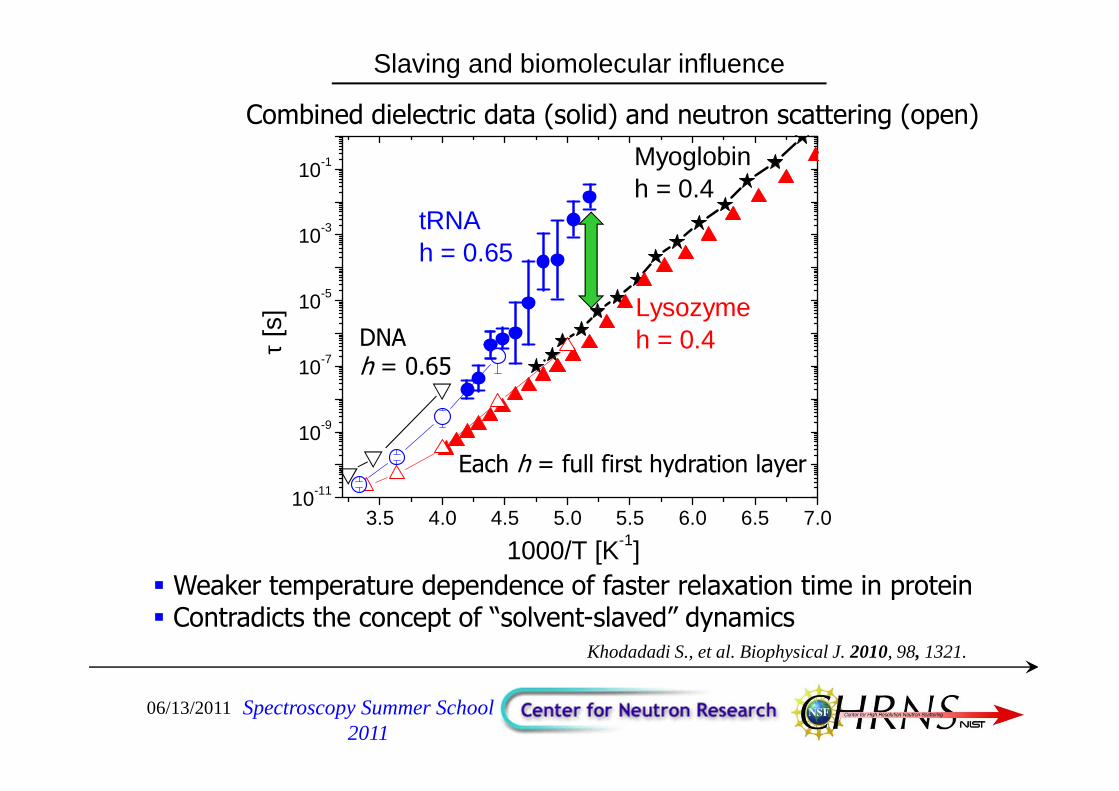
Slaving and biomolecular influence
3.5 4.0 4.5 5.0 5.5 6.0 6.5 7.010-11
10-9
10-7
10-5
10-3
10-1 Myoglobinh = 0.4
tRNAh = 0.65
Lysozymeh = 0.4
τ [s
]
1000/T [K-1]
Combined dielectric data (solid) and neutron scattering (open)
� Weaker temperature dependence of faster relaxation time in protein� Contradicts the concept of “solvent-slaved” dynamics
Each h = full first hydration layer
Khodadadi S., et al. Biophysical J. 2010, 98, 1321.
DNAh = 0.65
06/13/2011 Spectroscopy Summer School 2011
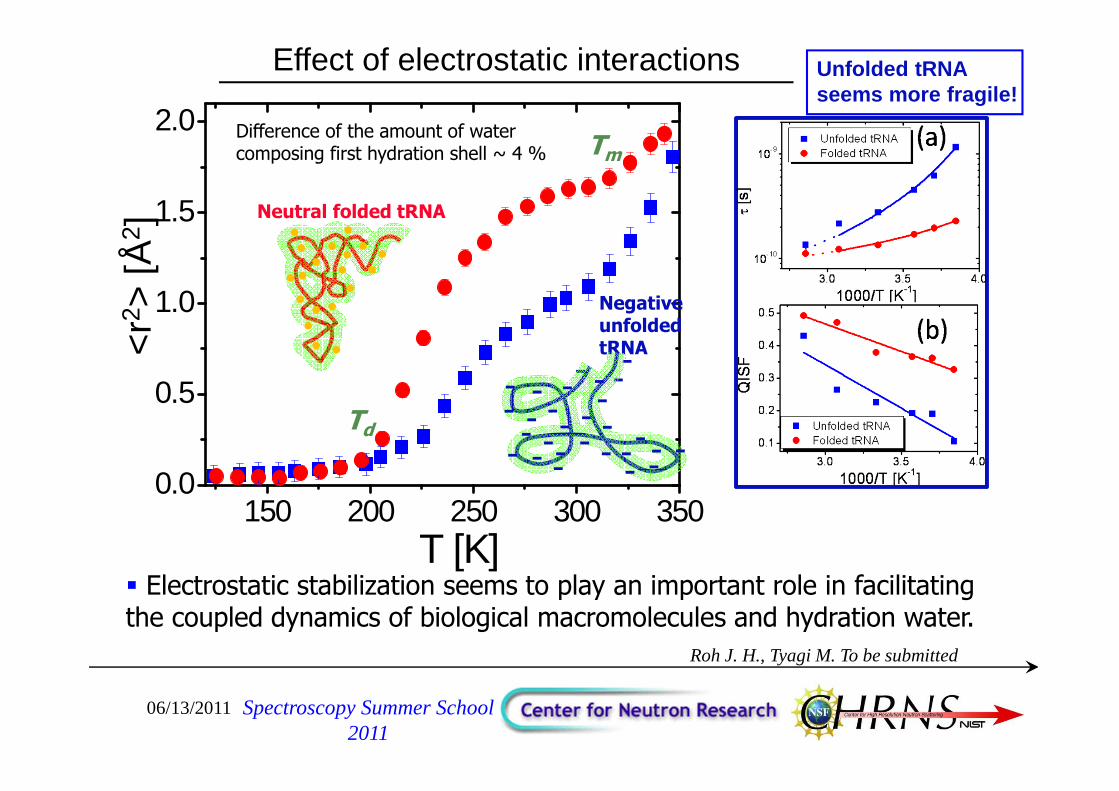
Effect of electrostatic interactions
150 200 250 300 3500.0
0.5
1.0
1.5
2.0
T [K]
Roh J. H., Tyagi M. To be submitted
� Electrostatic stabilization seems to play an important role in facilitating the coupled dynamics of biological macromolecules and hydration water.
Td
Tm<
r2>
[Å2 ]
Neutral folded tRNA
Negative unfolded tRNA
-- ---- -
- - - ------
- --- -- - --- -
-
Difference of the amount of water composing first hydration shell ~ 4 %
Unfolded tRNA seems more fragile!
06/13/2011 Spectroscopy Summer School 2011
06/13/2011
Polymers….
Spectroscopy Summer School 2011
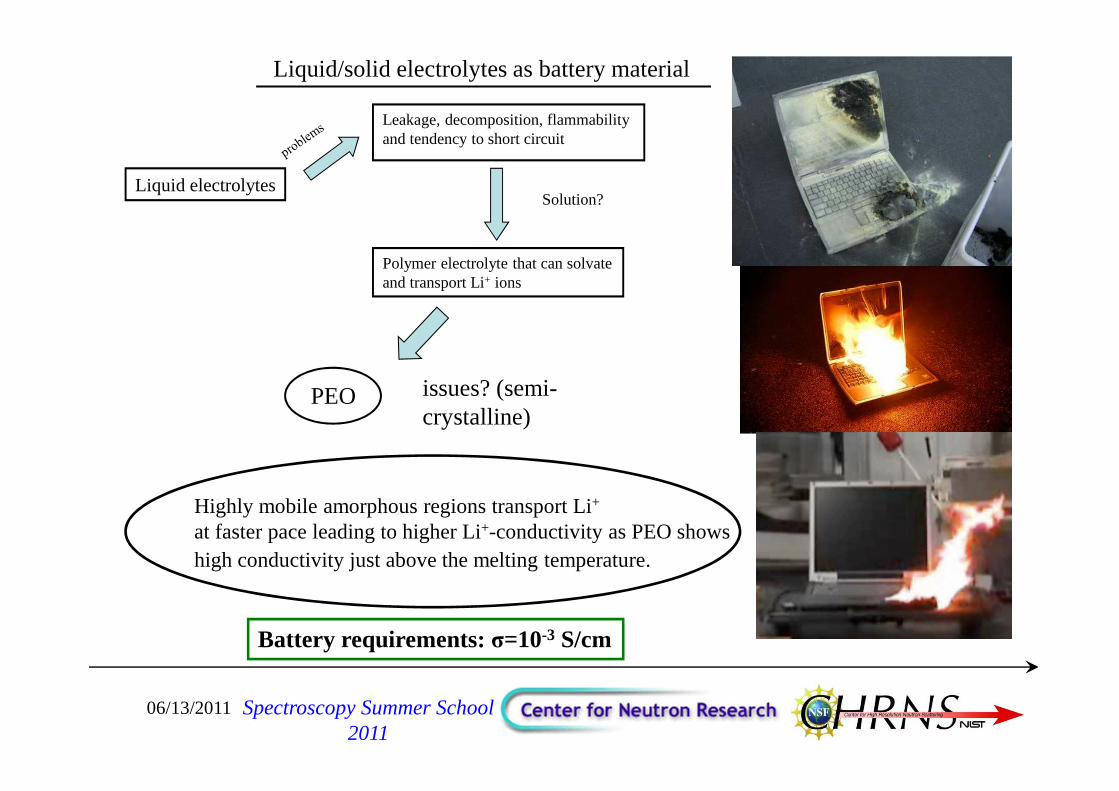
Liquid electrolytes
Leakage, decomposition, flammability and tendency to short circuit
Solution?
Polymer electrolyte that can solvate and transport Li+ ions
PEO
Liquid/solid electrolytes as battery material
Highly mobile amorphous regions transport Li+
at faster pace leading to higher Li+-conductivity as PEO showshigh conductivity just above the melting temperature.
issues? (semi-crystalline)
Battery requirements: σ=10-3 S/cm
06/13/2011 Spectroscopy Summer School 2011
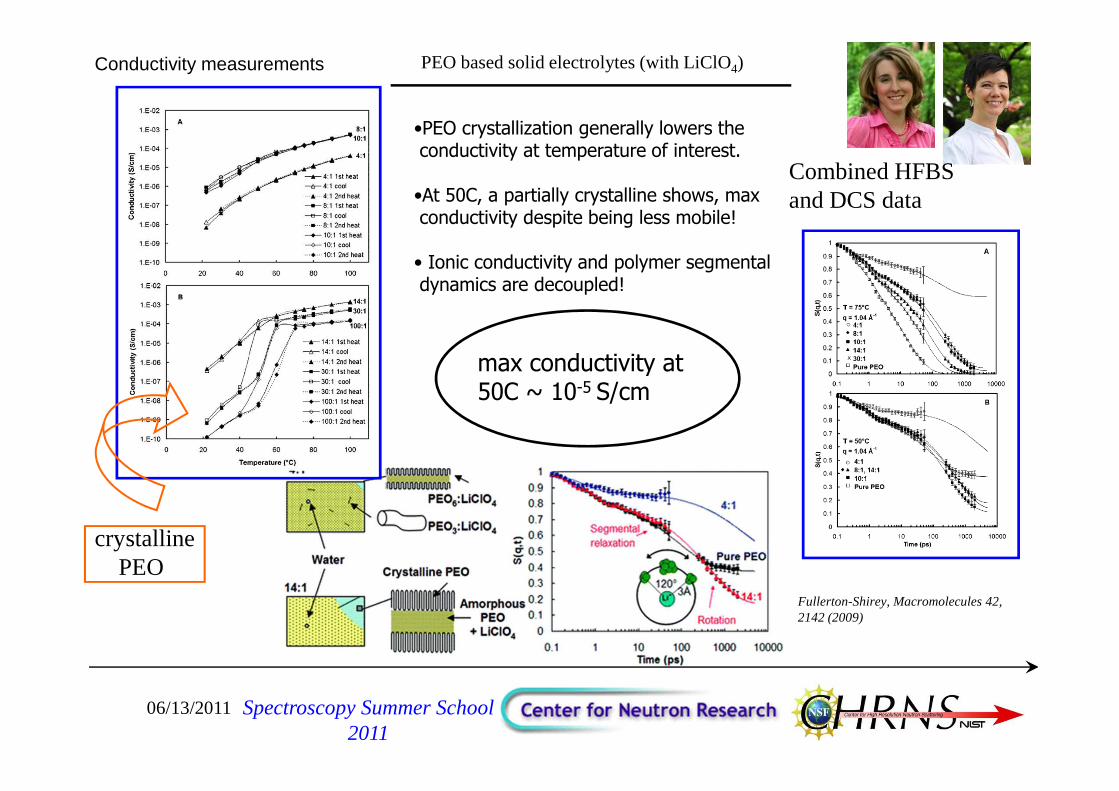
PEO based solid electrolytes (with LiClO4)
Combined HFBS and DCS data
Conductivity measurements
•PEO crystallization generally lowers theconductivity at temperature of interest.
•At 50C, a partially crystalline shows, maxconductivity despite being less mobile!
• Ionic conductivity and polymer segmentaldynamics are decoupled!
max conductivity at 50C ~ 10-5 S/cm
crystallinePEO
Fullerton-Shirey, Macromolecules 42, 2142 (2009)
06/13/2011 Spectroscopy Summer School 2011
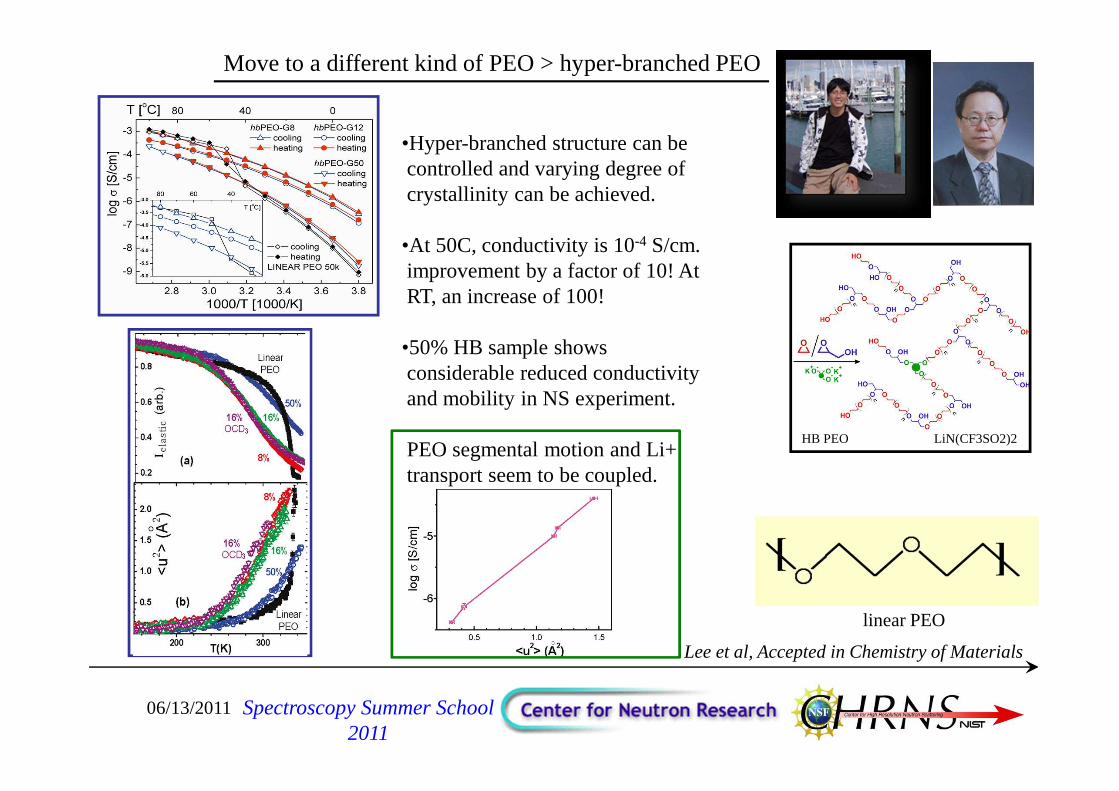
Move to a different kind of PEO > hyper-branched PEO
HB PEO
linear PEO
•Hyper-branched structure can be controlled and varying degree ofcrystallinity can be achieved.
•At 50C, conductivity is 10-4 S/cm.improvement by a factor of 10! At RT, an increase of 100!
•50% HB sample shows considerable reduced conductivity and mobility in NS experiment.
PEO segmental motion and Li+transport seem to be coupled.
Lee et al, Accepted in Chemistry of Materials
06/13/2011 Spectroscopy Summer School 2011
LiN(CF3SO2)2
06/13/2011
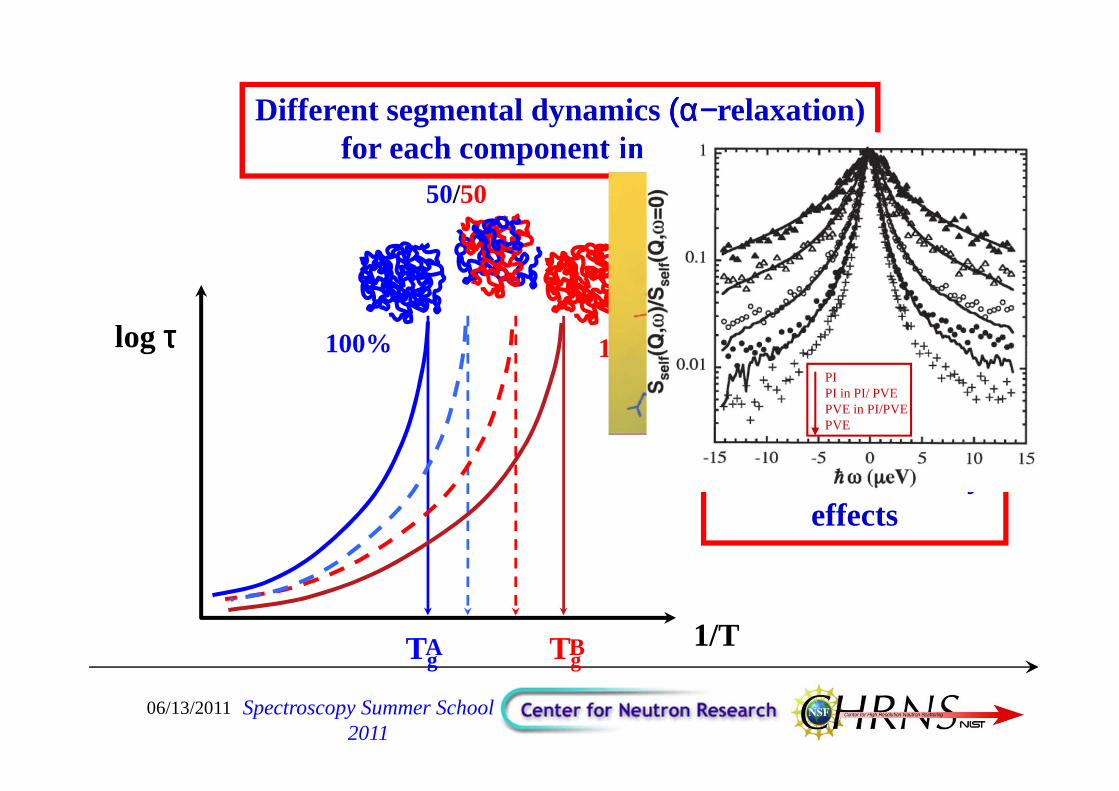
Different segmental dynamics (α(α(α(α−−−−relaxation)for each component in the blend
50/50
100% 100%
1/T
log ττττ
TgA TgB
Chain connectivityeffects
Segmental Dynamics in Polymers and Polymer Blends
PIPI in PI/ PVEPVE in PI/PVEPVE
Spectroscopy Summer School 2011
06/13/2011
-10
-9
-8
380 400 420 440 460 480
∆T=34K
Tg T
g
log[
a(T
)τΜ
(Q=
1Å
-1)(
s)]
blend(DSC)
T,T+∆T (K)
-10
-9
-8
380 400 420 440 460 480
log[
a(T
)τΜ
(Q=
1Å-1
)(s)
]
T, T+∆T (K)
∆T=23K
Tg T
g,eff
PVAc,LML
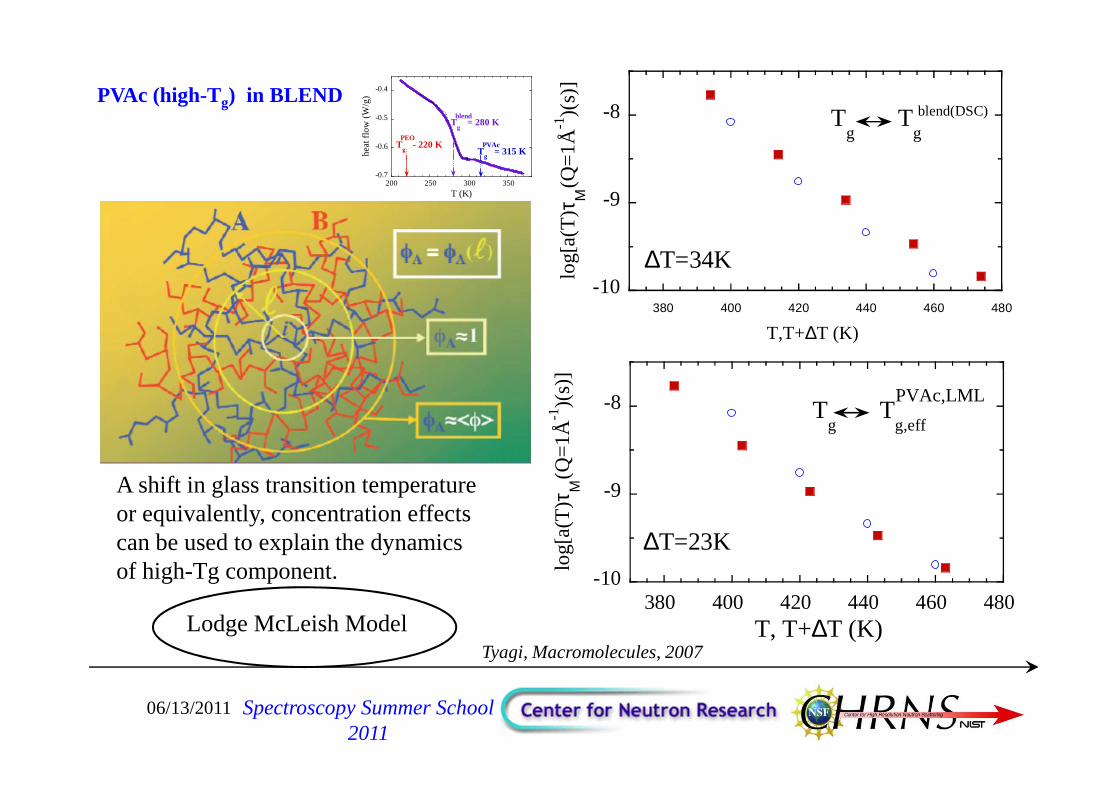
A shift in glass transition temperatureor equivalently, concentration effectscan be used to explain the dynamicsof high-Tg component.
Lodge McLeish ModelTyagi, Macromolecules, 2007
Spectroscopy Summer School 2011
-0.7
-0.6
-0.5
-0.4
200 250 300 350
hea
t flo
w (
W/g
)
T (K)
Tg = 280 K
blend
Tg - 220 K
PEO
Tg = 315 K
PVAc
PVAc (high-Tg) in BLEND
06/13/2011
Backscattering Measurements: PEO in hPEO/dPVAc
Gaussian distribution of log ττττ
1
10 270K290K350K375K400K
σ
-11
-10
-9
-8
-7
0.1 1
log[
τ o(s)]
Q (Å-1)
Q-4
(b)
1
10
100
I(Q
,ω)
(a.u
.)
T = 270 K
Q = 1Å-1
1
10
100T = 290 K
I(Q
,ω)
(a.u
.)
1
10
100T = 350 K
I(Q
,ω)
(a.u
.)
1
10
100
T = 375 K
I(Q
,ω)
(a.u
.)
1
10
100
-15 -10 -5 0 5 10 15
T = 400 K
hω(µeV)
I(Q
,ω)
(a.u
.)
Q-independent timescales at high Q
270K
350K
400K
dynamicconfinement
standardscenario
Spectroscopy Summer School 2011
-0.7
-0.6
-0.5
-0.4
200 250 300 350
hea
t flo
w (
W/g
)
T (K)
Tg = 280 K
blend
Tg - 220 K
PEO
Tg = 315 K
PVAc
PEO (low-Tg) in BLEND
06/03/2010 HFBS/DCS Tutorial
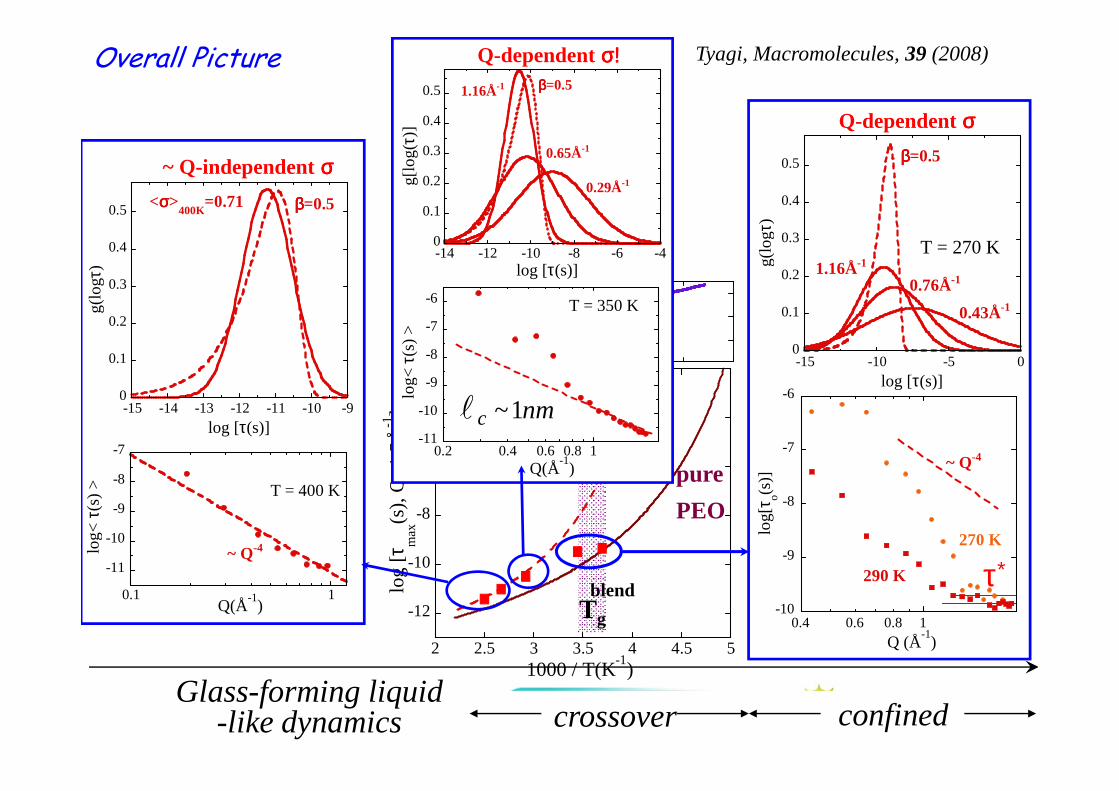
-12
-10
-8
-6
-4
-2
2 2.5 3 3.5 4 4.5 5
log
[τm
ax(s
), Q
~1.
5Å-1]
1000 / T(K-1
)Glass-forming liquid
-like dynamics
0
0.1
0.2
0.3
0.4
0.5
-15 -14 -13 -12 -11 -10 -9
g(lo
gτ)
log [τ(s)]
<σσσσ>400K
=0.71 ββββ=0.5
-11
-10
-9
-8
-7
0.1 1Q(Å
-1)
log
< τ(
s) > T = 400 K
~ Q-4
~ Q-independent σσσσ
pure
PEO
Tg
blend
0
0.1
0.2
0.3
0.4
0.5
-14 -12 -10 -8 -6 -4log [τ(s)]
1.16Å-1
0.65Å-1
0.29Å-1g[lo
g(τ
)]
ββββ=0.5
-11
-10
-9
-8
-7
-6
0.2 0.4 0.6 0.8 1
T = 350 K
log
< τ(
s) >
Q(Å-1
)
l c ~1nm
Q-dependent σ!σ!σ!σ!
τ∗
0
0.1
0.2
0.3
0.4
0.5
-15 -10 -5 0
g(lo
gτ)
log [τ(s)]
ββββ=0.5
1.16Å-1
0.76Å-1
0.43Å-1
T = 270 K
Q-dependent σσσσ
-10
-9
-8
-7
-6
0.4 0.6 0.8 1
log
[τo(s
)]
Q (Å-1
)
~ Q-4
270 K
290 K
crossover confined
Overall Picture Tyagi, Macromolecules, 39 (2008)
06/03/2010 HFBS/DCS Tutorial
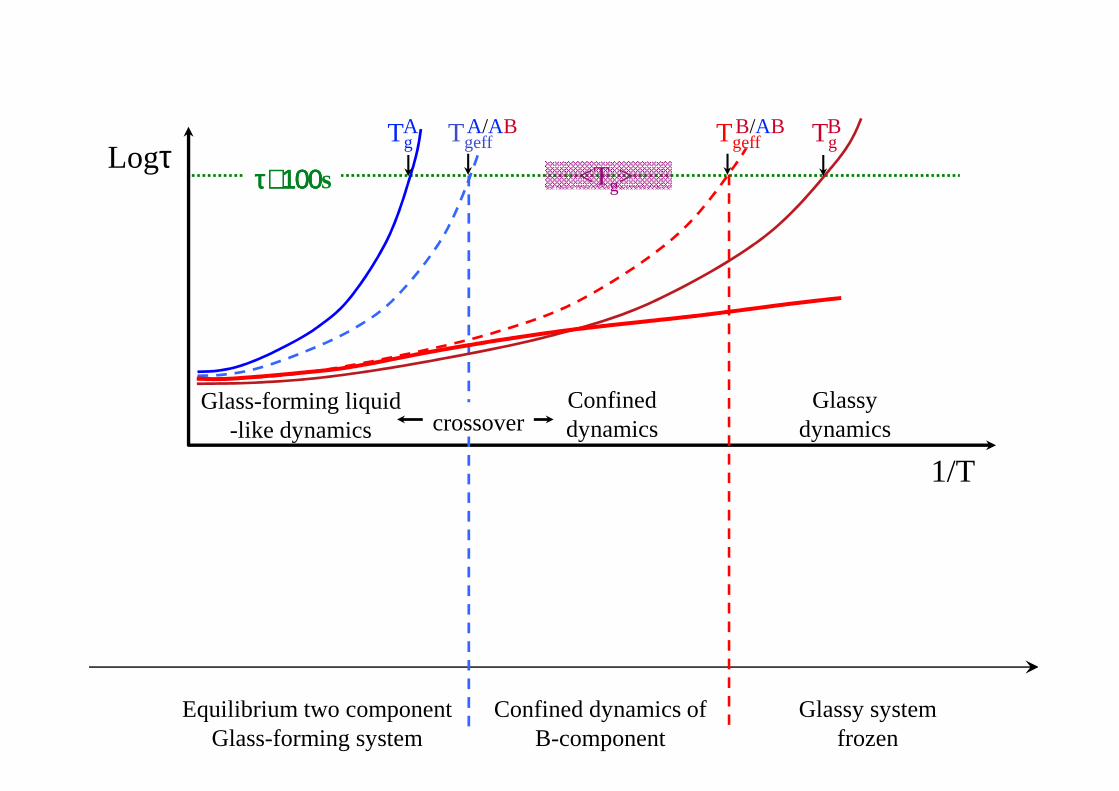
Confinement Effects in Polymer Blends
Logτ
1/T
ττττ∼∼∼∼111100000000s
Glass-forming liquid-like dynamics
Glassydynamics
TgA Tg
B
<Tg>
TgeffA/AB Tgeff
B/AB
Equilibrium two componentGlass-forming system
Confineddynamicscrossover
Confined dynamics of B-component
Glassy systemfrozen
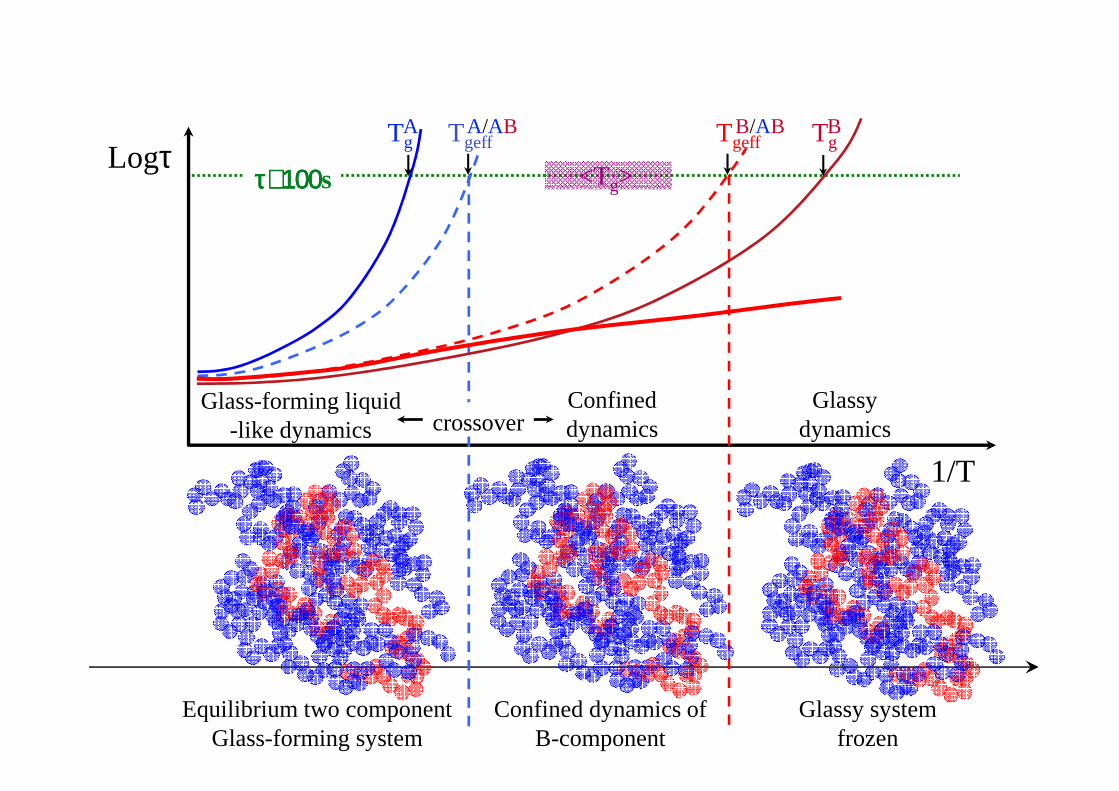
06/03/2010 HFBS/DCS Tutorial
Logτ
1/T
ττττ∼∼∼∼111100000000s
Glass-forming liquid-like dynamics
Confineddynamics
Glassydynamicscrossover
TgA Tg
B
<Tg>
TgeffA/AB Tgeff
B/AB
Equilibrium two componentGlass-forming system
Confined dynamics of B-component
Glassy systemfrozen
Confinement Effects in Polymer Blends
06/13/2011
…even inelastic neutron scattering…
Spectroscopy Summer School 2011
06/13/2011
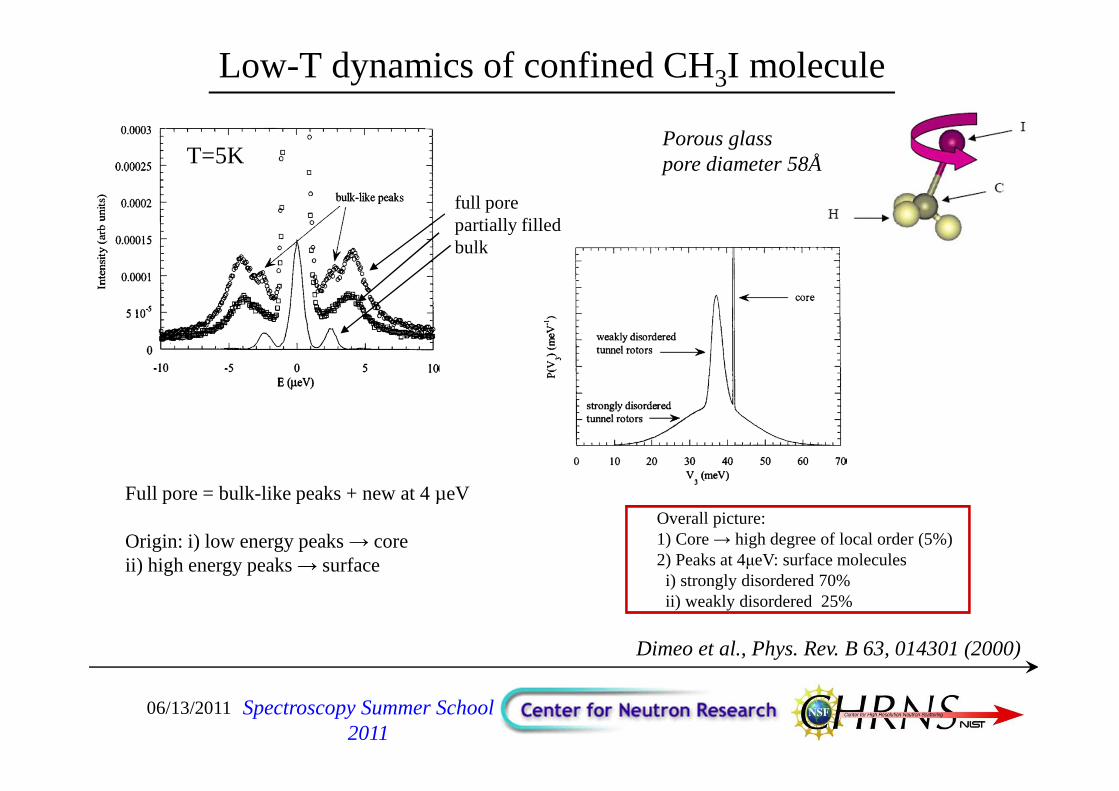
Low-T dynamics of confined CH3I molecule
Full pore = bulk-like peaks + new at 4 µeV
Origin: i) low energy peaks → core ii) high energy peaks → surface
full porepartially filledbulk
T=5K
Dimeo et al., Phys. Rev. B 63, 014301 (2000)
Porous glasspore diameter 58Å
Overall picture:1) Core → high degree of local order (5%)2) Peaks at 4µeV: surface moleculesi) strongly disordered 70%ii) weakly disordered 25%
Spectroscopy Summer School 2011
06/13/2011
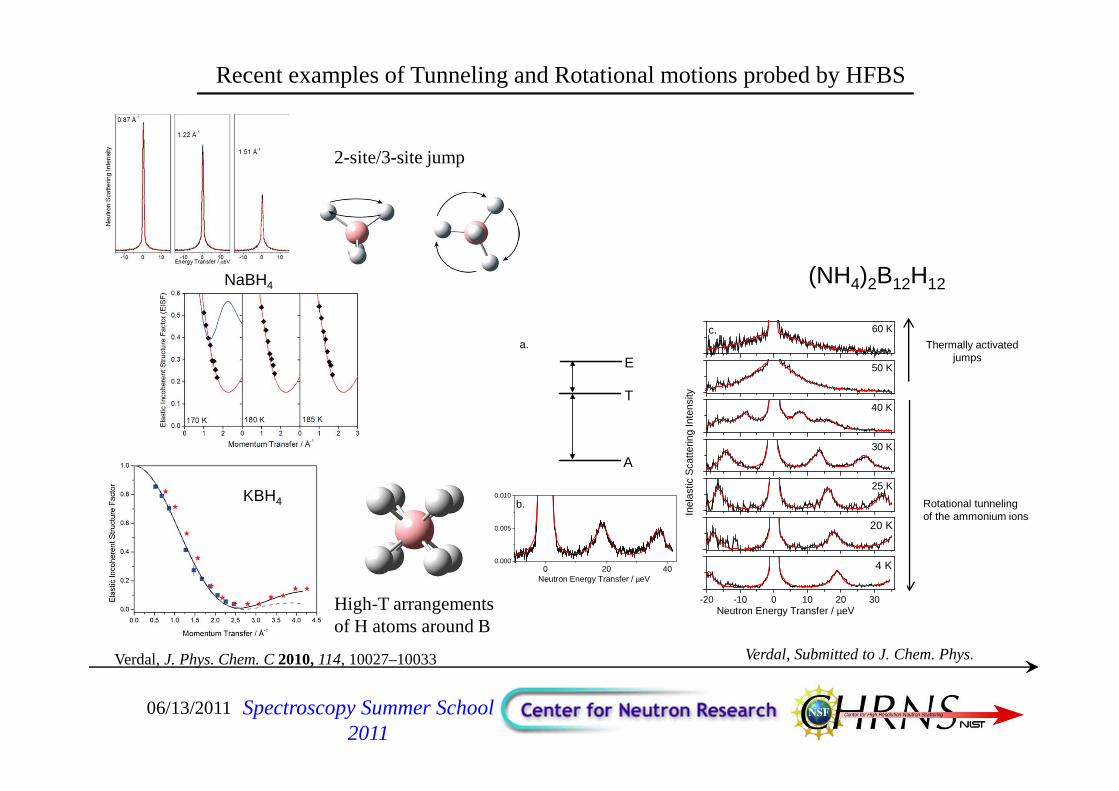
Rotational tunnelingof the ammonium ions
0 20 400.000
0.005
0.010
Neutron Energy Transfer / µeV
a.
b.
c.
A
T
E
-20 -10 0 10 20 30
4 K
20 K
25 K
40 K
30 K
Neutron Energy Transfer / µeV
Inel
astic
Sca
tterin
g In
tens
ity
50 K
60 K
Thermally activatedjumps
NaBH4
KBH4
(NH4)2B12H12
Spectroscopy Summer School 2011
Recent examples of Tunneling and Rotational motions probed by HFBS
2-site/3-site jump
High-T arrangementsof H atoms around B
Verdal, Submitted to J. Chem. Phys.Verdal, J. Phys. Chem. C 2010, 114, 10027–10033
06/13/2011
….Thank you!
Spectroscopy Summer School 2011