Embed Size (px)
Citation preview

MADINAH CPI PROFILE 2018
1
Acknowledgment
Table of contents:
List of Tables………………………………………………………………………...………….
List of Figures …………………………………………………………………………….…....
Abbreviations………………………………………………………………………...…………
Introduction ………………………………………………………………………………….....
Overview of Al Madinah City ………………………………………………………………....
- Historical Background ……………………………………………..…………...............
- Geography and
Location………………………………………..……………………….
- Demographic Background………………………………………..............……………..
- Socio-economic Background………………………………………………..…………..
The City Prosperity Index (CPI) Assessment………………………………………..……….
- Overall City Prosperity Index ………………………………………………………….
- Analysis of the Productivity Index……………………………………………………..
- Analysis of the Infrastructure Development Index…………………………………….
- Analysis of the Quality of Life Index …………………………………………………
- Analysis of the Equity and Social Inclusion Index ……………………………………
- Analysis of the Environmental Sustainability Index…………………………………...
- Analysis of the Urban Governance and Legislation Index……………………………..
- SWOT Analysis based on the City’s Prosperity Index Assessment…………….……...
Local Urban Observatory……………………………………………………………………..
- About Urban Observatories …………………………………………………….……...
- Madina Local Urban Observatory………………………………………………….…..
- Structure of Madina - Local Urban Observatory………………………………….……
- Performance of Madina Local Urban Observatory …………………………………….
References………………………………………………………………………………..……..
List of Tables

2
Table 1: Scale of Urban Prosperity……………………………………………………………...6
Table 2: The Productivity Index ………………………………………………………………..7
Table 3: The Infrastructure Development Index………………………………………………...8
Table 4: The Quality of Life Index ……………………………………………………………..9
Table 5: The Equity and Social Inclusion Index ………………………………………………..10
Table 6: The Environmental Sustainability Index ……………………………………………...11
Table 7: The Urban Governance and Legislation Index ………………………………………..12
Table 8: The SWOT Analysis base on City Prosperity Index Assessment……………………..14
List of Figures
Figure 1: Trends in Population and Household Units (estimates-2010-2025)……………….…4
Figure 2: Land use and Urban Growth Limit…………………………………………………...5
Figure 3: The City Prosperity Index Dimensions ……………………………………………....6
Figure 4: The Productivity Indicators …………………………………………………………..7
Figure 5: The Infrastructure Development Indicators…………………………………………...8
Figure 6: The Quality of Life Indicators………………………………………………………...10
Figure 7: The Equity and Social Inclusion Indicators…………………………………………..11
Figure 8: The Environmental Sustainability Indicators…………………………………………12
Figure 9: Urban Governance and Legislation Indicators………………………………………..13
Abbreviations
KSA Kingdom of Saudi Arabia
CPI City Prosperity Index
LUO Local Urban Observatories
SWOT Analysis Strengths, Weaknesses, Opportunities and Threats Analysis
UN-Habitat United Nations Human Settlements Programme
MOMRA Ministry of Municipality and Rural Affairs
FSCP Future Saudi Cities Programme
GIS Geographic Information System
GUO Global Urban Observatory
NUO National Urban Observatory
MDGs Millennium Development Goals
PI Productivity Index
IDI Infrastructure Development Index
QoLI Quality of Life Index
ESII Equity and Social Inclusion Index
ESI Environmental Sustainability Index
GLI Governance and Legislation Index

3
Introduction
The United Nations Human Settlements Programme (UN-HABITAT) and Ministry of Municipal
and Rural Affairs in the Kingdom of Saudi Arabia (MOMRA) jointly launched UN-HABITAT
Saudi Arabia Programme titled “ Future Saudi Cities Programme (FSCP)”. The UN-HABITAT
Office has been providing technical support to the MOMRA and targets 17 key cities in the
Kingdom of Saudi Arabia. The 17 cities include Riyadh, Makkah, Jeddah, Taif, Medina, Tabuk,
Dammam, Kathef, Ihsa, Abha, Najran, Jazan, Hail, Araar, AlBaha, Buraydah, and Sakaka, to
respond to national and local urban challenges.
Under the FSCP, UN-HABITAT, MOMRA, Madina Municipality and its Local Urban
Observatory has been working on developing urban statistic and spatial information (Geographic
Information System) to provide relevant urban information that strongly supports decision-making
process on urban development and urban planning in the city of Madina.
This CPI Assessment Report is a brief overview of the basic information and data about the City;
it provides an overview of the city’s profile regarding the factors that contribute to its prosperity
including productivity, infrastructure development, equity and social inclusion, environmental
sustainability, and urban governance and legislation.
Overview of Madina City
Al Madinah is the city of the Prophet Muhammad (peace be upon him) and also his burial place.
It is the city whose people supported Prophet Mohammad (peace be upon him) when he
immigrated to it from Makkah. It comprises the Mosque of the Prophet, his grave, the Islamic
University, King Fahd Complex for the Printing of the Holy Quran and many archaeological
Islamic features. The first mosque of Islam is also located in Madinah and is known as Masjid Al
Quba.
Geography and Location of the City
Al Madinah is the capital city of Al Madina region located in Eastern Part of Al Hijaz area in the
north-western part of the Kingdom of Saudi Arabia, about 250Km to the east of the Red Sea. A
number of mountains surround it: Al-Hujaj to the West, Salaa to the north-west, Al-E'er to the
north. Madinah city is on a flat mountain plateau at the junction of the three valleys of Al-Aql, Al-
Aqiq, and Al-Himdh. The city is 620 meters above sea level and covers an area of about 700 square
kilometers. The area has a hot, continental climate. The high-temperature ranges between 36-46
degrees Celsius during the summer months and cold temperatures ranges between 15- 20 degrees
Celsius during winter, while the average temperature in summer is 30oC and 15oC in winter. The
area receives little rain falls with an average of 94mm; the rain does mainly fall between November
and January.

4
Demographic Background of the City
According to the General Authority of Statistics, the total population of Madina was about 1.1
million in 2010, in 2016 it was estimated at 1.278 million with an average annual growth rate of
4.5%. The population density in the city was about 5000 persons per square kilometer. The city
had an estimated total number of households of about 284,000, each with an average household
size of 4.5 persons. Madina region had a population of about 2million in 2013, representing about
6.54% of the total population of the Kingdom. Madina governorate which also comprises Madina
city accounts for 66.6% (1.3 Million) of the total population of the region. The chart in Figure 1
shows the trend and projections of city population and the number of households.
Figure 1: Trends of Estimated City Population & No. of Households
Socio-Economic Background of the City
Al Madina has major historical, religious and economic importance, for its unique location and the
presence of the Holy Prophet’s Mosque. The Prophet’s Mosque and his sacred tomb attract
millions of pilgrims to visit the city every year, making Madina one of the tourism cities in the
Kingdom. The large volume of the consumer market due to the large numbers of visitors to the
Holy Prophet Mosque is very important. Madina Industrial city also makes it an industrial
economy, the number of factory workers in Madina region was about 32,500 in 2013 representing
around 3.9% of the total industrial manpower in the Kingdom which amounted to 828,000 by the
end of 20131. Madina region has a good network of roads and bridges connecting its major cities,
industrial and commercial facilities, and linking the region to the neighboring areas. Trade is one
of the key sectors in Madina because of the vital economic and productive activities in the city and
they are linked to the rest of the region. The mining and quarrying is a significant sector of the
economy, the exploitation of the natural resources in the region serves the needs of the construction
1 Economic report, Madina region 2014 (SAGIA).
0
200000
400000
600000
800000
1000000
1200000
1400000
1600000
1800000
2010 2012 2014 2016 2018 2020 2022 2024
Estimated City Population Estimated Number of household

5
and industrial sectors with raw materials. The agricultural sector is also one of the most important
economic sectors in the region due to the presence of fertile soil around Madina. In 2011, the total
crop area was about 27.5 thousand hectares, representing about 3.5% of the total crop area in the
Kingdom, which amounted to 788 thousand hectares in the same year.
The trend in Urban Growth and Existing Spatial Plans
Al - Madinah city is the largest and most important urban center in the Al Madinah region. Its
religious significance makes it one of the most visited places in the Islamic world, it receives over
8 million Muslim pilgrims each year. The city has been expanding rapidly since the 1970s, due to
the rapid growth, the government has invested heavily in the physical infrastructure which has
attracted labor from all over the Kingdom and other countries resulting into further growth of the
city. The population growth exerted pressure on the boundaries creating more demand for land
leading to an explosion in land subdivision. The land subdivision is considered the main process
by which rural land is converted to urban land. The land has been subdivided with diminutive
reference to the rate of development or occupancy, which has resulted in an enormous proportion
of the subdivided plots remaining vacant and this has resulted into urban sprawl.
Figure 2: Land use and urban growth limits.
The figure above is showing the trend of urban growth limit control and land use for the city of
Al Madinah.

6
City Prosperity Index (CPI) Assessment
Prosperity implies success, wellbeing, thriving conditions, safety and security, long life etc.
Prosperity in cities, therefore, is about successfully meeting today’s needs without compromising
tomorrow and working together for a smart, competitive economy, in a socially inclusive society
and a healthy, vibrant environment for individuals, families, and communities. Prosperity in cities
is a process and cities can be at different levels of prosperity. In order to measure the level and
also track how cities progress on the path to becoming prosperous, UN-Habitat introduced a
monitoring framework: The Cities Prosperity Index (CPI). The CPI is a composite index with six
carefully selected dimensions that captures all important elements of a prosperous city. This index
along with a conceptual matrix, The Wheel of Urban Prosperity and a Global Scale of City
Prosperity, are intended to help city authorities, decision-makers, partners and other stakeholders
to use existing evidence and formulate clear policy interventions for their cities.
Figure 2: Scale of Urban Prosperity and the Wheel of Urban Prosperity
The UN-Habitat’s Cities Prosperity Index (CPI) allows authorities and local groups to identify
opportunities and potential areas for action or adjustments in order to make their cities more
prosperous. The CPI is a multidimensional framework that integrates several dimensions and
indicators that are not only related but have a direct and indirect influence on in regard to fostering
prosperity in cities. These components are embodied in the following six dimensions: Productivity,
Infrastructure Development, Quality of life, Equity and social inclusion, Environmental
sustainability, and Governance and legislation. Each of the dimensions is comprised of several
indicators measured differently. Since the indicators are measured in different units, the first step
in the index computation involves the normalization of the indicators into values ranging between
0 and 12; the normalized values are then aggregated stepwise to create the single value called the
City Prosperity Index.
2 Can also be expressed in percentages so that values range between 0% and 100%, as used in this report.

7
The following sections apply the CPI framework, the concept of the Wheel of Urban Prosperity
and the Scale of Urban Prosperity to conduct an assessment of the level of prosperity in the city.
The assessment provides an indication of the strengths or weaknesses in the factors of prosperity
(in reference to the scale of urban prosperity); it also provides an indication of the level of
achievement towards the set prosperity goals (based on the magnitude of the CPI scores); and
highlights whether there are disparities between and within the six dimensions of prosperity (based
on the concept of the Wheel of Urban Prosperity-stressing balance). An in-depth analysis of the
findings will help to identify which particular sub-dimensions and indicators contribute to high or
low values in each of the dimensions and the CPI scores.
The Overall City Prosperity Index for Madina
The overall CPI index is the aggregate of the six dimensions. The radar chart in Figure 3 shows
the scores for each of the six dimensions as represented by the blue line. The city of Madina has
an overall index score of 54.1%, according to the global scale of urban prosperity the city is having
a moderately weak factor of productivity; in the chart, it is represented by the orange line. The
shape of the blue line indicates the presence of disparity between the dimensions, cities are better
off with high scores and fewer disparities between and within the dimensions. The observed
weakness is an indication that the city has some weak factors within its dimensions, these factors
should be identified and improved. The advantage of having a balanced city is that at whatever
level of prosperity, no segment of the city population or area suffers extreme deprivations. For this
reason, it is sometimes advisable that strong factors can be maintained while improving extremely
low factors to acceptable levels.
Figure 3: City Prosperity Index Dimensions
43.0%
66.9%
65.1%
45.0%
65.1%
45.7%
Productivity
Infrastructure
Development
Quality of Life
Equity and Social
Inclusion
Environmental
Sustainability
Urban Governance
and Legislation

8
The analysis in the following sections will dig deeper into all the six dimensions individually to
identify areas of strengths and weaknesses to enable the design of appropriate interventions.
The Productivity Dimension
Productivity is about how cities generate income or create wealth. The productivity dimension
measures how a city contributes to economic growth and development, employment creation and
availability of equal opportunities to the city dwellers. The findings show that the productivity
index for the Madina City is 43.0% which is weak according to the global scale of prosperity. The
weak rating implies that some of the city’s productivity factors are very weak. The table below
shows that only economic growth sub-dimension (63.7%) is moderately strong, all the remaining
sub-dimensions such as employment (48.4%) and economic agglomeration (16.9%) are weak.
Economic agglomeration measures the spatial distribution of the outcomes of productivity or the
benefits of prosperity.
Table 2: Productivity Index (43.0%)
Sub-Dimension Indicator Actual Units Standardized Comments
Economic Growth
(63.7%)
City Product per Capita 26,570.67 USD
(PPP)/Inhab
71.9% Strong
Mean Household Income 20,482.66 USD(PPP) 36.8% V. Weak
Old Age Dependency
Ratio
4.65 %
82.2% V. Strong
Employment (48.4%)
Employment to
Population Ratio
33.50 %
6.7% V. Weak
Informal Employment 17.40 % 90.0% V. Strong
Unemployment Rate 7.80 % 48.4% Weak
Economic
Agglomeration (16.9%)
Economic Density 144,990,717 USD
(PPP)/km2
16.9% V. Weak
The following indicators are too low and need to be prioritized for in-depth analysis and
subsequent improvements, mean household income, employment to population ratio,
unemployment rate, and economic density. By addressing these indicators, the productivity of the
city should move from weak to strong. Figure 4 shows the levels for each indicator and line for
the dimensional index.

9
Figure 4: Productivity Indicators
The Infrastructure Dimension
Urban infrastructure plays a central role in the proper functioning of a city and community.
Infrastructure ensures delivery of public health services, safety and security, supports the local
economic development and contributes toward the delivery of other basic public services to the
community. The benefits of a functional basic urban infrastructure, therefore, are overwhelmingly
community-wide. The infrastructure dimension measures how a city uses available resources to
provide a functional and efficient basic infrastructure, physical assets and amenities. Basic services
such as piped water, sanitation, power supply, road network, and information and communications
technology are required to sustain the population, for economic development, and a better quality
of life. The statistics in table 3 indicates that the city has a moderately strong infrastructure
development index score of 66.9%. Among the weak sub-dimensions are social infrastructure with
27.4% and ICT with 59%. Nevertheless, the city enjoys a strong housing infrastructure with 76.2%,
Urban Mobility infrastructure with 88.6% and street connectivity infrastructure with 83.3%. The
urban mobility infrastructure with 88.6% excludes the mass public transport system and the use of
public transport which are still unavailable in the city (0%), however, if the two indicators are
included the urban mobility infrastructure score reduces to 53.2%. This clearly shows how
important mass public transport system is. Mass transit system refers to public shared
transportation, such as Trains, BRT, etc. that can commute a larger number of passengers from
origin to destination on a nonreserved basis and in lesser time. Cities of the 21 century and beyond
grow to astronomical sizes in population and require public transport systems that can transport a
large number of passengers fast.
71.9%
36.8%
82.2%
6.7%
90.0%
48.4%
16.9%
City Product per
Capita
Mean Household
Income
Old Age
Dependency
Employment to
Population ratio
Informal
Employment
Unemployment
Rate
Economic Density
Economic Strenght Employment Economic
Agglomeration

10
Table 3: Infrastructure Development Index (66.9%)
Sub-Dimension Indicator Actual Units Standardized Comments
Housing Infrastructure
(76.2%)
Access to Electricity 100.00 % 100.0% V. Strong
Access to Improved Sanitation 57.80 % 57.8% M. Weak
Access to Improved Water 85.90 % 85.9% V. Strong
Access to Improved Shelter % -
Population Density 5,583.87 Inhab/Km2 37.2% V. Weak
Sufficient Living Area 100.00 % 100.0% V. Strong
Social Infrastructure
(27.4%)
Number of Public Libraries 0.07 #/100,000
inhab.
0.0% V. Weak
Physician Density 2.46 #/1,000 inhab. 54.8% M. Weak
ICT (59.0%)
Average Broadband Speed 9.55 Mbps 44.8% Weak
Home Computer Access 77.20 % 77.2% Strong
Internet Access 55.00 % 55.0% M. Weak
Urban Mobility (88.6%)
Average Daily Travel Time 19.80 minutes 100.0% V. Strong
Affordability of Transport 2.10 % 100.0% V. Strong
Length of Mass Transport
Network
Km/1M Inhab.
- -
Road Safety (traffic fatalities) 12.36 #/100,000
inhab.
62.1% M. Strong
Use of Public Transport - % - -
Street Connectivity
(83.3%)
Intersection Density 153.80 #/km2 100.0% V. Strong
Land Allocated to Streets 27.19 % 70.6% Strong
Street Density 15.85 Km/KM2 79.3% Strong
The main sources of weaknesses in this dimension includes the social infrastructure with 27.4%,
it has very weak rating mainly because all indicators associated with it are weak, for example, the
city has a very small number of public libraries and inadequate medical personnel relative to it's
large and rapidly growing population. The ICT infrastructure with 59% is moderately weak as
well, this is mainly because of the low internet access (55%) and low internet speeds (44.8%). The
housing infrastructure is strong mainly because it has three very strong indicators and two weak
ones. The street connectivity infrastructure is the most stable with all its indicators having scores
above 70% or at least strong. Figure 5 shows the levels for each indicator and line for the
dimensional index.

11
Figure 5: Infrastructure Development Indicators
The Quality of Life Dimension
The quality of life is about happiness, well-being and a sense of security in the society, the quality
of life index is a measure of the level of achievement a city has made in the provision of important
services and facilities that directly affect the well-being of individuals and the society at large.
Such services and facilities may include social services, education, health, recreation, safety, and
security, etc. Although the quality of life index for the city is moderately high (65.1%), it has some
elements of weaknesses especially in the education and public spaces sub-dimensions whose
scores as shown in table 4 corresponds to moderately weak and very weak ratings respectively.
Conversely, the main sources of strength in the quality of life dimension are the healthcare
provision with 72.2% and the safety and security with 98.7%.
Table 4: Quality of Life Index (65.1%)
Sub-Dimension Indicator Actual Units Standardized Comments
Health Care
(72.2%)
Life Expectancy at Birth 74.30 years 73.4% Strong
Eradicate Maternal Mortality
12.05 #/100,000 live
births
64.4% M. Strong
Eradicate Under-5 Mortality 17.70 #/1000 live births 52.8% Weak
Vaccination Coverage 98.10 % 98.1% V. Strong
Education (59.4%)
Early Childhood Education 4.78 % 4.8% V. Weak
Net Enrolment in Higher Education 45.10 % 45.1% Weak
Literacy Rate 93.00 % 91.9% V. Strong
Mean Years of Schooling 13.40 % 95.7% V. Strong
Safety and Security
(98.7%)
Homicide Rate 1.10 #/100,000 inhab. 100% V. Strong
Theft Rate 34.20 #/100,000 inhab. 97.3% V. Strong
Public Space
(30.4%)
Green Area per Capita 4.56 m2 / inhabitant 30.4% V. Weak
Accessibility to Open Public Space - % - -
Increasing the level of quality of life would require that focus be directed to extremely weak
indicators such as the early childhood education programmes, Under-five mortality, net enrolment
in higher education and access to public spaces especially the green area per capita. Figure 7 shows
the levels for each indicator and line for the dimensional index.
100.0%
57.8%
85.9%
0.0%
37.2%
100.0%
0.0%
54.8%
44.8%
77.2%
55.0%
100.0% 100.0%
0.0%
65.9%
0.0%
100.0%
70.6%
79.3%
Access to
Electricity
Access to
Improved
Sanitation
Access to
Improved
Water
Improved
Shelter
Population
Density
Sufficient
Living Area
Number of
Public
Libraries
Physicians
Density
Average
Broadband
Speed
Home
Computer
Access
Internet
Access
Average Daily
Travel Time
Affordability
of Transport
Length of
Mass
Transport
Network
Traffic
Fatalities
Use of Public
Transport
Intersection
Density
Land
Allocated to
Streets
Street Density
Housing Infrastructure Social Infrastructure ICT Urban Mobility Street Connectivity

12
Figure 6: Quality of Life Indicators
The Equity and Social Inclusion Dimension
Cities which care about people who are most at risk of exclusion, including the youth, children,
women and poor people from diverse backgrounds, are said to be inclusive cities. They work for
everyone. In the 21 century and beyond cities should be inclusive and ensure resources are
distributed equitably among all citizens. No matter how rich a city may be, whether it has high
average income or good infrastructure, cities with large segments of the population living in
deprivation cannot be said to be prosperous, for lack of a shared prosperity. In this respect, the
Holy City of Madina is not doing well, its ESI index is 45%. According to the global scale of
prosperity, the dimension is weak. Since the two sub-dimensions of economic inclusion and gender
inclusion are both moderately strong with 64.7% and 64.2% respectively, this general poor
performance can be associated with the extremely low scores in social inclusion sub-dimension
with 6%. However, all the three sub-dimensions are not yet very strong so they need to be
improved.
Table 5: Equity and Social Inclusion Index (45.0%)
Sub-Dimension Indicator Actual Units Standardized Comments
Economic Inclusion
(64.7%)
Gini Coefficient - - -
Poverty Rate 2.90 % 64.7% M. Strong
Social Inclusion
(6.0%)
Slum Households - % - -
Youth Unemployment 55.30 % 6.0% V. Weak
Gender Inclusion
(64.2%)
Equitable Secondary School
Enrollment 0.89 0 - ∞ 89.0% V. Strong
Women in local government 40.30 % 80.60% V. Strong
Women in the workforce 11.50 % 23.0% V. Weak
In general, the city of Madina has more strong factors of equity and inclusion than the weak factors.
Nonetheless, the city should increase the number of women in the workforce and improve the
economic integration aspect to put the city on its path to an equitable, inclusive and prosperous
city. Figure 7 shows the levels for each indicator and line for the dimensional index.
73.4%
64.4%
52.8%
98.1%
4.8%
45.1%
91.9%95.7%
100.0%97.3%
30.4%
0.0% 0.0%
Life
Expectancy at
Birth
Reduced
Maternal
Mortality
Reduced
Under-5
Mortality
Rate
Vaccination
Coverage
Early
Childhood
Education
Programme
Net
enrollment
rate in higher
education
Literacy Rate Mean Years
of Schooling
Reduced
Homicide rate
Reduced
Theft rate
Green area
per capita
Accessibilty
to Open
Public Area
Public Space
for Youth
Health Education Safety and Security Public Space
13
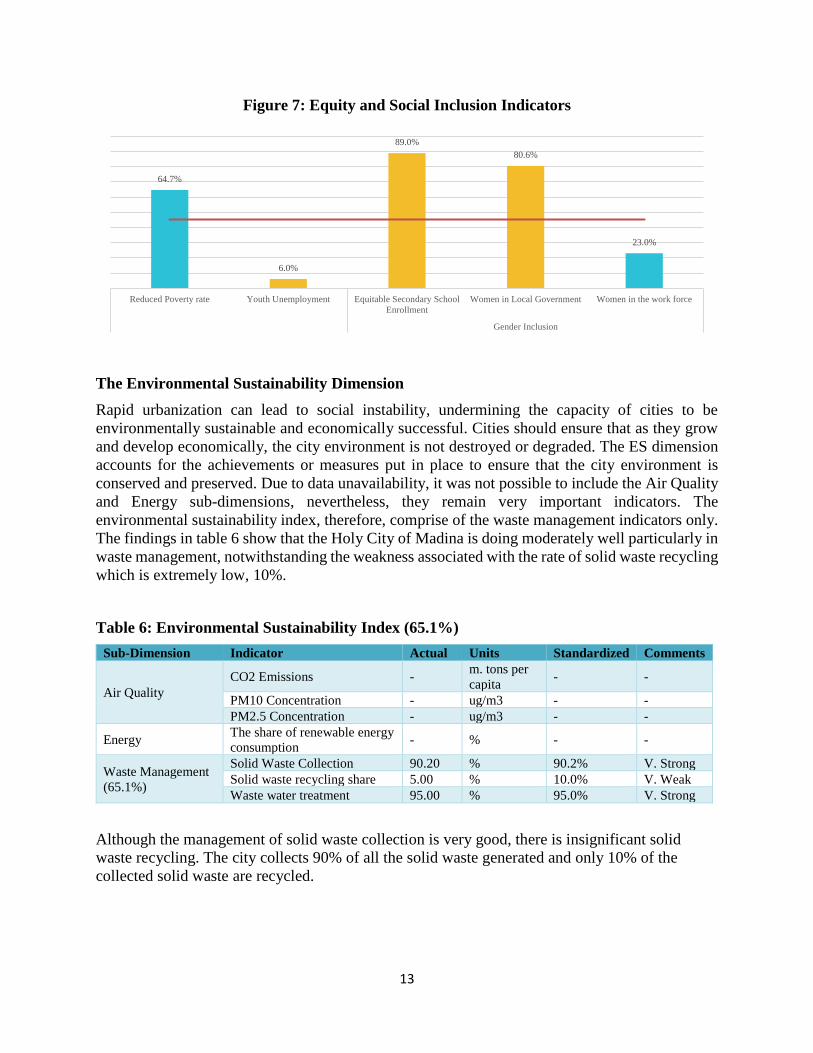
Figure 7: Equity and Social Inclusion Indicators
The Environmental Sustainability Dimension
Rapid urbanization can lead to social instability, undermining the capacity of cities to be
environmentally sustainable and economically successful. Cities should ensure that as they grow
and develop economically, the city environment is not destroyed or degraded. The ES dimension
accounts for the achievements or measures put in place to ensure that the city environment is
conserved and preserved. Due to data unavailability, it was not possible to include the Air Quality
and Energy sub-dimensions, nevertheless, they remain very important indicators. The
environmental sustainability index, therefore, comprise of the waste management indicators only.
The findings in table 6 show that the Holy City of Madina is doing moderately well particularly in
waste management, notwithstanding the weakness associated with the rate of solid waste recycling
which is extremely low, 10%.
Table 6: Environmental Sustainability Index (65.1%)
Sub-Dimension Indicator Actual Units Standardized Comments
Air Quality
CO2 Emissions - m. tons per
capita - -
PM10 Concentration - ug/m3 - -
PM2.5 Concentration - ug/m3 - -
Energy The share of renewable energy
consumption - % - -
Waste Management
(65.1%)
Solid Waste Collection 90.20 % 90.2% V. Strong
Solid waste recycling share 5.00 % 10.0% V. Weak
Waste water treatment 95.00 % 95.0% V. Strong
Although the management of solid waste collection is very good, there is insignificant solid
waste recycling. The city collects 90% of all the solid waste generated and only 10% of the
collected solid waste are recycled.
64.7%
6.0%
89.0%
80.6%
23.0%
Reduced Poverty rate Youth Unemployment Equitable Secondary School
Enrollment
Women in Local Government Women in the work force
Gender Inclusion

14
Figure 8: Environmental Sustainability Indicators
The Governance and Legislation Dimension
Good governance and appropriate legislation are prerequisites for sustainability and growth; it’s
only through good urban governance and accountable leadership that a city can be able to deploy
practical and effective policies, laws and regulations, and create adequate institutional frameworks
required for growth and prosperity. The average score for the governance and legislation is 45.7%,
the Holy City of Madina can be said to have a moderately weak governance and legislation system.
The city’s strongest aspect of good governance and legislation is the number of days required to
register and start a new business. On the other hand citizen participation in local elections as a
measure of participation and accountability aspect of good governance is very weak, with 30.5%.
Table 7: Governance and Legislation Index (45.7%)
Sub-Dimension Indicator Actual Units Standardized Comments
Participation & Accountability
(30.5%) Voter turnout
30.49 %
30.5% V. Weak
Municipal Finance (60.9%)
Own revenue collection - % - -
Days to start a business 12.30 Days 60.9% Strong
Local expenditure
efficiency
- %
- -
To forge ahead in the prosperity path, the city needs to improve by opening more space for
citizen participation and more accountability in its leadership and improve some aspects of
municipal finance management.
90.2%
10.0%
95.0%
Solid Waste Collection Solid waste recyling share Waste water treatment
Waste Management

15
Figure 9: Governance and Legislation
30.5%
60.9%
Voter Turnout Days to Start a Business
Participation and Accountability

16
SWOT Analysis based on City Prosperity Index Assessment
This section attempts to analyze the findings of the CPI and use it to identify areas of Strength,
Weaknesses or Challenges, Opportunities for growth and possible Threats that the city may have
so that appropriate recommendations and actions can be designed.
Table 8: CPI Based SWOT Analysis
STRENGTH WEAKNESSES
1. Good economic growth factors such as moderately, low old-
age dependency ratio and good employment factors are good
for the city economic stability.
2. High literacy rate: the youth and women have untapped
potential to contribute allot to economic growth. There is
allot of unutilized skilled manpower (human capital),
especially among educated women and youth.
3. Good safety and security, as well as political stability,
provide a conducive environment for growth and
development.
4. There is good healthcare provision in the city: a healthy
population is energetic and productive.
5. The housing infrastructure is good
6. Urban mobility is good
7. Street connectivity is good, the city can take advantage of it
to promote walking and cycling.
8. Waste management is good especially on collection of waste.
9.
1. The employment situation in the city is bad especially job
creation and availability of job opportunities. Youth
unemployment is high – in a youthful population, this is not
good.
2. Provision of education especially early childhood and
enrolment in higher education are too low.
3. Low access to improved sanitation – connection to sewerage
system reduce diseases.
4. Few public libraries – libraries promote learning and access to
information and provide empowering knowledge.
5. Social infrastructure relating to health is poor i.e Low
physician density and high maternal mortality – compromises
the quality of healthcare.
6. ICT is weak and it is very important in supporting growth.
Internet access and speeds is too low.
7. Few women in the workforce despite the fact that literacy and
education level among Saudi women is considerably good; this
is a critical economic resource in terms of manpower.
8. Poor availability of public spaces in the city – limiting
recreation and better quality of life.
10. No source of renewable energy like solar and wind.
OPPORTUNITIES THREATS
1. Good and Stable economic growth factors create a good
environment for growth and development in many areas of
the economy. Eradication of the informal sector is a big
advantage.
2. High access to home computers presents great opportunity to
expand the use of internet and to encourage higher speeds
and promote innovation in the ICT sector especially among
the youth with young creative minds.
3. High connectivity index presents good opportunity to
promote or encourage alternative means of transport such as
walking and cycling to reduce excessive use of private cars.
4. Good safety & security and political stability in the city
provide a conducive environment for attracting foreign
investments.
5. For the environment – the efficient solid waste collection is a
good starting point for recycling and ensuring a clean
environment.
1. Very Low employment to population ratio together with high
youth unemployment is not good in a country with generally
young population; bulging youth population mean high labour
force in near future. Demographic phenomenon.
2. No renewable energy sources – complete dependence on fossil
fuel which is not renewable source may not be the best for the
future of the city. Investment in other renewable energy sources
such as the solar and the wind is advisable.

17
LOCAL URBAN OBSERVATORY
Introduction
Global Urban Observatory Network (GUO-Net) is a worldwide information and capacity-
building network established by the United Nations Human Settlement Programme (UN-
HABITAT) to help implement the New Urban Agenda at the national and local levels. The
GUO-NET consists of national and city-level institutions that function as National and Local
Urban Observatories.
The purpose of GUO-Net is to support governments, local authorities and civil society:
• To improve the collection, management, analysis and use of information in formulating more
effective urban policies;
• To improve information flows between all levels for better urban decision-making;
• To stimulate broad-based consultative processes to help identify and integrate urban
information needs;
• To provide information and analyses to all stakeholders for more effective participation in
urban decision-making;
• To share information, knowledge, and expertise using modern information and
communication technology (ICT);
• To create a global network of local, national and regional platforms for sharing information
about the implementation of the New Urban Agenda;
• To share some tools and benefits provided by the GUO network;
• Training on using the urban indicator toolkit for data collection and analysis;
• Training on how to use the results of the urban indicators data for fund raising activities;
• Conferences of the network members for information exchange and city-to-city networking;
• Access to internet resources available at UN-Habitat’s website including urban indicators
databases and Urban Info system;
• Data used for evaluations done for the World Cities Report published biannually by UN-
Habitat.
UN-HABITAT achieves these objectives through a global network of local, national and regional
urban observatories and through partner institutions that provide training and other capacity-
building expertise.
The UN-Habitat and MOMRA have previously established Local Urban Observatories in the 17
cities covered by the FSCP. A rapid survey conducted by UN-Habitat-KSA in June 2015 targeting
the 17 LUO/cities, found out that only 15 LUOs existed. The findings also showed that 88% of
Local Urban Observatories are under Municipal Departments while 12% are under Authority for
Development within Municipality. It also revealed that 71% of the Local Urban Observatories
were active while the operations of 23% of them were suspended due to unaccomplished
staff/contractual arrangements.
Some of the data the Local Urban Observatories are required to collect in collaboration with the
Municipals are GIS-related, so there is need to have a collaborative work relations between the
LUOs and the GIS departments within the Municipalities. The survey revealed that in terms of
connections with the GIS departments, 59% of the LUOs have work relations with the GIS
department while 18% do not. There was evidence that 71% of the LUOs have GIS data while 6%
do not have.

18
MADINA – Local Urban Observatory
The Local Urban Observatory of Madina was established in 2004 (operational 11years) as a
department located within the municipality to be responsible for developing tools, collecting and
analyzing urban indicators at the city level. Madina LUO has a total of 18 employees, of which 9
are Non-Saudi Consultants provided by a private consulting firm contracted to do technical
management of the LUO, the other 9 are Saudi government staff. The contract with the consulting
firm has lasted 24 months.
Indicators Produced
Madina LUO has produced four rounds of indicators and now working on the fifth round of urban
indicators, so far they have produced a total of 113 urban indicators. This puts Madina LUO as the
7th best performing LUO after Makkah with 300 urban indicators, Abha (140), and Skaka (137)
among others. In addition to producing urban indicators, LUOs are also required to assist in the
collection and production of CPI indicators, according to a rapid survey conducted by UN-Habitat-
KSA in June 2015, Madina had produced a total of 30 CPI indicators and by June 2016 the number
of indicators reaches 51 out possible 74, this placed it eighth and is among the cities with least
number of CPI indicators. One survey has been conducted for producing the spatial indicators of
the city of Madina.
19
References
A. A. AlKhedheiri (2002) The Role of Secondary Cities in the National Development Process of
the Kingdom of Saudi Arabia.
A. Al-Otaibi (2004) The Aspiration for Housing in Jeddah Saudi Arabia. The University of
Newcastle upon Tyne, UK, Vol. 6, Issue 1, 2004.
Abdul Salam et al (2014) Population Distribution and Household Condition in Saudi Arabia:
Reflection from 2010 Census, Springer Plus 2014, 3:530.
A. A. Abou-Korin & F. S. Al-Shihri (2015) Rapid Urbanization and Sustainability in Saudi Arabia:
The Case of Dammam Metropolitan Area. Journal of Sustainable Development; Vol. 8, No. 9;
2015 ISSN 1913-9063 E-ISSN 1913-9071. Published by Canadian Center of Science and Education
A. A. Salam (2013) Population and Household Census, Kingdom of Saudi Arabia 2010: Facts and
Figures. Center for Population Studies King Saud University, Riyadh, Saudi Arabia. International
Journal of Humanities and Social Science Vol. 3 No. 16, August 2013.
High Commission for the Development of Riyadh (2015): ArRiyadh Urban Indicator 2013,
http://www.arriyadh.com/openshare/ar/Photos/----------/En-3-Big.jpg.
I. E. Ascoura (2013) Impact of Pilgrimage (Hajj) on the Urban Growth of the Mecca. Journal of
Educational and Social Research Vol. 3 (2) May 2013. ISSN 2239-978X
J. Gamboa (2008), City Expanding to the Desert Horizon: Riyadh’s problem of explosive growth
and urban sprawl, Geography 554
R Rantala and F Al Mazroa (2011): Intersectoral Action in Abha City, Saudi Arabia – A Healthy
City Tackling NCDs. World Health Organization Centre for Health Development, Kobe, Japan
and Ministry of Health, Kingdom of Saudi Arabia.
Saudi Arabia General Investment Authority (2014): Madina Region Economic Report 1434-1435-
2014.
UN-Habitat (2012) The State of Arab Cities 2012: Challenges of Urban Transition, United Nations
Human Settlements Programme, Nairobi.
UN-Habitat (2013) The State of the World Cities 2012/2013: Prosperity of Cities, United Nations
Human Settlements Programme, Nairobi.
UN-Habitat (unpublished) MEASUREMENT OF CITY PROSPERITY: Methodology and
Metadata.
UNICEF and WHO (2013) IMMUNIZATION SUMMARY: A statistical reference containing
data through 2011. The 2013 Edition.
Y. H. Yassin (2010) The UN-Support to the National Spatial Strategy and Urban Planning Efforts
of Saudi Arabia UNDP Kingdom of Saudi Arabia.
UN-Habitat NATIONAL SPATIAL FRAMEWORKS: Lessons Learnt from International
Experiences
Dar Al Sahan (1995) Urban Development in Saudi Arabia: Challenges and Opportunities. ISBN
9960-9054-0-3