Embed Size (px)
Citation preview
Madsen, Mary Ann (2016) Growth phase-specific promoters of
cyanobacteria for synthetic biology applications. PhD thesis.
https://theses.gla.ac.uk/7359/
Copyright and moral rights for this work are retained by the author
A copy can be downloaded for personal non-commercial research or study,
without prior permission or charge
This work cannot be reproduced or quoted extensively from without first
obtaining permission in writing from the author
The content must not be changed in any way or sold commercially in any
format or medium without the formal permission of the author
When referring to this work, full bibliographic details including the author,
title, awarding institution and date of the thesis must be given
Enlighten: Theses
https://theses.gla.ac.uk/
Growth phase-specific promoters of
cyanobacteria for synthetic biology applications
Thesis submitted for the degree of Doctor of Philosophy
Mary Ann Madsen
Institute of Molecular, Cell and Systems Biology
College of Medical, Veterinary and Life Sciences
University of Glasgow
April 2016
ii
ABSTRACT
Cyanobacteria are a diverse group of photosynthetic gram-negative bacteria able
to tap into virtually unlimited solar energy supplies and convert it into chemical
energy and biomass using minimal inputs: sunlight, water, carbon dioxide and
simple mineral nutrients. In recent years, cyanobacteria have attracted great
interest as a cost-effective and energetically sustainable chassis for a wide array
of applications in biotechnology and synthetic biology. However, molecular tools
to engineer cyanobacteria are relatively limited. In particular, promoters to
drive gene expression in a precise and controlled manner require development.
In this study, I have developed an approach to identify and characterise auto-
inducible promoters that are activated in high density cultures of cyanobacteria
to avoid interference of transgene expression with culture growth. To assess the
strength and specificity of candidate promoters, an in vivo GFP-based assay was
established to assess promoter activity in growing cultures of Synechococcus spp.
PCC 7002. For this purpose, a vector backbone was developed which is
compatible with the largest library of standardised biological components
available to date, BioBricks. In addition, a library of synthetic ribosome binding
sites was developed to increase the range of detectable transcriptional activity.
This heterologous GFP reporter system was able to reproduce the native growth
phase-specific promoter activity from a different species of cyanobacteria.
In order to identify growth phase-specific promoters, I first identified five
nutrient-limited conditions that specifically limited growth of Synechocystis spp.
PCC 6803: nitrate, phosphate, sulphate, magnesium and potassium. These
conditions provided a range of backgrounds in which I could investigate
transcriptional responses to changes in growth where cyanobacteria entered
stationary phase for different reasons. Quantitative PCR analysis of published
genes revealed that reported growth phase-specific expression patterns were not
robust across different conditions. RNA sequencing was therefore performed to
compare gene expression profiles across nutrient conditions and growth phases
to identify novel co-regulated gene clusters. Of particular interest were a large
group of genes that showed robust up-regulation during late exponential phase
across all of the conditions tested.
In summary, this study addresses one of the key limitations in cyanobacterial
engineering: robust promoters to tightly regulate gene expression. I have
developed tools in order to use standard biological components and to
characterise promoter behaviour in cyanobacteria. Genes with robust growth
phase-specific expression profiles have been identified and analysis of upstream
regions can now be performed to determine growth phase-specific motifs and
promoters. This work lays important foundations to develop essential, robust
tools for the rational design of cyanobacteria.
iii
TABLE OF CONTENTS
ABSTRACT .................................................................................... ii
TABLE OF CONTENTS ....................................................................... iii
LIST OF FIGURES ............................................................................ ix
LIST OF TABLES ............................................................................ xii
ACKNOWLEDGEMENTS ..................................................................... xv
AUTHOR’S DECLARATION ................................................................ xvi
ABBREVIATIONS ........................................................................... xvii
Chapter 1. Introduction .................................................................... 1
1.1 The need for alternative technology ........................................... 1
1.2 Cyanobacteria as solar-powered biofactories ................................. 2
1.2.1 Central carbon metabolism of cyanobacteria ............................ 3
1.2.2 Diversity of cyanobacteria................................................. 10
1.2.3 Advantages of prokaryotic systems ...................................... 11
1.2.4 Genetic manipulation of cyanobacteria ................................. 12
1.2.5 Unique challenges for cyanobacterial engineering .................... 13
1.3 Synthetic biology approaches to simplify biological complexity ......... 14
1.3.1 Decoupling, abstraction and modularity ................................ 14
1.3.2 Standardised components for rapid assembly .......................... 16
1.3.3 Component characterisation for predictable behaviour .............. 17
1.3.4 Computational modelling .................................................. 18
1.4 Taking control of gene expression ............................................ 18
1.4.1 The RNA polymerase holoenzyme ........................................ 21
1.4.2 Sigma factors ................................................................ 22
1.4.3 Promoter structure ......................................................... 23
1.4.4 Transcription factors ....................................................... 24
1.4.5 Limitations of available expression systems for cyanobacteria ...... 26
iv
1.5 Stationary phase growth as a manufacturing platform .................... 28
1.6 Objectives ........................................................................ 30
Chapter 2. Materials and methods ...................................................... 31
2.1 Standard cyanobacteria methods ............................................. 31
2.1.1 Strains of cyanobacteria ................................................... 31
2.1.2 Growth of cyanobacteria on agar plates ................................ 32
2.1.3 Long-term storage of cyanobacteria ..................................... 32
2.1.4 Monitoring growth .......................................................... 33
2.2 Analysis of gene expression levels ............................................ 34
2.2.1 Quantitative real-time Polymerase Chain Reaction (qPCR) ........... 35
2.2.2 RNA sequencing .............................................................. 38
2.2.3 Statistical analysis ........................................................... 40
2.3 Generation of transgenic material ............................................... 41
2.3.1 Isolation of genomic DNA from cyanobacteria .......................... 41
2.3.2 High-precision Polymerase Chain Reaction conditions ................. 41
2.3.3 Standard cloning techniques ............................................... 43
2.3.4 Transformation of Escherichia coli........................................ 47
2.3.5 Plasmid DNA purification from Escherichia coli ......................... 48
2.3.6 Plasmid verification in Escherichia coli .................................. 49
2.3.7 Natural transformation of cyanobacteria ................................ 50
2.3.8 PCR verification of transformed cyanobacteria ......................... 50
2.4 Quantification of reporter gene activity ...................................... 52
Chapter 3. Developing a standardised promoter assay .............................. 53
3.1 Introduction ...................................................................... 53
3.1.1 Chapter aim ................................................................. 55
3.2 Results ............................................................................. 56
3.2.1 PCC 7002 culture conditions .............................................. 56
3.2.2 Plasmid vector for PCC 7002 transformation ........................... 58
v
3.2.3 Reporters to monitor promoter activity ................................. 61
3.2.4 Ribosome binding sites for translation initiation ....................... 63
3.2.5 Testing the fluorescence assay with published promoters ........... 68
3.3 Discussion ......................................................................... 71
3.3.1 Further vector development .............................................. 72
3.3.2 Transcriptional tools for reliable engineering .......................... 75
3.3.3 Reference promoters for comparable measures of promoter activity .
................................................................................ 76
3.3.4 Heterologous promoters to control gene expression in cyanobacteria
................................................................................ 77
Chapter 4. Modulating growth kinetics in cyanobacteria ............................ 79
4.1 Introduction ...................................................................... 79
4.1.1 Chapter aim ................................................................. 81
4.2 Results ............................................................................. 82
4.2.1 Synechocystis spp. PCC 6803 culture conditions ....................... 82
4.2.2 Monitoring growth of cyanobacteria ..................................... 84
4.2.3 Mineral nutrient availability affects growth of PCC 6803 ............. 86
4.2.4 Teasing apart effects of single nutrient limitations ................... 91
4.3 Discussion ......................................................................... 96
4.3.1 Nutrient availability as a means to modulate growth kinetics in
cyanobacteria ......................................................................... 96
4.3.2 Nitrate supply is a key consideration for process design of
cyanofactories ........................................................................ 98
4.3.3 Cyanobacteria sense and respond to P-limitation before supplies run
out ................................................................................ 99
4.3.4 Potassium maintains turgor pressure and shape of bacterial cells . 100
4.3.5 Magnesium is a key factor coordinating cell growth and metabolism .
............................................................................... 101
4.3.6 Quantification of growth in cyanobacteria ............................ 102
vi
Chapter 5. Testing published growth phase-specific genes ........................ 104
5.1 Introduction ..................................................................... 104
5.1.1 Chapter aim ................................................................ 106
5.2 Results ............................................................................ 107
5.2.1 Identification of a suitable reference gene for qPCR analysis ...... 107
5.2.2 Expression profiles of sigma factors implicated in regulation of late
growth gene expression ............................................................ 109
5.2.3 Expression profile of the iron-stress-inducible gene isiA ............ 113
5.2.4 Expression profiles of plasmid-encoded genes ........................ 116
5.3 Discussion ........................................................................ 121
5.3.1 Enhancing the resolution of growth phase-specific gene expression
profiles ............................................................................... 122
5.3.2 Ensuring the robustness of growth phase-specific gene expression
profiles ............................................................................... 122
5.3.3 Sigma factor activity is not modulated at the transcript level ..... 123
5.3.4 Pslr9003, a potential auto-inducible promoter .......................... 125
5.3.5 Expanding the growth phase-specific promoter library for
cyanobacteria ........................................................................ 126
Chapter 6. Identifying novel growth phase-specific genes ......................... 127
6.1 Introduction ..................................................................... 127
6.1.1 Chapter aims ............................................................... 128
6.2 Results ............................................................................ 129
6.2.1 Experimental design ....................................................... 129
6.2.2 Multi-dimensional scaling ................................................. 131
6.2.3 Selecting a cut-off and defining a background of expressed genes 133
6.2.4 Overview of genes commonly regulated during late growth ........ 134
6.2.5 Genes commonly up-regulated during late growth ................... 135
6.2.6 Genes commonly down-regulated during late growth ................ 145
6.3 Discussion ........................................................................ 154
vii
6.3.1 Cyanobacteria switch to “standby” mode during late growth ...... 155
6.3.2 Factors with positive effects on survival ............................... 156
6.3.3 Signalling cascades are important for late growth survival in bacteria
............................................................................... 157
6.3.4 Promoters regulated in response to changes in growth .............. 160
6.3.5 Specific nutrient-responsive genes and promoters ................... 161
Chapter 7. General discussion .......................................................... 163
7.1 Standardised molecular tools for cyanobacteria ........................... 165
7.1.1 Further development of the pAQ1BB plasmid vector ................. 165
7.1.2 Developing landing pads for stable transgene integration ........... 165
7.1.3 Speeding up part assembly ............................................... 166
7.1.4 Designing ribosome binding sites to enhance product synthesis .... 167
7.1.5 Promoter design and characterisation .................................. 167
7.2 Identification of late growth-specific promoters .......................... 168
7.2.1 Establishing conditions to study the transition from exponential to
stationary phase ..................................................................... 168
7.2.2 Enhancing resolution of transcript analysis to identify robust gene
expression profiles .................................................................. 169
7.2.3 Identifying novel growth phase-specific genes ........................ 170
7.2.4 RNA sequencing versus microarray analysis ............................ 172
7.2.5 Gene expression levels in single cells versus bulk cell populations 172
7.2.6 The importance of silencing during non-induced conditions ........ 173
7.2.7 Future work: Motif discovery and promoter identification .......... 174
7.3 A proposed design for a cyanobacterial cell factory ...................... 175
7.4 Process selection and design .................................................. 177
7.5 Outlook ........................................................................... 178
REFERENCES ............................................................................... 179
APPENDIX I ................................................................................. 199
APPENDIX II ................................................................................ 200

viii
APPENDIX III ............................................................................... 201
APPENDIX IV ............................................................................... 206
APPENDIX V ................................................................................ 207
APPENDIX VI ............................................................................... 210
APPENDIX VII .............................................................................. 213
ix
LIST OF FIGURES
Figure 1-1. Subcellular organisation of Synechocystis spp. PCC 6803 4
Figure 1-2. Overview of central carbon metabolism of cyanobacteria and associated bioproduction pathways
5
Figure 1-3. The abstraction hierarchy 15
Figure 1-4. BioBrick part design and assembly 16
Figure 1-5. Structure of the RNA polymerase holoenzyme 21
Figure 1-6. Structure of a typical bacterial promoter 24
Figure 2-1. Workflow of gene expression analyses 34
Figure 2-2. Electropherograms of RNA samples following ribosomal RNA reduction.
39
Figure 3-1. Culture conditions of Synechococcus spp. PCC 7002 57
Figure 3-2. Plasmid vectors for transformation of Synechococcus spp. PCC 7002
59
Figure 3-3. Fluorescent reporter excitation and emission spectra 62
Figure 3-4. Relative reporter activity in PCC 7002 63
Figure 3-5. Predicted translation initiation rates for promoter-reporter modules
64
Figure 3-6. Predicted translation initiation rates for the synthetic RBS library
66
Figure 3-7. Synthetic ribosome binding sites to drive translation initiation of GFP
67
Figure 3-8. Testing published promoters from Synechocystis spp. PCC 6803
68
Figure 3-9. Phycocyanin promoter activity in endogenous and heterologous systems
70
Figure 4-1. Culture conditions of Synechococcus spp. PCC 6803 83
Figure 4-2. Comparison of optical density and cell number for PCC 6803 85
Figure 4-3. Effects of reducing nutrient supplies on growth of PCC 6803 86
Figure 4-4. Screen for growth effects of nutrient limitations in PCC 6803 88
Figure 4-5. Growth of PCC 6803 in BG11, BG11-N, BG11-KP and BG11-MgS 90
x
Figure 4-6. Growth of PCC 6803 in BG11-P and BG11-K 92
Figure 4-7. Growth of PCC 6803 in BG11-S and BG11-Mg 94
Figure 5-1. Stability of candidate reference genes throughout growth of PCC 6803
108
Figure 5-2. Relative transcript levels of sigC in BG11 110
Figure 5-3. Relative transcript levels of sigH in BG11 112
Figure 5-4. Relative transcript levels of isiA in BG11 114
Figure 5-5. Relative transcript levels of isiA in BG11-MgS 115
Figure 5-6. Relative transcript levels of sll7077 in BG11 117
Figure 5-7. Relative transcript levels of slr9003 in BG11 118
Figure 5-8. Relative transcript levels of slr9003 in BG11-MgS 119
Figure 5-9. Relative transcript levels of slr9003 in in BG11-KP 120
Figure 6-1. Multi-dimensional scaling of RNAseq dataset 132
Figure 6-2. FPKM values for each gene within a single sample 134
Figure 6-3. Expression profiles of genes up-regulated during late growth in all conditions
137
Figure 6-4. sll0528 encoding a protein of unknown function up-regulated during late growth
138
Figure 6-5. Cell death suppressor homolog gene up-regulated during late growth
139
Figure 6-6. Adenylate cyclase up-regulated during late growth 140
Figure 6-7. Genes involved in gene expression up-regulated during late growth
141
Figure 6-8. Phosphotransacetylase gene up-regulated during late growth 142
Figure 6-9. Type-2 NADH dehydrogenase genes up-regulated during late growth
143
Figure 6-10. Putative hydrogen production-related genes up-regulated during late growth
144
Figure 6-11. Chlorophyll biosynthesis genes down-regulated during late growth
146
Figure 6-12. Phycobilisome genes down-regulated during late growth 147
xi
Figure 6-13. Photosystem genes down-regulated during late growth 148
Figure 6-14. Photosynthetic electron transport down-regulation during late growth
149
Figure 6-15. ATP synthase down-regulation during late growth 150
Figure 6-16. Translation machinery genes down-regulated during late growth
151
Figure 6-17. Expression profiles of genes commonly down-regulated during late growth
153
Figure 7-1. Proposed design for a mixotrophic cyanofactory 176
xii
LIST OF TABLES
Table 1-1. Genomes of phototrophic model organisms 11
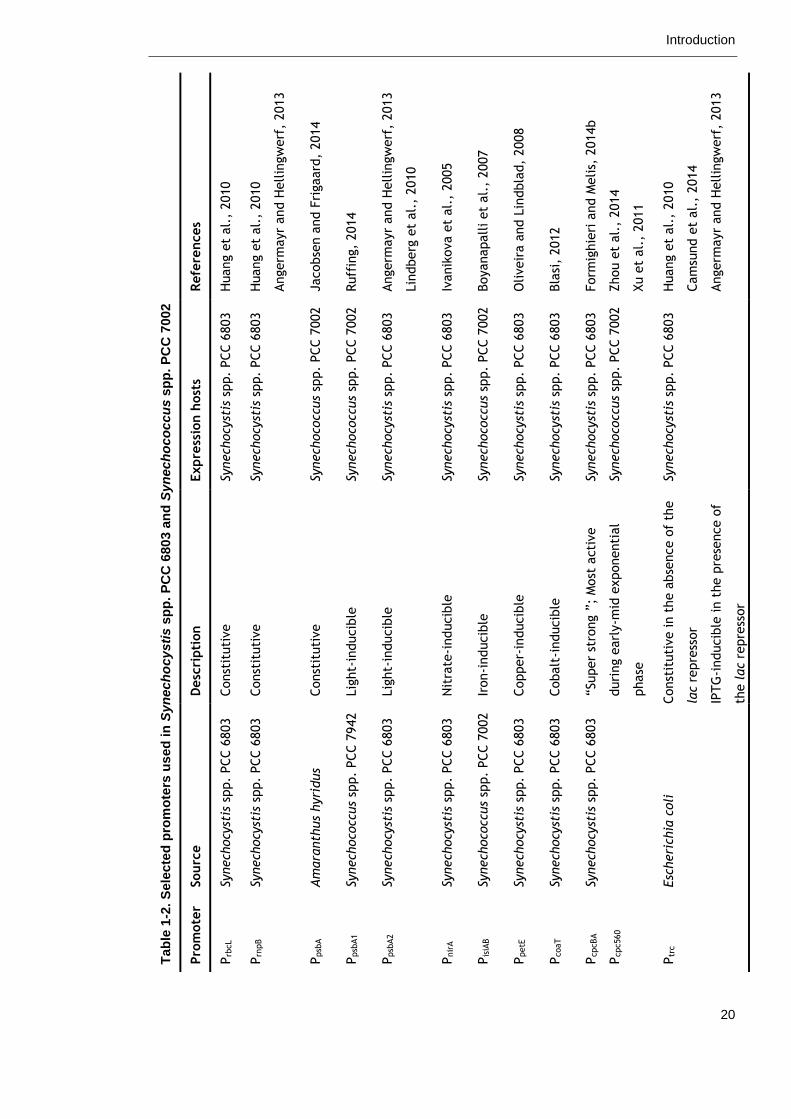
Table 1-2. Selected promoters used in Synechocystis spp. PCC 6803 and Synechococcus spp. PCC 7002
20
Table 2-1. Primers for quantitative RT-PCR 37
Table 2-2. Quantitative RT-PCR reaction setup 38
Table 2-3. Quantitative RT-PCR thermocycler conditions 38
Table 2-4. High-precision PCR reaction setup 42
Table 2-5. High-precision PCR thermocycler conditions 42
Table 2-6. Primers to amplify promoters from PCC 6803 43
Table 2-7. Primers to generate RBS-GFP library 43
Table 2-8. Adenylation of 3’ ends of purified PCR fragments reaction setup
44
Table 2-9. Adenylation of 3’ ends of purified PCR fragments thermocycler conditions
44
Table 2-10. Restriction digestion reaction setup 45
Table 2-11. Primers to generate synthetic double-stranded DNA 45
Table 2-12. Ligation reaction setup 46
Table 2-13. Primers for site-directed mutagenesis 47
Table 2-14. Antibiotic concentrations for Escherichia coli 48
Table 2-15. Solutions for plasmid DNA purification 49
Table 2-16. Restriction digestion reaction setup 49
Table 2-17. Primers for sequencing 50
Table 2-18. PCR verification of cyanobacterial transformants reaction setup
51
Table 2-19. PCR verification of cyanobacterial transformants thermocycler conditions
51
Table 3-1. Detection settings for fluorescent reporters 62
Table 3-2. Synthetic ribosome binding site sequences for GFP 66
xiii
Table 3-3. Published promoters from Synechocystis spp. PCC 6803 68
Table 4-1. BG11 media composition for Synechocystis spp. PCC 6803 87
Table 4-2. Sulphate in BG11 media 94
Table 4-3. Summary of growth effects in different nutrient conditions 97
Table 5-1. Candidate reference genes for qPCR in PCC 6803 108
Table 6-1. Workflow of RNAseq analysis 130
Table 6-2. Functional categories of genes differentially expressed at late versus early time points in all growth conditions
136
Table 7-1. Overview of the work and future development 164

xiv
For Ma and Pa

xv
ACKNOWLEDGEMENTS
First and foremost, I would like to extend my deepest gratitude to my supervisor
Professor Anna Amtmann for giving me the opportunity to work on this project,
the freedom to develop as an independent scientist and for supporting me all the
way, for giving me access to opportunities to develop skills outside of the lab
and especially for being so understanding of personal circumstances.
Thanks is also due to the BBSRC for funding my PhD project.
A big thank you goes to the collaborators of the EPSRC-funded Biodesalination
project for including me in this wonderfully exciting consortium: Linda Lawton
and Kostas Minas from Robert Gordon University, Aberdeen; Catherine Biggs and
Esther Karunakaran from University of Sheffield; Jaime Amezaga and Catherine
Gandy from Newcastle University and Michael Templeton and Tom Bond from
Imperial College London.
I would also like to thank the people at the Glasgow Polyomics facility. In
particular, I would like to thank Graham Hamilton for his tremendous help in
both data analysis and development and use of bioinformatics tools. Thanks to
Pawel Herzyk, Jing Wang and Julie Galbraith for their help with RNA sequencing
and analysis.
A massive thank you goes to all of the members of the Stevenson Lab for all the
fruitful scientific discussion, help at the bench and laughs in the pub: Emily
Larson, Carla Minguet, Cecile Lefoulon, Ben Zhang, Maria Papanatsiou, Sakharam
Waghmare, Yizhou Wang, Wijitra Horaruang, Amparo Ruiz-Prado, Adrian Hills
and everyone in the Bower Building. Special thanks goes to: Annegret Honsbein
for her enormous help to set up our cyanofactory; Giorgio Perrella, Maria
Amparo Asensi-Fabado and Rucha Karnik for the highly valued scientific
feedback; Naomi Donald for taking care of my cyanobabies while I have been
away, Craig Carr for his tremendous help to fix the eternally broken Conviron
and George Boswell for autoclaving my masses of glassware.
Last but not least, the biggest thanks of all goes to my friends and family. Thank
you for being my unwavering source of strength, optimism and joy!

xvi
AUTHOR’S DECLARATION
I declare that this dissertation is the result of my own work except where
explicit reference is made to the contribution of others. This thesis has not been
submitted for any other degree at the University of Glasgow or elsewhere.
Mary Ann Madsen
xvii
ABBREVIATIONS
2CS Two-component signal transduction system
bp Base pairs
EDTA Ethylenediaminetetraacetic acid
IPTG Isopropyl β-D-1-thiogalactopyranoside
K Potassium
Mg Magnesium
N Nitrate
P Phosphate
RBS Ribosome binding site
RNAP RNA polymerase
rpm Revolutions per minute
S Sulphate
SDS Sodium dodecyl sulphate
TIR Translation initiation rate
TRIS Tris(hydroxymethyl)aminomethane
Introduction
1
Chapter 1. Introduction
1.1 The need for alternative technology
Since the industrial revolution, modern civilisation has relied heavily on fossil
fuels. They provide us with up to 85 % of our current energy consumption
(Crabtree and Lewis, 2007) thus enabling us to travel, heat our homes and
browse our smartphones. These reserves are finite, however, and supplies are
rapidly diminishing in spite of an ever-growing demand for oil-derived products.
Depletion of current oil reserves is predicted by 2040, gas by 2042 and coal by
2112 (Shafiee and Topal, 2009). Furthermore, these reserves are becoming
increasingly difficult to extract and refine resulting in increasing costs
(Laherrere, 2005). Not only are fossil fuels inherently unsustainable given their
limited supply but their combustion has detrimental effects on the environment
including the release of pollutants and greenhouse gases contributing to climate
change, primarily carbon dioxide (CO2) (Stocker et al., 2013). Overall, there is
an immediate need to shift from petroleum-based industries to sustainable and
eco-friendly technologies.
Two major changes are currently underway with respect to energy supplies. In
transportation, petroleum-derived fuel is being replaced with electricity. In
electricity production, fossils fuels are being replaced by renewable energy
sources from wind, sun and biomass. The most abundant energy source is the
sun; a single hour of solar irradiation provides the equivalent of an entire year’s
energy consumption worldwide (Crabtree and Lewis, 2007). Photosynthetic
organisms such as plants, algae and cyanobacteria are able to capture and
convert solar energy into chemical energy and biomass. This involves the
extraction of electrons from water, the reduction of atmospheric CO2 into
organic compounds and the release of oxygen. In this way they can tap virtually
unlimited energy supplies to drive potentially carbon negative processes.
An interesting application for photosynthetic energy capture is biotechnology.
The biological production of pharmaceutical and commodity products currently
Introduction
2
employs primarily heterotrophic bacteria (e.g. E. coli) or mammalian cells (e.g.
CHO cells) as hosts, all of which rely on external energy supplies in the form of
organic carbon compounds such as sugars or amino acids. Replacing traditional
microbial hosts with photosynthetic organisms seems a logical step towards
sustainability of biotechnology (Abed et al., 2009). Cyanobacteria are
particularly attractive hosts due to their rapid growth (compared to plants) and
ease of transformation (compared to algae). Indeed, cyanobacteria have shown
early signs of promise for diverse applications including biodesalination (Minas et
al., 2014, Amezaga et al., 2014), bioremediation (Vijayakumar, 2012,
Subashchandrabose et al., 2013), production of biofuels (Nozzi et al., 2013,
Parmar et al., 2011), bioplastics (Ruffing, 2011, Yu et al., 2013) and other
commodity chemicals (Ducat et al., 2011). However, production titres and rates
are still unable to compete with heterotrophic fermentation (Yu et al., 2013).
Substantial development is still required, particularly the optimisation of
molecular tools to engineer cyanobacteria.
1.2 Cyanobacteria as solar-powered biofactories
Cyanobacteria (formerly “blue green algae”) were the first organisms to evolve
oxygenic photosynthesis and responsible for the oxygenation of the earth's
atmosphere more than two billion years ago (Olson, 2006). Now, they have the
potential to change the world again in the form of solar-powered cell factories.
Cyanobacteria have numerous advantages for biotechnology and synthetic
biology applications. First and foremost, photosynthesis enables the generation
of large amounts of biomass from solar energy, water and mineral nutrients.
Furthermore, they convert an estimated 25 Giga tonnes of CO2 per year into
energy dense biomass (Waterbury et al., 1979). Besides the benefits of oxygenic
photosynthesis and carbon capture, cyanobacteria are an incredibly diverse
group of bacteria in terms of ecology, morphology and metabolism thus providing
a wide and varied platform from which to begin engineering. Being prokaryotes,
cyanobacteria grow relatively quickly and are relatively simple biological
systems with small genomes that are amenable to genetic engineering. These
attributes established cyanobacteria as key models for core processes in
Introduction
3
photosynthetic organisms and as a result, there is a wealth of knowledge
surrounding the core biology of cyanobacteria to inform the rational design of
these organisms.
1.2.1 Central carbon metabolism of cyanobacteria
The primary advantage of cyanobacteria over heterotrophic systems for
biotechnology is their ability to perform oxygenic photosynthesis. This
essentially occurs in two phases: 1) the conversion of light energy into chemical
energy as ATP and NADPH and 2) carbon capture and assimilation into organic
compounds. These two phases occur in the thylakoids, which form distinct
structures in the cytoplasm of cyanobacterial cells as shown in Figure 1-1. The
thylakoid membrane has a distinct protein composition from the plasma
membrane (Pisareva et al., 2011) and it contains the protein machinery for
cellular respiration alongside the photosynthetic machinery. Thus,
photosynthesis and cellular respiration are closely interlinked as they share
common components, and the spatial organisation of components involved in
these core metabolic pathways is both versatile and flexible. Figure 1-2 presents
an overview of the central carbon metabolism and interesting production
pathways for bioengineering, which will be discussed in closer detail in the
following sections.
Introduction
4
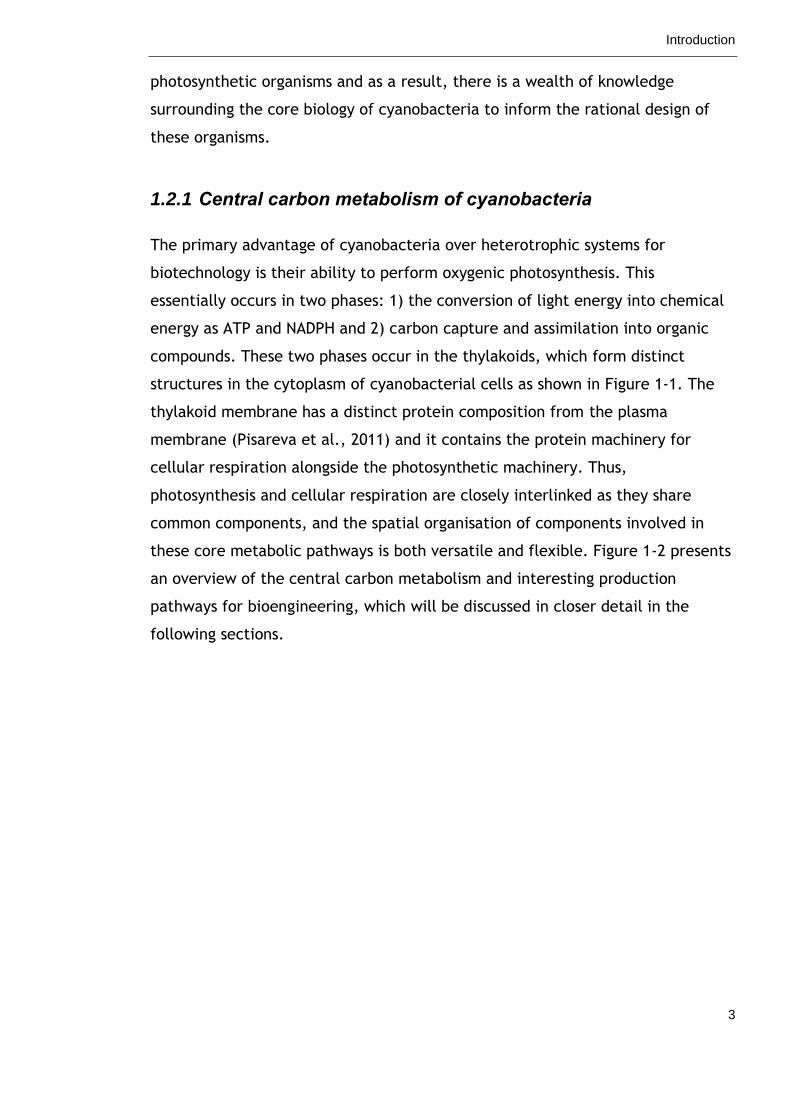
Figure 1-1. Subcellular organisation of Synechocystis spp. PCC 6803.
(A) Electron tomographic slice of a dividing Synechocystis spp. PCC 6803 cell. Thylakoid
membrane pairs (white arrowheads) surround the periphery of the cell and converge at thylakoid
centres (black arrow) adjacent to the cytoplasmic membrane. Carboxysome (white asterisk) and
ribosomes (black arrowheads) are found in the central cytoplasm. (B) 3D model showing a 100
nm thick section of thylakoid membrane pairs (green), thylakoid centre (blue), carboxysome
(yellow), ribosomes (white) and cytoplasmic membrane (brown). Scale bar is 50 nm. Figure
adapted from van de Meene et al., 2006.
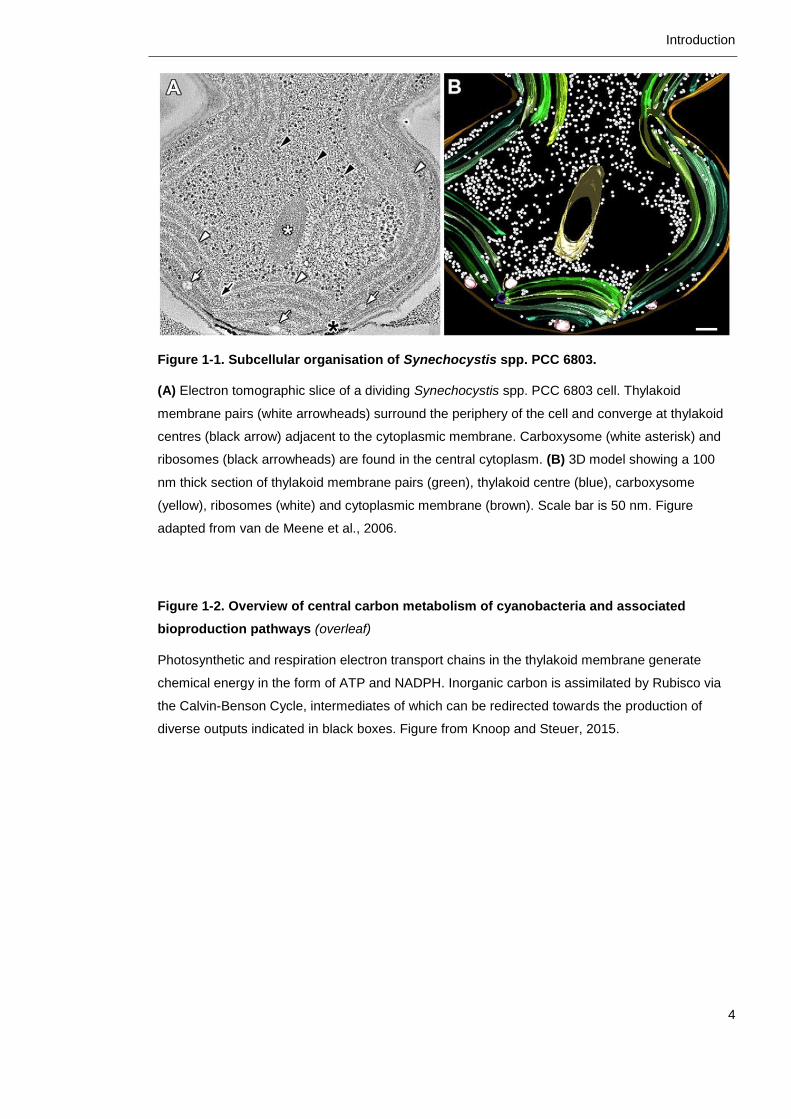
Figure 1-2. Overview of central carbon metabolism of cyanobacteria and associated
bioproduction pathways (overleaf)
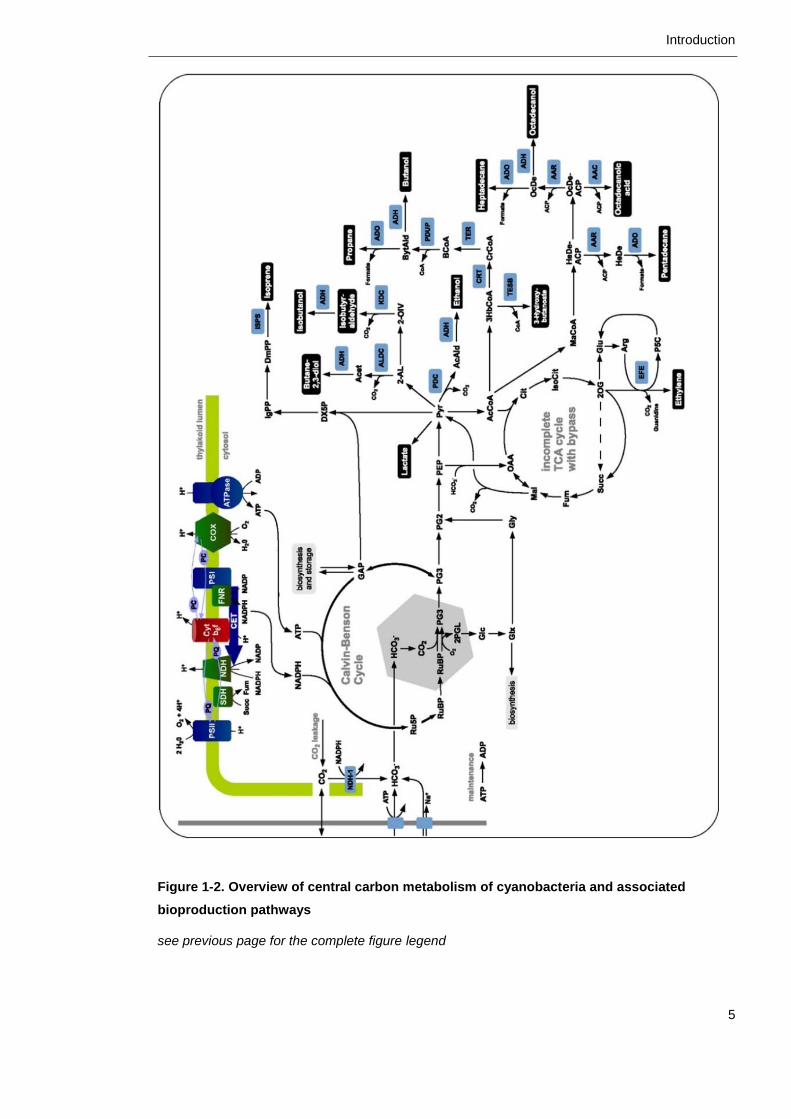
Photosynthetic and respiration electron transport chains in the thylakoid membrane generate
chemical energy in the form of ATP and NADPH. Inorganic carbon is assimilated by Rubisco via
the Calvin-Benson Cycle, intermediates of which can be redirected towards the production of
diverse outputs indicated in black boxes. Figure from Knoop and Steuer, 2015.
Introduction
5
Figure 1-2. Overview of central carbon metabolism of cyanobacteria and associated
bioproduction pathways
see previous page for the complete figure legend
Introduction
6
1.2.1.1 Photosynthetic conversion of solar into chemical energy
Of great significance for practical applications is the fact that cyanobacteria
have a superior photosynthetic capacity compared with other photoautotrophs.
This is in part due to the presence of unique antenna complexes called
phycobilisomes which are not found in plants or algae (Grossman et al., 1993).
The pigments present in these light-harvesting structures expand the absorption
spectrum of visible light cyanobacteria can utilise compared with other
photoautotrophs. This translates into an enhanced conversion of solar energy
into biomass: 10% in cyanobacteria compared to 5% in algae and 1% in plants
(Parmar et al., 2011, Posten and Schaub, 2009, Hase et al., 2000).
Cyanobacteria are the widely accepted predecessors of plants and algal
chloroplasts (Martin and Kowallik, 1999) and the photosynthetic electron
transport chain is essentially identical in these organisms. Light energy is
captured by chromophores within pigmented proteins and transferred to the
photosynthetic reaction centres of two photosystems, PSII and PSI, which
function in series to transfer electrons from water to NADPH and build an
electrochemical gradient across the thylakoid membrane to drive ATP synthesis
(Shevela et al., 2013). First, light energy is transferred to P680, the PSII primary
donor comprised of two chlorophyll dimers, which catalyses the extraction of
electrons from water (H2O → O2 + 4H+ + 4e-) and transfer to a mobile
plastoquinone (PQ). The doubly reduced PQ molecule then binds two protons and
leaves the PSII binding pocket as PQH2. The electrons are transferred to the
large redox protein complex cytochrome b6f (cyt b6f) which mediates electron
transfer between the two photosystems and pumps protons across the
membrane. The electrons are carried from cyt b6f to PSI by the lumen soluble
redox carrier, plastocyanin (PC). Under copper-depleted conditions, PC may be
replaced by cytochrome c6 (cyt c6, also known as cyt c533). In PSI, electrons are
reenergized by a second reaction centre, P700, and NADPH production is
catalysed by flavoprotein ferredoxin-NADP+ reductase (FNR).
Photosynthetic electron transport induces the accumulation of protons in the
thylakoid lumen thus building a proton electrochemical potential difference
across the thylakoid membrane to drive ATP synthesis. First, four protons are
Introduction
7
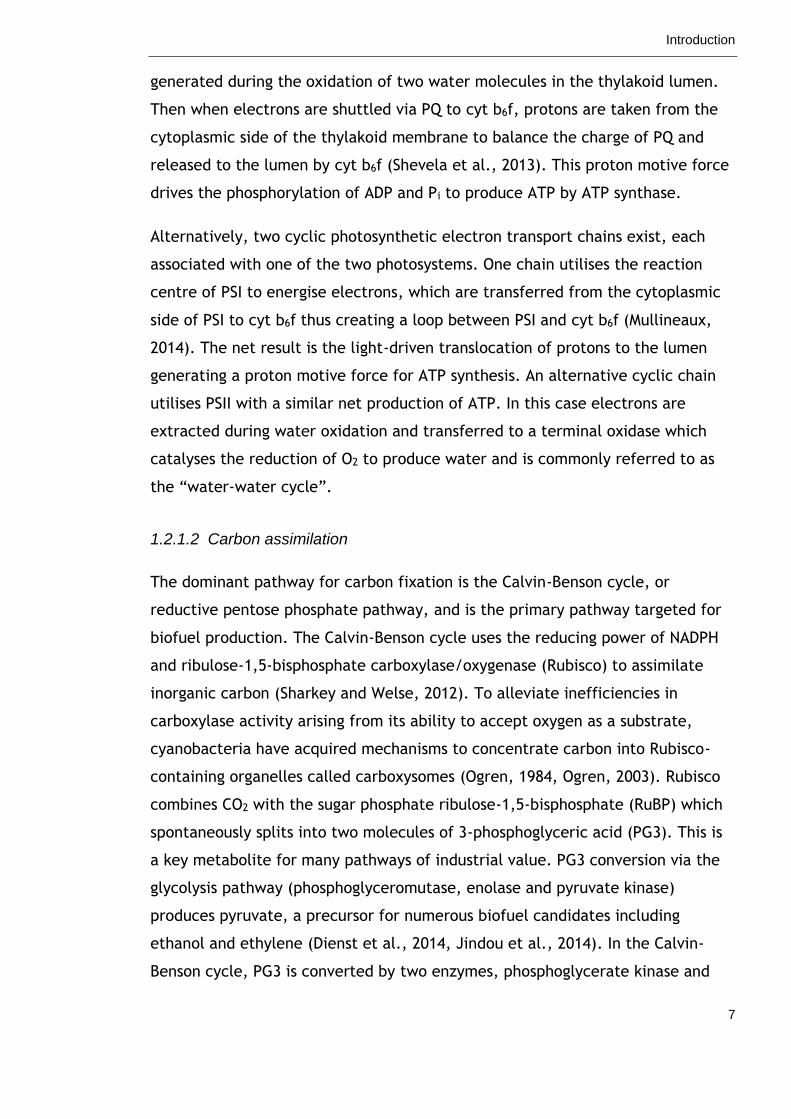
generated during the oxidation of two water molecules in the thylakoid lumen.
Then when electrons are shuttled via PQ to cyt b6f, protons are taken from the
cytoplasmic side of the thylakoid membrane to balance the charge of PQ and
released to the lumen by cyt b6f (Shevela et al., 2013). This proton motive force
drives the phosphorylation of ADP and Pi to produce ATP by ATP synthase.
Alternatively, two cyclic photosynthetic electron transport chains exist, each
associated with one of the two photosystems. One chain utilises the reaction
centre of PSI to energise electrons, which are transferred from the cytoplasmic
side of PSI to cyt b6f thus creating a loop between PSI and cyt b6f (Mullineaux,
2014). The net result is the light-driven translocation of protons to the lumen
generating a proton motive force for ATP synthesis. An alternative cyclic chain
utilises PSII with a similar net production of ATP. In this case electrons are
extracted during water oxidation and transferred to a terminal oxidase which
catalyses the reduction of O2 to produce water and is commonly referred to as
the “water-water cycle”.
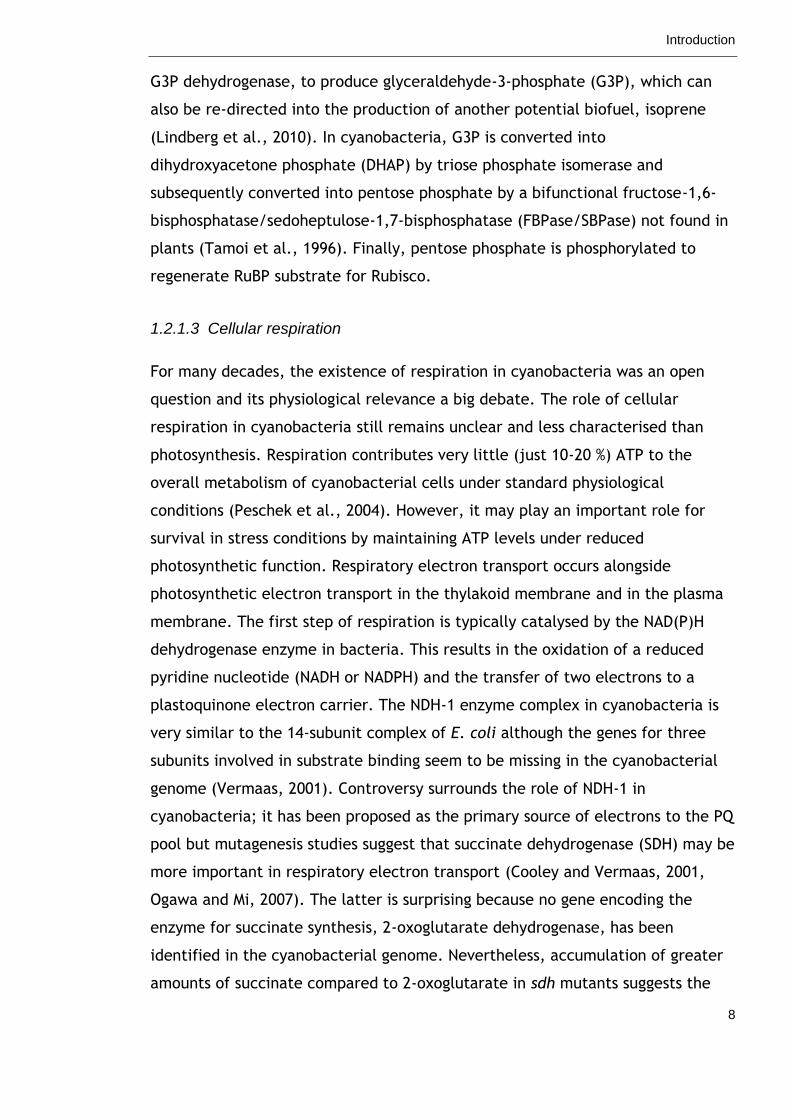
1.2.1.2 Carbon assimilation
The dominant pathway for carbon fixation is the Calvin-Benson cycle, or
reductive pentose phosphate pathway, and is the primary pathway targeted for
biofuel production. The Calvin-Benson cycle uses the reducing power of NADPH
and ribulose-1,5-bisphosphate carboxylase/oxygenase (Rubisco) to assimilate
inorganic carbon (Sharkey and Welse, 2012). To alleviate inefficiencies in
carboxylase activity arising from its ability to accept oxygen as a substrate,
cyanobacteria have acquired mechanisms to concentrate carbon into Rubisco-
containing organelles called carboxysomes (Ogren, 1984, Ogren, 2003). Rubisco
combines CO2 with the sugar phosphate ribulose-1,5-bisphosphate (RuBP) which
spontaneously splits into two molecules of 3-phosphoglyceric acid (PG3). This is
a key metabolite for many pathways of industrial value. PG3 conversion via the
glycolysis pathway (phosphoglyceromutase, enolase and pyruvate kinase)
produces pyruvate, a precursor for numerous biofuel candidates including
ethanol and ethylene (Dienst et al., 2014, Jindou et al., 2014). In the Calvin-
Benson cycle, PG3 is converted by two enzymes, phosphoglycerate kinase and
Introduction
8
G3P dehydrogenase, to produce glyceraldehyde-3-phosphate (G3P), which can
also be re-directed into the production of another potential biofuel, isoprene
(Lindberg et al., 2010). In cyanobacteria, G3P is converted into
dihydroxyacetone phosphate (DHAP) by triose phosphate isomerase and
subsequently converted into pentose phosphate by a bifunctional fructose-1,6-
bisphosphatase/sedoheptulose-1,7-bisphosphatase (FBPase/SBPase) not found in
plants (Tamoi et al., 1996). Finally, pentose phosphate is phosphorylated to
regenerate RuBP substrate for Rubisco.
1.2.1.3 Cellular respiration
For many decades, the existence of respiration in cyanobacteria was an open
question and its physiological relevance a big debate. The role of cellular
respiration in cyanobacteria still remains unclear and less characterised than
photosynthesis. Respiration contributes very little (just 10-20 %) ATP to the
overall metabolism of cyanobacterial cells under standard physiological
conditions (Peschek et al., 2004). However, it may play an important role for
survival in stress conditions by maintaining ATP levels under reduced
photosynthetic function. Respiratory electron transport occurs alongside
photosynthetic electron transport in the thylakoid membrane and in the plasma
membrane. The first step of respiration is typically catalysed by the NAD(P)H
dehydrogenase enzyme in bacteria. This results in the oxidation of a reduced
pyridine nucleotide (NADH or NADPH) and the transfer of two electrons to a
plastoquinone electron carrier. The NDH-1 enzyme complex in cyanobacteria is
very similar to the 14-subunit complex of E. coli although the genes for three
subunits involved in substrate binding seem to be missing in the cyanobacterial
genome (Vermaas, 2001). Controversy surrounds the role of NDH-1 in
cyanobacteria; it has been proposed as the primary source of electrons to the PQ
pool but mutagenesis studies suggest that succinate dehydrogenase (SDH) may be
more important in respiratory electron transport (Cooley and Vermaas, 2001,
Ogawa and Mi, 2007). The latter is surprising because no gene encoding the
enzyme for succinate synthesis, 2-oxoglutarate dehydrogenase, has been
identified in the cyanobacterial genome. Nevertheless, accumulation of greater
amounts of succinate compared to 2-oxoglutarate in sdh mutants suggests the
Introduction
9
presence of a modified tricarboxylic acid (TCA; also referred to as citric acid or
Krebs) cycle in cyanobacteria. Electrons transferred to the PQ pool are carried
through the cytochrome b6f complex and plastoquinone/cytochrome c6 pool to a
terminal cytochrome aa3-type cytochrome-c oxidase which transfers electrons to
the final acceptor, O2.
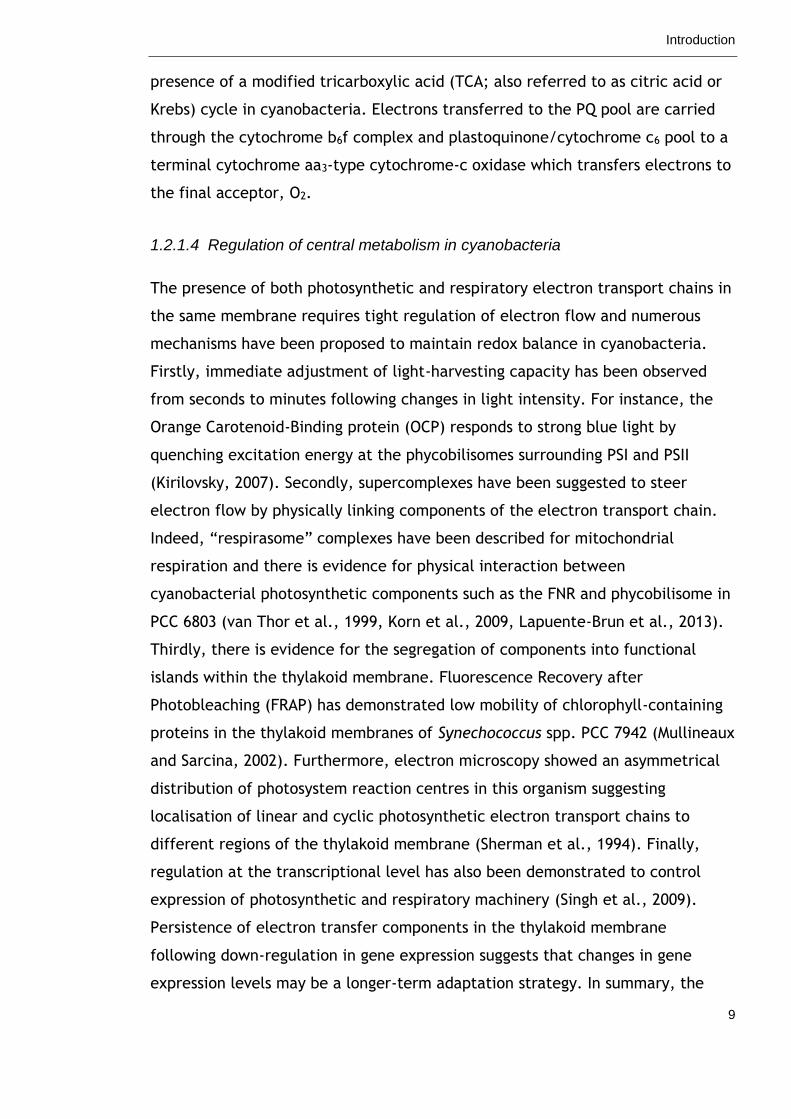
1.2.1.4 Regulation of central metabolism in cyanobacteria
The presence of both photosynthetic and respiratory electron transport chains in
the same membrane requires tight regulation of electron flow and numerous
mechanisms have been proposed to maintain redox balance in cyanobacteria.
Firstly, immediate adjustment of light-harvesting capacity has been observed
from seconds to minutes following changes in light intensity. For instance, the
Orange Carotenoid-Binding protein (OCP) responds to strong blue light by
quenching excitation energy at the phycobilisomes surrounding PSI and PSII
(Kirilovsky, 2007). Secondly, supercomplexes have been suggested to steer
electron flow by physically linking components of the electron transport chain.
Indeed, “respirasome” complexes have been described for mitochondrial
respiration and there is evidence for physical interaction between
cyanobacterial photosynthetic components such as the FNR and phycobilisome in
PCC 6803 (van Thor et al., 1999, Korn et al., 2009, Lapuente-Brun et al., 2013).
Thirdly, there is evidence for the segregation of components into functional
islands within the thylakoid membrane. Fluorescence Recovery after
Photobleaching (FRAP) has demonstrated low mobility of chlorophyll-containing
proteins in the thylakoid membranes of Synechococcus spp. PCC 7942 (Mullineaux
and Sarcina, 2002). Furthermore, electron microscopy showed an asymmetrical
distribution of photosystem reaction centres in this organism suggesting
localisation of linear and cyclic photosynthetic electron transport chains to
different regions of the thylakoid membrane (Sherman et al., 1994). Finally,
regulation at the transcriptional level has also been demonstrated to control
expression of photosynthetic and respiratory machinery (Singh et al., 2009).
Persistence of electron transfer components in the thylakoid membrane
following down-regulation in gene expression suggests that changes in gene
expression levels may be a longer-term adaptation strategy. In summary, the
Introduction
10
added complexity of two distinct energy production processes which share
common components in the same membrane requires extra levels of regulation
for rapid and efficient maintenance of cellular redox status. While this adds
complexity to cyanobacteria as a biotechnology chassis, it also supports the
remarkably versatile and flexible metabolism of phototrophic prokaryotes.
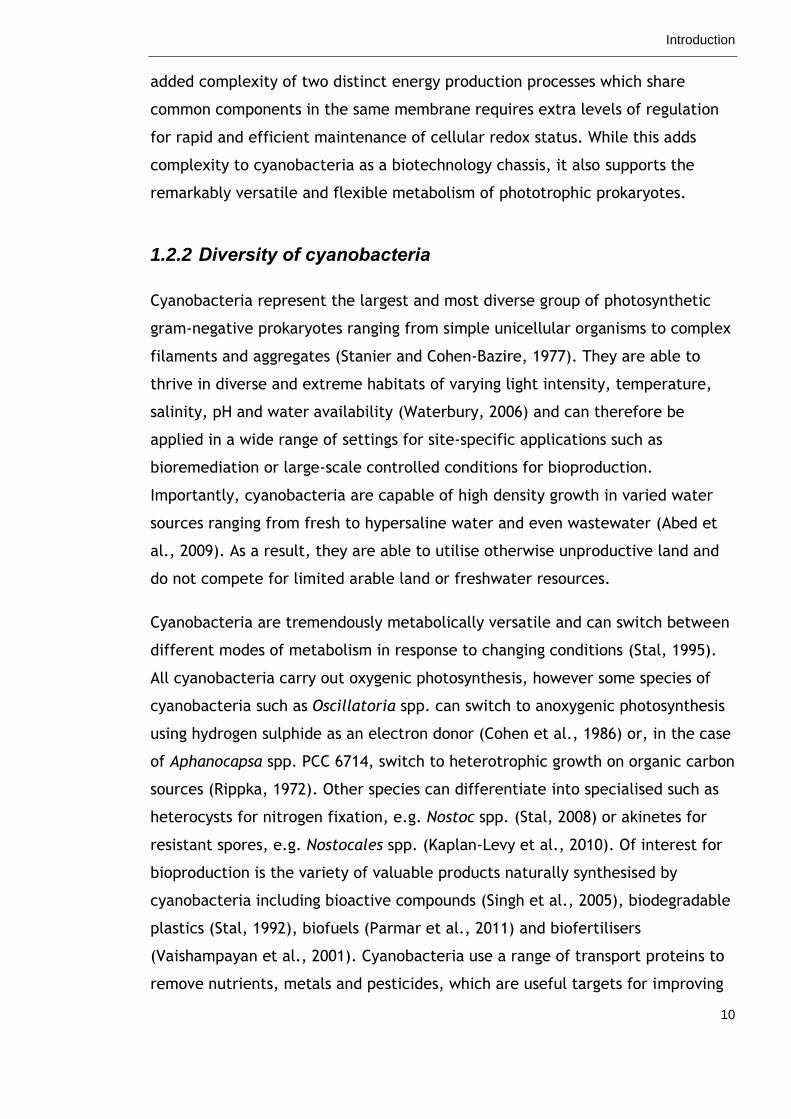
1.2.2 Diversity of cyanobacteria
Cyanobacteria represent the largest and most diverse group of photosynthetic
gram-negative prokaryotes ranging from simple unicellular organisms to complex
filaments and aggregates (Stanier and Cohen-Bazire, 1977). They are able to
thrive in diverse and extreme habitats of varying light intensity, temperature,
salinity, pH and water availability (Waterbury, 2006) and can therefore be
applied in a wide range of settings for site-specific applications such as
bioremediation or large-scale controlled conditions for bioproduction.
Importantly, cyanobacteria are capable of high density growth in varied water
sources ranging from fresh to hypersaline water and even wastewater (Abed et
al., 2009). As a result, they are able to utilise otherwise unproductive land and
do not compete for limited arable land or freshwater resources.
Cyanobacteria are tremendously metabolically versatile and can switch between
different modes of metabolism in response to changing conditions (Stal, 1995).
All cyanobacteria carry out oxygenic photosynthesis, however some species of
cyanobacteria such as Oscillatoria spp. can switch to anoxygenic photosynthesis
using hydrogen sulphide as an electron donor (Cohen et al., 1986) or, in the case
of Aphanocapsa spp. PCC 6714, switch to heterotrophic growth on organic carbon
sources (Rippka, 1972). Other species can differentiate into specialised such as
heterocysts for nitrogen fixation, e.g. Nostoc spp. (Stal, 2008) or akinetes for
resistant spores, e.g. Nostocales spp. (Kaplan-Levy et al., 2010). Of interest for
bioproduction is the variety of valuable products naturally synthesised by
cyanobacteria including bioactive compounds (Singh et al., 2005), biodegradable
plastics (Stal, 1992), biofuels (Parmar et al., 2011) and biofertilisers
(Vaishampayan et al., 2001). Cyanobacteria use a range of transport proteins to
remove nutrients, metals and pesticides, which are useful targets for improving
Introduction
11
bioextraction (Vijayakumar, 2012). Furthermore, the ability of cyanobacteria to
degrade or neutralise persistent organic pollutants such as polycyclic aromatic
hydrocarbons has applications in bioremediation (Subashchandrabose et al.,
2013). The enormous diversity of cyanobacteria enables engineers to select
strains particularly suited for specific applications.
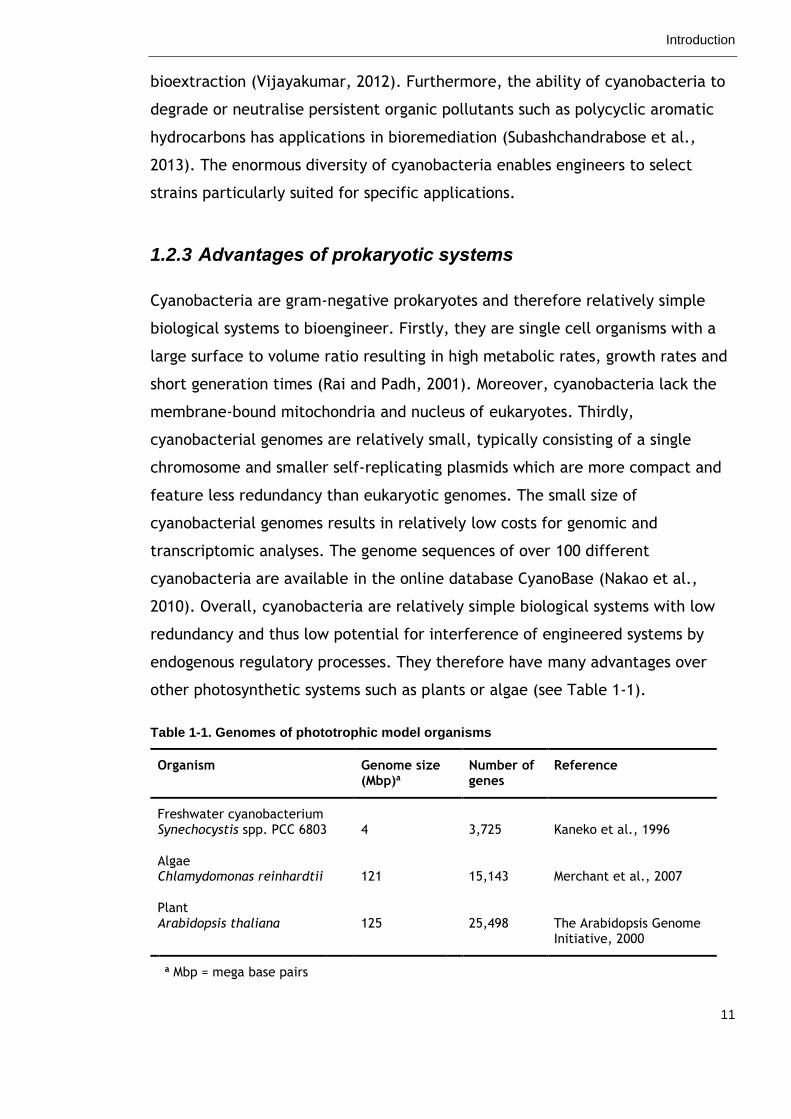
1.2.3 Advantages of prokaryotic systems
Cyanobacteria are gram-negative prokaryotes and therefore relatively simple
biological systems to bioengineer. Firstly, they are single cell organisms with a
large surface to volume ratio resulting in high metabolic rates, growth rates and
short generation times (Rai and Padh, 2001). Moreover, cyanobacteria lack the
membrane-bound mitochondria and nucleus of eukaryotes. Thirdly,
cyanobacterial genomes are relatively small, typically consisting of a single
chromosome and smaller self-replicating plasmids which are more compact and
feature less redundancy than eukaryotic genomes. The small size of
cyanobacterial genomes results in relatively low costs for genomic and
transcriptomic analyses. The genome sequences of over 100 different
cyanobacteria are available in the online database CyanoBase (Nakao et al.,
2010). Overall, cyanobacteria are relatively simple biological systems with low
redundancy and thus low potential for interference of engineered systems by
endogenous regulatory processes. They therefore have many advantages over
other photosynthetic systems such as plants or algae (see Table 1-1).
Table 1-1. Genomes of phototrophic model organisms
Organism Genome size (Mbp)a
Number of genes
Reference
Freshwater cyanobacterium Synechocystis spp. PCC 6803
4
3,725
Kaneko et al., 1996
Algae Chlamydomonas reinhardtii
121
15,143
Merchant et al., 2007
Plant Arabidopsis thaliana
125
25,498
The Arabidopsis Genome Initiative, 2000
a Mbp = mega base pairs
Introduction
12
1.2.4 Genetic manipulation of cyanobacteria
Cyanobacteria are relatively easy to genetically manipulate by natural
transformation, electroporation and conjugation using autonomous or genome-
integrating vectors (Koksharova and Wolk, 2002, Wilde and Dienst, 2011). Many
species are naturally competent and natural transformation is generally the
preferred method to introduce transgenes to cyanobacteria. Natural
transformation involves the direct uptake and incorporation of foreign DNA from
the environment into their genome. However, the process of DNA uptake is still
poorly understood. Type IV pili, multifunctional filaments which protrude from
the outer membranes of bacteria, are fundamental to the natural competence of
cyanobacteria (Yoshihara et al., 2001, Yoshihara et al., 2002) although their
exact role in DNA uptake remains to be elucidated. Exogenous DNA must be
double-stranded for binding and uptake to cyanobacteria (Essich et al., 1990). It
is converted to single-stranded DNA by a calcium-dependent nuclease located in
the plasma membrane for transfer across the cell envelope (Barten and Lill,
1995). Once inside the cell, the exogenous DNA is stably integrated into the host
chromosomal or plasmid DNA by homologous recombination.
Self-replicating plasmids can also be introduced to cyanobacteria via conjugation
or electroporation. Tri-parental conjugation is the second most common
approach to transform cyanobacteria (Huang et al., 2010). It involves the
transfer of plasmid DNA from a “cargo” strain of E. coli to cyanobacteria with
the aid of a “helper” E. coli strain expressing the required conjugation
machinery. Tri-parental conjugation is a relatively time-consuming approach
compared with natural transformation, however, as it requires additional steps
to prepare the E. coli strains and select for transformed cyanobacteria.
Alternatively, whole plasmids can be introduced into cyanobacteria via
electroporation, which involves the application of an electrical field to increase
membrane permeability. This approach is rarely used, however, as there are
concerns of mutagenic effects observed in some strains of cyanobacteria (Bruns
et al., 1989, Mühlenhoff and Chauvat, 1996).
Introduction
13
1.2.5 Unique challenges for cyanobacterial engineering
There are a number of special considerations to take into account when
engineering cyanobacteria. First and foremost, cyanobacteria represent an
incredibly diverse phylum of bacteria and this diversity has been observed at the
level of the genome sequence. Comparative genomic studies have demonstrated
considerable variation across multiple aspects including size (1.4 to 11.6 Mbp),
GC content (31-63%), number of protein coding sequences (1214-8446) and
coding nucleotide proportions (52-94 %; Larsson et al., 2011, Shih et al, 2013).
Furthermore, the sequence of the smallest cyanobacterial genome is not present
in that of the largest genome. This variation poses challenges for the
development of universal molecular tools to engineer cyanobacteria. Secondly,
cyanobacteria have the added complexity of photosynthesis-related pathways
(compared to heterotrophic prokaryotes) occurring at the same site (in the
thylakoid membranes) as respiration-related pathways (compared to
photoautotrophic eukaryotes). As a result, these two processes share many
common factors resulting in substantial crosstalk between photosynthesis and
cellular respiration (Mullineaux, 2014). Meticulous regulation and coordination of
the different electron transport chains is required to maintain the redox status
of the cells. Secondly, cyanobacteria are the only known prokaryotes to have a
circadian clock, which coordinates metabolic and behavioural responses with
daily fluctuations in light and temperature (Mackey et al., 2011). Thirdly,
cyanobacteria have evolved effective defence mechanisms against foreign DNA
in the form of restriction modification systems, physical barriers such as
extracellular nucleases, and functional barriers determined by the ability of
foreign DNA to replicate and be expressed in cyanobacteria (Stucken et al.,
2013). Finally, cyanobacteria carry multiple genome copies per cell. Copy
numbers range from three in Synechococcus spp. PCC 7942 to 142 in
Synechocystis spp. PCC 6803 subst. GT (Griese et al., 2011). For these reasons,
the development of cyanobacteria for practical applications has struggled to
match that of alternative hosts. However, while cyanobacteria are relatively
challenging prokaryotes to engineer, it is important to remember that biological
engineering is a great challenge in and of itself.

Introduction
14
1.3 Synthetic biology approaches to simplify biological
complexity
Although the fundamental laws of physics and chemistry apply to biological
processes, the predictability of experimental manipulation in biology lags far
behind that of other disciplines such as physics, chemistry and engineering. The
main problem is that biological systems are immensely complex, inherently
stochastic and highly dynamic: they grow and die, adapt and evolve. The
burgeoning new field of synthetic biology attempts to overcome this complexity
by applying traditional engineering approaches to biological problems. This
includes the use of computational modelling to inform the rational design of
biological processes and the use of standardised parts and devices to enhance
predictability of behaviour of engineered systems. Synthetic biology relies on
four main principles, which distinguish it from other disciplines such as systems
biology or biotechnology: decoupling, abstraction and modularity,
standardisation and modelling.
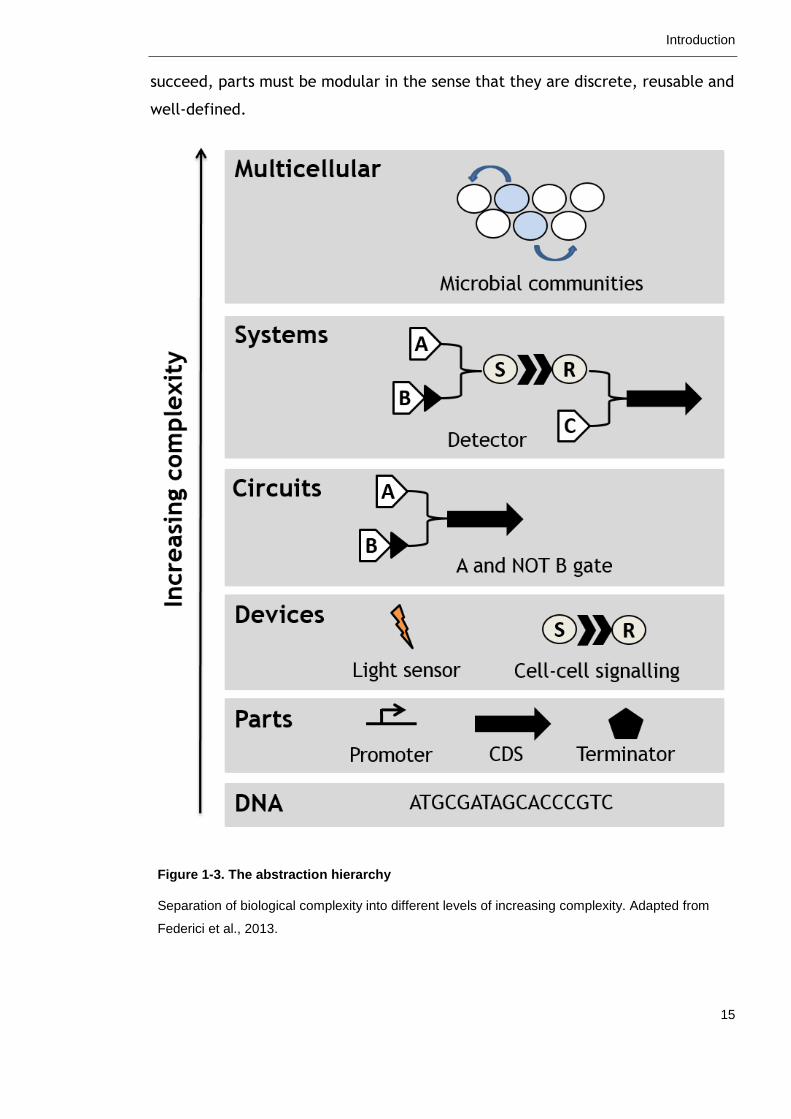
1.3.1 Decoupling, abstraction and modularity
Synthetic biology attempts to reduce biological complexity by decoupling, or
breaking down a complicated problem into many simpler problems which can
each be dealt with independently. One way to approach the problem of
biological complexity is to separate a process into different levels of increasing
complexity using an abstraction hierarchy as illustrated in Figure 1-3 (Endy,
2005). At the most basic level of the hierarchy is the DNA sequence, which
encodes genetic components, or “parts”, such as promoters and protein coding
sequences. Parts can be combined into devices with a defined function, devices
combined to form circuits and so forth. In this way, biological complexity is
subdivided into smaller, more manageable chunks. Bioengineers can assemble,
optimise and characterise modules at any level of the hierarchy without concern
for other levels and later combine them to form a functioning whole. For this to
Introduction
15
succeed, parts must be modular in the sense that they are discrete, reusable and
well-defined.
Figure 1-3. The abstraction hierarchy
Separation of biological complexity into different levels of increasing complexity. Adapted from
Federici et al., 2013.
Introduction
16
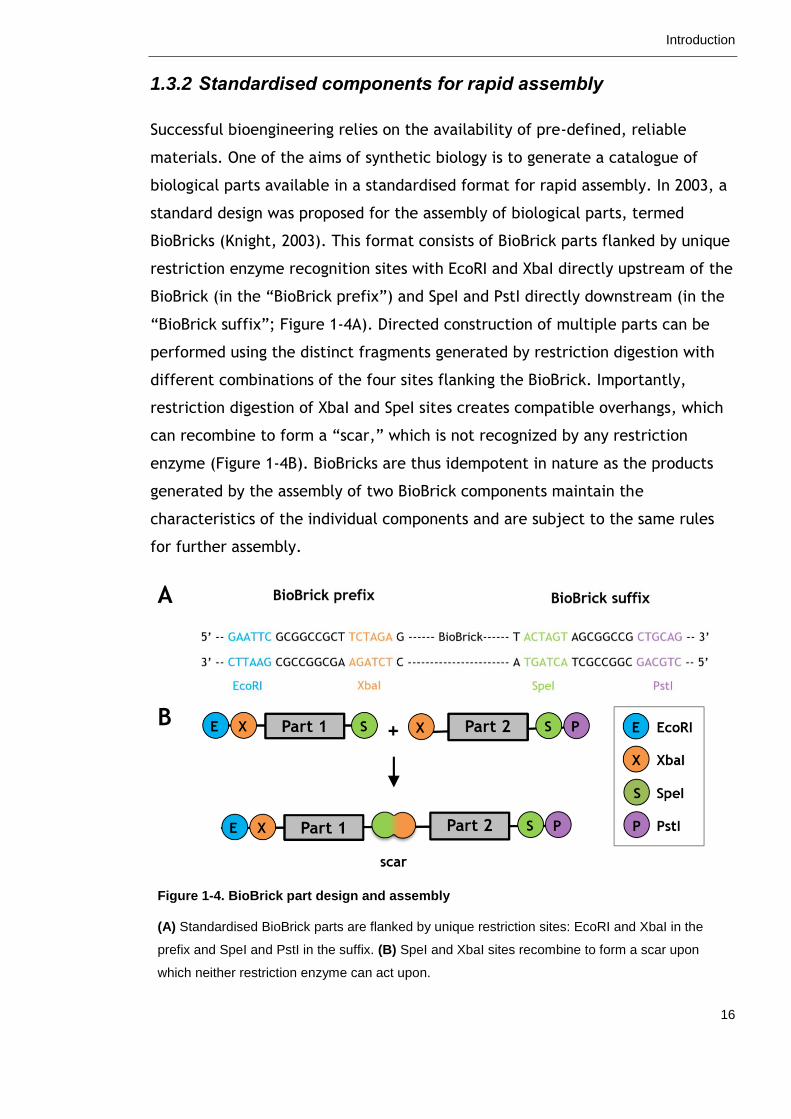
1.3.2 Standardised components for rapid assembly
Successful bioengineering relies on the availability of pre-defined, reliable
materials. One of the aims of synthetic biology is to generate a catalogue of
biological parts available in a standardised format for rapid assembly. In 2003, a
standard design was proposed for the assembly of biological parts, termed
BioBricks (Knight, 2003). This format consists of BioBrick parts flanked by unique
restriction enzyme recognition sites with EcoRI and XbaI directly upstream of the
BioBrick (in the “BioBrick prefix”) and SpeI and PstI directly downstream (in the
“BioBrick suffix”; Figure 1-4A). Directed construction of multiple parts can be
performed using the distinct fragments generated by restriction digestion with
different combinations of the four sites flanking the BioBrick. Importantly,
restriction digestion of XbaI and SpeI sites creates compatible overhangs, which
can recombine to form a “scar,” which is not recognized by any restriction
enzyme (Figure 1-4B). BioBricks are thus idempotent in nature as the products
generated by the assembly of two BioBrick components maintain the
characteristics of the individual components and are subject to the same rules
for further assembly.
A
B
Figure 1-4. BioBrick part design and assembly
(A) Standardised BioBrick parts are flanked by unique restriction sites: EcoRI and XbaI in the
prefix and SpeI and PstI in the suffix. (B) SpeI and XbaI sites recombine to form a scar upon
which neither restriction enzyme can act upon.
Introduction
17
Numerous registries of standard biological parts have since emerged, including
the Synthetic Biology Engineering Resource Centre (SynBERC) Registry, the Joint
BioEnergy Institute Public Registry (JBEI-ICE Public) and the BIOFAB:
International Open Facility Advancing Biotechnology to name a few. Due to the
idempotent nature of BioBricks, the Registry of Standard Biological Parts
(www.parts.igem.org; last accessed 06/09/2015) remains the largest and most
popular collection of genetic components (Kahl and Endy, 2013). Most of these
parts have been developed in and for E. coli however other chassis listed in the
registry include yeast, bacteriophage T7, and Bacillus subtilis. More recently,
focus has turned to cyanobacteria but currently available BioBricks have not
been effective in cyanobacteria including promoters (Huang et al., 2010) and
ribosome binding sites (Markley et al., 2014). Development and characterisation
of suitable parts for cyanobacteria is required before modules can be developed
at higher levels of the hierarchy.
1.3.3 Component characterisation for predictable behaviour
Successful bioengineering also relies on parts with robust behaviour. This
requires thorough characterisation of parts in a manner in which the character of
one part can be directly compared with that of another. A strong promoter in
one laboratory may be considered weak in another. Reference standards have
therefore been introduced as “yardsticks”. For instance, a standardised
promoter assay was developed in E. coli in which promoter activity was
normalised to the activity of a standard reference promoter to yield relative
promoter units (Kelly et al., 2009). Assessment of the same promoter library
across different laboratories demonstrated that this normalisation strategy
reduced variation between test conditions and measurement instruments. Upon
selection of suitable reference standards and thorough characterisation of
individual parts, scientists will be able to rationally select the best-suited
components for the desired process. The more thorough the characterisation and
the more robust the part, the greater the chance of the process behaving as
intended.
Introduction
18
1.3.4 Computational modelling
The construction of novel biological devices using standardised components may
give the misleading impression of an oversimplified “Plug and Play” strategy.
Indeed, it does enable the construction of increasingly complex modules by non-
specialists; the international Genetically Engineered Machine (iGEM) student
competition has successfully served as a workbench as well as a flagship for
synthetic biology (Vilanova and Porcar, 2014). However, careful consideration is
required when designing modules to ensure that when combined, components
retain the desired behaviour. Mathematical modelling and the application of
Biological Computer Aided Design (BioCAD) are important tools in the rational
design of biological organisms. Simpler software tools have been developed to
predict transcription and translation initiation rates and to design plasmid
vectors using libraries of standardised parts (Salis et al., 2009, Ellis et al., 2009,
Taton et al., 2014). The aim is to eventually use high-level software integrating
genomic, transcriptomic and metabolic data to inform the design of novel
biological systems. Before this can be achieved in cyanobacteria, however, it is
important to start at the beginning.
1.4 Taking control of gene expression
Control over gene expression is key for regulating processes in biological
systems. The first step of gene expression is the initiation of transcription at
promoters in the DNA, typically directly upstream of the gene, which are
specifically recognised by the RNA polymerase holoenzyme (Browning and Busby,
2004). Promoters are therefore the first design consideration for temporal and
spatial regulation of gene expression. They can be used as a biological switch to
trigger a biotechnological process in response to a given stimulus e.g.
environmental changes or supplements. Libraries of well-characterised,
standardised promoters spanning a wide range of transcriptional activity are
desirable for optimisation of engineered biological systems. Promoters directly
influence the amount of messenger RNA (mRNA) transcript available for
translation into functional protein. Strong promoters can thus compensate for
Introduction
19
mRNA instability, poor translation efficiency and unstable or inefficient
products. Consequently, this is the first point of optimisation in metabolic
engineering as enzymes within a given pathway may have differing efficiencies.
Promoters of varying strengths can be used to modulate the amounts of different
components within a pathway to alleviate bottlenecks within a multistep
process. Several constitutive, inducible and repressible promoters have already
been developed for cyanobacteria and are listed in Table 1-2 (Heidorn et al.,
2011, Wang et al., 2012, Berla et al., 2013). However, their use to date has
highlighted the need for further improvements.
Limitation of product titre due to insufficient transgene expression has been
illustrated by L-lactic acid production in PCC 6803 (Angermayr and Hellingwerf,
2013). The gene encoding lactate dehydrogenase (LDH) from Lactococcus lactis
was placed under the control of three different promoters in PCC 6803. Initial
titre was very low but could be increased by using a stronger promoter.
Furthermore, a linear relationship was observed between intracellular enzyme
concentration and rate of product formation. Hence, promoter strength was the
limiting factor. The strongest promoter used in this study was Ptrc, which
resulted in the production of 20 mmol L-lactic acid L-1 in 4 weeks.
Stronger promoters have since been identified such as the “super strong” cpcBA
promoter of PCC 6803 (Zhou et al., 2014). The endogenous cpcBA promoter
drives the expression of phycocyanin, a pigment-protein complex present in the
phycobilisome and the most abundant soluble protein in cyanobacteria
(Grossman et al., 1993). This promoter was recently used to enhance production
of β-phellandrene, a monoterpene of commercial value in medical, cosmetic and
cleaning industries as well as a potential fuel. Indeed, PcpcBA-driven expression of
heterologous β-phellandrene synthase resulted in the highest product titre
reported for cyanobacteria to date: 260 µg per g dry cell weight
Introduction
20
Tab
le 1
-2.
Sele
cte
d p
rom
ote
rs u
sed
in
Syn
ech
ocy
sti
s s
pp
. P
CC
680
3 a
nd
Syn
ech
oco
ccu
s s
pp
. P
CC
7002
Refe
rences
Huang e
t al.
, 2010
Huang e
t al.
, 2010
Angerm
ayr
and H
ellin
gw
erf
, 2013
Jacobse
n a
nd F
rigaard
, 2014
Ruff
ing,
2014
Angerm
ayr
and H
ellin
gw
erf
, 2013
Lin
dberg
et
al.
, 2010
Ivanik
ova e
t al.
, 2005
Boyanapall
i et
al.
, 2007
Oliveir
a a
nd L
indbla
d,
2008
Bla
si,
2012
Form
ighie
ri a
nd M
elis,
2014b
Zhou e
t al.
, 2014
Xu e
t al.
, 2011
Huang e
t al.
, 2010
Cam
sund e
t al.
, 2014
Angerm
ayr
and H
ellin
gw
erf
, 2013
Expre
ssio
n h
ost
s
Synech
ocy
stis
spp.
PCC 6
803
Synech
ocy
stis
spp.
PCC 6
803
Synech
oco
ccus
spp.
PCC 7
002
Synech
oco
ccus
spp.
PCC 7
002
Synech
ocy
stis
spp.
PCC 6
803
Synech
ocy
stis
spp.
PCC 6
803
Synech
oco
ccus
spp.
PCC 7
002
Synech
ocy
stis
spp.
PCC 6
803
Synech
ocy
stis
spp.
PCC 6
803
Synech
ocy
stis
spp.
PCC 6
803
Synech
oco
ccus
spp.
PCC 7
002
Synech
ocy
stis
spp.
PCC 6
803
Desc
ripti
on
Const
ituti
ve
Const
ituti
ve
Const
ituti
ve
Lig
ht-
inducib
le
Lig
ht-
inducib
le
Nit
rate
-inducib
le
Iron-i
nducib
le
Copper-
inducib
le
Cobalt
-inducib
le
“Super
stro
ng ”
; M
ost
acti
ve
duri
ng e
arl
y-m
id e
xponenti
al
phase
Const
ituti
ve in t
he a
bse
nce o
f th
e
lac
repre
ssor
IPTG
-inducib
le in t
he p
rese
nce o
f
the lac
repre
ssor
Sourc
e
Synech
ocy
stis
spp.
PCC 6
803
Synech
ocy
stis
spp.
PCC 6
803
Am
ara
nth
us
hyri
dus
Synech
oco
ccus
spp.
PCC 7
942
Synech
ocy
stis
spp.
PCC 6
803
Synech
ocy
stis
spp.
PCC 6
803
Synech
oco
ccus
spp.
PCC 7
002
Synech
ocy
stis
spp.
PCC 6
803
Synech
ocy
stis
spp.
PCC 6
803
Synech
ocy
stis
spp.
PCC 6
803
Esc
heri
chia
coli
Pro
mote
r
Prb
cL
Prn
pB
Ppsb
A
Ppsb
A1
Ppsb
A2
Pnir
A
Pis
iAB
PpetE
PcoaT
PcpcBA
Pcpc560
Ptr
c
Introduction
21
(Formighieri and Melis, 2014b). However, this also fails to compare with product
titres achieved in E. coli: 25 mg per g dry cell weight (Formighieri and Melis,
2014a). Although the gene encoding β-phellandrene synthase was driven by the
endogenous phycocyanin promoter, protein levels did not accumulate to similar
levels as native phycocyanin subunits from untransformed PCC 6803. Further
characterization of the cpcBA promoter will be required to explain the
discrepancies between expression levels of downstream genes.
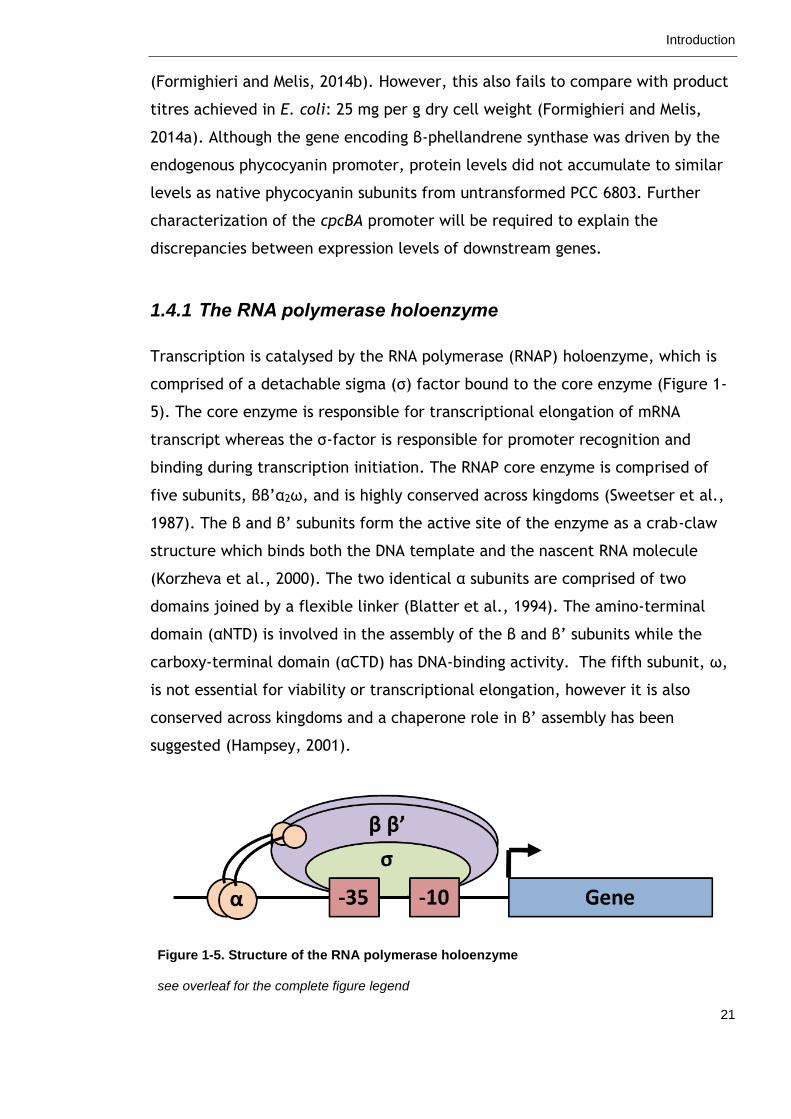
1.4.1 The RNA polymerase holoenzyme
Transcription is catalysed by the RNA polymerase (RNAP) holoenzyme, which is
comprised of a detachable sigma (σ) factor bound to the core enzyme (Figure 1-
5). The core enzyme is responsible for transcriptional elongation of mRNA
transcript whereas the σ-factor is responsible for promoter recognition and
binding during transcription initiation. The RNAP core enzyme is comprised of
five subunits, ββ’α2ω, and is highly conserved across kingdoms (Sweetser et al.,
1987). The β and β’ subunits form the active site of the enzyme as a crab-claw
structure which binds both the DNA template and the nascent RNA molecule
(Korzheva et al., 2000). The two identical α subunits are comprised of two
domains joined by a flexible linker (Blatter et al., 1994). The amino-terminal
domain (αNTD) is involved in the assembly of the β and β’ subunits while the
carboxy-terminal domain (αCTD) has DNA-binding activity. The fifth subunit, ω,
is not essential for viability or transcriptional elongation, however it is also
conserved across kingdoms and a chaperone role in β’ assembly has been
suggested (Hampsey, 2001).
Figure 1-5. Structure of the RNA polymerase holoenzyme
see overleaf for the complete figure legend
Introduction
22
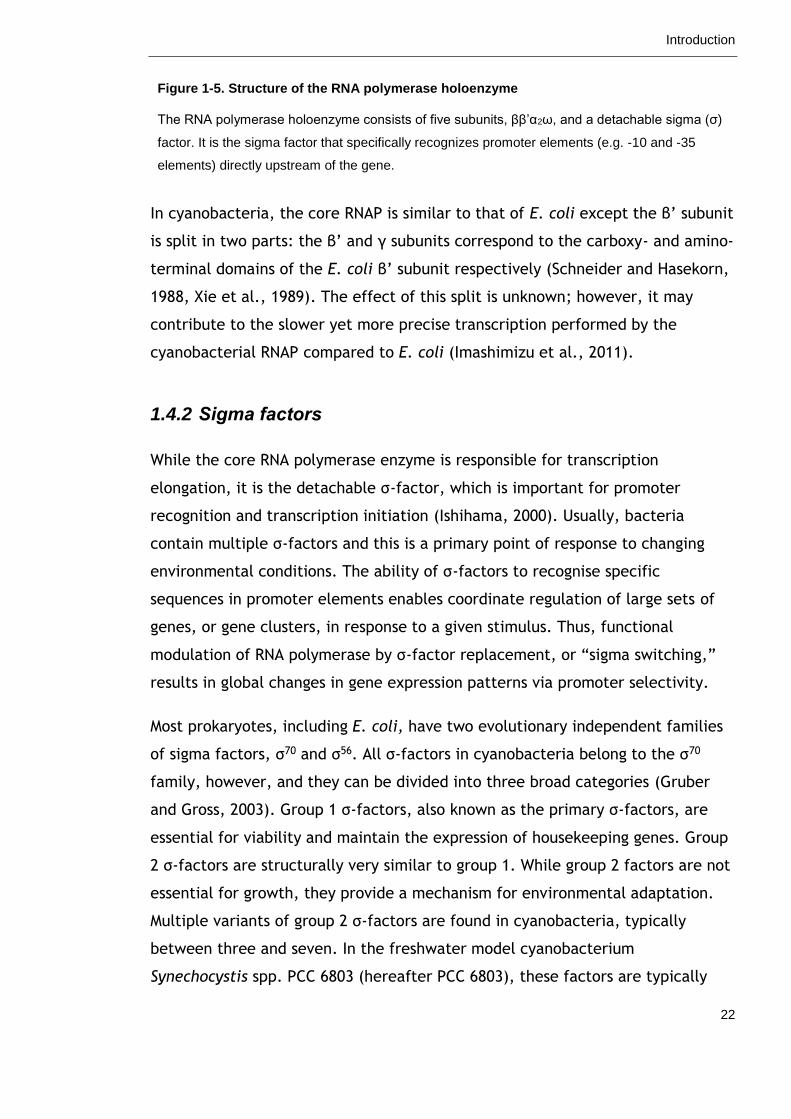
Figure 1-5. Structure of the RNA polymerase holoenzyme
The RNA polymerase holoenzyme consists of five subunits, ββ’α2ω, and a detachable sigma (σ)
factor. It is the sigma factor that specifically recognizes promoter elements (e.g. -10 and -35
elements) directly upstream of the gene.
In cyanobacteria, the core RNAP is similar to that of E. coli except the β’ subunit
is split in two parts: the β’ and γ subunits correspond to the carboxy- and amino-
terminal domains of the E. coli β’ subunit respectively (Schneider and Hasekorn,
1988, Xie et al., 1989). The effect of this split is unknown; however, it may
contribute to the slower yet more precise transcription performed by the
cyanobacterial RNAP compared to E. coli (Imashimizu et al., 2011).
1.4.2 Sigma factors
While the core RNA polymerase enzyme is responsible for transcription
elongation, it is the detachable σ-factor, which is important for promoter
recognition and transcription initiation (Ishihama, 2000). Usually, bacteria
contain multiple σ-factors and this is a primary point of response to changing
environmental conditions. The ability of σ-factors to recognise specific
sequences in promoter elements enables coordinate regulation of large sets of
genes, or gene clusters, in response to a given stimulus. Thus, functional
modulation of RNA polymerase by σ-factor replacement, or “sigma switching,”
results in global changes in gene expression patterns via promoter selectivity.
Most prokaryotes, including E. coli, have two evolutionary independent families
of sigma factors, σ70 and σ56. All σ-factors in cyanobacteria belong to the σ70
family, however, and they can be divided into three broad categories (Gruber
and Gross, 2003). Group 1 σ-factors, also known as the primary σ-factors, are
essential for viability and maintain the expression of housekeeping genes. Group
2 σ-factors are structurally very similar to group 1. While group 2 factors are not
essential for growth, they provide a mechanism for environmental adaptation.
Multiple variants of group 2 σ-factors are found in cyanobacteria, typically
between three and seven. In the freshwater model cyanobacterium
Synechocystis spp. PCC 6803 (hereafter PCC 6803), these factors are typically
Introduction
23
induced under stress conditions such as nitrogen limitation or under oxidative
stress (Osanai et al., 2008). Group 3 σ-factors are an alternative type and differ
structurally from the other two groups. In PCC 6803, these factors are involved
in specific stress survival regulons such as flagellar biosynthesis, heat shock
response and sporulation.
While cyanobacteria are extremely diverse and sigma factor composition differs
between species, they do share several characteristics. Imamura and Assayama
(Imamura and Asayama, 2009) assessed the phylogenetic relationship among σ-
factors across six species of cyanobacteria and found that certain clusters were
conserved while others likely evolved in a species-dependent manner. Consistent
between all species was the presence of a unique group 1 σ-factor closely
related to the E. coli primary σ-factor, RpoD. Group 2 σ-factors were also
relatively consistent between species and consisted of four clusters: B, C, D and
E. One σ-factor was present in each cluster with the exception of the
heterocyst-forming cyanobacteria Anabaena spp. PCC 7120, which encoded
multiple B-type σ-factors. Group 3 σ-factors also typically consisted of four
clusters: F, G, H and I, however this group was more divergent resulting in
clusters lacking in a few of the species, in particular H- and I-type σ-factors.
1.4.3 Promoter structure
Sigma factors recognise specific nucleotide sequences, or motifs, in the
upstream promoter regions of genes. In bacteria, promoters typically consist of
two conserved 6 base pair DNA sequences centred approximately 10 and 35
nucleotides upstream of the transcription start site as illustrated in Figure 1-6
(Browning and Busby, 2004). These two elements are designated the -10 TATA
box and the -35 hexamer respectively. Occasionally, additional enhancer motif
elements may be present further upstream of these two conserved regions.
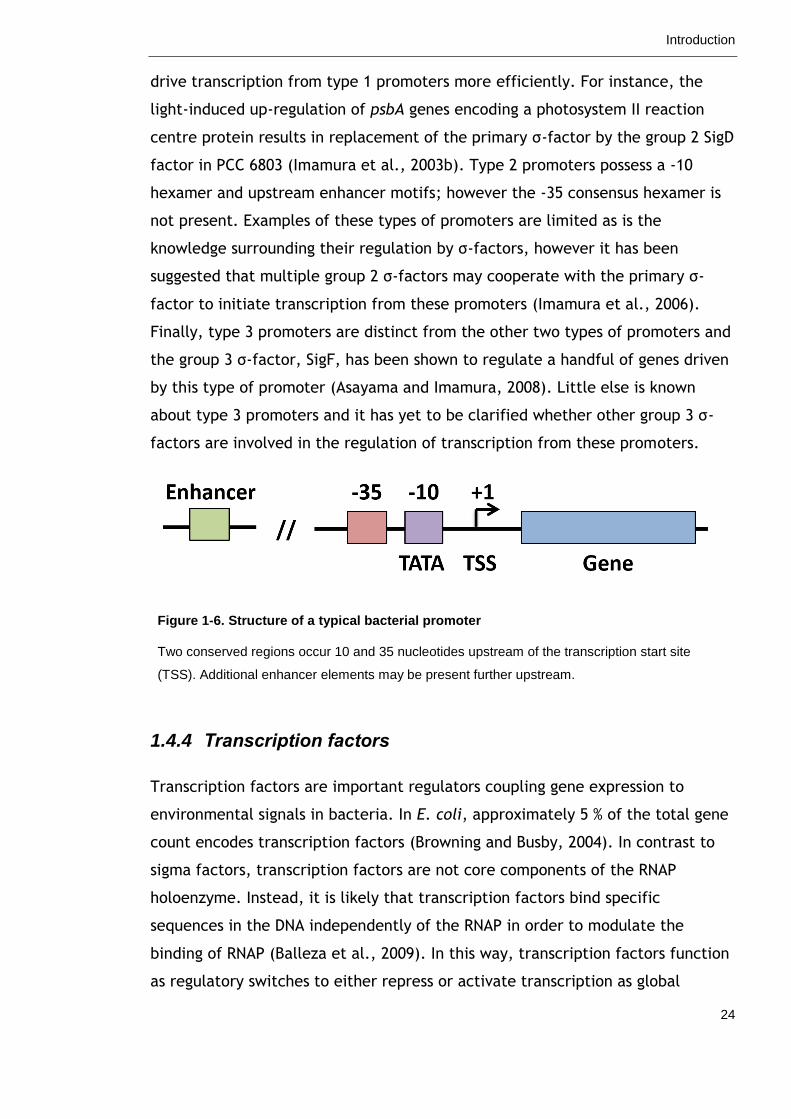
Three types of promoter have been described for cyanobacteria (Imamura and
Asayama, 2009). Type 1 promoters possess both the -10 and -35 hexamers
(consensus sequences TATAAT and TTGACA respectively) and are typically
recognised by the group 1 σ-factor. Under certain conditions, group 2 σ-factors
are induced and may replace the group 1 σ-factor in the RNAP holoenzyme to
Introduction
24
drive transcription from type 1 promoters more efficiently. For instance, the
light-induced up-regulation of psbA genes encoding a photosystem II reaction
centre protein results in replacement of the primary σ-factor by the group 2 SigD
factor in PCC 6803 (Imamura et al., 2003b). Type 2 promoters possess a -10
hexamer and upstream enhancer motifs; however the -35 consensus hexamer is
not present. Examples of these types of promoters are limited as is the
knowledge surrounding their regulation by σ-factors, however it has been
suggested that multiple group 2 σ-factors may cooperate with the primary σ-
factor to initiate transcription from these promoters (Imamura et al., 2006).
Finally, type 3 promoters are distinct from the other two types of promoters and
the group 3 σ-factor, SigF, has been shown to regulate a handful of genes driven
by this type of promoter (Asayama and Imamura, 2008). Little else is known
about type 3 promoters and it has yet to be clarified whether other group 3 σ-
factors are involved in the regulation of transcription from these promoters.
Figure 1-6. Structure of a typical bacterial promoter
Two conserved regions occur 10 and 35 nucleotides upstream of the transcription start site
(TSS). Additional enhancer elements may be present further upstream.
1.4.4 Transcription factors
Transcription factors are important regulators coupling gene expression to
environmental signals in bacteria. In E. coli, approximately 5 % of the total gene
count encodes transcription factors (Browning and Busby, 2004). In contrast to
sigma factors, transcription factors are not core components of the RNAP
holoenzyme. Instead, it is likely that transcription factors bind specific
sequences in the DNA independently of the RNAP in order to modulate the
binding of RNAP (Balleza et al., 2009). In this way, transcription factors function
as regulatory switches to either repress or activate transcription as global
Introduction
25
regulators of large gene clusters or by targeting individual genes. Negative
regulators repress transcription by binding close to the core promoter elements
and creating a steric hindrance to prevent RNAP binding. The classic example is
the lac repressor, which inhibits transcription of the lacZYA operon of E. coli in
the absence of lactose (Gilbert and Müller-Hill, 1966). It binds to the major
groove of the primary lac operator (lacO1) overlapping the transcription start
site via a helix-turn-helix motif (Lewis, 2005). In this way, it prevents
transcription of the encoded lactose metabolism genes and saves precious
cellular resources in the absence of substrate. By contrast, positive regulators
bind to regions outside of the promoter, typically upstream of the -35 element,
to aid the recruitment and stabilisation of RNAP in order to activate
transcription. In the example of the lac operon, cyclic AMP receptor proteins
(CRPs; also referred to as catabolite activator proteins, CAPs) undergo a
conformational change upon cAMP binding which promotes CRP binding adjacent
to the lac promoter and subsequent transcription of the lac operon (Busby and
Ebright, 1999).
Transcription factor activity is regulated by three main mechanisms. Firstly,
DNA-binding affinity can be modulated by small ligands whose concentrations
fluctuate in response to changing environmental conditions. For instance, the
presence of allolactose (a product of lactose) activates the expression of genes
involved in lactose metabolism by inhibiting DNA binding ability of the lac
repressor (Müller-Hill, 1996). Isopropyl β-D-1-thiogalactopyranoside (IPTG) is an
analog of allolactose commonly used to activate expression of promoters
containing a lac operator such as Ptrc. Secondly, covalent modification can also
alter the DNA-binding affinity of transcription factors. Common examples are
two-component signal transduction systems consisting of a sensor kinase, which,
upon detection of specific external stimuli, phosphorylates and activates a
response regulator, which often contains a DNA-binding domain (Parkinson and
Kofoid, 1992). Thirdly, the activity of some transcription factors is regulated by
their intracellular concentration determined either at the transcript or protein
level. Finally, transcription factor activity can also be regulated by sequestration
by regulatory proteins. In this way, bacteria are able to monitor external
conditions and adjust accordingly.
Introduction
26
1.4.5 Limitations of available expression systems for
cyanobacteria
In an ideal system for synthetic biology, the host organism, or chassis, should
have minimal interaction with the engineered system and merely provide the
machinery and resources necessary for the engineered process. Orthologous
systems have been developed which are comprised of components which have
evolved outside of the chassis and act independently of endogenous processes
(An and Chin, 2011, Camsund and Lindblad, 2014). This prevents undesirable
interaction between transcriptional regulatory elements and host factors thus
reducing potential interference from host regulatory networks. Efforts have been
made to optimize and implement orthologous expression systems commonly used
in prokaryotes, however they have had limited success in cyanobacteria. For
instance, the most common orthologous approach to regulate gene expression in
bacteria is based on the lacO-lacI system from E. coli. This typically involves
IPTG induction of gene expression from the chimeric Ptrc promoter from E. coli
consisting of the -35 sequence (TGAC) of Ptrp and the -10 sequence (TATAA) from
Plac separated by a 17 base pair spacer containing a lacO operator sequence
(Amann et al., 1988). This is a relatively strong promoter in PCC 6803; however,
repression is poor under non-induced conditions (Huang et al., 2010). In an
attempt to enhance non-induced silencing, a library of Ptrc-derived promoters
was generated by varying lacO operator sequence, location and spacing relative
to the -35 and -10 elements (Camsund et al., 2014). Despite these efforts,
repression under non-induced conditions remained poor. However, placement of
lacO downstream of the -10 element in Ptrc1O-prox resulted in greatly enhanced
expression, so this promoter can serve as a strong constitutive promoter for
cyanobacteria.
Another inducible gene expression system which has undergone substantial
development for application in cyanobacteria is based upon the Tet repressor
(TetR) from bacteriophage lambda. In this system, gene expression is repressed
by the binding of TetR to its cognate DNA sequence tetO within the PtetR
promoter (Bertram and Hillen, 2008). Addition of the inducer
anhydrotetracycline (aTc) inhibits the DNA binding ability of TetR and thus
Introduction
27
activates transcription from PtetR. In E. coli, TetR has a very high affinity for tetO
over non-specific DNA sequences resulting in a wide regulatory window from one
molecule of mRNA per three cells of E. coli under non-induced conditions to
5000-fold induction in the presence of aTc (Lutz and Bujard, 1997). Initially, very
low PtetR activity was detected using a GFP-based promoter assay in PCC 6803
(Huang et al., 2010). Conversion of the -10 element to the PCC 6803 consensus
sequence (TATAAT) only served to further reduce promoter activity (Huang and
Lindblad, 2013). Systematic alteration of nucleotide sequences between the -10
element and transcriptional start site resulted in substantial increases in
promoter strength of up to 467-fold induction by promoter L15 in the presence
of aTc. However, poor repression was still observed under non-induced
conditions. Modification of TetR expression to improve protein stability resulted
in slightly improved repression at the expense of weaker induced promoter
strength. Despite extensive modification, this orthogonal expression system
continues to suffer from leaky repressed activity and a relatively narrow range of
regulation.
The most effective promoters to regulate gene expression in cyanobacteria are
currently native cyanobacterial promoters. These originate from a handful of
model species and have mostly been characterised in their native settings
(Heidorn et al., 2011, Wang et al., 2012, Berla et al., 2013). While these tools
have been critical for unravelling the core biology of cyanobacteria, they were
originally developed to study specific processes in a limited number of species of
cyanobacteria and are not necessarily suitable for practical applications. For
instance, a large number of light-inducible promoters have been developed
during extensive research into photosynthesis and circadian rhythm in
cyanobacteria. One example is the promoter of the photosystem II D1
polypeptide (psbA2). PpsbA2 is considered a relatively strong promoter in PCC
6803 and is routinely used to control heterologous processes such as lactate and
monoterpene production (Eriksson et al., 2000, Angermayr and Hellingwerf,
2013, Formighieri and Melis, 2014b). Light-responsive promoters are not ideal
regulators for gene expression however, as high-density cultures experience a
steep gradient of light intensity throughout the culture. This results in zones
where light intensity and therefore promoter activity becomes limiting.
Introduction
28
Similarly, extensive nutrient limitation studies in cyanobacteria have identified a
variety of nutrient-regulated promoters. These promoters are generally not ideal
for biotechnology as their regulation relies on factors essential for growth. For
instance, nutrient-inducible promoters such as the nitrate-inducible promoter of
ferredoxin-nitrite reductase (nirA) necessarily couples biomass accumulation
with heterologous protein synthesis, which may result in growth inhibition and
therefore reduced biomass and hence product yield (Ivanikova et al., 2005).
Alternatively, nutrient-repressible promoters such as the promoter of the
sodium-dependent bicarbonate transporter (sbtA) regulated by inorganic carbon
availability rely on the depletion of nutrients, which may be required for product
synthesis (Wang et al., 2004). More recently, metal-inducible promoters
regulated by ions such as copper, zinc, nickel, cobalt and cadmium have been
developed and optimal conditions established to prevent disturbances in
metabolism (Peca et al., 2008, Blasi, 2012). While these promoters are highly
efficient in terms of both repression during non-induced conditions and ranges of
regulation, these approaches are not suitable for large-scale industrial processes
due to high costs and environmental concerns. Furthermore, the sensitivity of
the promoters means that all culture media would have to be of extremely high
purity, incurring further costs and challenges to the biomanufacturing process.
1.5 Stationary phase growth as a manufacturing platform
Practical applications typically require large biovolumes to maximise the effect
of the engineered process, for instance in bioproduction, biodesalination,
bioremediation or bioextraction. Computational analysis of stoichiometric
constraints of cyanobacterial metabolism indicates trade-offs between biomass
production and product synthesis (Knoop and Steuer, 2015). Bacterial cultures
grown in batch culture divide exponentially until one or more essential factors in
the environment becomes limiting. At this point, cells stop dividing and the
culture reaches a steady state cell density, which is nominally described as the
stationary phase of growth (Llorens et al., 2010). Promoters specifically active
during this growth phase would be particularly useful as transgene induction at
this stage would a) maximize the biovolume to perform the desired process, b)
Introduction
29
avoid trade-offs between biomass production and product synthesis and c)
minimise time of exposure to toxic compounds arising from the engineered
system.
Over the last couple of years, a number of studies aimed at producing
commodity chemicals in cyanobacteria report the highest production titres at
the onset of stationary phase growth. This includes the production of isoprene
and isopropanol in S. elongatus spp. PCC 7942 (Gao et al., 2015; Hirokawa et al.,
2015), methanol in marine cyanobacteria including Synechococcus spp. 8102 and
Prochlorococcus marinus (Mincer and Aicher, 2016), and biopolymers in Spirulina
(Martins et al., 2014). These observations, paired with the predicted trade-off
between biomass generation and product synthesis, indicate that the separation
of growth and production phases can enhance the productivity of cyanobacteria
cell factories (Knoop and Steuer, 2015). Hirokawa et al. developed a stationary
phase production system in PCC 7942. In this system, the growth phase occurred
under light and aerobic conditions and cultures were then transferred to dark
and anaerobic conditions for the isopropanol production phase (Hirokawa et al.,
2015). While this approach product yield in this experimental set up, it is not
suitable for processes requiring light and/or oxygen. Alternative approaches
should therefore be considered for a stationary phase production platform.
Promoters that specifically respond to changes in growth phase, particularly the
transition from exponential to stationary phase, would be invaluable to the
development of stationary phase production platforms. Notably, they can serve
as auto-inducible switches regulated by endogenous cues thus avoiding the need
for supplements and enhancing the sustainability of the system. Stationary
phase-specific promoters have been developed for other bacteria including E.
coli, Pseudomonas putida and Bacillus subtilis (Miksch and Dobrowolski, 1995,
Cases et al., 1996, Schumann, 2007). These systems rely on “sigma switching”
whereby the RNA polymerase holoenzyme alters its promoter specificity by
replacing the primary sigma factor with alternative sigma factors. Promoters
regulated in this manner have been identified in cyanobacteria, such as the
nitrogen-regulated promoter PglnB-54,-53, which is activated by RNA polymerase
sigma factor SigC during stationary phase growth in PCC 6803 (Asayama et al.,
Introduction
30
2004). As discussed in the previous section, nutrient-regulated gene expression is
not ideal, particularly when it depends on the depletion of a key macronutrient
such as nitrogen. Efforts have been made towards unravelling late exponential
phase and stationary phase-specific gene expression and its regulation, however
more general late growth regulators and promoters are still lacking for
cyanobacteria.
1.6 Objectives
The main aim of this PhD project was to develop robust promoters, which can
act as a genetic switch to activate gene expression in high-density cultures of
cyanobacteria.
The first objective was to develop an assay to characterise promoter activity in
growing cultures of cyanobacteria. For applications in synthetic biology, it was
important to develop tools compatible with current registries of standard
biological parts. This involved the development of a BioBrick-compatible plasmid
vector, selection of a suitable reporter and the development of a library of
ribosomal binding sites to detect a wide range of transcriptional activity.
The second objective was to identify genes specifically induced during late
exponential or early stationary phase in order to identify growth phase-specific
promoters. To ensure that identified genes and promoters were robust, it was
important to identify a range of conditions that resulted in transition from
exponential to stationary phase for different reasons, i.e. limitation by different
factors. This provided a variety of backgrounds to study gene expression
patterns. Expression profiles of published growth phase-specific genes were then
examined by quantitative RT-PCR (qPCR) and novel growth phase-specific gene
clusters were identified by RNA sequencing (RNAseq).
Materials and methods
31
Chapter 2. Materials and methods
All reagents used for media preparation were purchased from Sigma-Aldrich
(Dorset, England), Thermo Fisher Scientific (Loughborough, UK) or VWR
(Lutterworth, UK). Custom-made primers were purchased from Invitrogen (Life
Technologies, Darmstadt, Germany). All restriction enzymes were purchased
from New England Biolabs (Hitchin, UK).
2.1 Standard cyanobacteria methods
2.1.1 Strains of cyanobacteria
2.1.1.1 Synechococcus spp. PCC 7002
Synechococcus spp. PCC 7002 (hereafter PCC 7002) was a kind gift from Prof.
John Golbeck, Pennsylvania State University, PA, USA. It was grown
photoautotrophically in Medium A+ (Stevens and Porter, 1980) as described in
Section 3.2.1. In brief, cyanobacteria were selected as single colonies from
plates and inoculated to 20 ml media supplemented with spectinomycin (50 µg
ml-1) in glass culture tubes (VWR, Lutterworth, UK). Cultures selected for further
growth analysis were inoculated to 150 ml media in 250 ml Erlenmeyer flasks
(VWR, UK). Cultures were grown in long day (LD; photoperiod 16/8 h light/dark
and light intensity 120 µmol m-2 s-1) at 30 °C. Cultures were rapidly sparged with
ambient air from an aquarium pump (AP4 Interpet Aqua Air Pump, 123 Aquatics,
Westerham, UK) humidified with distilled water through a Büchner flask (VWR,
UK) as shown in Figure 3-1.
2.1.1.2 Synechocystis spp. PCC 6803
Synechocystis spp. PCC 6803 (hereafter PCC 6803) was a kind gift from Prof.
Linda Lawton, Robert Gordon University, Aberdeen, UK. It was grown
photoautotrophically in BG11 growth medium (Stanier et al., 1971) as described
in Section 4.2.1. In brief, 150 ml liquid cultures were grown in 250 ml Dreschel
Materials and methods
32
flasks (VWR, Lutterworth, UK) maintained in water baths equilibrated at 30 °C in
short day (SD; photoperiod 12/12 h light/dark). Cultures were sparged with
ambient air with 5 flasks per aquarium pump outlet (AP4 Interpet Aqua Air
Pump, 123 Aquatics, Westerham, UK) humidified with distilled water through a
Büchner flask (VWR, UK) as shown in Figure 4-1. Nutrient-limited media are
described in Section 4.2.3.
2.1.2 Growth of cyanobacteria on agar plates
To prepare solid media for plates, double strength growth media (BG11 for PCC
6803 or Medium A+ for PCC 7002) and 2 % agar were prepared and autoclaved
separately at 121 °C for 20 min. The solutions were allowed to cool to 40 °C
before being combined 1:1 (volume) and dispensed into petri dishes. Plates were
sealed with parafilm and grown in LD at 30 °C. Single green colonies appeared
after 7-10 days. Plates were then transferred to SD at 23 °C with a light intensity
of approximately 50 µmol m-2 s-1 for longer-term maintenance.
2.1.3 Long-term storage of cyanobacteria
2 ml of mid-exponential cyanobacterial cultures (OD730 1 to 3) were harvested in
a 2 ml Eppendorf tube by centrifugation at 7000 rpm for 2 min and the
supernatant removed. Under low light intensity, cells were gently resuspended
in 1 ml of half strength media with 8 % DMSO by pipetting. The suspension was
transferred to a 2 ml Nalgene® cryogenic vial (VWR, Lutterworth, UK) and a
further 1 ml of half strength media with 8 % DMSO was added to the suspension.
The cryogenic vials were transferred to a Mr. Frosty freezing container (VWR,
UK) containing 100 % isopropanol equilibrated at 4 °C and stored at -80 °C for a
minimum of 6 h before transfer to a cardboard box stored at -80 °C.
Frozen stocks of cyanobacterial cells were thawed in the dark or under low light
conditions. Cryogenic vials were rapidly thawed in distilled water equilibrated to
30 °C. The cells were gently mixed by inversion and subjected to two rounds of
centrifugation at 5000 rpm for 1.5 min followed by resuspension in 2 ml fresh
media by inversion. The 2 ml cell suspension was transferred to a sterile glass
Materials and methods
33
culture tube wrapped in aluminium foil and allowed recover overnight in the
dark. Cells were then cultured as described in Section 2.1.1.
2.1.4 Monitoring growth
2.1.4.1 Optical density
Optical density of cyanobacteria was measured at 730 nm (OD730) in a Lambda 45
UV/VIS Spectrophotometer (PerkinElmer, Cambridge, UK). Unless otherwise
stated, liquid cultures of cyanobacteria were diluted in fresh media to the linear
range of the spectrophotometer (OD730 0.05 to 1).
2.1.4.2 Cell counting
Liquid cultures of cyanobacteria were diluted in fresh media to OD730 0.1 to 0.6.
1 ml of diluted culture was added to a glass Sedgewick Rafter counting chamber
(Thermo Fisher Scientific, Loughborough, UK). The counting chamber was placed
on the stage of an Axiovert 200 microscope (ZEISS, Jena, Germany) with a
40x/0.6 objective (ZEISS, Germany) and allowed to settle for 10 min before
image capture. Imaging was performed using an AxioCam HRc digital camera
(ZEISS, Germany) and AxioVision LE software (ZEISS Vision GmbH, version 3.0.6
SPR) where 10 random 512 x 512 fields of the slide were acquired. Image
analysis was performed using Image J software v. 1.49 (Rasband and Bright,
1995) as follows. Scales were set using a reticule-containing image by translating
measured distance into pixels (100 μm = 632 pixels). Grey scale images of cells
were inverted and the threshold set from 0 to 90. Noise reduction was
performed using the erosion operation “Open” to remove isolated pixels
followed by watershed segmentation to separate adjacent cells. Finally, the
number of cells was determined by analyzing particles with a minimum size of
0.2 μm.
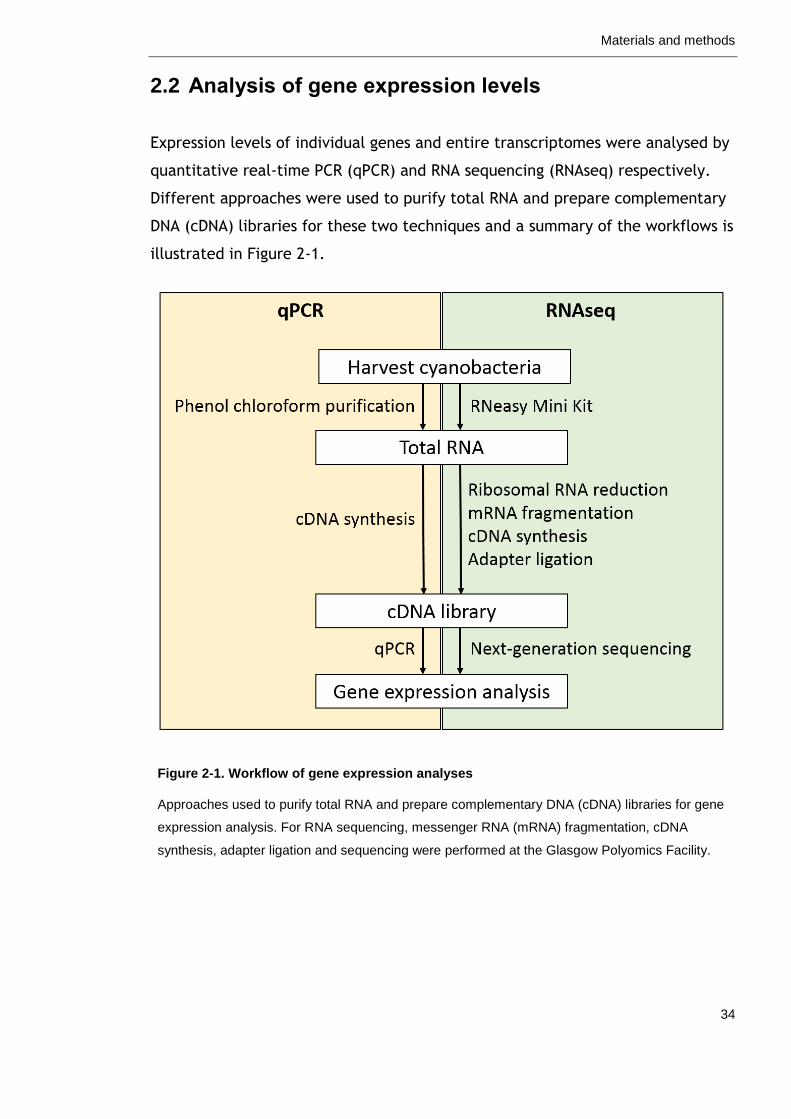
Materials and methods
34
2.2 Analysis of gene expression levels
Expression levels of individual genes and entire transcriptomes were analysed by
quantitative real-time PCR (qPCR) and RNA sequencing (RNAseq) respectively.
Different approaches were used to purify total RNA and prepare complementary
DNA (cDNA) libraries for these two techniques and a summary of the workflows is
illustrated in Figure 2-1.
Figure 2-1. Workflow of gene expression analyses
Approaches used to purify total RNA and prepare complementary DNA (cDNA) libraries for gene
expression analysis. For RNA sequencing, messenger RNA (mRNA) fragmentation, cDNA
synthesis, adapter ligation and sequencing were performed at the Glasgow Polyomics Facility.
Materials and methods
35
2.2.1 Quantitative real-time Polymerase Chain Reaction (qPCR)
2.2.1.1 RNA purification for qPCR
Total RNA was extracted from cell pellets weighing approximately 30 mg. Pellets
were resuspended in 250 μl TE buffer (10 mM Tris-HCl, pH 8 with 1 mM EDTA).
0.5 g of 0.5-mm-diameter glass beads, 25 μl 10 % SDS, 250 μl phenol equilibrated
with 0.1 M sodium citrate, pH 4.3 and 250 μl chloroform were added. Cells were
disrupted using a QIAGEN TissueLyser (QIAGEN, Manchester, UK) with three
cycles of 30 Hz for 1 min with 2 min of rest on ice between runs. Liquid phases
were then separated by centrifugation at 13,200 rpm for 15 m and the upper
aqueous phase was extracted twice with an equal volume of chloroform. RNA
was precipitated with 0.1 volume of 10 M LiCl and 2.5 volumes of ice-cold 100 %
ethanol overnight. The RNA was washed in 750 µl of 70 % ethanol, vacuum-dried
for 10 min in a Concentrator 5301 (Eppendorf, Hamburg, Germany) and
resuspended in TE buffer.
2.2.1.2 Reverse-Transcriptase Polymerase Chain Reaction
Genomic DNA was removed from samples containing 1 µg of total RNA with RQ1
RNase-free DNaseI (Promega, Southampton, UK) following the manufacturer’s
instructions. Reverse transcription of RNA to produce cDNA was performed using
the First Strand cDNA Synthesis Kit and random primers following manufacturer’s
instructions (Thermo Fisher Scientific, Loughborough, UK). cDNA was diluted
1:10 and stored at -20 °C.
2.2.1.3 Generation of standards for qPCR
PCR amplification of standards was performed as described in Section 2.3.2
(High-precision PCR conditions) using cDNA as template and primers designed for
qPCR. PCR products were separated by agarose gel electrophoresis, purified with
the QIAquick Gel Extraction Kit (QIAGEN, Manchester, UK) and DNA
concentration was determined by spectrophotometry (BioPhotometer plus 6132,
Eppendorf, Hamburg, Germany). Purified PCR product concentrations were
Materials and methods
36
adjusted to 1 pg µl-1 and ten-fold serial dilutions were performed to produce
standard curves for each qPCR run.
2.2.1.4 Quantitative Real-Time Polymerase Chain Reaction (qPCR)
qPCR was performed in a StepOnePlus Real-Time PCR System (Life Technologies,
Darmstadt, Germany). Primers listed in Table 2-1 were designed to amplify 100-
250 bp products with an annealing temperature of 60 °C using the web-based
Primer3 software tool (Koressaar and Remm, 2007, Untergasser et al., 2012).
Primers were reconstituted in water to 100 μM and interrogated using Brilliant III
Ultra Fast SYBR Green QPCR Master Mix (Agilent, Santa Clara, CA, USA). The
reaction setup is described in Table 2-2 and the cycler conditions in Table 2-3.
Optimal reference genes were selected using geNorm software (Vandesomepele
et al., 2009). Standard curves were included in all the qPCR runs using serial
dilutions of gel purified RT-PCR products (see Section 2.2.2.2). Negative controls
(no template water controls) were included and a melting curve analysis was
performed in all assays. qPCRs were performed with minimum three biological
replicates of each condition.
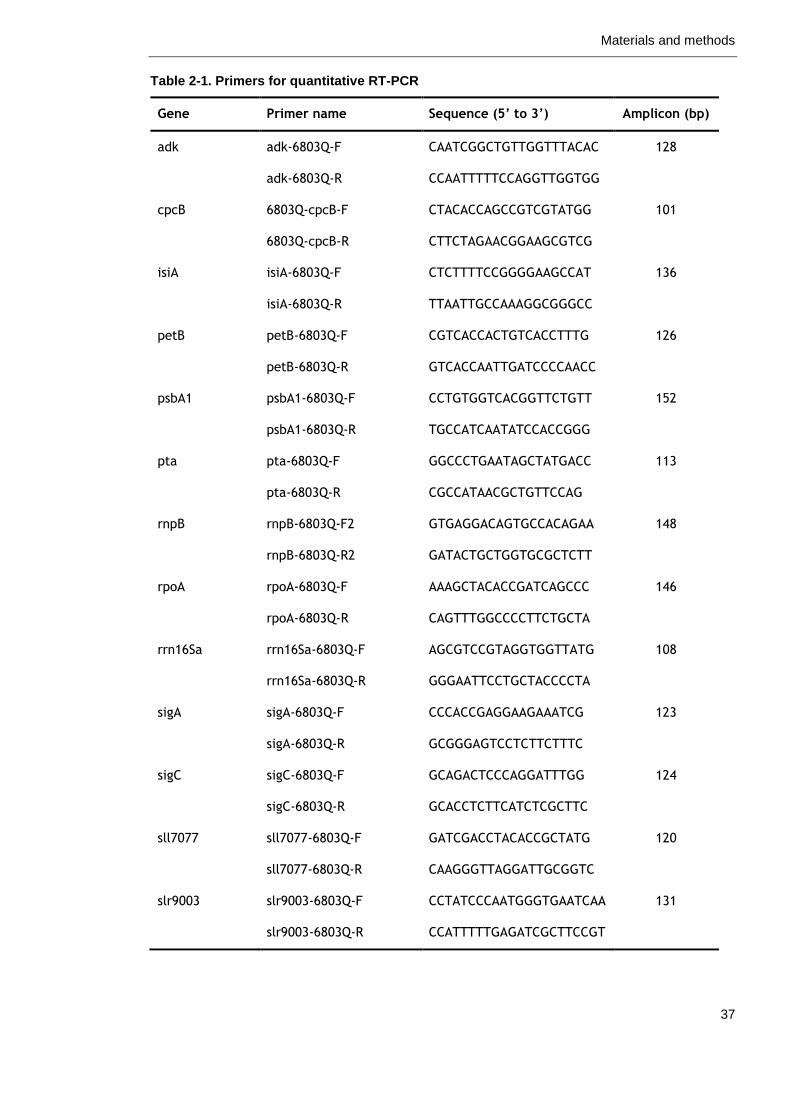
Materials and methods
37
Table 2-1. Primers for quantitative RT-PCR
Gene Primer name Sequence (5’ to 3’) Amplicon (bp)
adk adk-6803Q-F CAATCGGCTGTTGGTTTACAC 128
adk-6803Q-R CCAATTTTTCCAGGTTGGTGG
cpcB 6803Q-cpcB-F CTACACCAGCCGTCGTATGG 101
6803Q-cpcB-R CTTCTAGAACGGAAGCGTCG
isiA isiA-6803Q-F CTCTTTTCCGGGGAAGCCAT 136
isiA-6803Q-R TTAATTGCCAAAGGCGGGCC
petB petB-6803Q-F CGTCACCACTGTCACCTTTG 126
petB-6803Q-R GTCACCAATTGATCCCCAACC
psbA1 psbA1-6803Q-F CCTGTGGTCACGGTTCTGTT 152
psbA1-6803Q-R TGCCATCAATATCCACCGGG
pta pta-6803Q-F GGCCCTGAATAGCTATGACC 113
pta-6803Q-R CGCCATAACGCTGTTCCAG
rnpB rnpB-6803Q-F2 GTGAGGACAGTGCCACAGAA 148
rnpB-6803Q-R2 GATACTGCTGGTGCGCTCTT
rpoA rpoA-6803Q-F AAAGCTACACCGATCAGCCC 146
rpoA-6803Q-R CAGTTTGGCCCCTTCTGCTA
rrn16Sa rrn16Sa-6803Q-F AGCGTCCGTAGGTGGTTATG 108
rrn16Sa-6803Q-R GGGAATTCCTGCTACCCCTA
sigA sigA-6803Q-F CCCACCGAGGAAGAAATCG 123
sigA-6803Q-R GCGGGAGTCCTCTTCTTTC
sigC sigC-6803Q-F GCAGACTCCCAGGATTTGG 124
sigC-6803Q-R GCACCTCTTCATCTCGCTTC
sll7077 sll7077-6803Q-F GATCGACCTACACCGCTATG 120
sll7077-6803Q-R CAAGGGTTAGGATTGCGGTC
slr9003 slr9003-6803Q-F CCTATCCCAATGGGTGAATCAA 131
slr9003-6803Q-R CCATTTTTGAGATCGCTTCCGT
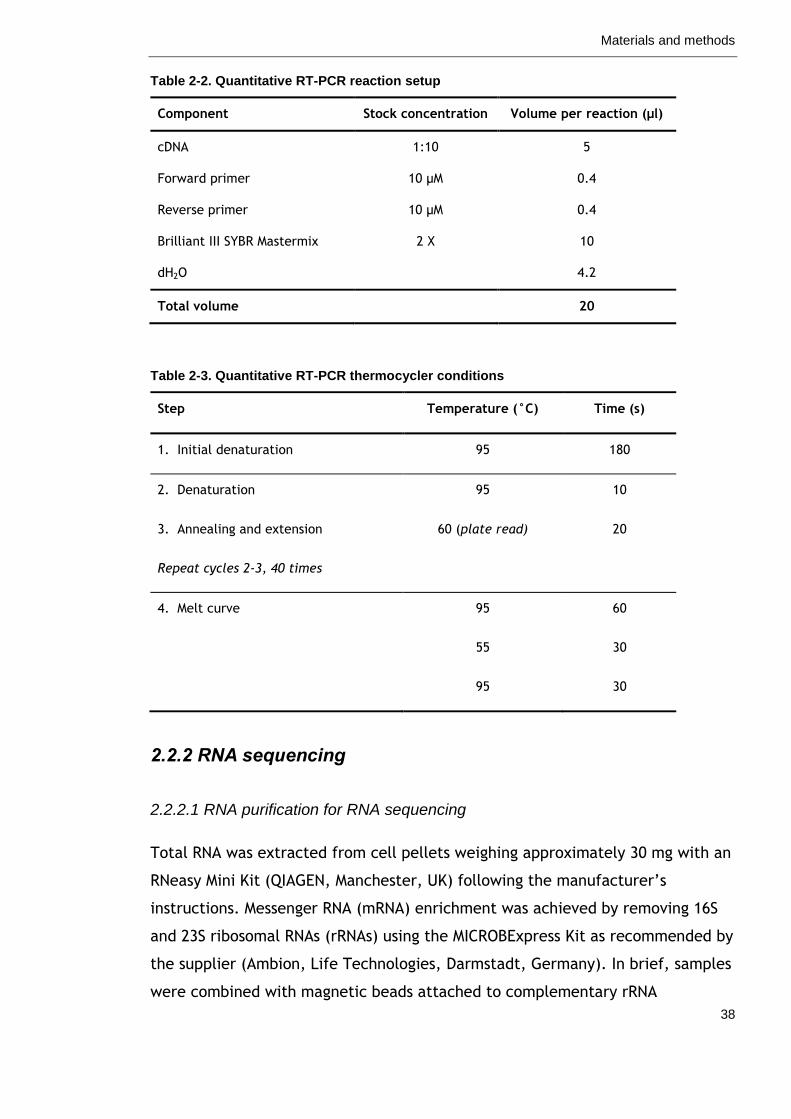
Materials and methods
38
Table 2-2. Quantitative RT-PCR reaction setup
Component Stock concentration Volume per reaction (µl)
cDNA 1:10 5
Forward primer 10 µM 0.4
Reverse primer 10 µM 0.4
Brilliant III SYBR Mastermix 2 X 10
dH2O 4.2
Total volume 20
Table 2-3. Quantitative RT-PCR thermocycler conditions
Step Temperature (°C) Time (s)
1. Initial denaturation 95 180
2. Denaturation 95 10
3. Annealing and extension 60 (plate read) 20
Repeat cycles 2-3, 40 times
4. Melt curve 95 60
55 30
95 30
2.2.2 RNA sequencing
2.2.2.1 RNA purification for RNA sequencing
Total RNA was extracted from cell pellets weighing approximately 30 mg with an
RNeasy Mini Kit (QIAGEN, Manchester, UK) following the manufacturer’s
instructions. Messenger RNA (mRNA) enrichment was achieved by removing 16S
and 23S ribosomal RNAs (rRNAs) using the MICROBExpress Kit as recommended by
the supplier (Ambion, Life Technologies, Darmstadt, Germany). In brief, samples
were combined with magnetic beads attached to complementary rRNA
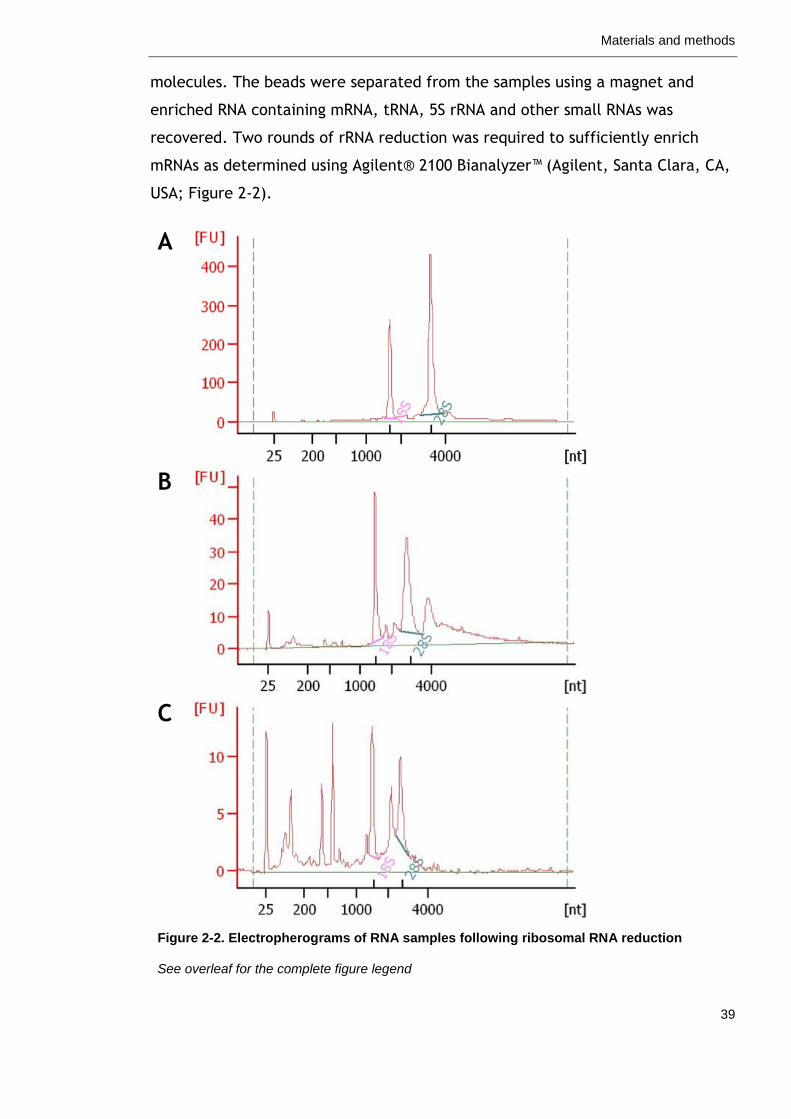
Materials and methods
39
molecules. The beads were separated from the samples using a magnet and
enriched RNA containing mRNA, tRNA, 5S rRNA and other small RNAs was
recovered. Two rounds of rRNA reduction was required to sufficiently enrich
mRNAs as determined using Agilent® 2100 Bianalyzer™ (Agilent, Santa Clara, CA,
USA; Figure 2-2).
A
B
C
Figure 2-2. Electropherograms of RNA samples following ribosomal RNA reduction
See overleaf for the complete figure legend
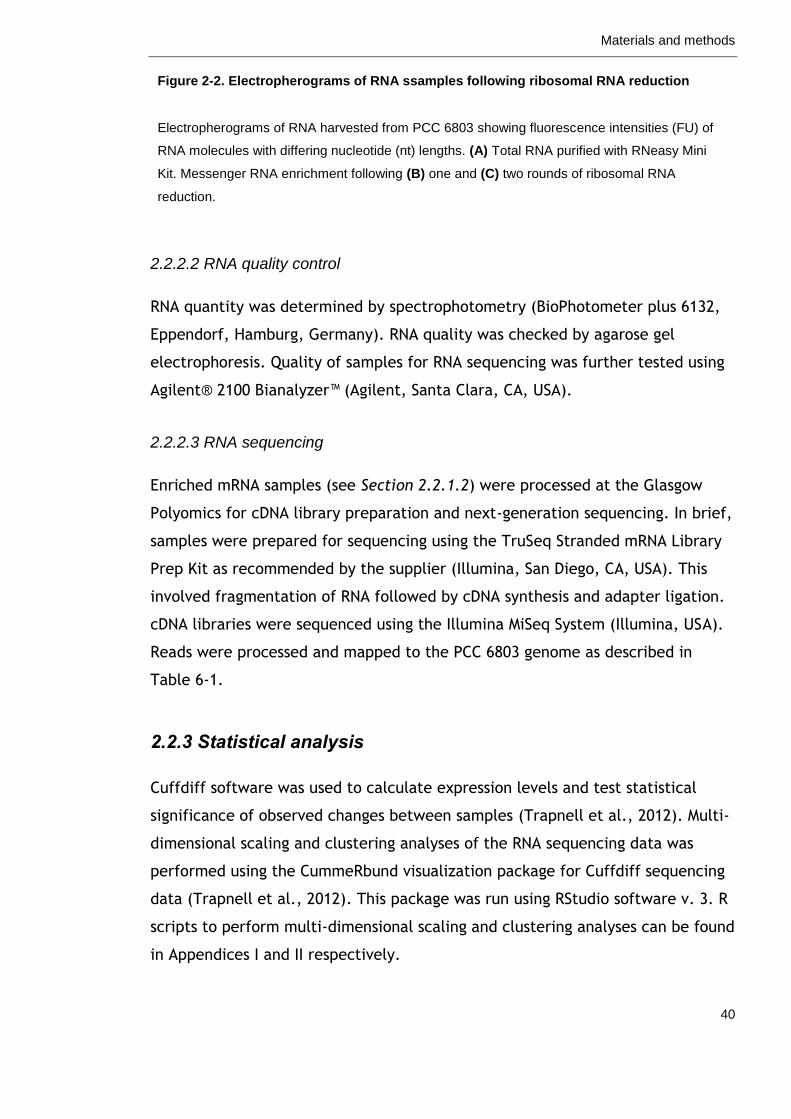
Materials and methods
40
Figure 2-2. Electropherograms of RNA ssamples following ribosomal RNA reduction
Electropherograms of RNA harvested from PCC 6803 showing fluorescence intensities (FU) of
RNA molecules with differing nucleotide (nt) lengths. (A) Total RNA purified with RNeasy Mini
Kit. Messenger RNA enrichment following (B) one and (C) two rounds of ribosomal RNA
reduction.
2.2.2.2 RNA quality control
RNA quantity was determined by spectrophotometry (BioPhotometer plus 6132,
Eppendorf, Hamburg, Germany). RNA quality was checked by agarose gel
electrophoresis. Quality of samples for RNA sequencing was further tested using
Agilent® 2100 Bianalyzer™ (Agilent, Santa Clara, CA, USA).
2.2.2.3 RNA sequencing
Enriched mRNA samples (see Section 2.2.1.2) were processed at the Glasgow
Polyomics for cDNA library preparation and next-generation sequencing. In brief,
samples were prepared for sequencing using the TruSeq Stranded mRNA Library
Prep Kit as recommended by the supplier (Illumina, San Diego, CA, USA). This
involved fragmentation of RNA followed by cDNA synthesis and adapter ligation.
cDNA libraries were sequenced using the Illumina MiSeq System (Illumina, USA).
Reads were processed and mapped to the PCC 6803 genome as described in
Table 6-1.
2.2.3 Statistical analysis
Cuffdiff software was used to calculate expression levels and test statistical
significance of observed changes between samples (Trapnell et al., 2012). Multi-
dimensional scaling and clustering analyses of the RNA sequencing data was
performed using the CummeRbund visualization package for Cuffdiff sequencing
data (Trapnell et al., 2012). This package was run using RStudio software v. 3. R
scripts to perform multi-dimensional scaling and clustering analyses can be found
in Appendices I and II respectively.
Materials and methods
41
2.3 Generation of transgenic material
2.3.1 Isolation of genomic DNA from cyanobacteria
50 ml cyanobacterial culture was harvested during mid-exponential phase growth
(approximately OD730 0.3), washed twice and resuspended in 400 μl SSC Buffer
(0.15M NaCl, 0.015 M sodium citrate, 0.01M EDTA and 0.5 M sucrose, pH 8.0).
After 30 min incubation at 60 °C, lysozyme was added to a final concentration of
2 mg ml-1 and incubated for a further 60 min at 37 °C. SDS was added to a final
concentration of 0.3 % and incubated at 45 °C for 15 min. SDS was added to a
final concentration of 1 % and Proteinase K to final concentration of 100 µg ml-1
and incubated overnight at 50 °C. Cells were centrifuged at 13,200 rpm for 10
min and the supernatant was transferred to a fresh 2 ml tube. One volume of
chloroform-isoamylalcohol (24:1 volume) was added, mixed by vortexing for 30
s, centrifuged at 13,200 rpm for 1 min and the supernatant was recovered to a
new tube. This step was repeated until debris was no longer visible at the
interphase. One volume of isopropanol was added, mixed by inversion and
centrifuged at 13,200 rpm for 20 min at 4 °C. The supernatant was removed, the
genomic DNA pellet was washed with 500 μl of 70 % ethanol and centrifuged at
13,200 rpm for 5 min at 4 °C. The supernatant was removed and the pellet was
vacuum-dried for 10 min in a Concentrator 5301 (Eppendorf, Hamburg,
Germany). The genomic DNA pellet was resuspended in 100 μl distilled water and
stored at -20 °C.
2.3.2 High-precision Polymerase Chain Reaction conditions
All PCR reactions were performed in a peqSTAR 96 universal gradient
thermocycler (Peqlab, Erlangen, Germany). The reaction setup is described in
Table 2-4 and the cycler conditions in Table 2-5. Primers to amplify promoters
from PCC 6803 genomic DNA are presented in Table 2-6. Primers to generate the
RBS-GFP library described in Section 3.2.5 are presented in Table 2-7 using the
BioBrick plasmid pSB1A2-E0240 carrying the coding sequence for GFPmut3b (kind
gift from Prof. Susan Rosser, University of Edinburgh, Edinburgh, UK) as
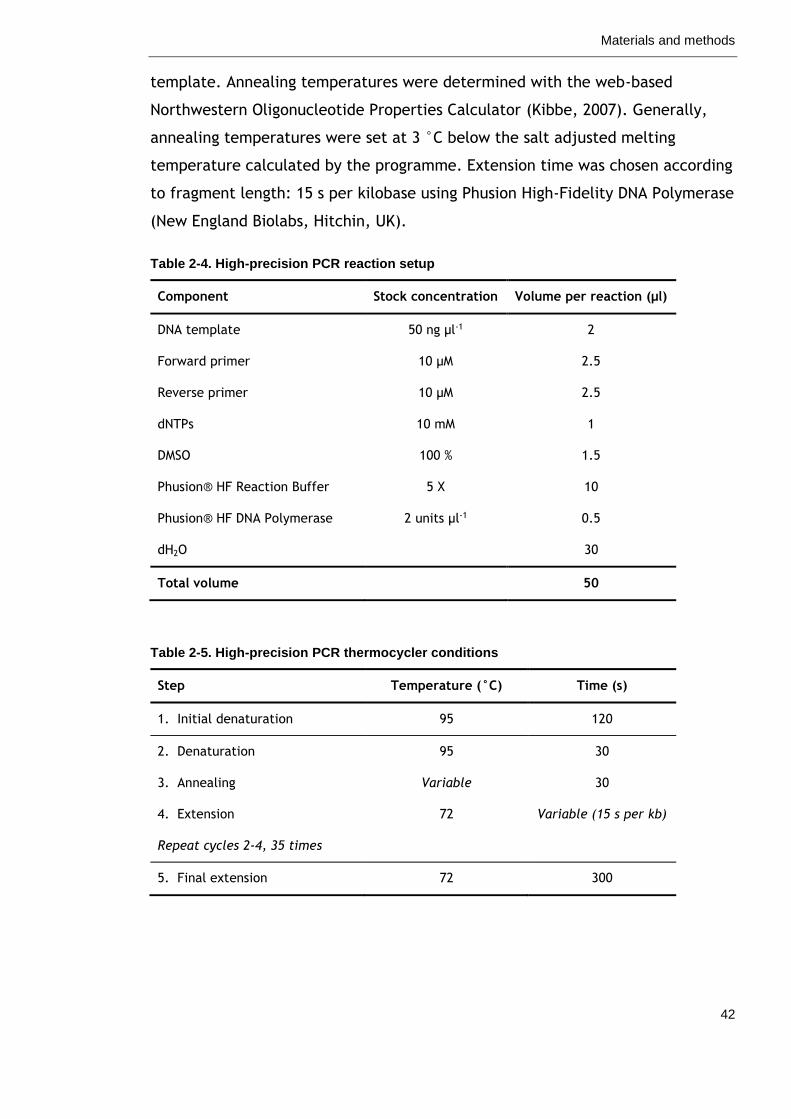
Materials and methods
42
template. Annealing temperatures were determined with the web-based
Northwestern Oligonucleotide Properties Calculator (Kibbe, 2007). Generally,
annealing temperatures were set at 3 °C below the salt adjusted melting
temperature calculated by the programme. Extension time was chosen according
to fragment length: 15 s per kilobase using Phusion High-Fidelity DNA Polymerase
(New England Biolabs, Hitchin, UK).
Table 2-4. High-precision PCR reaction setup
Component Stock concentration Volume per reaction (µl)
DNA template 50 ng µl-1 2
Forward primer 10 µM 2.5
Reverse primer 10 µM 2.5
dNTPs 10 mM 1
DMSO 100 % 1.5
Phusion® HF Reaction Buffer 5 X 10
Phusion® HF DNA Polymerase 2 units µl-1 0.5
dH2O 30
Total volume 50
Table 2-5. High-precision PCR thermocycler conditions
Step Temperature (°C) Time (s)
1. Initial denaturation 95 120
2. Denaturation 95 30
3. Annealing Variable 30
4. Extension 72 Variable (15 s per kb)
Repeat cycles 2-4, 35 times
5. Final extension 72 300
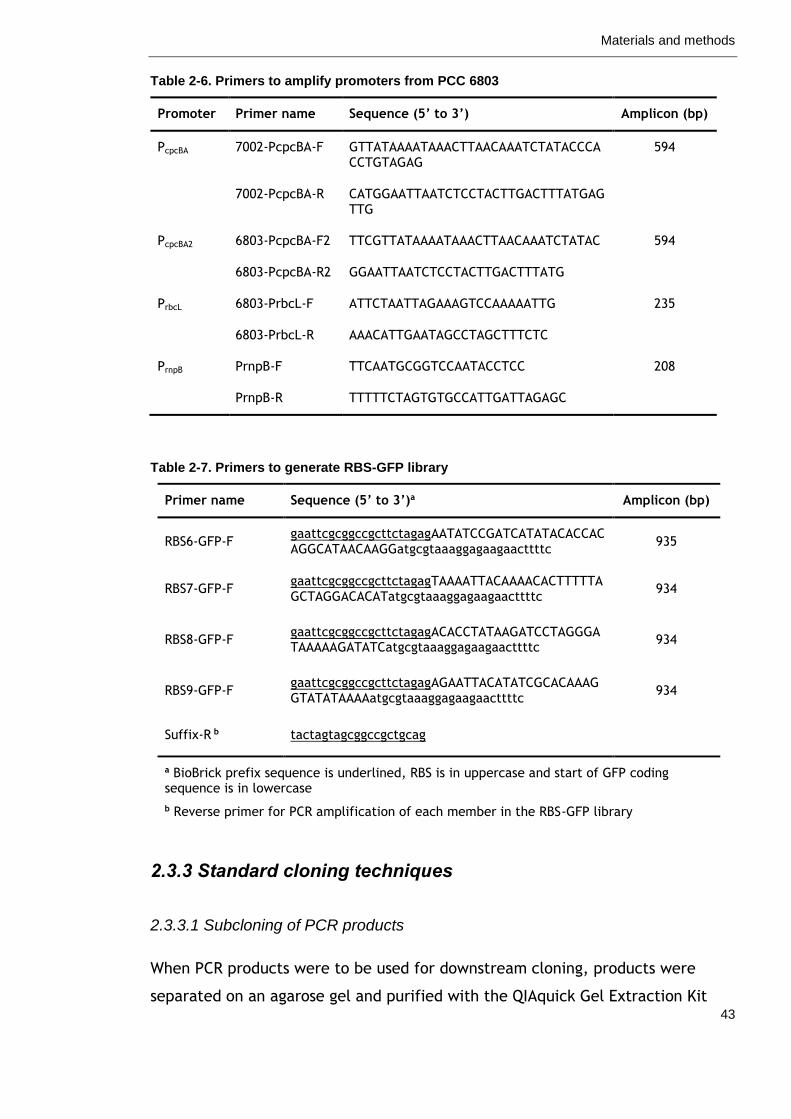
Materials and methods
43
Table 2-6. Primers to amplify promoters from PCC 6803
Promoter Primer name Sequence (5’ to 3’) Amplicon (bp)
PcpcBA 7002-PcpcBA-F GTTATAAAATAAACTTAACAAATCTATACCCACCTGTAGAG
594
7002-PcpcBA-R CATGGAATTAATCTCCTACTTGACTTTATGAGTTG
PcpcBA2 6803-PcpcBA-F2 TTCGTTATAAAATAAACTTAACAAATCTATAC 594
6803-PcpcBA-R2 GGAATTAATCTCCTACTTGACTTTATG
PrbcL 6803-PrbcL-F ATTCTAATTAGAAAGTCCAAAAATTG 235
6803-PrbcL-R AAACATTGAATAGCCTAGCTTTCTC
PrnpB PrnpB-F TTCAATGCGGTCCAATACCTCC 208
PrnpB-R TTTTTCTAGTGTGCCATTGATTAGAGC
Table 2-7. Primers to generate RBS-GFP library
Primer name Sequence (5’ to 3’)a Amplicon (bp)
RBS6-GFP-F gaattcgcggccgcttctagagAATATCCGATCATATACACCACAGGCATAACAAGGatgcgtaaaggagaagaacttttc
935
RBS7-GFP-F gaattcgcggccgcttctagagTAAAATTACAAAACACTTTTTAGCTAGGACACATatgcgtaaaggagaagaacttttc
934
RBS8-GFP-F gaattcgcggccgcttctagagACACCTATAAGATCCTAGGGATAAAAAGATATCatgcgtaaaggagaagaacttttc
934
RBS9-GFP-F gaattcgcggccgcttctagagAGAATTACATATCGCACAAAGGTATATAAAAatgcgtaaaggagaagaacttttc
934
Suffix-R b tactagtagcggccgctgcag
a BioBrick prefix sequence is underlined, RBS is in uppercase and start of GFP coding sequence is in lowercase
b Reverse primer for PCR amplification of each member in the RBS-GFP library
2.3.3 Standard cloning techniques
2.3.3.1 Subcloning of PCR products
When PCR products were to be used for downstream cloning, products were
separated on an agarose gel and purified with the QIAquick Gel Extraction Kit
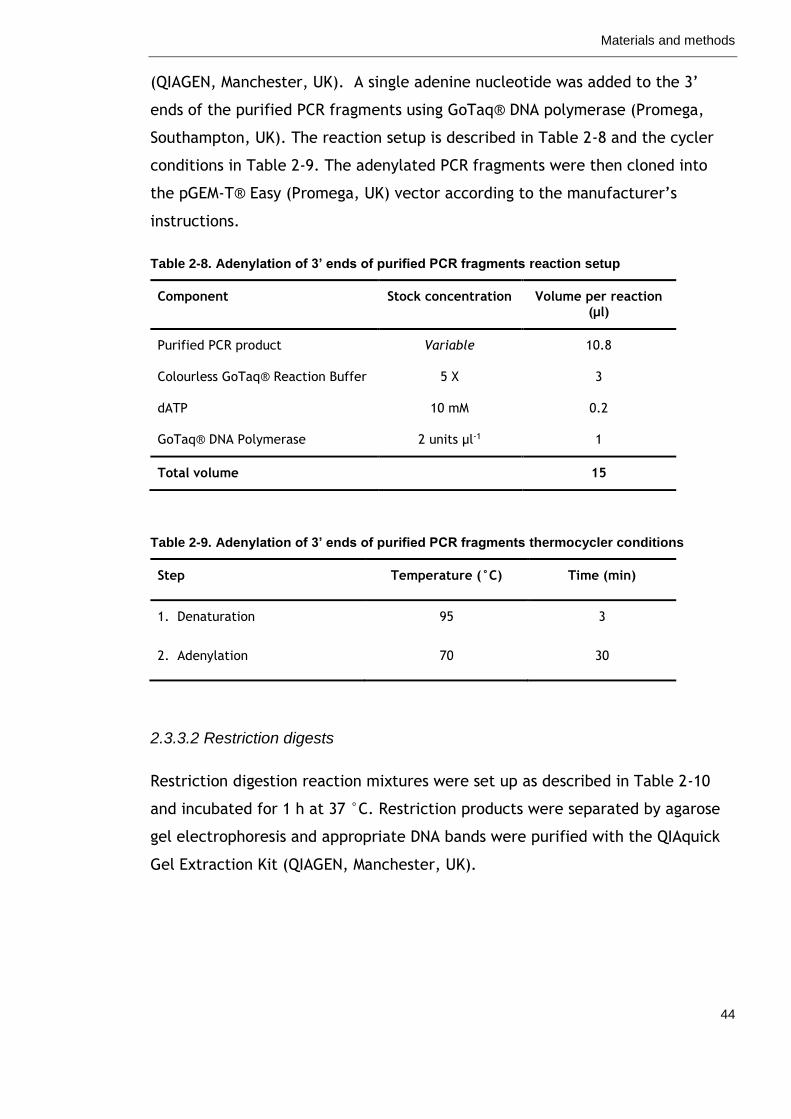
Materials and methods
44
(QIAGEN, Manchester, UK). A single adenine nucleotide was added to the 3’
ends of the purified PCR fragments using GoTaq® DNA polymerase (Promega,
Southampton, UK). The reaction setup is described in Table 2-8 and the cycler
conditions in Table 2-9. The adenylated PCR fragments were then cloned into
the pGEM-T® Easy (Promega, UK) vector according to the manufacturer’s
instructions.
Table 2-8. Adenylation of 3’ ends of purified PCR fragments reaction setup
Component Stock concentration Volume per reaction (µl)
Purified PCR product Variable 10.8
Colourless GoTaq® Reaction Buffer 5 X 3
dATP 10 mM 0.2
GoTaq® DNA Polymerase 2 units µl-1 1
Total volume 15
Table 2-9. Adenylation of 3’ ends of purified PCR fragments thermocycler conditions
Step Temperature (°C) Time (min)
1. Denaturation 95 3
2. Adenylation 70 30
2.3.3.2 Restriction digests
Restriction digestion reaction mixtures were set up as described in Table 2-10
and incubated for 1 h at 37 °C. Restriction products were separated by agarose
gel electrophoresis and appropriate DNA bands were purified with the QIAquick
Gel Extraction Kit (QIAGEN, Manchester, UK).
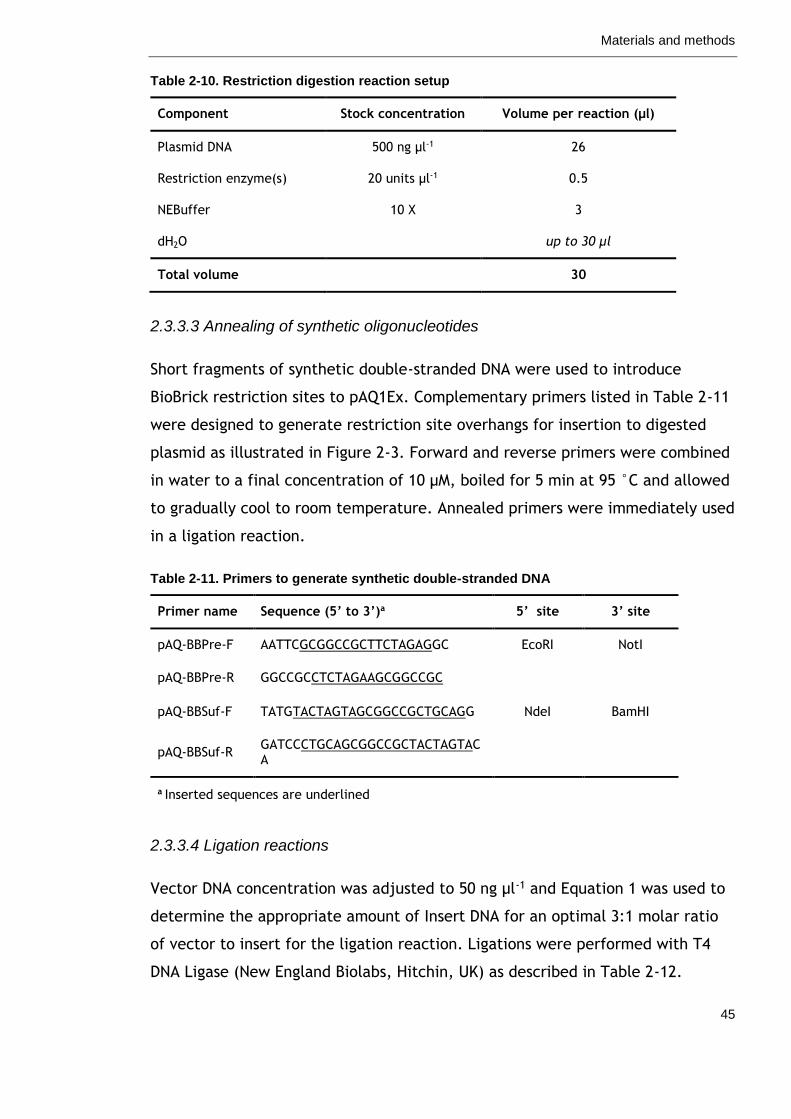
Materials and methods
45
Table 2-10. Restriction digestion reaction setup
Component Stock concentration Volume per reaction (µl)
Plasmid DNA 500 ng µl-1 26
Restriction enzyme(s) 20 units µl-1 0.5
NEBuffer 10 X 3
dH2O up to 30 µl
Total volume 30
2.3.3.3 Annealing of synthetic oligonucleotides
Short fragments of synthetic double-stranded DNA were used to introduce
BioBrick restriction sites to pAQ1Ex. Complementary primers listed in Table 2-11
were designed to generate restriction site overhangs for insertion to digested
plasmid as illustrated in Figure 2-3. Forward and reverse primers were combined
in water to a final concentration of 10 μM, boiled for 5 min at 95 °C and allowed
to gradually cool to room temperature. Annealed primers were immediately used
in a ligation reaction.
Table 2-11. Primers to generate synthetic double-stranded DNA
Primer name Sequence (5’ to 3’)a 5’ site 3’ site
pAQ-BBPre-F AATTCGCGGCCGCTTCTAGAGGC EcoRI NotI
pAQ-BBPre-R GGCCGCCTCTAGAAGCGGCCGC
pAQ-BBSuf-F TATGTACTAGTAGCGGCCGCTGCAGG NdeI BamHI
pAQ-BBSuf-R GATCCCTGCAGCGGCCGCTACTAGTACA
a Inserted sequences are underlined
2.3.3.4 Ligation reactions
Vector DNA concentration was adjusted to 50 ng µl-1 and Equation 1 was used to
determine the appropriate amount of Insert DNA for an optimal 3:1 molar ratio
of vector to insert for the ligation reaction. Ligations were performed with T4
DNA Ligase (New England Biolabs, Hitchin, UK) as described in Table 2-12.
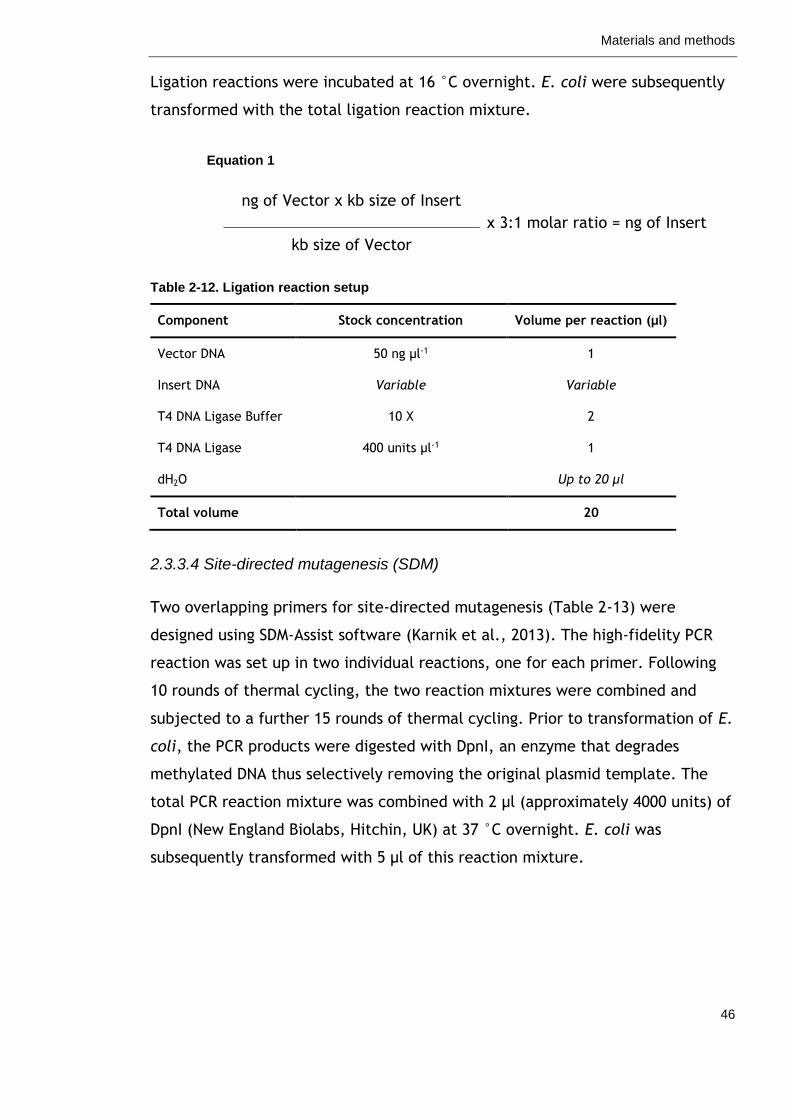
Materials and methods
46
Ligation reactions were incubated at 16 °C overnight. E. coli were subsequently
transformed with the total ligation reaction mixture.
Equation 1
ng of Vector x kb size of Insert
x 3:1 molar ratio = ng of Insert
kb size of Vector
Table 2-12. Ligation reaction setup
Component Stock concentration Volume per reaction (µl)
Vector DNA 50 ng µl-1 1
Insert DNA Variable Variable
T4 DNA Ligase Buffer 10 X 2
T4 DNA Ligase 400 units µl-1 1
dH2O Up to 20 µl
Total volume 20
2.3.3.4 Site-directed mutagenesis (SDM)
Two overlapping primers for site-directed mutagenesis (Table 2-13) were
designed using SDM-Assist software (Karnik et al., 2013). The high-fidelity PCR
reaction was set up in two individual reactions, one for each primer. Following
10 rounds of thermal cycling, the two reaction mixtures were combined and
subjected to a further 15 rounds of thermal cycling. Prior to transformation of E.
coli, the PCR products were digested with DpnI, an enzyme that degrades
methylated DNA thus selectively removing the original plasmid template. The
total PCR reaction mixture was combined with 2 µl (approximately 4000 units) of
DpnI (New England Biolabs, Hitchin, UK) at 37 °C overnight. E. coli was
subsequently transformed with 5 µl of this reaction mixture.
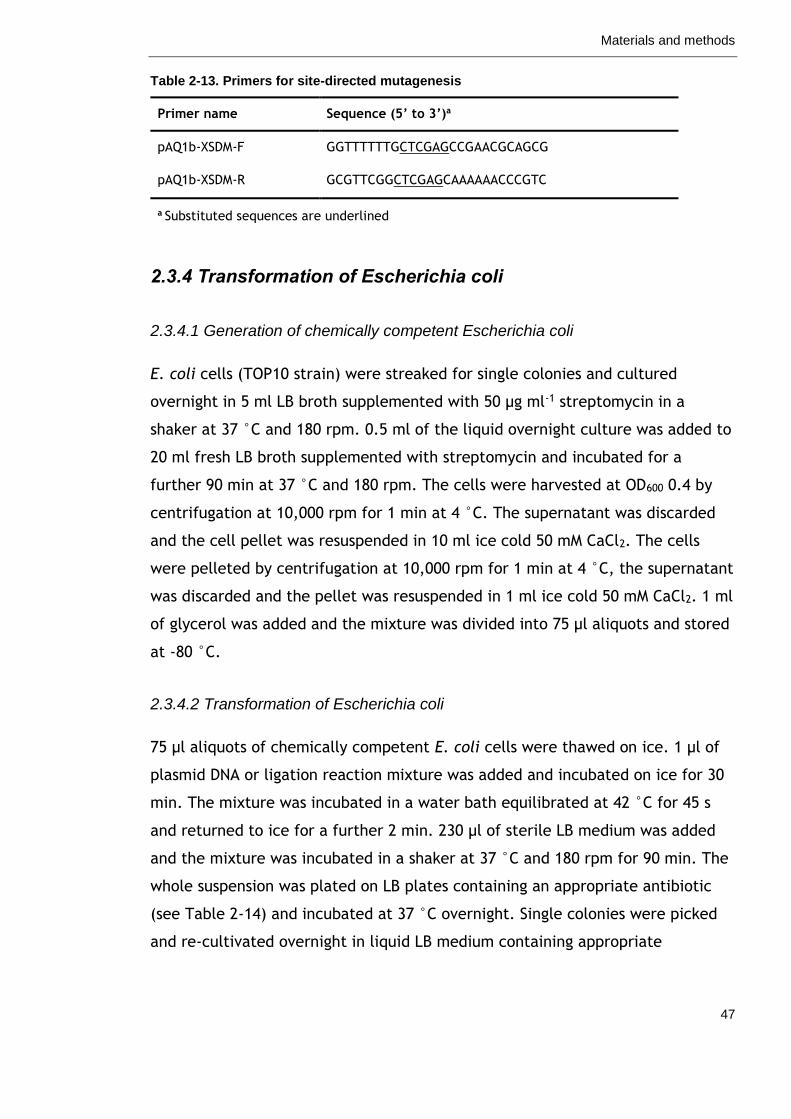
Materials and methods
47
Table 2-13. Primers for site-directed mutagenesis
Primer name Sequence (5’ to 3’)a
pAQ1b-XSDM-F GGTTTTTTGCTCGAGCCGAACGCAGCG
pAQ1b-XSDM-R GCGTTCGGCTCGAGCAAAAAACCCGTC
a Substituted sequences are underlined
2.3.4 Transformation of Escherichia coli
2.3.4.1 Generation of chemically competent Escherichia coli
E. coli cells (TOP10 strain) were streaked for single colonies and cultured
overnight in 5 ml LB broth supplemented with 50 µg ml-1 streptomycin in a
shaker at 37 °C and 180 rpm. 0.5 ml of the liquid overnight culture was added to
20 ml fresh LB broth supplemented with streptomycin and incubated for a
further 90 min at 37 °C and 180 rpm. The cells were harvested at OD600 0.4 by
centrifugation at 10,000 rpm for 1 min at 4 °C. The supernatant was discarded
and the cell pellet was resuspended in 10 ml ice cold 50 mM CaCl2. The cells
were pelleted by centrifugation at 10,000 rpm for 1 min at 4 °C, the supernatant
was discarded and the pellet was resuspended in 1 ml ice cold 50 mM CaCl2. 1 ml
of glycerol was added and the mixture was divided into 75 µl aliquots and stored
at -80 °C.
2.3.4.2 Transformation of Escherichia coli
75 µl aliquots of chemically competent E. coli cells were thawed on ice. 1 µl of
plasmid DNA or ligation reaction mixture was added and incubated on ice for 30
min. The mixture was incubated in a water bath equilibrated at 42 °C for 45 s
and returned to ice for a further 2 min. 230 µl of sterile LB medium was added
and the mixture was incubated in a shaker at 37 °C and 180 rpm for 90 min. The
whole suspension was plated on LB plates containing an appropriate antibiotic
(see Table 2-14) and incubated at 37 °C overnight. Single colonies were picked
and re-cultivated overnight in liquid LB medium containing appropriate
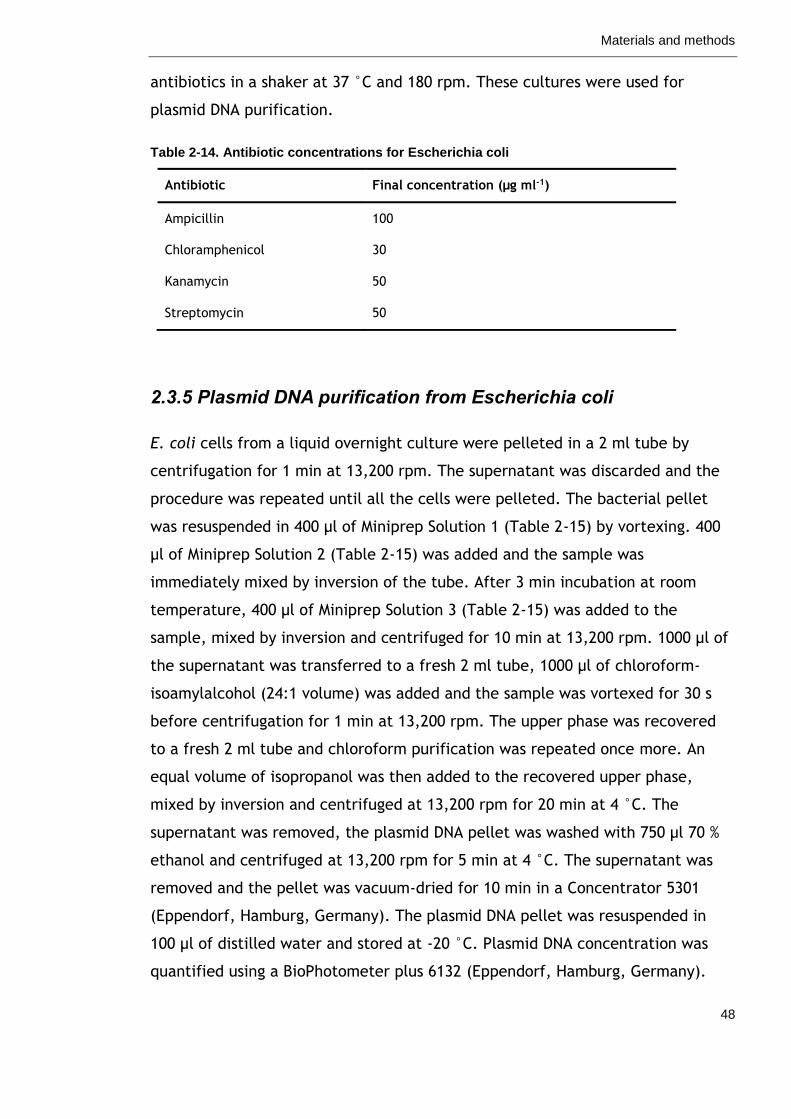
Materials and methods
48
antibiotics in a shaker at 37 °C and 180 rpm. These cultures were used for
plasmid DNA purification.
Table 2-14. Antibiotic concentrations for Escherichia coli
Antibiotic Final concentration (µg ml-1)
Ampicillin 100
Chloramphenicol 30
Kanamycin 50
Streptomycin 50
2.3.5 Plasmid DNA purification from Escherichia coli
E. coli cells from a liquid overnight culture were pelleted in a 2 ml tube by
centrifugation for 1 min at 13,200 rpm. The supernatant was discarded and the
procedure was repeated until all the cells were pelleted. The bacterial pellet
was resuspended in 400 µl of Miniprep Solution 1 (Table 2-15) by vortexing. 400
µl of Miniprep Solution 2 (Table 2-15) was added and the sample was
immediately mixed by inversion of the tube. After 3 min incubation at room
temperature, 400 µl of Miniprep Solution 3 (Table 2-15) was added to the
sample, mixed by inversion and centrifuged for 10 min at 13,200 rpm. 1000 µl of
the supernatant was transferred to a fresh 2 ml tube, 1000 µl of chloroform-
isoamylalcohol (24:1 volume) was added and the sample was vortexed for 30 s
before centrifugation for 1 min at 13,200 rpm. The upper phase was recovered
to a fresh 2 ml tube and chloroform purification was repeated once more. An
equal volume of isopropanol was then added to the recovered upper phase,
mixed by inversion and centrifuged at 13,200 rpm for 20 min at 4 °C. The
supernatant was removed, the plasmid DNA pellet was washed with 750 µl 70 %
ethanol and centrifuged at 13,200 rpm for 5 min at 4 °C. The supernatant was
removed and the pellet was vacuum-dried for 10 min in a Concentrator 5301
(Eppendorf, Hamburg, Germany). The plasmid DNA pellet was resuspended in
100 µl of distilled water and stored at -20 °C. Plasmid DNA concentration was
quantified using a BioPhotometer plus 6132 (Eppendorf, Hamburg, Germany).
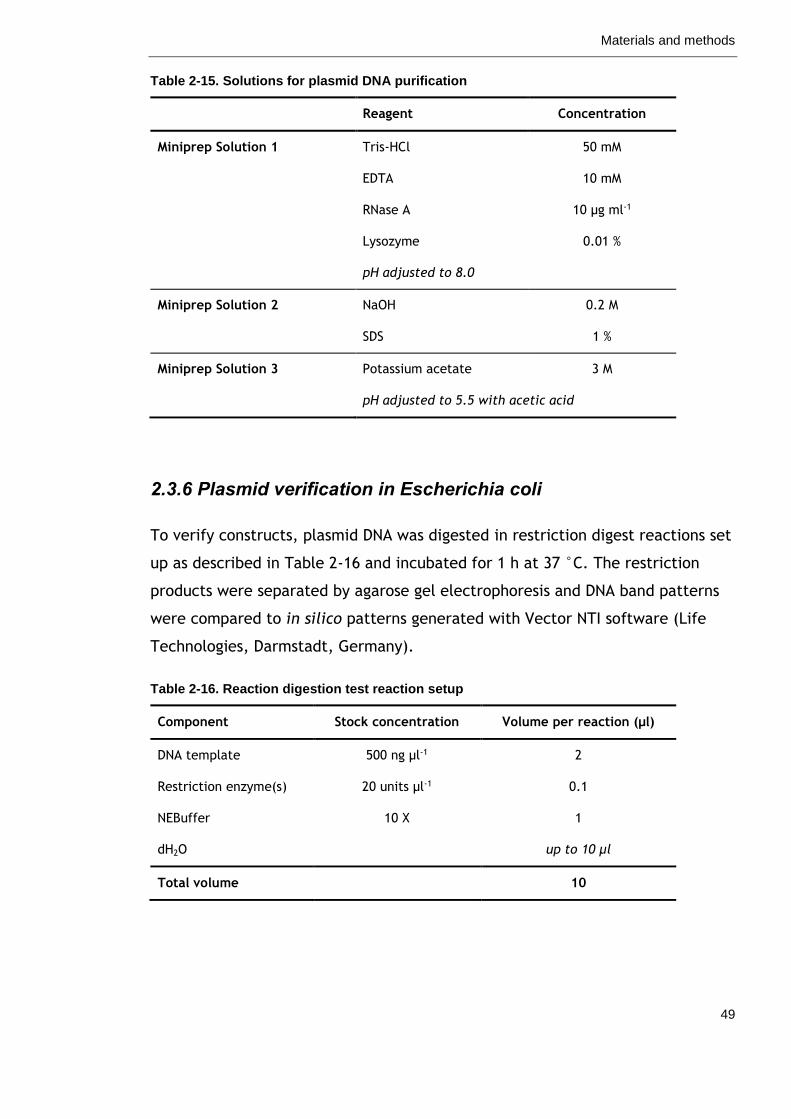
Materials and methods
49
Table 2-15. Solutions for plasmid DNA purification
Reagent Concentration
Miniprep Solution 1 Tris-HCl 50 mM
EDTA 10 mM
RNase A 10 µg ml-1
Lysozyme 0.01 %
pH adjusted to 8.0
Miniprep Solution 2 NaOH 0.2 M
SDS 1 %
Miniprep Solution 3 Potassium acetate 3 M
pH adjusted to 5.5 with acetic acid
2.3.6 Plasmid verification in Escherichia coli
To verify constructs, plasmid DNA was digested in restriction digest reactions set
up as described in Table 2-16 and incubated for 1 h at 37 °C. The restriction
products were separated by agarose gel electrophoresis and DNA band patterns
were compared to in silico patterns generated with Vector NTI software (Life
Technologies, Darmstadt, Germany).
Table 2-16. Reaction digestion test reaction setup
Component Stock concentration Volume per reaction (µl)
DNA template 500 ng µl-1 2
Restriction enzyme(s) 20 units µl-1 0.1
NEBuffer 10 X 1
dH2O up to 10 µl
Total volume 10
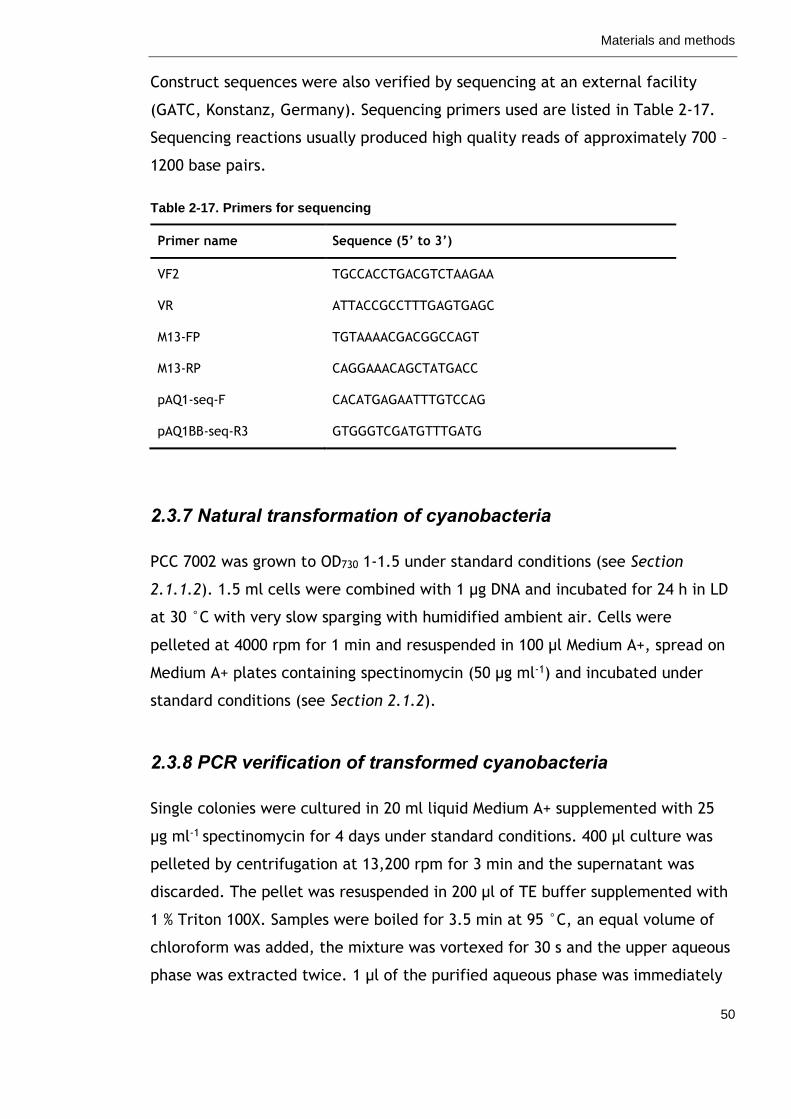
Materials and methods
50
Construct sequences were also verified by sequencing at an external facility
(GATC, Konstanz, Germany). Sequencing primers used are listed in Table 2-17.
Sequencing reactions usually produced high quality reads of approximately 700 –
1200 base pairs.
Table 2-17. Primers for sequencing
Primer name Sequence (5’ to 3’)
VF2 TGCCACCTGACGTCTAAGAA
VR ATTACCGCCTTTGAGTGAGC
M13-FP TGTAAAACGACGGCCAGT
M13-RP CAGGAAACAGCTATGACC
pAQ1-seq-F CACATGAGAATTTGTCCAG
pAQ1BB-seq-R3 GTGGGTCGATGTTTGATG
2.3.7 Natural transformation of cyanobacteria
PCC 7002 was grown to OD730 1-1.5 under standard conditions (see Section
2.1.1.2). 1.5 ml cells were combined with 1 μg DNA and incubated for 24 h in LD
at 30 °C with very slow sparging with humidified ambient air. Cells were
pelleted at 4000 rpm for 1 min and resuspended in 100 μl Medium A+, spread on
Medium A+ plates containing spectinomycin (50 µg ml-1) and incubated under
standard conditions (see Section 2.1.2).
2.3.8 PCR verification of transformed cyanobacteria
Single colonies were cultured in 20 ml liquid Medium A+ supplemented with 25
µg ml-1 spectinomycin for 4 days under standard conditions. 400 µl culture was
pelleted by centrifugation at 13,200 rpm for 3 min and the supernatant was
discarded. The pellet was resuspended in 200 µl of TE buffer supplemented with
1 % Triton 100X. Samples were boiled for 3.5 min at 95 °C, an equal volume of
chloroform was added, the mixture was vortexed for 30 s and the upper aqueous
phase was extracted twice. 1 µl of the purified aqueous phase was immediately
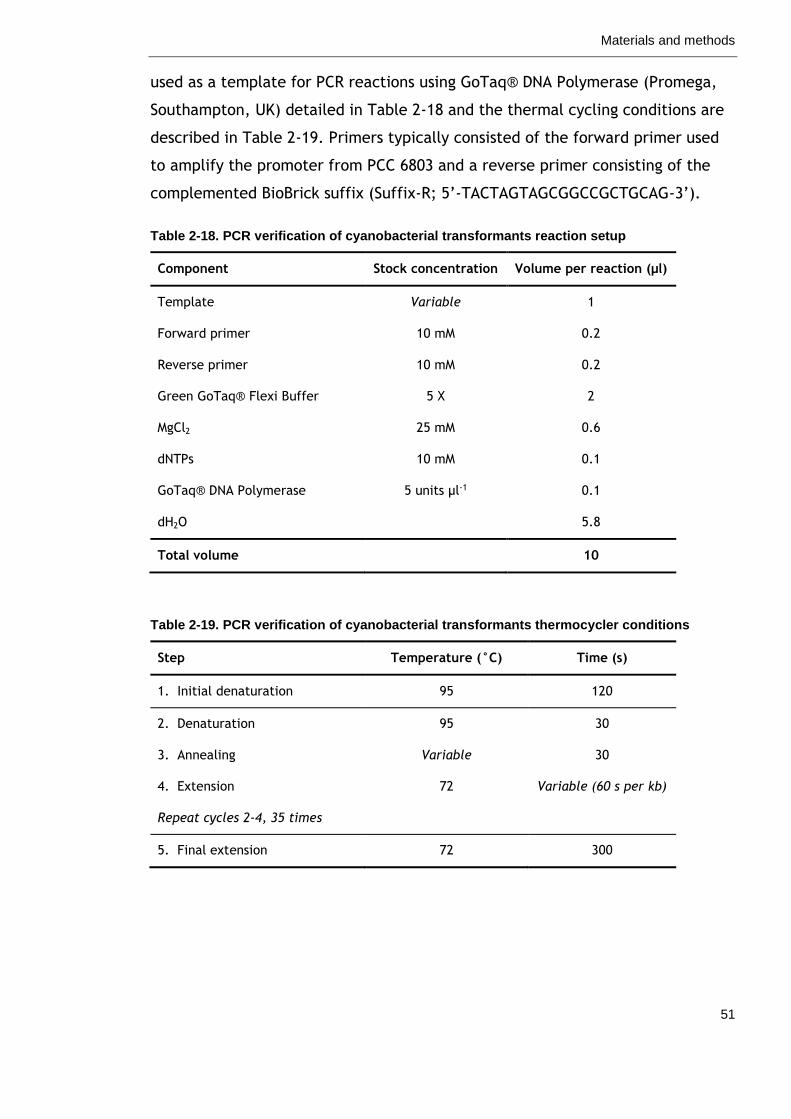
Materials and methods
51
used as a template for PCR reactions using GoTaq® DNA Polymerase (Promega,
Southampton, UK) detailed in Table 2-18 and the thermal cycling conditions are
described in Table 2-19. Primers typically consisted of the forward primer used
to amplify the promoter from PCC 6803 and a reverse primer consisting of the
complemented BioBrick suffix (Suffix-R; 5’-TACTAGTAGCGGCCGCTGCAG-3’).
Table 2-18. PCR verification of cyanobacterial transformants reaction setup
Component Stock concentration Volume per reaction (µl)
Template Variable 1
Forward primer 10 mM 0.2
Reverse primer 10 mM 0.2
Green GoTaq® Flexi Buffer 5 X 2
MgCl2 25 mM 0.6
dNTPs 10 mM 0.1
GoTaq® DNA Polymerase 5 units µl-1 0.1
dH2O 5.8
Total volume 10
Table 2-19. PCR verification of cyanobacterial transformants thermocycler conditions
Step Temperature (°C) Time (s)
1. Initial denaturation 95 120
2. Denaturation 95 30
3. Annealing Variable 30
4. Extension 72 Variable (60 s per kb)
Repeat cycles 2-4, 35 times
5. Final extension 72 300
Materials and methods
52
2.4 Quantification of reporter gene activity
Fluorescent reporter activity was quantified mid-way through the day cycle, i.e.
8 h after the lights turn on in LD. Optical density of cyanobacterial cultures was
measured at 730 nm (OD730) in a Lambda 45 UV/VIS Spectrophotometer
(PerkinElmer, Cambridge, UK). The optical density of the cultures was adjusted
to OD730 0.3 in fresh media and fluorescence was measured using a LS 55
Luminescence Spectrophotometer (PerkinElmer, Cambridge, UK) using the
excitation and emission wavelengths described in Table 3-1.
Developing a standardised promoter assay
53
Chapter 3. Developing a standardised promoter
assay
3.1 Introduction
Synechococcus spp. PCC 7002 (formerly “Agmenellum quadruplicatum PR-6”;
hereafter PCC 7002) is an attractive chassis for practical applications. It has
achieved the highest growth rates (Minas et al., 2014) as well as the highest
glycogen production rates (Aikawa et al., 2014) reported for cyanobacteria in
the literature to date. In addition, PCC 7002 is a unicellular marine
cyanobacterium able to grow across a wide range of salinities (Batterton and Van
Baalen, 1971) and thus does not compete for either limited fresh water or arable
land resources. It is tolerant of extreme high light (Nomura et al., 2006b),
capable of photohetertrophy (Lambert and Stevens, 1986), easily naturally
transformed (Stevens and Porter, 1980, Frigaard et al., 2004) and the genome is
fully sequenced (http://genome.microbedb.jp/cyanobase/SYNPCC7002; last
accessed 20/09/2015). Compared to other model species of cyanobacteria, there
are relatively few tools available to engineer PCC 7002. Promoters to drive gene
expression in this organism are particularly limited (Heidorn et al., 2011, Berla
et al., 2013, Wang et al., 2012).
Orthologous expression systems are desirable to control engineered processes as
they prevent interference from host transcriptional machinery. However,
inducible systems from E. coli and bacteriophages have proven relatively
inefficient in cyanobacteria (Huang et al., 2010, Huang and Lindblad, 2013,
Camsund et al., 2014, Zhou et al., 2014). These differences in promoter
efficiency have been attributed to differences in RNA polymerase, such as the
split β’ subunit which occurs in two parts in cyanobacteria as γ and β’ (Schneider
and Hasekorn, 1988, Xie et al., 1989). Additionally, the absence of σ54-family
sigma factors in cyanobacteria as well as differences between existing σ70
factors further impact promoter efficiency. Heterologous expression systems
derived from more closely-related organisms (i.e. other species of
Developing a standardised promoter assay
54
cyanobacteria) in which RNA polymerase core enzyme is conserved may
therefore be more successful. Transcriptional isolation of expression constructs
driven by heterologous cyanobacterial promoters may possible given the
variation of sigma factors responsible for promoter recognition across
cyanobacterial species (Imamura and Asayama, 2009). To date, the vast majority
of promoters have been characterised in their native settings, most commonly
the freshwater model Synechocystis spp. PCC 6803 (hereafter PCC 6803). Given
the enormous diversity of cyanobacteria as well as the variation in
transcriptional machinery, it is important to confirm that the native promoter
behaviour is maintained in heterologous systems.
Characterisation of biological components is a key enabling principle in synthetic
biology. The relative strength and behaviour of promoters are important
considerations in the rational design of engineered systems. Quantitative
approaches to characterise promoter activity and compatibility with widely
available standardised biological parts enables rapid assembly and optimisation
of rationally designed gene expression cassettes. A standardised promoter assay
was originally developed in E. coli using BioBrick parts (Kelly et al., 2009).
Promoters of interest were cloned upstream of a green fluorescent protein (GFP)
reporter in a plasmid vector and promoter activity was measured in transformed
E. coli cultures based on the fluorescence intensities of GFP. Furthermore,
promoter activity was measured relative to the activity of a standard reference
promoter in relative promoter units. This promoter assay has been adapted for
application in PCC 6803 (Huang et al., 2010). In this case, promoter-GFP modules
were introduced to PCC 6803 on a broad-host-range plasmid vector, pPMQAK1,
and promoter activity was measured relative to the promoter of RNase P subunit
B (PrnpB) from PCC 6803. Standardised approaches to characterise promoter
activity have not been described for other species of cyanobacteria.
Developing a standardised promoter assay
55
3.1.1 Chapter aim
This work aimed to adapt the standardised BioBrick promoter assay for
application in Synechococcus spp. PCC 7002. Several factors must be considered
when translating such approaches between biological systems. First, a plasmid
vector was developed to introduce BioBrick promoter-reporter modules to PCC
7002. Second, a reporter protein was required to accurately quantify promoter
activity. Third, a library of ribosome binding sites was generated to drive stable
translation rates of reporter protein and detect a wide range of transcriptional
activity. Finally, the activity of published promoters from PCC 6803 were
assessed using the promoter assay in PCC 7002. This assay will enable thorough
and accurate characterisation of promoter activity for predictable engineering of
PCC 7002 using characterised promoters in an “off-the-shelf” manner.
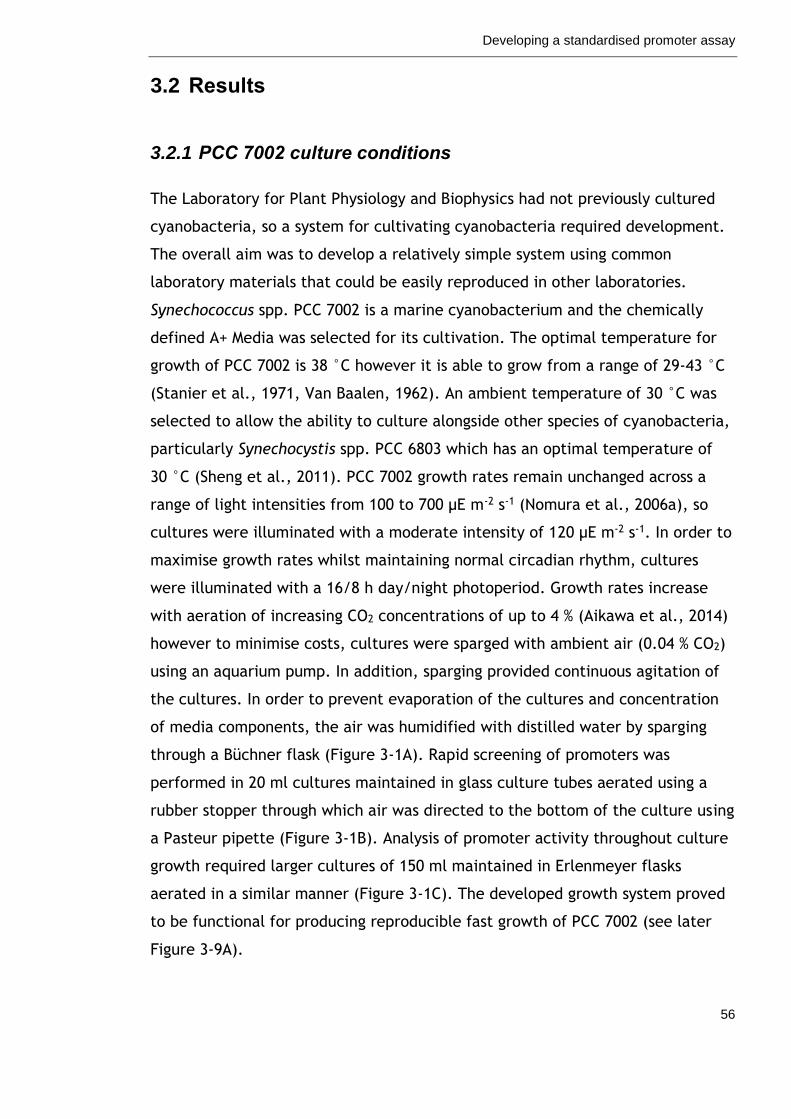
Developing a standardised promoter assay
56
3.2 Results
3.2.1 PCC 7002 culture conditions
The Laboratory for Plant Physiology and Biophysics had not previously cultured
cyanobacteria, so a system for cultivating cyanobacteria required development.
The overall aim was to develop a relatively simple system using common
laboratory materials that could be easily reproduced in other laboratories.
Synechococcus spp. PCC 7002 is a marine cyanobacterium and the chemically
defined A+ Media was selected for its cultivation. The optimal temperature for
growth of PCC 7002 is 38 °C however it is able to grow from a range of 29-43 °C
(Stanier et al., 1971, Van Baalen, 1962). An ambient temperature of 30 °C was
selected to allow the ability to culture alongside other species of cyanobacteria,
particularly Synechocystis spp. PCC 6803 which has an optimal temperature of
30 °C (Sheng et al., 2011). PCC 7002 growth rates remain unchanged across a
range of light intensities from 100 to 700 µE m-2 s-1 (Nomura et al., 2006a), so
cultures were illuminated with a moderate intensity of 120 µE m-2 s-1. In order to
maximise growth rates whilst maintaining normal circadian rhythm, cultures
were illuminated with a 16/8 h day/night photoperiod. Growth rates increase
with aeration of increasing CO2 concentrations of up to 4 % (Aikawa et al., 2014)
however to minimise costs, cultures were sparged with ambient air (0.04 % CO2)
using an aquarium pump. In addition, sparging provided continuous agitation of
the cultures. In order to prevent evaporation of the cultures and concentration
of media components, the air was humidified with distilled water by sparging
through a Büchner flask (Figure 3-1A). Rapid screening of promoters was
performed in 20 ml cultures maintained in glass culture tubes aerated using a
rubber stopper through which air was directed to the bottom of the culture using
a Pasteur pipette (Figure 3-1B). Analysis of promoter activity throughout culture
growth required larger cultures of 150 ml maintained in Erlenmeyer flasks
aerated in a similar manner (Figure 3-1C). The developed growth system proved
to be functional for producing reproducible fast growth of PCC 7002 (see later
Figure 3-9A).
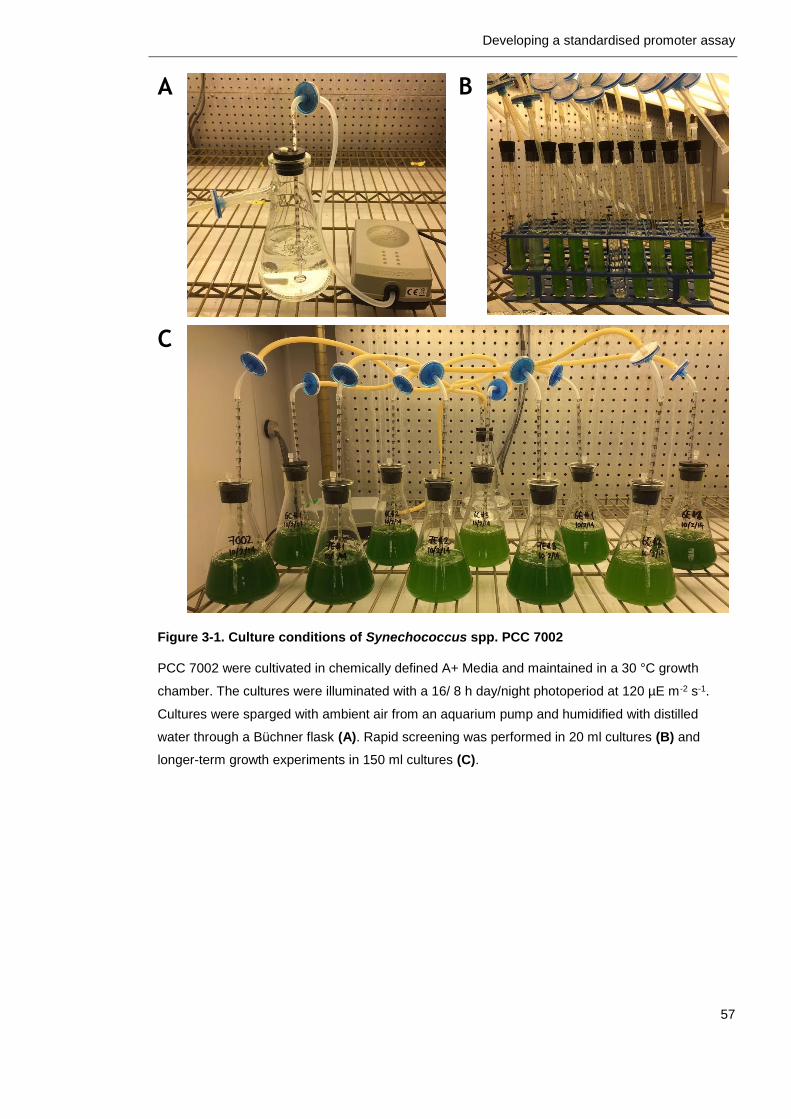
Developing a standardised promoter assay
57
A
B
C
Figure 3-1. Culture conditions of Synechococcus spp. PCC 7002
PCC 7002 were cultivated in chemically defined A+ Media and maintained in a 30 °C growth
chamber. The cultures were illuminated with a 16/ 8 h day/night photoperiod at 120 µE m-2 s-1.
Cultures were sparged with ambient air from an aquarium pump and humidified with distilled
water through a Büchner flask (A). Rapid screening was performed in 20 ml cultures (B) and
longer-term growth experiments in 150 ml cultures (C).
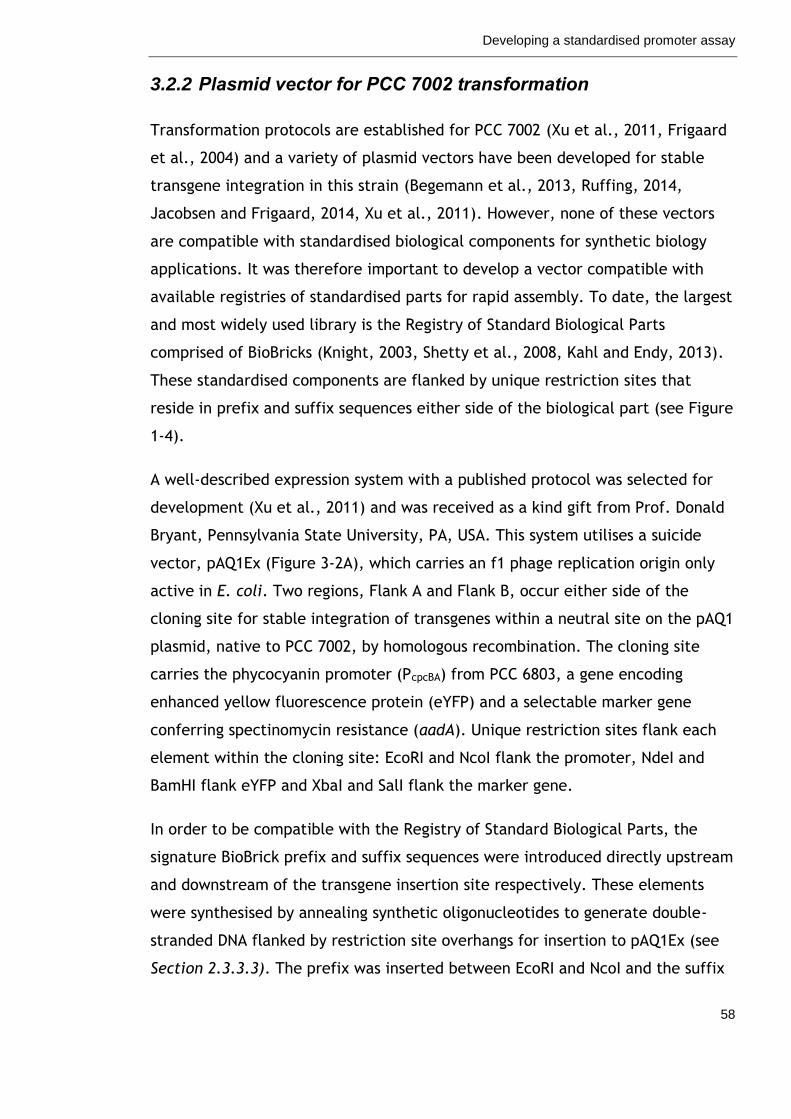
Developing a standardised promoter assay
58
3.2.2 Plasmid vector for PCC 7002 transformation
Transformation protocols are established for PCC 7002 (Xu et al., 2011, Frigaard
et al., 2004) and a variety of plasmid vectors have been developed for stable
transgene integration in this strain (Begemann et al., 2013, Ruffing, 2014,
Jacobsen and Frigaard, 2014, Xu et al., 2011). However, none of these vectors
are compatible with standardised biological components for synthetic biology
applications. It was therefore important to develop a vector compatible with
available registries of standardised parts for rapid assembly. To date, the largest
and most widely used library is the Registry of Standard Biological Parts
comprised of BioBricks (Knight, 2003, Shetty et al., 2008, Kahl and Endy, 2013).
These standardised components are flanked by unique restriction sites that
reside in prefix and suffix sequences either side of the biological part (see Figure
1-4).
A well-described expression system with a published protocol was selected for
development (Xu et al., 2011) and was received as a kind gift from Prof. Donald
Bryant, Pennsylvania State University, PA, USA. This system utilises a suicide
vector, pAQ1Ex (Figure 3-2A), which carries an f1 phage replication origin only
active in E. coli. Two regions, Flank A and Flank B, occur either side of the
cloning site for stable integration of transgenes within a neutral site on the pAQ1
plasmid, native to PCC 7002, by homologous recombination. The cloning site
carries the phycocyanin promoter (PcpcBA) from PCC 6803, a gene encoding
enhanced yellow fluorescence protein (eYFP) and a selectable marker gene
conferring spectinomycin resistance (aadA). Unique restriction sites flank each
element within the cloning site: EcoRI and NcoI flank the promoter, NdeI and
BamHI flank eYFP and XbaI and SalI flank the marker gene.
In order to be compatible with the Registry of Standard Biological Parts, the
signature BioBrick prefix and suffix sequences were introduced directly upstream
and downstream of the transgene insertion site respectively. These elements
were synthesised by annealing synthetic oligonucleotides to generate double-
stranded DNA flanked by restriction site overhangs for insertion to pAQ1Ex (see
Section 2.3.3.3). The prefix was inserted between EcoRI and NcoI and the suffix
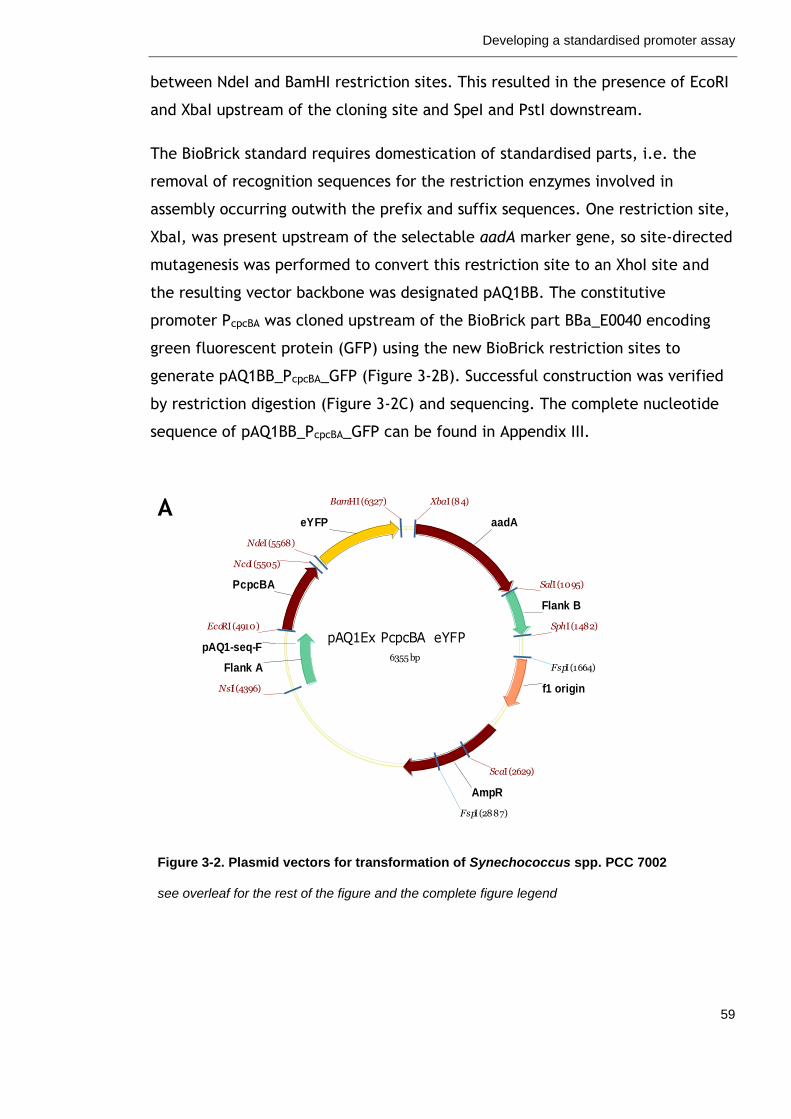
Developing a standardised promoter assay
59
between NdeI and BamHI restriction sites. This resulted in the presence of EcoRI
and XbaI upstream of the cloning site and SpeI and PstI downstream.
The BioBrick standard requires domestication of standardised parts, i.e. the
removal of recognition sequences for the restriction enzymes involved in
assembly occurring outwith the prefix and suffix sequences. One restriction site,
XbaI, was present upstream of the selectable aadA marker gene, so site-directed
mutagenesis was performed to convert this restriction site to an XhoI site and
the resulting vector backbone was designated pAQ1BB. The constitutive
promoter PcpcBA was cloned upstream of the BioBrick part BBa_E0040 encoding
green fluorescent protein (GFP) using the new BioBrick restriction sites to
generate pAQ1BB_PcpcBA_GFP (Figure 3-2B). Successful construction was verified
by restriction digestion (Figure 3-2C) and sequencing. The complete nucleotide
sequence of pAQ1BB_PcpcBA_GFP can be found in Appendix III.
A
Figure 3-2. Plasmid vectors for transformation of Synechococcus spp. PCC 7002
see overleaf for the rest of the figure and the complete figure legend
pAQ1Ex PcpcBA eYFP
6355 bp
eYFP
AmpR
aadA
pAQ1-seq-F
PcpcBA
f1 origin
Flank A
Flank B
EcoRI (4910)
XbaI (84)
NcoI (5505)
NdeI (5568)
BamHI (6327)
SalI (1095)
SphI (1482)
ScaI (2629)
NsiI (4396)
FspI (1664)
FspI (2887)
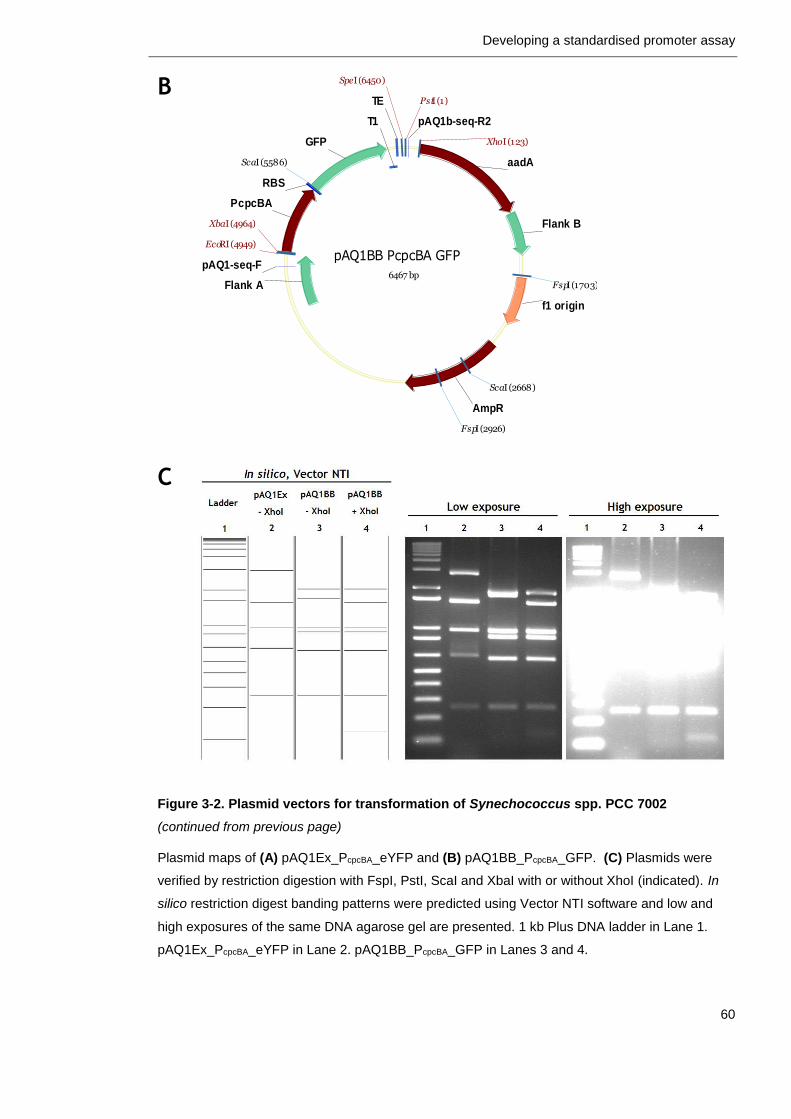
Developing a standardised promoter assay
60
B
C
Figure 3-2. Plasmid vectors for transformation of Synechococcus spp. PCC 7002
(continued from previous page)
Plasmid maps of (A) pAQ1Ex_PcpcBA_eYFP and (B) pAQ1BB_PcpcBA_GFP. (C) Plasmids were
verified by restriction digestion with FspI, PstI, ScaI and XbaI with or without XhoI (indicated). In
silico restriction digest banding patterns were predicted using Vector NTI software and low and
high exposures of the same DNA agarose gel are presented. 1 kb Plus DNA ladder in Lane 1.
pAQ1Ex_PcpcBA_eYFP in Lane 2. pAQ1BB_PcpcBA_GFP in Lanes 3 and 4.
pAQ1BB PcpcBA GFP
6467 bp
GFP
AmpR
aadA
pAQ1b-seq-R2
pAQ1-seq-F
PcpcBA
RBS
f1 origin
TE
T1
Flank B
Flank A
EcoRI (4949)
PstI (1)
SpeI (6450)
XbaI (4964)
XhoI (123)
FspI (1703)
FspI (2926)
ScaI (2668)
ScaI (5586)
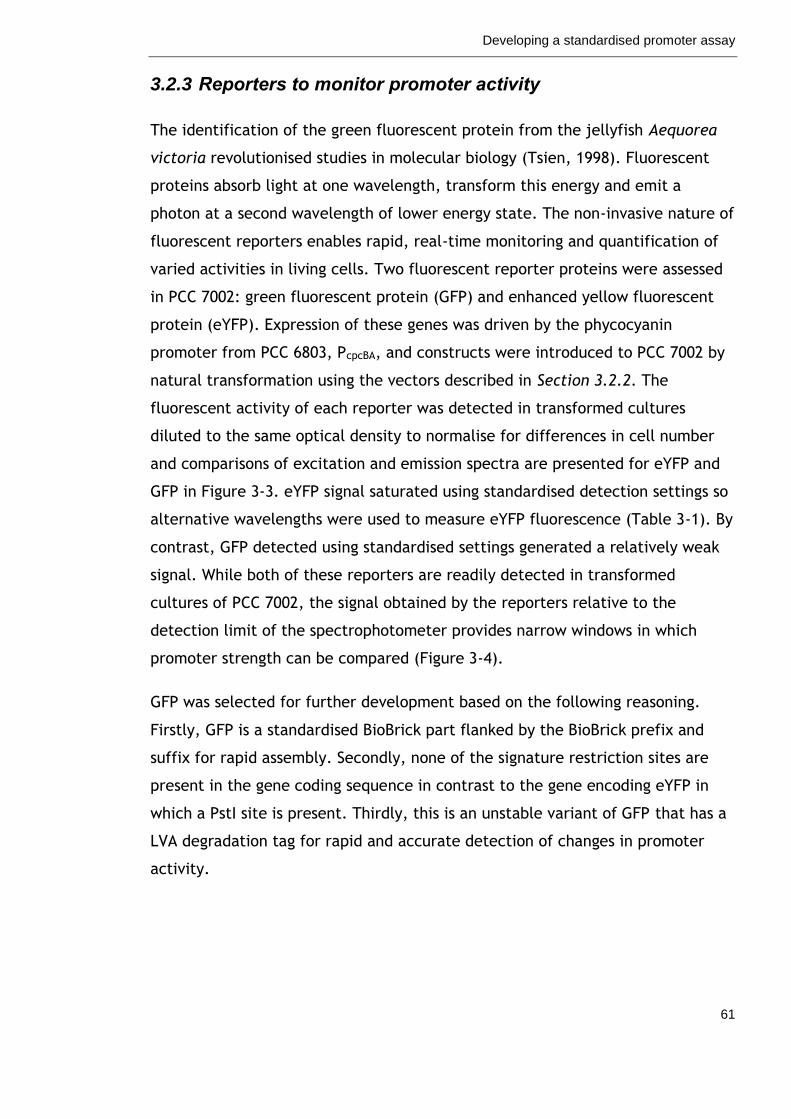
Developing a standardised promoter assay
61
3.2.3 Reporters to monitor promoter activity
The identification of the green fluorescent protein from the jellyfish Aequorea
victoria revolutionised studies in molecular biology (Tsien, 1998). Fluorescent
proteins absorb light at one wavelength, transform this energy and emit a
photon at a second wavelength of lower energy state. The non-invasive nature of
fluorescent reporters enables rapid, real-time monitoring and quantification of
varied activities in living cells. Two fluorescent reporter proteins were assessed
in PCC 7002: green fluorescent protein (GFP) and enhanced yellow fluorescent
protein (eYFP). Expression of these genes was driven by the phycocyanin
promoter from PCC 6803, PcpcBA, and constructs were introduced to PCC 7002 by
natural transformation using the vectors described in Section 3.2.2. The
fluorescent activity of each reporter was detected in transformed cultures
diluted to the same optical density to normalise for differences in cell number
and comparisons of excitation and emission spectra are presented for eYFP and
GFP in Figure 3-3. eYFP signal saturated using standardised detection settings so
alternative wavelengths were used to measure eYFP fluorescence (Table 3-1). By
contrast, GFP detected using standardised settings generated a relatively weak
signal. While both of these reporters are readily detected in transformed
cultures of PCC 7002, the signal obtained by the reporters relative to the
detection limit of the spectrophotometer provides narrow windows in which
promoter strength can be compared (Figure 3-4).
GFP was selected for further development based on the following reasoning.
Firstly, GFP is a standardised BioBrick part flanked by the BioBrick prefix and
suffix for rapid assembly. Secondly, none of the signature restriction sites are
present in the gene coding sequence in contrast to the gene encoding eYFP in
which a PstI site is present. Thirdly, this is an unstable variant of GFP that has a
LVA degradation tag for rapid and accurate detection of changes in promoter
activity.
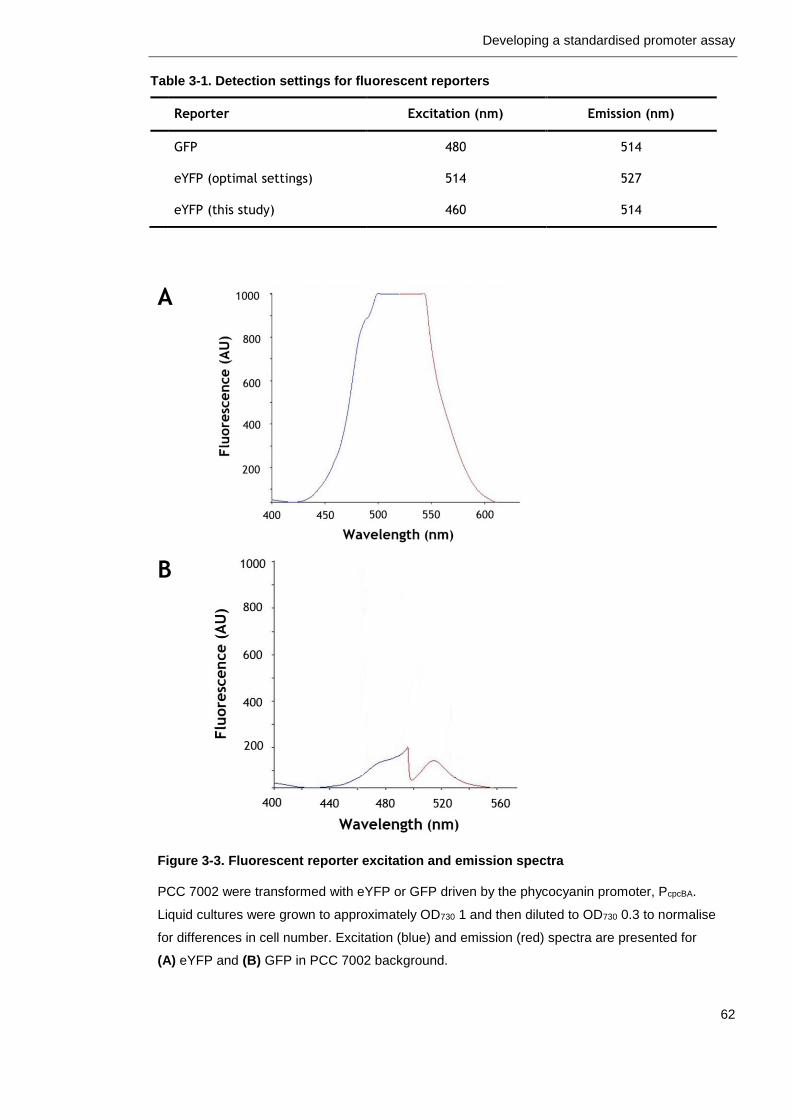
Developing a standardised promoter assay
62
Table 3-1. Detection settings for fluorescent reporters
Reporter Excitation (nm) Emission (nm)
GFP 480 514
eYFP (optimal settings) 514 527
eYFP (this study) 460 514
A
B
Figure 3-3. Fluorescent reporter excitation and emission spectra
PCC 7002 were transformed with eYFP or GFP driven by the phycocyanin promoter, PcpcBA.
Liquid cultures were grown to approximately OD730 1 and then diluted to OD730 0.3 to normalise
for differences in cell number. Excitation (blue) and emission (red) spectra are presented for
(A) eYFP and (B) GFP in PCC 7002 background.
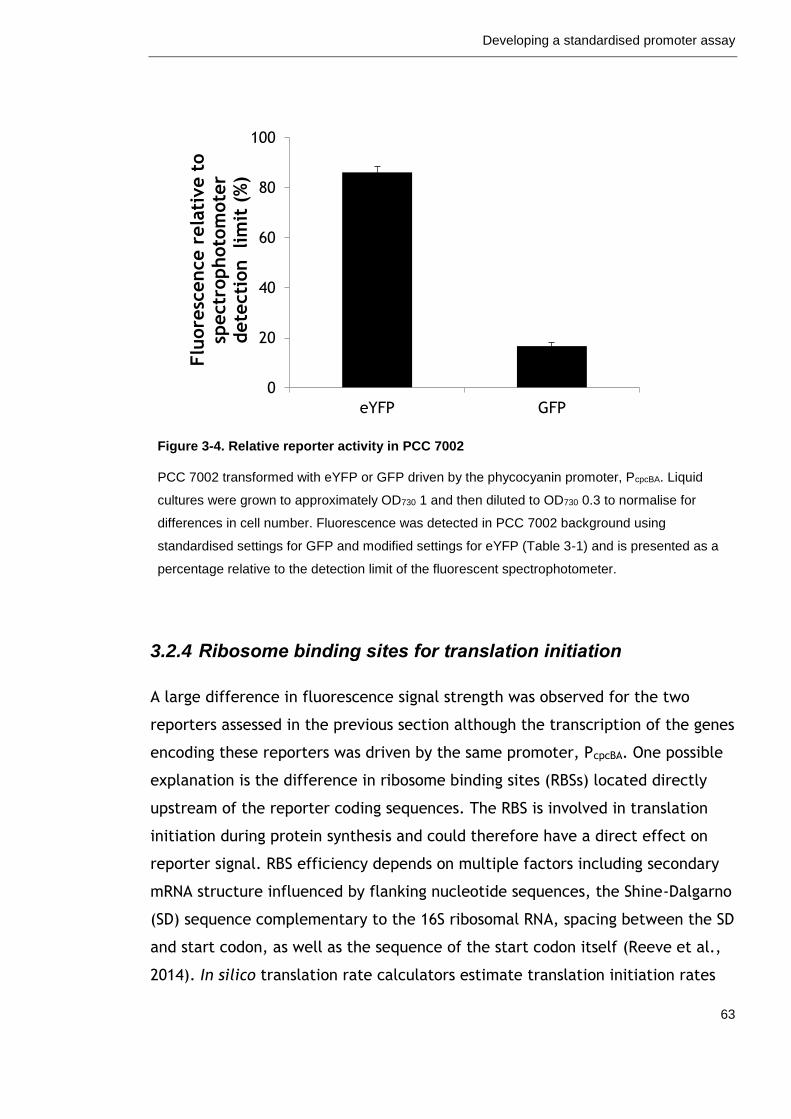
Developing a standardised promoter assay
63
Figure 3-4. Relative reporter activity in PCC 7002
PCC 7002 transformed with eYFP or GFP driven by the phycocyanin promoter, PcpcBA. Liquid
cultures were grown to approximately OD730 1 and then diluted to OD730 0.3 to normalise for
differences in cell number. Fluorescence was detected in PCC 7002 background using
standardised settings for GFP and modified settings for eYFP (Table 3-1) and is presented as a
percentage relative to the detection limit of the fluorescent spectrophotometer.
3.2.4 Ribosome binding sites for translation initiation
A large difference in fluorescence signal strength was observed for the two
reporters assessed in the previous section although the transcription of the genes
encoding these reporters was driven by the same promoter, PcpcBA. One possible
explanation is the difference in ribosome binding sites (RBSs) located directly
upstream of the reporter coding sequences. The RBS is involved in translation
initiation during protein synthesis and could therefore have a direct effect on
reporter signal. RBS efficiency depends on multiple factors including secondary
mRNA structure influenced by flanking nucleotide sequences, the Shine-Dalgarno
(SD) sequence complementary to the 16S ribosomal RNA, spacing between the SD
and start codon, as well as the sequence of the start codon itself (Reeve et al.,
2014). In silico translation rate calculators estimate translation initiation rates
0
20
40
60
80
100
eYFP GFP
Flu
ore
scence r
ela
tive t
o
spectr
ophoto
mote
r dete
cti
on lim
it (
%)
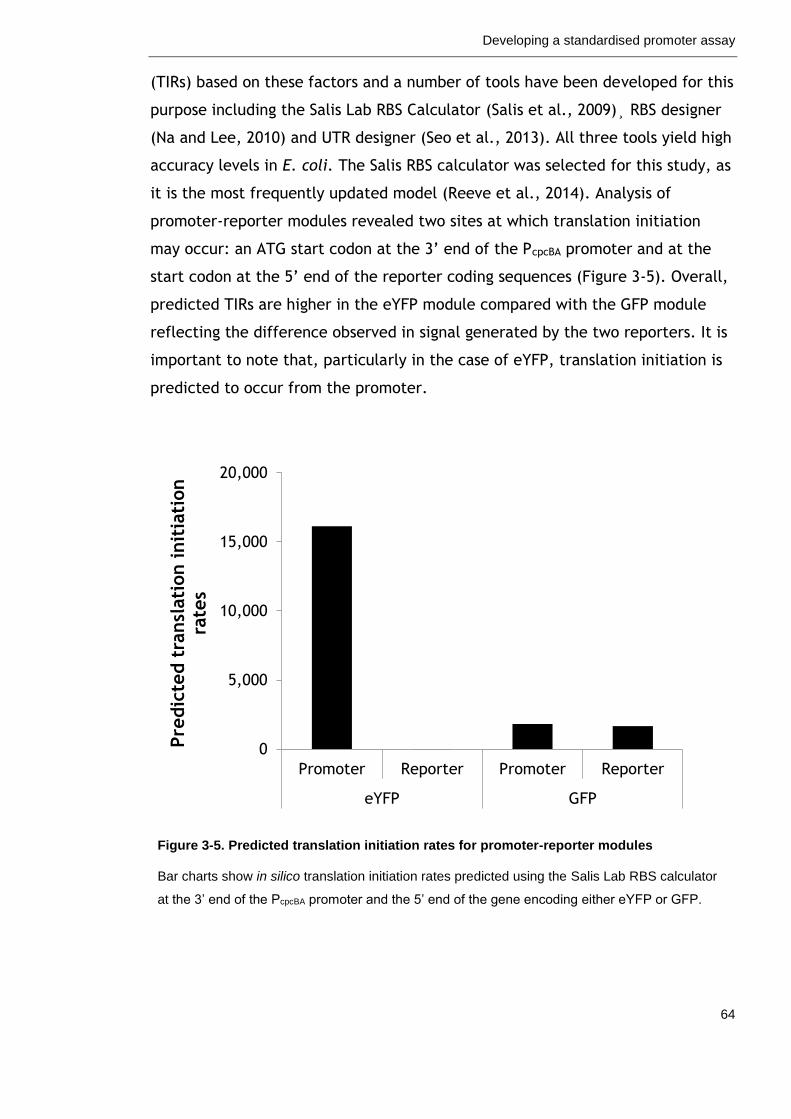
Developing a standardised promoter assay
64
(TIRs) based on these factors and a number of tools have been developed for this
purpose including the Salis Lab RBS Calculator (Salis et al., 2009)¸ RBS designer
(Na and Lee, 2010) and UTR designer (Seo et al., 2013). All three tools yield high
accuracy levels in E. coli. The Salis RBS calculator was selected for this study, as
it is the most frequently updated model (Reeve et al., 2014). Analysis of
promoter-reporter modules revealed two sites at which translation initiation
may occur: an ATG start codon at the 3’ end of the PcpcBA promoter and at the
start codon at the 5’ end of the reporter coding sequences (Figure 3-5). Overall,
predicted TIRs are higher in the eYFP module compared with the GFP module
reflecting the difference observed in signal generated by the two reporters. It is
important to note that, particularly in the case of eYFP, translation initiation is
predicted to occur from the promoter.
Figure 3-5. Predicted translation initiation rates for promoter-reporter modules
Bar charts show in silico translation initiation rates predicted using the Salis Lab RBS calculator
at the 3’ end of the PcpcBA promoter and the 5’ end of the gene encoding either eYFP or GFP.
0
5,000
10,000
15,000
20,000
Promoter Reporter Promoter Reporter
eYFP GFP
Pre
dic
ted t
ransl
ati
on init
iati
on
rate
s
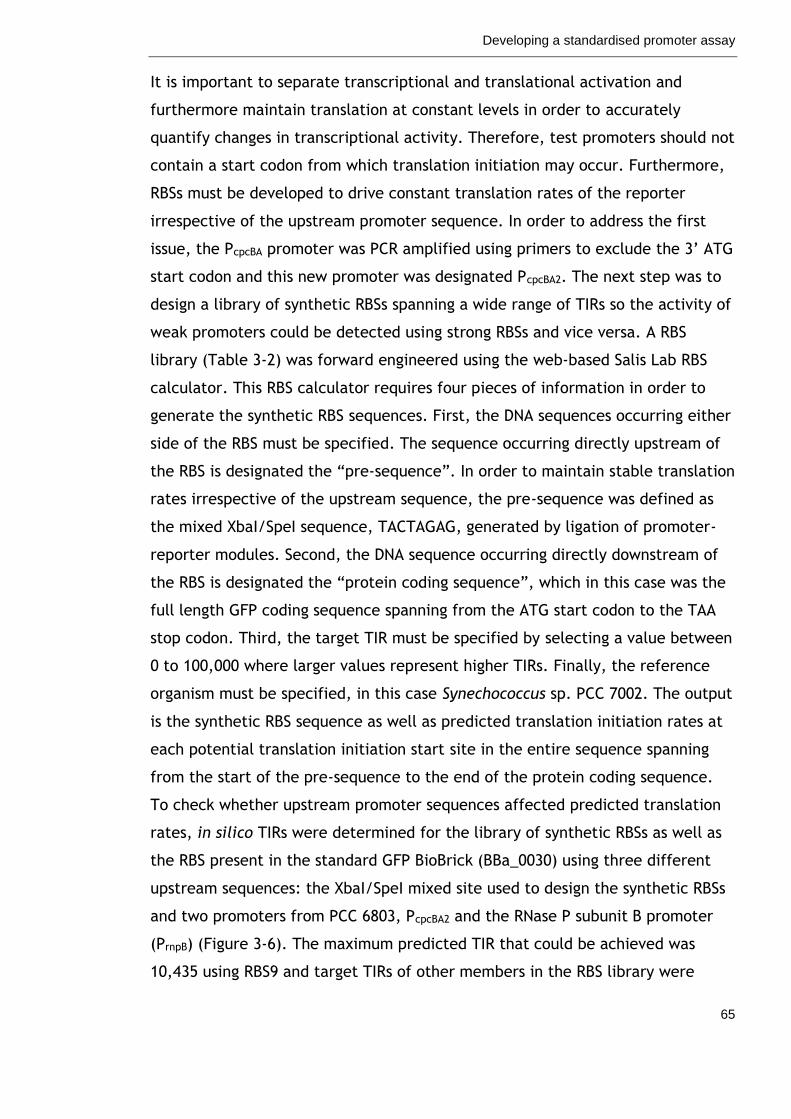
Developing a standardised promoter assay
65
It is important to separate transcriptional and translational activation and
furthermore maintain translation at constant levels in order to accurately
quantify changes in transcriptional activity. Therefore, test promoters should not
contain a start codon from which translation initiation may occur. Furthermore,
RBSs must be developed to drive constant translation rates of the reporter
irrespective of the upstream promoter sequence. In order to address the first
issue, the PcpcBA promoter was PCR amplified using primers to exclude the 3’ ATG
start codon and this new promoter was designated PcpcBA2. The next step was to
design a library of synthetic RBSs spanning a wide range of TIRs so the activity of
weak promoters could be detected using strong RBSs and vice versa. A RBS
library (Table 3-2) was forward engineered using the web-based Salis Lab RBS
calculator. This RBS calculator requires four pieces of information in order to
generate the synthetic RBS sequences. First, the DNA sequences occurring either
side of the RBS must be specified. The sequence occurring directly upstream of
the RBS is designated the “pre-sequence”. In order to maintain stable translation
rates irrespective of the upstream sequence, the pre-sequence was defined as
the mixed XbaI/SpeI sequence, TACTAGAG, generated by ligation of promoter-
reporter modules. Second, the DNA sequence occurring directly downstream of
the RBS is designated the “protein coding sequence”, which in this case was the
full length GFP coding sequence spanning from the ATG start codon to the TAA
stop codon. Third, the target TIR must be specified by selecting a value between
0 to 100,000 where larger values represent higher TIRs. Finally, the reference
organism must be specified, in this case Synechococcus sp. PCC 7002. The output
is the synthetic RBS sequence as well as predicted translation initiation rates at
each potential translation initiation start site in the entire sequence spanning
from the start of the pre-sequence to the end of the protein coding sequence.
To check whether upstream promoter sequences affected predicted translation
rates, in silico TIRs were determined for the library of synthetic RBSs as well as
the RBS present in the standard GFP BioBrick (BBa_0030) using three different
upstream sequences: the XbaI/SpeI mixed site used to design the synthetic RBSs
and two promoters from PCC 6803, PcpcBA2 and the RNase P subunit B promoter
(PrnpB) (Figure 3-6). The maximum predicted TIR that could be achieved was
10,435 using RBS9 and target TIRs of other members in the RBS library were
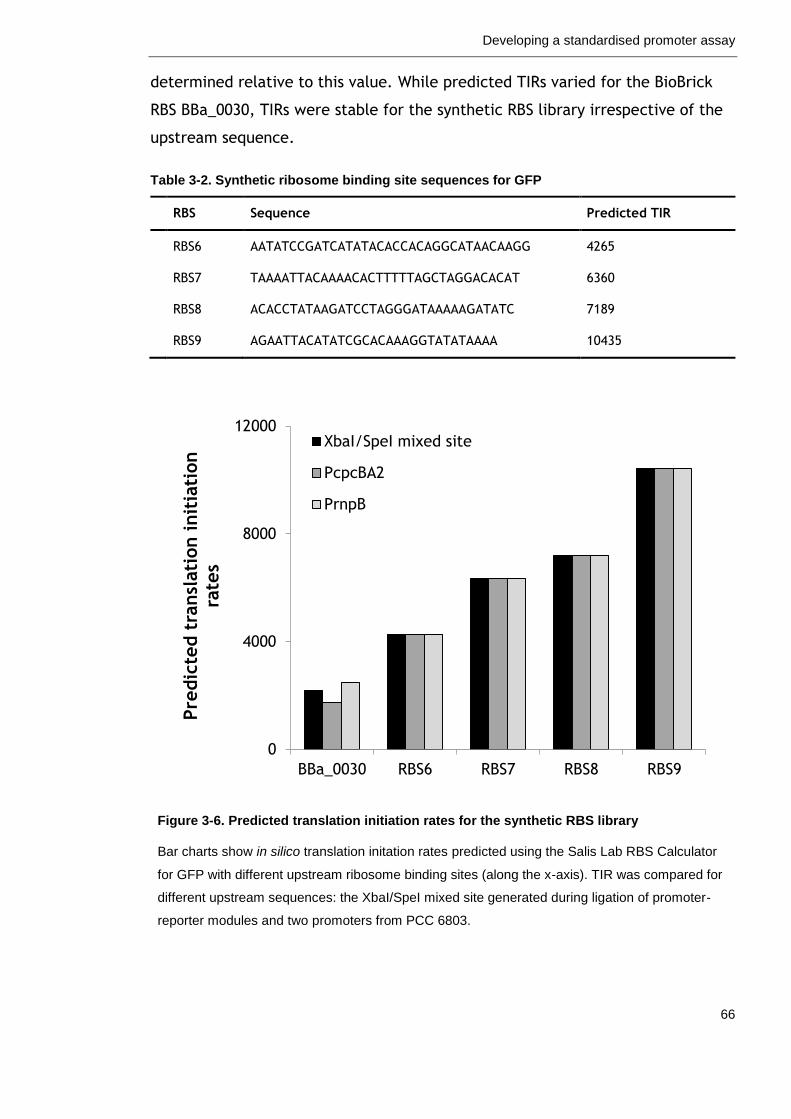
Developing a standardised promoter assay
66
determined relative to this value. While predicted TIRs varied for the BioBrick
RBS BBa_0030, TIRs were stable for the synthetic RBS library irrespective of the
upstream sequence.
Table 3-2. Synthetic ribosome binding site sequences for GFP
RBS Sequence Predicted TIR
RBS6 AATATCCGATCATATACACCACAGGCATAACAAGG 4265
RBS7 TAAAATTACAAAACACTTTTTAGCTAGGACACAT 6360
RBS8 ACACCTATAAGATCCTAGGGATAAAAAGATATC 7189
RBS9 AGAATTACATATCGCACAAAGGTATATAAAA 10435
Figure 3-6. Predicted translation initiation rates for the synthetic RBS library
Bar charts show in silico translation initation rates predicted using the Salis Lab RBS Calculator
for GFP with different upstream ribosome binding sites (along the x-axis). TIR was compared for
different upstream sequences: the XbaI/SpeI mixed site generated during ligation of promoter-
reporter modules and two promoters from PCC 6803.
0
4000
8000
12000
BBa_0030 RBS6 RBS7 RBS8 RBS9
Pre
dic
ted t
ransl
ati
on init
iati
on
rate
s
XbaI/SpeI mixed site
PcpcBA2
PrnpB
Developing a standardised promoter assay
67
While in silico modelling is an important tool for rational design, biological
systems are highly complex and may not behave as predicted. It was therefore
necessary to test the synthetic RBS library in vivo. Each member of the library
was introduced directly upstream of the ATG start of the GFP reporter gene by
PCR using primers containing the desired RBS sequence. PCR products were
subcloned to a pGEM-T Easy Vector and confirmed by sequencing to generate a
RBS-GFP library. As an example, the sequence of RBS7-GFP can be found in
Appendix IV. In order to assess the activity of the synthetic RBSs, each member
of the RBS-GFP library was cloned downstream of the PcpcBA2 promoter and
reporter activity was determined in transformed cultures of PCC 7002 (Figure
3-7). Measured fluorescence did not always reproduce the predicted TIRs, for
instance RBS6 and RBS8 resulted in relatively low reporter signal. RBS7
generated a slightly stronger signal compared with the BioBrick RBS BBa_0030
and RBS9 generated a very strong signal approximately 3-fold higher than RBS7.
These RBS-GFP modules cover a wide range of translation rates that can serve as
a useful tool to characterise promoters spanning a wide range of transcriptional
activity.
Figure 3-7. Synthetic ribosome binding sites to drive translation initiation of GFP
PCC 7002 were transformed with reporter modules carrying different synthetic ribosome binding
sites to drive translation of GFP. The expression of all modules was driven by the phycocyanin
promoter PcpcBA2. Three transformed colonies were selected and grown to OD730 1, diluted to
OD730 0.3 and fluorescence was detected using standardised settings in PCC 7002 background.
Wild-type PCC 7002 (WT) were included as a negative GFP control.
0
500
1000
1500
WT BBa_0030 RBS6 RBS7 RBS8 RBS9
Measu
red f
luore
scence
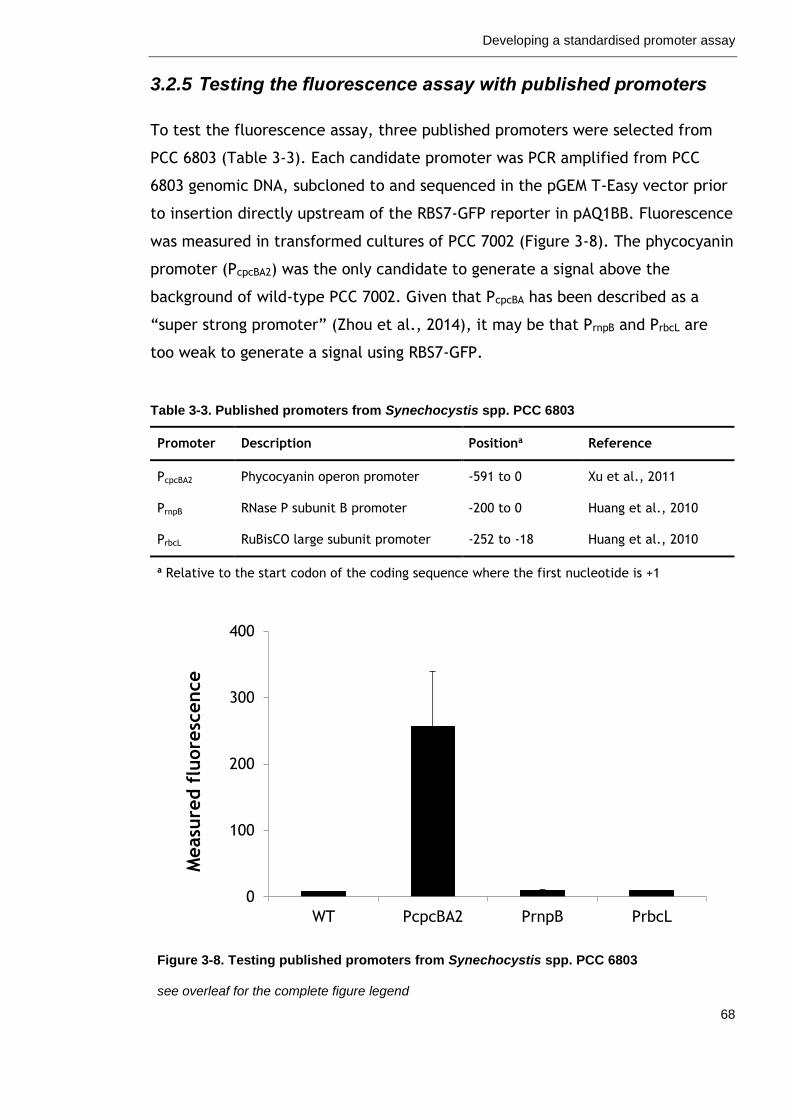
Developing a standardised promoter assay
68
3.2.5 Testing the fluorescence assay with published promoters
To test the fluorescence assay, three published promoters were selected from
PCC 6803 (Table 3-3). Each candidate promoter was PCR amplified from PCC
6803 genomic DNA, subcloned to and sequenced in the pGEM T-Easy vector prior
to insertion directly upstream of the RBS7-GFP reporter in pAQ1BB. Fluorescence
was measured in transformed cultures of PCC 7002 (Figure 3-8). The phycocyanin
promoter (PcpcBA2) was the only candidate to generate a signal above the
background of wild-type PCC 7002. Given that PcpcBA has been described as a
“super strong promoter” (Zhou et al., 2014), it may be that PrnpB and PrbcL are
too weak to generate a signal using RBS7-GFP.
Table 3-3. Published promoters from Synechocystis spp. PCC 6803
Promoter Description Positiona Reference
PcpcBA2 Phycocyanin operon promoter -591 to 0 Xu et al., 2011
PrnpB RNase P subunit B promoter -200 to 0 Huang et al., 2010
PrbcL RuBisCO large subunit promoter -252 to -18 Huang et al., 2010
a Relative to the start codon of the coding sequence where the first nucleotide is +1
Figure 3-8. Testing published promoters from Synechocystis spp. PCC 6803
see overleaf for the complete figure legend
0
100
200
300
400
WT PcpcBA2 PrnpB PrbcL
Measu
red f
luore
scence
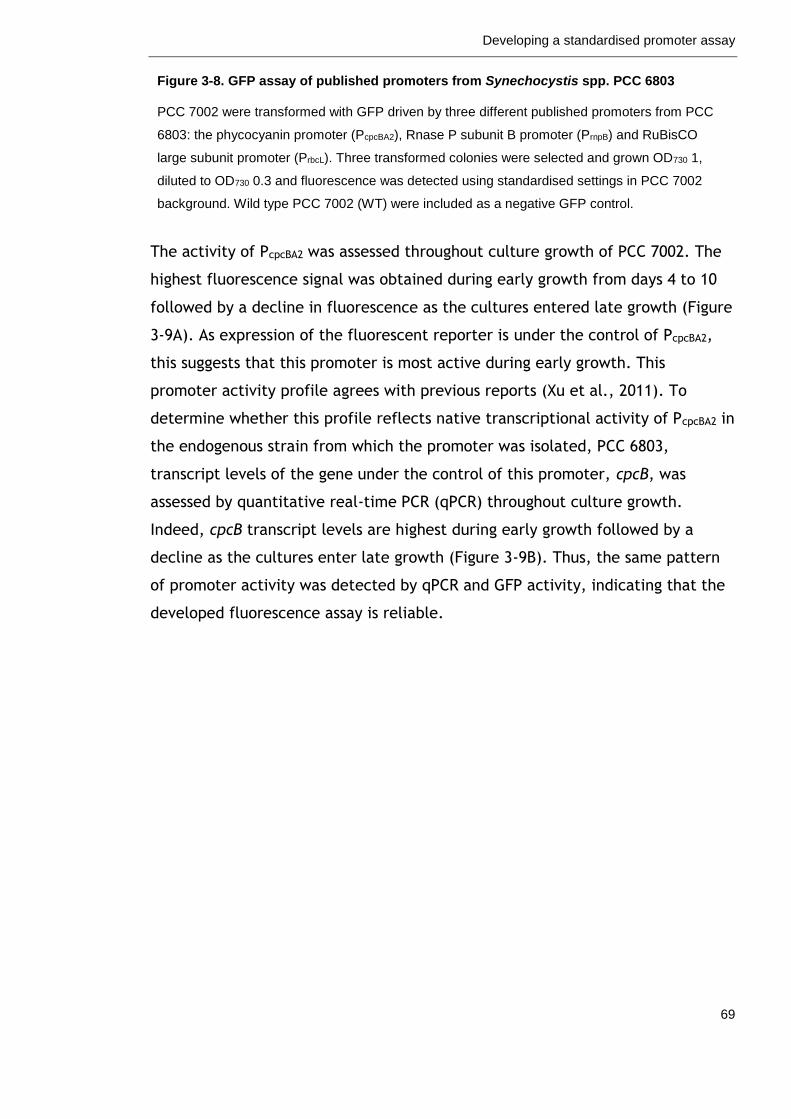
Developing a standardised promoter assay
69
Figure 3-8. GFP assay of published promoters from Synechocystis spp. PCC 6803
PCC 7002 were transformed with GFP driven by three different published promoters from PCC
6803: the phycocyanin promoter (PcpcBA2), Rnase P subunit B promoter (PrnpB) and RuBisCO
large subunit promoter (PrbcL). Three transformed colonies were selected and grown OD730 1,
diluted to OD730 0.3 and fluorescence was detected using standardised settings in PCC 7002
background. Wild type PCC 7002 (WT) were included as a negative GFP control.
The activity of PcpcBA2 was assessed throughout culture growth of PCC 7002. The
highest fluorescence signal was obtained during early growth from days 4 to 10
followed by a decline in fluorescence as the cultures entered late growth (Figure
3-9A). As expression of the fluorescent reporter is under the control of PcpcBA2,
this suggests that this promoter is most active during early growth. This
promoter activity profile agrees with previous reports (Xu et al., 2011). To
determine whether this profile reflects native transcriptional activity of PcpcBA2 in
the endogenous strain from which the promoter was isolated, PCC 6803,
transcript levels of the gene under the control of this promoter, cpcB, was
assessed by quantitative real-time PCR (qPCR) throughout culture growth.
Indeed, cpcB transcript levels are highest during early growth followed by a
decline as the cultures enter late growth (Figure 3-9B). Thus, the same pattern
of promoter activity was detected by qPCR and GFP activity, indicating that the
developed fluorescence assay is reliable.
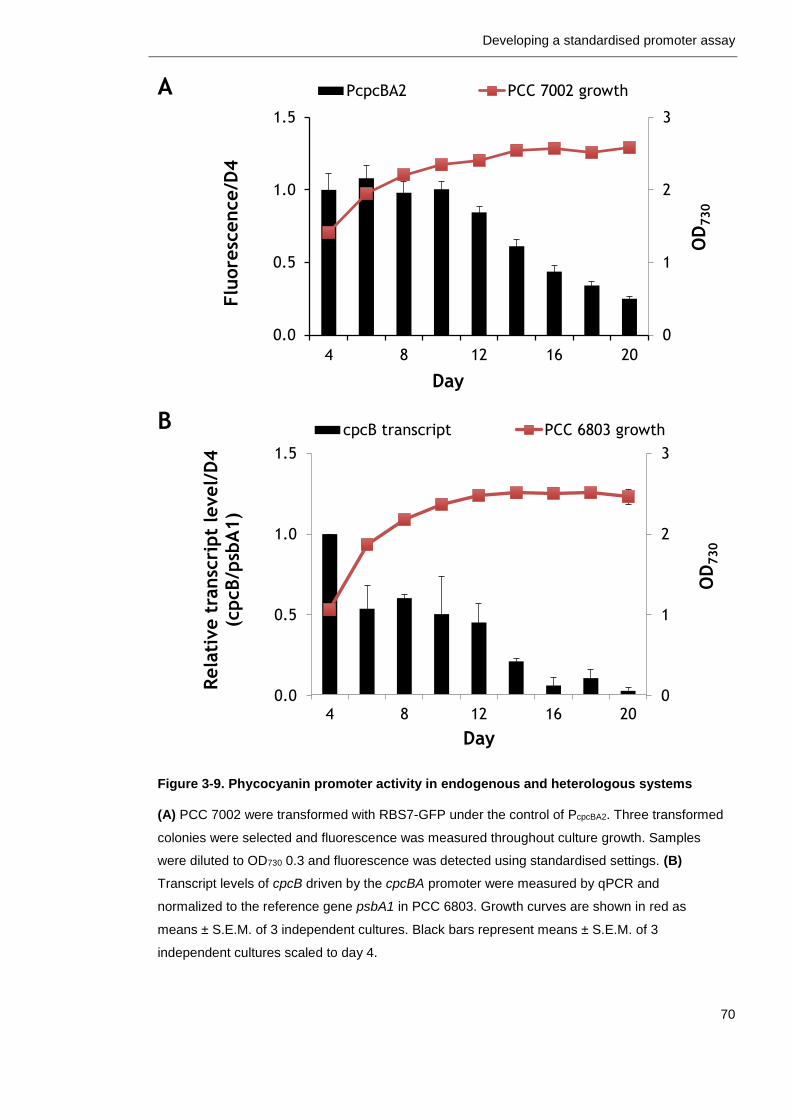
Developing a standardised promoter assay
70
A
B
Figure 3-9. Phycocyanin promoter activity in endogenous and heterologous systems
(A) PCC 7002 were transformed with RBS7-GFP under the control of PcpcBA2. Three transformed
colonies were selected and fluorescence was measured throughout culture growth. Samples
were diluted to OD730 0.3 and fluorescence was detected using standardised settings. (B)
Transcript levels of cpcB driven by the cpcBA promoter were measured by qPCR and
normalized to the reference gene psbA1 in PCC 6803. Growth curves are shown in red as
means ± S.E.M. of 3 independent cultures. Black bars represent means ± S.E.M. of 3
independent cultures scaled to day 4.
0
1
2
3
0.0
0.5
1.0
1.5
4 8 12 16 20
OD
730
Flu
ore
scence/D
4
Day
PcpcBA2 PCC 7002 growth
0
1
2
3
0.0
0.5
1.0
1.5
4 8 12 16 20O
D730
Rela
tive t
ransc
ript
level/
D4
(cpcB/p
sbA
1)
Day
cpcB transcript PCC 6803 growth
Developing a standardised promoter assay
71
3.3 Discussion
The rational design of biological organisms relies on robust tools that behave in a
reproducible manner. Thorough characterisation of individual components
enhances the accuracy of predicted function when assembled into modules that
are more complex. The tools currently available for cyanobacteria are not ideal
for industrial applications and it is essential to begin optimisation at the most
basic level, namely the first step of gene expression: transcription initiation at
the promoter. Assays have been developed to characterise promoter behaviour
in a growing number of chassis organisms including the freshwater
cyanobacterium PCC 6803 (Kelly et al., 2009, Huang et al., 2010). In this
chapter, an assay was established to characterise promoter activity in the
marine cyanobacterium PCC 7002 using components that are compatible with the
largest library of standardised biological parts available to date (BioBricks). A
plasmid vector for homologous recombination, pAQ1BB, was developed to
include key restriction sites required for the assembly of BioBrick parts and
furthermore these restriction sites were removed from other sites within the
vector. A fluorescent reporter, GFP, was selected to quantify promoter activity
in PCC 7002 and synthetic ribosome binding sites (RBSs) were developed to drive
a wide range of translation rates in order to detect a wide range of
transcriptional activity. I showed that the developed GFP reporter system in PCC
7002 was able to reproduce the native growth phase-specific promoter activity
determined by qPCR in PCC 6803. Using RBS7, the assay was not sensitive enough
to produce a signal with weaker promoters. Stronger RBSs such as RBS9 should be
used to follow the activity of these promoters.
Developing a standardised promoter assay
72
3.3.1 Further vector development
3.3.1.1 Alternative plasmid vectors
The assay developed in this chapter utilises a plasmid vector for homologous
recombination to introduce transgenes into a native plasmid in PCC 7002. This
system could be subject to “gene dosage” variation as a) recombination may not
occur with all copies of the native pAQ1 plasmid in every cell and b) the native
plasmid may alter its copy number under different conditions. Copy number of
bacterial plasmids is regulated independently of the bacterial chromosome (del
Solar and Espinosa, 2000). The target site for integration of promoter-reporter
modules is pAQ1, an endogenous plasmid, which maintains the same copy
number as the chromosome throughout growth under standard conditions in PCC
7002 (Xu et al., 2011). Nevertheless, exact copy numbers per cell and across
different growth conditions may vary and thus result in potential differences in
gene dosage, thus decoupling reporter signal from promoter activity.
Self-replicating plasmids maintained as autonomous replicons independent of the
host’s genetic material may provide a solution to this problem as these plasmids
typically maintain stable copy numbers within cells. Moreover, use of
autonomous vectors avoids the lengthy selection process for homozygous
transformants. The promoter assay developed for PCC 6803 utilises an
autonomous plasmid vector, pPMQAK1, which is compatible with standardised
BioBrick parts (Huang et al., 2010). This vector carries a broad-host-range
replication origin derived from the RSF1010 plasmid (Meyer, 2009) and maintains
a low copy number of approximately 10 copies per cell in PCC 6803 (Marraccini
et al., 1993).
There are no reports on the maintenance of autonomously replicating plasmids
in PCC 7002; however, this replicon is active in diverse strains of cyanobacteria
including Nostoc spp. PCC 7120, N. punctiforme, and Synechococcus sp. PCC
7942 to name a few (Sode et al., 1992, Mermet-Bouvier et al., 1993). Indeed,
pPMQAK1 was evaluated for this promoter assay and successful transformation
PCC 7002 was confirmed by PCR (data not shown). Nevertheless, this vector was
not pursued due to very low yield of DNA following purification of restriction
Developing a standardised promoter assay
73
digests and thus very low cloning efficiency in E. coli. While the low copy
number of this plasmid can in part explain these observations, a recent study has
pinned this inefficiency to the origin of transfer, oriT (Taton et al., 2014).
RSF1010 carries a mobilisation element, which encodes three proteins including
MobA, which nicks one of the DNA strands at oriT for transfer across the
conjugation pore during horizontal gene transfer between bacteria. As a result,
the alkaline lysis step during plasmid purification produces single-stranded DNA,
which are useless for cloning. Furthermore, the complex formed between MobA
and the 5’ end of the cleaved strand interferes during restriction digestion and
other enzymatic reactions. New variants of the RSF1010 replicon have since been
developed in which proteins encoded in the mobilisation element have been
inactivated resulting in higher cloning efficiency (Taton et al., 2014).
3.3.1.2 Additional features of BioBrick vectors
The plasmid vector developed in this chapter carries the necessary restriction
sites for assembly of BioBrick parts. Furthermore, domestication of the plasmid
was performed to remove these restriction sites from other locations within the
plasmid. While this work was critical for compatibility with standardised BioBrick
parts, further development is required to meet the standard design for BioBrick
vectors (Shetty et al., 2008). The next step would be to genetically isolate
modules within the cloning site by introducing forward and reverse
transcriptional terminator sequences either side of the cloning site as well as
translational stop codons. This will prevent run-through of transcription and/or
translation from areas outwith the cloning site thus preventing aberrant
transgene product formation. Finally, the introduction of BioBrick verification
primer binding sites will enable sequence confirmation using standardised
primers.
3.3.1.3 Alternative cloning approaches for gene assembly
The BioBrick design was rapidly embraced by the synthetic biology community
due to its idempotent nature (Knight, 2003). That is to say, products generated
by the assembly of two BioBrick components maintain the characteristics of the
individual components and thus are subject to the same rules for further
Developing a standardised promoter assay
74
assembly (see Figure 1-4B). This arises from the formation of an eight base pair
scar generated upon the ligation of XbaI and SpeI restriction sites, which neither
enzyme can recognise. This can be problematic particularly in the assembly of
fusion proteins as this scar encodes an in-frame stop codon. Furthermore, the
BioBrick design relies on traditional cloning techniques that are limited by
1) the restriction sites available for assembly and 2) the number of components
that can be assembled simultaneously, namely two. Next-generation cloning
techniques are rapidly emerging which promise high precision, rapid assembly of
multiple components in single reactions. These include methods based on end-
homology such as Gibson isothermal assembly (Gibson et al., 2009), Type IIS
restriction enzymes such as MoClo (Weber et al., 2011), and site-specific
recombination such as Gateway (Hartley et al., 2000) or serine integrase
recombinational assembly (Colloms et al., 2014). Adoption of such techniques
will significantly reduce time and effort for gene assembly.
3.3.1.4 Cell-free approaches to assess transcriptional activity
In vivo approaches for part characterisation are important to assess activity in
the context of living cells however this can be a time-consuming and laborious
task when screening large libraries. Alternatively, in vitro cell-free approaches
can shorten the process from days to hours and enable high-throughput library
generation and screening using automated methods such as liquid handling
robots and microfluidics (Gulati et al., 2009). Crude extract cell-free systems
from E. coli have already shown promise for cost-effective protein synthesis
(Hodgman and Jewett, 2012) and both transcription and translation are
comparable between in vivo and in vitro reactions (Chappell et al., 2013).
Cyanobacterial cell extracts have previously been used to investigate effects of
biologically active compounds such as antibiotics and toxins (Pietsch et al.,
2001, Guedes et al., 2011, Carvalho et al., 2013) and could be optimised for in
vitro part characterisation.
Developing a standardised promoter assay
75
3.3.2 Transcriptional tools for reliable engineering
Modelling is a key enabling principle in synthetic biology and a number of
software tools have been developed to design and test DNA parts in silico. In this
study, I assessed the utility of the Salis Lab RBS calculator (Salis et al., 2009) to
design synthetic ribosome binding sites and predict translation initiation rates
for GFP in PCC 7002. There are currently no reports of use of the Salis Lab RBS
calculator for PCC 7002 so this study is the first demonstration of the application
of this tool for the rational design of PCC 7002. It enabled the generation of a
library of synthetic RBSs to drive a wide range of translational activation of GFP
reporter protein in PCC 7002. While this is a powerful tool to control gene
expression levels, fluorescence measured in transformed cultures of
cyanobacteria did not always correlate with in silico translation initiation rates
predicted by the RBS calculator. The disconnect observed between predicted TIR
and measured fluorescence may be due to the frequent absence of Shine-
Dalgarno sequences in the 5’ untranslated regions of cyanobacterial genes (Ma et
al., 2002). Just 26 % of genes in cyanobacteria have a SD sequence located at
the optimal position. This suggests alternative mechanisms for ribosomal
recognition and binding of mRNA transcripts during translation initiation in
cyanobacteria. Indeed, in the absence of SD sequences, ribosomal protein S1
provides ribosome-messenger recognition via AU-rich sequences in the 5’
untranslated regions of the gene (Tzareva et al., 1994). In silico RBS calculators
are not yet advanced enough to accommodate for such mechanisms resulting in
inaccuracies in predicted translation initiation rates.
The disconnect between predicted and actual translation rates demonstrated in
this study highlights the importance of verifying computational models in vivo
and furthermore selecting appropriate tools for predictable outputs. Ribosome
binding sites are important for translation of gene products however this may
not be best the point of optimisation to modulate rates of gene product
formation. One of the drawbacks is the highly context (i.e. sequence) dependent
efficiency of ribosome binding sites (Reeve et al., 2014). Quantification of gene
product formation under the control of different ribosome binding sites would
require relatively labour-intensive and time-consuming approaches. By contrast,
Developing a standardised promoter assay
76
promoters are more robust regulators of gene expression and the transcriptional
activity of promoters is relatively easily quantified using assays such as the one
described in this chapter. Transcription initiation rates are less influenced by
surrounding sequences so promoters behave in a more predictable manner.
Libraries of promoters spanning a wide range of transcriptional activity are
therefore a more useful tool for the design and optimisation multistep processes.
3.3.3 Reference promoters for comparable measures of promoter
activity
The original proposal for promoter characterisation by Kelly et al. was to
quantify promoter activity in Relative Promoter Units (RPUs) by normalising
promoter activity to a stable reference promoter (Kelly et al., 2009). While this
generates units which are more comparable across different laboratories, this
approach requires access to the selected reference promoters. Furthermore, the
selected promoters may not in fact be suitable references for particular
experimental setups as promoter activity may vary under different conditions.
Instead, more recent promoter analyses have simply been presented as
fluorescence normalised to optical density (Huang et al., 2010, Camsund et al.,
2014, Markley et al., 2014). Variation will arise from the use of different
instruments so the measurement of one or more reference promoters under
standard conditions will aid the interpretation of promoter strength. The PcpcBA2
promoter assessed in this chapter is not a suitable candidate reference promoter
due to changes in activity observed at different times during growth.
Constitutive promoters from PCC 6803 such as PrnpB and PrbcL may be better
candidate reference promoters however transcriptional activity could not be
detected using RBS7-GFP. Given that PcpcBA has previously been described as a
“super strong” promoter, it may be that PrnpB and PrbcL are indeed active in PCC
7002 however stronger RBSs such as RBS9 are required to detect their activity.
Developing a standardised promoter assay
77
3.3.4 Heterologous promoters to control gene expression in
cyanobacteria
Previous attempts to engineer orthogonal transcriptional systems to drive gene
expression in cyanobacteria have had limited success (Huang et al., 2010, Huang
and Lindblad, 2013, Camsund et al., 2014, Zhou et al., 2014). These systems
were derived from bacteria whose transcriptional machinery, such as the RNA
polymerase core enzyme, differed from that of cyanobacteria, however
(Schneider and Hasekorn, 1988, Xie et al., 1989). By contrast, this study aimed
to develop transcriptional systems using promoters from more closely related
organisms, i.e. other species of cyanobacteria. Given that the composition of the
RNA polymerase core enzyme is conserved across the major cyanobacteria
subgroups, heterologous expression systems developed using this approach may
show improved function.
Promoters from PCC 6803 are routinely used to control transgene expression in
other species of cyanobacteria including Synechococcus spp. PCC 7942 and
Anabaena spp. PCC 7120 (Heidorn et al., 2011, Wang et al., 2012, Berla et al.,
2013). In this study, I used promoters from PCC 6803 to drive the expression of
GFP in Synechococcus spp. PCC 7002. Cyanobacteria are an extremely diverse
phylum, and there is of course the possibility that promoters from PCC 6803 will
not function in PCC 7002. There are many similarities between the two strains.
They are both members of the taxonomic subsection I Chroococcales as they are
spherical unicellular organisms that reproduce by binary fission (Rippka et al.,
1979). Neither of these strains are capable of nitrogen fixation, forming spores
or symbiotic relationships with other organisms (Larsson et al., 2011).
Furthermore, while they naturally inhabit different environments (PCC 6803 in
freshwater and PCC 7002 in seawater), both strains are able to grow across a
wide range of salinities (Minas et al., 2014). The genomes of these two organisms
are of a similar size (3.96 and 3.41 Mbp in PCC 6803 and PCC 7002 respectively),
however sequences differ substantially with 33 % similarity as determined by
nucleotide alignment of the two genome sequences. Furthermore, differences in
gene regulation have been previously observed for salt-induced synthesis and
accumulation of the osmolyte glucosylglycerol (Engelbrecht et al., 1999).
Developing a standardised promoter assay
78
It was therefore important to confirm that promoters from PCC 6803 retained
their behaviour in PCC 7002. Indeed, this is the first study to illustrate that the
growth-phase-specific behaviour of a promoter from PCC 6803 retains the same
activation pattern in PCC 7002. Furthermore, this pattern was observed using
two different techniques (qPCR and a fluorescence assay) confirming that the
design of the GFP-based promoter assay accurately reflects promoter activity.
This is a highly valuable tool to identify and characterise critical tools that are of
much need for the engineering of cyanobacteria.
Modulating growth kinetics in cyanobacteria
79
Chapter 4. Modulating growth kinetics in
cyanobacteria
4.1 Introduction
In the previous chapter, an assay was established to characterise promoter
activity in the marine cyanobacterium Synechococcus spp. PCC 7002. The aim is
now to identify promoters to control gene expression in this chassis from a
different species of cyanobacteria, the freshwater Synechocystis spp. PCC 6803
(hereafter PCC 6803). Inducible promoters are the most popular approach to
regulate gene expression in bacteria due to tight regulation and the ability to
control the timing of gene expression. This typically involves the addition of
small molecules and heavy metals, which are costly and often toxic and
therefore not suitable for large-scale processes in industrial applications
(Heidorn et al., 2011, Wang et al., 2012, Berla et al., 2013). Alternatively, auto-
inducible systems regulated by endogenous cues can serve as a more sustainable
approach to control gene expression. In bacteria, promoters that respond to
changes in growth are a common tool, particularly promoters activated once
cultures cease growth and division (Miksch and Dobrowolski, 1995, Cases et al.,
1996, Schumann, 2007). In order to identify promoters which respond specifically
to growth phases of cyanobacterial cultures, the first step is to determine
factors that affect culture growth.
In contrast to heterotrophic bacteria that require organic carbon sources,
cyanobacteria have relatively simple input requirements: light, carbon dioxide,
water and mineral nutrients. The most common limiting factor in both
freshwater and marine ecosystems is the mineral nutrient supply (Vitousek and
Howarth, 1991) and indeed numerous studies have demonstrated that nutrient
availability is a key growth determinant in cyanobacterial cultures (Hirani et al.,
2001, Richaud et al., 2001, Kim et al., 2011, Krasikov et al., 2012, Fuszard et
al., 2013). Nitrogen, phosphorus and sulphur are regarded as macronutrients as
they are major components in essential biomolecules, most notably nucleic acids
Modulating growth kinetics in cyanobacteria
80
and proteins. Cyanobacteria have evolved mechanisms to overcome
macronutrient limitation in the wild by a) enhancing nutrient uptake and
accessibility and b) releasing intracellular nutrient reserves, most commonly by
degrading light-harvesting phycobilisome complexes to release nitrogen and
sulphur stores (Grossman et al., 1993, Grossman et al., 1994, Schwarz and
Forchhammer, 2005). These mechanisms enable the maintenance of growth;
however, depletion of internal reserves will eventually occur in batch cultures.
As a result, macronutrient deprivation, i.e. complete removal of the
macronutrient, in PCC 6803 results in a short period of exponential growth
followed by growth arrest at a significantly lower density compared to cultures
grown under replete nutrient conditions (Krasikov et al., 2012, Richaud et al.,
2001, Hirani et al., 2001). Potassium and magnesium, considered macronutrients
in plant nutrition, are also essential for growth of cyanobacteria (Grusak, 2001,
Wolk, 1973). They constitute the two major intracellular cations present in
bacterial cells and deprivation of these nutrients impairs growth of
heterocystous, filament-forming cyanobacteria (Utkilen, 1982, Alahari and Apte,
1998). The effects of limited supplies of these and other nutrients have yet to be
described in other cyanobacteria, including PCC 6803.
Micronutrients are required at lower concentrations but are still essential to
maintain proper metabolism e.g. as cofactors. Typically, cyanobacteria cope
with micronutrient deficiency by simply reducing cellular demand for that
nutrient (Grossman et al., 1994). For instance, iron and copper are two key
micronutrients given their important roles in electron transfer proteins for
photosynthesis. In order to reduce cellular demand, cyanobacteria replace the
electron transfer proteins containing these metal ions with alternative proteins
that do not contain them. Thus, the iron-containing protein ferredoxin is
replaced by flavodoxin, which does not contain iron. Similarly, plastocyanin is
replaced with cytochrome c553 under copper limiting conditions. In this way,
cyanobacteria are able to reduce cellular demand for these metal ions without
significant loss of photosynthetic function (Sandmann et al., 1990). The effects
of other micronutrient deficiencies have not been studied in much detail in
cyanobacteria.
Modulating growth kinetics in cyanobacteria
81
4.1.1 Chapter aim
A great number of studies have focused on the short-term shock responses to
nutrient deprivation at physiological, transcriptomic and proteomic levels
(Suzuki et al., 2004, Krasikov et al., 2012, Kopf et al., 2014, Zhang et al., 2008,
Osanai et al., 2006, Fuszard et al., 2013, Richaud et al., 2001, Hirani et al.,
2001). This typically involved transfer of cultures during exponential phase
growth from replete (hereafter “standard”) media to deficient media in which
the particular nutrient was completely removed. By contrast, this study focused
on the effects of nutrient limitation on culture growth, where “limitation” refers
to a poor supply of a given nutrient as opposed to complete elimination of that
nutrient (typically 12.5 % relative to the standard concentration). The aim of this
work was to identify conditions that result in transition from exponential to
stationary phase for different reasons, i.e. limitation by different factors. This
enabled later identification of genes that respond to the growth transition
irrespective of the particular limiting factor. The hope was that this approach
would enable the identification of robust growth phase-specific promoters.
Nutrient limitation was studied as opposed to complete deprivation to allow for
enough growth to provide sufficient RNA material for future gene expression
analysis and further mimic the gradual decline in nutrient availability that
cultures experience in batch cultures.
Modulating growth kinetics in cyanobacteria
82
4.2 Results
4.2.1 Synechocystis spp. PCC 6803 culture conditions
A tightly controlled system was required for reproducible growth of PCC 6803 as
samples were to be collected for subsequent transcriptomic analyses. Firstly,
stable temperatures were achieved in controlled water baths (Figure 4-1)
equilibrated at the optimal temperature of 30 ° C (Sheng et al., 2011). Cultures
were illuminated with Sylvania Cool White fluorescent bulbs with a 12 hour
day/night photoperiod. The exact light intensity within the water baths could
not be determined however a schematic diagram illustrating the layout of the
water bath with flanking lights is presented in Figure 4-1A. Secondly, stable
aeration rates of cyanobacteria cultures were achieved in Dreschel flasks (Figure
4-1B) through which ambient air (0.04 % CO2) humidified with distilled water was
delivered into the culture from an aquarium pump via a Büchner flask. In
addition, sparging provided continuous agitation of the cultures.
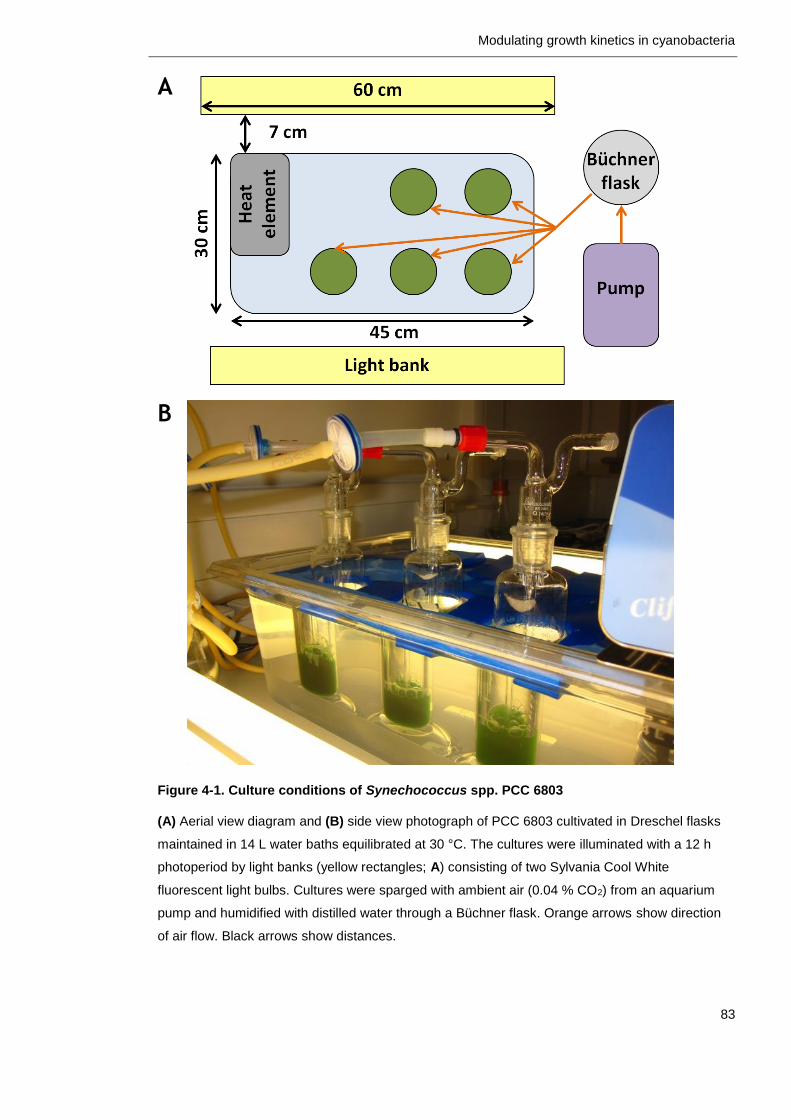
Modulating growth kinetics in cyanobacteria
83
A
B
Figure 4-1. Culture conditions of Synechococcus spp. PCC 6803
(A) Aerial view diagram and (B) side view photograph of PCC 6803 cultivated in Dreschel flasks
maintained in 14 L water baths equilibrated at 30 °C. The cultures were illuminated with a 12 h
photoperiod by light banks (yellow rectangles; A) consisting of two Sylvania Cool White
fluorescent light bulbs. Cultures were sparged with ambient air (0.04 % CO2) from an aquarium
pump and humidified with distilled water through a Büchner flask. Orange arrows show direction
of air flow. Black arrows show distances.
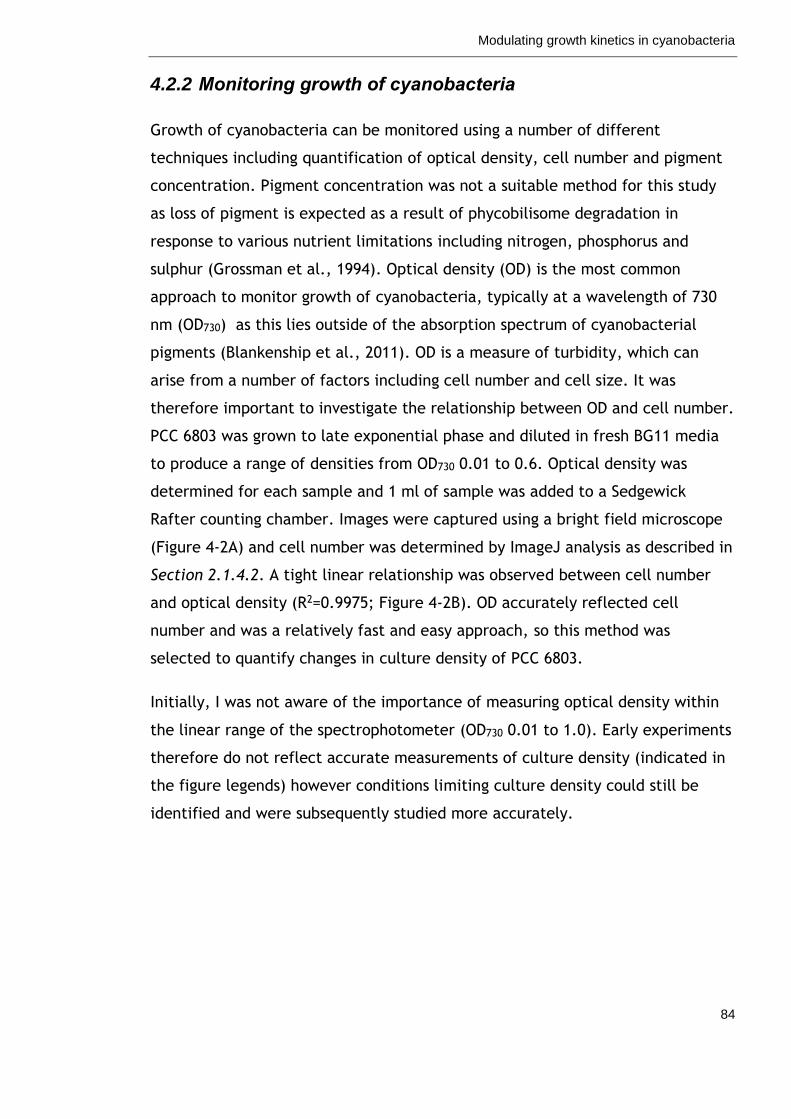
Modulating growth kinetics in cyanobacteria
84
4.2.2 Monitoring growth of cyanobacteria
Growth of cyanobacteria can be monitored using a number of different
techniques including quantification of optical density, cell number and pigment
concentration. Pigment concentration was not a suitable method for this study
as loss of pigment is expected as a result of phycobilisome degradation in
response to various nutrient limitations including nitrogen, phosphorus and
sulphur (Grossman et al., 1994). Optical density (OD) is the most common
approach to monitor growth of cyanobacteria, typically at a wavelength of 730
nm (OD730) as this lies outside of the absorption spectrum of cyanobacterial
pigments (Blankenship et al., 2011). OD is a measure of turbidity, which can
arise from a number of factors including cell number and cell size. It was
therefore important to investigate the relationship between OD and cell number.
PCC 6803 was grown to late exponential phase and diluted in fresh BG11 media
to produce a range of densities from OD730 0.01 to 0.6. Optical density was
determined for each sample and 1 ml of sample was added to a Sedgewick
Rafter counting chamber. Images were captured using a bright field microscope
(Figure 4-2A) and cell number was determined by ImageJ analysis as described in
Section 2.1.4.2. A tight linear relationship was observed between cell number
and optical density (R2=0.9975; Figure 4-2B). OD accurately reflected cell
number and was a relatively fast and easy approach, so this method was
selected to quantify changes in culture density of PCC 6803.
Initially, I was not aware of the importance of measuring optical density within
the linear range of the spectrophotometer (OD730 0.01 to 1.0). Early experiments
therefore do not reflect accurate measurements of culture density (indicated in
the figure legends) however conditions limiting culture density could still be
identified and were subsequently studied more accurately.
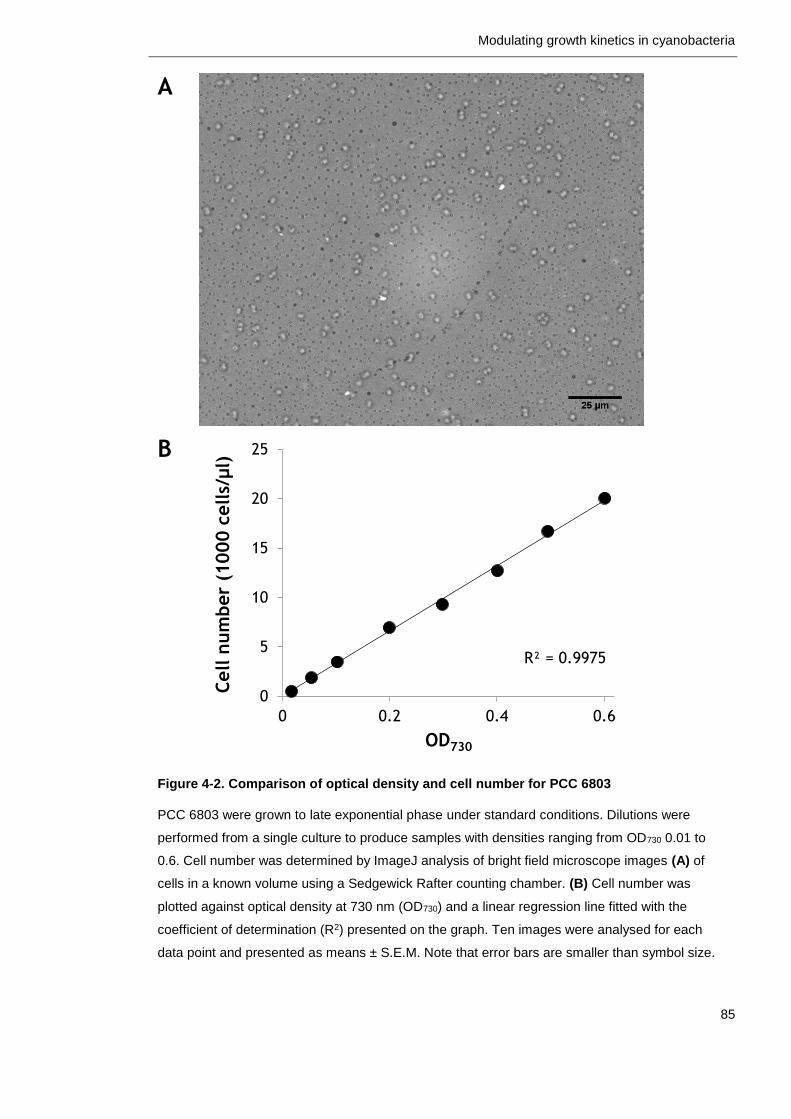
Modulating growth kinetics in cyanobacteria
85
A
B
Figure 4-2. Comparison of optical density and cell number for PCC 6803
PCC 6803 were grown to late exponential phase under standard conditions. Dilutions were
performed from a single culture to produce samples with densities ranging from OD730 0.01 to
0.6. Cell number was determined by ImageJ analysis of bright field microscope images (A) of
cells in a known volume using a Sedgewick Rafter counting chamber. (B) Cell number was
plotted against optical density at 730 nm (OD730) and a linear regression line fitted with the
coefficient of determination (R2) presented on the graph. Ten images were analysed for each
data point and presented as means ± S.E.M. Note that error bars are smaller than symbol size.
R² = 0.9975
0
5
10
15
20
25
0 0.2 0.4 0.6
Cell n
um
ber
(1000 c
ells/
µl)
OD730
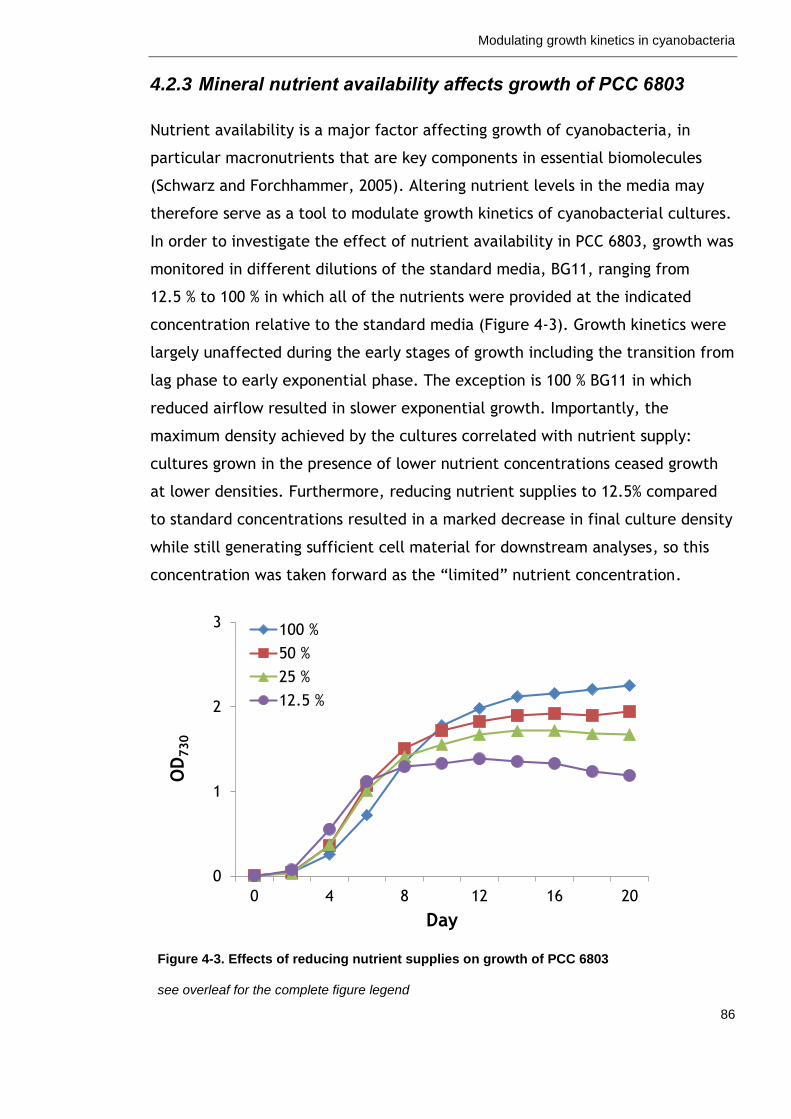
Modulating growth kinetics in cyanobacteria
86
4.2.3 Mineral nutrient availability affects growth of PCC 6803
Nutrient availability is a major factor affecting growth of cyanobacteria, in
particular macronutrients that are key components in essential biomolecules
(Schwarz and Forchhammer, 2005). Altering nutrient levels in the media may
therefore serve as a tool to modulate growth kinetics of cyanobacterial cultures.
In order to investigate the effect of nutrient availability in PCC 6803, growth was
monitored in different dilutions of the standard media, BG11, ranging from
12.5 % to 100 % in which all of the nutrients were provided at the indicated
concentration relative to the standard media (Figure 4-3). Growth kinetics were
largely unaffected during the early stages of growth including the transition from
lag phase to early exponential phase. The exception is 100 % BG11 in which
reduced airflow resulted in slower exponential growth. Importantly, the
maximum density achieved by the cultures correlated with nutrient supply:
cultures grown in the presence of lower nutrient concentrations ceased growth
at lower densities. Furthermore, reducing nutrient supplies to 12.5% compared
to standard concentrations resulted in a marked decrease in final culture density
while still generating sufficient cell material for downstream analyses, so this
concentration was taken forward as the “limited” nutrient concentration.
Figure 4-3. Effects of reducing nutrient supplies on growth of PCC 6803
see overleaf for the complete figure legend
0
1
2
3
0 4 8 12 16 20
OD
730
Day
100 %
50 %
25 %
12.5 %
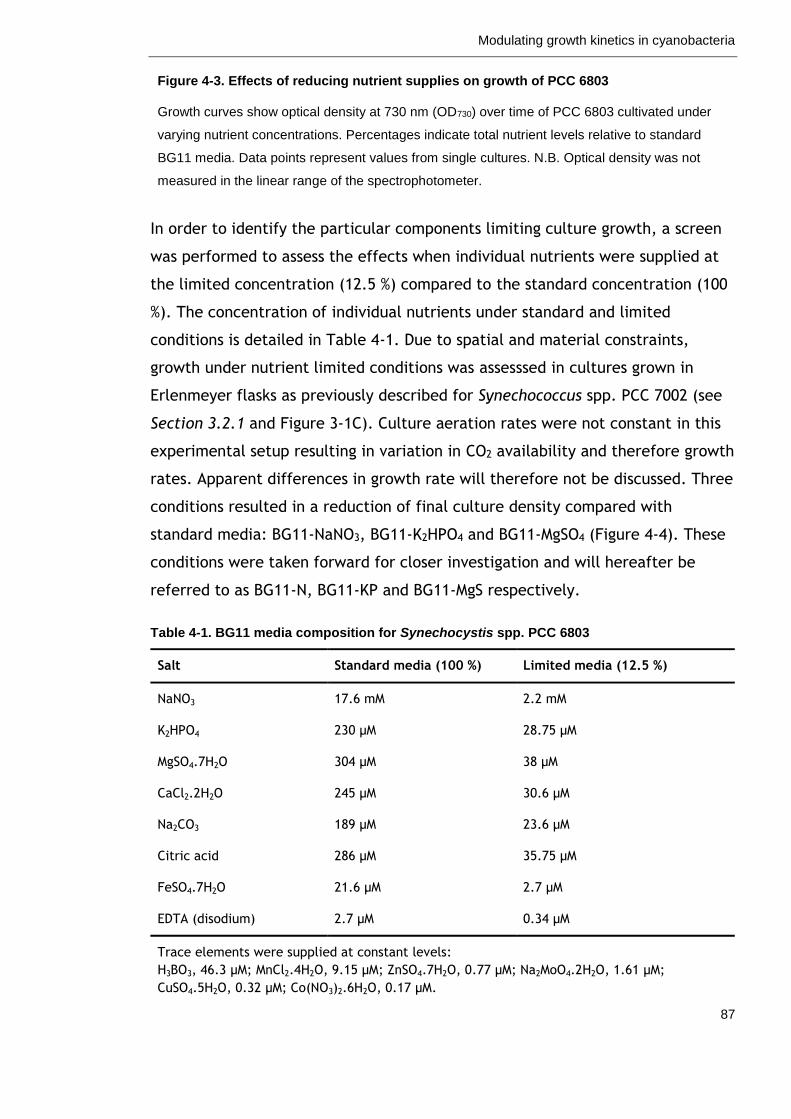
Modulating growth kinetics in cyanobacteria
87
Figure 4-3. Effects of reducing nutrient supplies on growth of PCC 6803
Growth curves show optical density at 730 nm (OD730) over time of PCC 6803 cultivated under
varying nutrient concentrations. Percentages indicate total nutrient levels relative to standard
BG11 media. Data points represent values from single cultures. N.B. Optical density was not
measured in the linear range of the spectrophotometer.
In order to identify the particular components limiting culture growth, a screen
was performed to assess the effects when individual nutrients were supplied at
the limited concentration (12.5 %) compared to the standard concentration (100
%). The concentration of individual nutrients under standard and limited
conditions is detailed in Table 4-1. Due to spatial and material constraints,
growth under nutrient limited conditions was assesssed in cultures grown in
Erlenmeyer flasks as previously described for Synechococcus spp. PCC 7002 (see
Section 3.2.1 and Figure 3-1C). Culture aeration rates were not constant in this
experimental setup resulting in variation in CO2 availability and therefore growth
rates. Apparent differences in growth rate will therefore not be discussed. Three
conditions resulted in a reduction of final culture density compared with
standard media: BG11-NaNO3, BG11-K2HPO4 and BG11-MgSO4 (Figure 4-4). These
conditions were taken forward for closer investigation and will hereafter be
referred to as BG11-N, BG11-KP and BG11-MgS respectively.
Table 4-1. BG11 media composition for Synechocystis spp. PCC 6803
Salt Standard media (100 %) Limited media (12.5 %)
NaNO3 17.6 mM 2.2 mM
K2HPO4 230 µM 28.75 µM
MgSO4.7H2O 304 µM 38 µM
CaCl2.2H2O 245 µM 30.6 µM
Na2CO3 189 µM 23.6 µM
Citric acid 286 µM 35.75 µM
FeSO4.7H2O 21.6 µM 2.7 µM
EDTA (disodium) 2.7 µM 0.34 µM
Trace elements were supplied at constant levels:
H3BO3, 46.3 µM; MnCl2.4H2O, 9.15 µM; ZnSO4.7H2O, 0.77 µM; Na2MoO4.2H2O, 1.61 µM;
CuSO4.5H2O, 0.32 µM; Co(NO3)2.6H2O, 0.17 µM.
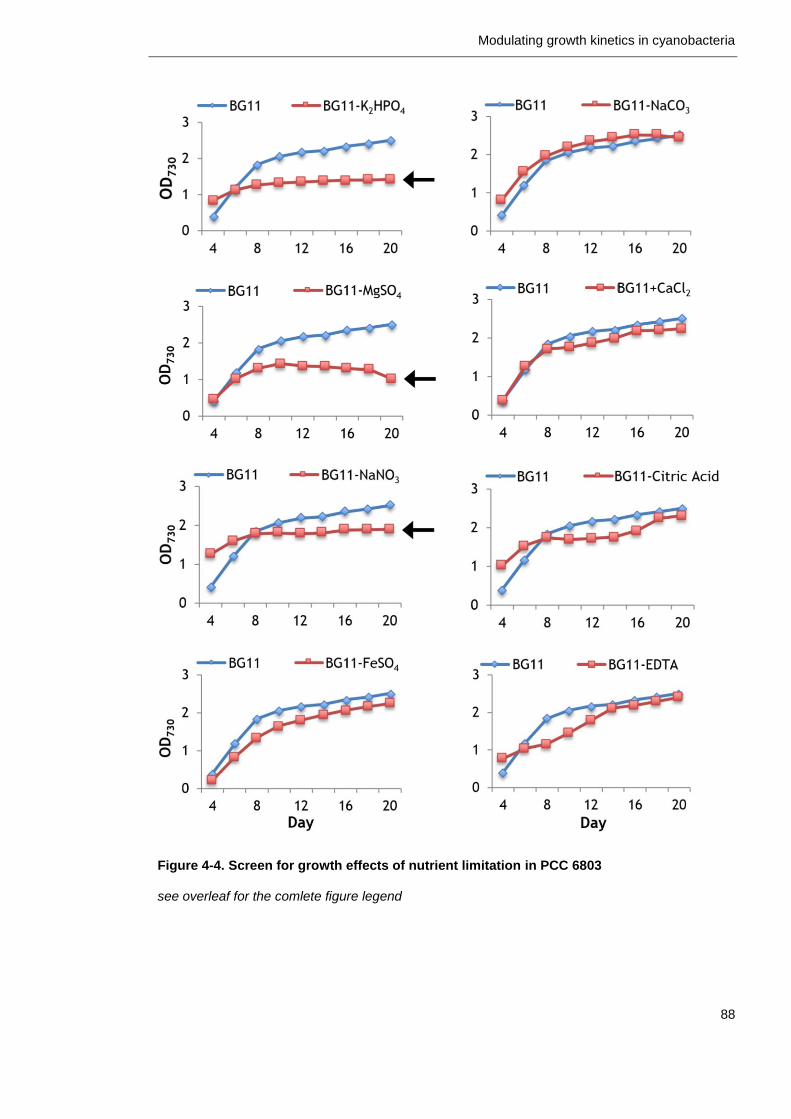
Modulating growth kinetics in cyanobacteria
88
Figure 4-4. Screen for growth effects of nutrient limitation in PCC 6803
see overleaf for the comlete figure legend
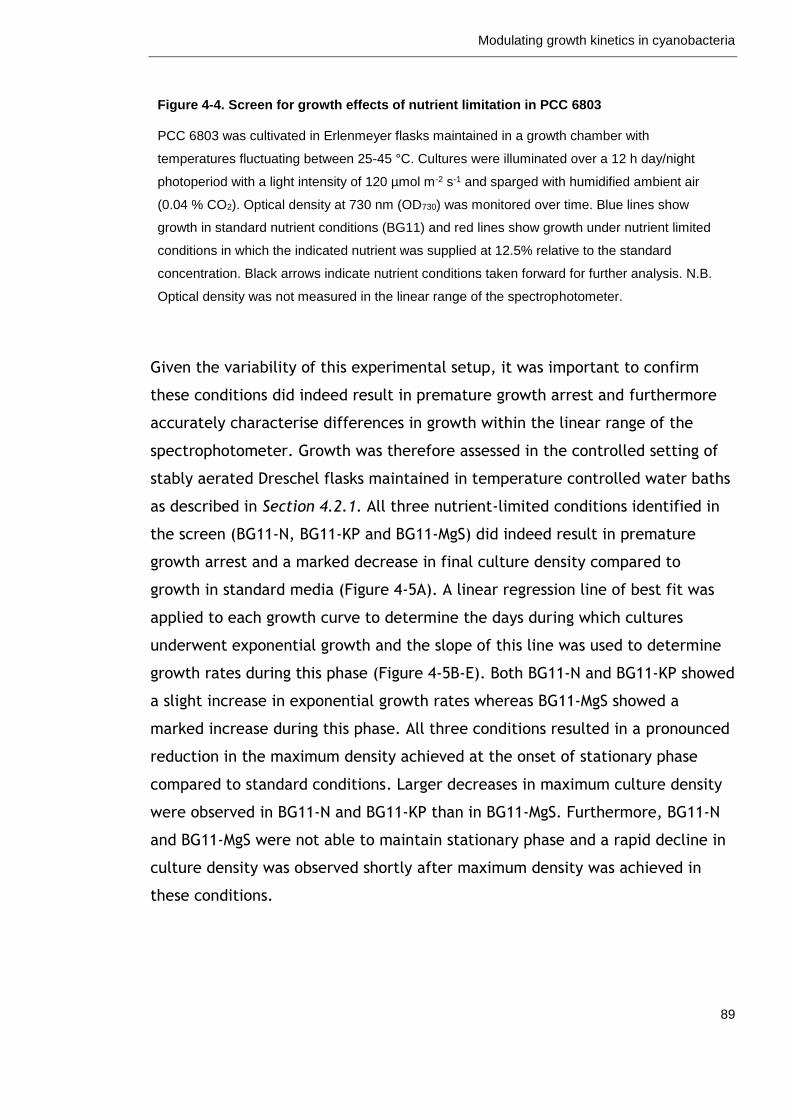
Modulating growth kinetics in cyanobacteria
89
Figure 4-4. Screen for growth effects of nutrient limitation in PCC 6803
PCC 6803 was cultivated in Erlenmeyer flasks maintained in a growth chamber with
temperatures fluctuating between 25-45 °C. Cultures were illuminated over a 12 h day/night
photoperiod with a light intensity of 120 µmol m-2 s-1 and sparged with humidified ambient air
(0.04 % CO2). Optical density at 730 nm (OD730) was monitored over time. Blue lines show
growth in standard nutrient conditions (BG11) and red lines show growth under nutrient limited
conditions in which the indicated nutrient was supplied at 12.5% relative to the standard
concentration. Black arrows indicate nutrient conditions taken forward for further analysis. N.B.
Optical density was not measured in the linear range of the spectrophotometer.
Given the variability of this experimental setup, it was important to confirm
these conditions did indeed result in premature growth arrest and furthermore
accurately characterise differences in growth within the linear range of the
spectrophotometer. Growth was therefore assessed in the controlled setting of
stably aerated Dreschel flasks maintained in temperature controlled water baths
as described in Section 4.2.1. All three nutrient-limited conditions identified in
the screen (BG11-N, BG11-KP and BG11-MgS) did indeed result in premature
growth arrest and a marked decrease in final culture density compared to
growth in standard media (Figure 4-5A). A linear regression line of best fit was
applied to each growth curve to determine the days during which cultures
underwent exponential growth and the slope of this line was used to determine
growth rates during this phase (Figure 4-5B-E). Both BG11-N and BG11-KP showed
a slight increase in exponential growth rates whereas BG11-MgS showed a
marked increase during this phase. All three conditions resulted in a pronounced
reduction in the maximum density achieved at the onset of stationary phase
compared to standard conditions. Larger decreases in maximum culture density
were observed in BG11-N and BG11-KP than in BG11-MgS. Furthermore, BG11-N
and BG11-MgS were not able to maintain stationary phase and a rapid decline in
culture density was observed shortly after maximum density was achieved in
these conditions.
Modulating growth kinetics in cyanobacteria
90
A
B
C
D
E
Figure 4-5. Growth of PCC 6803 in BG11, BG11-N, BG11-KP and BG11-MgS
see overleaf for the complete figure legend
0
4
8
12
0 5 10 15 20
OD
730
Day
BG11
BG11-N
BG11-KP
BG11-MgS
y = 0.0132e0.7239x
R² = 0.97280.01
1
100
0 5 10 15 20 25 30
OD
730
Day
BG11
y = 0.0092e0.851x
R² = 0.96260.01
0.1
1
10
0 5 10 15
OD
730
Day
BG11-N
y = 0.0099e0.7919x
R² = 0.98340.01
0.1
1
10
0 5 10 15
OD
730
Day
BG11-KP
y = 0.0015e1.2251x
R² = 0.93290.01
0.1
1
10
0 5 10 15
OD
730
Day
BG11-MgS
Modulating growth kinetics in cyanobacteria
91
Figure 4-5. Growth of PCC 6803 in BG11, BG11-N, BG11-KP and BG11-MgS
(A) Growth curves show optical density at 730 nm (OD730) of PCC 6803 cultivated under
standard (BG11) conditions, sodium nitrate limitation (BG11), di-potassium phosphate limitation
(BG11-KP), or magnesium sulphate limitation (BG11-MgS) in which limited nutrients were
supplied at 12.5 % relative to standard concentration. (B-E) Semi-logarithmic plots of growth
under each nutrient condition. An exponential regression line was fitted to points during
exponential growth (indicated with internal white boxes). The equation of the line and the
coefficient of determination (R2) derived from exponential growth points are presented on the
graph. Growth rates were determined by the slope of the line (underlined). Data are presented
as means ± S.E.M of three independent cultures. Note error bars are often smaller than symbol
size.
4.2.4 Teasing apart effects of single nutrient limitations
BG11 media supplies macronutrients (nitrogen, phosphorus and sulphur) in
chemical forms easily assimilated by cyanobacteria (nitrate, phosphate and
sulphate respectively). These nutrients are co-supplied with a counter ion as an
electrically neutral salt. Potassium (K) and magnesium (Mg) are supplied with
phosphate (P) and sulphate (S) as K2HPO4 (KP) and MgSO4 (MgS) respectively.
Both of these cations are essential for growth of cyanobacteria (Wolk, 1973) and
deficiency results in impaired growth in filamentous cyanobacteria (Utkilen,
1982, Alahari and Apte, 1998). It was therefore important to investigate the
specific effects of macronutrient and counter ion for each condition identified in
the previous section. In the case of NaNO3, sodium (Na) is provided as a counter
ion for nitrate (N) as well as various other components in BG11 (Table 4-1). The
growth effects observed in BG11 were therefore attributed to N limitation and
the effect of Na limitation was not investigated.
Severe growth inhibitions have been reported for PCC 6803 grown under P-
limitation with and without the replacement of K (Hirani et al., 2001, Fuszard et
al., 2013). It was therefore hypothesised that P was the main contributing factor
to the growth inhibitions observed in BG11-KP. However, KP is the sole source of
both K and P in BG11 media (Table 4-1). It was therefore important to determine
the specific effects of each component on PCC 6803 growth. First, the effects of
P-limitation were investigated by replacing K with KCl of the same osmolarity.
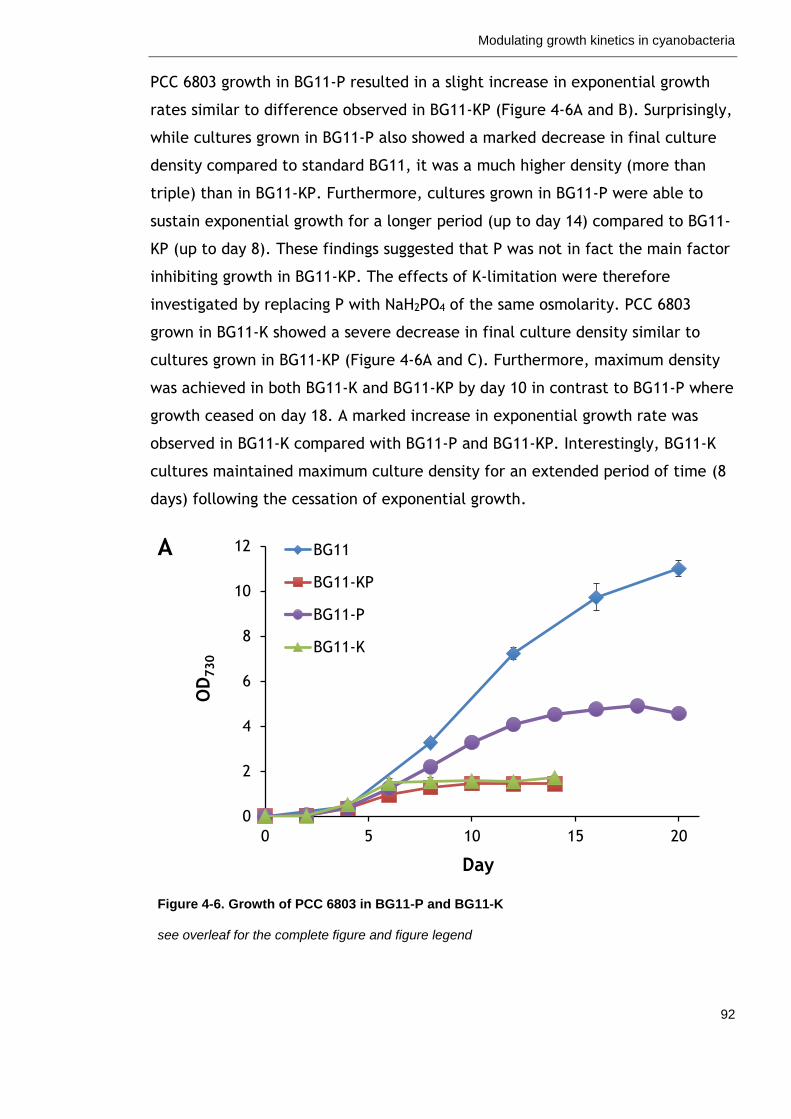
Modulating growth kinetics in cyanobacteria
92
PCC 6803 growth in BG11-P resulted in a slight increase in exponential growth
rates similar to difference observed in BG11-KP (Figure 4-6A and B). Surprisingly,
while cultures grown in BG11-P also showed a marked decrease in final culture
density compared to standard BG11, it was a much higher density (more than
triple) than in BG11-KP. Furthermore, cultures grown in BG11-P were able to
sustain exponential growth for a longer period (up to day 14) compared to BG11-
KP (up to day 8). These findings suggested that P was not in fact the main factor
inhibiting growth in BG11-KP. The effects of K-limitation were therefore
investigated by replacing P with NaH2PO4 of the same osmolarity. PCC 6803
grown in BG11-K showed a severe decrease in final culture density similar to
cultures grown in BG11-KP (Figure 4-6A and C). Furthermore, maximum density
was achieved in both BG11-K and BG11-KP by day 10 in contrast to BG11-P where
growth ceased on day 18. A marked increase in exponential growth rate was
observed in BG11-K compared with BG11-P and BG11-KP. Interestingly, BG11-K
cultures maintained maximum culture density for an extended period of time (8
days) following the cessation of exponential growth.
A
Figure 4-6. Growth of PCC 6803 in BG11-P and BG11-K
see overleaf for the complete figure and figure legend
0
2
4
6
8
10
12
0 5 10 15 20
OD
730
Day
BG11
BG11-KP
BG11-P
BG11-K
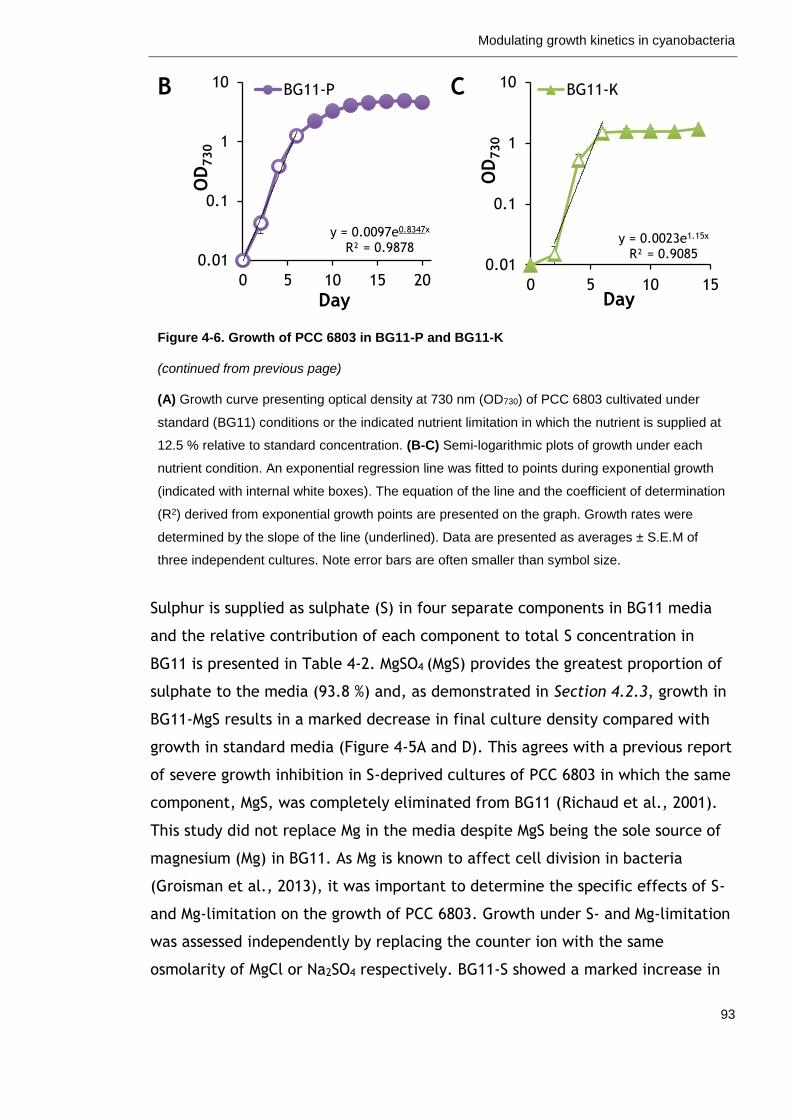
Modulating growth kinetics in cyanobacteria
93
B
C
Figure 4-6. Growth of PCC 6803 in BG11-P and BG11-K
(continued from previous page)
(A) Growth curve presenting optical density at 730 nm (OD730) of PCC 6803 cultivated under
standard (BG11) conditions or the indicated nutrient limitation in which the nutrient is supplied at
12.5 % relative to standard concentration. (B-C) Semi-logarithmic plots of growth under each
nutrient condition. An exponential regression line was fitted to points during exponential growth
(indicated with internal white boxes). The equation of the line and the coefficient of determination
(R2) derived from exponential growth points are presented on the graph. Growth rates were
determined by the slope of the line (underlined). Data are presented as averages ± S.E.M of
three independent cultures. Note error bars are often smaller than symbol size.
Sulphur is supplied as sulphate (S) in four separate components in BG11 media
and the relative contribution of each component to total S concentration in
BG11 is presented in Table 4-2. MgSO4 (MgS) provides the greatest proportion of
sulphate to the media (93.8 %) and, as demonstrated in Section 4.2.3, growth in
BG11-MgS results in a marked decrease in final culture density compared with
growth in standard media (Figure 4-5A and D). This agrees with a previous report
of severe growth inhibition in S-deprived cultures of PCC 6803 in which the same
component, MgS, was completely eliminated from BG11 (Richaud et al., 2001).
This study did not replace Mg in the media despite MgS being the sole source of
magnesium (Mg) in BG11. As Mg is known to affect cell division in bacteria
(Groisman et al., 2013), it was important to determine the specific effects of S-
and Mg-limitation on the growth of PCC 6803. Growth under S- and Mg-limitation
was assessed independently by replacing the counter ion with the same
osmolarity of MgCl or Na2SO4 respectively. BG11-S showed a marked increase in
y = 0.0097e0.8347x
R² = 0.98780.01
0.1
1
10
0 5 10 15 20
OD
730
Day
BG11-P
y = 0.0023e1.15x
R² = 0.90850.01
0.1
1
10
0 5 10 15
OD
730
Day
BG11-K
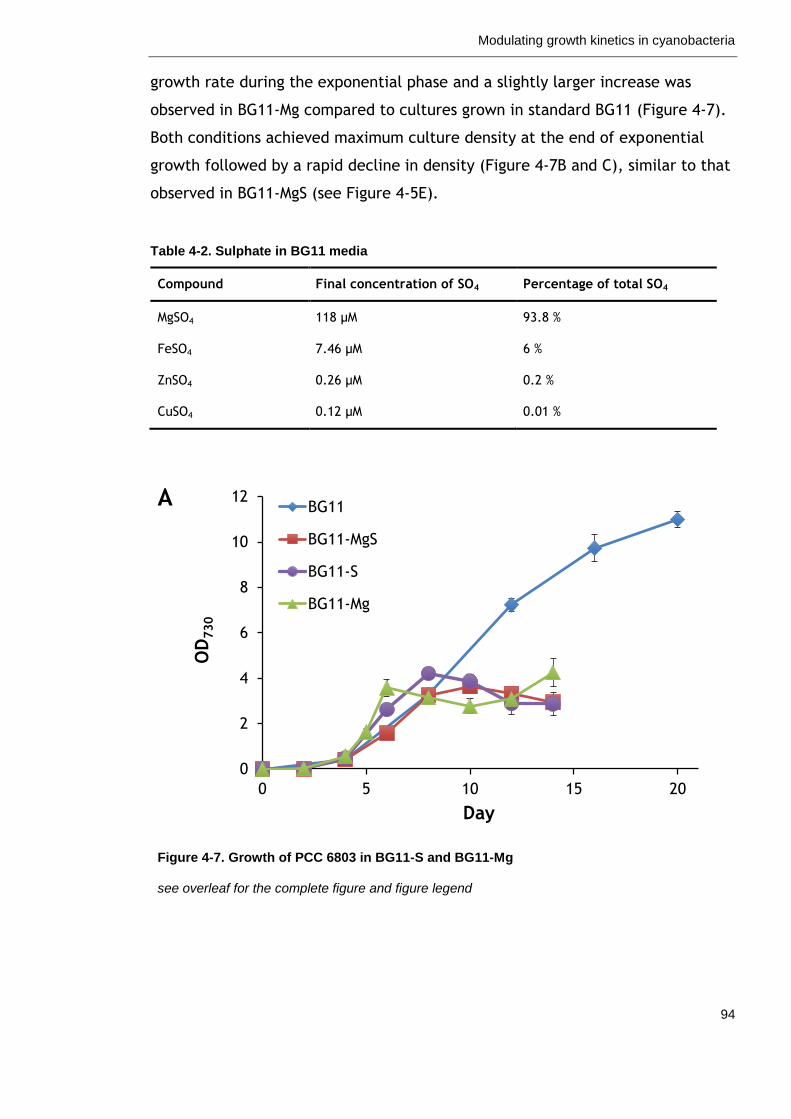
Modulating growth kinetics in cyanobacteria
94
growth rate during the exponential phase and a slightly larger increase was
observed in BG11-Mg compared to cultures grown in standard BG11 (Figure 4-7).
Both conditions achieved maximum culture density at the end of exponential
growth followed by a rapid decline in density (Figure 4-7B and C), similar to that
observed in BG11-MgS (see Figure 4-5E).
Table 4-2. Sulphate in BG11 media
Compound Final concentration of SO4 Percentage of total SO4
MgSO4 118 µM 93.8 %
FeSO4 7.46 µM 6 %
ZnSO4 0.26 µM 0.2 %
CuSO4 0.12 µM 0.01 %
A
Figure 4-7. Growth of PCC 6803 in BG11-S and BG11-Mg
see overleaf for the complete figure and figure legend
0
2
4
6
8
10
12
0 5 10 15 20
OD
730
Day
BG11
BG11-MgS
BG11-S
BG11-Mg
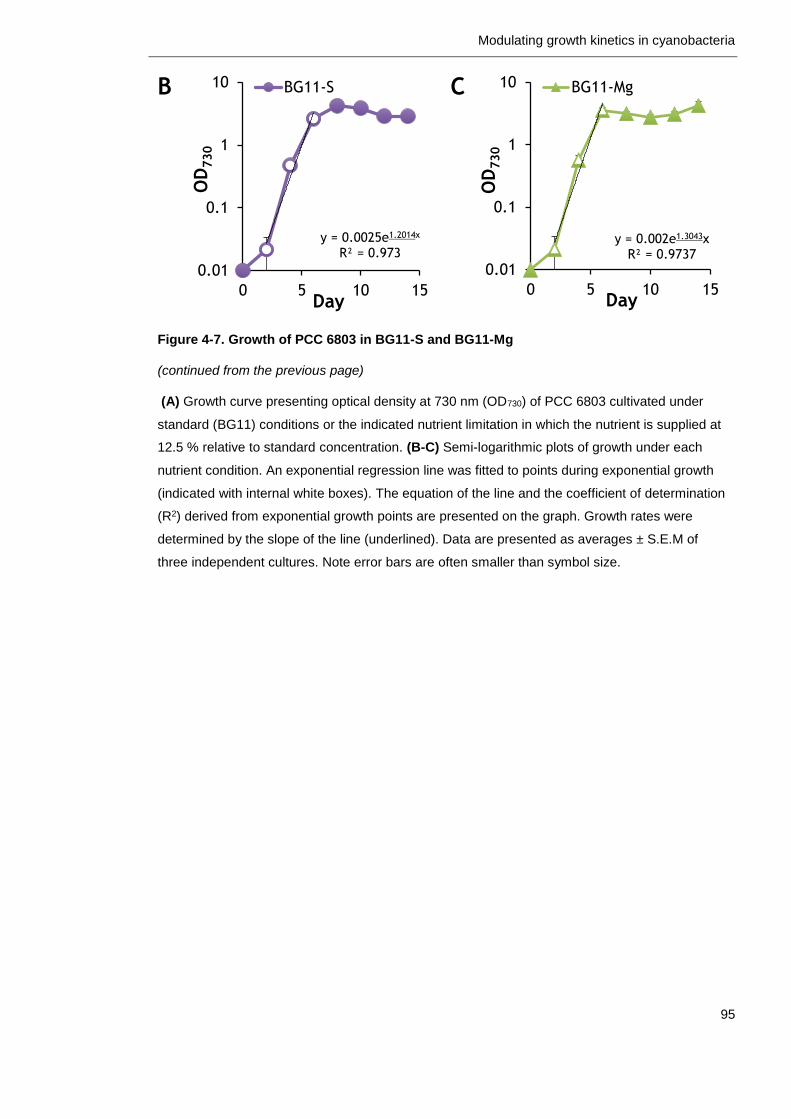
Modulating growth kinetics in cyanobacteria
95
B
C
Figure 4-7. Growth of PCC 6803 in BG11-S and BG11-Mg
(continued from the previous page)
(A) Growth curve presenting optical density at 730 nm (OD730) of PCC 6803 cultivated under
standard (BG11) conditions or the indicated nutrient limitation in which the nutrient is supplied at
12.5 % relative to standard concentration. (B-C) Semi-logarithmic plots of growth under each
nutrient condition. An exponential regression line was fitted to points during exponential growth
(indicated with internal white boxes). The equation of the line and the coefficient of determination
(R2) derived from exponential growth points are presented on the graph. Growth rates were
determined by the slope of the line (underlined). Data are presented as averages ± S.E.M of
three independent cultures. Note error bars are often smaller than symbol size.
y = 0.0025e1.2014x
R² = 0.973
0.01
0.1
1
10
0 5 10 15
OD
730
Day
BG11-S
y = 0.002e1.3043xR² = 0.9737
0.01
0.1
1
10
0 5 10 15
OD
730
Day
BG11-Mg
Modulating growth kinetics in cyanobacteria
96
4.3 Discussion
4.3.1 Nutrient availability as a means to modulate growth kinetics
in cyanobacteria
Cyanobacteria are complex organisms, which have evolved to cope with ever-
changing environments prone to nutrient deprivation. A detailed understanding
of the mineral nutrients affecting growth of cyanobacteria is important for the
development of large-scale processes and provides a tool with which to
investigate growth phase-specific responses. Nutrient deprivation studies in
cyanobacteria have primarily focused on the effects of nitrate (N), phosphate
(P), sulphate (S), iron (Fe) and carbon (C). Effects of these nutrients have been
studied in isolation focusing on responses to nutrient deprivation, i.e. total
elimination of the nutrient. Furthermore, these studies have often neglected to
consider the effects of counter ions supplied with these nutrients, notably
potassium (K) and magnesium (Mg) (Richaud et al., 2001, Krasikov et al., 2012,
Fuszard et al., 2013). By contrast, I have compared the effects of poor supplies
of individual components in the media on culture growth. The concentration for
nutrient limitation was selected by characterising growth under a range of
dilutions of BG11 media and a concentration was selected which resulted in a
marked decrease in final density whilst still generating enough cell material for
subsequent analyses. Specific components limiting growth within BG11 media
were then identified and the effects of macronutrients and counter ions within
these components characterised. This study utilised a single concentration to
represent nutrient limitation and indeed a range of concentrations representing
varying degrees of limitation as well as interactions between nutrients could be
explored. Nevertheless, the obtained results are informative for the ultimate
purpose to identify growth phase-specific regulators as we now have a range of
backgrounds in which cultures of cyanobacteria transition from exponential into
stationary phase for different reasons. Chapter 6 will describe the results
obtained by sequencing RNA of cells harvested at early and late exponential
phase across all of the nutrient-limited conditions identified in this chapter.
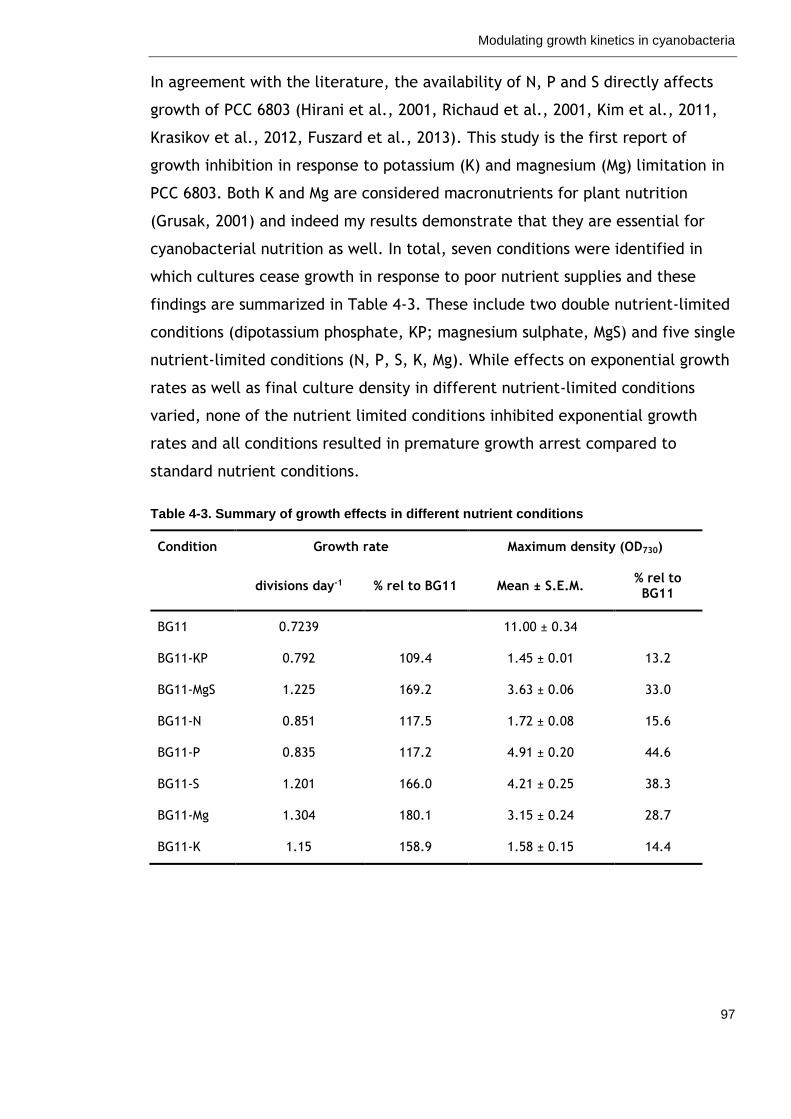
Modulating growth kinetics in cyanobacteria
97
In agreement with the literature, the availability of N, P and S directly affects
growth of PCC 6803 (Hirani et al., 2001, Richaud et al., 2001, Kim et al., 2011,
Krasikov et al., 2012, Fuszard et al., 2013). This study is the first report of
growth inhibition in response to potassium (K) and magnesium (Mg) limitation in
PCC 6803. Both K and Mg are considered macronutrients for plant nutrition
(Grusak, 2001) and indeed my results demonstrate that they are essential for
cyanobacterial nutrition as well. In total, seven conditions were identified in
which cultures cease growth in response to poor nutrient supplies and these
findings are summarized in Table 4-3. These include two double nutrient-limited
conditions (dipotassium phosphate, KP; magnesium sulphate, MgS) and five single
nutrient-limited conditions (N, P, S, K, Mg). While effects on exponential growth
rates as well as final culture density in different nutrient-limited conditions
varied, none of the nutrient limited conditions inhibited exponential growth
rates and all conditions resulted in premature growth arrest compared to
standard nutrient conditions.
Table 4-3. Summary of growth effects in different nutrient conditions
Condition Growth rate Maximum density (OD730)
divisions day-1 % rel to BG11 Mean ± S.E.M. % rel to BG11
BG11 0.7239 11.00 ± 0.34
BG11-KP 0.792 109.4 1.45 ± 0.01 13.2
BG11-MgS 1.225 169.2 3.63 ± 0.06 33.0
BG11-N 0.851 117.5 1.72 ± 0.08 15.6
BG11-P 0.835 117.2 4.91 ± 0.20 44.6
BG11-S 1.201 166.0 4.21 ± 0.25 38.3
BG11-Mg 1.304 180.1 3.15 ± 0.24 28.7
BG11-K 1.15 158.9 1.58 ± 0.15 14.4
Modulating growth kinetics in cyanobacteria
98
4.3.2 Nitrate supply is a key consideration for process design of
cyanofactories
Of the nutrients that were examined in this study, nitrate (N) availability had
the most pronounced effect on final culture density compared with the other
single nutrient-limited conditions. Given the relatively high N supply in BG11
(Table 4-1), this suggests that this is the most important factor for PCC 6803
growth. This finding agrees with the literature as nitrogen availability is the
most limiting factor for primary production in nature, and photosynthetic
organisms require more nitrogen than other nutrients (Vitousek and Howarth,
1991). In this study, I observed an abrupt transition from exponential growth into
the death phase in which culture density rapidly declined. This was somewhat
surprising given that cyanobacteria have evolved mechanisms to deal with N
stress, notably the degradation of N-rich phycobilisomes (Grossman et al., 1993,
Grossman et al., 1994, Schwarz and Forchhammer, 2005). One might therefore
hypothesise that these stores would help sustain stationary phase cultures.
Instead, my findings suggest that internal N stores are already consumed during
the exponential phase in order to maintain exponential growth. This hypothesis
is supported by the relatively pale colour of exponentially growing cultures in
BG11-N compared to BG11 (data not shown), a common observation under N
deprivation. The rapid decline in culture density following exponential growth
suggests that cyanobacteria are not in fact able to cope with N deprivation.
Assessment of pigment concentration throughout growth of PCC 6803 in BG11-N
compared to BG11 could give insight to how cyanobacteria manage N supplies
and inform process design of cyanobacterial cell factories as this can have direct
impacts on both biomass generation and protein synthesis.
Modulating growth kinetics in cyanobacteria
99
4.3.3 Cyanobacteria sense and respond to P-limitation before
supplies run out
Phosphate (P) starvation has been reported to severely inhibit growth of PCC
6803 (Hirani et al., 2001, Fuszard et al., 2013). Even upon replacement of K,
complete elimination of P resulted in a final density of just 10 % compared to
cultures grown in the presence of P (Hirani et al., 2001). While poor P supplies
also inhibited growth in my experiments, the effect was less severe than
previously reported. Cells cultivated in BG11-P were able to maintain growth for
an extended period (up to day 18) compared with other nutrient-limited
conditions (up to day 6-10). While BG11-P produced a final culture density
comparable to that of BG11-S and BG11-Mg, relatively slow exponential growth
rates enabled the prolonged growth phase (Table 4-3). It is important to note
that this is not due to a decrease in BG11-P growth rates but rather the marked
increase in BG11-Mg and BG11-S growth rates.
External P levels may influence growth rates and cyanobacteria do in fact sense
and respond to phosphate levels via the SphS-SphR two-component signal
transduction system (Hirani et al., 2001). These systems allow bacteria to
monitor external conditions and adjust to changing environments accordingly
(Parkinson and Kofoid, 1992). In PCC 6803, the histidine kinase P sensor SphS
monitors external P levels via an extended N-terminal region spanning the cell
membrane (Burut-Archanai et al., 2009). Upon detection of limited P supplies, a
histidine residue is phosphorylated in the carboxy-terminal transmitter motif.
The phosphoryl group is transferred to a specific aspartate residue on the amino-
terminal receiver motif of the cognate response regulator SphR. A DNA-binding
domain located in the C-terminus of the response regulator induces P-responsive
genes such as the phosphate-specific transport systems Pst1 and Pst2. Given the
reduction in growth rate observed under P-limitation in both this study as well a
previous report (Hirani et al., 2001), genes involved in growth are likely targets
of SphR or downstream regulators. These genes could be interesting targets to
enhance biomass production rates and furthermore serve as markers to indicate
diminishing supplies of a key component for product synthesis.
Modulating growth kinetics in cyanobacteria
100
4.3.4 Potassium maintains turgor pressure and shape of bacterial
cells
Potassium (K) is the major intracellular cation in bacteria. While K is not
incorporated into chemical compounds, it serves important roles including
maintenance of osmotic pressure and pH, enzyme activation and as a second
messenger to stimulate compatible solute accumulation (Epstein, 2003).
Notably, osmotic pressure creates cellular hydrostatic forces known as turgor
pressure, which is essential for growth and determination of the shape of
bacterial cells. As K is not metabolised, there are no intracellular reserves from
which to scavenge K to increase turgor pressure in growing cells providing a
possible explanation for the abrupt halt in growth observed under K-limitation
(Figure 4-6C).
K is also important to maintain intracellular pH and, while the mechanism of pH
homeostasis is not clearly understood in cyanobacteria, lack of control of
intracellular pH results in growth limitation in the heterocystous, filament-
forming cyanobacterium Anabaena spp. 7120 (Giraldez-Ruiz et al., 1997). In this
case, calcium (Ca) supplies under low pH conditions were used to modulate
intracellular pH. In my nutrient limitation screen, Ca-limitation (as CaCl2; Figure
4-4) had no noticeable effects on growth, however accurate quantification in a
more controlled setting may reveal subtle growth effects. Nevertheless,
imbalances in pH homeostasis arising from K-limitation may be a contributing
factor to the growth effects observed in this study.
Growth inhibition following transfer to K-deficient media has also been observed
in the filamentous cyanobacterium Anabaena torulosa (Alahari and Apte, 1998).
K-starved cells were able to recover growth upon resupply of K. The actual cause
of growth arrest was not determined, however decreases in both photosynthetic
function and protein synthesis were observed following K deprivation. These may
be general responses arising from growth arrest, however, as cyanobacteria shut
down anabolic pathways and enter a “stand-by” metabolic mode (Schwarz and
Forchhammer, 2005).
Modulating growth kinetics in cyanobacteria
101
Interestingly, K does not appear to be important to maintain stationary phase in
PCC 6803. BG11-K was the only single nutrient-limited condition in which
maximum culture density was steadily maintained for an extended period
following the cessation of exponential growth. Furthermore, the double-nutrient
limited condition BG11-KP showed a similar effect. By contrast, all other
conditions resulted in a (often immediately) rapid decline in culture density once
exponential growth has stopped. These findings suggest that while K essential for
growth, it is not necessary for stationary phase viability. This opens an
interesting possibility for industrial applications, as K supply can be a means to
determine culture density and thus control timing of entry to stationary phase.
In summary, K is important to support biomass production by maintaining turgor
pressure in growing cells and has potential as a tool to control time of entry into
the production phase before essential nutrients are exhausted in batch cultures.
4.3.5 Magnesium is a key factor coordinating cell growth and
metabolism
Magnesium (Mg) is the second most abundant cation in bacteria after potassium
and plays a critical role in membrane stabilisation, ribosomes and as a cofactor
in enzymatic reactions such as DNA replication and transcription. Furthermore,
in photosynthetic organisms, Mg is a core component of the most abundant
pigment, chlorophyll, and has been proposed as the dominant counterion to
conserve the pH gradient and transmembrane potential of thylakoids in plants
(Barber et al., 1974). In mammalian cells, Mg is the key factor coordinating cell
growth and metabolism. It acts as a sensor for cell size and regulates cell
division by timing the transition between cell cycle phases, notably entry to S
phase during which DNA replication occurs (Wolf and Cittadini, 1999). A general
feature of Mg-limitation in bacteria is the enlargement of cells that may be the
result of continued growth in spite of the inability to progress through the cell
cycle (Groisman et al., 2013). In agreement, the most pronounced effect of Mg-
limitation in the filamentous cyanobacterium A. nidulans was increased cell size
resulting from continued DNA, protein and cell mass synthesis despite inhibited
cell division (Utkilen, 1982). This was attributed to an inhibition in cell wall
Modulating growth kinetics in cyanobacteria
102
lipoprotein synthesis in which Mg plays an important role to neutralise the
negative charge of phosphate residues.
Similar to phosphate, bacteria are able to sense intra- and extracellular Mg
levels using a two-component system. The PhoP/PhoQ system of Salmonella
enterica was the first signal transduction system to be identified and
characterised in which an ion, namely Mg, acts as a first messenger (Garcia
Véscovi et al., 1996). In this case, Mg ions form a metal bridge between negative
residues in the periplasmic domain of PhoQ and the phospholipid head groups of
the cytoplasmic membrane. Absence of Mg destabilised PhoQ resulting in PhoP
phosphorylation and subsequent regulation of Mg-responsive genes. Mg sensing
systems have not been described for cyanobacteria, and my results suggest that
PCC 6803 are not able to detect and respond to reduced Mg availability early in
culture growth. Given that PCC 6803 are not able to maintain high culture
density during stationary phase once Mg supplies have run out, it will be
important to ensure sufficient supplies of Mg are provided both during the
growth and production phases of cyanobacterial cell factories.
4.3.6 Quantification of growth in cyanobacteria
There are numerous approaches to quantify growth of cyanobacterial cultures.
For my experiments, I selected optical density, as this was a relatively fast and
easy method to assess changes in growth. Importantly for synthetic biology
applications, this can be measured using standard laboratory equipment and is
relatively comparable across laboratories. Nevertheless, this may not always be
the best approach. While a linear relationship was observed between optical
density and cell number from a single culture grown under standard conditions,
the relationship between these two variables may not remain constant under
different conditions. This is due to the fact that optical density reflects a
number of factors including cell number, cell size and particulate matter in the
media, which may arise in applications such as bioproduction. Optical density
may therefore increase even if cell numbers remain the same. This may be the
case in BG11-Mg, for instance, where cell elongation is a common response in
bacteria (Groisman et al., 2013). Nevertheless, optical density is a good measure
Modulating growth kinetics in cyanobacteria
103
for biomass as it reflects the combined information of both cell size and number
within a culture. This is perhaps the most interesting parameter for practical
applications and aids in our purpose to identify promoters specifically active
once maximum biomass has been achieved.
In summary, seven different nutrient conditions (two double nutrient-limited and
five single nutrient-limited conditions) have been identified in which PCC 6803
ceases growth in response to different components in the media. Indeed,
mineral nutrients are just one factor that may affect culture growth and one
could have assessed growth effects under variable light intensity, carbon
availability as well as heterotrophic conditions. For interrogating growth-phase
specific expression, however, these conditions will suffice. Few reports describe
late growth of cyanobacterial cultures, so nutrient limitation can provide a
useful tool to dissect the various growth phases in cyanobacteria. Importantly,
by identifying common responses across a range of conditions in which
cyanobacteria have ceased growth, we can be more confident that these
responses are indeed a result of changes in growth as opposed to particular
stresses. Chapter 5 will investigate expression patterns of published growth
phase-specific genes by qPCR and Chapter 6 will identify co-regulated gene
clusters by RNA sequencing using the conditions established in this chapter.
Testing published growth phase-specific genes
104
Chapter 5. Testing published growth phase-
specific genes
5.1 Introduction
Promoters are important regulatory elements for high-level gene expression and
recombinant protein production. As discussed in Section 4.1, growth phase-
specific promoters are a particularly attractive tool to regulate gene expression
as they do not require the addition of costly and often toxic supplements to
induce or repress expression but rather respond to endogenous cues induced by
changes in growth. For this purpose, it is useful to divide growth into two
distinct phases. First, the exponential growth phase during which cells are
actively growing and dividing (hereafter “early growth”). Then as environmental
factors becoming limiting during late exponential and stationary phase growth,
cells eventually cease growth (hereafter “late growth”). The late growth phase
is typically the optimal time for engineered processes to occur, as this is when
maximum biomass has been achieved. Promoters specifically active during late
culture growth are desirable as they avoid interference of transgene expression
with culture growth. A key feature of promoters for industrial applications is
tight regulation and efficient silencing during non-induced conditions.
Furthermore, promoters should be robust in the sense that they are specifically
activated by the desired stimulus, in this case growth phase. Thus late growth-
specific promoters should not be active during early culture growth and be
robustly activated during late growth irrespective of the particular factor which
is limiting further growth.
Growth phase-specific expression systems have been developed for prokaryotes
including E. coli, Bacillus subtilis and Pseudomonas putida to name a few
(Miksch and Dobrowolski, 1995, Cases et al., 1996, Schumann, 2007). These
systems typically rely on “sigma switching” whereby the RNA polymerase
holoenzyme alters its promoter specificity in response to environmental stimuli
by replacing the primary sigma factor with alternative sigma factors. In this way,
Testing published growth phase-specific genes
105
bacteria can alter gene expression over a wide range of different functions to
enable acclimation to changing environmental conditions. Thus, promoters
specifically recognized by alternative sigma factors involved in the regulation of
growth phase-specific gene expression are a valuable tool for regulating large-
scale processes. In E. coli, late growth-specific expression is regulated by the
alternative sigma factor, RpoS (σS) (Hengge-Aronis, 2002). Intracellular levels of
σS increase as cells cease growth prior to entry to stationary phase and this
factor subsequently induces the expression of some 30 genes upon entry to
stationary phase (Jishage and Ishihama, 1995). Based on the consensus sequence
of promoters regulated by σS, libraries of synthetic promoters for late growth-
specific induction have been constructed and optimized for E. coli (Miksch et al.,
2005).
As usual, cyanobacteria are lagging behind its prokaryotic peers. Efforts have
been made towards unravelling late growth-specific gene expression and its
regulation, however growth-phase specific promoters are still lacking. A few
alternative sigma factors have suggested roles in regulating late growth-specific
expression, however a general late growth regulator remains to be identified
(Osanai et al., 2008, Imamura and Asayama, 2009). Furthermore, target
promoters of factors implicated in regulating late growth gene expression have
not yet been identified. Microarray analyses have revealed genes that follow late
growth-specific expression patterns. However, these studies compared changes
in gene expression across a limited number of conditions. First, late exponential
phase-specific genes were identified in two genotypes, wild type and ΔsigB,
which have virtually identical growth kinetics (Foster et al., 2007). Second,
stationary phase-specific genes were identified using two conditions, autotrophic
and mixotrophic cultures, with very different growth kinetics (Berla and Pakrasi,
2012). These studies can inform the identification of late growth-specific
promoters and indeed candidates have been suggested. However, validation is
required to confirm the robustness of the growth-specific expression patterns
under a range of conditions.
Testing published growth phase-specific genes
106
5.1.1 Chapter aim
This work aimed to assess the robustness of candidate genes exhibiting late
growth-specific expression patterns identified in previous microarray studies
(Berla and Pakrasi, 2012, Foster et al., 2007). The previous chapter identified a
range of backgrounds in which cultures of cyanobacteria ceased growth for
different reasons, thus providing additional conditions with which to explore
transcriptional changes in response to growth. Transcript levels of the candidate
genes were measured by quantitative real-time PCR (qPCR) analysis throughout
culture growth in different conditions including standard nutrient conditions
(BG11) and double nutrient-limited conditions, 12.5 % MgSO4 (BG11-MgS) and
12.5 % K2HPO4 (BG11-KP). Genome-wide oscillations in transcription occur
because of circadian rhythm and in PCC 6803 up to 9 % of genes oscillate in
expression during a 24-hour period (Kucho et al., 2005). In order to avoid
circadian oscillations, all samples were harvested midway through the 12 hour
day period, i.e. 6 hours after the lights turned on. Phenol-chloroform extraction
was performed to isolate RNA from frozen cell pellets and cDNA template was
generated using a random priming strategy. The identification of genes that are
robustly regulated by changes in growth can serve to a) identify candidate
growth phase-specific promoters and b) serve as markers to indicate growth
phase of cells harvested at different times during growth.
Testing published growth phase-specific genes
107
5.2 Results
5.2.1 Identification of a suitable reference gene for qPCR
analysis
Expression of candidate growth phase-specific genes was assessed by measuring
transcript levels in cultures grown under different nutrient conditions by
quantitative real-time PCR (qPCR). This technique enables accurate
quantification of expression levels of a limited number of genes in different
samples. However, to account for variation during sample preparation and
quantification, the values obtained for the test genes need to be normalized to a
constitutive reference gene in the same sample. The expression levels of
common reference genes may vary considerably depending on the samples and
experimental conditions (Thellin et al., 1999, Dheda et al., 2004). It was
therefore necessary to identify a suitable reference gene that was stably
expressed throughout growth of cyanobacterial cultures under the different
conditions. geNorm software was used to assess the stability of a selection of
candidate reference genes. This algorithm determines the pairwise variation of
each gene with all other genes based on their crossing threshold (Ct) values
across a representative set of samples (Vandesomepele et al., 2002). Genes with
the greatest variation are sequentially excluded until two genes with the most
stable expression levels are identified.
Table 5-1 presents the candidate reference genes interrogated in nine samples
consisting of PCC 6803 cells harvested at three different times during growth
(days 4, 8 and 12) under three different nutrient conditions (BG11, BG11-MgS
and BG11-KP). The list includes commonly used reference genes for
normalisation of qPCR data in PCC 6803 and the primary sigma factor SigA, which
maintains constant expression levels irrespective of growth phase in PCC 6803
(Imamura et al., 2003b). Reference genes for Bacillus anthracis were also
interrogated. Reference genes for E. coli (cysG, hcaT, idnT and ihfB) (Zhou et
al., 2011) were also considered but homologs for these genes could not be
identified in PCC 6803 using the Basic Local Alignment Search Tool (BLAST).
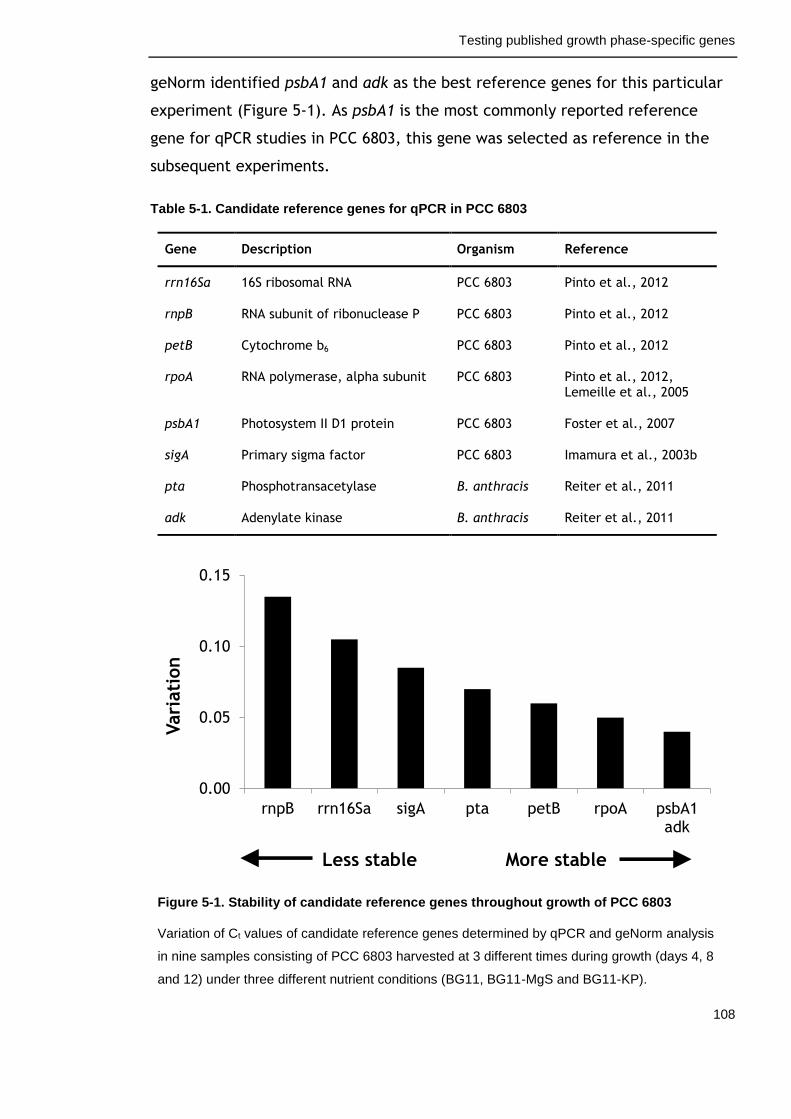
Testing published growth phase-specific genes
108
geNorm identified psbA1 and adk as the best reference genes for this particular
experiment (Figure 5-1). As psbA1 is the most commonly reported reference
gene for qPCR studies in PCC 6803, this gene was selected as reference in the
subsequent experiments.
Table 5-1. Candidate reference genes for qPCR in PCC 6803
Gene Description Organism Reference
rrn16Sa 16S ribosomal RNA PCC 6803 Pinto et al., 2012
rnpB RNA subunit of ribonuclease P PCC 6803 Pinto et al., 2012
petB Cytochrome b6 PCC 6803 Pinto et al., 2012
rpoA RNA polymerase, alpha subunit PCC 6803 Pinto et al., 2012, Lemeille et al., 2005
psbA1 Photosystem II D1 protein PCC 6803 Foster et al., 2007
sigA Primary sigma factor PCC 6803 Imamura et al., 2003b
pta Phosphotransacetylase B. anthracis Reiter et al., 2011
adk Adenylate kinase B. anthracis Reiter et al., 2011
Figure 5-1. Stability of candidate reference genes throughout growth of PCC 6803
Variation of Ct values of candidate reference genes determined by qPCR and geNorm analysis
in nine samples consisting of PCC 6803 harvested at 3 different times during growth (days 4, 8
and 12) under three different nutrient conditions (BG11, BG11-MgS and BG11-KP).
0.00
0.05
0.10
0.15
rnpB rrn16Sa sigA pta petB rpoA psbA1adk
Vari
ati
on
More stable Less stable
Testing published growth phase-specific genes
109
5.2.2 Expression profiles of sigma factors implicated in
regulation of late growth gene expression
In many species of bacteria, sigma factors are key components in the
regulation of late growth-specific gene expression by altering promoter
specificity of the RNA polymerase holoenzyme (Miksch and Dobrowolski, 1995,
Cases et al., 1996, Schumann, 2007). Three alternative sigma factors are
implicated in regulating late growth-specific expression in PCC 6803. SigC
regulates stress-related regulons important for stationary phase survival
(Asayama et al., 2004). A more general role for SigC in stationary phase-
specific gene regulation remains to be demonstrated, however. SigB, on the
other hand, is implicated in general regulation of late exponential phase-
specific gene expression (Foster et al., 2007). Gene inactivation of sigB
modulated differential gene expression in PCC 6803 during the transition from
exponential to stationary phase growth including the down-regulation of sigC
transcript. Furthermore, this study demonstrated a potential role of SigH in
the regulation of late growth-specific gene expression. Regulation of sigma
factors has been demonstrated at the transcript level by qPCR analysis in PCC
6803 sigma mutants (Lemeille et al., 2005). Thus, sigma factors involved in
regulating late growth gene expression may serve as useful indicators that
cultures are preparing to enter stationary phase growth and as tools to
identify target promoter sequences during this transition.
The group 2 factor SigC is important for survival during stationary phase
growth in PCC 6803 (Asayama et al., 2004). Gene disruption of sigC results in a
significant reduction in cell viability during the stationary phase compared
with wild-type cells as demonstrated by viable cell counts on BG11 plates,
trypan blue staining and visualization of lysed cells by transmission electron
microscopy. SigC regulates stationary phase-specific expression of nitrogen-
related genes in response to nitrogen status (Asayama et al., 2004) and
mediates stress responses such as heat acclimation (Tuominen et al., 2008).
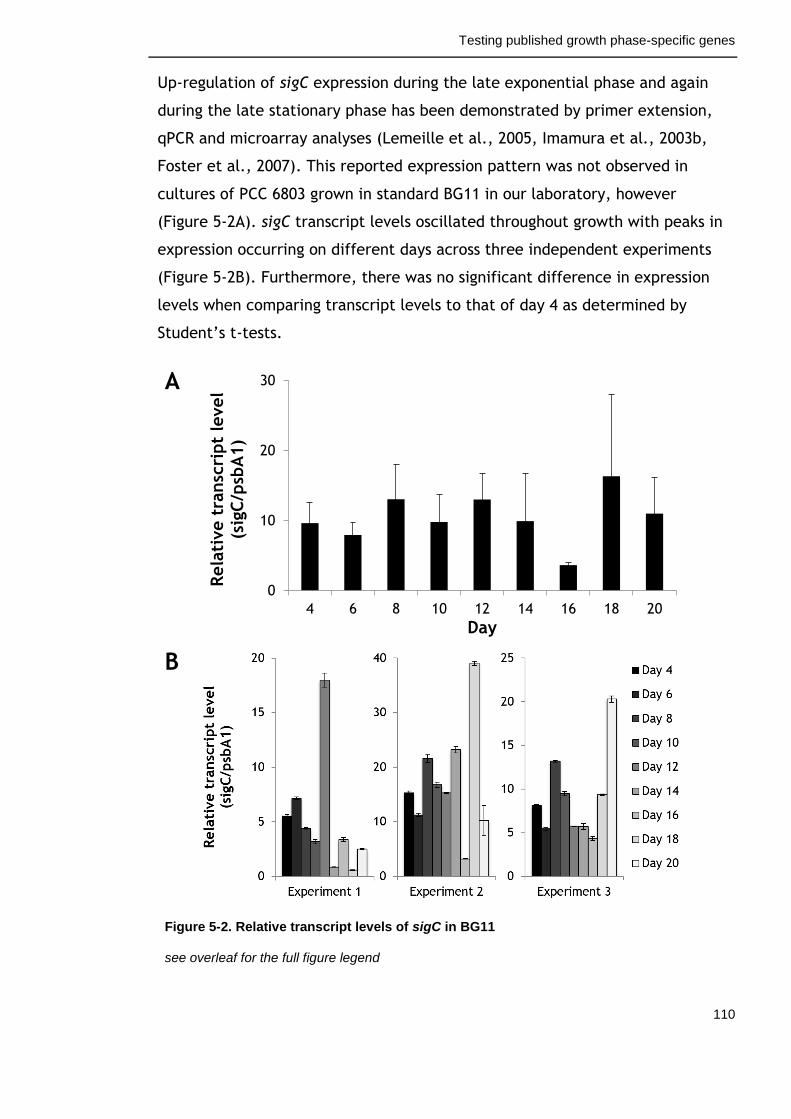
Testing published growth phase-specific genes
110
Up-regulation of sigC expression during the late exponential phase and again
during the late stationary phase has been demonstrated by primer extension,
qPCR and microarray analyses (Lemeille et al., 2005, Imamura et al., 2003b,
Foster et al., 2007). This reported expression pattern was not observed in
cultures of PCC 6803 grown in standard BG11 in our laboratory, however
(Figure 5-2A). sigC transcript levels oscillated throughout growth with peaks in
expression occurring on different days across three independent experiments
(Figure 5-2B). Furthermore, there was no significant difference in expression
levels when comparing transcript levels to that of day 4 as determined by
Student’s t-tests.
A
B
Figure 5-2. Relative transcript levels of sigC in BG11
see overleaf for the full figure legend
0
10
20
30
4 6 8 10 12 14 16 18 20
Rela
tive t
ransc
ript
level
(sig
C/p
sbA
1)
Day
Testing published growth phase-specific genes
111
Figure 5-2. Relative transcript levels of sigC in BG11
RNA was isolated throughout growth of PCC 6803 under standard nutrient conditions.
Transcript levels were normalised to the reference gene psbA1 and are presented as means ±
S.E.M. of (A) three independent experiments and (B) technical replicates within each
experiment.
SigH belongs to the alternative group 3 sigma factors of which little is
currently known (Imamura and Asayama, 2009). Northern blot analyses
demonstrate a 30-fold increase in sigH transcript following heat stress. This
factor is not involved in the immediate response to heat stress however, as
heat shock response genes such as groEL are induced prior to SigH (Huckauf et
al., 2000). While SigH function remains unclear, a role in regulating late
growth gene expression has been suggested (Foster et al., 2007). Transcript
analyses support a role during late growth as primer extension, qPCR and
microarray analyses have demonstrated up-regulation of sigH transcript in late
exponential and stationary phase cultures of PCC 6803 (Imamura et al., 2003b,
Lemeille et al., 2005, Foster et al., 2007). In fact, sigH showed the greatest
response in a microarray study comparing gene expression in late against early
exponential growth (11-fold up-regulation). Despite multiple reports of sigH
induction during late growth, this expression pattern was not observed across
three independent cultivations of PCC 6803 grown in standard BG11 in our
laboratory (Figure 5-3). sigH transcript levels oscillated throughout growth and
highly variable up-regulation was observed at the last time point, day 20, with
1.5- to 7-fold up-regulation compared to day 4. The difference was not
statistically significant as determined by Student’s t-tests.
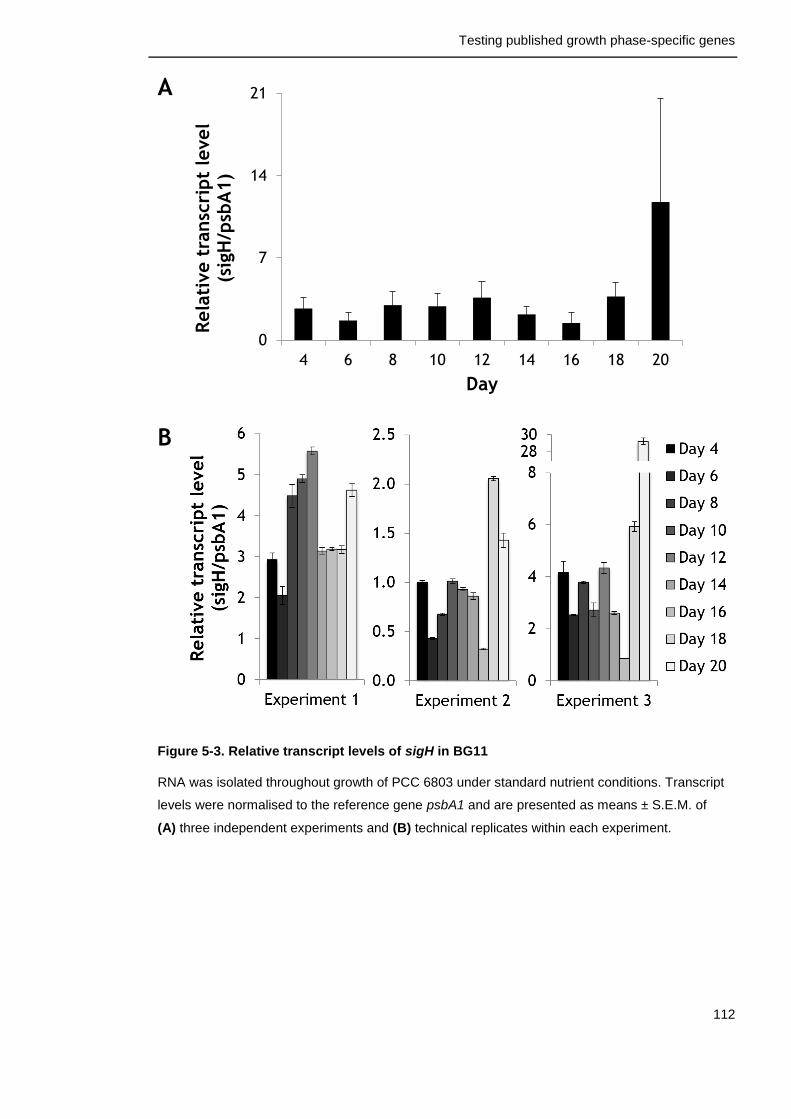
Testing published growth phase-specific genes
112
A
B
Figure 5-3. Relative transcript levels of sigH in BG11
RNA was isolated throughout growth of PCC 6803 under standard nutrient conditions. Transcript
levels were normalised to the reference gene psbA1 and are presented as means ± S.E.M. of
(A) three independent experiments and (B) technical replicates within each experiment.
0
7
14
21
4 6 8 10 12 14 16 18 20
Rela
tive t
ransc
ript
level
(sig
H/p
sbA
1)
Day
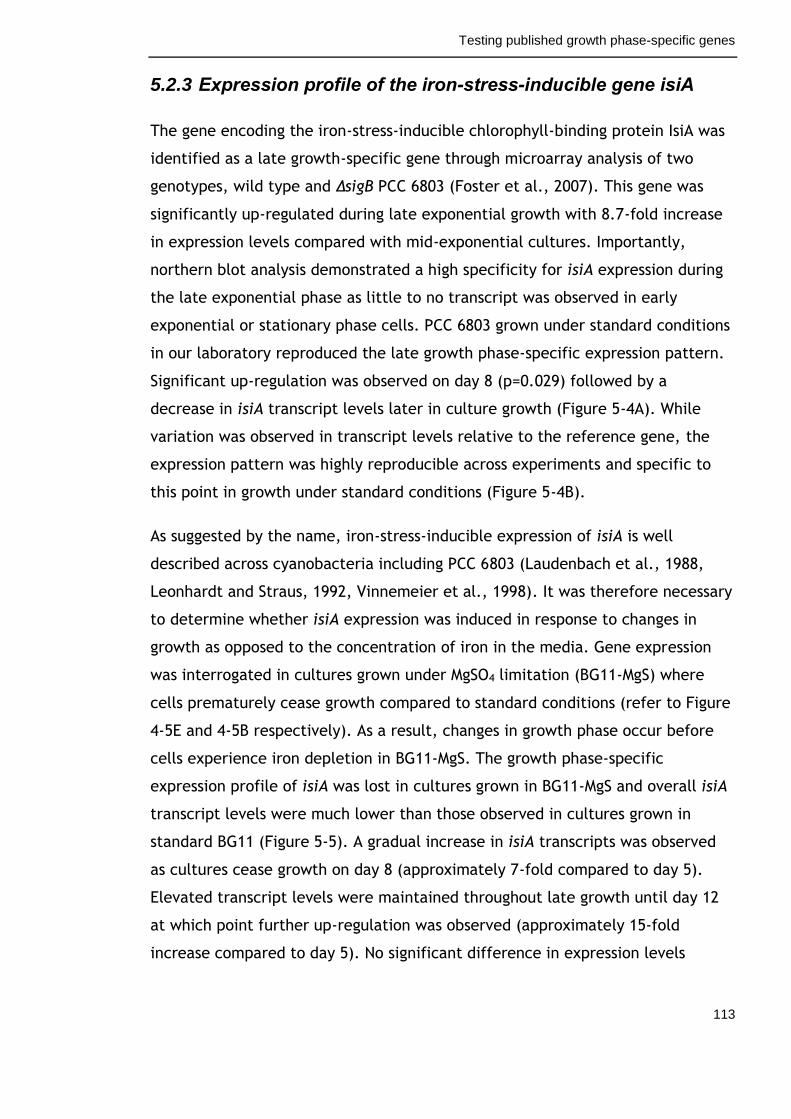
Testing published growth phase-specific genes
113
5.2.3 Expression profile of the iron-stress-inducible gene isiA
The gene encoding the iron-stress-inducible chlorophyll-binding protein IsiA was
identified as a late growth-specific gene through microarray analysis of two
genotypes, wild type and ΔsigB PCC 6803 (Foster et al., 2007). This gene was
significantly up-regulated during late exponential growth with 8.7-fold increase
in expression levels compared with mid-exponential cultures. Importantly,
northern blot analysis demonstrated a high specificity for isiA expression during
the late exponential phase as little to no transcript was observed in early
exponential or stationary phase cells. PCC 6803 grown under standard conditions
in our laboratory reproduced the late growth phase-specific expression pattern.
Significant up-regulation was observed on day 8 (p=0.029) followed by a
decrease in isiA transcript levels later in culture growth (Figure 5-4A). While
variation was observed in transcript levels relative to the reference gene, the
expression pattern was highly reproducible across experiments and specific to
this point in growth under standard conditions (Figure 5-4B).
As suggested by the name, iron-stress-inducible expression of isiA is well
described across cyanobacteria including PCC 6803 (Laudenbach et al., 1988,
Leonhardt and Straus, 1992, Vinnemeier et al., 1998). It was therefore necessary
to determine whether isiA expression was induced in response to changes in
growth as opposed to the concentration of iron in the media. Gene expression
was interrogated in cultures grown under MgSO4 limitation (BG11-MgS) where
cells prematurely cease growth compared to standard conditions (refer to Figure
4-5E and 4-5B respectively). As a result, changes in growth phase occur before
cells experience iron depletion in BG11-MgS. The growth phase-specific
expression profile of isiA was lost in cultures grown in BG11-MgS and overall isiA
transcript levels were much lower than those observed in cultures grown in
standard BG11 (Figure 5-5). A gradual increase in isiA transcripts was observed
as cultures cease growth on day 8 (approximately 7-fold compared to day 5).
Elevated transcript levels were maintained throughout late growth until day 12
at which point further up-regulation was observed (approximately 15-fold
increase compared to day 5). No significant difference in expression levels
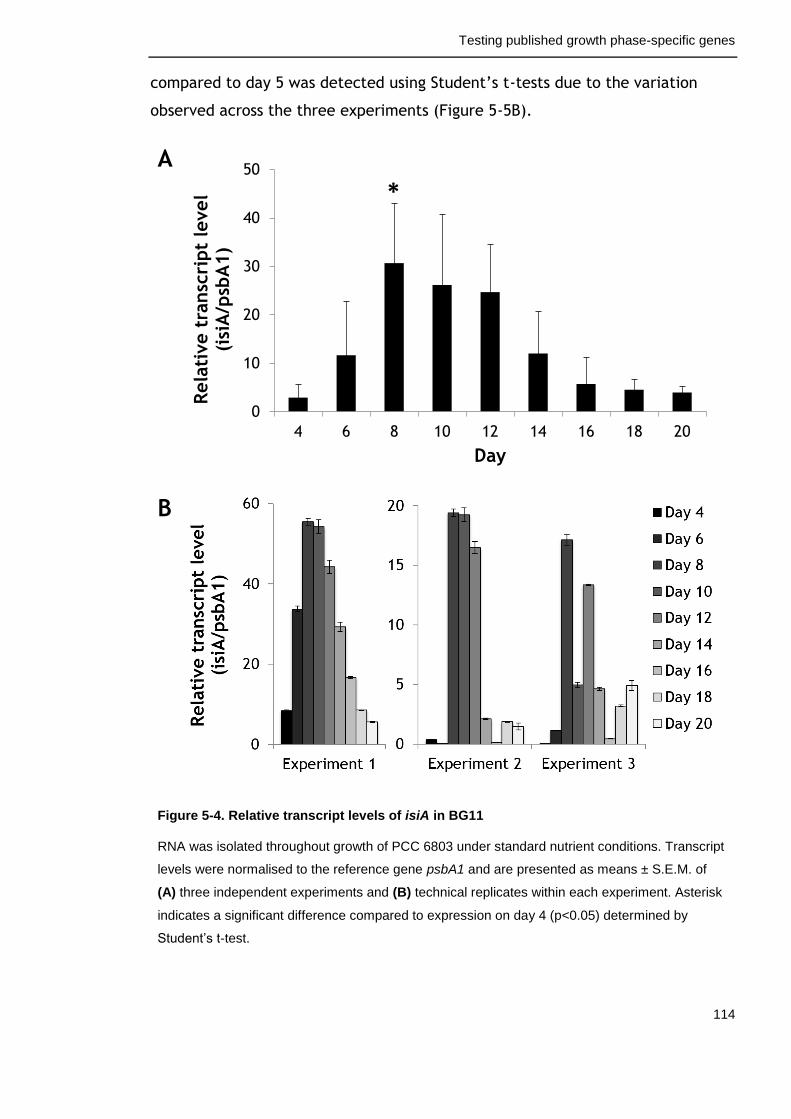
Testing published growth phase-specific genes
114
compared to day 5 was detected using Student’s t-tests due to the variation
observed across the three experiments (Figure 5-5B).
A
B
Figure 5-4. Relative transcript levels of isiA in BG11
RNA was isolated throughout growth of PCC 6803 under standard nutrient conditions. Transcript
levels were normalised to the reference gene psbA1 and are presented as means ± S.E.M. of
(A) three independent experiments and (B) technical replicates within each experiment. Asterisk
indicates a significant difference compared to expression on day 4 (p<0.05) determined by
Student’s t-test.
0
10
20
30
40
50
4 6 8 10 12 14 16 18 20
Rela
tive t
ransc
ript
level
(isi
A/p
sbA
1)
Day
*
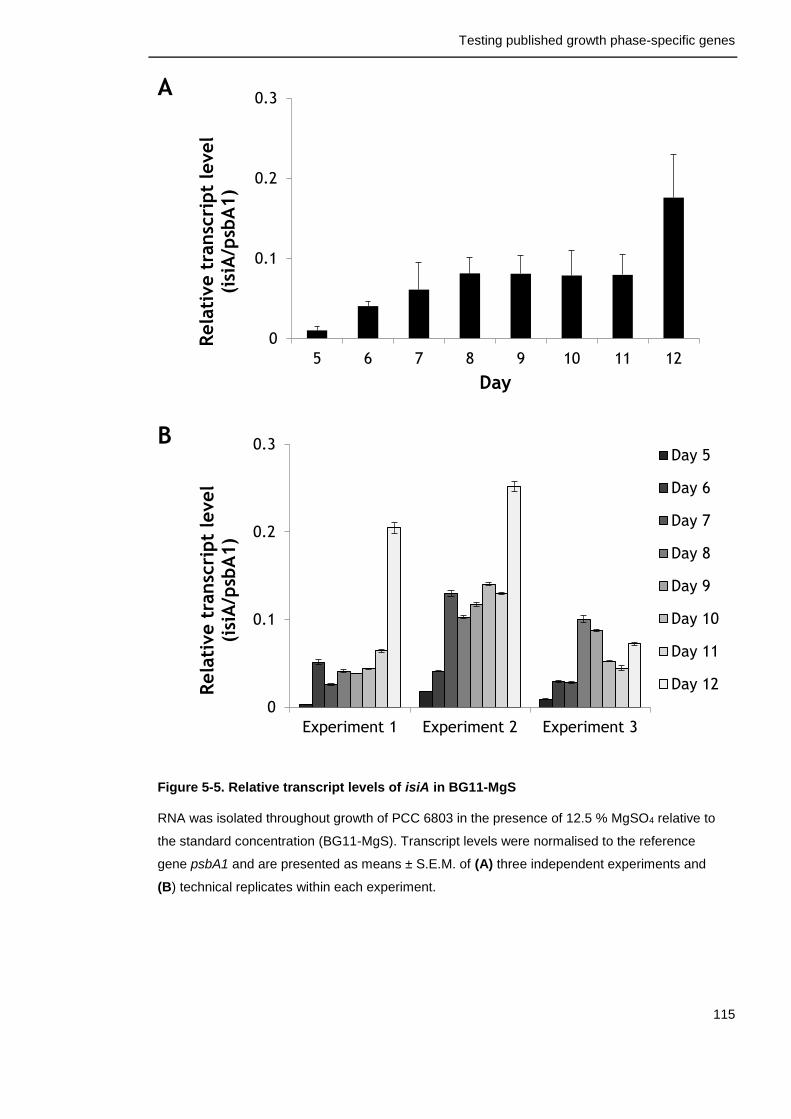
Testing published growth phase-specific genes
115
A
B
Figure 5-5. Relative transcript levels of isiA in BG11-MgS
RNA was isolated throughout growth of PCC 6803 in the presence of 12.5 % MgSO4 relative to
the standard concentration (BG11-MgS). Transcript levels were normalised to the reference
gene psbA1 and are presented as means ± S.E.M. of (A) three independent experiments and
(B) technical replicates within each experiment.
0
0.1
0.2
0.3
5 6 7 8 9 10 11 12
Rela
tive t
ransc
ript
level
(isi
A/p
sbA
1)
Day
0
0.1
0.2
0.3
Experiment 1 Experiment 2 Experiment 3
Rela
tive t
ransc
ript
level
(isi
A/p
sbA
1)
Day 5
Day 6
Day 7
Day 8
Day 9
Day 10
Day 11
Day 12
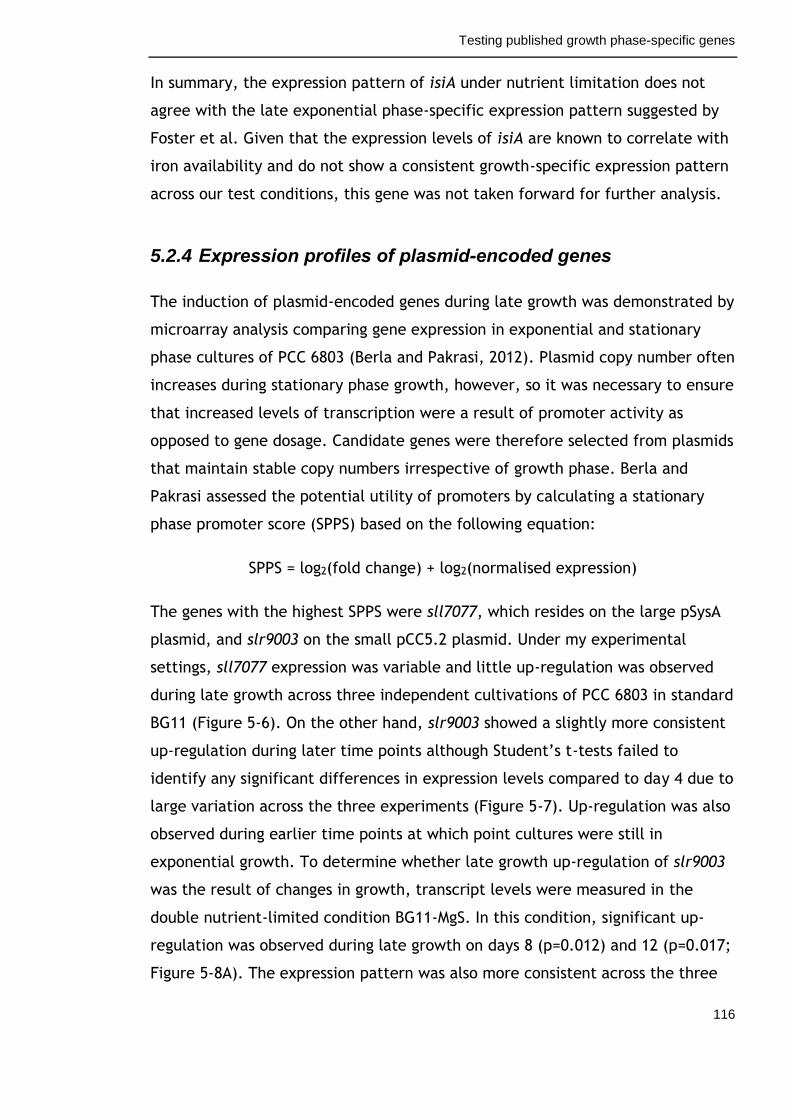
Testing published growth phase-specific genes
116
In summary, the expression pattern of isiA under nutrient limitation does not
agree with the late exponential phase-specific expression pattern suggested by
Foster et al. Given that the expression levels of isiA are known to correlate with
iron availability and do not show a consistent growth-specific expression pattern
across our test conditions, this gene was not taken forward for further analysis.
5.2.4 Expression profiles of plasmid-encoded genes
The induction of plasmid-encoded genes during late growth was demonstrated by
microarray analysis comparing gene expression in exponential and stationary
phase cultures of PCC 6803 (Berla and Pakrasi, 2012). Plasmid copy number often
increases during stationary phase growth, however, so it was necessary to ensure
that increased levels of transcription were a result of promoter activity as
opposed to gene dosage. Candidate genes were therefore selected from plasmids
that maintain stable copy numbers irrespective of growth phase. Berla and
Pakrasi assessed the potential utility of promoters by calculating a stationary
phase promoter score (SPPS) based on the following equation:
SPPS = log2(fold change) + log2(normalised expression)
The genes with the highest SPPS were sll7077, which resides on the large pSysA
plasmid, and slr9003 on the small pCC5.2 plasmid. Under my experimental
settings, sll7077 expression was variable and little up-regulation was observed
during late growth across three independent cultivations of PCC 6803 in standard
BG11 (Figure 5-6). On the other hand, slr9003 showed a slightly more consistent
up-regulation during later time points although Student’s t-tests failed to
identify any significant differences in expression levels compared to day 4 due to
large variation across the three experiments (Figure 5-7). Up-regulation was also
observed during earlier time points at which point cultures were still in
exponential growth. To determine whether late growth up-regulation of slr9003
was the result of changes in growth, transcript levels were measured in the
double nutrient-limited condition BG11-MgS. In this condition, significant up-
regulation was observed during late growth on days 8 (p=0.012) and 12 (p=0.017;
Figure 5-8A). The expression pattern was also more consistent across the three
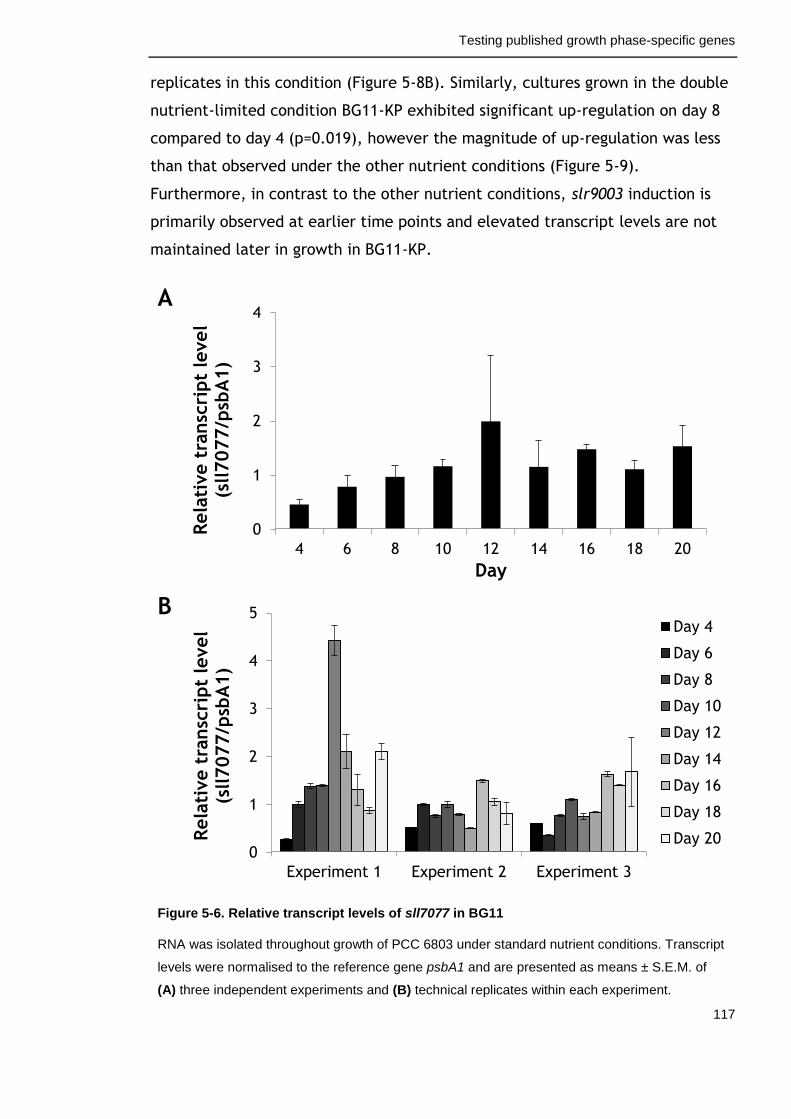
Testing published growth phase-specific genes
117
replicates in this condition (Figure 5-8B). Similarly, cultures grown in the double
nutrient-limited condition BG11-KP exhibited significant up-regulation on day 8
compared to day 4 (p=0.019), however the magnitude of up-regulation was less
than that observed under the other nutrient conditions (Figure 5-9).
Furthermore, in contrast to the other nutrient conditions, slr9003 induction is
primarily observed at earlier time points and elevated transcript levels are not
maintained later in growth in BG11-KP.
A
B
Figure 5-6. Relative transcript levels of sll7077 in BG11
RNA was isolated throughout growth of PCC 6803 under standard nutrient conditions. Transcript
levels were normalised to the reference gene psbA1 and are presented as means ± S.E.M. of
(A) three independent experiments and (B) technical replicates within each experiment.
0
1
2
3
4
4 6 8 10 12 14 16 18 20
Rela
tive t
ransc
ript
level
(sll7077/p
sbA
1)
Day
0
1
2
3
4
5
Experiment 1 Experiment 2 Experiment 3
Rela
tive t
ransc
ript
level
(sll7077/p
sbA
1)
Day 4
Day 6
Day 8
Day 10
Day 12
Day 14
Day 16
Day 18
Day 20
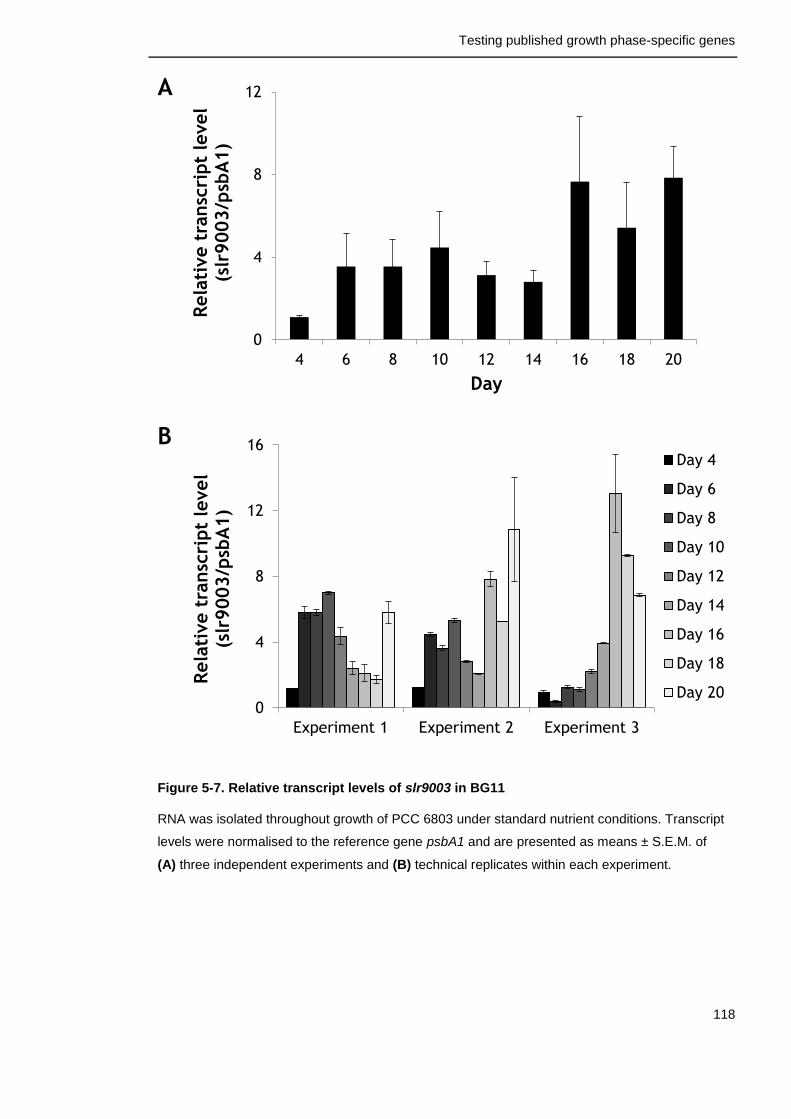
Testing published growth phase-specific genes
118
A
B
Figure 5-7. Relative transcript levels of slr9003 in BG11
RNA was isolated throughout growth of PCC 6803 under standard nutrient conditions. Transcript
levels were normalised to the reference gene psbA1 and are presented as means ± S.E.M. of
(A) three independent experiments and (B) technical replicates within each experiment.
0
4
8
12
4 6 8 10 12 14 16 18 20
Rela
tive t
ransc
ript
level
(slr
9003/p
sbA
1)
Day
0
4
8
12
16
Experiment 1 Experiment 2 Experiment 3
Rela
tive t
ransc
ript
level
(slr
9003/p
sbA
1)
Day 4
Day 6
Day 8
Day 10
Day 12
Day 14
Day 16
Day 18
Day 20
Testing published growth phase-specific genes
119
A
B
Figure 5-8. Relative transcript levels of slr9003 in BG11-MgS
RNA was isolated throughout growth of PCC 6803 in the presence of 12.5 % MgSO4 relative to
the standard concentration. Transcript levels were normalised to the reference gene psbA1 and
are presented as means ± S.E.M. of (A) three independent experiments and (B) technical
replicates within each experiment. Asterisk indicates a significant difference compared to
expression on day 4 (p<0.05) determined by Student’s t-test.
0
2
4
6
8
10
4 5 6 7 8 9 10 11 12
Rela
tive t
ransc
ript
level
(slr
9003/p
sbA
1)
Day
* *
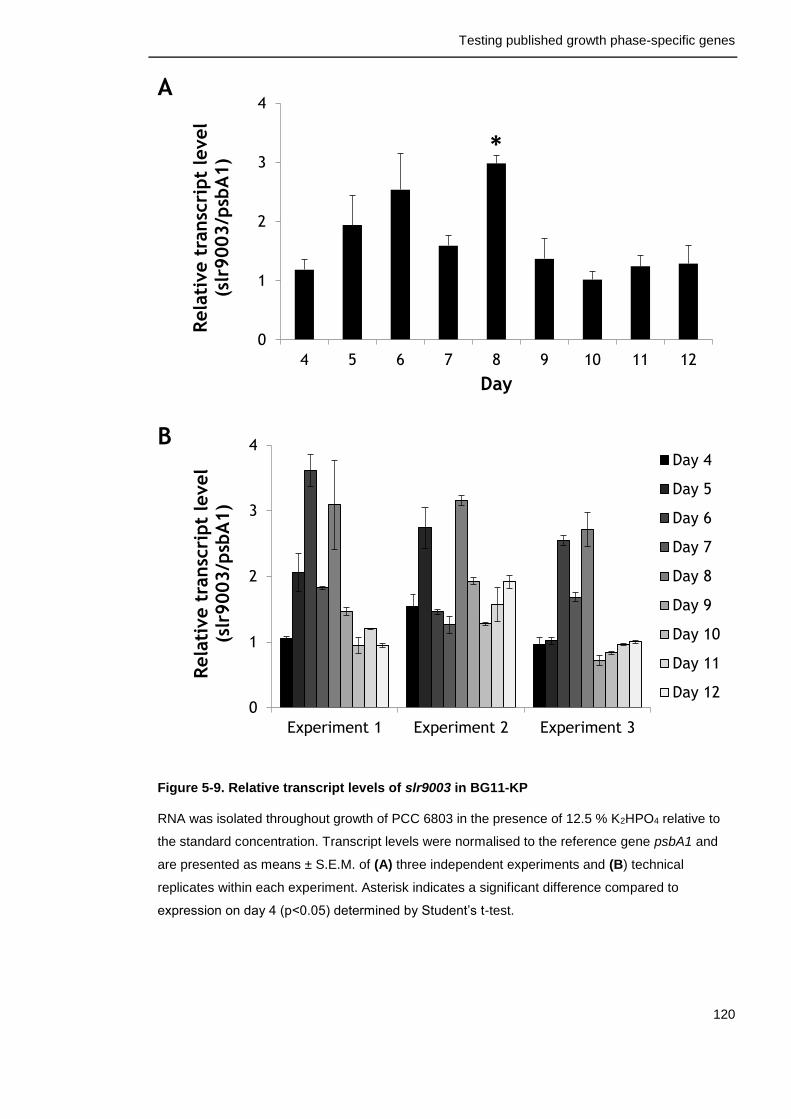
Testing published growth phase-specific genes
120
A
B
Figure 5-9. Relative transcript levels of slr9003 in BG11-KP
RNA was isolated throughout growth of PCC 6803 in the presence of 12.5 % K2HPO4 relative to
the standard concentration. Transcript levels were normalised to the reference gene psbA1 and
are presented as means ± S.E.M. of (A) three independent experiments and (B) technical
replicates within each experiment. Asterisk indicates a significant difference compared to
expression on day 4 (p<0.05) determined by Student’s t-test.
0
1
2
3
4
4 5 6 7 8 9 10 11 12
Rela
tive t
ransc
ript
level
(slr
9003/p
sbA
1)
Day
*
0
1
2
3
4
Experiment 1 Experiment 2 Experiment 3
Rela
tive t
ransc
ript
level
(slr
9003/p
sbA
1)
Day 4
Day 5
Day 6
Day 7
Day 8
Day 9
Day 10
Day 11
Day 12
Testing published growth phase-specific genes
121
5.3 Discussion
A key characteristic of inducible promoters for synthetic biology applications is
the robust activation of gene expression in response to a specific stimulus.
Ideally, these promoters should maintain this specific behaviour irrespective of
the context in which they are applied. This enables predictable engineering at
higher levels of the abstraction hierarchy without concern for lower levels (refer
to Figure 1-3). Late growth-specific promoters that are activated as cultures
cease cell growth are desirable for large-scale processes as they respond to
endogenous signals and thus do not require the addition of supplements. Such
promoters have yet to be identified in PCC 6803. The first step towards the
identification of growth phase-specific promoters is the identification of growth
phase-specific genes. Sigma factors are important regulators of growth phase-
specific gene expression in bacteria and two sigma factors, SigC and SigH, have
been implicated in the regulation of stationary phase-specific expression in PCC
6803 (Asayama et al., 2004, Foster et al., 2007). Transcript levels of the genes
encoding these sigma factors oscillated throughout culture growth and were not
suitable indicators of growth phase in PCC 6803. I therefore turned my attention
to genes with published growth-specific expression profiles. Closer investigation
of selected genes showed that these profiles were not robust across all of the
conditions tested suggesting a response to factors other than changes in growth.
The genes investigated in this chapter were not robust indicators of growth
phase in PCC 6803 and the promoters of these genes were not ideal candidates
for synthetic biology. Chapter 6 will describe the results obtained by RNA
sequencing to identify gene clusters robustly induced during late growth across
all of the single nutrient-limited conditions described in Chapter 4.
Testing published growth phase-specific genes
122
5.3.1 Enhancing the resolution of growth phase-specific gene
expression profiles
This study has highlighted the importance of interrogating gene expression a) at
numerous time points throughout culture growth and, more importantly, b) in
conditions with different growth kinetics. By measuring transcript levels
regularly throughout culture growth, a clearer picture of expression patterns can
be ascertained. Previous studies compared expression levels at a maximum of
three time points representing different growth phases: early to mid-
exponential, late exponential and stationary phase growth. As a result,
consistent oscillations in gene expression may be interpreted as growth-phase
specific patterns. This was evident in the expression levels of sigma factor genes
sigC and sigH that fluctuated throughout growth under standard conditions in our
laboratory (Figure 5-2 and 5-3, respectively). Thus, by interrogating samples at
numerous time points throughout culture growth, the studies in this chapter
have enhanced the resolution of gene expression patterns. This elucidated a
large variation across experimental replicates for the majority of genes
investigated in this study as peaks in expression occurred at different
magnitudes on different days. These expression patterns therefore do not meet
the robustness criterion and the tested genes are not ideal candidates for
promoters in synthetic biology.
5.3.2 Ensuring the robustness of growth phase-specific gene
expression profiles
Another limitation of previous studies is the use of just two conditions to
interrogate transcriptomic responses to changes in growth. Foster et al.
compared early and late exponential growth in wild type and ΔsigB PCC 6803.
However, both of these genotypes exhibited virtually identical growth kinetics
under standard conditions (Foster et al., 2007, Singh et al., 2006). As a result,
genes selected from this study (sigH and isiA) exhibited the least robust growth-
specific expression patterns of the genes tested in this chapter. In spite of highly
reproducible induction of isiA transcript specifically during late exponential
Testing published growth phase-specific genes
123
growth under standard conditions (Figure 5-4), this expression pattern was lost
in cultures which prematurely ceased growth in response to nutrient limitation
(BG11-MgS; Figure 5-5) arguing against growth phase-specific regulation of isiA
transcript. There are numerous reports of the iron-dependent regulation of the
operon in which this gene resides, isiAB (Laudenbach et al., 1988, Leonhardt and
Straus, 1992, Burnap et al., 1993, Vinnemeier et al., 1998). The promoter of this
operon has also been used as a bioreporter for iron availability in PCC 7002
(Boyanapalli et al., 2007). Given the late induction of isiA expression under
nutrient limitation, this suggests nutrient-dependent as opposed to growth
phase-dependent regulation.
By contrast, Berla and Pakrasi identified genes commonly up-regulated during
stationary phase growth in two conditions with very different growth kinetics by
using mixotrophic cultures which ceased growth at a much lower density
compared with cultures grown under standard conditions (Berla et al., 2013).
Indeed, the gene that exhibited the most robust growth phase-specific
expression pattern of those tested in this chapter was identified from this study
(slr9003). This reinforces the importance of confirming results across a range of
conditions modulating the process of interest, in this case the transition into
stationary phase growth of cyanobacteria. To this end, I utilised two double
nutrient-limited conditions, BG11-MgS and BG11-KP, to confirm expression
patterns observed under standard nutrient conditions. Confidence in positive
results increases with every additional condition, and assessment of growth-
phase specific genes would ideally utilise all of the conditions identified in
Chapter 4.
5.3.3 Sigma factor activity is not modulated at the transcript level
It is the sigma factor within the RNA polymerase holoenzyme that confers the
specificity of promoter recognition and binding. “Sigma switching” modulates
the transcription of large subsets of genes to coordinate responses to changing
environmental conditions (Imamura and Asayama, 2009). Sigma factors
implicated in regulating growth phase-specific gene expression can serve as a
useful tool for the identification of genes and promoters that respond to changes
Testing published growth phase-specific genes
124
in growth. Firstly, transcriptome analyses comparing stationary phase expression
in wild type and knockout strains would reveal potential targets of the sigma
factor of interest. Analyses of upstream regions of these targets may then
elucidate important motifs required for stationary phase-specific expression.
Secondly, chromatin immunoprecipitation studies could be performed to identify
the DNA sequences with which the sigma factor directly interacts. Finally, sigma
factor transcript and/or protein levels may serve as a marker for entry to
stationary phase growth and thus inform time point selection for –omics studies
investigating growth-phase specific processes.
In contrast to previously reported expression profiles, I observed oscillations in
sigC and sigH transcripts encoding two sigma factors implicated in the regulation
of stationary phase gene expression. A closer review of the literature revealed
that sigma factor transcript and protein levels do not necessarily correlate. For
instance, SigC protein levels remained constant during the light-to-dark
transition despite a decrease in sigC transcript (Imamura et al., 2003a,
Tuominen et al., 2003). In comparison, SigH protein was not detectable under
heat stress despite a 30-fold increase in sigH transcript (Huckauf et al., 2000,
Imamura et al., 2003b). In fact, none of the group 3 sigma factor proteins were
detectable under standard conditions despite the presence of their transcripts.
This suggests that sigma factor regulation does not occur at the transcript level
but instead in the form of translational attenuation or protein instability. Such
post-transcriptional regulatory mechanisms may be beneficial for the rapid
response to stress stimuli.
Given that transcript levels do not serve as an indicator for sigma factor activity,
it is still possible that sigma factors are involved in the regulation of stationary
phase-specific gene expression. If indeed this is the case, it is expected that
specific motifs will be present in the promoters of genes that respond to changes
in growth. Chapter 6 will describe the results obtained by RNA sequencing
comparing gene expression in late versus early cultures and an approach to
identify growth-phase specific motifs. This should include motifs required for
recognition and binding of sigma factors and other transcription factors involved
in regulating gene expression in response to growth.
Testing published growth phase-specific genes
125
5.3.4 Pslr9003, a potential auto-inducible promoter
Of the genes assessed in this chapter, the plasmid-encoded gene slr9003
exhibited the most consistent up-regulation during late growth across three
different nutrient conditions with varied growth kinetics (Figure 5-7, 5-8 and 5-
9). While slr9003 expression was consistently induced during late growth,
however, expression was still observed during early growth in all conditions. The
promoter of this gene is therefore not an ideal candidate for practical
applications as a key characteristic of inducible promoters is efficient silencing
under non-induced conditions. This is particularly important for growth phase-
specific promoters that aim to minimise biosynthetic demand and potential
toxicity during the active growth phase. Moreover, elevated transcript levels
were not always maintained following induction, in particular BG11-KP (Figure 5-
9). While it would be ideal to identify promoters that remain active throughout
late growth, promoters with transient growth phase-specific activity can still be
useful to activate self-perpetuating systems such as a circular T7 transcriptional
system.
A more detailed analysis of slr9003 could be performed including determination
of expression patterns across single nutrient-limited conditions by qPCR and
promoter activity using the assay established in Chapter 3. However, due to time
constraints and the intent to identify more robust candidates using RNA
sequencing in Chapter 6, this gene was not taken forward for further analysis.
Optimisation of this promoter would be required to a) optimise specificity to
enhance repression during early growth and b) maintain promoter activity post-
induction during late growth across different conditions. To achieve this, DNA
elements necessary for late growth-specific activation should be determined by
first identifying the shortest fragment of the slr9003 promoter required for late
growth-specific activation and second altering nucleotide sequences within this
fragment to identify motifs required to maintain this specificity. Once the
necessary DNA elements have been established, spacing as well as the nucleotide
sequences occurring between these elements could be modified to enhance
promoter strength and specificity. Furthermore, reducing the size of this
Testing published growth phase-specific genes
126
promoter to the bare minimum would ease the construction of larger multipart
modules.
5.3.5 Expanding the growth phase-specific promoter library for
cyanobacteria
This chapter identified a potential candidate late growth-specific promoter for
cyanobacteria. While this is useful for synthetic biology applications, it is
important to develop a library of promoters spanning a wide range of
transcriptional activity. Moreover, substantial development is still required to
optimise the specificity of the candidate promoter identified in this chapter. As
mentioned in the previous section, classical promoter analyses may be
performed to identify the DNA elements, or motifs, required for growth phase-
specific activation. This is a laborious and time-consuming task, however, and
alternative approaches may enable more rapid identification of growth phase-
specific DNA motifs. One example is performing a large transcriptomic study
comparing gene expression across growth phases and conditions modulating
growth kinetics to identify subsets of genes specifically induced at different
times of growth. Upon identification of growth phase-specific gene sets, analyses
of upstream regions of these genes can identify motifs overrepresented in the
promoters of these genes compared to the rest of the genome. This type of
analysis would identify all of the DNA motifs responsible for growth phase-
specific promoter activity and would not be limited by the study of one
particular promoter. Thus, growth phase-specific promoter libraries can be
developed which span a wide range of transcriptional activity and specificity,
providing a diverse toolkit for biological engineering of cyanobacteria. The next
chapter will describe such an approach in more detail and present preliminary
results.
Identifying novel growth phase-specific genes
127
Chapter 6. Identifying novel growth phase-specific
genes
6.1 Introduction
The previous chapter demonstrated the importance of investigating changes in
response to growth across a range of conditions affecting growth kinetics. Genes
following growth phase-specific expression patterns were selected from previous
microarray studies (Foster et al., 2007, Berla and Pakrasi, 2012) and assessed in
nutrient-limited conditions established in Chapter 4. While growth phase-specific
patterns were typically observed under standard conditions, this was not always
maintained when cultures prematurely ceased growth in response to specific
nutrient limitations. To identify robust growth phase-specific promoters, it is
therefore necessary to study global changes in gene expression across a variety
of conditions in which cultures have stopped growing for different reasons.
The majority of transcriptomic studies in cyanobacteria have used microarray
analyses. In this case, samples are added to a chip on which DNA probes are
immobilized and transcript levels within the samples are determined as
hybridization intensities. More recently, RNA sequencing (RNAseq) has emerged
as a powerful method to analyse differential gene expression (Wang et al.,
2009). This approach does not require any knowledge of transcript sequence and
thus results in unbiased transcript detection. Furthermore, it enables the
detection of a greater dynamic range of expression levels due to very low
background signal and no upper limit for quantification. Combining
transcriptomic analyses with a range of conditions altering growth kinetics
provides a powerful approach to identify genes (and promoters) specifically
regulated by changes in growth.
Cyanobacteria have multiple approaches to regulate gene expression (see
Introduction 1.3). These include two-component signal transduction systems,
RNA polymerase sigma factors, and transcription factors to name a few. These
mechanisms of regulation typically rely on the recognition and binding of
Identifying novel growth phase-specific genes
128
specific nucleotide sequences, or motifs, in the DNA. Alternative sigma factors
have been implicated in the regulation of gene expression during late growth
(Asayama et al., 2004, Foster et al., 2007), however regulatory networks in
living organisms are highly complex and a myriad of factors may be involved.
Clustering analysis can identify subsets of co-regulated genes that may be
regulated by common factors. The upstream regions of these genes can then be
analysed to discover over-represented motifs that are likely targets of these
factors. For this purpose, it is important to define a “foreground” in which
enriched elements are to be identified and a relevant “background” to which the
foreground should be compared. Promoters containing identified motifs can then
be assessed for growth phase-specific activity.
6.1.1 Chapter aims
This work aimed to investigate global changes in gene expression arising from
changes in growth in cultures of Synechocystis spp. PCC 6803 across six nutrient
conditions established in Chapter 4. RNA sequencing (RNAseq) was performed to
determine transcript levels and differences in expression levels were detected
using statistical tools. For motif discovery, a suitable background was defined by
identifying the full set of genes that are actively expressed in PCC 6803 in at
least one of the conditions tested. Genes with growth phase-specific expression
patterns were identified and clustering analysis performed to identify co-
regulated sets of genes. This will generate lists of genes with interesting
expression profiles that will serve as the foreground for analysis of upstream
regions and motif discovery.
Identifying novel growth phase-specific genes
129
6.2 Results
6.2.1 Experimental design
Synechocystis spp. PCC 6803 was grown under six different nutrient conditions
described in Chapter 4: standard (BG11), nitrate-limited (BG11-N), phosphate-
limited (BG11-P), sulphate-limited (BG11-S), magnesium-limited (BG11-M) and
potassium-limited (BG11-K) media where limited nutrients were provided at
12.5 % compared to the standard concentration. To compare transcriptional
profiles, RNA samples were extracted from two time points representing early
and late growth. Day 4 was selected as the early growth time point as this was
the point at which all cultures had entered the exponential phase of growth. Day
8 and Day 16 were selected as the late growth time point in nutrient-limited and
standard conditions respectively as this was the point where cultures
transitioned from exponential to stationary phase growth.
Genome-wide oscillations in transcription occur as a result of circadian rhythm,
and in PCC 6803 up to 9 % of genes oscillate in expression during a 24 hour
period (Kucho et al., 2005). In order to normalise for the effects of
transcriptional oscillation, all samples were harvested midway through the 12
hour day period, i.e. 6 hours after the lights turned on. Total RNA was isolated
and subjected to two rounds of ribosomal RNA depletion prior to cDNA library
synthesis (see Figure 2-2) and next-generation RNA sequencing using the Illumina
MiSeq system. RNAseq and initial data analysis was performed at the Glasgow
Polyomics facility in the University of Glasgow (summarized in Table 6-1). The
reference genome selected for the alignment of RNAseq reads was the original
PCC 6803 genome sequence published on Cyanobase, a dedicated genome
database for cyanobacteria (Kaneko et al., 1996, Nakamura et al., 1998, Nakao
et al., 2010). While this genome does not include the sequences of the three
smaller plasmids pCA2.4, pCB2.4 and pCC5.2, it remains the only sequence
available for wild-type PCC 6803. As a result, the nine genes encoded on these
three plasmids were not represented in our dataset.
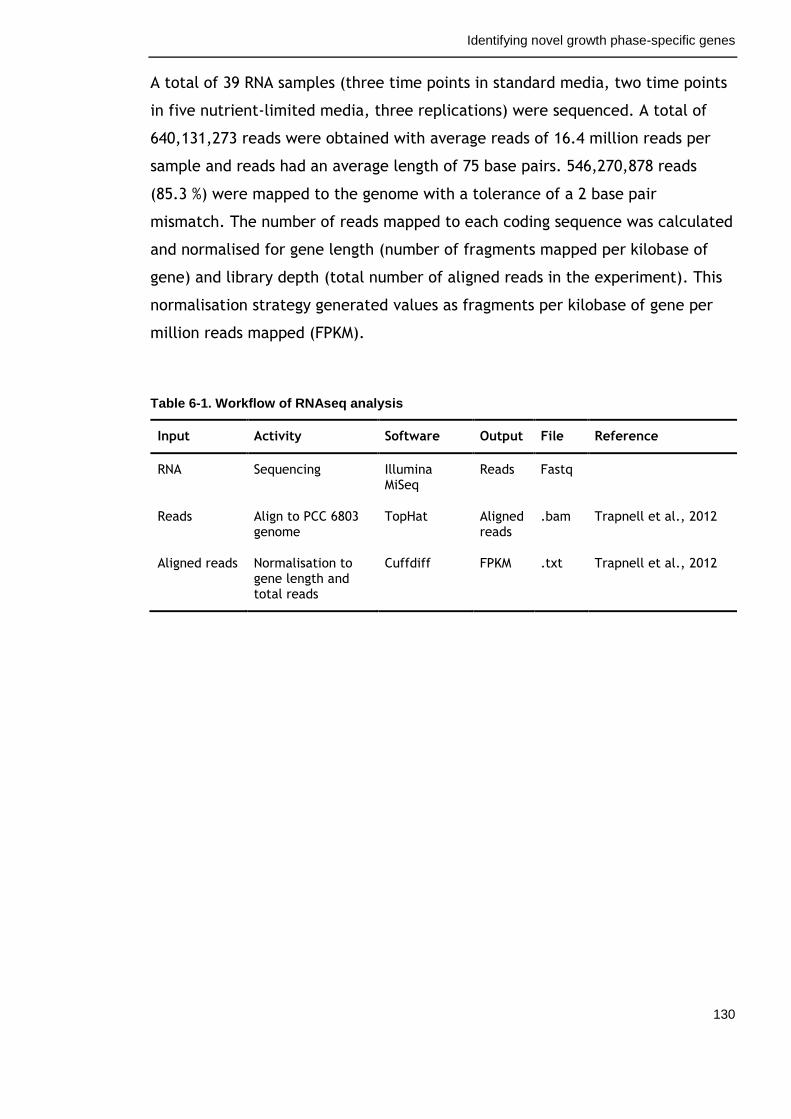
Identifying novel growth phase-specific genes
130
A total of 39 RNA samples (three time points in standard media, two time points
in five nutrient-limited media, three replications) were sequenced. A total of
640,131,273 reads were obtained with average reads of 16.4 million reads per
sample and reads had an average length of 75 base pairs. 546,270,878 reads
(85.3 %) were mapped to the genome with a tolerance of a 2 base pair
mismatch. The number of reads mapped to each coding sequence was calculated
and normalised for gene length (number of fragments mapped per kilobase of
gene) and library depth (total number of aligned reads in the experiment). This
normalisation strategy generated values as fragments per kilobase of gene per
million reads mapped (FPKM).
Table 6-1. Workflow of RNAseq analysis
Input Activity Software Output File Reference
RNA Sequencing Illumina MiSeq
Reads Fastq
Reads Align to PCC 6803 genome
TopHat Aligned reads
.bam Trapnell et al., 2012
Aligned reads Normalisation to gene length and total reads
Cuffdiff FPKM .txt Trapnell et al., 2012
Identifying novel growth phase-specific genes
131
6.2.2 Multi-dimensional scaling
Multi-dimensional scaling (MDS) is a method that reduces the dimensionality of a
dataset and visualises the level of similarity between individual samples within
the dataset (Mugavin, 2008). This is achieved by converting a set of similarities
based on genome-wide FPKM values into a set of points where the distances
reflect the relative similarities. MDS was performed using the CummeRbund
visualisation package for Cuffdiff sequencing data (Trapnell et al., 2012).
Generally, good replication was observed within each sample (Figure 6-1). The
early samples harvested at the start of the exponential phase before cultures
experienced nutrient limitation clustered closely together with the exception of
BG11-N. In fact, there was clear separation of the BG11-N, both early and late
samples, from the rest of the dataset suggesting a distinct growth pattern in this
condition. Day 8 samples grown in BG11 clustered with day 4 samples in the
same condition reflecting the fact that at this time point BG11 cultures were
still growing exponentially. This showed that genome wide transcript levels do
indeed provide a good indicator of growth phase irrespective of the actual
culture density. The late samples clearly separated from all the early samples.
Furthermore, they separated according to condition. These findings are in
accordance with the fact that at this time point, culture growth slowed down
due to specific different nutrient limitations. Relatively large variation was
observed in the late cultures grown in standard BG11, reflecting the larger
variation in the corresponding culture growth curves (compare Figure 4-6B).
Figure 6-1. Multi-dimensional scaling of RNAseq dataset (overleaf)
The distances between points reflect the relative similarities between samples based on genome
wide transcript levels. The different colours correspond to nutrient condition. Labels indicate the
nutrient condition (SM: standard BG11 media, KL: potassium limitation, PL: phosphate limitation,
ML: magnesium limitation, SL: sulphate limitation, NL: nitrate limitation), time point (4: day 4
corresponding to early growth, 8: day 8 corresponding to late growth in nutrient-limited conditions,
16: day 16 corresponding to late growth in standard media), and replicate number.
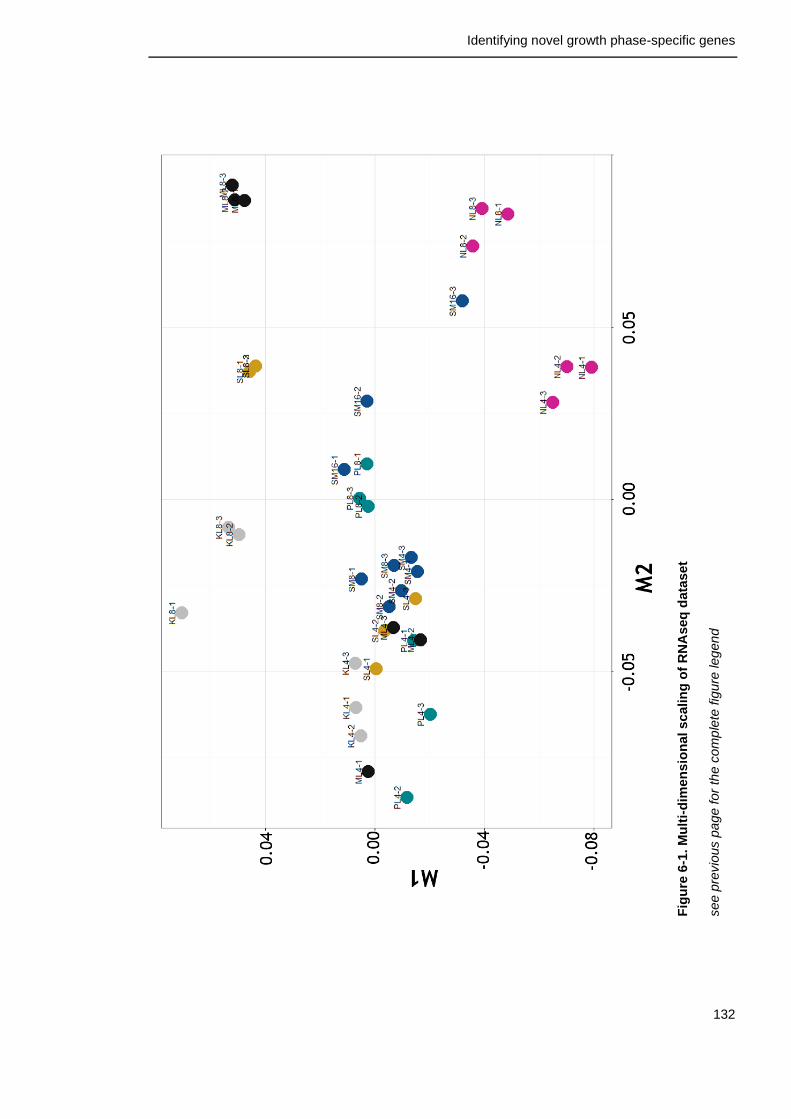
Identifying novel growth phase-specific genes
132
Fig
ure
6-1
. M
ult
i-d
imen
sio
nal sc
alin
g o
f R
NA
seq
data
set
see p
revio
us p
age f
or
the c
om
ple
te fig
ure
leg
en
d
Identifying novel growth phase-specific genes
133
6.2.3 Selecting a cut-off and defining a background of expressed
genes
The ultimate aim of this work was to identify overrepresented motifs in the
upstream regions (i.e. the promoters) of genes that follow a desired expression
pattern. It was necessary to define a relevant reference, or “background”, to
which these upstream regions should be compared as organisms may differ in
terms of GC content and codon usage (Yu et al., 2012). For this purpose, I
determined the full set of genes that showed expression in at least one of the
conditions tested, thereby avoiding any bias that might be generated by genes
that are permanently silenced or specifically expressed under conditions not
applied here. To select a suitable cut-off for what is considered “expressed”,
FPKM values for each gene in a given sample were plotted on a logarithmic scale
(Figure 6-2). In this example (BG11 day 4 replicate 1), 160 genes had a FPKM of 0
followed by a steep incline until sigmoidal distribution began at FPKM 2. Similar
curves were obtained for other samples. Thus, genes were considered
“expressed” if they showed a FPKM value of at least 2 in at least one condition.
This resulted in the exclusion of 77 genes, which can be found in Appendix V.
With the exception of 4 genes encoding ribosomal RNAs, all of the genes
excluded from the background list encoded putative, hypothetical and unknown
proteins or transposons. The remaining 3318 genes comprised the background list
of expressed genes. Upstream regions of differing lengths (300, 600 and 1000
base pairs) have been extracted for these genes for future analysis.
The next step was to define the test sets, or “foreground”. These are the
upstream regions of genes with distinct expression patterns to be identified in
the following sections.
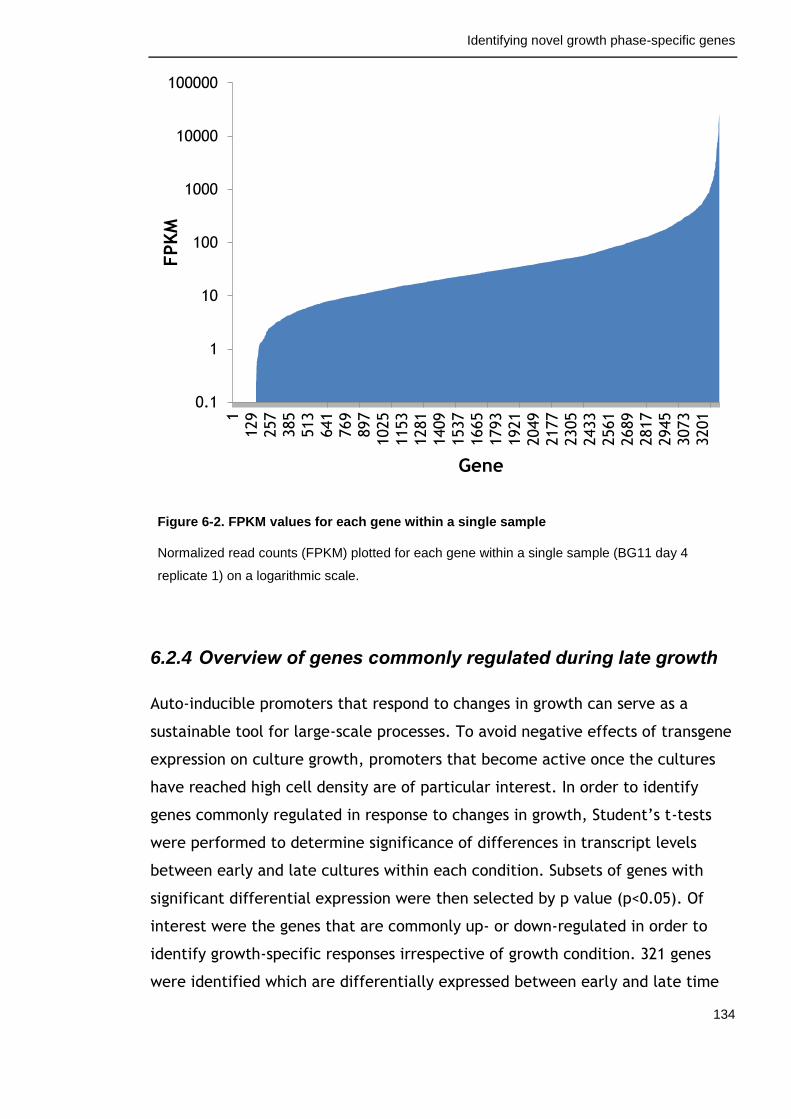
Identifying novel growth phase-specific genes
134
Figure 6-2. FPKM values for each gene within a single sample
Normalized read counts (FPKM) plotted for each gene within a single sample (BG11 day 4
replicate 1) on a logarithmic scale.
6.2.4 Overview of genes commonly regulated during late growth
Auto-inducible promoters that respond to changes in growth can serve as a
sustainable tool for large-scale processes. To avoid negative effects of transgene
expression on culture growth, promoters that become active once the cultures
have reached high cell density are of particular interest. In order to identify
genes commonly regulated in response to changes in growth, Student’s t-tests
were performed to determine significance of differences in transcript levels
between early and late cultures within each condition. Subsets of genes with
significant differential expression were then selected by p value (p<0.05). Of
interest were the genes that are commonly up- or down-regulated in order to
identify growth-specific responses irrespective of growth condition. 321 genes
were identified which are differentially expressed between early and late time
0.1
1
10
100
1000
10000
100000
1
129
257
385
513
641
769
897
1025
1153
1281
1409
1537
1665
1793
1921
2049
2177
2305
2433
2561
2689
2817
2945
3073
3201
FPK
M
Gene
Identifying novel growth phase-specific genes
135
points across all conditions. These differentially expressed genes were divided
into functional categories according to the Cyanobase designation
(http://genome.kazusa.or.jp/cyanobase/; last accessed 14/09/2015) and the
number of genes in each functional category is presented in Table 6-2. The most
prominent response was the down-regulation of 188 genes during late growth,
primarily with functions related to photosynthesis, respiration and translation. A
smaller set of genes were consistently up-regulated during late growth. Some of
the up-regulated genes were involved in regulatory functions and transport.
However, the vast majority (55.2 %) encoded hypothetical or unknown proteins.
The following sections will describe commonly up- and down-regulated genes in
closer detail.
6.2.5 Genes commonly up-regulated during late growth
Promoters induced during late growth are desirable for processes requiring a
large biomass such as bioproduction, bioremediation or biodesalination. These
promoters should have a robust activation pattern where they are reproducibly
induced during late growth irrespective of the particular conditions in which the
cyanobacteria were grown. Genes commonly up-regulated during late growth are
therefore useful for identifying late growth-specific promoters. In total, 87
genes were significantly up-regulated during late growth across all six conditions
(Appendix VI). Clusters of co-regulated genes were identified by k-means
analysis of transcript changes throughout growth across the nutrient conditions.
Assignment of commonly up-regulated genes into 5 clusters (designated UP1-
UP5; Figure 6-3) efficiently separated different response profiles and additional
clusters only separated single genes with similar expression profiles. For
instance, UP5 represents a gene with particularly large differences between
early and late time points in BG11 compared to other conditions, particularly
BG11-P. UP1 to UP4 showed smaller but consistent differences early and late
time points, however differences in the magnitude of response differed. For
instance, UP4 showed relatively larger responses in late cultures compared to
UP1. Clustering analysis did not reveal any remarkable co-regulation of genes
with similar function. This may be a result of the large proportion of
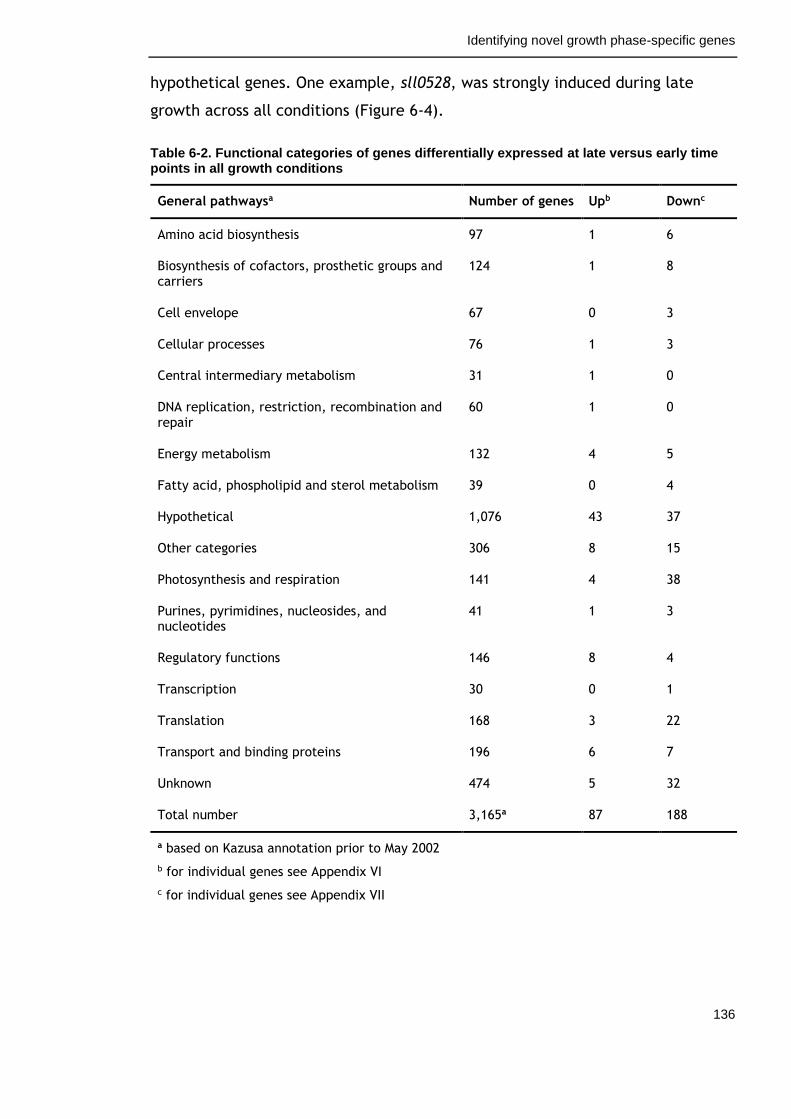
Identifying novel growth phase-specific genes
136
hypothetical genes. One example, sll0528, was strongly induced during late
growth across all conditions (Figure 6-4).
Table 6-2. Functional categories of genes differentially expressed at late versus early time points in all growth conditions
General pathwaysa Number of genes Upb Downc
Amino acid biosynthesis 97 1 6
Biosynthesis of cofactors, prosthetic groups and carriers
124 1 8
Cell envelope 67 0 3
Cellular processes 76 1 3
Central intermediary metabolism 31 1 0
DNA replication, restriction, recombination and repair
60 1 0
Energy metabolism 132 4 5
Fatty acid, phospholipid and sterol metabolism 39 0 4
Hypothetical 1,076 43 37
Other categories 306 8 15
Photosynthesis and respiration 141 4 38
Purines, pyrimidines, nucleosides, and nucleotides
41 1 3
Regulatory functions 146 8 4
Transcription 30 0 1
Translation 168 3 22
Transport and binding proteins 196 6 7
Unknown 474 5 32
Total number 3,165a 87 188
a based on Kazusa annotation prior to May 2002
b for individual genes see Appendix VI
c for individual genes see Appendix VII
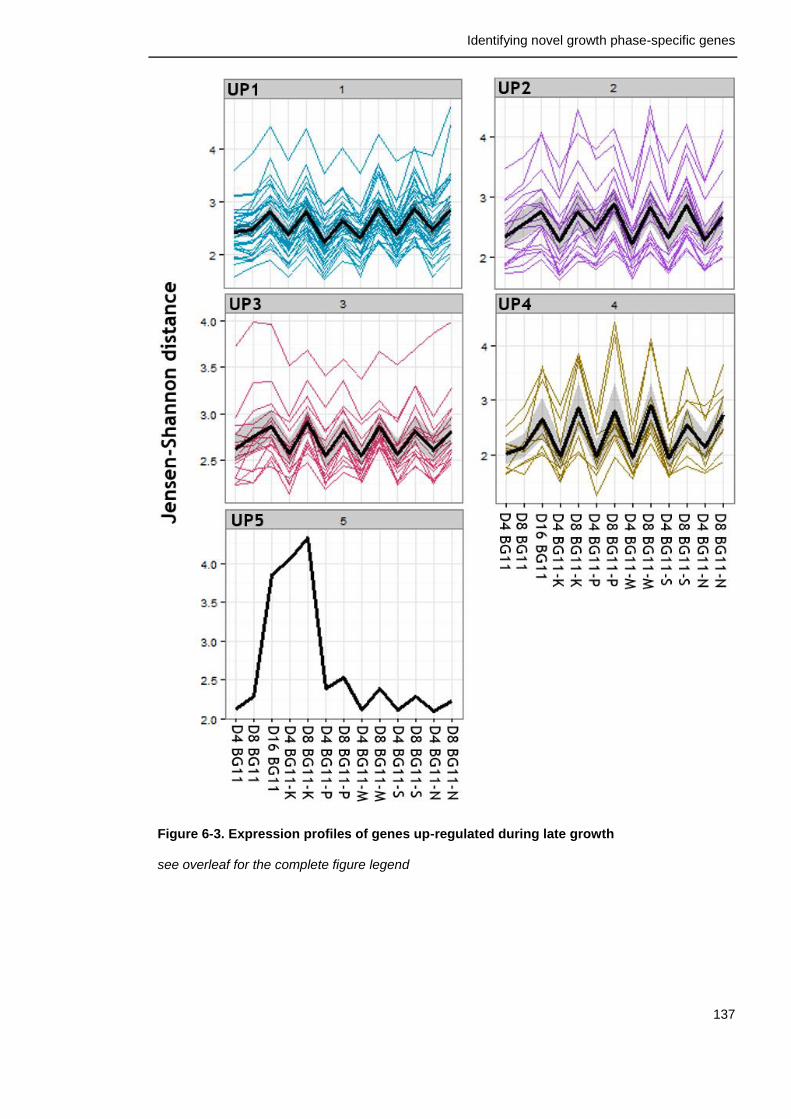
Identifying novel growth phase-specific genes
137
Figure 6-3. Expression profiles of genes up-regulated during late growth
see overleaf for the complete figure legend
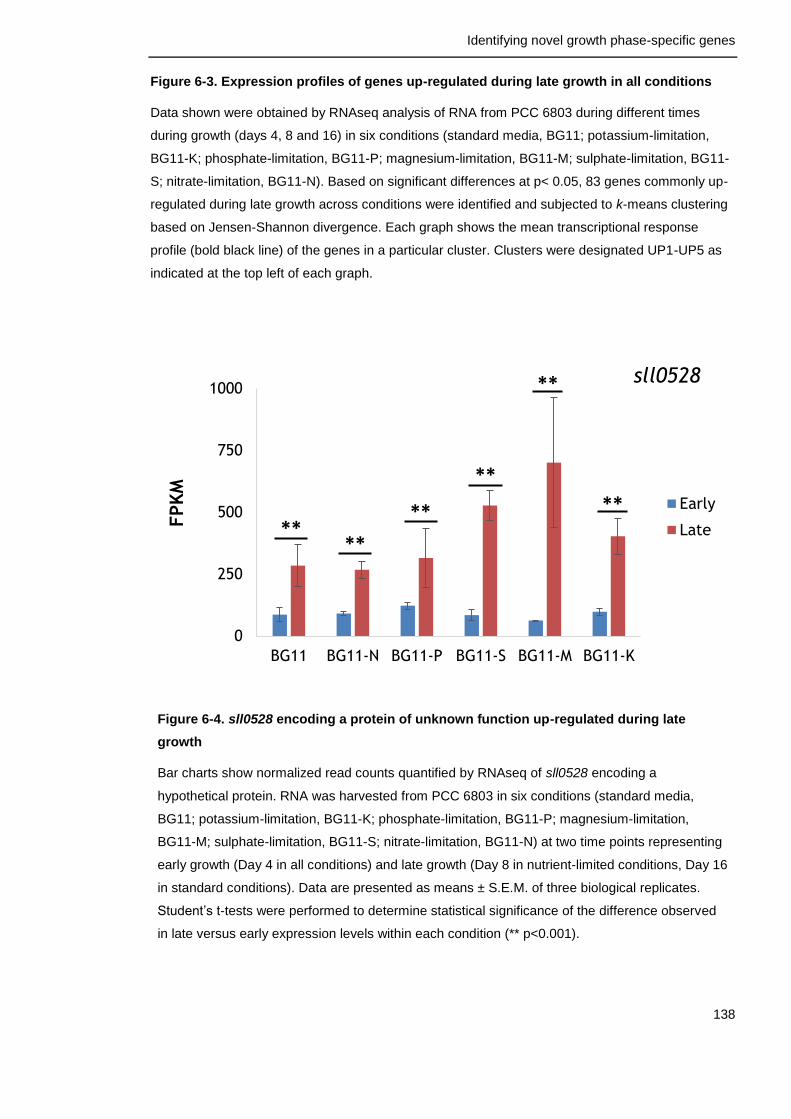
Identifying novel growth phase-specific genes
138
Figure 6-3. Expression profiles of genes up-regulated during late growth in all conditions
Data shown were obtained by RNAseq analysis of RNA from PCC 6803 during different times
during growth (days 4, 8 and 16) in six conditions (standard media, BG11; potassium-limitation,
BG11-K; phosphate-limitation, BG11-P; magnesium-limitation, BG11-M; sulphate-limitation, BG11-
S; nitrate-limitation, BG11-N). Based on significant differences at p< 0.05, 83 genes commonly up-
regulated during late growth across conditions were identified and subjected to k-means clustering
based on Jensen-Shannon divergence. Each graph shows the mean transcriptional response
profile (bold black line) of the genes in a particular cluster. Clusters were designated UP1-UP5 as
indicated at the top left of each graph.
Figure 6-4. sll0528 encoding a protein of unknown function up-regulated during late
growth
Bar charts show normalized read counts quantified by RNAseq of sll0528 encoding a
hypothetical protein. RNA was harvested from PCC 6803 in six conditions (standard media,
BG11; potassium-limitation, BG11-K; phosphate-limitation, BG11-P; magnesium-limitation,
BG11-M; sulphate-limitation, BG11-S; nitrate-limitation, BG11-N) at two time points representing
early growth (Day 4 in all conditions) and late growth (Day 8 in nutrient-limited conditions, Day 16
in standard conditions). Data are presented as means ± S.E.M. of three biological replicates.
Student’s t-tests were performed to determine statistical significance of the difference observed
in late versus early expression levels within each condition (** p<0.001).
0
250
500
750
1000
BG11 BG11-N BG11-P BG11-S BG11-M BG11-K
FPK
M
Early
Late** **
**
**
****
sll0528
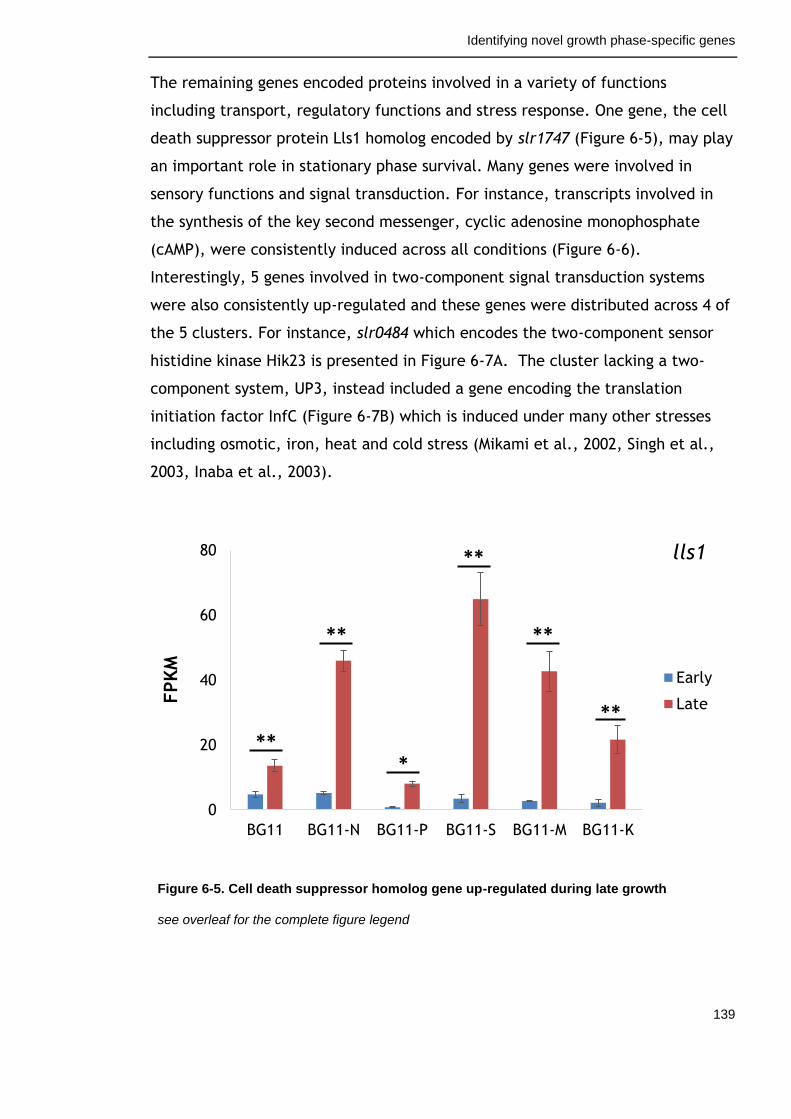
Identifying novel growth phase-specific genes
139
The remaining genes encoded proteins involved in a variety of functions
including transport, regulatory functions and stress response. One gene, the cell
death suppressor protein Lls1 homolog encoded by slr1747 (Figure 6-5), may play
an important role in stationary phase survival. Many genes were involved in
sensory functions and signal transduction. For instance, transcripts involved in
the synthesis of the key second messenger, cyclic adenosine monophosphate
(cAMP), were consistently induced across all conditions (Figure 6-6).
Interestingly, 5 genes involved in two-component signal transduction systems
were also consistently up-regulated and these genes were distributed across 4 of
the 5 clusters. For instance, slr0484 which encodes the two-component sensor
histidine kinase Hik23 is presented in Figure 6-7A. The cluster lacking a two-
component system, UP3, instead included a gene encoding the translation
initiation factor InfC (Figure 6-7B) which is induced under many other stresses
including osmotic, iron, heat and cold stress (Mikami et al., 2002, Singh et al.,
2003, Inaba et al., 2003).
Figure 6-5. Cell death suppressor homolog gene up-regulated during late growth
see overleaf for the complete figure legend
0
20
40
60
80
BG11 BG11-N BG11-P BG11-S BG11-M BG11-K
FPK
M
Early
Late**
**
*
**
**
**
lls1
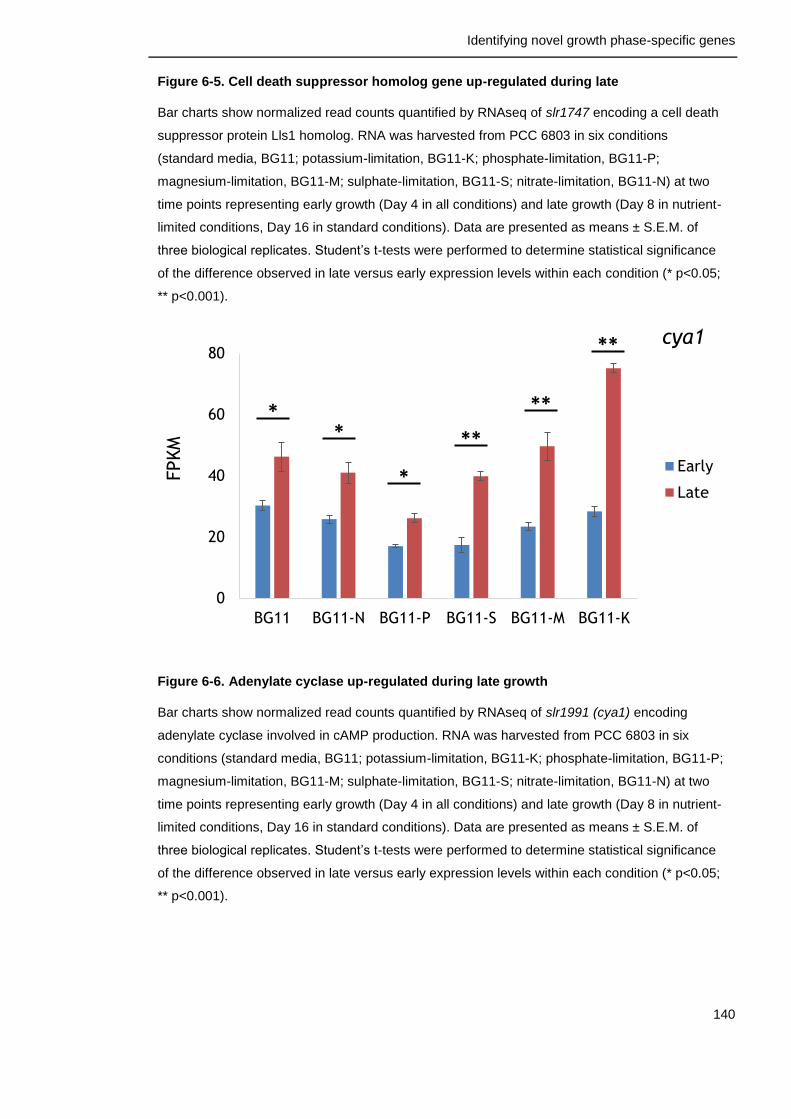
Identifying novel growth phase-specific genes
140
Figure 6-5. Cell death suppressor homolog gene up-regulated during late
Bar charts show normalized read counts quantified by RNAseq of slr1747 encoding a cell death
suppressor protein Lls1 homolog. RNA was harvested from PCC 6803 in six conditions
(standard media, BG11; potassium-limitation, BG11-K; phosphate-limitation, BG11-P;
magnesium-limitation, BG11-M; sulphate-limitation, BG11-S; nitrate-limitation, BG11-N) at two
time points representing early growth (Day 4 in all conditions) and late growth (Day 8 in nutrient-
limited conditions, Day 16 in standard conditions). Data are presented as means ± S.E.M. of
three biological replicates. Student’s t-tests were performed to determine statistical significance
of the difference observed in late versus early expression levels within each condition (* p<0.05;
** p<0.001).
Figure 6-6. Adenylate cyclase up-regulated during late growth
Bar charts show normalized read counts quantified by RNAseq of slr1991 (cya1) encoding
adenylate cyclase involved in cAMP production. RNA was harvested from PCC 6803 in six
conditions (standard media, BG11; potassium-limitation, BG11-K; phosphate-limitation, BG11-P;
magnesium-limitation, BG11-M; sulphate-limitation, BG11-S; nitrate-limitation, BG11-N) at two
time points representing early growth (Day 4 in all conditions) and late growth (Day 8 in nutrient-
limited conditions, Day 16 in standard conditions). Data are presented as means ± S.E.M. of
three biological replicates. Student’s t-tests were performed to determine statistical significance
of the difference observed in late versus early expression levels within each condition (* p<0.05;
** p<0.001).
0
20
40
60
80
BG11 BG11-N BG11-P BG11-S BG11-M BG11-K
FPKM
Early
Late*
**
**
**
**
cya1
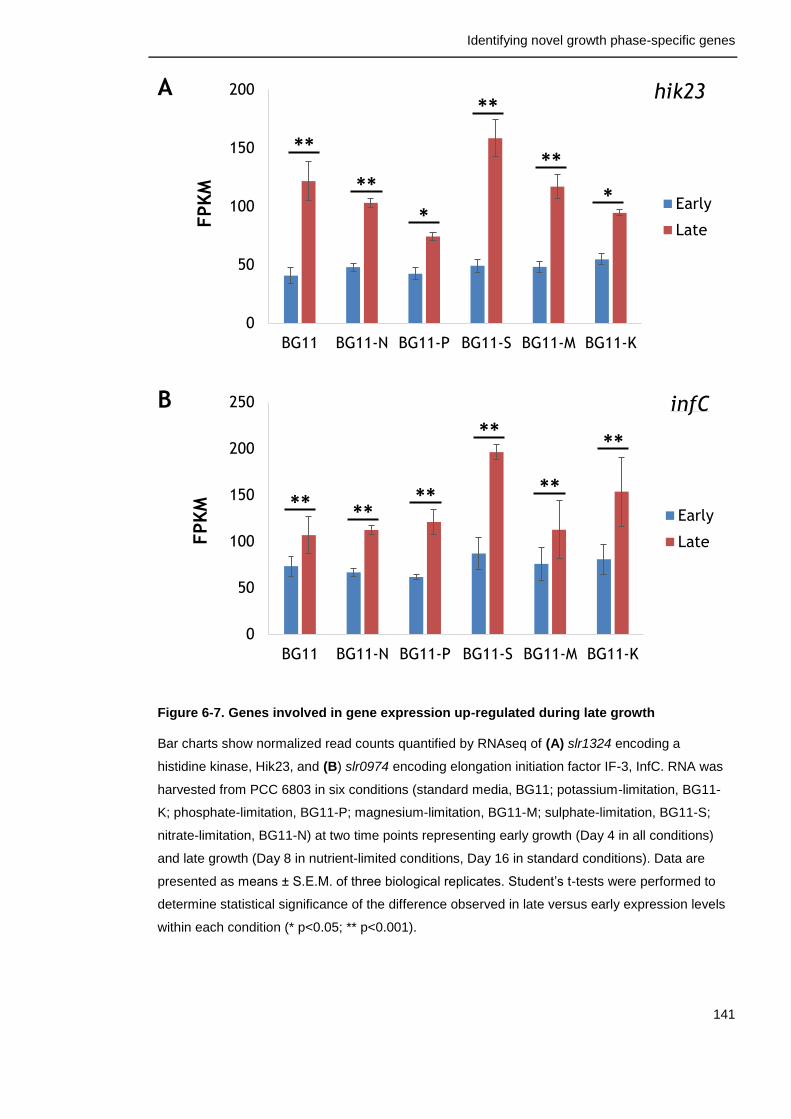
Identifying novel growth phase-specific genes
141
A
B
Figure 6-7. Genes involved in gene expression up-regulated during late growth
Bar charts show normalized read counts quantified by RNAseq of (A) slr1324 encoding a
histidine kinase, Hik23, and (B) slr0974 encoding elongation initiation factor IF-3, InfC. RNA was
harvested from PCC 6803 in six conditions (standard media, BG11; potassium-limitation, BG11-
K; phosphate-limitation, BG11-P; magnesium-limitation, BG11-M; sulphate-limitation, BG11-S;
nitrate-limitation, BG11-N) at two time points representing early growth (Day 4 in all conditions)
and late growth (Day 8 in nutrient-limited conditions, Day 16 in standard conditions). Data are
presented as means ± S.E.M. of three biological replicates. Student’s t-tests were performed to
determine statistical significance of the difference observed in late versus early expression levels
within each condition (* p<0.05; ** p<0.001).
0
50
100
150
200
BG11 BG11-N BG11-P BG11-S BG11-M BG11-K
FPK
MEarly
Late
**
**
***
**
*
hik23
0
50
100
150
200
250
BG11 BG11-N BG11-P BG11-S BG11-M BG11-K
FPK
M
Early
Late
infC
**
**
**
******
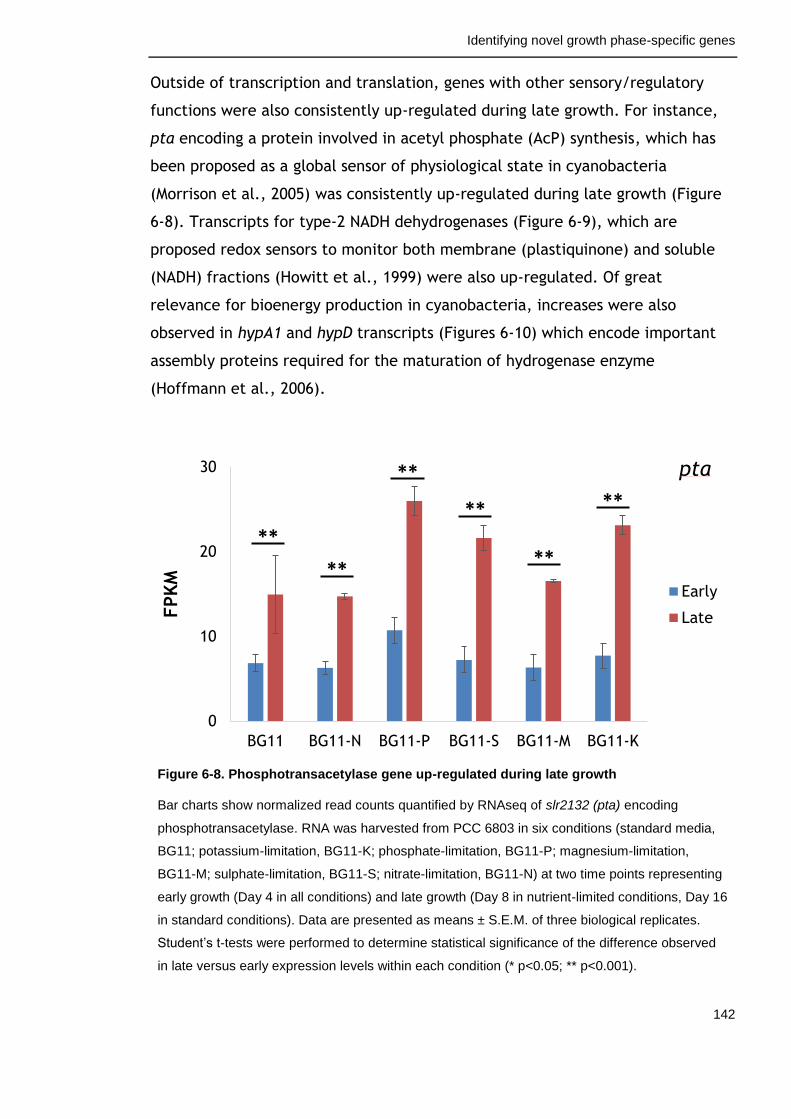
Identifying novel growth phase-specific genes
142
Outside of transcription and translation, genes with other sensory/regulatory
functions were also consistently up-regulated during late growth. For instance,
pta encoding a protein involved in acetyl phosphate (AcP) synthesis, which has
been proposed as a global sensor of physiological state in cyanobacteria
(Morrison et al., 2005) was consistently up-regulated during late growth (Figure
6-8). Transcripts for type-2 NADH dehydrogenases (Figure 6-9), which are
proposed redox sensors to monitor both membrane (plastiquinone) and soluble
(NADH) fractions (Howitt et al., 1999) were also up-regulated. Of great
relevance for bioenergy production in cyanobacteria, increases were also
observed in hypA1 and hypD transcripts (Figures 6-10) which encode important
assembly proteins required for the maturation of hydrogenase enzyme
(Hoffmann et al., 2006).
Figure 6-8. Phosphotransacetylase gene up-regulated during late growth
Bar charts show normalized read counts quantified by RNAseq of slr2132 (pta) encoding
phosphotransacetylase. RNA was harvested from PCC 6803 in six conditions (standard media,
BG11; potassium-limitation, BG11-K; phosphate-limitation, BG11-P; magnesium-limitation,
BG11-M; sulphate-limitation, BG11-S; nitrate-limitation, BG11-N) at two time points representing
early growth (Day 4 in all conditions) and late growth (Day 8 in nutrient-limited conditions, Day 16
in standard conditions). Data are presented as means ± S.E.M. of three biological replicates.
Student’s t-tests were performed to determine statistical significance of the difference observed
in late versus early expression levels within each condition (* p<0.05; ** p<0.001).
0
10
20
30
BG11 BG11-N BG11-P BG11-S BG11-M BG11-K
FPK
M
Early
Late
**
**
**
**
**
**
pta
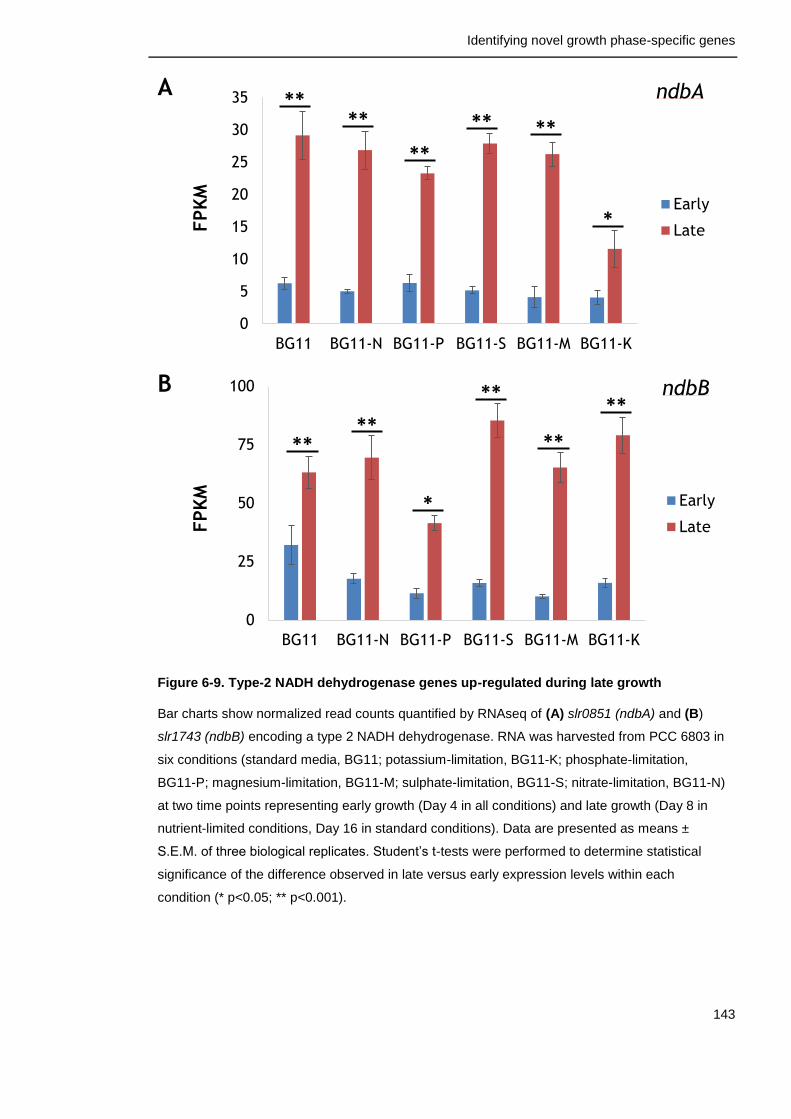
Identifying novel growth phase-specific genes
143
A
B
Figure 6-9. Type-2 NADH dehydrogenase genes up-regulated during late growth
Bar charts show normalized read counts quantified by RNAseq of (A) slr0851 (ndbA) and (B)
slr1743 (ndbB) encoding a type 2 NADH dehydrogenase. RNA was harvested from PCC 6803 in
six conditions (standard media, BG11; potassium-limitation, BG11-K; phosphate-limitation,
BG11-P; magnesium-limitation, BG11-M; sulphate-limitation, BG11-S; nitrate-limitation, BG11-N)
at two time points representing early growth (Day 4 in all conditions) and late growth (Day 8 in
nutrient-limited conditions, Day 16 in standard conditions). Data are presented as means ±
S.E.M. of three biological replicates. Student’s t-tests were performed to determine statistical
significance of the difference observed in late versus early expression levels within each
condition (* p<0.05; ** p<0.001).
0
5
10
15
20
25
30
35
BG11 BG11-N BG11-P BG11-S BG11-M BG11-K
FPK
MEarly
Late
****
**
****
*
ndbA
0
25
50
75
100
BG11 BG11-N BG11-P BG11-S BG11-M BG11-K
FPK
M Early
Late
ndbB
*
**
**
**
****
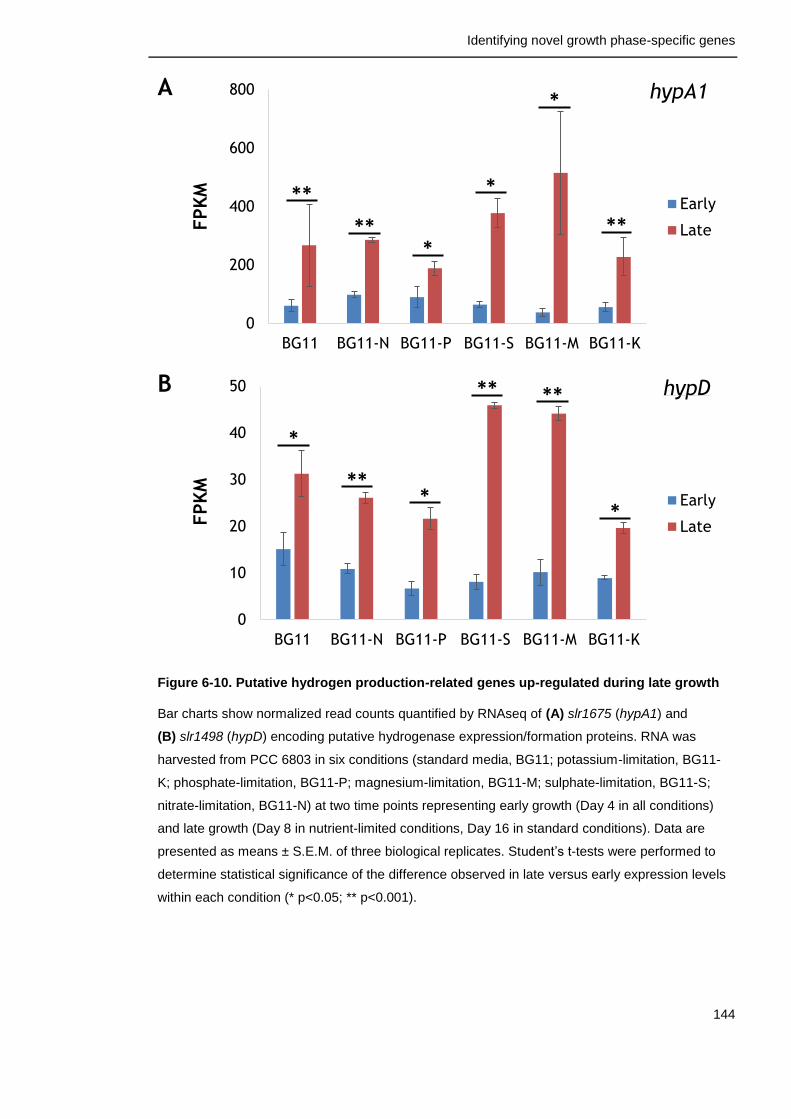
Identifying novel growth phase-specific genes
144
A
B
Figure 6-10. Putative hydrogen production-related genes up-regulated during late growth
Bar charts show normalized read counts quantified by RNAseq of (A) slr1675 (hypA1) and
(B) slr1498 (hypD) encoding putative hydrogenase expression/formation proteins. RNA was
harvested from PCC 6803 in six conditions (standard media, BG11; potassium-limitation, BG11-
K; phosphate-limitation, BG11-P; magnesium-limitation, BG11-M; sulphate-limitation, BG11-S;
nitrate-limitation, BG11-N) at two time points representing early growth (Day 4 in all conditions)
and late growth (Day 8 in nutrient-limited conditions, Day 16 in standard conditions). Data are
presented as means ± S.E.M. of three biological replicates. Student’s t-tests were performed to
determine statistical significance of the difference observed in late versus early expression levels
within each condition (* p<0.05; ** p<0.001).
0
200
400
600
800
BG11 BG11-N BG11-P BG11-S BG11-M BG11-K
FPK
MEarly
Late
hypA1
***
*
*
**
**
0
10
20
30
40
50
BG11 BG11-N BG11-P BG11-S BG11-M BG11-K
FPK
M
Early
Late
hypD
*
**
****
**
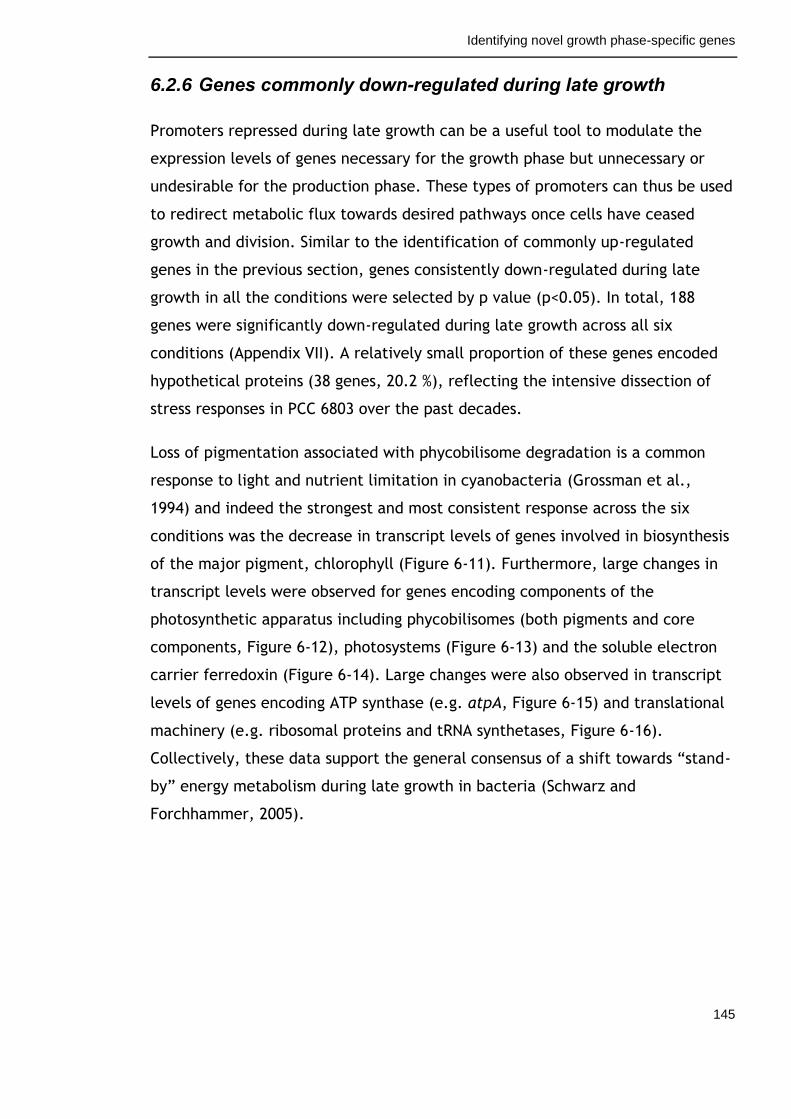
Identifying novel growth phase-specific genes
145
6.2.6 Genes commonly down-regulated during late growth
Promoters repressed during late growth can be a useful tool to modulate the
expression levels of genes necessary for the growth phase but unnecessary or
undesirable for the production phase. These types of promoters can thus be used
to redirect metabolic flux towards desired pathways once cells have ceased
growth and division. Similar to the identification of commonly up-regulated
genes in the previous section, genes consistently down-regulated during late
growth in all the conditions were selected by p value (p<0.05). In total, 188
genes were significantly down-regulated during late growth across all six
conditions (Appendix VII). A relatively small proportion of these genes encoded
hypothetical proteins (38 genes, 20.2 %), reflecting the intensive dissection of
stress responses in PCC 6803 over the past decades.
Loss of pigmentation associated with phycobilisome degradation is a common
response to light and nutrient limitation in cyanobacteria (Grossman et al.,
1994) and indeed the strongest and most consistent response across the six
conditions was the decrease in transcript levels of genes involved in biosynthesis
of the major pigment, chlorophyll (Figure 6-11). Furthermore, large changes in
transcript levels were observed for genes encoding components of the
photosynthetic apparatus including phycobilisomes (both pigments and core
components, Figure 6-12), photosystems (Figure 6-13) and the soluble electron
carrier ferredoxin (Figure 6-14). Large changes were also observed in transcript
levels of genes encoding ATP synthase (e.g. atpA, Figure 6-15) and translational
machinery (e.g. ribosomal proteins and tRNA synthetases, Figure 6-16).
Collectively, these data support the general consensus of a shift towards “stand-
by” energy metabolism during late growth in bacteria (Schwarz and
Forchhammer, 2005).
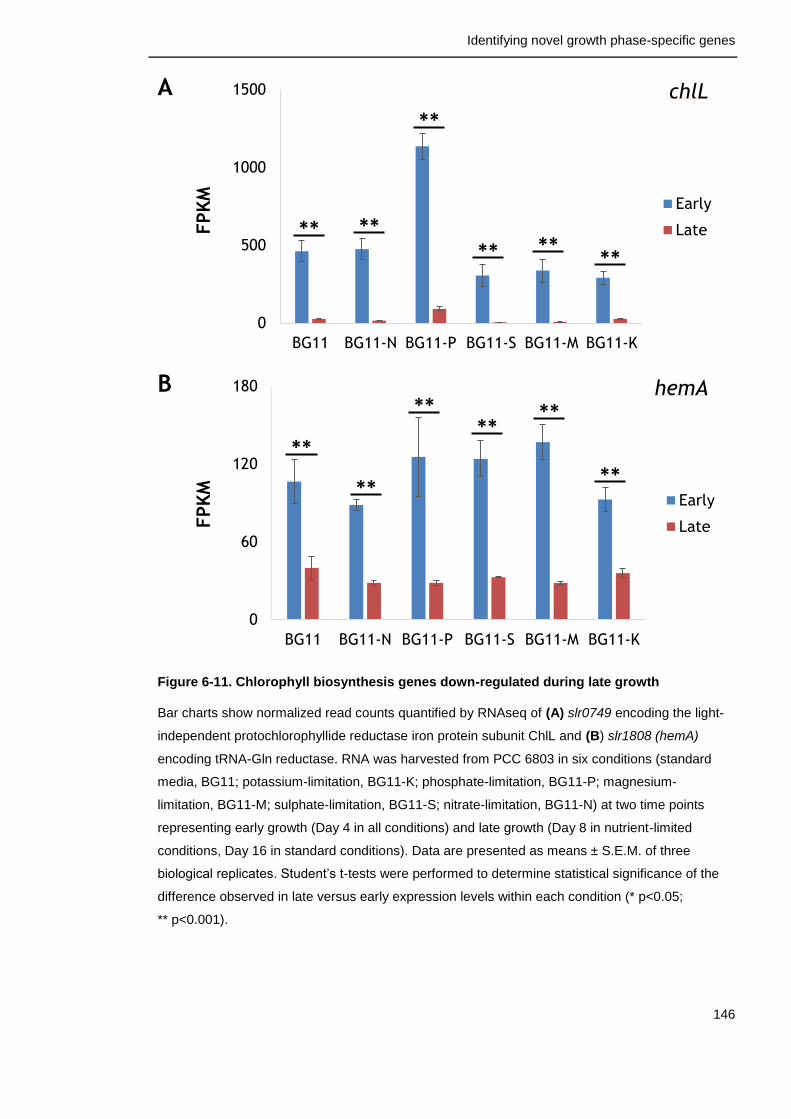
Identifying novel growth phase-specific genes
146
A
B
Figure 6-11. Chlorophyll biosynthesis genes down-regulated during late growth
Bar charts show normalized read counts quantified by RNAseq of (A) slr0749 encoding the light-
independent protochlorophyllide reductase iron protein subunit ChlL and (B) slr1808 (hemA)
encoding tRNA-Gln reductase. RNA was harvested from PCC 6803 in six conditions (standard
media, BG11; potassium-limitation, BG11-K; phosphate-limitation, BG11-P; magnesium-
limitation, BG11-M; sulphate-limitation, BG11-S; nitrate-limitation, BG11-N) at two time points
representing early growth (Day 4 in all conditions) and late growth (Day 8 in nutrient-limited
conditions, Day 16 in standard conditions). Data are presented as means ± S.E.M. of three
biological replicates. Student’s t-tests were performed to determine statistical significance of the
difference observed in late versus early expression levels within each condition (* p<0.05;
** p<0.001).
0
500
1000
1500
BG11 BG11-N BG11-P BG11-S BG11-M BG11-K
FPK
MEarly
Late
chlL
******
**
****
0
60
120
180
BG11 BG11-N BG11-P BG11-S BG11-M BG11-K
FPK
M
Early
Late
hemA
**
****
**
**
**
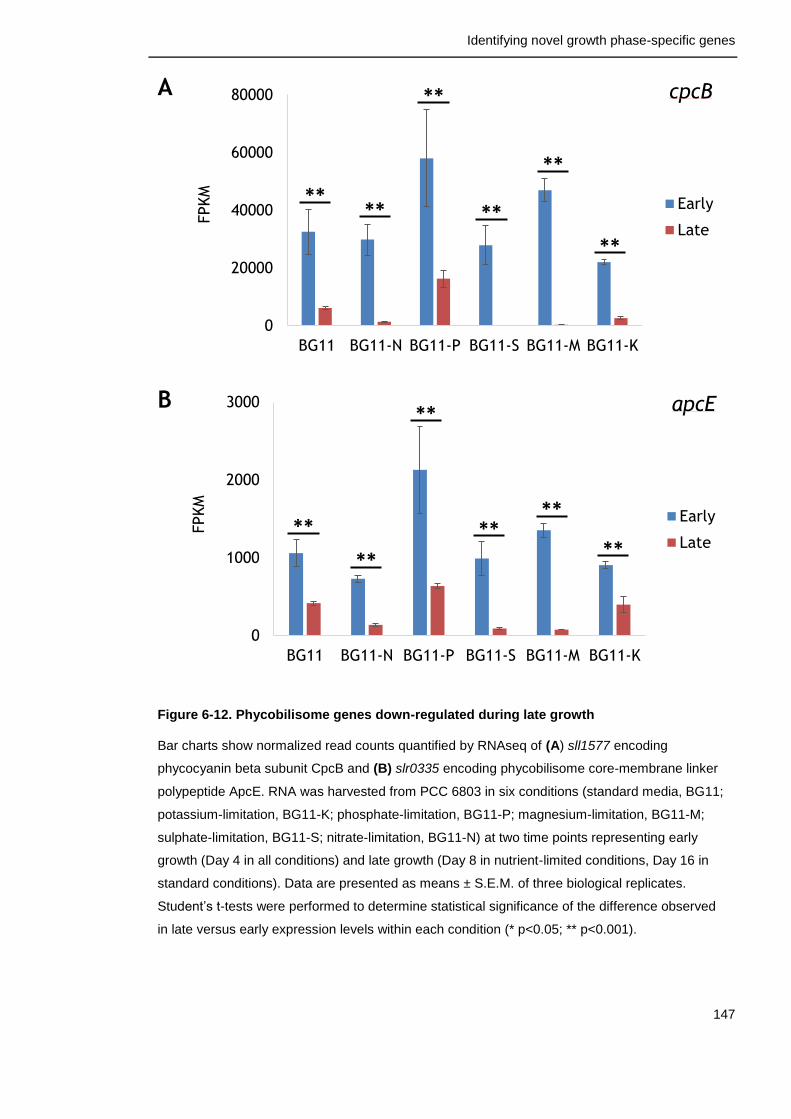
Identifying novel growth phase-specific genes
147
A
B
Figure 6-12. Phycobilisome genes down-regulated during late growth
Bar charts show normalized read counts quantified by RNAseq of (A) sll1577 encoding
phycocyanin beta subunit CpcB and (B) slr0335 encoding phycobilisome core-membrane linker
polypeptide ApcE. RNA was harvested from PCC 6803 in six conditions (standard media, BG11;
potassium-limitation, BG11-K; phosphate-limitation, BG11-P; magnesium-limitation, BG11-M;
sulphate-limitation, BG11-S; nitrate-limitation, BG11-N) at two time points representing early
growth (Day 4 in all conditions) and late growth (Day 8 in nutrient-limited conditions, Day 16 in
standard conditions). Data are presented as means ± S.E.M. of three biological replicates.
Student’s t-tests were performed to determine statistical significance of the difference observed
in late versus early expression levels within each condition (* p<0.05; ** p<0.001).
0
20000
40000
60000
80000
BG11 BG11-N BG11-P BG11-S BG11-M BG11-K
FPKM
Early
Late**
**
**
**
****
cpcB
0
1000
2000
3000
BG11 BG11-N BG11-P BG11-S BG11-M BG11-K
FPKM
Early
Late**
apcE
****
**
**
**
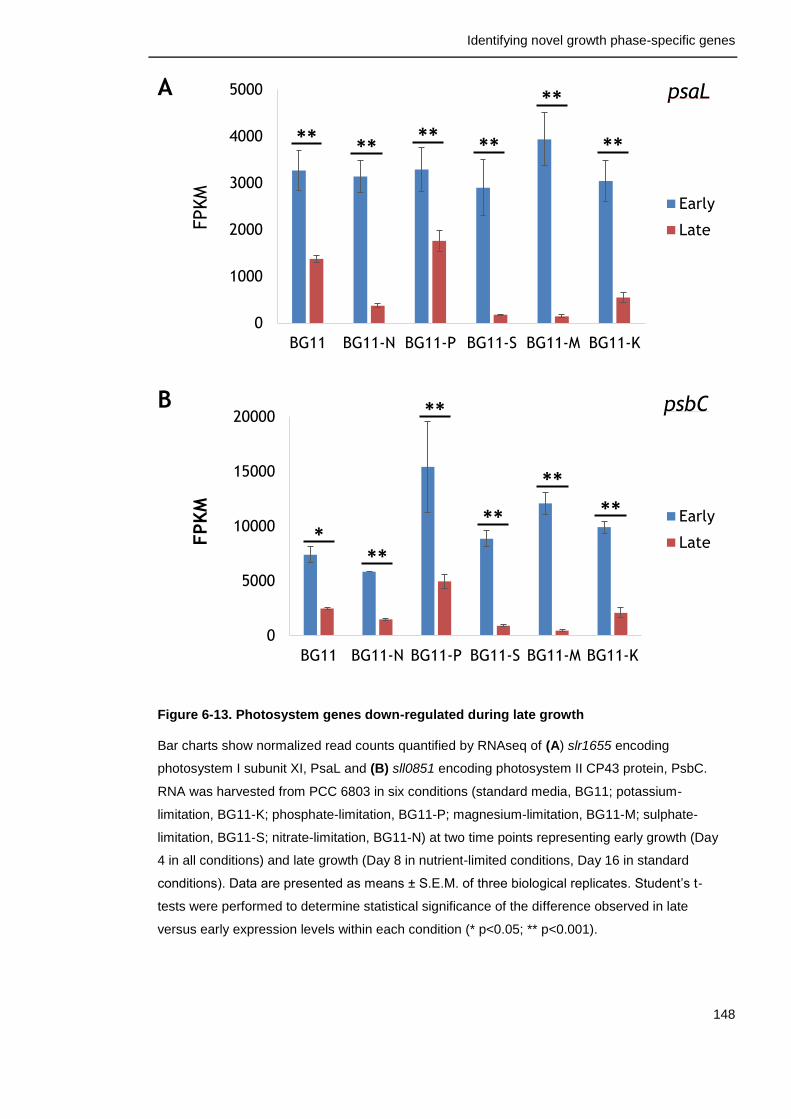
Identifying novel growth phase-specific genes
148
A
B
Figure 6-13. Photosystem genes down-regulated during late growth
Bar charts show normalized read counts quantified by RNAseq of (A) slr1655 encoding
photosystem I subunit XI, PsaL and (B) sll0851 encoding photosystem II CP43 protein, PsbC.
RNA was harvested from PCC 6803 in six conditions (standard media, BG11; potassium-
limitation, BG11-K; phosphate-limitation, BG11-P; magnesium-limitation, BG11-M; sulphate-
limitation, BG11-S; nitrate-limitation, BG11-N) at two time points representing early growth (Day
4 in all conditions) and late growth (Day 8 in nutrient-limited conditions, Day 16 in standard
conditions). Data are presented as means ± S.E.M. of three biological replicates. Student’s t-
tests were performed to determine statistical significance of the difference observed in late
versus early expression levels within each condition (* p<0.05; ** p<0.001).
0
1000
2000
3000
4000
5000
BG11 BG11-N BG11-P BG11-S BG11-M BG11-K
FPKM
Early
Late
**
**
********
psaL
0
5000
10000
15000
20000
BG11 BG11-N BG11-P BG11-S BG11-M BG11-K
FPK
M
Early
Late***
**
**
**
**
psbC
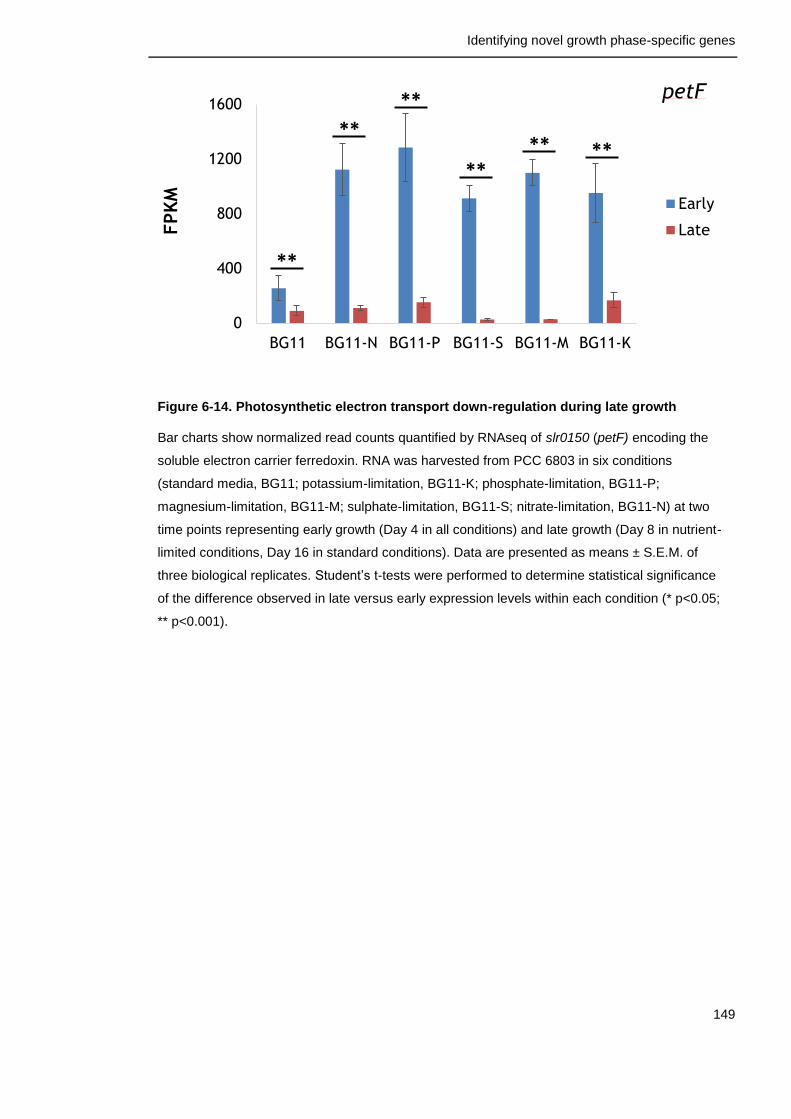
Identifying novel growth phase-specific genes
149
Figure 6-14. Photosynthetic electron transport down-regulation during late growth
Bar charts show normalized read counts quantified by RNAseq of slr0150 (petF) encoding the
soluble electron carrier ferredoxin. RNA was harvested from PCC 6803 in six conditions
(standard media, BG11; potassium-limitation, BG11-K; phosphate-limitation, BG11-P;
magnesium-limitation, BG11-M; sulphate-limitation, BG11-S; nitrate-limitation, BG11-N) at two
time points representing early growth (Day 4 in all conditions) and late growth (Day 8 in nutrient-
limited conditions, Day 16 in standard conditions). Data are presented as means ± S.E.M. of
three biological replicates. Student’s t-tests were performed to determine statistical significance
of the difference observed in late versus early expression levels within each condition (* p<0.05;
** p<0.001).
0
400
800
1200
1600
BG11 BG11-N BG11-P BG11-S BG11-M BG11-K
FPK
M
Early
Late
******
**
**
**
petF
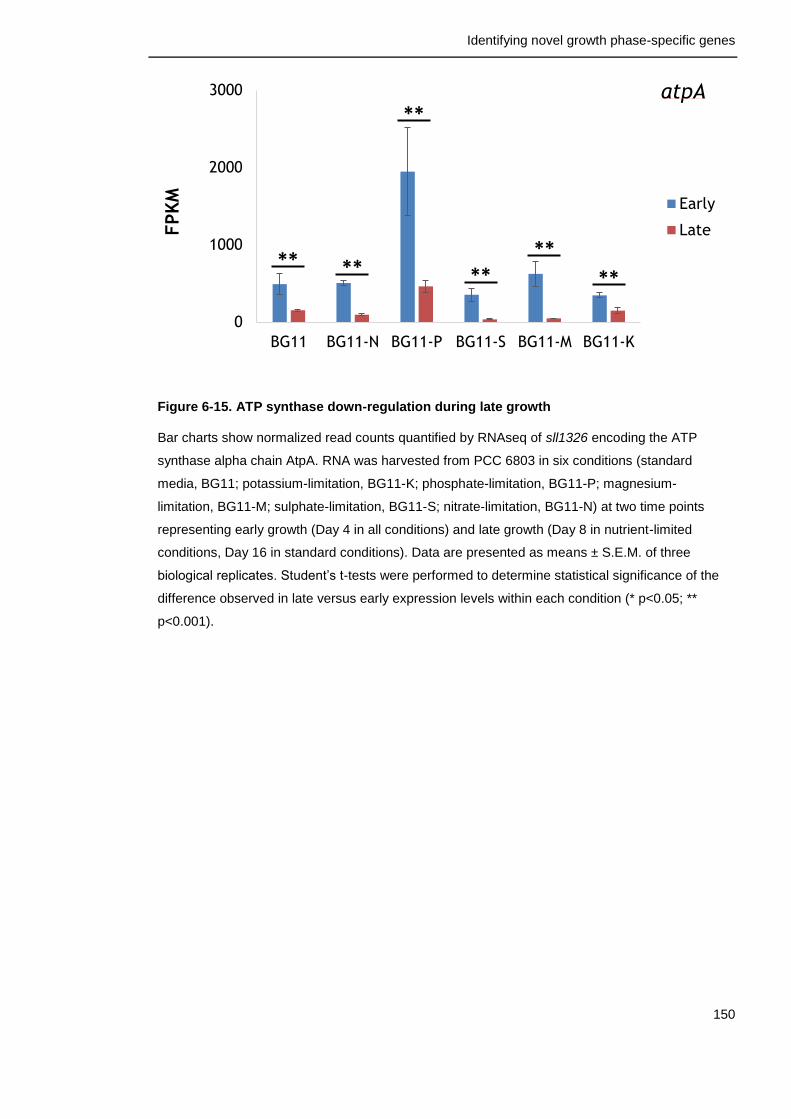
Identifying novel growth phase-specific genes
150
Figure 6-15. ATP synthase down-regulation during late growth
Bar charts show normalized read counts quantified by RNAseq of sll1326 encoding the ATP
synthase alpha chain AtpA. RNA was harvested from PCC 6803 in six conditions (standard
media, BG11; potassium-limitation, BG11-K; phosphate-limitation, BG11-P; magnesium-
limitation, BG11-M; sulphate-limitation, BG11-S; nitrate-limitation, BG11-N) at two time points
representing early growth (Day 4 in all conditions) and late growth (Day 8 in nutrient-limited
conditions, Day 16 in standard conditions). Data are presented as means ± S.E.M. of three
biological replicates. Student’s t-tests were performed to determine statistical significance of the
difference observed in late versus early expression levels within each condition (* p<0.05; **
p<0.001).
0
1000
2000
3000
BG11 BG11-N BG11-P BG11-S BG11-M BG11-K
FPK
M Early
Late
**
**
**
******
atpA
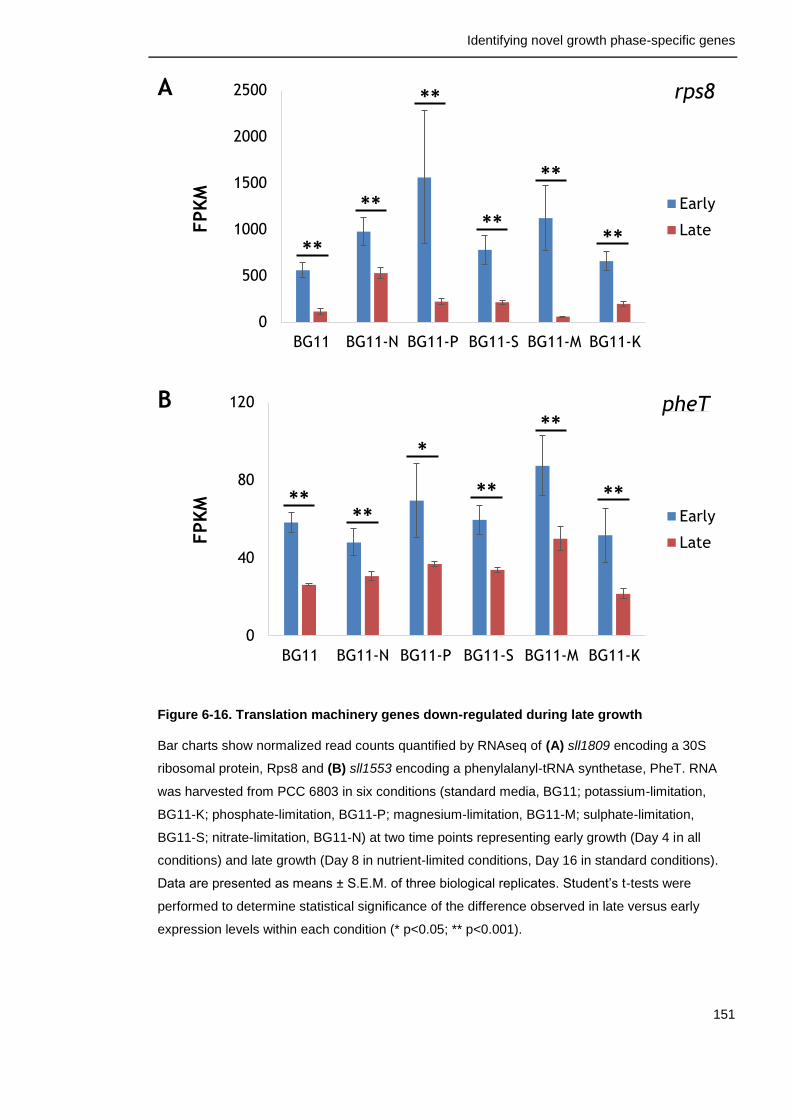
Identifying novel growth phase-specific genes
151
A
B
Figure 6-16. Translation machinery genes down-regulated during late growth
Bar charts show normalized read counts quantified by RNAseq of (A) sll1809 encoding a 30S
ribosomal protein, Rps8 and (B) sll1553 encoding a phenylalanyl-tRNA synthetase, PheT. RNA
was harvested from PCC 6803 in six conditions (standard media, BG11; potassium-limitation,
BG11-K; phosphate-limitation, BG11-P; magnesium-limitation, BG11-M; sulphate-limitation,
BG11-S; nitrate-limitation, BG11-N) at two time points representing early growth (Day 4 in all
conditions) and late growth (Day 8 in nutrient-limited conditions, Day 16 in standard conditions).
Data are presented as means ± S.E.M. of three biological replicates. Student’s t-tests were
performed to determine statistical significance of the difference observed in late versus early
expression levels within each condition (* p<0.05; ** p<0.001).
0
500
1000
1500
2000
2500
BG11 BG11-N BG11-P BG11-S BG11-M BG11-K
FPK
MEarly
Late
**
**
**
****
**
rps8
0
40
80
120
BG11 BG11-N BG11-P BG11-S BG11-M BG11-K
FPK
M
Early
Late
**
***
****
**
pheT
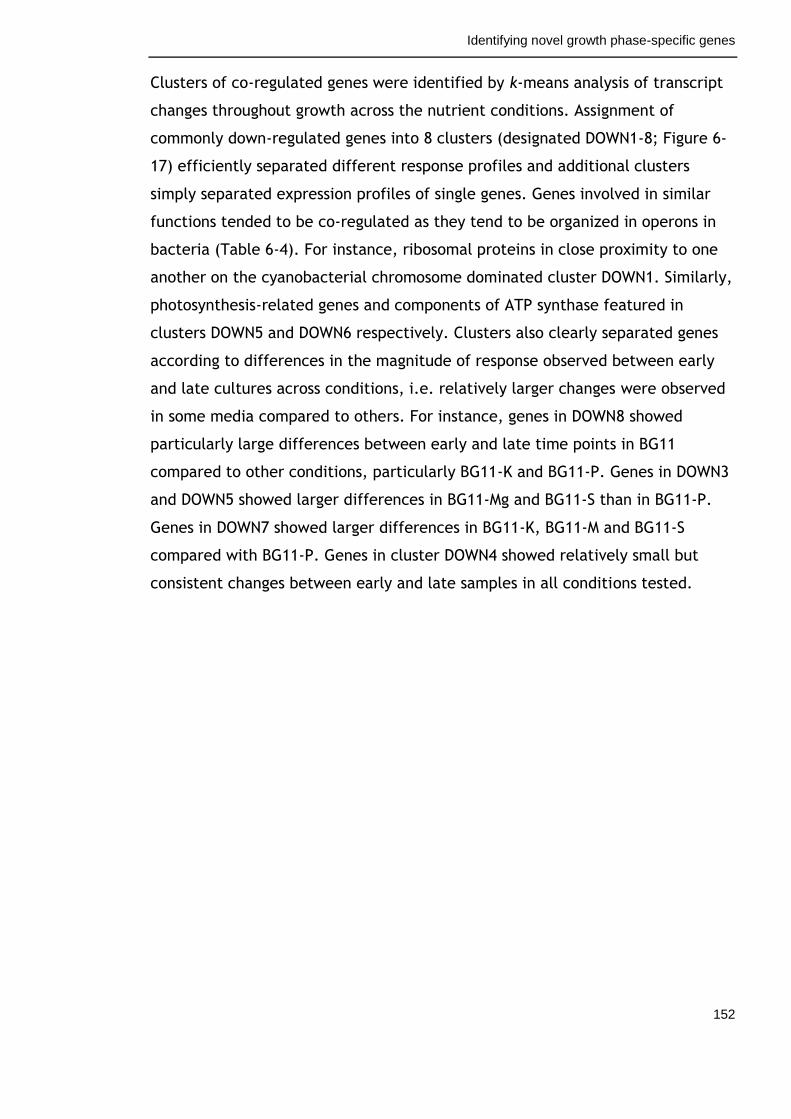
Identifying novel growth phase-specific genes
152
Clusters of co-regulated genes were identified by k-means analysis of transcript
changes throughout growth across the nutrient conditions. Assignment of
commonly down-regulated genes into 8 clusters (designated DOWN1-8; Figure 6-
17) efficiently separated different response profiles and additional clusters
simply separated expression profiles of single genes. Genes involved in similar
functions tended to be co-regulated as they tend to be organized in operons in
bacteria (Table 6-4). For instance, ribosomal proteins in close proximity to one
another on the cyanobacterial chromosome dominated cluster DOWN1. Similarly,
photosynthesis-related genes and components of ATP synthase featured in
clusters DOWN5 and DOWN6 respectively. Clusters also clearly separated genes
according to differences in the magnitude of response observed between early
and late cultures across conditions, i.e. relatively larger changes were observed
in some media compared to others. For instance, genes in DOWN8 showed
particularly large differences between early and late time points in BG11
compared to other conditions, particularly BG11-K and BG11-P. Genes in DOWN3
and DOWN5 showed larger differences in BG11-Mg and BG11-S than in BG11-P.
Genes in DOWN7 showed larger differences in BG11-K, BG11-M and BG11-S
compared with BG11-P. Genes in cluster DOWN4 showed relatively small but
consistent changes between early and late samples in all conditions tested.
Identifying novel growth phase-specific genes
153
Figure 6-17. Expression profiles of genes commonly down-regulated during late growth
Data shown were obtained by RNAseq analysis of RNA from PCC 6803 during different times
during growth (days 4, 8 and 16) in six conditions (standard media, BG11; potassium-limitation,
BG11-K; phosphate-limitation, BG11-P; magnesium-limitation, BG11-M; sulphate-limitation,
BG11-S; nitrate-limitation, BG11-N). Based on significant differences at p< 0.05, 83 genes
commonly down-regulated during late growth across conditions were identified and subjected to
k-means clustering based on Jensen-Shannon divergence. Each graph shows the mean
transcriptional response profile (bold black line) of the genes in a particular cluster.
Identifying novel growth phase-specific genes
154
6.3 Discussion
The identification of genes robustly regulated by changes in growth are the first
step towards identifying growth phase-specific promoters. Until now, growth
phase-specific gene expression has been compared in a limited number of
conditions that did not necessarily affect growth kinetics (Foster et al., 2007,
Berla and Pakrasi, 2012). By contrast, I have studied the changes in gene
expression across six conditions with vastly differing growth kinetics. This
enabled the identification of genes that are consistently up- or down-regulated
during late growth of PCC 6803 irrespective of the growth limiting factor. These
sets of co-regulated genes were further subdivided into clusters showing similar
expression profiles which may be regulated by common factors. It should be
noted that the k-means clustering analysis pre-defines the number of clusters.
The optimal cluster number is determined in a minimum function but it always
constitutes a compromise. This accounts for the fact that some genes do not fit
well with the average cluster profile (and should be eliminated) while some of
the clusters are very similar (and should be combined). Differences between the
obtained clusters were due to relatively larger changes in some media compared
to others. For example, genes in DOWN8 showed particularly large differences
between late and early time points in BG11, while genes in DOWN3 and DOWN5
showed larger differences in BG11-Mg and BG11-S than in BG11-P. Genes in
cluster DOWN4 showed relatively small but consistent changes between early
and late samples in all conditions tested.
Many additional analyses can be performed on this large dataset to identify
genes with many other interesting expression patterns (e.g. genes which respond
to specific nutrient limitations) however these questions were outwith the scope
of this project. Furthermore, additional validation of the RNAseq results will
need to be performed using alternative approaches such as qPCR to confirm the
observed gene expression profiles. Nevertheless, I have identified large sets of
genes that are co-regulated in response to growth and can be taken forward for
analysis of upstream regions. Furthermore, I have defined a relevant background
of expressed genes in order to identify enrichment within selected gene clusters.
Identifying novel growth phase-specific genes
155
6.3.1 Cyanobacteria switch to “standby” mode during late growth
In nature, conditions are seldom able to maintain constant growth and as a
result, cyanobacteria have evolved to cope with continuous cycles of growth and
starvation. During prolonged starvation, many bacteria transition into non-
proliferative states commonly referred to as stationary phase growth. In the
laboratory, stationary phase is sooner or later reached in batch cultures. In
cyanobacterial research, few studies have focused on stationary phase itself but
rather responses to stress which result in the cessation of growth, most
commonly nutrient limitation. While there are specific responses for particular
nutrients, a number of general responses occur under any starvation condition
including the cessation of cell division and significant changes in cell morphology
and metabolism (Schwarz and Forchhammer, 2005). In particular, a general
decrease in anabolic and increase in catabolic processes is commonly observed
during acclimation.
A well-studied phenomenon is the degradation of light-harvesting phycobilisomes
(PBSs). These pigmented structures are rich in sulfur and nitrogen and
degradation may provide amino acids for the synthesis of proteins important for
acclimation (Grossman et al., 1993). Indeed, my results demonstrated both a
strong decrease in transcripts encoding phycobilisome components (Figure 6-13)
as well as an increase in nblA transcript involved in phycobilisome degradation
during late growth in all conditions. As PBSs serve as antenna complexes for
photosynthesis, PBS degradation also reduces energy transfer to the chlorophyll
molecules and thus the potential formation of reactive oxygen species (ROS) and
subsequent damage to cellular components including DNA, RNA and proteins.
This down-regulation of electron transfer is important given the general
decrease in anabolic processes and thus decrease in reoxidation of the final
electron acceptors. Long-term N-starvation studies in Synechococcus spp. PCC
7942 have revealed dramatic decreases in the activity of photosystems I and II
(0.1 % compared to actively growing cells) as well as slow turnover of proteins
involved in photosynthesis but not translational machinery (Sauer et al., 2001).
In agreement, I observed significant down-regulation of transcripts encoding
subunits of photosystems, ATP synthase and ribosomes suggesting this a typical
Identifying novel growth phase-specific genes
156
response during late growth in cyanobacteria. Furthermore, the strongest
response I observed during late growth was the down-regulation of transcripts
involved in chlorophyll biosynthesis, the major pigment present in the
photosystems. Overall, there is a shift towards low metabolism during late
growth in cyanobacteria indicating a transition into “standby” mode until more
favourable conditions arise.
6.3.2 Factors with positive effects on survival
Negative mechanisms to reduce toxicity and cellular demand to enhance survival
during late growth are well described for cyanobacteria, particularly the
reduced activity of photosynthesis as discussed in the previous section. By
contrast, positive mechanisms that enhance survival during late growth are
lacking in the dataset. This may be due to a general lack of knowledge of such
mechanisms in cyanobacteria, which is reflected in the fact that the majority of
genes up-regulated during late growth in all conditions had no functional
annotation. One gene, slr1747, is a homolog of the cell death suppressor protein
Lls1 (lethal leaf spot 1). This gene is highly conserved in plants and is important
for limiting the spread of cell death in leaves (Gray et al., 1999). In maize, the
encoded protein contains two structural motifs that are highly conserved in
bacterial phenolic dioxygenases. Phenolic compounds become highly reactive
under oxidative conditions induced by stress, generating ROS and phenolic free
radicals and have been proposed as mediators of cell death in plants (Appel,
1993). These compounds are produced as secondary metabolites in
cyanobacteria and the common induction of the Lls1 homolog during late growth
suggests a similar role in cyanobacteria.
6.3.2.1 Natural shifts towards energy production during late growth
Hydrogenase enzymes have attracted a lot of interest in recent years due to
their ability to convert solar power into hydrogen energy. PCC 6803 possesses
the bidirectional Hox enzyme belonging to the [NiFe] class of hydrogenases that
catalyse both hydrogen oxidation and proton reduction (Khanna 2015). Despite
their popularity, the precise physiological role of hydrogenases is still under
Identifying novel growth phase-specific genes
157
debate. Their activity has been linked to photosynthesis, acting as a valve to
dissipate excess electrons generated during the light reactions of photosynthesis
(Appel et al., 2000). Biosynthesis of this enzyme requires the help of several
additional proteins including HypA1 and HypD which incorporate nickel (Ni) and
iron (Fe) respectively into the active centre of the enzyme (Hoffmann et al.,
2006). Both hypA1 and hypD transcripts were consistently induced in my study
suggesting a role for hydrogenase activity during late growth. Indeed, the
dissipation of excess reductant resulting from reduced metabolism may play an
important role during late growth. This has great implications for the
applications of high-density cyanobacterial cultures in the generation of
renewable fuels.
6.3.3 Signalling cascades are important for late growth survival in
bacteria
Stationary phase survival, and in fact stress survival in general, relies heavily on
signalling cascades to regulate gene expression and thus coordinate a diverse
array of metabolic activity in bacteria (Llorens et al., 2010). Indeed, I observed
a large increase in transcripts related to both signalling and gene regulation
during late growth in PCC 6803. This included the induction of genes involved in
two-component signal transduction systems as well as the production of
intracellular signaling molecules cyclic AMP and acetyl phosphate.
6.3.3.1 Two-component signal transduction systems
Two-component signal transduction systems (2CSs) are a common approach to
monitor external conditions and adjust accordingly, typically by influencing gene
expression (Parkinson and Kofoid, 1992). Six genes involved 2SCs were commonly
regulated (five up and one down) during late growth across all conditions. The
sole histidine kinase that was consistently down-regulated during late growth in
this study was hik31. A virtually identical copy of this gene resides on the
plasmid pSYSX (slr6041), however the plasmid copy of this gene did not respond
in the same manner to changes in growth. Chromosomal hik31 expression during
active growth followed by down-regulation during late growth has previously
Identifying novel growth phase-specific genes
158
been demonstrated by RT-PCR (Nagarajan et al., 2012). This system is
implicated in the negative control of autotrophic events and glucose metabolism
and a general role in the regulation of growth and cellular homeostasis has been
suggested (Kahlon et al., 2006, Summerfield et al., 2011). Microarray analyses
comparing gene expression in wild type and Δhik31-inactivated mutants in
response to low-oxygen revealed the negative regulation of a large set of genes
associated with growth, most notably photosynthesis, ATP synthesis and
translation. While I observed common down-regulation of genes within these
same functional categories, the negative regulation mechanism previously
proposed as a result of phenotypic and microarray analyses argue against gene
regulation by Hik31 in response to changes in growth.
Hik34, a histidine kinase sensor unique to cyanobacteria, is implicated in the
regulation of gene expression under various stresses including salt, heat and
oxidative stress (Marin et al., 2003, Suzuki et al., 2005, Kanesaki et al., 2007).
Under heat stress, Hik34 has a proposed role as a negative regulator since
inactivation of hik34 results in enhanced expression of heat shock genes and thus
enhanced thermotolerance (Suzuki et al., 2005). Aside from heat shock proteins
that are not commonly regulated during late growth according to our data, Hik34
also negatively regulates the expression of photosynthesis-related genes
including hemA, cpcC, and atpF, which encode the tRNA-Gln reductase
responsible for catalysing the first step of chlorophyll biosynthesis, the
phycocyanin linker protein and a subunit of ATPase respectively. These genes are
commonly down-regulated during late growth in my dataset and may be targets
of Hik34.
The roles of the remaining 2CSs commonly induced during late growth in this
study (hik23, hik26, sll5060 and slr1594) are still undefined. Neither stimuli
inducing their expression nor potential targets have been described. 2CS studies
in cyanobacteria typically involve gene inactivation followed by phenotypic and
transcriptomic analysis of mutants under various stress conditions. This is the
first study to demonstrate the induction of these 2CSs. Previous nutrient-
limitation studies failed to identify these 2CSs, however this may be due to their
focus on shock responses to complete elimination of the nutrient of interest
Identifying novel growth phase-specific genes
159
(Hirani et al., 2001, Richaud et al., 2001, Krasikov et al., 2012, Zhang et al.,
2008, Suzuki et al., 2004). By contrast, I studied changes in response to gradual
nutrient depletion that evidently induce a different response regulated by a
different set of factors. This suggests important roles for these uncharacterized
2CSs in the gradual acclimation to nutrient depletion.
6.3.3.2 Cellular cAMP
Adenylate cyclase catalyses the conversion of ATP to cylic AMP (cAMP), a
secondary messenger which plays important roles in the regulation of various
biological activities including enzyme activity and gene expression in both
prokaryotes and eukaryotes. Transcript levels of cya1, which encodes adenylate
cyclase, was consistently induced during late growth in this study, suggesting up-
regulation of cAMP production. In cyanobacteria, cellular cAMP levels vary in
response to environmental factors including light, pH and nitrogen availability
(Cann, 2004). This influences the activity of cAMP-receptor proteins (CRPs; also
referred to as catabolite activator proteins, CAPs) which act as global
transcriptional regulatory proteins via binding to specific motifs in the promoter
regions of target genes. One such protein, SYCRP1, is implicated in twitching
motility observed in response to blue light illumination in PCC 6803. Perception
of blue light (450 nm) results in marked increases in cellular cAMP levels which
promotes SYCRP1 binding to promoters of genes encoding type IV pili which form
hair-like filaments extending from the outer membrane of cyanobacteria
(Ohmori and Okamoto, 2004). Interestingly, increases in cAMP secretion during
stationary phase growth have been reported for the filamentous cyanobacterium
Anabaena flos-aquae (Francko and Wetzel, 1981), however the same was not
observed in stationary phase cultures of PCC 6803 (Sakamoto et al., 1991). There
was no evidence of up-regulation of cAMP-receptor proteins during late growth
in my dataset, however only two are annotated in the PCC 6803 genome to date.
6.3.3.3 Acetyl phosphate, a global sensor of physiological state
Phosphotransacetylase catalyses the production of acetyl phosphate which has
been suggested as a global sensor of physiological state in cyanobacteria
(Morrison et al., 2005). Acetyl phosphate levels fluctuate in response to growth
Identifying novel growth phase-specific genes
160
phase, carbon source, pH and temperature. I observed consistent up-regulation
of the gene encoding phosphotransacetylase, pta, during late growth suggesting
increased acetyl phosphate production during this phase. This can have direct
impacts on transcription as acetyl phosphate may act as an alternative
phosphodonor for response regulators in 2CSs. Indeed, several bacterial response
regulators are activated by acetyl phosphate in vitro (McCleary and Stock, 1994)
and a recent study in B. subtilis has demonstrated in vivo enhancement of Rre
phosphorylation in the presence of elevated acetyl phosphate levels (Cairns et
al., 2015). This may serve as an alternative mechanism to activate 2CSs and thus
coordinate gene expression when ATP levels are likely reduced given low
transcription of ATP synthase subunits during late growth.
6.3.4 Promoters regulated in response to changes in growth
Bacteria have numerous mechanisms to regulate gene expression including
mechanisms that do not involve direct contact with promoters of genes. For
instance, changes in DNA topology, particularly DNA supercoiling, play an
important role in mediating responses to environmental stress in bacteria
(Dorman, 1996). The induction of a large number of uncharacterized regulatory
factors in this study gives hope for the identification of growth phase-specific
promoters. Indeed, regulatory mechanisms can be subject to signal cascades
involving multiple factors and do not necessarily depend on direct interaction
with DNA. For instance, Hik31 regulation of glucose metabolism appears to be
post-transcriptional given the lack of change observed in the transcriptome of
hik31-inactivated mutants (Kahlon et al., 2006). However, the majority of 2CSs
mediate a direct transcriptional response via binding of the response regulator
to the promoter regions of genes (Los et al., 2010). Given that four
uncharacterised genes encoding components of 2CSs were reproducibly induced
during late growth across multiple conditions, it is likely that growth phase-
specific promoters do indeed exist in cyanobacteria. Furthermore, it is likely
that motifs specifically recognized by these 2CSs are present in promoters
important for growth-specific regulation.
Identifying novel growth phase-specific genes
161
Motif discovery algorithms have been developed to identify specific nucleotide
sequences overrepresented in one set of DNA sequences as compared with
another. The work described in this chapter provides the experimental dataset
to enable such analysis in future. I have defined a background set of expressed
genes and identified foreground sets of genes that are robustly co-regulated in
response to culture growth phase. As multiple factors may be regulating
expression in response to growth, I performed clustering analysis to identify
subsets of co-regulated genes to enrich for potential factor-specific motifs. It is
important to note that bacterial genes tend to be organised in operons in which
multiple genes are transcribed from a single promoter. Visualisation of where
the RNAseq reads map to the cyanobacterial genome will inform on operon
structure and thus the selection of promoters to be analysed. Motifs have
previously been identified in nitrate- and phosphate-responsive genes (Suzuki et
al., 2004, Luque et al., 1994). These can serve as useful tools to aid in the
selection of motif discovery algorithm as well as optimisation of the length of
upstream sequences to be included in the analysis.
6.3.5 Specific nutrient-responsive genes and promoters
For practical applications, the dataset presented in this chapter provides a
goldmine of information of global transcriptomic responses to changes in growth
across a variety of conditions. This data can give indications of changes in
metabolism and thus flux arising from specific nutrient limitations, thus enabling
the tailoring of media and conditions to enhance flux towards particular
processes. This information can be further expanded by incorporating more
conditions including light intensity, carbon availability as well as combined
effects of multiple nutrient limitations to name a few. Specific nutrient
responses can also be identified and analysis of gene clusters and upstream
sequences may provide more auto-inducible regulatory elements to the growing
molecular toolbox for cyanobacteria. While it is generally not ideal to regulate
processes using factors necessary for growth, this can still serve as a sustainable
approach to regulate gene expression and further complement processes in
custom media tailored to enhance metabolic flux. This approach can be applied
to identify other nutrient-responsive promoters that do not have such inhibitory

Identifying novel growth phase-specific genes
162
effects on growth. Finally, this is the first study of response to cation (Mg and K)
limitation in PCC 6803, and it is now possible to glean both general as well as
specific responses to cation stress. This will add another level of understanding
to this already thoroughly studied model organism, thus enhancing the rational
design of this system.
Identifying novel growth phase-specific genes
163
Chapter 7. General discussion
Cyanobacteria are an attractive chassis for practical applications due to their
ability to convert solar energy into chemical energy and biomass. While
cyanobacteria have shown early signs of promise for a wide array of applications,
they still do not present a real alternative to heterotrophic systems. The
recurring limitation is the lack of tightly regulated promoters to control gene
expression in this organism at a desired point of time during the process
(Angermayr and Hellingwerf, 2013). A synthetic biology approach can help tackle
this problem using well-defined, standardised genetic tools for rapid assembly of
rationally designed gene expression cassettes to enhance productivity. In
bacteria, promoters that are specifically active in high-density cultures are
desirable as they prevent interference of transgene expression during active
culture growth. Furthermore, auto-inducible promoters regulated by endogenous
cues arising from changes in growth phase avoid the need for costly and often
toxic supplements. I therefore set out to identify promoters specifically
activated in high-density cultures of cyanobacteria. A summary of this work is
presented in Table 7-1 and will be discussed in closer detail in the following
sections.
Table 7-1. Overview of the work and future development (overleaf)
Abbreviations : PCC 7002, Synechococcus spp. PCC 7002; RBS, ribosome binding site; GFP,
green fluorescent protein; N, nitrate; P, phosphate; S, sulphate; K, potassium; Mg, magnesium;
PCC 6803, Synechocystis spp. PCC 6803; BG11-K, potassium-limited BG11 media; BG11-Mg,
magnesium-limited BG11 media.
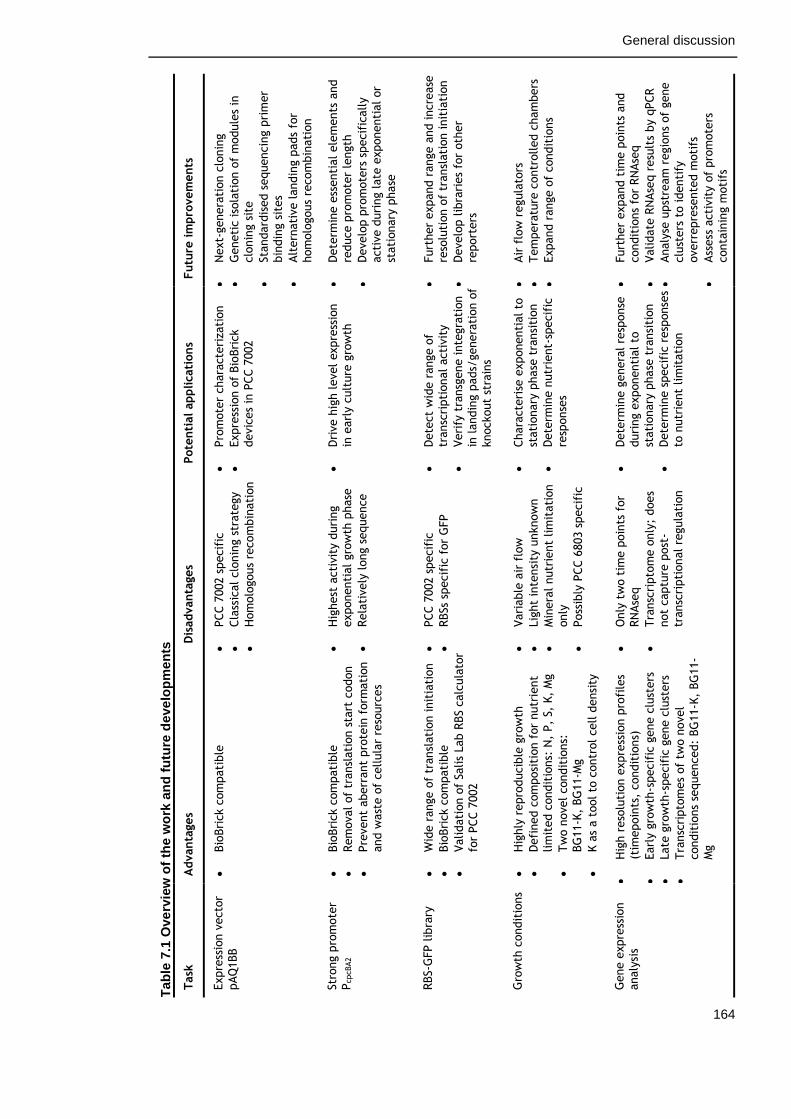
General discussion
164
Tab
le 7
.1 O
ve
rvie
w o
f th
e w
ork
an
d f
utu
re d
eve
lop
men
ts
Futu
re im
pro
vem
ents
N
ext-
genera
tion c
lonin
g
G
eneti
c iso
lati
on o
f m
odule
s in
clo
nin
g s
ite
Sta
ndard
ised s
equencin
g p
rim
er
bin
din
g s
ites
Alt
ern
ati
ve l
andin
g p
ads
for
hom
olo
gous
recom
bin
ati
on
D
ete
rmin
e e
ssenti
al ele
ments
and
reduce p
rom
ote
r le
ngth
D
evelo
p p
rom
ote
rs s
pecif
ically
acti
ve d
uri
ng late
exponenti
al or
stati
onary
phase
Furt
her
expand r
ange a
nd incre
ase
reso
luti
on o
f tr
ansl
ati
on init
iati
on
D
evelo
p lib
rari
es
for
oth
er
report
ers
Air
flo
w r
egula
tors
Tem
pera
ture
contr
olled c
ham
bers
Expand r
ange o
f condit
ions
Furt
her
expand t
ime p
oin
ts a
nd
condit
ions
for
RN
Ase
q
Validate
RN
Ase
q r
esu
lts
by q
PCR
Analy
se u
pst
ream
regio
ns
of
gene
clu
sters
to identi
fy
overr
epre
sente
d m
oti
fs
Ass
ess
acti
vit
y o
f pro
mote
rs
conta
inin
g m
oti
fs
Pote
nti
al applicati
ons
Pro
mote
r chara
cte
rizati
on
Expre
ssio
n o
f Bio
Bri
ck
devic
es
in P
CC 7
002
D
rive h
igh level expre
ssio
n
in e
arl
y c
ult
ure
gro
wth
D
ete
ct
wid
e r
ange o
f
transc
ripti
onal acti
vit
y
Veri
fy t
ransg
ene inte
gra
tion
in landin
g p
ads/
genera
tion o
f
knockout
stra
ins
Chara
cte
rise
exponenti
al to
stati
onary
phase
tra
nsi
tion
D
ete
rmin
e n
utr
ient-
specif
ic
resp
onse
s
D
ete
rmin
e g
enera
l re
sponse
duri
ng e
xponenti
al to
stati
onary
phase
tra
nsi
tion
D
ete
rmin
e s
pecif
ic r
esp
onse
s
to n
utr
ient
lim
itati
on
Dis
advanta
ges
PCC 7
002 s
pecif
ic
Cla
ssic
al clo
nin
g s
trate
gy
H
om
olo
gous
recom
bin
ati
on
H
ighest
acti
vit
y d
uri
ng
exponenti
al gro
wth
phase
Rela
tively
long s
equence
PCC 7
002 s
pecif
ic
RBSs
specif
ic f
or
GFP
Vari
able
air
flo
w
Lig
ht
inte
nsi
ty u
nknow
n
M
inera
l nutr
ient
lim
itati
on
only
Poss
ibly
PCC 6
803 s
pecif
ic
O
nly
tw
o t
ime p
oin
ts f
or
RN
Ase
q
Tra
nsc
ripto
me o
nly
; does
not
captu
re p
ost
-
transc
ripti
onal re
gula
tion
Advanta
ges
Bio
Bri
ck c
om
pati
ble
Bio
Bri
ck c
om
pati
ble
Rem
oval of
transl
ati
on s
tart
codon
Pre
vent
aberr
ant
pro
tein
form
ati
on
and w
ast
e o
f cellula
r re
sourc
es
W
ide r
ange o
f tr
ansl
ati
on init
iati
on
Bio
Bri
ck c
om
pati
ble
Validati
on o
f Salis
Lab R
BS c
alc
ula
tor
for
PCC 7
002
H
ighly
repro
ducib
le g
row
th
D
efi
ned c
om
posi
tion f
or
nutr
ient
lim
ited c
ondit
ions:
N,
P,
S, K
, M
g
Tw
o n
ovel condit
ions:
BG
11-K
, BG
11-M
g
K a
s a t
ool to
contr
ol cell d
ensi
ty
H
igh r
eso
luti
on e
xpre
ssio
n p
rofi
les
(tim
epoin
ts,
condit
ions)
Earl
y g
row
th-s
pecif
ic g
ene c
lust
ers
Late
gro
wth
-specif
ic g
ene c
lust
ers
Tra
nsc
ripto
mes
of
two n
ovel
condit
ions
sequenced:
BG
11-K
, BG
11-
Mg
Task
Expre
ssio
n v
ecto
r
pAQ
1BB
Str
ong p
rom
ote
r
PcpcBA2
RBS-G
FP l
ibra
ry
Gro
wth
condit
ions
Gene e
xpre
ssio
n
analy
sis
General discussion
165
7.1 Standardised molecular tools for cyanobacteria
7.1.1 Further development of the pAQ1BB plasmid vector
To assess the strength and specificity of candidate promoters, I established a
GFP-based assay to quantify promoter activity in vivo throughout culture growth
of the marine cyanobacterium Synechococcus spp. PCC 7002. The components of
this assay were developed in accordance with the BioBrick design for
compatibility with the Registry of Standardised Parts. Importantly, a plasmid
vector, pAQ1BB, was developed to include unique key restriction sites required
for BioBrick assembly. Additional features should be incorporated to genetically
isolate modules within the cloning site including forward and reverse
transcriptional terminators and translational stop codons to prevent aberrant
transgene product formation. Furthermore, standardised sequencing primer
binding sites will improve sequencing quality to confirm correct assembly.
BioBrick verification primers are not commonly available at sequencing facilities
such as GATC (Konstanz, Germany) so I instead propose using universal primers
such as the M13 forward and reverse primers.
7.1.2 Developing landing pads for stable transgene integration
The pAQ1BB vector facilitates stable integration of BioBrick modules into the
PCC 7002 genome by homologous recombination, which sadly restricts its
application to this particular species of cyanobacteria. Broad host range
autonomous vectors could provide a more general tool for cyanobacteria and
have indeed been recently developed (Taton et al., 2014). These vectors do
have their limitations however as they require constant selective pressure and
typically maintain a low copy number in bacteria. Instead, pAQ1BB can be
modified by replacing the nucleotide sequences involved in recombination using
the unique flanking restriction sites for transformation of other organisms. A
library of plasmid vectors targeting different regions, or “landing pads”, in the
genomes of different species of cyanobacteria would be a highly valuable tool.
For instance, numerous modules could be introduced into a single organism at
General discussion
166
neutral sites where deletion or interruption has no phenotypic affect. BioBricks
of flanking sequences for homologous recombination to a neutral site in an
annotated open reading frame with no known function (slr0168) have already
been developed for PCC 6803 (BBa_K142000 and BBa_K142001). Alternatively,
genes encoding key metabolic enzymes may serve as landing pads for
simultaneous redirection of metabolic flux and introduction of heterologous
modules.
7.1.3 Speeding up part assembly
Arguments can be made against the selection of the BioBrick design as it relies
on classical cloning techniques, which are limited by the restriction sites
available for assembly, and the number of components that can be
simultaneously assembled, namely two. Indeed, it is essential to adopt next-
generation cloning technologies, which enable high precision, rapid assembly of
multiple components in single reactions. Paired with software tools to design
plasmid vectors, this will drastically reduce time and effort required to generate
complex expression systems. Golden Gate cloning is a particularly attractive
method which utilizes Type IIS restriction enzymes to cut DNA outside of their
recognition sites enabling scarless fusion when necessary (Weber et al., 2011). A
Golden Gate cloning toolbox has recently been developed plants (Engler et al.,
2014), however since its introduction, Golden Gate cloning has failed to replace
BioBrick assembly as the favoured approach by the synthetic biology community
(Kahl and Endy, 2013). Despite its drawbacks, the plasmid developed in this work
single-handedly opens up an enormous catalog of molecular tools for the
bioengineering of PCC 7002, notably protein domains and coding sequences of
diverse function such as biosynthesis, post-translational modification and
membrane transport.
General discussion
167
7.1.4 Designing ribosome binding sites to enhance product
synthesis
Currently available parts may require some optimisation to improve efficiency in
PCC 7002 such as enhancing translation initiation via the ribosome binding site
(RBS). A number of in silico translation rate calculators have been developed in
recent years and I have validated the utility of the Salis Lab RBS Calculator for
PCC 7002. This calculator, although not perfect, is a reasonably accurate tool to
reverse engineer RBSs of defined translation initiation rates in this chassis. It
enabled the generation of a library of synthetic ribosome binding sites to drive a
range of translation rates for GFP. Not only can this library be used to detect a
wide range of transcriptional activity, but it can also be a valuable tool to verify
successful integration of modules to novel landing pads or assess the effects of
DNA topology on gene transcription. The Salis Lab RBS Calculator did have its
inaccuracies, however, as gene product formation did not always agree with
predicted translation initiation rates. Other RBS calculators have been developed
and could prove more accurate for this cyanobacterium. Nevertheless, RBS
efficiency is highly context (i.e. sequence) dependent so synthetic RBSs would
need to be designed and verified for each construct. In summary, RBS calculators
are useful tools to optimise gene production formation, but they are not ideal
features with which to modulate gene expression levels.
7.1.5 Promoter design and characterisation
Promoters are robust regulators of gene expression and therefore ideal
components for regulating processes in biological systems. Furthermore, the
transcriptional activity of promoters is easily characterised using assays such as
the one I have developed thus enhancing the predictability of the function of
multipart modules. Few characterised promoters are known to regulate gene
expression in PCC 7002. One such promoter is PcpcBA of PCC 6803, which has been
described as a “super strong” regulator in PCC 7002 (Xu et al., 2011, Zhou et al.,
2014). This promoter was selected to optimize the promoter assay. Variable
reporter signal under the control of PcpcBA and subsequent in silico RBS analysis
identified undesirable translation initiation from the 3’ end of the promoter
General discussion
168
sequence. I therefore optimised this promoter by removing the 3’ start codon
and further introducing flanking BioBrick restriction sites to generate PcpcBA2. This
was important to prevent a) translation initiation from a part intended to
regulate transcriptional activation thus enhancing the prediction of multipart
module function, b) aberrant protein formation and c) waste of cellular
resources. However, some promoters do contain essential DNA elements
downstream of the transcriptional start site. For instance, the secA promoter of
PCC 6803 contains two important regulatory elements located within the secA
protein coding sequence required to maintain its light-regulated expression
(Mazouni et al., 1998). While promoters containing transcriptional start sites are
not ideal, aberrant protein formation can be avoided by introducing a stop codon
between the promoter and RBS sequences. Assessment of PcpcBA2 in PCC 7002
revealed high activity during early growth followed by a decline during late
growth. This promoter is therefore not ideal for regulating processes requiring
large amounts of biomass. Nevertheless, the pattern of activity observed in the
heterologous reporter system reproduced native transcriptional activity in the
freshwater cyanobacterium Synechocystis spp. PCC 6803. The promoter assay is
therefore a valuable new tool for the characterization of promoters in PCC 7002.
Furthermore, activity of a Synechocystis promoter in Synechococcus is promising
as the use of heterologous promoters could reduce the risk of crosstalk with the
native transcriptional system of this cyanobacterium.
7.2 Identification of late growth-specific promoters
7.2.1 Establishing conditions to study the transition from
exponential to stationary phase
To identify robust late growth-specific promoters from PCC 6803, growth
conditions had to be established in order to interrogate changes in gene
expression across a range of backgrounds where cultures have entered stationary
phase for different reasons. A controlled system was established for growth of
PCC 6803 that is easily reproducible in other laboratories. There are, however,
potential sources of variation between laboratories and setups that may affect
General discussion
169
exponential growth rates. Firstly, ambient air exposure may vary subtly between
different settings and airflow may vary depending on the aquarium pump. Gas
tanks of defined composition fitted with airflow regulators will ensure more
reproducible growth across laboratories. Secondly, light intensity experienced by
cultures could not be determined due to the experimental set up in water baths.
Alternatively, the use of temperature-controlled chambers can allow for direct
measurement of light intensity. Despite these limitations, the established growth
system allowed reproducible growth of PCC 6803.
Five nutrients were identified which specifically limited growth: nitrate (N),
phosphate (P), sulphate (S), magnesium (Mg) and potassium (K). Notably, this is
the first report of growth inhibition in response to limited Mg and K supplies in
PCC 6803. Given that these nutrients constitute essential components for
biomolecules, turgor pressure and the regulation of cell division, it is expected
that these conditions will similarly limit growth in other species of
cyanobacteria, but this will need to be confirmed. I selected a nutrient
concentration that limited culture growth while still generating enough cell
material for analysis. Ideally, growth should be characterised for a range of
concentrations and varying combinations of limiting nutrients. However, the
chosen growth conditions were sufficient to identify late growth-phase regulated
genes. Instead, including additional conditions would increase confident in the
robustness of responses observed and the regulators involved. For instance,
growth under variable light intensity and carbon availability as well as
heterotrophic conditions should be assessed. The effects of other mineral
nutrients such as calcium (Ca) and iron (Fe) could also be assessed.
7.2.2 Enhancing resolution of transcript analysis to identify
robust gene expression profiles
Comparison of transcript levels at regular intervals throughout growth enabled
the generation of high-resolution expression profiles of individual genes. Genes
following growth phase-specific expression patterns were selected from
published microarray studies and transcript levels were measured by
quantitative RT-PCR (qPCR). Growth phase-specific expression profiles were
General discussion
170
typically reproducible under standard nutrient conditions. However, standard
nutrient profiles were often distorted under double nutrient-limited conditions.
These findings highlighted the importance of assessing expression profiles under
a range of conditions. One gene, slr9003, showed a relatively robust growth
phase-specific expression pattern across the three conditions tested.
Nevertheless, the promoter of this gene was not an ideal candidate to activate
late growth-specific expression since a) some induction in gene expression was
observed during early growth and b) elevated transcript levels were not always
maintained during late growth. Thus, substantial optimisation would be required
to silence the promoter under non-induced conditions (early growth) and to
maintain activity during induced conditions (late growth).
Sigma factors implicated in the regulation of growth phase-specific gene
expression were assessed as potential markers for entry into stationary phase
growth. qPCR analysis of cultures grown under standard nutrient conditions
revealed highly variable, oscillating patterns despite numerous reports of late
exponential and stationary phase induction. Previous studies compared
expression levels across three time points representing early to mid-exponential,
late exponential and stationary phase growth. By contrast, I compared
expression levels across ten time points spanning culture growth. The enhanced
resolution of my analysis revealed fluctuations of gene expression over time and
thus tested robust growth phase-specific gene expression more stringently. The
oscillations in transcript levels suggests post-transcriptional mechanisms to
regulate sigma factor function, so these genes are not suitable indicators of
growth phase in PCC 6803.
7.2.3 Identifying novel growth phase-specific genes
Comparison between early and late time points across the established conditions
provided an opportunity to identify genes with growth phase-specific responses
independent of the actual growth conditions. Following RNA sequencing, a large
number of co-regulated genes were identified. In agreement with the general
observation that stationary phase cultures enter a “standby” metabolic mode,
the most prominent response was the down-regulation of photosynthesis,
General discussion
171
respiration and translation during the late exponential phase across all
conditions. By contrast, the majority of genes up-regulated during this phase
encode uncharacterised proteins suggesting a great number of physiological
functions relating to stationary phase growth and survival which remain to be
unravelled. Interestingly, a number of genes involved in two-component signal
transduction systems were also up-regulated during the late exponential phase
across all conditions. These genes may encode important regulators of gene
expression during stationary phase growth, suggesting the presence of specific
DNA motifs in the promoters of genes induced during this phase. To enhance
motif discovery, genes were subdivided into clusters of similar expression
profiles. Furthermore, a background list of expressed genes was defined to
provide a relevant reference to which the upstream regions of these gene
clusters should be compared.
With the ultimate aim of identifying growth phase-specific promoters, I focused
my analysis on genes, which were consistently up- or down-regulated across all
of the conditions. Many additional analyses can and should be performed on this
large dataset to identify genes with other interesting expression patterns. For
instance, genes could be identified that respond to specific nutrient limitations
that have not been investigated before, namely K and Mg limitation.
Furthermore, the data can be mined to identify nutrient-specific as well as
general changes in metabolism during late exponential phase. However, these
questions were outwith the scope of this project. For the identification of
growth phase-specific genes and promoters, it would be useful to analyse
additional time points, particularly during the stationary phase, to increase
confidence in growth phase-specific expression patterns and confirm maintained
activation during the stationary phase. In the absence of these additional time
points, it is essential to analyse the expression profiles of selected genes using
the qPCR approach discussed in the previous section. This will both validate the
RNA sequencing results and confirm growth phase-specific expression profiles for
individual genes.
General discussion
172
7.2.4 RNA sequencing versus microarray analysis
Shortly after the genome sequence of PCC 6803 was made available in 1996, a
microarray platform, denoted cyanoCHIP, was commercialised by Takara Bio Inc.
(Kaneko et al., 1996). This powerful tool provided a comprehensive view of
transcriptional activity and more than 700 microarray experiments have since
provided valuable information on gene regulation across numerous
environmental conditions and genetic backgrounds in this organism (Hernández-
Prieto et al., 2014). Microarray expression analyses are based on the
hybridisation of cDNA to probes immobilised on a solid surface. Originally,
probes consisted of double stranded PCR fragments of C-terminal 1 kilobase
protein coding genes (Hirani et al., 2001). This has the distinct disadvantage of
requiring prior knowledge of gene and transcript sequences and importantly does
not differentiate between sense and anti-sense RNAs. By contrast, next
generation sequencing of RNA (RNAseq) enables unbiased strand-specific
transcript detection. Expression profiling using RNAseq has revealed the
existence of non-protein coding transcripts (ncRNAs) occurring outside of protein
coding genes which could not be detected in microarrays. Surprisingly, ncRNAs
make up a substantial part of the transcriptome, in particular antisense RNAs,
and account for nearly two thirds of the transcriptome of PCC 6803 grown under
standard conditions (Mitschke et al., 2011). Additionally, RNAseq enables the
determination of transcription unit architecture, notably transcriptional start
sites, which are invaluable for promoter analyses such as the one intended for
this study. Thus, RNAseq was the most appropriate method to sample the
transcriptome of PCC 6803 in this study.
7.2.5 Gene expression levels in single cells versus bulk cell
populations
Gene expression is an intrinsically stochastic process arising from random
biomolecular interactions. As a result, gene expression levels can vary drastically
between individual cells within an isogenic population and thus affect the
chances of survival under stress conditions (Raj and van Oudenaarden, 2008).
Indeed, a recent RNAseq study demonstrated that variation in single cell gene
General discussion
173
expression levels increases over time following nitrogen starvation in PCC 6803
(Wang et al., 2015). Given that my RNAseq study has focused on the responses of
bulk cell populations to stress under different nutrient conditions over time, it is
expected that individual cells within these samples may show different
transcript profiles. The purpose of my study was to identify genes that
reproducibly respond to changes in growth phase, however. It is known that
variation in gene expression levels decreases as cell population size increases,
particularly for lowly expressed genes (Piras and Selvarajoo, 2015). It was
therefore appropriate to assess average expression levels across a large
population, as opposed to individual cells, in order to identify robust candidate
promoters.
7.2.6 The importance of silencing during non-induced conditions
Inducible promoters are extremely useful tools for industrial applications due to
two key characteristics. Firstly, efficient silencing during non-induced conditions
prevents undesirable interactions with other stages within the process. Secondly,
robust activation in response to a specific stimulus enables precise timing of
each stage in a multi-step process. While a library of promoters spanning a wide
range of transcriptional activation would be ideal for metabolic engineering, it is
not a necessity. For instance, weak promoters can be used to drive high
expression when present in high copy numbers or combined with strong ribosome
binding sites and stable gene products. Promoters with high transcriptional
activity under induced conditions are therefore not essential for successful
engineering. By contrast, efficient silencing during non-induced conditions is
vadtly more important. Leaky expression results in misallocation of precious
cellular resources and potential undesirable interactions. In the case of
stationary phase-specific gene expression, inefficient silencing during
exponential phase can result in trade-offs between biomass production and
product biosynthesis and therefore negative effects on growth rates, amount of
biomass and final product titres. Thus, absence of expression during the
exponential phase is more important than high expression in stationary phase for
a growth phase-regulated manufacturing platform.
General discussion
174
7.2.7 Future work: Motif discovery and promoter identification
I identified a large number of genes with potential function as transcription
factors during late exponential growth of cyanobacterial cultures. This suggests
the presence of promoters that are specifically recognized by these factors.
Motif discovery algorithms such as SeAMotE (Agostini et al., 2014) should be
applied to identify specific motifs overrepresented in the upstream regions of
the co-regulated gene clusters as compared with the background set of
expressed genes. For this purpose, it is necessary to optimise the length of the
sequence as well as the position relative to the transcriptional start site (TSS).
Sequence length is important as sequences that are too long may generate false
positives whereas sequences which are too short may not identify any motifs at
all. Initially, upstream regions of differing lengths (300, 600 and 1000 base pairs)
have been extracted and are currently being analysed. While promoter elements
typically occur upstream of the TSS, they may also occur within the gene itself
such as the light-inducible secA promoter described in Section 7.1.5 (Mazouni et
al., 1998). It may therefore be necessary to include sequences extending into
the protein coding sequence. Furthermore, the defined gene clusters may
require further refinement to exclude genes co-transcribed as polycistronic
mRNA molecules from a single promoter.
Upon successful identification of overrepresented motifs, it will be necessary to
characterise promoters containing these motifs in vivo. Naturally occurring
promoters containing these motifs should be assessed first. In this case,
promoters from PCC 6803 should be cloned upstream of RBS9-GFP in the pAQ1BB
vector to ensure detection of transcriptional activity. As in the case of motif
discovery, promoter length will again need to be optimised for the promoter
assay to ensure the maintenance of growth phase-specific activation. Once a
suitable length has been determined, classical promoter analyses can be
performed to determine the minimum sequence required to maintain this
activation pattern. Furthermore, essential elements and spacing between
elements can be determined and optimised. This can inform the design of
synthetic promoters, which may reduce the risk of crosstalk with native
transcriptional systems.
General discussion
175
The promoter assay in this study was established for PCC 7002. By contrast, the
genes following growth phase-specific expression patterns were identified in PCC
6803. There is a risk that promoters identified from PCC 6803 may not function
in a heterologous system, let alone maintain growth phase-specific activation
patterns. If this is the case, activity of growth phase-specific promoters will
need to be verified and characterised in PCC 6803 using appropriate vector
backbones and can still serve as useful tools for the bioengineering of PCC 6803.
I have however shown that the growth phase-specific activity of a promoter from
PCC 6803 was maintained in PCC 7002. This promoter drives the expression of a
photosynthesis-related gene involved in a process commonly down-regulated in
response to multiple stresses across cyanobacteria and may be regulated by a
factor common across bacteria. Similarly, transition to stationary phase growth
is a common response to growth limitation in cyanobacteria. It is therefore
possible that common factors are involved in regulating transcription during this
phase and that growth phase-specific promoter identified in one species of
cyanobacteria may prove useful tools in other species.
7.3 A proposed design for a cyanobacterial cell factory
The marked down-regulation of photosynthesis and ATP synthesis-related genes
in high density cultures of cyanobacteria indicates that light may not be a
suitable energy source in late exponential phase. Many species of cyanobacteria
are capable of switching between photoautotrophic and heterotrophic growth
(Rippka et al., 1979), so a system can be conceived in which the biomass is
generated during a photoautotrophic growth phase whereas product synthesis is
carried out in a subsequent heterotrophic phase as proposed in Figure 7-1. While
photosynthesis may not be a suitable driver during the production phase, it is
still highly advantageous during the growth phase as it minimises inputs and thus
costs required to generate large amounts of biomass compared with fully
heterotrophic systems. Growth phase-specific promoters can complement this
system by activating the engineered process once the biomass has been
achieved. Furthermore, timing the switch to heterotrophic production can
potentially be controlled by modulating potassium (K) supplies. Implementing
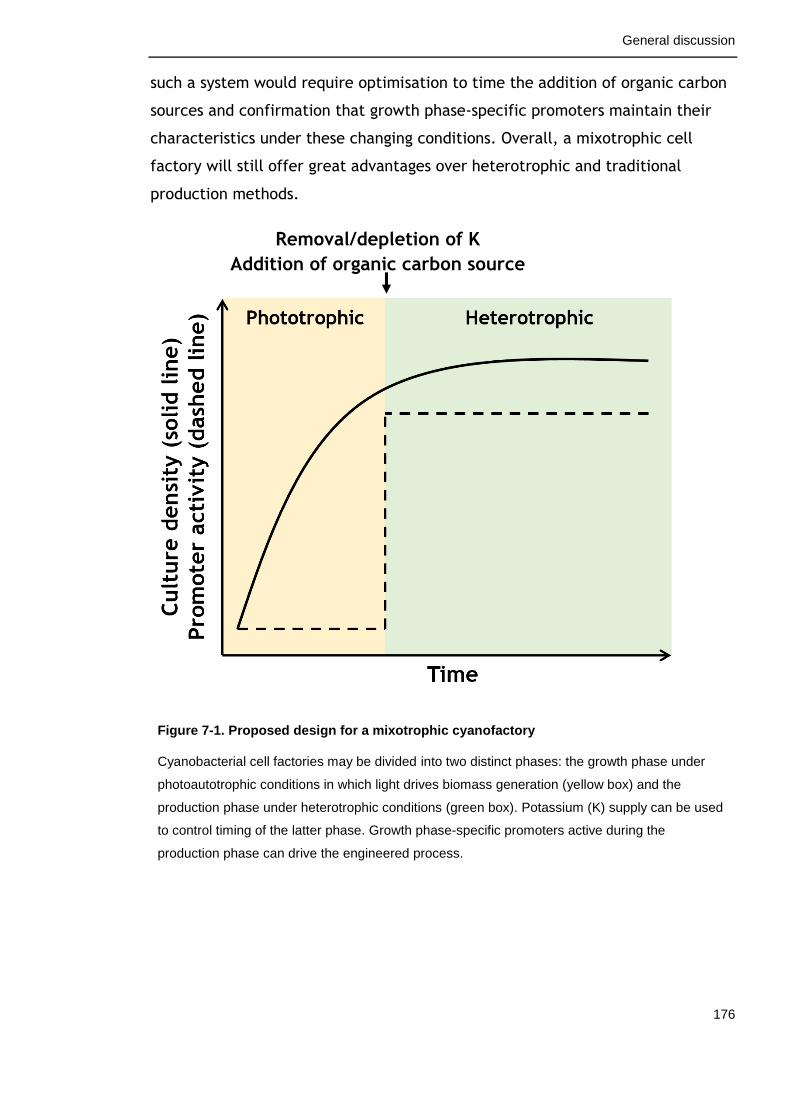
General discussion
176
such a system would require optimisation to time the addition of organic carbon
sources and confirmation that growth phase-specific promoters maintain their
characteristics under these changing conditions. Overall, a mixotrophic cell
factory will still offer great advantages over heterotrophic and traditional
production methods.
Removal/depletion of K
Addition of organic carbon source
Figure 7-1. Proposed design for a mixotrophic cyanofactory
Cyanobacterial cell factories may be divided into two distinct phases: the growth phase under
photoautotrophic conditions in which light drives biomass generation (yellow box) and the
production phase under heterotrophic conditions (green box). Potassium (K) supply can be used
to control timing of the latter phase. Growth phase-specific promoters active during the
production phase can drive the engineered process.
General discussion
177
7.4 Process selection and design
Once a cell factory system has been established, a process must be selected,
designed, implemented and optimised. At this stage, computation modelling is
an important tool to rapidly test possible modifications and assess their effects
on metabolism and thus product synthesis. There is a wealth of experimental
data available for the freshwater model cyanobacterium PCC 6803. However, it
can be difficult to integrate information from studies performed under differing
conditions using differing techniques. In this current age of “big data” in which
large amounts of information are continuously generated by ‘omics studies,
normalization strategies are rapidly developing. Biologists are teaming up with
programmers to develop more advanced and sophisticated software. Indeed,
comprehensive metabolic models have been developed for PCC 6803 and inform
novel compound discovery, identification of bottlenecks in engineered pathways
and knockout strategies to enhance production of desired metabolites (Knoop et
al., 2013, Nogales et al., 2014, Maarleveld et al., 2014). While this study
investigated global changes in the transcriptome, it spans a large number of
conditions and can give indications of changes in metabolism and thus flux
arising from changes in growth as well as under specific nutrient limitations. For
instance, up-regulation of genes involved in hydrogenase biosynthesis indicate a
propensity for hydrogen energy production during high-density growth. Closer
examination of the dataset may highlight many other processes as promising
candidates under any or all of the conditions examined in this study.
Furthermore, this dataset can be mined to inform media composition to enhance
flux towards desired processes. Countless other conditions can be examined and
every few months a new transcriptome is revealed under yet another condition.
While extensive work is still required to validate metabolic models, integration
of this dataset into existing models will enhance a fundamental tool for the
engineering of cyanofactories.
General discussion
178
7.5 Outlook
Like most of my fellow PhD candidates, I had to finish my project with many
open ends, most notably the identification of growth phase-specific motifs and
promoters. This work does, however, lay a solid foundation to enable the
identification and characterization of these auto-inducible regulators that have
great potential for a huge diversity of applications in cyanobacteria. They can
serve as genetic switches to activate the degradation of toxic pollutants,
extraction of valuable chemicals from wastewater and production of a wide
array of valuable compounds for medicine, nutrition and energy. Furthermore,
this work also provides a goldmine to data to inform the rational design of
cyanobacteria.
More generally, the rational design of biological organisms using synthetic
biology approaches shows great promise to enhance biological engineering.
Standardised biological parts are abundant and diverse. Part characterisation is
an ongoing project across different organisms and conditions. Computational
models are being developed, refined and validated. Indeed, this discipline is still
in its infancy and the wider community needs to come to a consensus on
standardised approaches such as next-generation assembly methods. However, a
concerted effort is underway to establish and validate this booming field. Given
the rate at which synthetic biology has advanced in the last decade, there is
hope to replace the global demand for fossil fuels before their limited supplies
are exhausted with technologies that leave smaller, and maybe even positive,
footprints behind.
REFERENCES
179
REFERENCES
Abed, R. M., Dobretsov, S. & Sudesh, K. 2009. Applications of cyanobacteria in biotechnology. Journal of Applied Microbiology, 106, 1-12.
Agostini, F., Cirillo, D., Ponti, R. D. & Tartaglia, G. G. 2014. SeAMotE: a method for high-throughput motif discovery in nucleic acid sequences. BMC Genomics, 15, 925.
Aikawa, S., Nishida, A., Ho, S. H., Chang, J. S., Hasunuma, T. & Kondo, A. 2014. Glycogen production for biofuels by the euryhaline cyanobacteria Synechococcus sp. strain PCC 7002 from an oceanic environment. Biotechnology for Biofuels, 7, 88.
Alahari, A. & Apte, S. K. 1998. Pleitropic effects of potassim deficiency in a heterocystous, nitrogen-fixing cyanobacterium, Anabaena torulosa. Microbiology, 144, 1557-1563.
Amann, E., Ochs, B. & Abel, K. J. 1988. Tightly regulated tac promoter vectors useful for the expression of unfused and fused proteins in Escherichia coli. Gene, 69, 301-315.
Amezaga, J., Amtmann, A., Biggs, C. A., Bond, T., Gandy, C. J., Honsbein, A., Karunakaran, E., Lawton, L., Madsen, M. A., Minas, K. & Templeton, M. R. 2014. Biodesalination: A case study for applications of photosynthetic bacteria in water treatment. Plant Physiology, 164, 1661-1676.
An, W. & Chin, J. W. 2011. Orthogonal gene expression in Escherichia coli. Methods in Enzymology, 497, 115-134.
Angermayr, S. A. & Hellingwerf, K. J. 2013. On the use of metabolic control analysis in the optimization of cyanobacterial biosolar cell factories. Journal of Physical Chemistry B, 117, 11169-11175.
Appel, H. M. 1993. Phenolics in ecological interactions: The importance of oxidation. Journal of Chemical Ecology, 19, 1521-1552.
Appel, J., Phunpruch, S., Steinmüller, K. & Schulz, R. 2000. The bidirectional hydrogenase of Synechocystis sp. PCC 6803 works as an electron valve during photosynthesis. Archives in Microbiology, 173, 333-338.
Asayama, M. & Imamura, S. 2008. Stringent promoter recognition and autoregulation by the group 3 sigma-factor SigF in the cyanobacterium Synechocystis sp. strain PCC 6803. Nucleic Acids Research, 36, 5297-5305.
Asayama, M., Imamura, S., Yoshihara, S., Miyazaki, A., Yoshida, N., Sazuka, T., Kaneko, T., Ohara, O., Tabata, S., Osanai, T., Tanaka, K., Takahashi, H. & Shirai, M. 2004. SigC, the group 2 sigma factor of RNA polymerase, contributes to the late-stage gene expression and nitrogen promoter recognition in the cyanobacterium Synechocystis sp. strain PCC 6803. Bioscience Biotechnology and Biochemistry, 68, 477-487.
Balleza, E., López-Bojorquez, L. N., Martínez-Antonio, A., Resendis-Antonio, R., Lozada-Chávez, I., Balderas-Martínez, Y. I., Encarnación, S. & Collado-
REFERENCES
180
Vides, J. 2009. Regulation by transcription factors in bacteria: beyond description. FEMS Microbiology Reviews, 33, 133-151.
Barber, J., Mills, J. & Nicolson, J. 1974. Studies with cation specific ionophores show that within the intact chloroplast Mg++ acts as the main exchange cation for H+ pumping. FEBS Letters, 49, 106-110.
Barten, R. & Lill, H. 1995. DNA-uptake in the naturally competent cyanobacterium, Synechocystis sp. PCC 6803. FEMS Microbiology Letters, 129, 83-87.
Batterton, J. C. J. & Van Baalen, C. 1971. Growth responses of blue-green algae to sodium chloride concentration. Archiv für Mikrobiologie, 76, 151-165.
Begemann, M. B., Zess, E. K., Walters, E. M., Schmitt, E. F., Markley, A. L. & Pfleger, B. F. 2013. An organic acid based counter selection system for cyanobacteria. PLOS ONE, 8, e76594.
Berla, B. M. & Pakrasi, H. B. 2012. Upregulation of plasmid genes during stationary phase in Synechocystis sp. strain PCC 6803, a cyanobacterium. Applied and Environmental Microbiology, 78, 5448-5451.
Berla, B. M., Saha, R., Immethun, C. M., Maranas, C. D., Moon, T. S. & Pakrasi, H. B. 2013. Synthetic biology of cyanobacteria: unique challenges and opportunities. Frontiers in Microbiology, 4, 246.
Bertram, R. & Hillen, W. 2008. The application of Tet repressor in prokaryotic gene regulation and expression. Microbial Biotechnology, 1, 2-16.
Blankenship, R. E., Tiede, D. M., Barber, J., Brudvig, G. W., Fleming, G., Ghirardi, M., Gunner, M. R., Junge, W., Kramer, D. M., Melis, A., Moore, T. A., Moser, C. C., Nocera, D. G., Nozik, A. J., Ort, D. R., Parson, W. W., Prince, R. C. & Sayre, R. T. 2011. Comparing photosynthetic and photovoltaic efficiencies and recognizing the potential for improvement. Science, 332, 805-809.
Blasi, B. 2012. Characterization of Stress Responses of Heavy Metal and Metalloid Inducible Promoters in Synechocystis PCC6803. Journal of Microbiology and Biotechnology, 22, 166-169.
Blatter, E. E., Ross, W., Tang, H., Gourse, R. L. & Ebright, R. H. 1994. Domain organization of RNA polymerase alpha subunit: C-terminal 85 amino acids constitute a domain capable of dimerization and DNA binding. Cell, 78, 889-896.
Boyanapalli, R., Bullerjahn, G. S., Pohl, C., Croot, P. L., Boyd, P. W. & Mckay, R. M. 2007. Luminescent whole-cell cyanobacterial bioreporter for measuring Fe availability in diverse marine environments. Applied and Environmental Microbiology, 73, 1019-1024.
Browning, D. F. & Busby, S. J. 2004. The regulation of bacterial transcription initiation. Nature Reviews Microbiology, 2, 57-65.
Bruns, B. U., Briggs, W. R. & Grossman, A. R. 1989. Molecular characterization of phycobilisome regulatory mutants of Fremyella diplosiphon. Journal of Bacteriology, 171, 901-908.
REFERENCES
181
Burnap, R. L., Troyan, T. & Sherman, L. A. 1993. The highly abundant chlorophyll-protein complex of iron-deficient Synechococcus sp. PCC7942 (CP43') is encoded by the isiA gene. Plant Physiology, 103, 893-902.
Burut-Archanai, S., Incharoensakdi, A. & Eaton-Rye, J. J. 2009. The extended N-terminal region of SphS is required for detection of external phosphate levels in Synechocystis sp. PCC 6803. Biochemical and Biophysical Research Communications, 378, 383-388.
Busby, S. & Ebright, R. H. 1999. Transcription activation by catabolite activator protein (CAP). Journal of Molecular Biology, 293, 199-213.
Cairns, L. S., Martyn, J. E., Bromley, K. & Stanley-Wall, N. R. 2015. An alternate route to phosphorylating DegU of Bacillus subtilis using acetyl phosphate. BMC Microbiology, 15, 78-90.
Camsund, D., Heidorn, T. & Lindblad, P. 2014. Design and analysis of LacI-repressed promoters and DNA-looping in a cyanobacterium. Journal of Biological Engineering, 8, 4.
Camsund, D. & Lindblad, P. 2014. Engineered transcriptional systems for cyanobacterial biotechnology. Frontiers in Bioengineering and Biotechnology, 2, 40.
Cann, M. J. 2004. Signalling through cyclic nucleotide monophosphates in cyanobacteria. New Phytologist, 161, 23-34.
Carvalho, L. R., Costa-Neves, A., Conserva, G. A. A., Brunetti, R. L., Hentschke, G. S., Malone, C. F. S., Torres, L. M. B., Sant’Anna, C. L. & Rangel, M. 2013. Biologically active compounds from cyanobacteria extracts: In vivo and in vitro aspects. Brazilian Journal of Parmacognosy, 23, 3, 471-480.
Cases, I., De Lorenzo, V. & Pérez-Martín, J. 1996. Involvement of sigma 54 in exponential silencing of the Pseudomonas putida TOL plasmid Pu promoter. Molecular Microbiology, 19, 7-17.
Chappell, J., Jensen, K. & Freemont, P. S. 2013. Validation of an entirely in vitro approach for rapid prototyping of DNA regulatory elements for synthetic biology. Nucleic Acids Research, 41, 3471-3481.
Cohen, Y., Jørgensen, B. B., Revsbech, N. P. & Poplawski, R. 1986. Adaptation to hydrogen sulfide of oxygenic and anoxygenic photosynthesis among cyanobacteria. Applied and Environmental Microbiology, 51, 398-407.
Colloms, S. D., Merrick, C. A., Olorunniji, F. J., Stark, W. M., Smith, M. C., Osbourn, A., Keasling, J. D. & Rosser, S. J. 2014. Rapid metabolic pathway assembly and modification using serine integrase site-specific recombination. Nucleic Acids Research, 42, e23.
Cooley, J. W. & Vermaas, W. F. 2001. Succinate dehydrogenase and other respiratory pathways in thylakoid membranes of Synechocystis sp. strain PCC 6803: Capacity comparisons and physiological function. Journal of Bacteriology, 183, 4251-4281.
Crabtree, G. W. & Lewis, N. S. 2007. Solar energy conversion. Physics Today, 60, 37-42.
REFERENCES
182
Del Solar, G. & Espinosa, M. 2000. Plasmid copy number control: an ever-growing story. Molecular Microbiology, 37, 492-500.
Dheda, K., Huggett, J. F., Bustin, S. A., Johnson, M. A., Rook, G. & Zumla, A. 2004. Validation of housekeeping genes for normalizing RNA expression in real-time PCR. Biotechniques, 37, 112-4, 116, 118-119.
Dienst, D., Georg, J., Abts, T., Jakorew, L., Kuchmina, E., Börner, T., Wilde, A., Dühring, U., Enke, H. & Hess, W. R. 2014. Transcriptomic response to prolonged ethanol production in the cyanobacterium Synechocystis sp. PCC6803. Biotechnology and Bioengineering, 7, 21.
Dorman, C. J. 1996. Flexible response: DNA supercoiling, transcription and bacterial adaptation to environmental stress. Trends in Microbiology, 4, 214-216.
Ducat, D. C., Way, J. C. & Silver, P. A. 2011. Engineering cyanobacteria to generate high-value products. Trends in Biotechnology, 29, 95-103.
Ellis, T., Wang, X. & Collins, J. J. 2009. Diversity-based, model-guided construction of synthetic gene networks with predicted functions. Nature Biotechnology, 27, 465-471.
Endy, D. 2005. Foundations for engineering biology. Nature, 438, 449-453.
Engelbrecht, F., Marin, K. & Hagemann, M. 1999. Expression of the ggpS gene, involved in osmolyte synthesis in the marine cyanobacterium Synechococcus sp. strain PCC 7002, revealed regulatory differences between this strain and the freshwater strain Synechocystis sp. strain PCC 6803. Applied and Environmental Microbiology, 65, 11, 4822-4829.
Engler, C., Youles, M., Gruetzner, R., Ehnert, T., Werner, S., Jones, J. D. G., Patron, N. J. & Marillonnet, S. 2014. A Golden Gate modular cloning toolbox for plants. ACS Synthetic Biology, 3, 839-843.
Epstein, W. 2003. The roles and regulation of potassium in bacteria. Progress in Nucliec Acid Research and Molecular Biology, 75, 293-320.
Eriksson, J., Salih, G. F., Ghebramedhin, H. & Jansson, C. 2000. Deletion mutagenesis of the 5' psbA2 region in Synechocystis 6803: Identification of a putative cis element involved in photoregulation. Molecular Cell Biology Research Communications, 3, 292-298.
Essich, E., Stevens, S. E. J. & Porter, R. D. 1990. Chromosomal transformation in the cyanobacterium Agmenellum quadruplicatum. Journal of Bacteriology, 172, 1916-1922.
Federici, F., Rudge, T. J., Pollak, B., Haseloff, J. & Gutiérrez, R. A. 2013. Synthetic Biology: Opportunities for Chilean bioindustry and education. Biological Research, 46, 383-393.
Formighieri, C. & Melis, A. 2014a. Carbon partitioning to the terpenoid biosynthetic pathway enables heterologous β-phellandrene production in Escherichia coli cultures. Archives of Microbiology, 196, 853-861.
Formighieri, C. & Melis, A. 2014b. Regulation of β-phellandrene synthase gene expression, recombinant protein accumulation, and monoterpene hydrocarbons production in Synechocystis transformants. Planta, 240.
REFERENCES
183
Foster, J. S., Singh, A. K., Rothschild, L. J. & Sherman, L. A. 2007. Growth-phase dependent differential gene expression in Synechocystis sp. strain PCC 6803 and regulation by a group 2 sigma factor. Archives in Microbiology, 187, 265-279.
Francko, D. & Wetzel, R. 1981. Dynamics of cellular and extracellular cAMP in Anabaena fos-aquae (cyanophyta): Intrinsic culture variability and correlation with metabolic variables. Journal of Phycology, 17, 129-134.
Frigaard, N. U., Sakuragi, Y. & Bryant, D. A. 2004. Gene inactivation in the cyanobacterium Synechococcus sp. PCC 7002 and the green sulfur bacterium Chlorobium tepidum using in vitro-made DNA constructs and natural transformation. Methods in Molecular Biology, 274, 325-340.
Fuszard, M. A., Ow, S. Y., Gan, C. S., Noirel, J., Ternan, N. G., Mcmullan, G., Biggs, C. A., Reardon, K. F. & Wright, P. C. 2013. The quantitative proteomic response of Synechocystis sp. PCC6803 to phosphate acclimation. Aquatatic Biosystems, 9, 5.
Gao, X., Gao, F., Liu, D., Zhang, H., Nie, X. & Yang, C. 2016. Engineering the methylerythritol phosphate pathway in cyanobacteria for photosynthetic isoprene production from CO2. Energy & Environmental Science, Advance article.
Garcia Véscovi, E., Soncini, F. C. & Groisman, E. A. 1996. Mg2+ as an extracellular signal: environmental regulation of Salmonella virulence. Cell, 84, 165-174.
Gibson, D. G., Young, L., Chuang, R. Y., Venter, J. C., Hutchison, C. A., 3rd & Smith, H. O. 2009. Enzymatic assembly of DNA molecules up to several hundred kilobases. Nature Methods, 6, 343-345.
Gilbert, W. & Müller-Hill, B. 1966. Isolation of the lac repressor. Proceedings of the National Academy of Sciences, 56, 1891-1898.
Giraldez-Ruiz, N., Mateo, P., Bonilla, I. & Fernandez-Piñas, F. 1997. The relationship between intracellular pH, growth characteristics and calcium in the cyanobacterium Anabaena sp. strain PCC7120 explosed to low pH. New Phytologist, 137, 599-605.
Gray, J., Close, P. S., Briggs, S. P. & Johal, G. S. 1999. A novel suppressor of cell death in plants encoded by the Lls1 gene of maize. Cell, 89, 25-31.
Griese, M., Lange, C. & Soppa, J. 2011. Ploidy in cyanobacteria. FEMS Microbiology Lett, 323, 124-131.
Groisman, E. A., Hollands, K., Kriner, M. A., Lee, E. J., Park, S. Y. & Pontes, M. H. 2013. Bacterial Mg2+ homeostasis, transport, and virulence. Annual Review of Genetics, 47, 625-646.
Grossman, A. R., Schaefer, M. R., Chiang, G. G. & Collier, J. L. 1993. The phycobilisome, a light-harvesting complex responsive to environmental conditions. Microbiology Reviews, 57, 725-749.
Grossman, A. R., Schaefer, M. R., Chiang, G. G. & Collier, J. L. 1994. The responses of cyanobacteria to environmental conditions: Light and nutrients, The Netherlands, Kluwer Academic Publishers.
REFERENCES
184
Gruber, T. M. & Gross, C. A. 2003. Multiple sigma subunits and the partitioning of bacterial transcription space. Annual Review of Microbiology, 47, 441-466.
Grusak, M. A. 2001. Plant macro- and micronutrient minterals. Encyclopedia of Life Sciences. Chichester, England: John Wiley & Sons, Ltd.
Guedes, A. C., Barbosa, C. R., Amaro, H. M., Pereira, C. I. & Malcata, F. X. 2011. Microalgal and cyanobacterial cell extracts for use as natural antibacterial additives against food pathogens. International Journal of Food Science & Technology, 46, 4, 862-870.
Gulati, S., Rouilly, V., Niu, X., Chappell, J., Kitney, R. I., Edel, J. B., Freemont, P. S. & Demello, A. J. 2009. Opportunities for microfluidic technologies in synthetic biology. Journal of the Royal Society Interface, 6 Suppl 4, S493-506.
Hampsey, M. 2001. Omega meets its match. Trends in Genetics, 17, 190-191.
Hartley, J. L., Temple, G. F. & Brasch, M. A. 2000. DNA cloning using in vitro site-specific recombination. Genome Research, 10, 1788-1795.
Hase, R., Oikawa, H., Sasao, C., Morita, M. & Watanabe, Y. 2000. Photosynthetic production of microalgal biomass in a raceway system under greenhouse conditions in Sendai city. Journal of Bioscience and Bioengineering, 89, 157-163.
Heidorn, T., Camsund, D., Huang, H. H., Lindberg, P., Oliveira, P., Stensjo, K. & Lindblad, P. 2011. Synthetic biology in cyanobacteria engineering and analyzing novel functions. Methods in Enzymology, 497, 539-579.
Hengge-Aronis, R. 2002. Stationary phase gene regulation: what makes an Escherichia coli promoter sigmaS-selective? Current Opinion in Microbiology, 5, 591-595.
Hernández-Prieto, M. A., Semeniuk, T. A. & Futschik, M. E. 2014. Toward a systems-level understanding of gene regulatory, protein interaction, and metabolics network in cyanobacteria. Frontiers in Genetics, 5, 191.
Hirani, T. A., Suzuki, I., Murata, N., Hayashi, H. & Eaton-Rye, J. J. 2001. Characterization of a two-component signal transduction system involved in the induction of alkaline phosphatase under phosphate-limiting conditions in Synechocystis sp. PCC 6803. Plant Molecular Biology, 45, 133-144.
Hirokawa, Y., Suzuki, I. & Hanai, T. 2015. Optimization of isopropanol production by engineered cyanobacteria with a synthetic metabolic pathway. Journal of Bioscience and Bioengineering, 119, 5, 585-590.
Hoffmann, D., Gutekunst, K., Klissenbauer, M., Schulz-Friedrich, R. & Appel, J. 2006. Mutagenesis of hydrogenase accessory genes of Synechocystis sp. PCC 6803. Additional homologus of hypA and hypB are not active in hydrogenase maturation. FEBS Journal, 273, 4516-4527.
Howitt, C. A., Udall, P. K. & Vermaas, W. F. 1999. Type 2 NADH dehydrogenases in the cyanobacterium Synechocystis sp. strain PCC 6803 are involved in
REFERENCES
185
regulation rather than respiration. Journal of Bacteriology, 181, 3994-4003.
Huang, H. H., Camsund, D., Lindblad, P. & Heidorn, T. 2010. Design and characterization of molecular tools for a Synthetic Biology approach towards developing cyanobacterial biotechnology. Nucleic Acids Research, 38, 2577-2593.
Huang, H. H. & Lindblad, P. 2013. Wide-dynamic-range promoters engineered for cyanobacteria. Journal of Biological Engineering, 7, 10-20.
Huckauf, J., Nomura, C., Forchhammer, K. & Hagemann, M. 2000. Stress responses of Synechocystis sp. strain PCC 6803 mutants impaired in genes encoding putative alternative sigma factors. Microbiology, 146, 2877-2889.
Imamura, S. & Asayama, M. 2009. Sigma factors for cyanobacterial transcription. Gene Regulation and Systems Biology, 3, 65-87.
Imamura, S., Asayama, M., Takahashi, H., Tanaka, K., Takahashi, H. & Shirai, M. 2003a. Antagonistic dark/light-induced SigB/SigD, group 2 sigma factors, expression through redox potential and their roles in cyanobacteria. FEBS Letters, 554, 357-362.
Imamura, S., Tanaka, K., Shirai, M. & Asayama, M. 2006. Growth phase-dependent activation of nitrogen-related genes by a control network of group 1 and group 2 sigma factors in a cyanobacterium. The Journal of Biological Chemistry, 281, 2668-2675.
Imamura, S., Yoshihara, S., Nakano, S., Shiozaki, N., Yamada, A., Tanaka, K., Takahashi, H., Asayama, M. & Shirai, M. 2003b. Purification, characterization, and gene expression of all sigma factors of RNA polymerase in a cyanobacterium. Journal of Molecular Biology, 325, 857-872.
Imashimizu, M., Tanaka, K. & Shimamoto, N. 2011. Comparative study of cyanobacterial and E. coli RNA polymerases: Misincorporation, abortive transcription, and dependence on divalent cations. Genetics Research International, 2011, 572689.
Inaba, M., Suzuki, I., Szalontai, B., Kanesaki, Y., Los, D. A., Hayashi, H. & Murata, N. 2003. Gene-engineered rigidification of membrane lipids enhances the cold inducibility of gene expression in synechocystis. The Journal of Biological Chemistry, 278, 12191-12198.
Ishihama, A. 2000. Functional modulation of Escherichia coli RNA polymerase. Annual Review of Microbiology, 54.
Ivanikova, N. V., Mckay, R. M. & Bullerjahn, G. S. 2005. Construction and characterization of a cyanobacterial bioreporter capable of assessing nitrate assimilatory capacity in freshwaters. Limnology and Oceanography: Methods, 3, 86-93.
Jacobsen, J. H. & Frigaard, N. U. 2014. Engineering of photosynthetic mannitol biosynthesis from CO2 in a cyanobacterium. Metabolic Engineering, 21, 60-70.
REFERENCES
186
Jindou, S., Ito, Y., Mito, N., Uematsu, K., Hosoda, A. & Tamura, H. 2014. Engineered platform for bioethylene production by a cyanobacterium expressing a chimeric complex of plant enzymes. ACS Synthetic Biology, 3, 487-496.
Jishage, M. & Ishihama, A. 1995. Regulation of RNA polymerase sigma subunit synthesis in Escherichia coli: Intracellular levels of sigma 70 and sigma 38. Journal of Bacteriology, 177, 6832-6835.
Kahl, L. J. & Endy, D. 2013. A survey of enabling technologes in synthetic biology. Journal of Biological Engineering, 7, 13.
Kahlon, S., Beeri, K., Ohkawa, H., Hihara, Y., Murik, O., Suzuki, I., Ogawa, T. & Kaplan, A. 2006. A putative sensor kinase, Hik31, is involved in the response of Synechocystis sp. strain PCC 6803 to the presence of glucose. Microbiology, 152, 647-655.
Kaneko, T., Sato, S., Kotani, H., Tanaka, A., Asamizu, E., Nakamura, Y., Miyajima, N., Hirosawa, M., Sugiura, M., Sasamoto, S., Kimura, T., Hosouchi, T., Matsuno, A., Muraki, A., Nakazaki, N., Naruo, K., Okumura, S., Shimpo, S., Takeuchi, C., Wada, T., Watanabe, A., Yamada, M., Yasuda, M. & Tabata, S. 1996. Sequence analysis of the genome of the unicellular cyanobacterium Synechocystis sp. strain PCC6803. II. Sequence determination of the entire genome and assignment of potential protein-coding regions. DNA Research, 3, 109-136.
Kanesaki, Y., Yamamoto, H., Paithoonrangsarid, K., Shoumskaya, M., Suzuki, I., Hayashi, H. & Murata, N. 2007. Histidine kinases play important roles in the perception and signal transduction of hydrogen peroxide in the cyanobacterium, Synechocystis sp. PCC 6803. The Plant Journal, 49, 313-324.
Kaplan-Levy, R. N., Hadas, O., Summers, M. L., Rücker, J. & Sukenik, A. 2010. Akinetes: Dormant cells of cyanobacteria, Springer-Verlag Berlin Heidelberg.
Karnik, A., Karnik, R. & Grefen, C. 2013. SDM-Assist software to design site-directed mutagenesis primers introducing "silent" restriction sites. BMC Bioinformatics, 14, 105.
Kelly, J. R., Rubin, A. J., Davis, J. H., Ajo-Franklin, C. M., Cumbers, J., Czar, M. J., De Mora, K., Glieberman, A. L., Monie, D. D. & Endy, D. 2009. Measuring the activity of BioBrick promoters using an in vivo reference standard. Journal of Biological Engineering, 3, 4.
Kibbe, W. A. 2007. OligoCalc: an online oligonucleotide properties calculator. Nucleic Acids Research, 35, W43-46.
Kim, H. W., Vannela, R., Zhou, C. & Rittmann, B. E. 2011. Nutrient acquisition and limitation for the photoautotrophic growth of Synechocystis sp. PCC6803 as a renewable biomass source. Biotechnology and Bioengineering, 108, 277-285.
Kirilovsky, D. 2007. Photoprotection in cyanobacteria: The orange carotenoid protein (OCP)-related non-photochemical-quenching mechanism. Photosynthesis Research, 93, 7-16.
REFERENCES
187
Knight, T. 2003. Idempotent vector design for standard assembly of biobricks [Online]. MIT Artificial Intelligence Laboratory. Available: http://hdl.handle.net/1721.1/21168 [Accessed 27/11/2014 2011].
Knoop, H., Grundel, M., Zilliges, Y., Lehmann, R., Hoffmann, S., Lockau, W. & Steuer, R. 2013. Flux balance analysis of cyanobacterial metabolism: the metabolic network of Synechocystis sp. PCC 6803. PLoS Compututational Biology, 9, e1003081.
Knoop, H. & Steuer, R. 2015. A computational analysis of stoichiometric constraints and trade-offs in cyanobacterial biofuel production. Frontiers in Bioengineering and Biotechnology, 3, 47.
Koksharova, O. A. & Wolk, C. P. 2002. Genetic tools for cyanobacteria. Applied Microbiology and Biotechnology, 58, 123-137.
Kopf, M., Klahn, S., Scholz, I., Matthiessen, J. K., Hess, W. R. & Voss, B. 2014. Comparative Analysis of the Primary Transcriptome of Synechocystis sp. PCC 6803. DNA Research, 21, 527-539.
Koressaar, T. & Remm, M. 2007. Enhancements and modifications of primer design program Primer3. Bioinformatics, 23, 1289-1291.
Korn, A., Ajlani, G., Lagoutte, B., Gall, A. & Sétif, P. 2009. Ferredoxin:NADP+ oxidoreductase association with phycocyanin modulates its properties. The Journal of Biological Chemistry, 284, 31789-31797.
Korzheva, N., Mustaev, A., Kozlov, M., Malhotra, A., Nikiforov, V., Goldfarb, A. & Darst, S. A. 2000. A structural model of transcription elongation. Science, 289, 619-625.
Krasikov, V., Aguirre Von Wobeser, E., Dekker, H. L., Huisman, J. & Matthijs, H. C. 2012. Time-series resolution of gradual nitrogen starvation and its impact on photosynthesis in the cyanobacterium Synechocystis PCC 6803. Physiologia Plantarum, 145, 426-439.
Kucho, K., Okamoto, K., Tsuchiya, Y., Nomura, S., Nango, M., Kanehisa, M. & Ishiura, M. 2005. Global analysis of circadian expression in the cyanobacterium Synechocystis sp. strain PCC 6803. Journal of Bacteriology, 187, 2190-2199.
Laherrere, J. 2005. Forecasting production from discovery. In ASPO.
Lambert, D. H. & Stevens, S. E. 1986. Photoheterotrophic growth of Agmenellum quadruplicatum PR-6. Journal of Bacteriology, 165, 654-656.
Lapuente-Brun, E., Moreno-Loshuertos, R., Acín-Pérez, R., Latorre-Pellicer, A., Colás, C., Blasa, E., Perales-Clemente, E., Quirós, P. M., Calvo, E., Rodríguez-Hernández, M. A., Navas, P., Cruz, R., Carracedo, Á., López-Otín, C., Pérez-Martos, A., Fernández-Vizarra, E. & Enríquez, J. A. 2013. Supercomplex assembly determines electron flux in the mitochondrial electron transport chain. Science, 340, 1567-1570.
Larsson, J., Nylander, J. A. A. & Bergman, B. 2011. Genome fluctuations in cyanobacteria reflect evolutionary, developmental and adaptive traits. BMC Evolutionary Biology, 11:187.
REFERENCES
188
Laudenbach, D. E., Reith, M. E. & Straus, N. A. 1988. Isolation, sequence analysis, and transcriptional studies of the flavodoxin gene from Anacystis nidulans R2. Journal of Bacteriology, 170, 258-265.
Lemeille, S., Geiselmann, J. & Latifi, A. 2005. Crosstalk regulation among group 2-sigma factors in Synechocystis PCC6803. BMC Microbiology, 5, 18.
Leonhardt, K. & Straus, N. A. 1992. An iron stress operon involved in photosynthetic electron transport in the marine cyanobacterium Synechococcus sp. PCC 7002. Journal of General Microbiology, 138, 1613-1621.
Lewis, M. 2005. The lac repressor. Comptes Rendus Biologies, 328, 521-548.
Lindberg, P., Park, S. & Melis, A. 2010. Engineering a platform for photosynthetic isoprene production in cyanobacteria, using Synechocystis as the model organism. Metabolic Engineering, 12, 70-79.
Llorens, J. M. N., Tormo, A. & Martinez-García, E. 2010. Stationary phase in gram-negative bacteria. FEMS Microbiology Reviews, 34, 476-495.
Los, D. A., Zorina, A., Sinetova, M., Kryazhov, S., Mironov, K. & Zinchenko, V. V. 2010. Stress sensors and signal transducers in cyanobacteria. Sensors (Basel), 10, 2386-2415.
Luque, I., Flores, E. & Herrero, A. 1994. Molecular mechanism for the operation of nitrogen control in cyanobacteria. EMBO Journal, 13, 2862-2869.
Lutz, R. & Bujard, H. 1997. Independent and tight regulation of transcriptional units in Escherichia coli via the LacR/O, the TetR/O and AraC/I1-I2 regulatory elements. Nucleic Acids Research, 25, 1203-1210.
Ma, J., Campbell, A. & Karlin, S. 2002. Correlations between Shine-Dalgarno sequences and gene features such as predicted expression levels and operon structures. Journal of Bacteriology, 184, 5733-5745.
Maarleveld, T. R., Boele, J., Bruggeman, F. J. & Teusink, B. 2014. A data integration and visualisation resource for the metabolic network of Synechocystis sp. PCC 6803. Plant Physiology, 164, 1111-1121.
Mackey, S. R., Golden, S. S. & Ditty, J. L. 2011. The itty-bitty time machine genetics of the cyanobacterial circadian clock. Advances in Genetics, 74, 13-53.
Marin, K., Suzuki, I., Yamaguchi, K., Ribbeck, K., Yamamoto, H., Kanesaki, Y., Hagemann, M. & Murata, N. 2003. Identification of histidine kinases that act as sensors in the perception of salt stress in Synechocystis sp. PCC 6803. Proceedings of the National Academy of Sciences, 100, 9061-9066.
Markley, A. L., Begemann, M. B., Clarke, R. E., Gordon, G. C. & Pfleger, B. F. 2014. Synthetic Biology Toolbox for Controlling Gene Expression in the Cyanobacterium Synechococcus sp. strain PCC 7002. ACS Synthetic Biology, 4, 5, 595-603.
Marraccini, P., Bulteau, S., Cassier-Chauvat, C., Mermet-Bouvier, P. & Chauvat, F. 1993. A conjugative plasmid vector for promoter analysis in several cyanobacteria of the genera Synechococcus and Synechocystis. Plant Molecular Biology, 23, 905-909.
REFERENCES
189
Martin, W. & Kowallik, K. 1999. Annotated English translation of Mereschkowsky's 1905 paper ‘Über Natur und Ursprung der Chromatophoren imPflanzenreiche’. European Journal Phycology, 34, 287-295.
Martins, R. G., Gonçalves, I. S., de Morais, M. G. & Costa, J. A. V. 2014. Bioprocess engineering aspects of biopolymer production by the cyanobacterium Spirulina strain LEB 18. International Journal of Polymer Science, Article ID 895237.
Mazouni, K., Bulteau, S., Cassier-Chauvat, C. & Chauvat, F. 1998. Promoter element spacing controls basal expression and light inducibility of the cyanobacterial secA gene. Molecular Microbiology, 30, 1113-1122.
Mccleary, W. R. & Stock, J. B. 1994. Acetyl phosphate and the activation of two-component response regulators. The Journal of Biological Chemistry, 269, 31567-31572.
Merchant, S. S., Prochnik, S. E., Vallon, O., Harris, E. H., Karpowicz, S. J., Witman, G. B., Terry, A., Salamov, A., Fritz-Laylin, L. K., Marechal-Drouard, L., Marshall, W. F., Qu, L. H., Nelson, D. R., Sanderfoot, A. A., Spalding, M. H., Kapitonov, V. V., Ren, Q., Ferris, P., Lindquist, E., Shapiro, H., Lucas, S. M., Grimwood, J., Schmutz, J., Cardol, P., Cerutti, H., Chanfreau, G., Chen, C. L., Cognat, V., Croft, M. T., Dent, R., Dutcher, S., Fernandez, E., Fukuzawa, H., Gonzalez-Ballester, D., Gonzalez-Halphen, D., Hallmann, A., Hanikenne, M., Hippler, M., Inwood, W., Jabbari, K., Kalanon, M., Kuras, R., Lefebvre, P. A., Lemaire, S. D., Lobanov, A. V., Lohr, M., Manuell, A., Meier, I., Mets, L., Mittag, M., Mittelmeier, T., Moroney, J. V., Moseley, J., Napoli, C., Nedelcu, A. M., Niyogi, K., Novoselov, S. V., Paulsen, I. T., Pazour, G., Purton, S., Ral, J. P., Riano-Pachon, D. M., Riekhof, W., Rymarquis, L., Schroda, M., Stern, D., Umen, J., Willows, R., Wilson, N., Zimmer, S. L., Allmer, J., Balk, J., Bisova, K., Chen, C. J., Elias, M., Gendler, K., Hauser, C., Lamb, M. R., Ledford, H., Long, J. C., Minagawa, J., Page, M. D., Pan, J., Pootakham, W., Roje, S., Rose, A., Stahlberg, E., Terauchi, A. M., Yang, P., Ball, S., Bowler, C., Dieckmann, C. L., Gladyshev, V. N., Green, P., Jorgensen, R., Mayfield, S., Mueller-Roeber, B., Rajamani, S., Sayre, R. T., Brokstein, P., et al. 2007. The Chlamydomonas genome reveals the evolution of key animal and plant functions. Science, 318, 245-250.
Mermet-Bouvier, P., Cassier-Chauvat, C., Marraccini, P. & Chauvat, F. 1993. Transfer and replication of RSF1010-derived plasmids in several cyanobacteria of the genera Synechocystis and Synechococcus. Current Microbiology, 27, 323-327.
Meyer, R. 2009. Replication and conjugative mobilization of broad host-range IncQ plasmids. Plasmid, 62, 57-70.
Mikami, K., Kanesaki, Y., Suzuki, I. & Murata, N. 2002. The histidine kinase Hik33 perceives osmotic stress and cold stress in Synechocystis sp PCC 6803. Molecular Microbiology, 46, 905-915.
Miksch, G., Bettenworth, F., Friehs, K., Flaschel, E., Saalbach, A., Twellmann, T. & Nattkemper, T. W. 2005. Libraries of synthetic stationary-phase and
REFERENCES
190
stress promoters as a tool for fine-tuning of expression of recombinant proteins in Escherichia coli. Journal of Biotechnology, 120, 25-37.
Miksch, G. & Dobrowolski, P. 1995. Growth phase-dependent induction of stationary-phase promoters of Escherichia coli in different gram-negative bacteria. Journal of Bacteriology, 177, 5374-5378.
Minas, K., Karunakaran, E., Bond, T., Gandy, C., Honsbein, A., Madsen, M., Amezaga, J., Amtmann, A., Templeton, M. R., Biggs, C. A. & Lawton, L. 2014. Biodesalination: an emerging technology for targeted removal of Na+and Cl−from seawater by cyanobacteria. Desalination and Water Treatment, 1-22.
Mincer, T. J. & Aicher, A. C. 2016. Methanol production by a broad phylogenetic array of marine phytoplankton. PLOS One, 11, 3, e0150820.
Mitschke, J., Georg, J., Scholz, I., Sharma, C. M., Dienst, D., Bantscheff, J., Voβ, B. Steglich, C., Wilde, A., Vogel, J. & Hess, W. R. 2011. An experimentally anchored map of transcriptional start sites in the model cyanobacterium Synechocystis sp. PCC6803. Proceedings of the National Academy of Sciences, 108, 5, 2124-2129.
Morrison, S. S., Mullineaux, C. W. & Ashby, M. K. 2005. The influence of acetyl phosphate on DspA signalling in the cyanobacterium Synechocystis sp. PCC6803. BMC Microbiology, 5, 47.
Mugavin, M. E. 2008. Multidimensional scaling: a brief overview. Nursing Research, 57, 64-68.
Mühlenhoff, U. & Chauvat, F. 1996. Gene transfer and manipulation in the thermophilic cyanobacterium Synechococcus elongatus. Molecular Genetics and Genomics, 252, 93-100.
Müller-Hill, B. 1996. The Lac Operon: A short history of a genetic paradigm, New York, Walter de Gruyter.
Mullineaux, C. W. 2014. Co-existence of photosynthetic and respiratory activities in cyanobacterial thylakoid membranes. Biochimica et Biophysica Acta, 1837, 503-511.
Mullineaux, C. W. & Sarcina, M. 2002. Probing the dynamics of photosynthetic membranes with fluorescence recovery after photobleaching. Trends in Plant Science, 7, 237-240.
Na, D. & Lee, D. 2010. RBSDesigner: software for designing synthetic ribosome binding sites that yields a desired level of protein expression. Bioinformatics, 26, 2633-2634.
Nagarajan, S., Sherman, D. M., Shaw, I. & Sherman, L. A. 2012. Functions of the duplicated hik31 operons in central metabolism and responses to light, dark, and carbon sources in Synechocystis sp. strain PCC 6803. Journal of Bacteriology, 194, 448-459.
Nakamura, Y., Kaneko, T., Hirosawa, M., Miyajima, N. & Tabata, S. 1998. CyanoBase, a www database containing the complete nucleotide sequence of the genome of Synechocystis sp. strain PCC6803. Nucleic Acids Research, 26, 63-67.
REFERENCES
191
Nakao, M., Okamoto, S., Kohara, M., Fujishiro, T., Fujisawa, T., Sato, S., Tabata, S., Kaneko, T. & Nakamura, Y. 2010. CyanoBase: the cyanobacteria genome database update 2010. Nucleic Acids Research, 38, D379-381.
Nogales, J., Gudmundsson, S., Knight, E. M., Palsson, B. O. & Thiele, I. 2014. Detailing the optimality of photosynthesis in cyanobacteria through systems biology analysis. Proceedings of the National Academy of Sciences, 109, 2678-2683.
Nomura, C. T., Persson, S., Shen, G., Inoue-Sakamoto, K. & Bryant, D. A. 2006a. Characterization of two cytochrome oxidase operons in the marine cyanobacterium Synechococcus sp. PCC 7002: inactivation of ctaDI affects the PS I:PS II ratio. Photosynthesis Research, 87, 215-228.
Nomura, C. T., Sakamoto, T. & Bryant, D. A. 2006b. Roles for heme-copper oxidases in extreme high-light and oxidative stress response in the cyanobacterium Synechococcus sp. PCC 7002. Archives in Microbiology, 185, 471-479.
Nozzi, N. E., Oliver, J. W. & Atsumi, S. 2013. Cyanobacteria as a platform for biofuel production. Frontiers in Bioengineering and Biotechnology, 1, 7.
Ogawa, T. & Mi, H. 2007. Cyanobacterial NADPH dehydrogenase complexes. Photosynthesis Research, 93, 69-77.
Ogren, W. L. 1984. Photorespiration: Pathways, regulation and modification. Annual Review of Plant Physiology, 35, 415-442.
Ogren, W. L. 2003. Affixing the O to Rubisco: Discovering the source of photorespiratory glycolate and its regulation. Photosynthesis Research, 76, 53-63.
Ohmori, M. & Okamoto, K. 2004. Photoresponsive cAMP signal transduction in cyanobacteria. Photochemical & Photobiological Sciences, 3, 503-511.
Oliveira, P. & Lindblad, P. 2008. An AbrB-like protein regulates the expression of the bidirectional hydrogenase in Synechocystis sp. strain PCC 6803. Journal of Bacteriology, 190, 1011-1019.
Olson, J. M. 2006. Photosynthesis in the Archean era. Photosynthesis Research, 88, 109-17.
Osanai, T., Ikeuchi, M. & Tanaka, K. 2008. Group 2 sigma factors in cyanobacteria. Physiologia Plantarum, 133, 490-506.
Osanai, T., Imamura, S., Asayama, M., Shirai, M., Suzuki, I., Murata, N. & Tanaka, K. 2006. Nitrogen induction of sugar catabolic gene expression in Synechocystis sp. PCC 6803. DNA Research, 13, 185-195.
Parkinson, J. S. & Kofoid, E. C. 1992. Communication modules in bacterial signaling proteins. Annual Review of Genetics, 26, 71-112.
Parmar, A., Singh, N. K., Pandey, A., Gnansounou, E. & Madamwar, D. 2011. Cyanobacteria and microalgae: a positive prospect for biofuels. Bioresource Technology, 102, 10163-10172.
REFERENCES
192
Peca, L., Kós, P. B., Máté, Z., Farsang, A. & Vass, I. 2008. Construction of bioluminescent cyanobacterial reporter strains for detection of nickel, cobalt and zinc. FEMS Microbiology Letters, 289, 258-264.
Peschek, G. A., Obinger, C. & Paumann, M. 2004. The respiratory chain of blue-green algae (cyanobacteria). Physiologia Plantarum, 120, 358-369.
Pietsch, C., Wiegand, C., Amé, M. V., Nicklisch, A., Wunderlin, D. & Pflugmacher, S. 2001. The effects of a cyanobacterial crude extract on different aquatic organisms: Evidence for cyanobacterial toxin modulating factors. Environmental Toxicology, 16, 6, 535-542.
Pinto, F., Pacheco, C. C., Ferreira, D., Moradas-Ferreira, P. & Tamagnini, P. 2012. Selection of suitable reference genes for RT-qPCR analyses in cyanobacteria. PLOS ONE, 7, e34983.
Piras, V. & Selvarajoo, K. 2015. The reduction of gene expression variability from single cells to populations follows simple statistical laws. Genomics, 105, 137-144.
Pisareva, T., Kwon, J., Oh, J., Kim, S., Ge, C., Wieslander, A., Choi, J. S. & Norling, B. 2011. Model for membrane organization and protein sorting in the cyanobacterium Synechocystis sp. PCC 6803 inferred from proteomics and multivariate sequence analysis. Journal of Proteome Research, 10, 3617-3631.
Posten, C. & Schaub, G. 2009. Microalgae and terrestrial biomass as source for fuels--a process view. Journal of Biotechnology, 142, 64-69.
Rai, M. & Padh, H. 2001. Expression systems for production of heterologous proteins. Current Science, 80, 1121-1128.
Raj, A. & van Oudenaarden, A. 2008. Nature, nurture, or chance: stochastic gene expression and its consequences. Cell, 135, 2, 216-226.
Rasband, W. S. & Bright, D. S. 1995. NIH Image: A public domain image processing program for the Macintosh. Microbeam Analysis, 4, 137-149.
Reeve, B., Hargest, T., Gilbert, C. & Ellis, T. 2014. Predicting translation initiation rates for designing synthetic biology. Frontiers in Bioengineering and Biotechnology, 2, 1.
Reiter, L., Kolsto, A. B. & Piehler, A. P. 2011. Reference genes for quantitative, reverse-transcription PCR in Bacillus cereus group strains throughout the bacterial life cycle. Journal of Microbiology Methods, 86, 210-217.
Richaud, C., Zabulon, G., Joder, A. & Thomas, J. C. 2001. Nitrogen or sulfur starvation differentially affects phycobilisome degradation and expression of the nblA gene in Synechocystis strain PCC 6803. Journal of Bacteriology, 183, 2989-2994.
Rippka, R. 1972. Photoheterotrophy and chemoheterotrophy among unicellular blue-green algae. Archiv für Mikrobiologie, 87, 93-98.
Rippka, R., Deruelles, J., Waterbury, J. B., Herdman, M. & Stanier, R. Y. 1979. Generic assignments, strain histories and properties of pure cultures of cyanobacteria. Microbiology Reviews, 111, 1-61.
REFERENCES
193
Ruffing, A. M. 2011. Engineered cyanobacteria: Teaching an old bug new tricks. Bioengineered Bugs, 2, 136-149.
Ruffing, A. M. 2014. Improved free fatty acid production in cyanobacteria with Synechococcus sp. PCC 7002 as host. Frontiers in Bioengineering and Biotechnology, 2, 17.
Sakamoto, T., Murata, N. & Ohmori, M. 1991. The concentration of cyclic AMP and adenylate cyclase activity in cyanobacteria. Plant and Cell Physiology, 32, 581-484.
Salis, H. M., Mirsky, E. A. & Voigt, C. A. 2009. Automated design of synthetic ribosome binding sites to control protein expression. Nature Biotechnology, 27, 946-950.
Sandmann, G., Peleato, M. L., Fillat, M. F., Lázaro, M. C. & Gómez-Moreno, C. 1990. Consequences of the iron-dependent formation of ferredoxin and flavodoxin on photosynthesis and nitrogen fixation on Anabaena strains. Photosynthesis Research, 26, 119-125.
Sauer, J., Schreiber, U., Schmid, R., Völker, U. & Forchhammer, K. 2001. Nitrogen starvation-induced chlorosis in Synechococcus PCC 7942. Low-level photosynthesis as a mechanism of long-term survival. Plant Physiology, 126, 233-243.
Schneider, G. J. & Hasekorn, R. 1988. RNA polymerase subunit homology among cyanobacteria, other eubacteria and archaebacteria. Journal of Bacteriology, 170, 4136-4140.
Schumann, W. 2007. Production of recombinant proteins in Bacillus subtilis. Advances in Applied Microbiology, 62, 137-189.
Schwarz, R. & Forchhammer, K. 2005. Acclimation of unicellular cyanobacteria to macronutrient deficiency: emergence of a complex network of cellular responses. Microbiology, 151, 2503-2514.
Seo, S. W., Yang, J. S., Kim, I., Yang, J., Min, B. E., Kim, S. & Jung, G. Y. 2013. Predictive design of mRNA translation initiation region to control prokaryotic translation efficiency. Metabolic Engineering, 15, 67-74.
Shafiee, S. & Topal, E. 2009. When will fossil fuel reserves be diminished? Energy Policy, 37, 181-189.
Sharkey, T. D. & Welse, S. E. 2012. Autotrophic carbon dioxide fixation, Springer Science + Business Media B. V.
Sheng, J., Kim, H. W., Badalamenti, J. P., Zhou, C., Sridharakrishnan, S., Krajmalnik-Brown, R., Rittmann, B. E. & Vannela, R. 2011. Effects of temperature shifts on growth rate and lipid characteristics of Synechocystis sp. PCC6803 in a bench-top photobioreactor. Bioresource Technology, 102, 11218-11225.
Sherman, D. M., Troyan, T. A. & Sherman, L. A. 1994. Localization of membrane proteins in the cyanobacterium Synechococcus sp. PCC7942 (radial asymmetry in the photosynthetic complexes). Plant Physiology, 106, 251-262.
REFERENCES
194
Shetty, R. P., Endy, D. & Knight, T. F., Jr. 2008. Engineering BioBrick vectors from BioBrick parts. Journal of Biological Engineering, 2, 5-16.
Shevela, D., Pishchalnikov, R., Eichacker, L. A. & Govindjee 2013. Oxygenic photosynthesis in cyanobacteria, CRC Press.
Shih, P. M., Wu, D., Latifi, A., Axen, S. D., Fewer, D. P., Talla, E., Calteau, A., Cai, F., Tandeau de Marsac, N., Rippka, R., Herman, M., Sivonen, K., Coursin, T., Laurent, T., Goodwin, L., Nolan, M., Davenport, K. W., Hans, C. S., Rubin, E. M., Eisen, J. A., Woyke, T., Gugger, M. & Kerfeld, C. A. 2013. Improving the coverage of the cyanobacterial phylum using diversity-driven genome sequencing. Proceedings of the National Academy of Sciences, 110, 3, 1053-1058.
Singh, A. K., Bhattacharyya-Pakrasi, M., Elvitigala, T., Ghosh, B., Aurora, R. & Pakrasi, H. B. 2009. A systems-level analysis of the effects of light quality on the metabolism of a cyanobacterium. Plant Physiology, 151, 1596-1608.
Singh, A. K., Mcintyre, L. M. & Sherman, L. A. 2003. Microarray analysis of the genome-wide response to iron deficiency and iron reconstitution in the cyanobacterium Synechocystis sp. PCC 6803. Plant Physiology, 132, 1825-1839.
Singh, A. K., Summerfield, T. C. & Sherman, L. A. 2006. The heat shock response in the cyanobacterium Synechocystis sp. Strain PCC 6803 and regulation of gene expression by HrcA and SigB. Archives in Microbiology, 186, 273-286.
Singh, S., Kate, B. N. & Banerjee, U. C. 2005. Bioactive compounds from cyanobacteria and microalgae: An overview. Critical Reviews in Biotechnology, 25, 73-95.
Sode, K., Tatara, M., Takeyama, H., Burgess, J. G. & Matsunaga, T. 1992. Conjugative gene transfer in marine cyanobacteria: Synechococcus sp., Synechocystis sp. and Pseudanabaena sp. Applied Microbiology Biotechnology, 37, 369-373.
Stal, L. J. 1992. Poly(hydroxyalkanoate) in cyanobacteria: An overview. FEMS Microbiology Letters, 103, 169-180.
Stal, L. J. 1995. Physiological ecology of cyanobacteria in microbial mats and other communities. New Phytologist, 131, 1-32.
Stal, L. J. 2008. Nitrogen Fixation in Cyanobacteria.
Stanier, R. Y. & Cohen-Bazire, G. 1977. Phototrophic prokaryotes: the cyanobacteria. Annual Review of Microbiology, 31, 225-274.
Stanier, R. Y., Kunisawa, R., Mandel, M. & Cohen-Bazire, G. 1971. Purification and properties of unicellular blue-green algae (order Chroococcales). Bacteriological Reviews, 35, 171-205.
Stevens, S. E. & Porter, R. D. 1980. Transformation in Agmenellum quadruplicatum. Proceedings of the National Academy of Sciences, 77, 6052-6056.
Stocker, T. F., Qin, D., Plattner, G.-K., Tignor, M., Allen, S. K., Boschung, J., Nauels, A., Xia, Y., Bex, V. & Midgley, B. 2013. Climage Change 2013: The
REFERENCES
195
Physical Science Basis. Cambridge, United Kingdom and New York, USA: Cambridge University Press.
Stucken, K., Koch, R. & Dagan, T. 2013. Cyanobacterial defense mechanisms against foreign DNA transfer and their impact on genetic engineering. Biological Research, 46, 373-382.
Subashchandrabose, S. R., Ramakrishnan, B., Megharaj, M., Venkateswarlu, K. & Naidu, R. 2013. Mixotrophic cyanobacteria and microalgae as distinctive biological agents for organic pollutant degradation. Environment International, 51, 59-72.
Summerfield, T. C., Nagarajan, S. & Sherman, L. A. 2011. Gene expression under low-oxygen conditions in the cyanobacterium Synechocystis sp. PCC 6803 demonstrates Hik31-dependent and -independent responses. Microbiology, 157, 301-312.
Suzuki, I., Kanesaki, Y., Hayashi, H., Hall, J. J., Simon, W. J., Slabas, A. R. & Murata, N. 2005. The histidine kinase Hik34 is involved in thermotolerance by regulating the expression of heat shock genes in Synechocystis. Plant Physiology, 138, 1409-1421.
Suzuki, S., Ferjani, A., Suzuki, I. & Murata, N. 2004. The SphS-SphR two component system is the exclusive sensor for the induction of gene expression in response to phosphate limitation in synechocystis. The Journal of Biological Chemistry, 279, 13234-13240.
Sweetser, D., Nonet, M. & Young, R. A. 1987. Prokaryotic and eukaryotic RNA polymerases have homologous core subunits. Proceedings of the National Academy of Sciences, 84, 1192-1196.
Tamoi, M., Ishikawa, T., Takeda, T. & Shigeoka, S. 1996. Molecular characterization and resistance to hydrogen peroxide of two fructose-1,6-bisphosphatases from Synechococcus PCC 7942. Archives of Biochemistry and Biophysics, 334, 27-36.
Taton, A., Unglaub, F., Wright, N. E., Zeng, W. Y., Paz-Yepes, J., Brahamsha, B., Palenik, B., Peterson, T. C., Haerizadeh, F., Golden, S. S. & Golden, J. W. 2014. Broad-host-range vector system for synthetic biology and biotechnology in cyanobacteria. Nucleic Acids Research, 42, e136.
The Arabidopsis Genome Initiative. 2000. Analysis of the genome sequence of the flowering plant Arabidopsis thaliana. Nature, 408, 796-815.
Thellin, O., Zorzi, W., Lakaye, B., De Borman, B., Coumans, B., Hennen, G., Grisar, T., Igout, A. & Heinen, E. 1999. Housekeeping genes as internal standards: use and limits. Journal of Biotechnology, 75, 291-295.
Trapnell, C., Roberts, A., Goff, L., Pertea, G., Kim, D., Kelley, D. R., Pimentel, H., Salzberg, S. L., Rinn, J. L. & Pachter, L. 2012. Differential gene and transcript expression analysis of RNA-seq experiments with TopHat and Cufflinks. Nature Protocols, 7, 562-578.
Tsien, R. Y. 1998. The green fluorescent protein. Annual Review of Biochemistry, 67, 509-544.
REFERENCES
196
Tuominen, I., Pollari, M., Aguirre Von Wobeser, E., Tyystjärvi, E., Ibelings, B. W., Matthijs, H. C. & Tyystjärvi, T. 2008. Sigma factor SigC is required for heat acclimation of the cyanobacterium Synechocystis sp. strain PCC 6803. FEBS Letters, 582, 346-350.
Tuominen, I., Tyystjärvi, E. & Tyystjärvi, T. 2003. Expression of primary sigma factor (PSF) and PSF-like sigma factors in the cyanobacterium Synechocystis sp. strain PCC 6803. Journal of Bacteriology, 185, 1116-1119.
Tzareva, N. V., Makhno, V. I. & Boni, I. V. 1994. Ribosome-messenger recognition in the absence of the Shine-Dalgarno interactions. FEBS Letters, 337, 189-194.
Untergasser, A., Cutcutache, I., Koressaar, T., Ye, J., Faircloth, B. C., Remm, M. & Rozen, S. G. 2012. Primer3--new capabilities and interfaces. Nucleic Acids Research, 40, e115.
Utkilen, H. C. 1982. Magnesium-limited growth of the cyanobacterium Anacystis nidulans. Journal of General Microbiology, 128, 1849-1862.
Vaishampayan, A., Sinha, R. P., Hader, D.-P., Dey, T., Gupta, A. K., Bhan, U. & Rao, A. L. 2001. Cyanobacterial biofertilizers in rice agriculture. The Botanical Review, 67, 453-516.
Van Baalen, C. 1962. Studies on marine blue-green algae. Botanica Marina, 4, 129-139.
Van De Meene, A. M., Hohmann-Marriott, M. F., Vermaas, W. F. & Roberson, R. W. 2006. The three-dimensional structure of the cyanobacterium Synechocystis sp. PCC 6803. Archives of Microbiology, 184, 259-270.
Van Thor, J. J., Gruters, O. W., Matthijs, H. C. & Hellingwerf, K. J. 1999. Localization and function of ferredoxin:NADP(+) reductase bound to the phycobilisomes of Synechocystis. EMBO Journal, 18, 4128-4136.
Vandesomepele, J., De Preter, K., Pattyn, F., Poppe, B., Van Roy, N., De Paepe, A. & Speleman, F. 2002. Accurate normalization of real-time quantitative RT-PCR data by geometric averaging of multiple internal control genes. Genome Biology, 3, RESEARCH0034.
Vandesomepele, J., Kubista, M. & Pfaffl, M. W. 2009. Reference gene validation software for improved normalization. In: LOGAN, J., EDWARDS, K. & SAUNDERS, N. (eds.) Real-Time PCR: Current technology and applications. Caister Academic Press.
Vermaas, W. F. 2001. Photosynthesis and Respiration in Cyanobacteria, Macmillan Publishers Ltd, Nature Publishing Group.
Vijayakumar, S. 2012. Potential Applications of Cyanobacteria in Industrial Effluents-A Review. Journal of Bioremediation and Biodegradation, 03.
Vilanova, C. & Porcar, M. 2014. iGEM 2.0--refoundations for engineering biology. Nature Biotechnology, 32, 420-424.
Vinnemeier, J., Kunert, A. & Hagemann, M. 1998. Transcriptional analysis of the isiAB operon in salt-stressed cells of the cyanobacterium Synechocystis sp. PCC 6803. FEMS Microbiology Letters, 169, 323-330.
REFERENCES
197
Vitousek, P. M. & Howarth, R. W. 1991. Nitrogen limitation on land and in the sea: How can it occur? Biogeochemistry, 13, 87-115.
Wang, B., Wang, J., Zhang, W. & Meldrum, D. R. 2012. Application of synthetic biology in cyanobacteria and algae. Frontiers in Microbiology, 3, 344.
Wang, H.-L., Postier, B. L. & Burnap, R. L. 2004. Alterations in global patterns of gene expression in Synechocystis sp. PCC 6803 in response to inorganic carbon limitation and the inactivation of ndhR, a LysR family regulator. The Journal of Biological Chemistry, 279, 5739-5751.
Wang, J., Chen, L., Chen, Z. & Zhang, W. 2015. RNA-seq based transcriptomic analysis of single bacterial cells. Integrative Biology, 7, 1466-1476.
Wang, Z., Gerstein, M. & Snyder, M. 2009. RNA-Seq: a revolutionary tool for transcriptomics. Nature Reviews Genetics, 10, 57-63.
Waterbury, J. B. 2006. The Cyanobacteria—Isolation, Purification and Identification. 1053-1073.
Waterbury, J. B., Watson, S. W., Guillard, R. R. L. & Brand, L. E. 1979. Widespread occurrence of a unicellular, marine, planktonic, cyanobacterium. Nature, 277, 293-294.
Weber, E., Engler, C., Gruetzner, R., Werner, S. & Marillonnet, S. 2011. A Modular Cloning System for Standardized Assembly of Multigene Constructs. PLOS ONE, 6, e16765.
Wilde, A. & Dienst, D. 2011. Tools for Genetic Manipulation of Cyanobacteria. 685-703.
Wolf, F. I. & Cittadini, A. 1999. Magnesium in cell proliferation and differentiation. Frontiers in Bioscience, 4, D607-617.
Wolk, C. P. 1973. Physiology and cytological chemistry of blue-green algae. Bacteriological Reviews, 37, 32-101.
Xie, W. Q., Jäger, K. & Potts, M. 1989. Cyanobacterial RNA polymerase genes rpoC1 and rpoC2 correspond to rpoC of Escherichia coli. Joural of Bacteriology, 171, 1967-1973.
Xu, Y., Alvey, R. M., Byrne, P. O., Graham, J. E., Shen, G. & Bryant, D. A. 2011. Expression of genes in cyanobacteria: adaptation of endogenous plasmids as platforms for high-level gene expression in Synechococcus sp. PCC 7002. Methods in Molecular Biology, 684, 273-293.
Yoshihara, S., Geng, X. & Ikeuchi, M. 2002. pilG gene cluster and split pilL genes involved in pilus biogenesis, motility and genetic transformation in the cyanobacterium Synechocystis sp. PCC 6803. Plant and Cell Physiology, 43, 513-521.
Yoshihara, S., Geng, X., Okamoto, S., Yura, K., Murata, T., Go, M., Ohmori, M. & Ikeuchi, M. 2001. Mutational analysis of genes involved in pilus structure, motility and transformation competency in the unicellular motile cyanobacterium Synechocystis sp. PCC 6803. Plant and Cell Physiology, 42, 63-73.
REFERENCES
198
Yu, T., Li, J., Yang, Y., Qi, L., Chen, B., Zhao, F., Bao, Q. & Wu, J. 2012. Codon usage patterns and adaptive evolution of marine unicellular cyanobacteria Synechococcus and Prochlorococcus. Molecular Phylogenetics and Evolution, 62, 206-213.
Yu, Y., You, L., Liu, D., Hollinshead, W., Tang, Y. J. & Zhang, F. 2013. Development of Synechocystis sp. PCC 6803 as a phototrophic cell factory. Marine Drugs, 11, 2894-2916.
Zhang, Z., Pendse, N. D., Phillips, K. N., Cotner, J. B. & Khodursky, A. 2008. Gene expression patterns of sulfur starvation in Synechocystis sp. PCC 6803. BMC Genomics, 9, 344.
Zhou, J., Zhang, H., Meng, H., Zhu, Y., Bao, G., Zhang, Y., Li, Y. & Ma, Y. 2014. Discovery of a super-strong promoter enables efficient production of heterologous proteins in cyanobacteria. Scientific Reports, 4, 4500.
Zhou, K., Zhou, L., Lim, Q., Zou, R., Stephanopoulos, G. & Too, H. P. 2011. Novel reference genes for quantifying transcriptional responses of Escherichia coli to protein overexpression by quantitative PCR. BMC Molecular Biology, 12, 18.
APPENDIX I
199
APPENDIX I
R script to perform multi-dimensional scaling
(Author: Dr. Graham Hamilton, Glasgow Polyomics, University of Glasgow)
# SET YOUR WORKING DIRECTORY
library(cummeRbund)
# Load the Cufflinks data
cuff<-readCufflinks('cuffdiff_all_conditions_28May')
# List the replicates
replicates(cuff)
# Change the rep.list to the replicates required for the PCA plot.
rep.list<-
c("StandardMedia4Days_0","StandardMedia4Days_1","StandardMedia4Days_2","Sta
ndardMedia8Days_0","StandardMedia8Days_1","StandardMedia8Days_2")
# Give the samples a sort name for the MDS plot
labs<-c('SM4-1','SM4-2','SM4-3','SM8-1','SM8-2','SM8-3')
# Colours for the sample circles
cols <- c(rep("aquamarine",3),rep("aquamarine4",3))
fpkms<-repFpkmMatrix(genes(cuff),fullnames=FALSE,rep.list)
# Run this for log transformations
pseudocount<-1.0
fpkms<-log10(fpkms+pseudocount)
dist<-JSdist(makeprobs(fpkms))
fit<-cmdscale(dist,eig=TRUE, k=2)
res<-
data.frame(names=rownames(fit$points),M1=fit$points[,1],M2=fit$points[,2])
plot<-ggplot(res)
plot<-plot + geom_point(aes(x=M1,y=M2),color=cols,size=10) +
geom_text(aes(x=M1,y=M2,label=labs,hjust=0.5, vjust=-1)) + theme_bw()
plot
APPENDIX II
200
APPENDIX II
R script to perform clustering analysis
(Author: Dr. Graham Hamilton, Glasgow Polyomics, University of Glasgow)
# SET YOUR WORKING DIRECTORY
library(cummeRbund)
# Load the Cufflinks data
cuff<-readCufflinks('cuffdiff_all_conditions_28May')
# Read in list of genes, change file name. File should be an XLOC id per line.
myGeneIDs<-
read.table("Background_Expressed_genes.txt",sep="\t",header=FALSE)
# Get XLOC ids from read in table
XLOCs<-myGeneIDs[,'V1']
genes<-getGenes(cuff,XLOCs)
# Cluster the genes using the Jensen-Shannon distance and K means
clusters<-30
cluster.distances<-csCluster(genes,k=clusters)
# Plot the clusters
clust.plot<-csClusterPlot(cluster.distances)
clust.plot
# Write the names of the genes in the clusters to files
i <- 1
while(i <= clusters){
num <- (i)
file_name <- "clusters"
file_type <- "txt"
file_name <- paste(file_name, num, sep="_", collapse = NULL)
file_name <- paste(file_name, file_type, sep=".", collapse = NULL)
clust_ids <- names(cluster.distances$clustering)[cluster.distances$clustering ==
(i)]
write.table(clust_ids,file_name, sep='\t',row.names=F,col.names=F,quote=F)
i <- i + 1
}
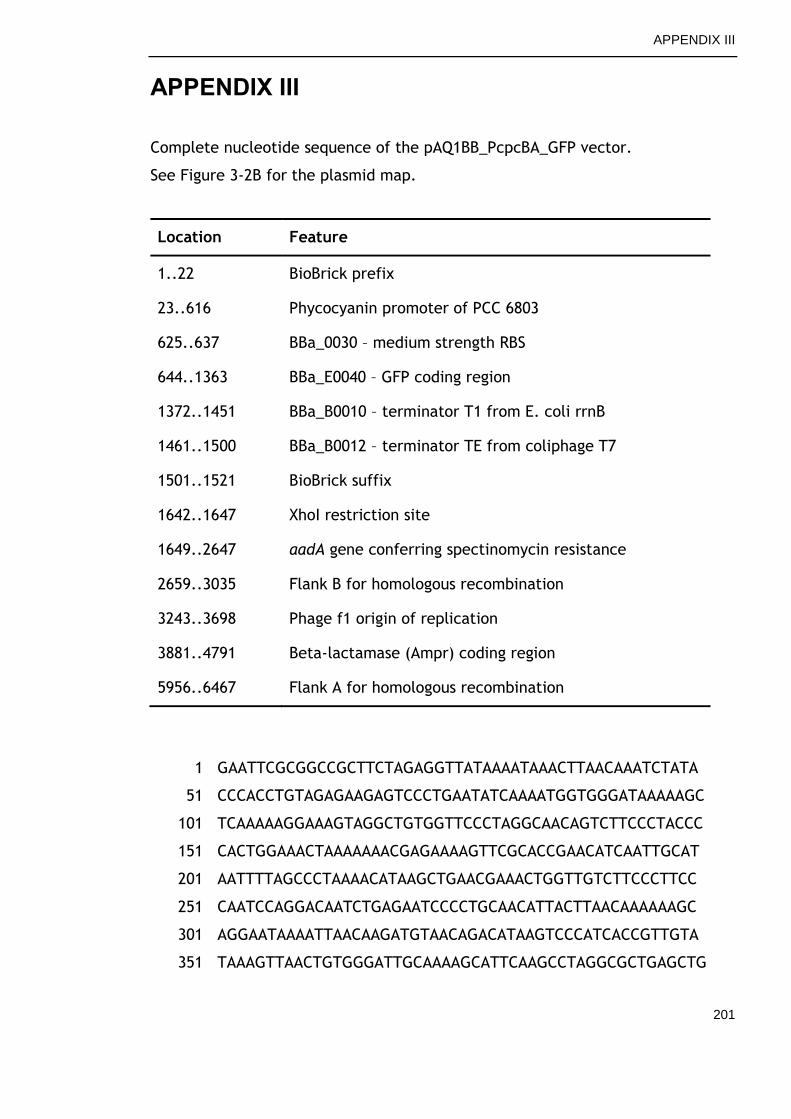
APPENDIX III
201
APPENDIX III
Complete nucleotide sequence of the pAQ1BB_PcpcBA_GFP vector.
See Figure 3-2B for the plasmid map.
Location Feature
1..22 BioBrick prefix
23..616 Phycocyanin promoter of PCC 6803
625..637 BBa_0030 – medium strength RBS
644..1363 BBa_E0040 – GFP coding region
1372..1451 BBa_B0010 – terminator T1 from E. coli rrnB
1461..1500 BBa_B0012 – terminator TE from coliphage T7
1501..1521 BioBrick suffix
1642..1647 XhoI restriction site
1649..2647 aadA gene conferring spectinomycin resistance
2659..3035 Flank B for homologous recombination
3243..3698 Phage f1 origin of replication
3881..4791 Beta-lactamase (Ampr) coding region
5956..6467 Flank A for homologous recombination
1 GAATTCGCGGCCGCTTCTAGAGGTTATAAAATAAACTTAACAAATCTATA
51 CCCACCTGTAGAGAAGAGTCCCTGAATATCAAAATGGTGGGATAAAAAGC
101 TCAAAAAGGAAAGTAGGCTGTGGTTCCCTAGGCAACAGTCTTCCCTACCC
151 CACTGGAAACTAAAAAAACGAGAAAAGTTCGCACCGAACATCAATTGCAT
201 AATTTTAGCCCTAAAACATAAGCTGAACGAAACTGGTTGTCTTCCCTTCC
251 CAATCCAGGACAATCTGAGAATCCCCTGCAACATTACTTAACAAAAAAGC
301 AGGAATAAAATTAACAAGATGTAACAGACATAAGTCCCATCACCGTTGTA
351 TAAAGTTAACTGTGGGATTGCAAAAGCATTCAAGCCTAGGCGCTGAGCTG
APPENDIX III
202
401 TTTGAGCATCCCGGTGGCCCTTGTCGCTGCCTCCGTGTTTCTCCCTGGAT
451 TTATTTAGGTAATATCTCTCATAAATCCCCGGGTAGTTAACGAAAGTTAA
501 TGGAGATCAGTAACAATAACTCTAGGGTCATTACTTTGGACTCCCTCAGT
551 TTATCCGGGGGAATTGTGTTTAAGAAAATCCCAACTCATAAAGTCAAGTA
601 GGAGATTAATTCCATGTACTAGAGTCACACAGGAAAGTACTAGATGCGTA
651 AAGGAGAAGAACTTTTCACTGGAGTTGTCCCAATTCTTGTTGAATTAGAT
701 GGTGATGTTAATGGGCACAAATTTTCTGTCAGTGGAGAGGGTGAAGGTGA
751 TGCAACATACGGAAAACTTACCCTTAAATTTATTTGCACTACTGGAAAAC
801 TACCTGTTCCATGGCCAACACTTGTCACTACTTTCGGTTATGGTGTTCAA
851 TGCTTTGCGAGATACCCAGATCATATGAAACAGCATGACTTTTTCAAGAG
901 TGCCATGCCCGAAGGTTATGTACAGGAAAGAACTATATTTTTCAAAGATG
951 ACGGGAACTACAAGACACGTGCTGAAGTCAAGTTTGAAGGTGATACCCTT
1001 GTTAATAGAATCGAGTTAAAAGGTATTGATTTTAAAGAAGATGGAAACAT
1051 TCTTGGACACAAATTGGAATACAACTATAACTCACACAATGTATACATCA
1101 TGGCAGACAAACAAAAGAATGGAATCAAAGTTAACTTCAAAATTAGACAC
1151 AACATTGAAGATGGAAGCGTTCAACTAGCAGACCATTATCAACAAAATAC
1201 TCCAATTGGCGATGGCCCTGTCCTTTTACCAGACAACCATTACCTGTCCA
1251 CACAATCTGCCCTTTCGAAAGATCCCAACGAAAAGAGAGACCACATGGTC
1301 CTTCTTGAGTTTGTAACAGCTGCTGGGATTACACATGGCATGGATGAACT
1351 ATACAAATAATAATACTAGAGCCAGGCATCAAATAAAACGAAAGGCTCAG
1401 TCGAAAGACTGGGCCTTTCGTTTTATCTGTTGTTTGTCGGTGAACGCTCT
1451 CTACTAGAGTCACACTGGCTCACCTTCGGGTGGGCCTTTCTGCGTTTATA
1501 TACTAGTAGCGGCCGCTGCAGTTAATTAAGGATCCGGCTGCTAACAAAGC
1551 CCGAAAGGAAGCTGAGTTGGCTGCTGCCACCGCTGAGCAATAACTAGCAT
1601 AACCCCTTGGGGCCTCTAAACGGGTCTTGACGGGTTTTTTGCTCGAGCCG
1651 AACGCAGCGGTGGTAACGGCGCAGTGGCGGTTTTCATGGCTTGTTATGAC
1701 TGTTTTTTTGGGGTACAGTCTATGCCTCGGGCATCCAAGCAGCAAGCGCG
1751 TTACGCCGTGGGTCGATGTTTGATGTTATGGAGCAGCAACGATGTTACGC
1801 AGCAGGGCAGTCGCCCTAAAACAAAGTTAAACATCATGAGGGAAGCGGTG
1851 ATCGCCGAAGTATCGACTCAACTATCAGAGGTAGTTGGCGTCATCGAGCG
1901 CCATCTCGAACCGACGTTGCTGGCCGTACATTTGTACGGCTCCGCAGTGG
1951 ATGGCGGCCTGAAGCCACACAGTGATATTGATTTGCTGGTTACGGTGACC
2001 GTAAGGCTTGATGAAACAACGCGGCGAGCTTTGATCAACGACCTTTTGGA
APPENDIX III
203
2051 AACTTCGGCTTCCCCTGGAGAGAGCGAGATTCTCCGCGCTGTAGAAGTCA
2101 CCATTGTTGTGCACGACGACATCATTCCGTGGCGTTATCCAGCTAAGCGC
2151 GAACTGCAATTTGGAGAATGGCAGCGCAATGACATTCTTGCAGGTATCTT
2201 CGAGCCAGCCACGATCGACATTGATCTGGCTATCTTGCTGACAAAAGCAA
2251 GAGAACATAGCGTTGCCTTGGTAGGTCCAGCGGCGGAGGAACTCTTTGAT
2301 CCGGTTCCTGAACAGGATCTATTTGAGGCGCTAAATGAAACCTTAACGCT
2351 ATGGAACTCGCCGCCCGACTGGGCTGGCGATGAGCGAAATGTAGTGCTTA
2401 CGTTGTCCCGCATTTGGTACAGCGCAGTAACCGGCAAAATCGCGCCGAAG
2451 GATGTCGCTGCCGACTGGGCAATGGAGCGCCTGCCGGCCCAGTATCAGCC
2501 CGTCATACTTGAAGCTAGACAGGCTTATCTTGGACAAGAAGAAGATCGCT
2551 TGGCCTCGCGCGCAGATCAGTTGGAAGAATTTGTCCACTACGTGAAAGGC
2601 GAGATCACCAAGGTAGTCGGCAAATAATGTCTAACAATTCGCTCGACTCT
2651 AGGTCGACGCCTCCTGAATAAATCTATTTATACAGGGGTTGGACACGGCC
2701 CCTAATTTTGCTTGGTCACGCTGTAACCAATGAGCAAAGACCTTTTCGCG
2751 CTGATCGTTAGGGGCGATCGCCTCATAGACCCGCTGACGGTTATCCCGCG
2801 ATCCAAAGCGCCCCTTGTATTCCAATTTCCGGTCAAGCTTGCCTAGGAGC
2851 GCCTGAGCAATTTCGAGCGGGCTCATTTTGTCGGTGATCGTTCTGCCAAG
2901 AATCCACTTGATCGGCTTGGCATACCGCAAACAATTTTCCTTGAACCCTT
2951 CAAGGCTCGCCCCGGTGAATGTCACCCCTGGTTTTAAGAACTGATGGATG
3001 TTGAGTAGCTCTAACAGGTGAATCTTTGGTGAGAGGCATGCGACGTCGGG
3051 CCCAATTCGCCCTATAGTGAGTCGTATTACAATTCACTGGCCGTCGTTTT
3101 ACAACGTCGTGACTGGGAAAACCCTGGCGTTACCCAACTTAATCGCCTTG
3151 CAGCACATCCCCCTTTCGCCAGCTGGCGTAATAGCGAAGAGGCCCGCACC
3201 GATCGCCCTTCCCAACAGTTGCGCAGCCTGAATGGCGAATGGACGCGCCC
3251 TGTAGCGGCGCATTAAGCGCGGCGGGTGTGGTGGTTACGCGCAGCGTGAC
3301 CGCTACACTTGCCAGCGCCCTAGCGCCCGCTCCTTTCGCTTTCTTCCCTT
3351 CCTTTCTCGCCACGTTCGCCGGCTTTCCCCGTCAAGCTCTAAATCGGGGG
3401 CTCCCTTTAGGGTTCCGATTTAGTGCTTTACGGCACCTCGACCCCAAAAA
3451 ACTTGATTAGGGTGATGGTTCACGTAGTGGGCCATCGCCCTGATAGACGG
3501 TTTTTCGCCCTTTGACGTTGGAGTCCACGTTCTTTAATAGTGGACTCTTG
3551 TTCCAAACTGGAACAACACTCAACCCTATCTCGGTCTATTCTTTTGATTT
3601 ATAAGGGATTTTGCCGATTTCGGCCTATTGGTTAAAAAATGAGCTGATTT
3651 AACAAAAATTTAACGCGAATTTTAACAAAATATTAACGCTTACAATTTCC
APPENDIX III
204
3701 TGATGCGGTATTTTCTCCTTACGCATCTGTGCGGTATTTCACACCGCATC
3751 AGGTGGCACTTTTCGGGGAAATGTGCGCGGAACCCCTATTTGTTTATTTT
3801 TCTAAATACATTCAAATATGTATCCGCTCATGAGACAATAACCCTGATAA
3851 ATGCTTCAATAATATTGAAAAAGGAAGAGTATGAGTATTCAACATTTCCG
3901 TGTCGCCCTTATTCCCTTTTTTGCGGCATTTTGCCTTCCTGTTTTTGCTC
3951 ACCCAGAAACGCTGGTGAAAGTAAAAGATGCTGAAGATCAGTTGGGTGCA
4001 CGAGTGGGTTACATCGAACTGGATCTCAACAGCGGTAAGATCCTTGAGAG
4051 TTTTCGCCCCGAAGAACGTTTTCCAATGATGAGCACTTTTAAAGTTCTGC
4101 TATGTGGCGCGGTATTATCCCGTATTGACGCCGGGCAAGAGCAACTCGGT
4151 CGCCGCATACACTATTCTCAGAATGACTTGGTTGAGTACTCACCAGTCAC
4201 AGAAAAGCATCTTACGGATGGCATGACAGTAAGAGAATTATGCAGTGCTG
4251 CCATAACCATGAGTGATAACACTGCGGCCAACTTACTTCTGACAACGATC
4301 GGAGGACCGAAGGAGCTAACCGCTTTTTTGCACAACATGGGGGATCATGT
4351 AACTCGCCTTGATCGTTGGGAACCGGAGCTGAATGAAGCCATACCAAACG
4401 ACGAGCGTGACACCACGATGCCTGTAGCAATGGCAACAACGTTGCGCAAA
4451 CTATTAACTGGCGAACTACTTACTCTAGCTTCCCGGCAACAATTAATAGA
4501 CTGGATGGAGGCGGATAAAGTTGCAGGACCACTTCTGCGCTCGGCCCTTC
4551 CGGCTGGCTGGTTTATTGCTGATAAATCTGGAGCCGGTGAGCGTGGGTCT
4601 CGCGGTATCATTGCAGCACTGGGGCCAGATGGTAAGCCCTCCCGTATCGT
4651 AGTTATCTACACGACGGGGAGTCAGGCAACTATGGATGAACGAAATAGAC
4701 AGATCGCTGAGATAGGTGCCTCACTGATTAAGCATTGGTAACTGTCAGAC
4751 CAAGTTTACTCATATATACTTTAGATTGATTTAAAACTTCATTTTTAATT
4801 TAAAAGGATCTAGGTGAAGATCCTTTTTGATAATCTCATGACCAAAATCC
4851 CTTAACGTGAGTTTTCGTTCCACTGAGCGTCAGACCCCGTAGAAAAGATC
4901 AAAGGATCTTCTTGAGATCCTTTTTTTCTGCGCGTAATCTGCTGCTTGCA
4951 AACAAAAAAACCACCGCTACCAGCGGTGGTTTGTTTGCCGGATCAAGAGC
5001 TACCAACTCTTTTTCCGAAGGTAACTGGCTTCAGCAGAGCGCAGATACCA
5051 AATACTGTTCTTCTAGTGTAGCCGTAGTTAGGCCACCACTTCAAGAACTC
5101 TGTAGCACCGCCTACATACCTCGCTCTGCTAATCCTGTTACCAGTGGCTG
5151 CTGCCAGTGGCGATAAGTCGTGTCTTACCGGGTTGGACTCAAGACGATAG
5201 TTACCGGATAAGGCGCAGCGGTCGGGCTGAACGGGGGGTTCGTGCACACA
5251 GCCCAGCTTGGAGCGAACGACCTACACCGAACTGAGATACCTACAGCGTG
5301 AGCTATGAGAAAGCGCCACGCTTCCCGAAGGGAGAAAGGCGGACAGGTAT
APPENDIX III
205
5351 CCGGTAAGCGGCAGGGTCGGAACAGGAGAGCGCACGAGGGAGCTTCCAGG
5401 GGGAAACGCCTGGTATCTTTATAGTCCTGTCGGGTTTCGCCACCTCTGAC
5451 TTGAGCGTCGATTTTTGTGATGCTCGTCAGGGGGGCGGAGCCTATGGAAA
5501 AACGCCAGCAACGCGGCCTTTTTACGGTTCCTGGCCTTTTGCTGGCCTTT
5551 TGCTCACATGTTCTTTCCTGCGTTATCCCCTGATTCTGTGGATAACCGTA
5601 TTACCGCCTTTGAGTGAGCTGATACCGCTCGCCGCAGCCGAACGACCGAG
5651 CGCAGCGAGTCAGTGAGCGAGGAAGCGGAAGAGCGCCCAATACGCAAACC
5701 GCCTCTCCCCGCGCGTTGGCCGATTCATTAATGCAGCTGGCACGACAGGT
5751 TTCCCGACTGGAAAGCGGGCAGTGAGCGCAACGCAATTAATGTGAGTTAG
5801 CTCACTCATTAGGCACCCCAGGCTTTACACTTTATGCTTCCGGCTCGTAT
5851 GTTGTGTGGAATTGTGAGCGGATAACAATTTCACACAGGAAACAGCTATG
5901 ACCATGATTACGCCAAGCTATTTAGGTGACACTATAGAATACTCAAGCTA
5951 TGCATGGGGTTTTCTCGTGTTTAGGCAGCATCTTGATCCGCCTCATCATT
6001 GTTATAGACTTCGAGCAAATCTCGTAAAACAAGCTCCCGGATATAGTCGC
6051 TGAAATTTAAGCCTTGCTCATTGGCTTTTTTAGTAGCCGCGCTGTACATG
6101 AGTGGGGGAAAACGAACCGCGCTCGCTGATTTTAAATTCTTATTCGGTCT
6151 AGTCGTCATGGGATCGCCTAAGAAAGTCTCTATCATTTTACAGTATCCAA
6201 AAGATTTGACACCCCCATTCATGGTGGTATTTTTTCTTTTCCTTTTCCCC
6251 ATAGCACTGTGGCTAGCAATAAAGCTATGGGCGATCCCTACATTTATTCT
6301 GTAGCACCAACGCTACAGCCCCTTAATTTCCTGTGGATAAACAGTGTGGA
6351 AATTGAGAAGAACACATGAGAATTTGTCCAGTTTTATTTTGATGGTTATT
6401 TTTTGCGGTTGCTTTTTAAGGGAATTGTGCGTGTGGTTTCCAGTCCCCAT
6451 CTGTGCATAAGAGAAAG
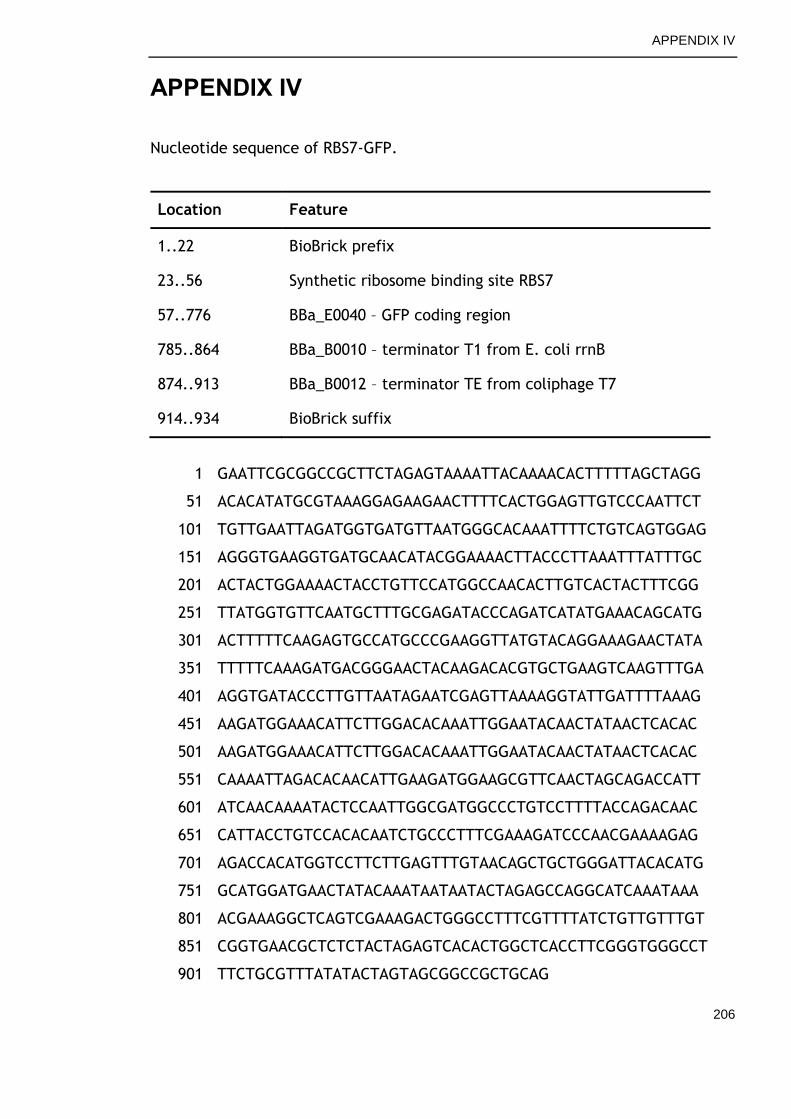
APPENDIX IV
206
APPENDIX IV
Nucleotide sequence of RBS7-GFP.
Location Feature
1..22 BioBrick prefix
23..56 Synthetic ribosome binding site RBS7
57..776 BBa_E0040 – GFP coding region
785..864 BBa_B0010 – terminator T1 from E. coli rrnB
874..913 BBa_B0012 – terminator TE from coliphage T7
914..934 BioBrick suffix
1 GAATTCGCGGCCGCTTCTAGAGTAAAATTACAAAACACTTTTTAGCTAGG
51 ACACATATGCGTAAAGGAGAAGAACTTTTCACTGGAGTTGTCCCAATTCT
101 TGTTGAATTAGATGGTGATGTTAATGGGCACAAATTTTCTGTCAGTGGAG
151 AGGGTGAAGGTGATGCAACATACGGAAAACTTACCCTTAAATTTATTTGC
201 ACTACTGGAAAACTACCTGTTCCATGGCCAACACTTGTCACTACTTTCGG
251 TTATGGTGTTCAATGCTTTGCGAGATACCCAGATCATATGAAACAGCATG
301 ACTTTTTCAAGAGTGCCATGCCCGAAGGTTATGTACAGGAAAGAACTATA
351 TTTTTCAAAGATGACGGGAACTACAAGACACGTGCTGAAGTCAAGTTTGA
401 AGGTGATACCCTTGTTAATAGAATCGAGTTAAAAGGTATTGATTTTAAAG
451 AAGATGGAAACATTCTTGGACACAAATTGGAATACAACTATAACTCACAC
501 AAGATGGAAACATTCTTGGACACAAATTGGAATACAACTATAACTCACAC
551 CAAAATTAGACACAACATTGAAGATGGAAGCGTTCAACTAGCAGACCATT
601 ATCAACAAAATACTCCAATTGGCGATGGCCCTGTCCTTTTACCAGACAAC
651 CATTACCTGTCCACACAATCTGCCCTTTCGAAAGATCCCAACGAAAAGAG
701 AGACCACATGGTCCTTCTTGAGTTTGTAACAGCTGCTGGGATTACACATG
751 GCATGGATGAACTATACAAATAATAATACTAGAGCCAGGCATCAAATAAA
801 ACGAAAGGCTCAGTCGAAAGACTGGGCCTTTCGTTTTATCTGTTGTTTGT
851 CGGTGAACGCTCTCTACTAGAGTCACACTGGCTCACCTTCGGGTGGGCCT
901 TTCTGCGTTTATATACTAGTAGCGGCCGCTGCAG
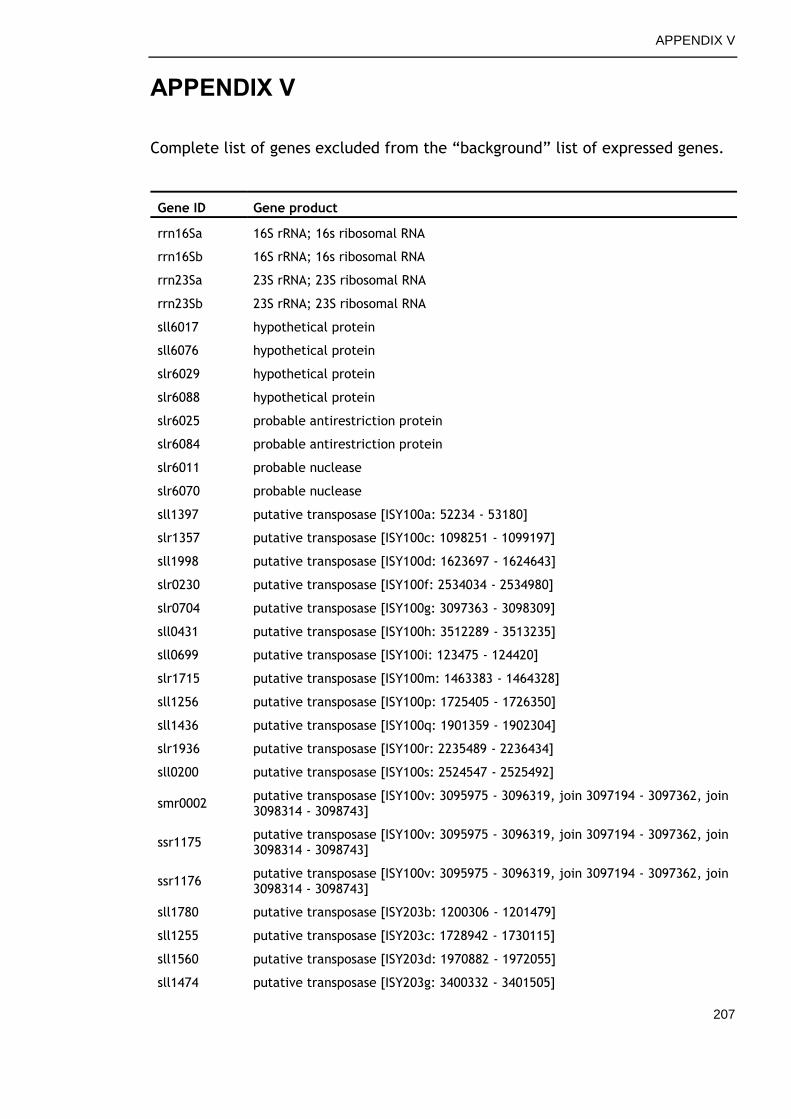
APPENDIX V
207
APPENDIX V
Complete list of genes excluded from the “background” list of expressed genes.
Gene ID Gene product
rrn16Sa 16S rRNA; 16s ribosomal RNA
rrn16Sb 16S rRNA; 16s ribosomal RNA
rrn23Sa 23S rRNA; 23S ribosomal RNA
rrn23Sb 23S rRNA; 23S ribosomal RNA
sll6017 hypothetical protein
sll6076 hypothetical protein
slr6029 hypothetical protein
slr6088 hypothetical protein
slr6025 probable antirestriction protein
slr6084 probable antirestriction protein
slr6011 probable nuclease
slr6070 probable nuclease
sll1397 putative transposase [ISY100a: 52234 - 53180]
slr1357 putative transposase [ISY100c: 1098251 - 1099197]
sll1998 putative transposase [ISY100d: 1623697 - 1624643]
slr0230 putative transposase [ISY100f: 2534034 - 2534980]
slr0704 putative transposase [ISY100g: 3097363 - 3098309]
sll0431 putative transposase [ISY100h: 3512289 - 3513235]
sll0699 putative transposase [ISY100i: 123475 - 124420]
slr1715 putative transposase [ISY100m: 1463383 - 1464328]
sll1256 putative transposase [ISY100p: 1725405 - 1726350]
sll1436 putative transposase [ISY100q: 1901359 - 1902304]
slr1936 putative transposase [ISY100r: 2235489 - 2236434]
sll0200 putative transposase [ISY100s: 2524547 - 2525492]
smr0002 putative transposase [ISY100v: 3095975 - 3096319, join 3097194 - 3097362, join 3098314 - 3098743]
ssr1175 putative transposase [ISY100v: 3095975 - 3096319, join 3097194 - 3097362, join 3098314 - 3098743]
ssr1176 putative transposase [ISY100v: 3095975 - 3096319, join 3097194 - 3097362, join 3098314 - 3098743]
sll1780 putative transposase [ISY203b: 1200306 - 1201479]
sll1255 putative transposase [ISY203c: 1728942 - 1730115]
sll1560 putative transposase [ISY203d: 1970882 - 1972055]
sll1474 putative transposase [ISY203g: 3400332 - 3401505]
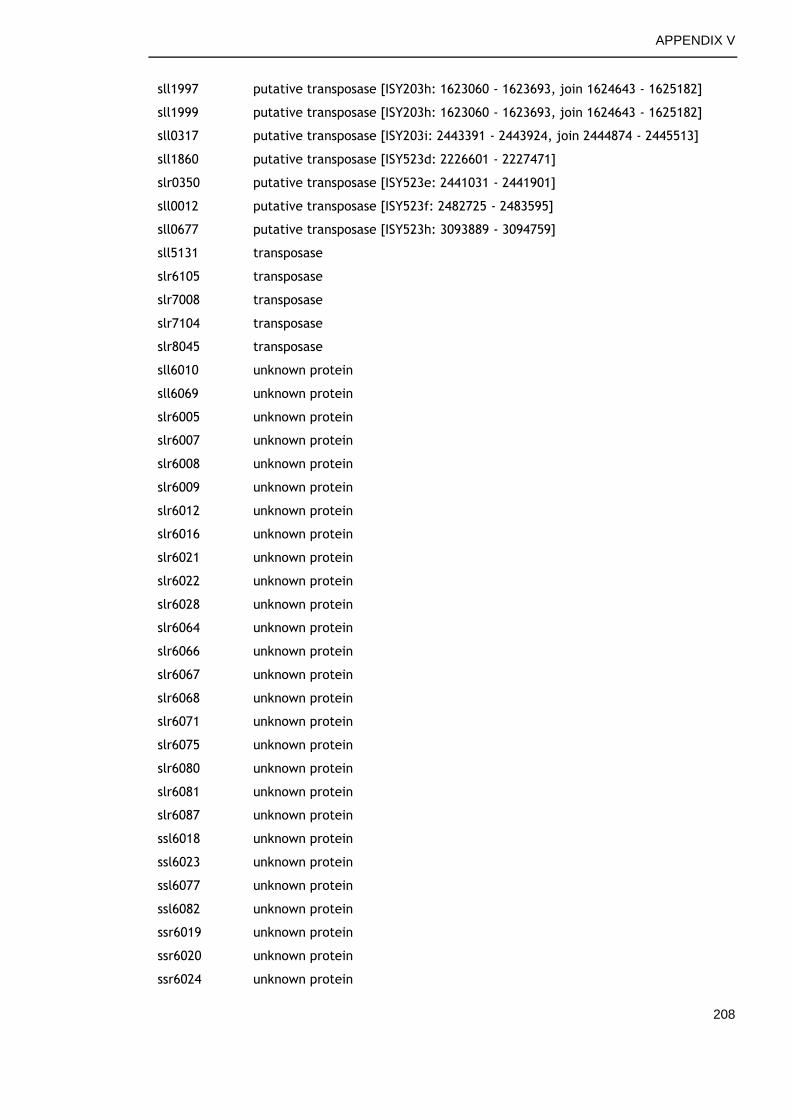
APPENDIX V
208
sll1997 putative transposase [ISY203h: 1623060 - 1623693, join 1624643 - 1625182]
sll1999 putative transposase [ISY203h: 1623060 - 1623693, join 1624643 - 1625182]
sll0317 putative transposase [ISY203i: 2443391 - 2443924, join 2444874 - 2445513]
sll1860 putative transposase [ISY523d: 2226601 - 2227471]
slr0350 putative transposase [ISY523e: 2441031 - 2441901]
sll0012 putative transposase [ISY523f: 2482725 - 2483595]
sll0677 putative transposase [ISY523h: 3093889 - 3094759]
sll5131 transposase
slr6105 transposase
slr7008 transposase
slr7104 transposase
slr8045 transposase
sll6010 unknown protein
sll6069 unknown protein
slr6005 unknown protein
slr6007 unknown protein
slr6008 unknown protein
slr6009 unknown protein
slr6012 unknown protein
slr6016 unknown protein
slr6021 unknown protein
slr6022 unknown protein
slr6028 unknown protein
slr6064 unknown protein
slr6066 unknown protein
slr6067 unknown protein
slr6068 unknown protein
slr6071 unknown protein
slr6075 unknown protein
slr6080 unknown protein
slr6081 unknown protein
slr6087 unknown protein
ssl6018 unknown protein
ssl6023 unknown protein
ssl6077 unknown protein
ssl6082 unknown protein
ssr6019 unknown protein
ssr6020 unknown protein
ssr6024 unknown protein

APPENDIX V
209
ssr6026 unknown protein
ssr6027 unknown protein
ssr6078 unknown protein
ssr6079 unknown protein
ssr6083 unknown protein
ssr6085 unknown protein
ssr6086 unknown protein
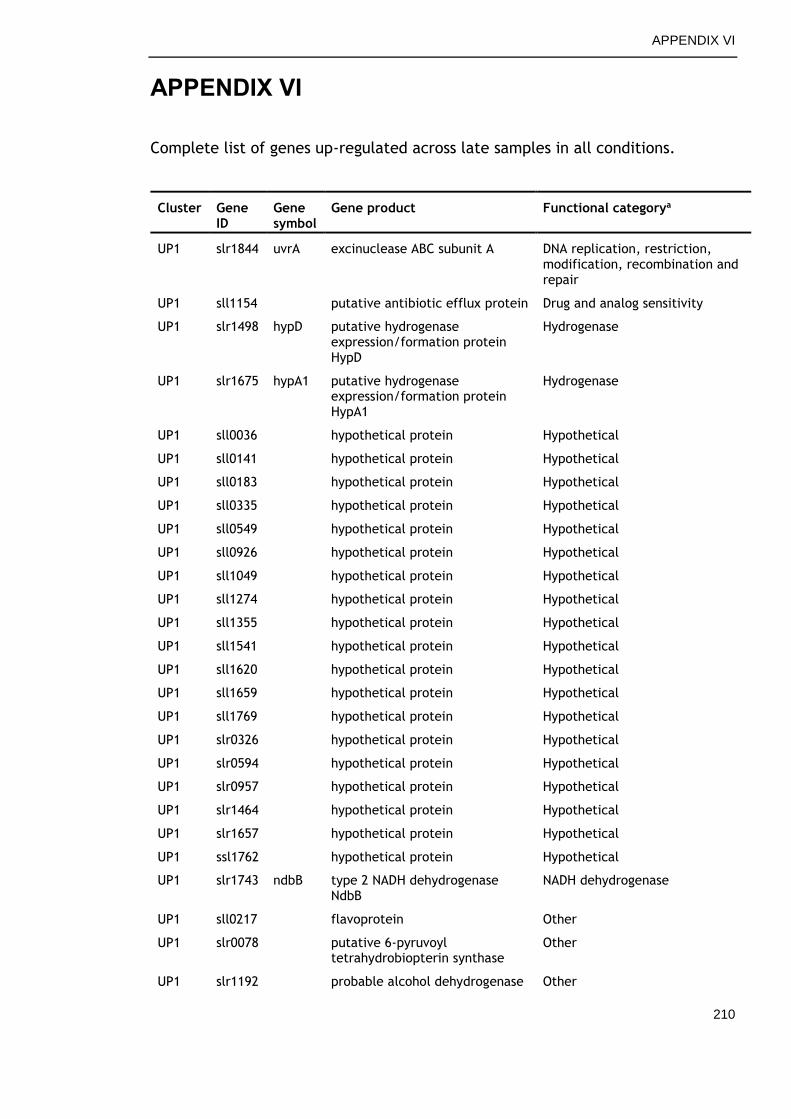
APPENDIX VI
210
APPENDIX VI
Complete list of genes up-regulated across late samples in all conditions.
Cluster Gene ID
Gene symbol
Gene product Functional categorya
UP1 slr1844 uvrA excinuclease ABC subunit A DNA replication, restriction, modification, recombination and repair
UP1 sll1154 putative antibiotic efflux protein Drug and analog sensitivity
UP1 slr1498 hypD putative hydrogenase expression/formation protein HypD
Hydrogenase
UP1 slr1675 hypA1 putative hydrogenase expression/formation protein HypA1
Hydrogenase
UP1 sll0036 hypothetical protein Hypothetical
UP1 sll0141 hypothetical protein Hypothetical
UP1 sll0183 hypothetical protein Hypothetical
UP1 sll0335 hypothetical protein Hypothetical
UP1 sll0549 hypothetical protein Hypothetical
UP1 sll0926 hypothetical protein Hypothetical
UP1 sll1049 hypothetical protein Hypothetical
UP1 sll1274 hypothetical protein Hypothetical
UP1 sll1355 hypothetical protein Hypothetical
UP1 sll1541 hypothetical protein Hypothetical
UP1 sll1620 hypothetical protein Hypothetical
UP1 sll1659 hypothetical protein Hypothetical
UP1 sll1769 hypothetical protein Hypothetical
UP1 slr0326 hypothetical protein Hypothetical
UP1 slr0594 hypothetical protein Hypothetical
UP1 slr0957 hypothetical protein Hypothetical
UP1 slr1464 hypothetical protein Hypothetical
UP1 slr1657 hypothetical protein Hypothetical
UP1 ssl1762 hypothetical protein Hypothetical
UP1 slr1743 ndbB type 2 NADH dehydrogenase NdbB
NADH dehydrogenase
UP1 sll0217 flavoprotein Other
UP1 slr0078 putative 6-pyruvoyl tetrahydrobiopterin synthase
Other
UP1 slr1192 probable alcohol dehydrogenase Other
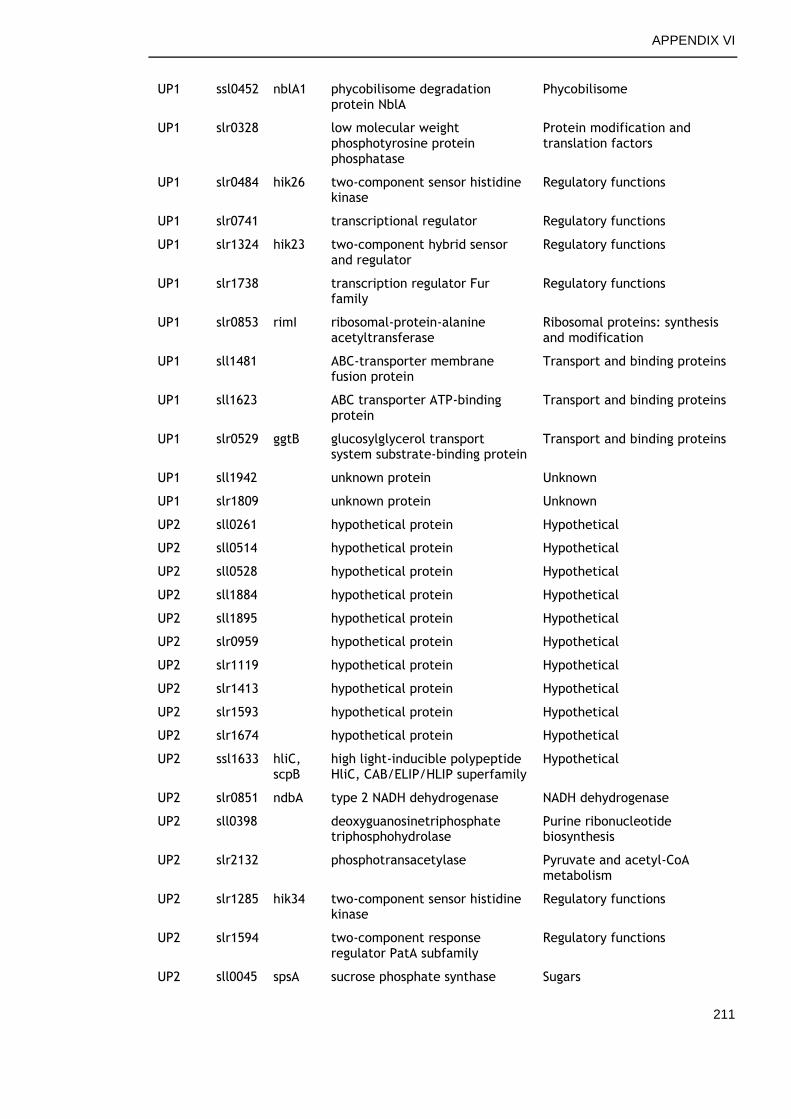
APPENDIX VI
211
UP1 ssl0452 nblA1 phycobilisome degradation protein NblA
Phycobilisome
UP1 slr0328 low molecular weight phosphotyrosine protein phosphatase
Protein modification and translation factors
UP1 slr0484 hik26 two-component sensor histidine kinase
Regulatory functions
UP1 slr0741 transcriptional regulator Regulatory functions
UP1 slr1324 hik23 two-component hybrid sensor and regulator
Regulatory functions
UP1 slr1738 transcription regulator Fur family
Regulatory functions
UP1 slr0853 rimI ribosomal-protein-alanine acetyltransferase
Ribosomal proteins: synthesis and modification
UP1 sll1481 ABC-transporter membrane fusion protein
Transport and binding proteins
UP1 sll1623 ABC transporter ATP-binding protein
Transport and binding proteins
UP1 slr0529 ggtB glucosylglycerol transport system substrate-binding protein
Transport and binding proteins
UP1 sll1942 unknown protein Unknown
UP1 slr1809 unknown protein Unknown
UP2 sll0261 hypothetical protein Hypothetical
UP2 sll0514 hypothetical protein Hypothetical
UP2 sll0528 hypothetical protein Hypothetical
UP2 sll1884 hypothetical protein Hypothetical
UP2 sll1895 hypothetical protein Hypothetical
UP2 slr0959 hypothetical protein Hypothetical
UP2 slr1119 hypothetical protein Hypothetical
UP2 slr1413 hypothetical protein Hypothetical
UP2 slr1593 hypothetical protein Hypothetical
UP2 slr1674 hypothetical protein Hypothetical
UP2 ssl1633 hliC, scpB
high light-inducible polypeptide HliC, CAB/ELIP/HLIP superfamily
Hypothetical
UP2 slr0851 ndbA type 2 NADH dehydrogenase NADH dehydrogenase
UP2 sll0398 deoxyguanosinetriphosphate triphosphohydrolase
Purine ribonucleotide biosynthesis
UP2 slr2132 phosphotransacetylase Pyruvate and acetyl-CoA metabolism
UP2 slr1285 hik34 two-component sensor histidine kinase
Regulatory functions
UP2 slr1594 two-component response regulator PatA subfamily
Regulatory functions
UP2 sll0045 spsA sucrose phosphate synthase Sugars
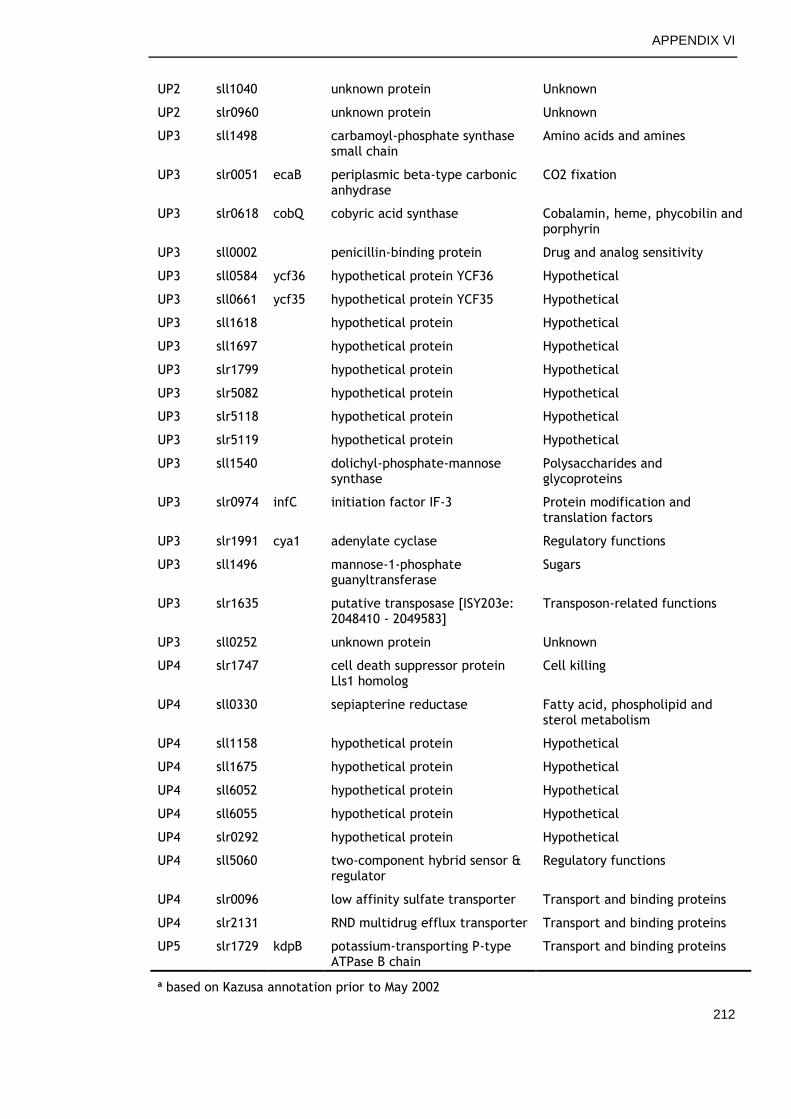
APPENDIX VI
212
UP2 sll1040 unknown protein Unknown
UP2 slr0960 unknown protein Unknown
UP3 sll1498 carbamoyl-phosphate synthase small chain
Amino acids and amines
UP3 slr0051 ecaB periplasmic beta-type carbonic anhydrase
CO2 fixation
UP3 slr0618 cobQ cobyric acid synthase Cobalamin, heme, phycobilin and porphyrin
UP3 sll0002 penicillin-binding protein Drug and analog sensitivity
UP3 sll0584 ycf36 hypothetical protein YCF36 Hypothetical
UP3 sll0661 ycf35 hypothetical protein YCF35 Hypothetical
UP3 sll1618 hypothetical protein Hypothetical
UP3 sll1697 hypothetical protein Hypothetical
UP3 slr1799 hypothetical protein Hypothetical
UP3 slr5082 hypothetical protein Hypothetical
UP3 slr5118 hypothetical protein Hypothetical
UP3 slr5119 hypothetical protein Hypothetical
UP3 sll1540 dolichyl-phosphate-mannose synthase
Polysaccharides and glycoproteins
UP3 slr0974 infC initiation factor IF-3 Protein modification and translation factors
UP3 slr1991 cya1 adenylate cyclase Regulatory functions
UP3 sll1496 mannose-1-phosphate guanyltransferase
Sugars
UP3 slr1635 putative transposase [ISY203e: 2048410 - 2049583]
Transposon-related functions
UP3 sll0252 unknown protein Unknown
UP4 slr1747 cell death suppressor protein Lls1 homolog
Cell killing
UP4 sll0330 sepiapterine reductase Fatty acid, phospholipid and sterol metabolism
UP4 sll1158 hypothetical protein Hypothetical
UP4 sll1675 hypothetical protein Hypothetical
UP4 sll6052 hypothetical protein Hypothetical
UP4 sll6055 hypothetical protein Hypothetical
UP4 slr0292 hypothetical protein Hypothetical
UP4 sll5060 two-component hybrid sensor & regulator
Regulatory functions
UP4 slr0096 low affinity sulfate transporter Transport and binding proteins
UP4 slr2131 RND multidrug efflux transporter Transport and binding proteins
UP5 slr1729 kdpB potassium-transporting P-type ATPase B chain
Transport and binding proteins
a based on Kazusa annotation prior to May 2002
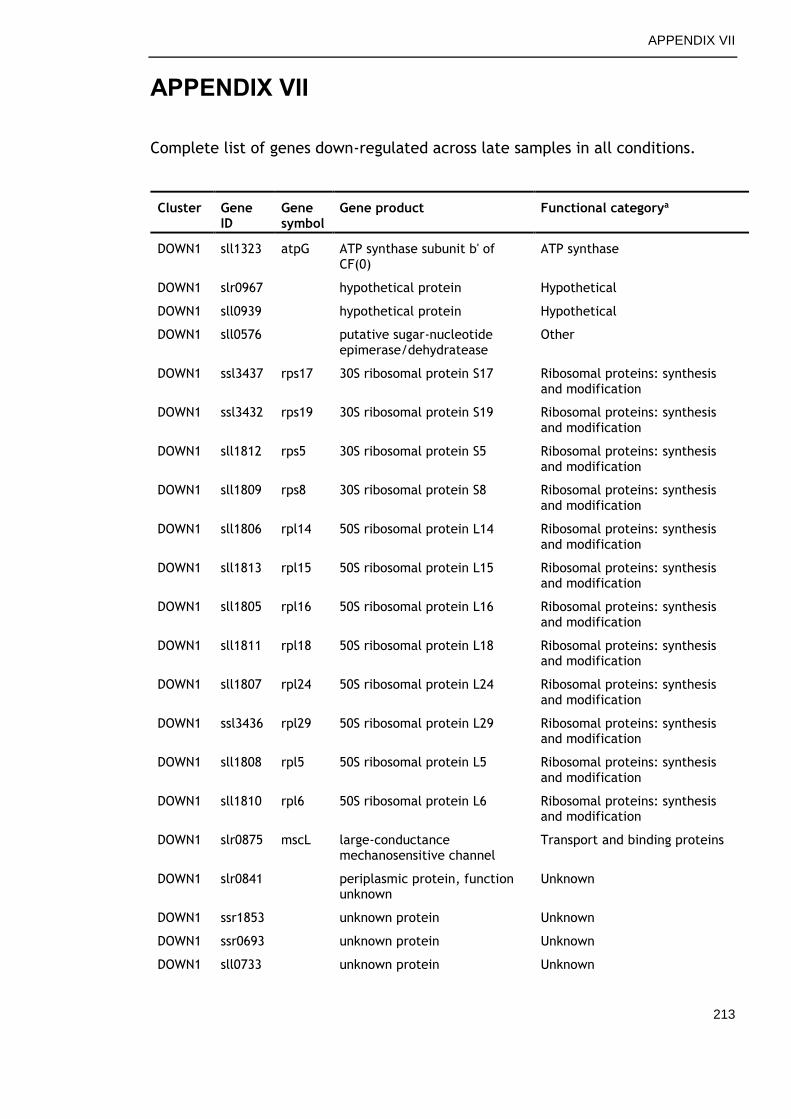
APPENDIX VII
213
APPENDIX VII
Complete list of genes down-regulated across late samples in all conditions.
Cluster Gene ID
Gene symbol
Gene product Functional categorya
DOWN1 sll1323 atpG ATP synthase subunit b' of CF(0)
ATP synthase
DOWN1 slr0967 hypothetical protein Hypothetical
DOWN1 sll0939 hypothetical protein Hypothetical
DOWN1 sll0576 putative sugar-nucleotide epimerase/dehydratease
Other
DOWN1 ssl3437 rps17 30S ribosomal protein S17 Ribosomal proteins: synthesis and modification
DOWN1 ssl3432 rps19 30S ribosomal protein S19 Ribosomal proteins: synthesis and modification
DOWN1 sll1812 rps5 30S ribosomal protein S5 Ribosomal proteins: synthesis and modification
DOWN1 sll1809 rps8 30S ribosomal protein S8 Ribosomal proteins: synthesis and modification
DOWN1 sll1806 rpl14 50S ribosomal protein L14 Ribosomal proteins: synthesis and modification
DOWN1 sll1813 rpl15 50S ribosomal protein L15 Ribosomal proteins: synthesis and modification
DOWN1 sll1805 rpl16 50S ribosomal protein L16 Ribosomal proteins: synthesis and modification
DOWN1 sll1811 rpl18 50S ribosomal protein L18 Ribosomal proteins: synthesis and modification
DOWN1 sll1807 rpl24 50S ribosomal protein L24 Ribosomal proteins: synthesis and modification
DOWN1 ssl3436 rpl29 50S ribosomal protein L29 Ribosomal proteins: synthesis and modification
DOWN1 sll1808 rpl5 50S ribosomal protein L5 Ribosomal proteins: synthesis and modification
DOWN1 sll1810 rpl6 50S ribosomal protein L6 Ribosomal proteins: synthesis and modification
DOWN1 slr0875 mscL large-conductance mechanosensitive channel
Transport and binding proteins
DOWN1 slr0841 periplasmic protein, function unknown
Unknown
DOWN1 ssr1853 unknown protein Unknown
DOWN1 ssr0693 unknown protein Unknown
DOWN1 sll0733 unknown protein Unknown
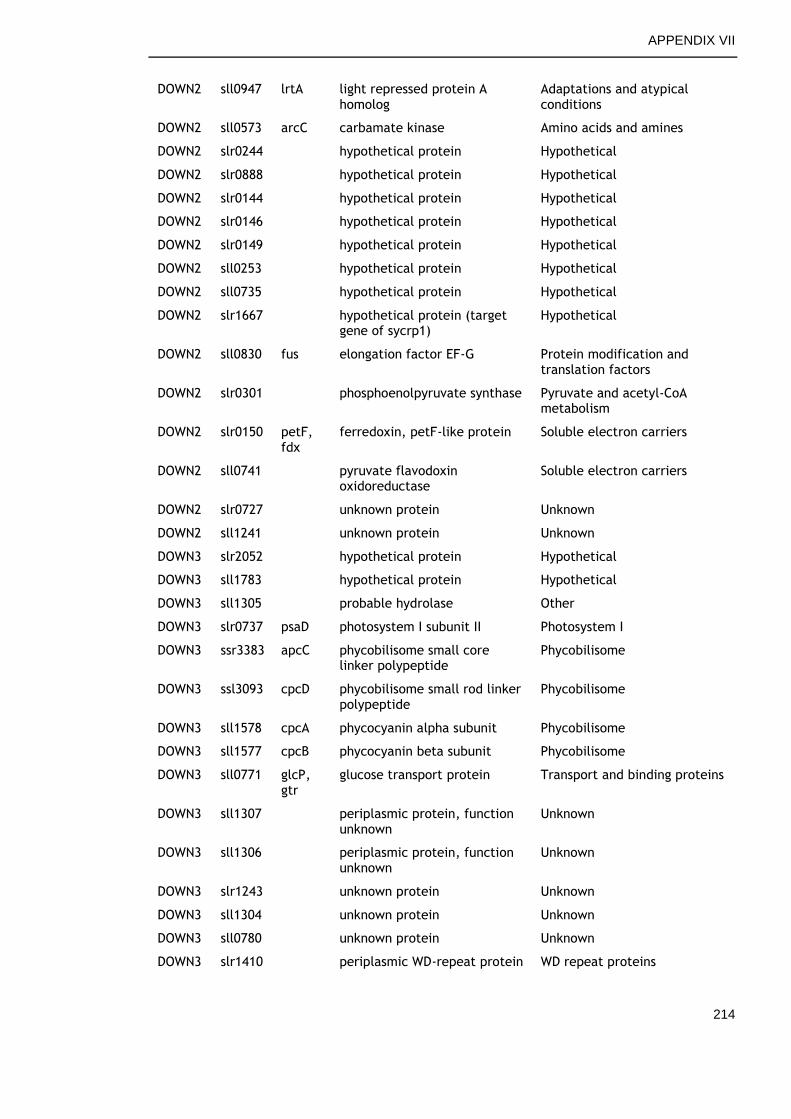
APPENDIX VII
214
DOWN2 sll0947 lrtA light repressed protein A homolog
Adaptations and atypical conditions
DOWN2 sll0573 arcC carbamate kinase Amino acids and amines
DOWN2 slr0244 hypothetical protein Hypothetical
DOWN2 slr0888 hypothetical protein Hypothetical
DOWN2 slr0144 hypothetical protein Hypothetical
DOWN2 slr0146 hypothetical protein Hypothetical
DOWN2 slr0149 hypothetical protein Hypothetical
DOWN2 sll0253 hypothetical protein Hypothetical
DOWN2 sll0735 hypothetical protein Hypothetical
DOWN2 slr1667 hypothetical protein (target gene of sycrp1)
Hypothetical
DOWN2 sll0830 fus elongation factor EF-G Protein modification and translation factors
DOWN2 slr0301 phosphoenolpyruvate synthase Pyruvate and acetyl-CoA metabolism
DOWN2 slr0150 petF, fdx
ferredoxin, petF-like protein Soluble electron carriers
DOWN2 sll0741 pyruvate flavodoxin oxidoreductase
Soluble electron carriers
DOWN2 slr0727 unknown protein Unknown
DOWN2 sll1241 unknown protein Unknown
DOWN3 slr2052 hypothetical protein Hypothetical
DOWN3 sll1783 hypothetical protein Hypothetical
DOWN3 sll1305 probable hydrolase Other
DOWN3 slr0737 psaD photosystem I subunit II Photosystem I
DOWN3 ssr3383 apcC phycobilisome small core linker polypeptide
Phycobilisome
DOWN3 ssl3093 cpcD phycobilisome small rod linker polypeptide
Phycobilisome
DOWN3 sll1578 cpcA phycocyanin alpha subunit Phycobilisome
DOWN3 sll1577 cpcB phycocyanin beta subunit Phycobilisome
DOWN3 sll0771 glcP, gtr
glucose transport protein Transport and binding proteins
DOWN3 sll1307 periplasmic protein, function unknown
Unknown
DOWN3 sll1306 periplasmic protein, function unknown
Unknown
DOWN3 slr1243 unknown protein Unknown
DOWN3 sll1304 unknown protein Unknown
DOWN3 sll0780 unknown protein Unknown
DOWN3 slr1410 periplasmic WD-repeat protein WD repeat proteins
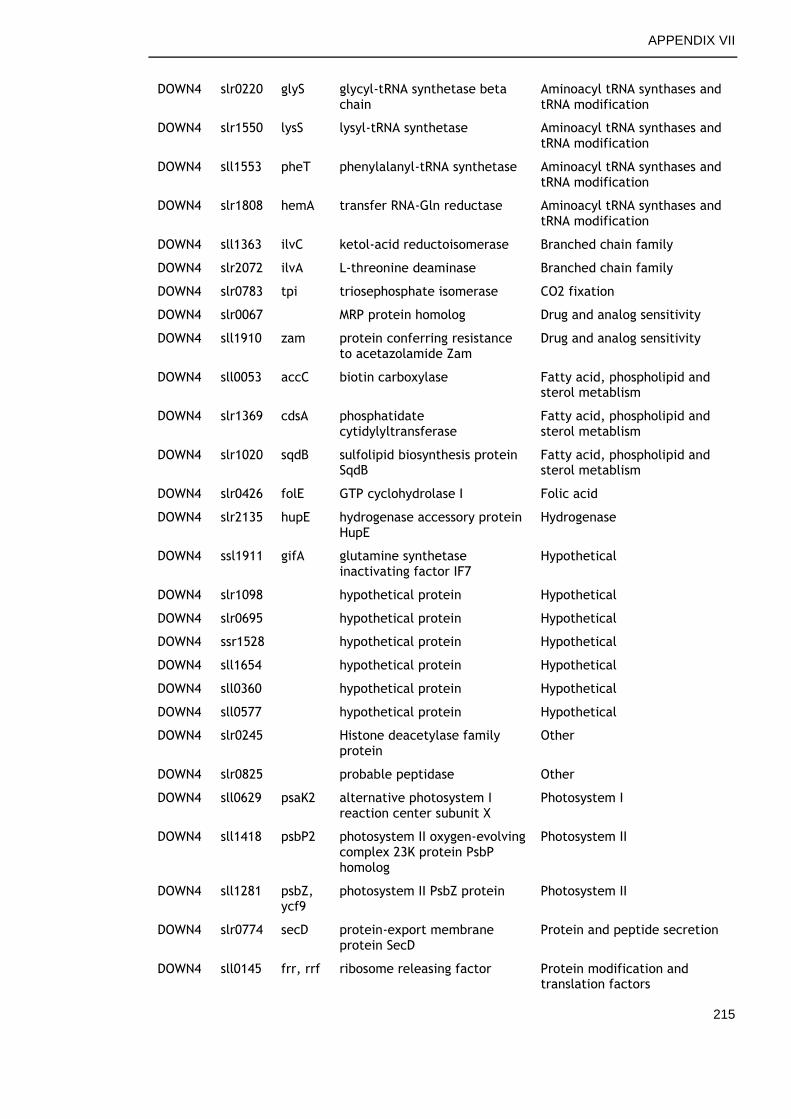
APPENDIX VII
215
DOWN4 slr0220 glyS glycyl-tRNA synthetase beta chain
Aminoacyl tRNA synthases and tRNA modification
DOWN4 slr1550 lysS lysyl-tRNA synthetase Aminoacyl tRNA synthases and tRNA modification
DOWN4 sll1553 pheT phenylalanyl-tRNA synthetase Aminoacyl tRNA synthases and tRNA modification
DOWN4 slr1808 hemA transfer RNA-Gln reductase Aminoacyl tRNA synthases and tRNA modification
DOWN4 sll1363 ilvC ketol-acid reductoisomerase Branched chain family
DOWN4 slr2072 ilvA L-threonine deaminase Branched chain family
DOWN4 slr0783 tpi triosephosphate isomerase CO2 fixation
DOWN4 slr0067 MRP protein homolog Drug and analog sensitivity
DOWN4 sll1910 zam protein conferring resistance to acetazolamide Zam
Drug and analog sensitivity
DOWN4 sll0053 accC biotin carboxylase Fatty acid, phospholipid and sterol metablism
DOWN4 slr1369 cdsA phosphatidate cytidylyltransferase
Fatty acid, phospholipid and sterol metablism
DOWN4 slr1020 sqdB sulfolipid biosynthesis protein SqdB
Fatty acid, phospholipid and sterol metablism
DOWN4 slr0426 folE GTP cyclohydrolase I Folic acid
DOWN4 slr2135 hupE hydrogenase accessory protein HupE
Hydrogenase
DOWN4 ssl1911 gifA glutamine synthetase inactivating factor IF7
Hypothetical
DOWN4 slr1098 hypothetical protein Hypothetical
DOWN4 slr0695 hypothetical protein Hypothetical
DOWN4 ssr1528 hypothetical protein Hypothetical
DOWN4 sll1654 hypothetical protein Hypothetical
DOWN4 sll0360 hypothetical protein Hypothetical
DOWN4 sll0577 hypothetical protein Hypothetical
DOWN4 slr0245 Histone deacetylase family protein
Other
DOWN4 slr0825 probable peptidase Other
DOWN4 sll0629 psaK2 alternative photosystem I reaction center subunit X
Photosystem I
DOWN4 sll1418 psbP2 photosystem II oxygen-evolving complex 23K protein PsbP homolog
Photosystem II
DOWN4 sll1281 psbZ, ycf9
photosystem II PsbZ protein Photosystem II
DOWN4 slr0774 secD protein-export membrane protein SecD
Protein and peptide secretion
DOWN4 sll0145 frr, rrf ribosome releasing factor Protein modification and translation factors
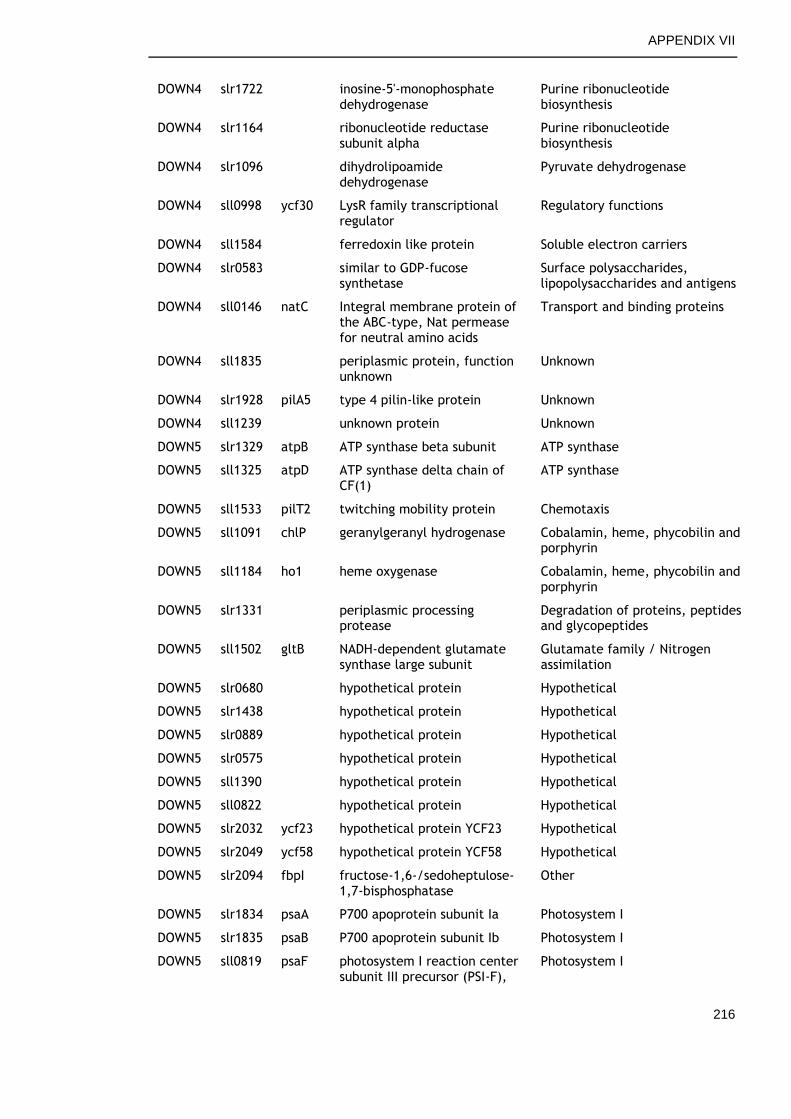
APPENDIX VII
216
DOWN4 slr1722 inosine-5'-monophosphate dehydrogenase
Purine ribonucleotide biosynthesis
DOWN4 slr1164 ribonucleotide reductase subunit alpha
Purine ribonucleotide biosynthesis
DOWN4 slr1096 dihydrolipoamide dehydrogenase
Pyruvate dehydrogenase
DOWN4 sll0998 ycf30 LysR family transcriptional regulator
Regulatory functions
DOWN4 sll1584 ferredoxin like protein Soluble electron carriers
DOWN4 slr0583 similar to GDP-fucose synthetase
Surface polysaccharides, lipopolysaccharides and antigens
DOWN4 sll0146 natC Integral membrane protein of the ABC-type, Nat permease for neutral amino acids
Transport and binding proteins
DOWN4 sll1835 periplasmic protein, function unknown
Unknown
DOWN4 slr1928 pilA5 type 4 pilin-like protein Unknown
DOWN4 sll1239 unknown protein Unknown
DOWN5 slr1329 atpB ATP synthase beta subunit ATP synthase
DOWN5 sll1325 atpD ATP synthase delta chain of CF(1)
ATP synthase
DOWN5 sll1533 pilT2 twitching mobility protein Chemotaxis
DOWN5 sll1091 chlP geranylgeranyl hydrogenase Cobalamin, heme, phycobilin and porphyrin
DOWN5 sll1184 ho1 heme oxygenase Cobalamin, heme, phycobilin and porphyrin
DOWN5 slr1331 periplasmic processing protease
Degradation of proteins, peptides and glycopeptides
DOWN5 sll1502 gltB NADH-dependent glutamate synthase large subunit
Glutamate family / Nitrogen assimilation
DOWN5 slr0680 hypothetical protein Hypothetical
DOWN5 slr1438 hypothetical protein Hypothetical
DOWN5 slr0889 hypothetical protein Hypothetical
DOWN5 slr0575 hypothetical protein Hypothetical
DOWN5 sll1390 hypothetical protein Hypothetical
DOWN5 sll0822 hypothetical protein Hypothetical
DOWN5 slr2032 ycf23 hypothetical protein YCF23 Hypothetical
DOWN5 slr2049 ycf58 hypothetical protein YCF58 Hypothetical
DOWN5 slr2094 fbpI fructose-1,6-/sedoheptulose-1,7-bisphosphatase
Other
DOWN5 slr1834 psaA P700 apoprotein subunit Ia Photosystem I
DOWN5 slr1835 psaB P700 apoprotein subunit Ib Photosystem I
DOWN5 sll0819 psaF photosystem I reaction center subunit III precursor (PSI-F),
Photosystem I
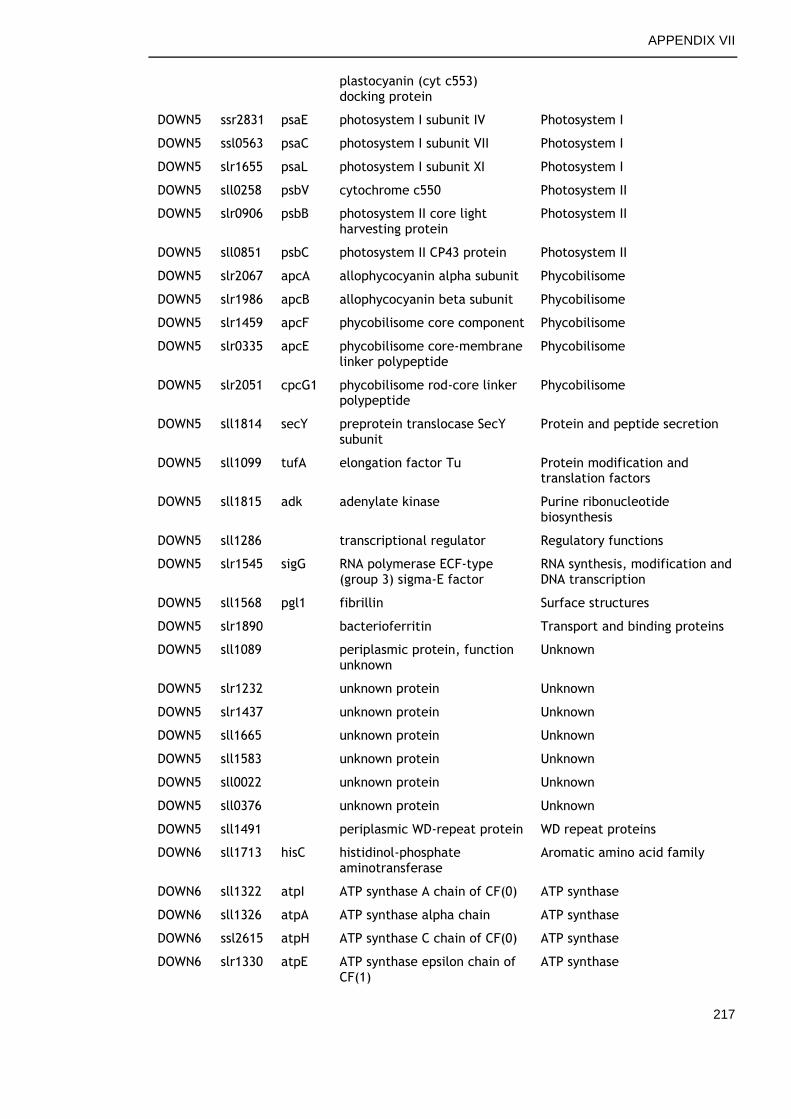
APPENDIX VII
217
plastocyanin (cyt c553) docking protein
DOWN5 ssr2831 psaE photosystem I subunit IV Photosystem I
DOWN5 ssl0563 psaC photosystem I subunit VII Photosystem I
DOWN5 slr1655 psaL photosystem I subunit XI Photosystem I
DOWN5 sll0258 psbV cytochrome c550 Photosystem II
DOWN5 slr0906 psbB photosystem II core light harvesting protein
Photosystem II
DOWN5 sll0851 psbC photosystem II CP43 protein Photosystem II
DOWN5 slr2067 apcA allophycocyanin alpha subunit Phycobilisome
DOWN5 slr1986 apcB allophycocyanin beta subunit Phycobilisome
DOWN5 slr1459 apcF phycobilisome core component Phycobilisome
DOWN5 slr0335 apcE phycobilisome core-membrane linker polypeptide
Phycobilisome
DOWN5 slr2051 cpcG1 phycobilisome rod-core linker polypeptide
Phycobilisome
DOWN5 sll1814 secY preprotein translocase SecY subunit
Protein and peptide secretion
DOWN5 sll1099 tufA elongation factor Tu Protein modification and translation factors
DOWN5 sll1815 adk adenylate kinase Purine ribonucleotide biosynthesis
DOWN5 sll1286 transcriptional regulator Regulatory functions
DOWN5 slr1545 sigG RNA polymerase ECF-type (group 3) sigma-E factor
RNA synthesis, modification and DNA transcription
DOWN5 sll1568 pgl1 fibrillin Surface structures
DOWN5 slr1890 bacterioferritin Transport and binding proteins
DOWN5 sll1089 periplasmic protein, function unknown
Unknown
DOWN5 slr1232 unknown protein Unknown
DOWN5 slr1437 unknown protein Unknown
DOWN5 sll1665 unknown protein Unknown
DOWN5 sll1583 unknown protein Unknown
DOWN5 sll0022 unknown protein Unknown
DOWN5 sll0376 unknown protein Unknown
DOWN5 sll1491 periplasmic WD-repeat protein WD repeat proteins
DOWN6 sll1713 hisC histidinol-phosphate aminotransferase
Aromatic amino acid family
DOWN6 sll1322 atpI ATP synthase A chain of CF(0) ATP synthase
DOWN6 sll1326 atpA ATP synthase alpha chain ATP synthase
DOWN6 ssl2615 atpH ATP synthase C chain of CF(0) ATP synthase
DOWN6 slr1330 atpE ATP synthase epsilon chain of CF(1)
ATP synthase
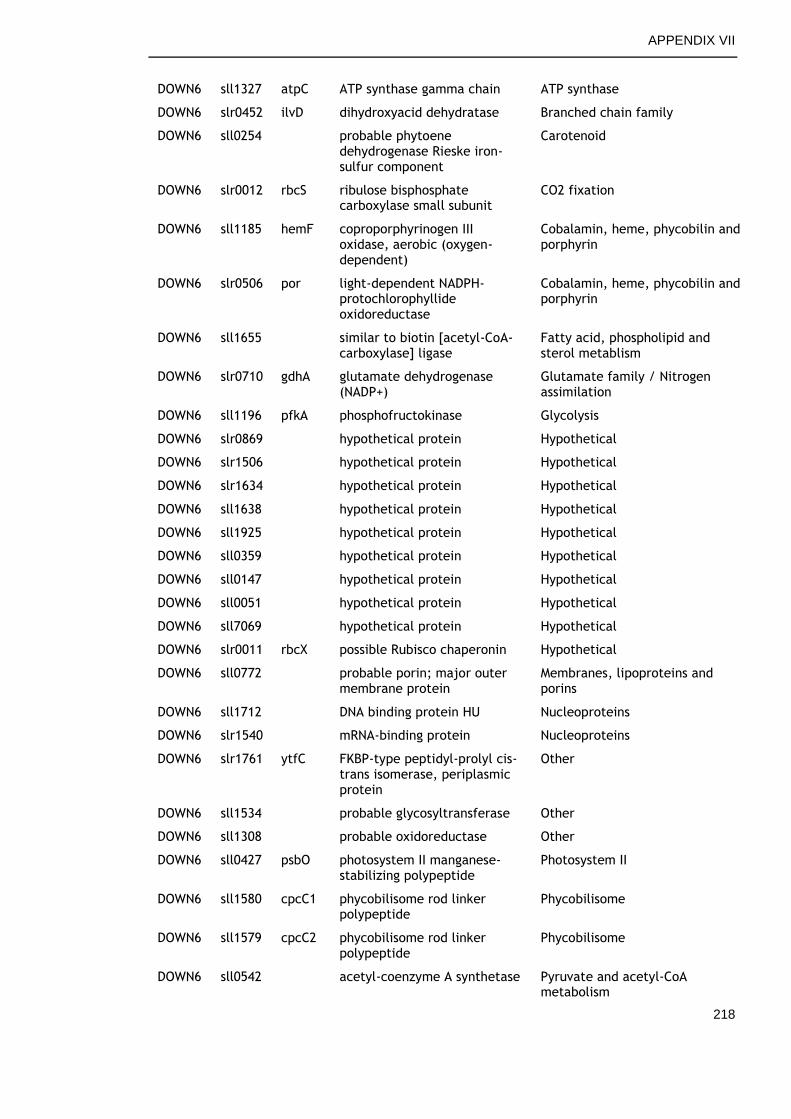
APPENDIX VII
218
DOWN6 sll1327 atpC ATP synthase gamma chain ATP synthase
DOWN6 slr0452 ilvD dihydroxyacid dehydratase Branched chain family
DOWN6 sll0254 probable phytoene dehydrogenase Rieske iron-sulfur component
Carotenoid
DOWN6 slr0012 rbcS ribulose bisphosphate carboxylase small subunit
CO2 fixation
DOWN6 sll1185 hemF coproporphyrinogen III oxidase, aerobic (oxygen-dependent)
Cobalamin, heme, phycobilin and porphyrin
DOWN6 slr0506 por light-dependent NADPH-protochlorophyllide oxidoreductase
Cobalamin, heme, phycobilin and porphyrin
DOWN6 sll1655 similar to biotin [acetyl-CoA-carboxylase] ligase
Fatty acid, phospholipid and sterol metablism
DOWN6 slr0710 gdhA glutamate dehydrogenase (NADP+)
Glutamate family / Nitrogen assimilation
DOWN6 sll1196 pfkA phosphofructokinase Glycolysis
DOWN6 slr0869 hypothetical protein Hypothetical
DOWN6 slr1506 hypothetical protein Hypothetical
DOWN6 slr1634 hypothetical protein Hypothetical
DOWN6 sll1638 hypothetical protein Hypothetical
DOWN6 sll1925 hypothetical protein Hypothetical
DOWN6 sll0359 hypothetical protein Hypothetical
DOWN6 sll0147 hypothetical protein Hypothetical
DOWN6 sll0051 hypothetical protein Hypothetical
DOWN6 sll7069 hypothetical protein Hypothetical
DOWN6 slr0011 rbcX possible Rubisco chaperonin Hypothetical
DOWN6 sll0772 probable porin; major outer membrane protein
Membranes, lipoproteins and porins
DOWN6 sll1712 DNA binding protein HU Nucleoproteins
DOWN6 slr1540 mRNA-binding protein Nucleoproteins
DOWN6 slr1761 ytfC FKBP-type peptidyl-prolyl cis-trans isomerase, periplasmic protein
Other
DOWN6 sll1534 probable glycosyltransferase Other
DOWN6 sll1308 probable oxidoreductase Other
DOWN6 sll0427 psbO photosystem II manganese-stabilizing polypeptide
Photosystem II
DOWN6 sll1580 cpcC1 phycobilisome rod linker polypeptide
Phycobilisome
DOWN6 sll1579 cpcC2 phycobilisome rod linker polypeptide
Phycobilisome
DOWN6 sll0542 acetyl-coenzyme A synthetase Pyruvate and acetyl-CoA metabolism
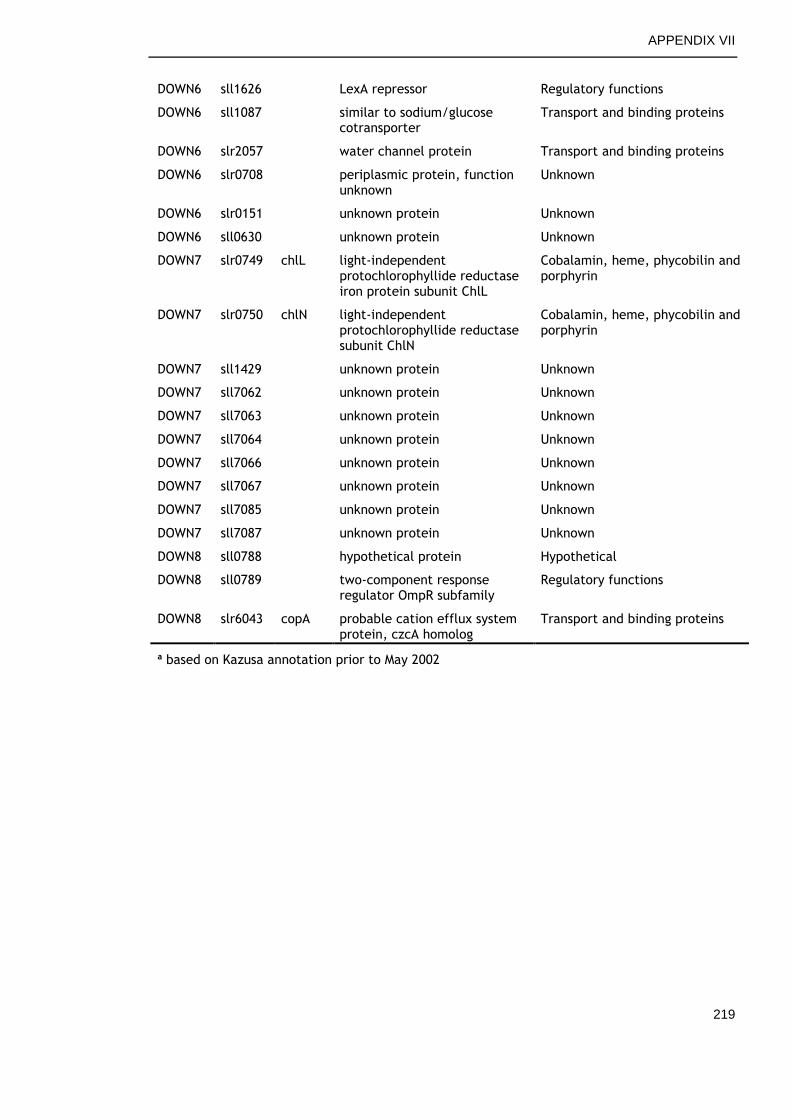
APPENDIX VII
219
DOWN6 sll1626 LexA repressor Regulatory functions
DOWN6 sll1087 similar to sodium/glucose cotransporter
Transport and binding proteins
DOWN6 slr2057 water channel protein Transport and binding proteins
DOWN6 slr0708 periplasmic protein, function unknown
Unknown
DOWN6 slr0151 unknown protein Unknown
DOWN6 sll0630 unknown protein Unknown
DOWN7 slr0749 chlL light-independent protochlorophyllide reductase iron protein subunit ChlL
Cobalamin, heme, phycobilin and porphyrin
DOWN7 slr0750 chlN light-independent protochlorophyllide reductase subunit ChlN
Cobalamin, heme, phycobilin and porphyrin
DOWN7 sll1429 unknown protein Unknown
DOWN7 sll7062 unknown protein Unknown
DOWN7 sll7063 unknown protein Unknown
DOWN7 sll7064 unknown protein Unknown
DOWN7 sll7066 unknown protein Unknown
DOWN7 sll7067 unknown protein Unknown
DOWN7 sll7085 unknown protein Unknown
DOWN7 sll7087 unknown protein Unknown
DOWN8 sll0788 hypothetical protein Hypothetical
DOWN8 sll0789 two-component response regulator OmpR subfamily
Regulatory functions
DOWN8 slr6043 copA probable cation efflux system protein, czcA homolog
Transport and binding proteins
a based on Kazusa annotation prior to May 2002


![Unidad III [7359]c](https://img.pdfslide.net/doc/110x75/563dba2c550346aa9aa3570a/unidad-iii-7359c.jpg)